Micromechanical properties of biological silica in skeletons of deep-sea sponges
Upload
khangminh22Category
view
0download
0
DOE/MC/29110--3879 (DE95000004)
Organic Sponges for Cost-Effective CVOC Abatement
Final Report September 1992 - April 1994
William P. Flanagan Marsha M. Grade David P. Homey Patricia D. Mackenzie Joseph J. Salvo Timothy M. Sivavec Mark L. Stephens
July 1994
Work Performed Under Contract No.: DE-AC21-92MC29110
For U.S. Department of Energy Office of Fossil Energy Morgantown Energy Technology Center Morgantown, West Virginia
By General Electric Corporate Research and Development Schenectady, New York

DISCLAIMER This report was prepared as an account of work sponsored by an agency of the United States Government. Neither the United States Government nor any agency thereof, nor any of their employees, makes any warranty, express or implied, or assumes any legal liability or responsibility for the accuracy, completeness, or usefulness of any information, apparatus, product, or process disclosed, or represents that its use would not infringe privately owned rights. Reference herein to any specific commercial product, process, or service by trade name, trademark, manufacturer; or otherwise does not necessarily constitute or imply its endorsement, recommendation, or favoring by the United States Government or any agency thereof. The views and opinions of authors expressed herein do not necessarily state or reflect those of the United States Government or any agency thereof.
This report has been reproduced directly from the best available copy.
Available to DOE and DOE contractors from the Office of Scientific and Technical Information, P.O. Box 62; Oak Ridge, TN 37831; prices available from (615) 576-8401.
Available to the public from the U.S. Department of Commerce, Technology Administration, National Technical Information Service, Springfield, VA 22161, (703) 487-4650.

DISCLAIMER
Portions of this document may be illegible in electronic image products. Images are produced from the best available original document.

DOE/MC/29110-3879 (DE95000004)
Distribution Category UC-902
Organic Sponges for Cost-Effective CVOC Abatement
Final Report September 1992 - April 1994
William P. Flanagan Marsha M. Grade David P. Horney
Patricia D. Mackenzie Joseph ]. Salvo
Timothy M. Sivavec Mark L. Stephens
Work Performed Under Contract No.: DE-AC21-92MC29110
For U.S. Department of Energy
Office of Fossil Energy Morgantown Energy Technology Center
P.O. Box 880 Morgantown, West Virginia 26507-0880
By General Electric Corporate Research and Development
P. O. Box 8 Schenectady, New York 12301
July 1994

Part I Summary: Evaluation of Sorbents and Conceptual Process Development
Chlorinated solvents such as trichloroethylene (TCE) are the most frequently found ground water contaminants. Many of the technologies that are available for the treatment of soils and ground waters contaminated with these chlorinated volatile organic compounds (CVOCs), such as air stripping of ground water and soil vapor extraction of the vadose zone, result in a contaminated gas-phase stream. Although in some states it may now be acceptable to release such streams to the environment, such releases will not be permitted under the Clean Air Act Amendments of 1990. New EPA regulations under the Organic Air Emissions Standards for HWTSD Facilities and FTW generators also tighten control over CVOC emissions.
The processes that have been developed to treat CVOC-contaminated gas streams can be divided into two classes, those that capture and recover the CVOC and those that destroy the CVOC.
Capture/ recovery processes are useful for cases where the CVOC has some value or its disposal cost as a neat solvent is low. Sorption onto activated carbon is the most common capture/ recovery process and is effective in many applications. However, there are many drawbacks associated with the use of activated carbon. Depending on the regeneration scheme used these may include:
• Low capacity at high relative humidity • Relatively hydrophilic: readily adsorbs water • Difficult to completely regenerate • Need for periodic high temperature (500-1000°C) reactivation • Can catalyze formation of H O from CVOCs, especially with steam • Potential fire hazard, due to the heat of adsorption • Friable
Any of these properties can adversely affect process economics.
The goal of this work was to identify and evaluate synthetic sorbents that would not suffer from the same limitations as activated carbon when treating CVOC-contaminated air streams. To that end greater than 100 synthetic sorbents were screened for their ability to sorb CVOCs. An expedient technique of measuring weight uptake from a saturated vapor was used. From these screening experiments, about 10 sorbents were selected for further evaluation. The relevant properties of these potential sorbents were measured and compared both among the sorbents and with activated carbon. These properties include:
• CVOC sorption isotherms (sorption capacity for CVOC as a function of vapor concentration)
• Sorption Rate (rate of CVOC sorption) • Effect of relative humidity on CVOC sorption isotherm • Water sorption isotherm (sorption capacity for water as a function of relative
humidity)
ES-l

• CVOC desorption isotherms (change in sorption capacity for CVOC as a function of temperature)
• CVOC desorption rate (rate of CVOC desorption from sorbent at elevated temperature)
• Sorption Lifetime (effect of repeated heating and/or desorption on sorbent capacity)
• Aqueous CVOC isotherms (sorption capacity of sorbents for CVOCsfrom water - potentially useful for coupling to biodegradation)
• Dynamic Behavior (column experiments)
The net result of this work is a direct comparison of several important properties of various sorbents and carbon under the same experimental conditions.
Sorbents were classified into four groups: commercial polymeric sorbents (e.g. macroporous styrenic polymers); commercial carbonaceous sorbents (pyrolyzed polymers); commercial polymers and rubbers (e.g. polyether/ polyester block copolymers and ground rubber tires); and activated carbon.
The commercial polymers and rubbers have a very high capacity for CVOCs from saturated vapors but their capacity at low concentrations is orders of magnitude below that of the other classes of sorbents. Thus, while not of value for treating air streams from remediation processes, the low cost of these materials may make them of interest in treating more concentrated industrial emissions.
For remediation applications - Dow's XUS, a polymeric sorbent, and Rohm and Haas' Ambersorb 563, a carbonaceous sorbent, are the best choices as replacements for activated carbon.
Dow XUS offers many advantages over activated carbon:
• similar, although slightly lower, capacity for CVOC • higher sorption rate • CVOC capacity much less affected by relative humidity • much lower sorption of water • greater change in sorption capacity as temperature is increased, making
it more thermally desorbable • faster thermal desorption rate • no effect of repeated sorption/ desorption on capacity for CVOC • better dynamic performance in a column - quicker restoration of
sorption capacity • not catalytic • not friable - low attrition • low fire hazard
The commercial carbonaceous sorbent, Ambersorb 563, offers some of these same advantages, however, it is not as thermally regenerable and did not perform as well on repeated use in a column. Although Ambersorb 563 has a higher capacity than Dow XUS at the lower end of the concentration range considered here, the difference is much smaller at the higher end. Ambersorb 563 does sorb much less
ES-2

water at higher relative humidities than does Dow XUS. Overall, Dow XUS is the preferred sorbent, but Ambersorb 563 is also acceptable.
However, both of these synthetic sorbents have a significant disadvantage compared to activated carbon - cost of the sorbent, which ranges from $25-$35/lb versus <$2.50/lb for activated carbon.
In this work, a sorption process was developed based on standard packed bed technology. While this process offers a cost advantage over off-site regenerated activated carbon at high concentrations, it is not cost-competitive with other processes using these same sorbents. The key to capitalizing on the many advantages commercial synthetic sorbents offer over activated carbon is to minimize the effect of sorbent purchase price. This leads to designs using small sorber beds and hence short sorption cycle times. This in turn translates into short desorption times and a close matching of these times. Significant progress toward these goals has been made by various vendors, such as Purus, Inc. These implementations have been found to be cost-effective in field use. Further improvements, such as reduced desorption time and separate treatment of the column bleed resulting from this partial desorption, may create an even more cost-effective process.
ES-3

ORGANIC SPONGES FOR COST-EFFECTIVE CVOC ABATEMENT
General Electric Corporate Research and Development U.S. Department of Energy - Morgantown Energy Technology Center
US DOE Contract No. DE-AC21-92MC29U0
EXECUTIVE SUMMARY
The need to remove chlorinated solvents from air streams is nearly universal, occurring both at remediation sites and in industrial settings. Increased enforcement of the Clean Air Act Amendments of 1990 and the new EPA regulations under the Organic Air Emissions Standards for HWTSD Facilities and HW generators will accelerate the need for cost-effective processes that can treat CVOC-contaminated air streams.
In remediation applications, air streams contaminated with CVOCs arise from air stripping of ground water or from soil and dual phase vapor extraction. The importance of treating such streams is reflected in two major DOE-sponsored programs - the Arid Soil Integrated Demonstration (Hanford) and the Non-Arid Soil Integrated Demonstration (Savannah River). CVOC-contaminated streams are prevalent at DOE sites: Hanford - (mainly) carbon tetrachloride; Savannah River and Paducah - mainly trichloroethylene (TCE); Idaho National Engineering Laboratory and Rocky Flats - mainly TCE and carbon tetrachloride.
Similarly, General Electric has at least 25 sites accountable to discontinued GE businesses that currently use pump and treat technology. Many of these treat, or will need to treat, solvent-contaminated air streams. In terms of plant emissions and targets for pollution prevention, solvents are one of the largest issues within GE, with releases totaling 1.2 million pounds in 1992.
Recognizing this need and being acutely aware of the shortcomings of the most common treatment scheme — adsorption onto activated carbon — General Electric undertook an 18-month program to develop better sorption technologies for remediation applications. The focus was on identifying sorbents that would not suffer the limitations of activated carbon and on developing a cost-effective process using these sorbents as a superior alternative to traditional carbon adsorption.
The shortcomings of using activated carbon to remove CVOCs from air streams are well-documented. INEL recently rejected carbon adsorption as part of their remedial action alternative because of the difficulties associated with carbon handling and regeneration. A carbon fire at the Hanford site, resulting from the treatment of a fairly concentrated air stream, demonstrates some of the safety issues related to the use of activated carbon. Drawbacks of using activated carbon can include:

Organic Sponges for Cost-Effective CVOC Abatement
• Low capacity at high relative humidity • Relatively hydrophilic: readily adsorbs water • Difficult to completely regenerate • Need for periodic high temperature (500-1000°C) reactivation • Catalyzes formation of HC1 from CVOCs, especially with steam • Potential fire hazard, due to the heat of adsorption • Friable - subject to attrition losses during handling (~5% per cycle).
Any of these properties can adversely affect process economics.
To identify synthetic sorbents that do not suffer from these limitations, we screened greater than 100 materials for their ability to sorb CVOCs. An expedient technique of measuring weight uptake from a saturated vapor was developed. From these screening experiments, about 10 sorbents were selected for further evaluation. The key performance properties of these potential sorbents were measured and compared to each other and to activated carbon. These properties included: sorption isotherms and rate, effect of relative humidity, thermal desorption and rate, aqueous desorption isotherms, sorbent lifetime and dynamic performance in a column.
Out of this work, we have identified two types of sorbents which offer significant advantages over activated carbon for use in remediation applications — a commercial polymeric sorbent (Dow's XUS) and a commercial carbonaceous sorbent (Rohm and Haas' Ambersorb 563). Through extensive experimentation and comparison under identical conditions, and incorporating some company supplied data, we found that Dow XUS has many advantages over activated carbon:
• similar, although slightly lower, capacity for CVOC • faster sorption • CVOC capacity much less affected by relative humidity • much lower sorption of water • greater change in sorption capacity as temperature is increased, making
it more thermally desorbable • faster thermal desorption • no effect of repeated sorption/ desorption on capacity for CVOC • better dynamic performance in a column - quicker restoration of
sorption capacity • not catalytic • not friable - low attrition • low fire hazard.
The commercial carbonaceous sorbent, Ambersorb 563, has a higher capacity than Dow XUS at the lower end of the concentration range likely to be encountered in remediation applications, but the difference is much smaller at the higher end. Ambersorb 563 also sorbs less water at high relative humidities compared to Dow XUS. However, it is not as thermally regenerable and did not perform as well on repeated use in a column.
2
Organic Sponges for Cost-Effective-CVOC Abatement
Both of these synthetic sorbents have a significant initial cost disadvantage compared to activated carbon ~ $25-$35/lb for the synthetic sorbents versus <$2.50/lb for activated carbon.
The key, then, to capitalizing on the many advantages commercial synthetic sorbents offer over activated carbon is to minimize the effect of sorbent purchase price (i.e., use small sorber beds). In this work, a sorption process was developed based on the use of these synthetic sorbents in a standard packed bed technology. This process offers greater than 50% savings in total annualized cost over off-site regenerated activated carbon at high concentrations (400 ppmv TCE, 2000 SCFM). In addition, there are several straightforward approaches to further optimize the process. The most obvious is to reduce sorption cycle times, which will result in smaller sorber beds. This could be accomplished by minimizing desorption times and closely balancing sorption and desorption times.
Significant progress toward these goals has been made by Purus, Inc. Purus uses electric in-bed heaters and cooling coils to minimize the heating and cooling parts of the desorption cycle. This responsive control of bed temperature results in shorter desorption times and consequently smaller sorber beds. In one soil remediation application there was an estimated 40% savings in treatment costs compared to the use of activated carbon. Comparable savings have been seen in ground water remediation and in the treatment of industrial process waters and vapors. Greater than ten such units are currently in use at various soil and water remediation sites.
We believe that further improvements to reduce cost and improve reliability of present systems are possible. For instance, reducing desorption time and providing for separate treatment of the column bleed resulting from this partial desorption will permit the use of shorter sorption times and hence smaller sorber beds. The bleed could be treated by a biotic or abiotic destruction process that may work best at low concentrations. Such a hybrid system would maximize the strength of each process. The sorption process would handle the bulk of the CVOC, but would not be hampered by an excessively long desorption step. Most of the CVOC would still be recovered as neat product, and the column bleed would be removed via the destruction technology.
For streams containing several contaminants (BTEX or TCE/ vinyl chloride/ methylene chloride), the system capital cost could be reduced by intentionally allowing the less sorbable components to pass through unsorbed, thus allowing the use of a smaller sorber bed. As above, the non-sorbed contaminants could then be treated by a coupled destruction process.
A destruction process coupled to the effluent of a sorption process would also serve as a safety net for handling any process upsets resulting from feed spikes. Thus, overall system reliability would be improved.
One destruction technology in which we have significant development experience is the biodegradation of methylene chloride and TCE in aqueous streams using a GAC-fluid bed bioreactor. Our original goal was to couple aqueous microbial destruction technology to the regeneration step of the sorption process, either through water or steam regeneration of the loaded bed.
3

Organic Sponges for Cost-Effective CVOC Abatement
Although the commercial viability of the coupled sorption/biodegradation process can be limited by high COD loadings in the desorption streams, microbial destruction shows promise for the treatment of relatively dilute streams or lower flow rates. Therefore, based on our work thus far, we believe that biodegradation is an efficient destruction step. Even greater efficiency could be attained by applying biodegradation directly to contaminated air streams (biofiltration) in the coupled biodegradation/sorption process.
We have made several key advances in the biodegradation of aqueous-phase CVOCs and these should position us to rapidly couple biofiltration to a sorption process. We found the biodegradation of aqueous-phase methylene chloride in a GAC-fluid bed bioreactor to be commercially viable; specifically:
• biodegradation can be accomplished effectively using a mixed microbial culture derived from industrial activated sludge — a specially tailored microbe is not necessary
• an aggressive reactor startup procedure demonstrated that the process is robust and suitable for large-scale implementation.
The biodegradation of aqueous-phase TCE in a GAC-fluid bed reactor is earlier in the development stage, but shows promise. Thus far we have found:
• a phenokTCE degrading microbe suitable for scale-up in the GAC-fluid bed bioreactor. This was isolated and characterized via laboratory optimization studies.
• non-optimized continuous bioreactor studies resulted in -30% biodegradation of TCE. The system performance can most likely be improved by optimizing the phenohTCE ratio and the retention time.
• the TCE-degrading competency of the selected microorganism remained strong even after five weeks of continuous culture in a non-sterile bioreactor environment (based on microbiological assays). Long-term microbial survival is a critical aspect of system performance.
These biological treatment approaches also have direct stand-alone application to the destruction of CVOCs in contaminated ground waters or industrial process wastewaters. We are actively pursuing opportunities for the methylene chloride biodegradation process within GE.
Biofiltration overcomes the inherent gas/liquid mass transfer limitations associated with traditional aqueous-phase biological treatment. Increased oxygen availability would lead to greater degradation rates and a consequent reduction in reactor size (i.e., reduced capital cost). For all of these reasons biofiltration technology seems ideal for treating either the column bleed from a partially desorbed bed, or the poorly sorbed components of a mixed contaminant stream. Of course, certain compounds are more amenable to biodegradation than others. Hydrocarbons are relatively easily degraded, as is methylene chloride. TCE is a greater challenge. Our extensive experience with aqueous-phase biodegradation, along with our knowledge of vapor-phase sorption (which can be a key parameter in successful biofiltration), lays the groundwork for us to further develop and apply biofiltration technology.
4

Organic Sponges for Cost-Effective CVOC Abatement
GE sees several opportunities to further develop both sorption and biodegradation technologies. In addition, there is an anticipated synergy in coupling these two processes. The sorption system works best for the recovery of bulk amounts of readily sorbable solvents. The biodegradation will be more economically viable for low amounts of solvent. Based on the results of this work, we recommend the following future development activities:
• optimize the operation of a process using polymeric sorbents to further reduce cost. For a Purus sorption unit, a design of experiments protocol would provide the ability to predict the effect of regeneration time, regeneration temperature, flow rate of purge gas and duration of purge gas flow on the amount of bleed from the column and the actual working capacity of the column. With this information, economic decisions based on the trade-offs between operating costs and sorber bed size could then be confidently made for a given site.
• develop the biodegradation of chlorinated solvents in air streams (biofiltration). Based on aqueous phase work, this should be straightforwardJor methylene chloride, but more difficult for TCE. The polymeric sorbents that we identified here have excellent regeneration capabilities, which can be a critical property of an efficient biofiltration matrix. Our detailed knowledge of sorption/ desorption behavior will allow us to assess the usefulness of polymeric or other sorbents for this application. This .'work would complement that underway within the DOE by W. Apel at INEL.
• couple sorption and biofiltration to realize the strengths of each. Biofiltration could be used to treat the column bleed resulting from incomplete desorption of the sorber bed. This would result in a smaller sorber bed and hence reduced capital costs. Since only a fraction of the total solvent would be biodegraded, the size and cost of that unit would also be small. The results of the sorption process optimization (effect of operating conditions and hence operating and capital costs on column bleed) would then be coupled with the costs for the biofiltration system to define the lowest cost scenario for the combined processes.
• use biofiltration to treat the less sorbable components of a mixed stream. This would be particularly useful for treating streams containing methylene chloride or BTEX.
GE's expertise in understanding the fundamental properties of sorbents, coupled with the field experience of a vendor such as Purus, Inc., will allow us together to continue to improve sorption technology based on polymeric sorbents. Relying on our basic and applied work in aerobic aqueous biodegradation of both chlorinated and hydrocarbon solvents and collaborating with known experts within DOE, such as W. Apel, we will be able to rapidly extend our work into biodegradation of contaminants in air streams. GE is in the unique position to couple these two technologies and therefore develop a more cost-effective process that takes advantage of the strengths of each for the treatment of solvent-contaminated air streams.
5

ORGANIZATION of REPORT
This report is organized into three parts. Part I discusses the work on evaluation of sorbents for CVOCs, leading to selection of two sorbents used in the conceptual design of a sorption process. Part II discusses the aerobic biodegradation of methylene chloride and trichloroethylene. Part m is the detailed report on the process design and cost analysis.
The acronyms, abbreviations, and units used in this report are listed on the following pages.
6

List of Acronyms and Abbreviations Used in Report
A563 Ambersorb 563 sorbent (Rohm and Haas) AS air stripper or air stripping BPL activated carbon (Calgon) BTC breakthrough curve BTEX benzene, toluene, xylenes CC14 carbon tetrachloride CH 2C1 2 methylene chloride, dichloromethane COD chemical oxygen demand CSTR continuous stirred-tank reactor CVOC chlorinated volatile organic compound D desorbing gas flow rate d P diameter of particle D c diameter of column DCM methylene chloride, dichloromethane D.O. dissolved oxygen DOE Department of Energy AP pressure drop AP/L pressure drop per unit length EBCT empty bed contact time ECD electron capture detector EPA Environmental Protection Agency EPCM engineering, procurement and construction
management F feed flow rate FBR fluidized-bed reactor FID flame ionization detector GAC granular activated carbon GC gas chromatography GE General Electric Company GEP GE Plastics H Henry's law constant HC1 hydrochloric acid HRT hydraulic retention time HW hazardous waste HWTSD hazardous waste toxic substance disposal ID, ID. inside diameter INEL Idaho National Engineering Laboratory K constant in Freundlich equation (Chapter 3) K p equilibrium constant (aqueous phase - Chapter K v equilibrium constant (vapor phase - Chapter 8) L c length of column, bed height MC,MeCl2 methylene chloride, dichloromethane MeOH methanol MTZ mass transfer zone N 2 nitrogen n , l / n constant in Freundlich equation (Chapter 3) NA not available
7

List of Acronyms and Abbreviations Used in Report (continued)
O&M operating and maintenance OD optical density PAS phosphate-ammonium salts PCE perchloroethylene, tetrachloroethylene PVC polyvinyl chloride q sorption capacity (gCVOC/gsorbent) R2A a rich agar medium RD remedial design RH relative humidity RI/FS remedial investigation/ feasibility study ROD record of decision SVE soil vapor extraction T m melting temperature TCE trichloroethylene TSDF toxic substance disposal facility TSS total suspended solids VOC volatile organic compound VSS volatile suspended solids WWTP wastewater treatment plant XU,XUS Dow XUS sorbent (Dow Chemical)
Note: Numerous sorbents are referred to by abbreviation throughout this report. Definition, description and properties of sorbents (including those not listed in this table) are given in Tables 2.1,2.4,3.1 and IV.l in Part I.
8

List of Units Used in Report
BTU British thermal unit C,°C Celsius, degrees Celsius cc cubic centimeters cfu,CFU colony-forming units cm centimeters d,D days deg degrees F / F Fahrenheit, degrees Fahrenheit f,ft feet g grams gal, GAL gallons GJ giga joules (109 joules) gpm, GPM gallons/minute h,hr hours hp,HP horsepower in inches inHg("Hg) inches of mercury k,K thousand kcal kilocalorie kg kilograms kw,KW kilowatts kw-hr, KWhr kilowatt-hour I L liters lb, lbs pound(s) M molar (moles/liter) m meter mg milligrams MGD million gallons/day min minutes ml,mL milliliters mM millimolar (millimoles/liter) MM million mm millimeters mmol, mmole(s) millimole(s) mol mole(s) mw,MW molecular weight N normal (equivalents/liter) ppb parts per billion ppm, ppmw parts per million (by weight) ppmm parts per million (molar) ppmv parts per million (by volume) psi pounds per square inch psia pounds per square inch — absolute psig pounds per square inch — gauge seem, SCCM standard cubic centimeters/minute SCF standard cubic feet scfh,-SCFH standard cubic feet/hour
9

List of Units Used in Report (continued)
scfm,SCFM standard cubic feet/minute sf square foot SLPM standard liters / minute Hg micrograms ul,uL microliters urn micrometers uM micromolar (micromoles /liter) umol, umole(s) micromole(s) yr year i i inches i feet # pounds
10

Organic Sponges for Cost-Effective CVOC Abatement Part I: Evaluation of Sorbents and Conceptual Process Development
1-1


TABLE of CONTENTS
Part I Summary: Evaluation of Sorbents and Conceptual
Process Development ES-1
CHAPTER 1: INTRODUCTION and BACKGROUND on SORBENTS 1
1.1 Introduction 1 1.2 CVOC Sorption Processes 3
1.2.1 Activated Carbon Systems 3 1.2.2 Approach for Evaluating Synthetic Sorbents 4 1.2.3 General Types of Sorbents 6 1.2.4 Preliminary Selection of Sorbents 7
1.3 Organization of Report 8 CHAPTER 2: INITIAL SCREENING of SORBENTS 9
2.1 Purpose and Background 9 2.2 Experimental 10 2.3 Results 11 2.4 Discussion and Conclusions 18
CHAPTER 3: SORPTION ISOTHERMS 20
3.1 Purpose and Background 20 3.2 Experimental 20 3.3 Results 20 3.4 Discussion and Conclusions 26
CHAPTER 4: SORPTION RATE 29
4.1 Purpose and Background 29 4.2 Experimental 29 4.3 Results 29 4.4 Discussion and Conclusions 31
CHAPTER 5: EFFECT of RELATIVE HUMIDITY on SORBENT PROPERTIES 32
5.1 Purpose and Background 32 5.2 Experimental 32 5.3 Results 32 5.4 Discussion and Conclusions 37
CHAPTER 6: THERMAL DESORPTION ISOTHERMS 39
6.1 Purpose and Background 39 6.2 Experimental 39 6.3 Results 39 6.4 Discussion and Conclusions 41
i
1-3

CHAPTER 7: THERMAL DESORPTTON RATE 43
7.1 Purpose and Background 43 7.2 Experimental 43 7.3 Results 44 7.4 Discussion and Conclusions 50
CHAPTER 8: AQUEOUS DESORPTION ISOTHERMS 51
8.1 Purpose and Background 51 8.2 Experimental 51 8.3 Results 51 8.4 Discussion and Conclusions 54
CHAPTER 9: SORBENT LIFETIME 57
9.1 Purpose and Background 57 9.2 Experimental 57 9.3 Results 58 9.4 Discussion and Conclusions 59
CHAPTER 10: DYNAMIC PERFORMANCE - COLUMN EXPERIMENTS 62
10.1 Purpose and Background 62 10.2 Experimental 62 10.3 Results 64 10.4 Discussion and Conclusions 66
CHAPTER 11: SUMMARY of PROCESS DESIGN and COST ANALYSIS 72
11.1 Sorbent Choice 72 11.2 Conceptual Process Design 72 11.3 Summary of Cost Analysis 76 11.4 Refinement of Process Design 77 11.5 Recommendations for Process Improvements 79
CHAPTER 12: CONCLUSIONS and RECOMMENDATIONS 81
12.1 Summary of Sorbent Properties 81 12.2 Sorbent Choice for Remediation Applications 82 12.3 Recommendations 84
REFERENCES 85
APPENDIX I: WEIGHT UPTAKE RESULTS 87 APPENDIX H: USE of TEKMAR AUTOMATIC HE ADSPACE ANALYZER 95 APPENDIX HI: FREUNDLICH FITS 101 APPENDIX IV: AQUEOUS PARTITION COEFFICIENTS 104
ii
1-4

LIST of TABLES
1.1 Cost Factors in On-Site Carbon Regeneration Process 4 1.2 Properties of "Ideal" Sorbent 5
2.1 TCE, CH2CI2 and Water Vapor Sorption Capacities of Select Sorbents Measured under Saturated Vapor Conditions at 30°C 12
2.2 Particle Size Distributions of Select Lomod JB610 Thermoplastic Elastomers (GE Plastics) and Carbon-Filled Rubbers 14
2.3 Effect of Water on TCE and Methylene Chloride Sorption Capacities 16 2.4 Top-Performing Commercial Polymers and Rubbers Selected for
Further Examination 19
3.1 Sorbents Selected for Isotherm Studies 21 3.2 Freundlich Parameters for TCE at 30°C and Ambient (low) Humidity 26 3.3 Freundlich Parameters for CH2CI2 at 30°C and Ambient (low)
Humidity 26 3.4 Properties of Sorbents Used in Subsequent Testing 27
5.1 Freundlich Parameters for TCE Sorption at 30°C and 85% Relative Humidity 37
5.2 Freundlich Parameters for CH2CI2 Sorption at 30°C and 85% Relative Humidity 37
6.1 Freundlich Parameters for TCE at 90°C 39 6.2 Freundlich Parameters for CH2CI2 at 90°C 41 6.3 Relative Desorbability 42
8.1 Prediction of Vapor Phase Distribution Coefficient (Kv) from Aqueous Phase Distribution Coefficient (Kp) 56
10.1 Properties of Sorbents for Column Studies 63
11.1 Comparison of Estimated Costs 77 11.2 Analysis of Annualized Costs 78 Jll.3 Comparison with Purus Quote 79
12.1 Ratings of Sorbents versus Properties of "Ideal" Sorbent for Removing CVOCs from Air Streams in Remediation Applications 83
1.1 Percent Uptake of TCE on Polymers at 30°C 88 1.2 Percent Uptake of Methylene Chloride on Polymers at 30°C 91 1.3 Percent Uptake of TCE on Water-Saturated Polymers at 30°C 92 1.4 Percent Uptake of MC on Water-Saturated Polymers at 30°C 93 1.5 Percent Uptake of Water on Dry Polymers at 30°C 94 11.1 Methods for Tekmar Headspace Analyzer 99 11.2 Typical Calibration Data for TCE 99 IV.l Equilibrium Partitioning Coefficients Describing the Partitioning of
TCE and Methylene Chloride between Aqueous and Polymer Phases at25°C 104
iii
1-5

LIST of FIGURES
2.1 Vapor Tank Assembly 10 2.2 Rate of Sorption of TCE Vapor by Polymeric Sorbents and
Activated Carbon under Saturated Vapor Conditions 13 2.3 Rate of Sorption of Methylene Chloride Vapor by Polymeric Sorbents
and Activated Carbon under Saturated Vapor Conditions 13 2.4 Sorption of TCE by Rubber Tire Under Saturated TCE Vapor
Conditions: Effect of Rubber Particle Size 15 2.5 Rate of Desorption of TCE from TCE-Loaded Sorbents at Ambient
Temperature and Pressure 17 2.6 Rate of Desorption of Methylene Chloride from MC-Loaded
Sorbents at Ambient Temperature and Pressure 17
3.1 Comparison to Calgon Reported Data for BPL 4x6 22 3.2 Comparison to Dow Reported Data for Dow XUS 22 3.3 Isotherms for TCE at Ambient Conditions 24 3.4 Isotherms for CH2CI2 at Ambient Conditions 24 3.5 Sorption of TCE and CH2CI2 by Activated Carbon and Synthetic
Sorbents 25 3.6 Sorption of TCE and CH2CI2 by Commercial Polymers and Rubbers 25
4.1 Sorption Rate for Sorbonorit B2 30 4.2 Sorption Rate for Dow XUS small particles 30
5.1 Water Sorption by Various Sorbents 33 5.2 Comparison to Literature Data at High Humidity 33 5.3 Effect of Relative Humidity on Sorption Capacity of Activated Carbon 34 5.4 Effect of Relative Humidity on Sorption Capacity of Commercial
Polymers and Rubbers 35 5.5 Effect of Relative Humidity on TCE Sorption 36 5.6 Effect of Relative Humidity on CH2CI2 Sorption 36
6.1 Effect of Temperature on TCE Isotherms 40 6.2 Effect of Temperature on CH2CI2 Isotherms 40
7.1 TCE Desorption at Constant Initial Loading 44 7.2 TCE Desorption at Constant Initial Loading 45 7.3 CH2CI2 Desorption at Constant, Low Initial Loading 45 7.4 CH2CI2 Desorption at Constant, High Initial Loading 46 7.5 Desorption at Constant Initial TCE Gas Concentration 47 7.6 Desorption at Constant Initial TCE Gas Concentration 47 7.7 Desorption at Constant Initial TCE Gas Concentration 48 7.8 Desorption at Constant Initial TCE Gas Concentration 49 7.9 Effect of Sorbent Size on Desorption Rate 49
8.1 Low Concentration Aqueous Isotherms 52 8.2 High Concentration Aqueous Isotherms 53 8.3 Aqueous Isotherms - Entire Concentration Range 54
IV
1-6

LIST of FIGURES (continued)
9.1 Sorption Behavior of Dow XUS (small and large) After Thermal Cycling with No TCE Present 59
9.2 Sorption Behavior of BPL 4x6 and Ambersorb 563 After Thermal Cycling with No TCE Present 60
9.3 Sorption Behavior of Dow XUS (small and large) After Thermal Cycling with TCE Present 60
9.4 Sorption Behavior of BPL 4x6 and Ambersorb 563 After Thermal Cycling with TCE Present 61
10.1 Column Set Up 63 10.2 Column Runs: Dow XUS large particles 67 10.3 Column Runs: Dow XUS small particles 67 10.4 Column Runs: Ambersorb 563 68 10.5 Column Runs: CalgonBPL4x6 68 10.6 1st Loading: Virgin Materials 69 10.7 2nd Loading: After "Mild" Desorption 69 10.8 3rd Loading: After More Extensive Desorption 70 10.9 1st Loading: Virgin Materials - Expanded View 70 10.7 2nd Loading: After "Mild" Desorption - Expanded View 71 10.8 3rd Loading: After More Extensive Desorption - Expanded View 71
11.1 Flowsheet for Sorption/Thermal Desorption Process 74
n.l Tekmar 7000 Sampling Sequence 96 11.2 Results of Typical Calibration 100
V
1-7


CHAPTER 1: INTRODUCTION and BACKGROUND on SORBENTS
1.1 Introduction
Hazardous waste remediation and site restoration are of increasing importance in the United States. All cost projections for these activities point up the crucial need for cost-effective treatment schemes. Chlorinated solvents such as trichloroethylene (TCE) and tetrachloroefhylene (perchloroethylene, PCE) are the most frequently found ground water contaminants. Because of their relatively high water solubilities, these compounds are very mobile in soils, aquifer materials, and ground water.
Many of the technologies that are available for the treatment of soils and ground waters contaminated with these chlorinated volatile organic compounds (CVOCs) result in a contaminated gas-phase stream. For instance air stripping of ground water that has been pumped to the surface produces an air stream containing 10's of ppmv of CVOCs. Soil vapor extraction (SVE) of the vadose zone produces an air stream containing from 1000's down to 100's of ppmv of CVOCs.
Although in some states it may now be acceptable to release such streams to the environment, such releases will not be permitted under the Clean Air Act Amendments of 1990. It will be illegal to discharge these compounds to the environment by 1995 or 1996, depending upon the compound. New EPA regulations under the Organic Air Emissions Standards for HWTSD Facilities and HW generators also tighten control over CVOC emissions.
Numerous processes have been developed to treat CVOC-contaminated gas streams. These processes can be divided into two classes, those that capture and recover the CVOC and those that destroy the CVOC. Some of the trade-offs between these approaches are listed by Kumar, et al. and Ruddy and Carroll. Several reviews of industrial practices for controlling VOCs are also available (Mukhopadhyay and Moretti; Basta). Their use in remediation applications is discussed below.
Capture/ recovery processes are useful for cases where the CVOC has some value or its disposal cost as a neat solvent is low. For most remediation cases, this value/ disposal cost will probably be established by the toxic substance disposal facility (TSDF), since the recovered solvent would probably not be pure and the remediation site probably would not have a use for it. The TSDF may recover the solvent or use it for fuel value (zero for CVOCs). Examples of capture/ recovery processes include:
• one-pass adsorption onto activated carbon • adsorption onto activated carbon followed by on-site regeneration • condensation • membrane separation
Some capture/ recovery processes (adsorption) serve to concentrate the CVOC onto a solid phase, which then reduces the disposal volume (and hence cost). Other capture/ recovery processes (adsorption with on-site regeneration) result in
l
1-9
collection (usually through condensation) of neat solvent. There may be a public perception advantage to collecting the CVOC in this form - it is easy to demonstrate that the CVOC has indeed been removed from the ground if it has been collected in 55-gallon drums. A disadvantage of these CVOC disposal options is the potential for continued liability assigned to the waste generator. But, permitting may be easier in these types of processes compared to destruction processes, since no potentially harmful emissions are produced. Note that in pollution abatement cases, on-site recovery of solvent is likely to be beneficial, since it may be possible to recycle it into the manufacturing process.
Capture/ recovery processes are also used to concentrate the CVOC stream prior to sending it to a collection (condensation) or destruction process. High concentration can improve the performance of the collection or destruction process, and the reduction in stream volume may well result in a capital cost savings for the downstream process.
Destruction technologies offer the advantage of eliminating the CVOC. Typical destruction technologies include:
• thermal oxidation • thermal catalytic oxidation • free-radical oxidation • reduction by iron • biodestruction
The costs associated with these processes are generally higher than for recovery processes. Energy costs for thermal oxidation are high and the process requires off-gas scrubbing for HC1 when destroying CVOCs. m addition, this process can require extensive permitting due to the potential for harmful air emissions. The use of a catalyst allows thermal catalytic oxidation to operate at lower temperatures and energy consumption is reduced compared with thermal oxidation. Overall the costs for the catalytic thermal oxidation are about the same as for thermal oxidation, but emissions and hence permitting requirements are potentially less. Thus, catalytic oxidation is becoming more widely accepted in the remediation community. Free radical oxidation, reduction by iron, and biodestruction are still emerging technologies for the treatment of gas streams (Haselow et al.; Mukhopadhyay and Moretti).
Clearly, the choice of the "best" off-gas treatment process is highly site-specific, depending on stream flow rate and concentration, market for recovered solvent, availability of utilities, and the regulatory climate.
This work focused on a technology from each of these general classes: capture/ recovery by sorption and aerobic biodegradation. These technologies were developed in parallel, with the intent being to couple them in a process design if that proved economical. Part I of this report covers the experimental work leading to sorption process conceptual design and Part n covers biodegradation. Potential for coupling these technologies is discussed in Chapter 11 of Part I and in Part EI.
2
1-10

1.2 CVOC Sorption Processes
The main goal of this work was to identify and evaluate sorbents for their usefulness in removing CVOCs from air streams, and to develop and do a cost analysis of a process based on these sorbents. The streams of interest were those generated from remediation processes, especially air stripping of ground water and soil vapor extraction. In particular, given the potential drawbacks of using activated carbon (discussed below), emphasis was placed on finding synthetic sorbents that would be suitable replacements for carbon. An additional result of this work was to classify synthetic sorbents according to the concentration of the air stream they would be useful for treating.
1.2.1 Activated Carbon Systems
Numerous companies have developed processes based on using activated carbon to remove CVOCs from air streams (Stenzel; Riley and SenGupta). The simplest approach is to pass the stream through a 55-gallon drum (or drums) filled with activated carbon. When the carbon is loaded, the drums are sent for disposal or replacement, usually to the carbon supplier (e.g. Calgon or American Norit). Regenerated or reactivated carbon is returned, although with some loss of material due to attrition, etc. This carbon exchange is often the main cost in the air treatment scheme.
On-site regeneration of carbon can be accomplished with steam, hot gas, in-bed heating, vacuum, or a combination of the above. All of these cases permit CVOC recovery as a neat product. Some secondary waste (contaminated water) may also be generated. Steam regeneration is the traditional method, common in industrial processes where solvent recovery is desired (Stenzel and SenGupta; Crittenden et al.). More recent technologies have moved away from steam and its concomitant generation of aqueous waste. For instance in their Brasorb process, NUCON uses hot nitrogen to desorb the CVOC-loaded bed. Heating and cooling of the nitrogen gas is accomplished with a Brayton refrigeration cycle (NUCON literature). Westates has used hot nitrogen to regenerate the bed and has also implemented a rotor concentrator to achieve continuous adsorption and desorption (Graham and Ramaratnam). Met-Pro Systems uses vacuum and in-bed heating to accomplish regeneration (Parmele et al.). Calgon's CADRE (Vara, International) process also uses hot gas to regenerate the bed. Integral to the process is a thermal oxidation unit. Overall costs can be low due to the reduced stream volume sent to the oxidizer (Riley and SenGupta). Numerous other alternative designs based on activated carbon have been proposed (Parmele et al; Ruhl).
Although on-site carbon regeneration systems have been used to successfully treat many contaminated air streams, there are several shortcomings associated with the use of carbon. Depending on the regeneration scheme used these may include:
• Low capacity at high relative humidity • Relatively hydrophilic: readily adsorbs water • Difficult to completely regenerate
3 1-11

• Need for periodic high temperature (500-1000°C) reactivation • Can catalyze formation of HC1 from CVOCs, especially with steam • Potential fire hazard, due to the heat of adsorption • Friable
To further elucidate the issues associated with the use of activated carbon, an analysis of the factors that affect the cost of an on-site steam regenerated carbon system was done. The basic data were taken from Crittenden (Crittenden). Table 1.1 summarizes the most important costs, listed as a percentage of the total annual cost. Annual capital costs were based on a 20 year, 20 payment 10% bond interest rate (capital recovery factor = 0.117). Maintenance was assumed to be 5% of total equipment costs. The GAC (granular activated carbon) to treat the aqueous regenerant effluent was assumed to be a self-contained adsorption unit at $575/ unit. The heating steam to reduce relative humidity was that required to reduce the relative humidity of the air inlet stream (from an air stripper) to less than 50%. A rather high regenerant steam to carbon ratio of 20 lb steam/ lb carbon was assumed.
TABLE 1.1: Cost Factors in On-Site Carbon Regeneration Process
ITEM % of Annual Cost Capital Recovery
Adsorber Initial Carbon
40-65 10-20
2 - 4 Maintenance 10-20 GAC for regenerant effluent 3-20 Heating steam to reduce %RH 7 - 8 Regenerant steam 1-2
The major cost items are highlighted in bold. Two are related to carbon capacity and its decreased performance at high relative humidity: the adsorber (and associated maintenance costs) and the steam required to preheat the air stream to reduce relative humidity. The cost for GAC to treat the regenerant effluent is unique to a steam regeneration process. However, if, due to its hydrophilic nature, the carbon adsorbs a significant amount of water, there may still be a volume of aqueous effluent to treat from a hot nitrogen-based regeneration process.
2.2.2 Approach for Evaluating Synthetic Sorbents
Based on all of the above considerations, the "ideal" sorbent would have the properties listed in Table 1.2.
It was a goal of this work to identify and evaluate synthetic sorbents that would meet these properties and thereby not suffer from the same limitations as activated carbon when treating CVOC-contaminated air streams. The approach to accomplish this goal was first to screen greater than 100 synthetic sorbents for their ability to sorb CVOCs. An expedient technique of measuring weight uptake from a saturated vapor was used. From these screening experiments, about 10 sorbents were selected for further evaluation. The relevant properties of potential sorbents
4
1-12

were measured and compared both among the sorbents and with carbon. The net result is a direct comparison of several important properties of various sorbents and carbon under the same experimental conditions. The important sorbent properties were chosen based on the criteria listed in Table 1.2 for the "ideal" sorbent. They were:
• CVOC sorption isotherms (sorption capacity for CVOC as a function of vapor concentration)
• Sorption Rate (rate of CVOC sorption) • Effect of relative humidity on CVOC sorption isotherm • Water sorption isotherm (sorption capacity for water as a function of relative
humidity) • CVOC desorption isotherms (change in sorption capacity for CVOC as a
function of temperature) • CVOC desorption rate (rate of CVOC desorption from sorbent at elevated
temperature) • Sorption Lifetime (effect of repeated heating and/or desorption on sorbent
capacity) • Aqueous CVOC isotherms (sorption capacity of sorbents for CVOCsfrdm water
- potentially useful for coupling to biodegradation) • Dynamic Behavior (column experiments)
TABLE 1.2: Properties of "Ideal" Sorbent
Property Impact on Process Costs High Capacity Smaller adsorber, lower capital and
maintenance High Sorption Rate Small mass transfer zone - smaller beds Capacity not affected by %RH No steam to heat incoming gas or heat
exchanger to cool and condense out water Hydrophobic - Low Water Sorption Lower volume of aqueous effluent to
dispose or destroy Readily Regenerable (fast and complete)
Lower volume of effluent to dispose or destroy; shorter cycle time
Long Lifetime No loss of sorption capacity with repeated use
Not catalytic Lower materials of construction cost due to no HCl formation
Low AP Lower blower costs Low Attrition Lower make-up costs Low Fire Hazard Safety Low Purchase Cost Low initial capital expense Readily Acceptable to Remediation and Regulatory Communities
Ease of permitting, Critical to success
5
1-13

123 General Types of Sorbents
In a very general view, solid sorbents may be classified as two types: adsorbents and absorbents. Traditionally, most sorbents are adsorbers, designed so as to have very high surface areas to which the sorbate may adhere. Adsorbents include activated carbon, synthetic polymeric adsorbents, and synthetic carbonaceous adsorbents.
Numerous references discuss the manufacture and properties of activated carbon (Soffel; Sontheimer et al.; American Norit; Calgon). In general, granular activated carbon (GAC) contains many different surface functional groups and has a wide range of pore sizes (Kong and DiGiano). Polymeric adsorbents tend to have more uniform pore size and surface area, which can be controlled during the manufacturing process. Typical matrix types are copolymers of styrene-divinylbenzene and polyacrylic ester. Gel-type polymeric resins are general used for aqueous applications, where water can swell the polymer to create porosity. Macroreticular and macroporous resins have a high physical porosity and so are useful for gas phase applications (Rohm and Haas; Dow). Carbonaceous adsorbents are formed by partial pyrolysis of macroreticular polymer resin (highly sulfonated styrene/ divinylbenzene). Pyrolysis results in a large increase in microporosity and allows control of surface hydrophobicity (Rohm and Haas).
Generally, activated carbons tend to have more microporosity (<2 nm), whereas synthetic (polymeric and carbonaceous) adsorbents have more meso- (2 nm - 50 nm) and macro- (>50 nm) porosity (Vandersall et al.). In a comparing these three types of sorbents for the ability to remove trace organics from water, Weber and van Vliet concluded that adsorption on polymeric adsorbents occurs mainly by hydrophobic bonding and dispersion forces. For carbon, specific-type electrostatic interactions are also a factor. Carbonaceous adsorbents fall in between. As a result of these factors, activated carbons generally have the highest capacity for a sorbate, at least at low concentrations; however, compared to the polymeric adsorbents, this adsorption is relatively irreversible.
Several researchers have compared isotherms for adsorption of organic compounds from water by activated carbon and synthetic adsorbents (Browne and Cohen; Simpson et al.; Weber and van Vliet). All have found that the slope of the isotherms increases in the order activated carbon < carbonaceous < polymeric, leading to the conclusion that at sufficiently high concentrations, the adsorptive capacity of the polymeric and carbonaceous adsorbents may exceed carbon. Indeed, Simpson et al. have measured aqueous isotherms over a wide range of concentrations and found that, for a variety of organic contaminants, at about 25% of aqueous solubility, the capacity of polymeric adsorbents exceeds that of activated carbon. Such comparisons do not appear to be available for adsorption from the gas phase.
Absorption of a sorbate into a sorbent has also been noted in the literature. Absorption may be viewed as a solubility-type mechanism. Schoene et al. observed this type of behavior for sorption of hydrocarbons and PCE from the gas phase into polyethylene foil and Carbowax 20M-2-nitroterephthalic acid. The results were
6
1-14

described in terms of Henry's law. The observed positive deviations were attributed to either structural changes in the polymeric matrix due to absorption or solute-solute interactions being stronger than solute-polymer. For Tenax (poly(p-2,6-diphenylphenylene oxide)) bom adsorption (low concentration) and absorption (higher concentrations) were concluded to occur. The solubility in the absorption part of the isotherm was described by Henry's law. Hradil et al., in a study of sorption of organic compounds from water by polymeric sorbents, also report a solubility mechanism, particularly for less cross-linked matrices.
Simpson et al. closely examined the sorption properties of XAD-4 (macroreticular, high surface area styrene/divinylbenzene copolymer). XAD-4 is an agglomeration of very small non-porous microspheres; all of the porosity is outside these microspheres. By comparing the sorption capacity of larger microspheres of the same polymeric composition (non-porous, low surface area, minimal adsorption) with XAD-4 itself, Simpson concluded that XAD-4 sorbs by both adsorption and absorption. Simpson et al. found that extending the adsorption-only model of Weber and van Vliet to very high concentrations resulted in an underprediction of XAD-4 sorption capacity for CCI4, indicating that absorption becomes important at high concentrations. This absorption component may account for the higher capacity of polymeric sorbents compared to activated carbon at higher concentrations.
From the above discussion, it is apparent that some sorbents can have either an ad or an ab sorption component, or both. High surface area materials with no possibility for sorbate dissolution work by adsorption. Low surface area materials would have minimal adsorption component and work by absorption. High surface area polymeric sorbents may have the capability to do both. Most likely adsorption would dominate at low concentrations and absorption at high concentrations (after surface sites are saturated). The effects of these phenomenon on isotherms is discussed in Chap 3.
To avoid assuming the type of mechanism the word "sorption" is used here to describe both ad and ab sorption.
1.2.4 Preliminary Selection of Sorbents
The initial phase of this work was designed so that many sorbents could be screened quickly. Therefore, sorbents assumed to have various types of sorption mechanisms were chosen. The classes of sorbents studied included:
• activated carbon • synthetic polymeric sorbents (commercially available) • synthetic carbonaceous sorbents (commercially available) • other commercial polymers and rubbers
Activated carbons were chosen as the comparison case and for their high capacity. Synthetic polymeric sorbents were chosen for their purported easy of regenerability. Synthetic carbonaceous sorbents were chosen for reportedly having properties intermediate between these two. Subsequent to the start of this work,
7
1-15

Purus, Inc. introduced a cost-effective vapor treatment process based on some commercially available synthetic sorbents (Purus literature). Rotamill (SORBATHENE process) and Otto, German companies working with Dow Chemical Company, use a Dow-based polymeric sorbent bed to sorbs CVOCs from industrial emissions (Mukhopadhyay and Moretti; Jones). Some of these same synthetic sorbents were a part this work.
In previous work, certain readily available commercial polymers and rubbers had shown great potential for removing PCBs from aqueous surfactant solutions (Gascoyne and Webb). These sorbents, working by an absorption mechanism, had a high capacity for PCBs and were also selective. Thus, these types of materials were also included in this study.
An important criterion in selecting an optimum polymeric sorbent is the ability of the sorbent to retain its physical integrity at high CVOC capacity. Many, if not most, commercial polymeric resins swell, fuse or dissolve upon sorption of aggressive chlorinated solvents such as TCE and methylene chloride. As described in Chapter 2, high CVOC sorption capacities and fast sorption rates were measured for a number of commercial polymers and rubbers. These sorbents fell into three distinct classes: thermoplastic elastomers with a hardblock-softblock composition (e.g., Lomod®, Hytrel®), carbon-filled rubber materials (e.g., scrap rubber tire, NBR, EPDM) and blends of rubber and reinforcing polymers such as polypropylene (e.g., Geolast, Vyram, Santoprene).
In each of these classes of polymers, a nonsorbing reinforcing component or hardblock imparts dimensional and structural integrity to the CVOC-laden polymer. For example, the Lomod and Hytrel thermoplastic resins contain a polyether softblock that sorbs CVOC and a polybutylene terephthalate (PBT) hardblock that does not sorb CVOC. The PBT hardblock is necessary, however, in that it physically reinforces the softblock. In the same way, the carbon filler in the carbon-filled rubber and the polypropylene in the rubber-PP blends serve to reinforce the sorbing components of those blends. A complete list of all the sorbents studied is included in Appendix I.
Although zeolites are finding more use for VOC control (Mukhopadhyay and Moretti; Ruhl), none were included here.
1.3 Organization of Report
Each of the following chapters is devoted to the measurement of a particular sorbent property, covering experimental procedures and results and a discussion of which sorbent is "best" with respect to the property measured and what insight into sorption mechanism may be gleaned from these measurements. This culminates in the selection of sorbents for use in a sorption process to remove CVOCs from remediation-type air streams. Chapter 11 presents the process design and cost analysis based on the preferred sorbents. A summary of conclusions is given in Chapter 12. Part II summarizes the work on biodegradation of CVOCs. Part HI gives the details of the process design and cost analysis.
8
1-16

CHAPTER 2: INITIAL SORBENT SCREENING
2.1 Purpose and Background
The objective of £he sorbent screening studies was to identify several commercial polymer and synthetic sorbents to be used to sorb chlorinated solvent vapors such as TCE and methylene chloride from air streams. Such air streams are commonly encountered in air stripping of ground water (10's of ppmv), soil vacuum extraction (100's of ppmv), and industrial emissions (>1000 ppmv).
r
In this phase, four major criteria were used in selecting top-candidate sorbents: (1) equilibrium capacity measured under saturated TCE and methylene chloride vapor conditions, (2) sorption/desorption rates for TCE and methylene chloride under saturated vapor conditions, (3) retention of original physical state of the polymer at sorption capacity and (4) cost and availability. Saturated TCE and methylene chloride vapor concentrations rather than low CVOC vapor concentrations were used for the screening process because of the number of sorbents to be investigated simultaneously and because of the ease at which such an environment could be generated in a temperature-controlled vapor tank.
The ideal candidates would cost less than activated carbon, have a higher CVOC capacity and not be adversely affected by sorbed CVOC. In addition, ideal sorbents would be distinguished from activated carbon materials in that they would not sorb water or water vapor. Unlike activated carbon, CVOC sorption would be noncompetitive.
The screening studies involved the measurement of weight gain as a function of time of a large number of sorbents exposed to a saturated TCE vapor (approximately 100,000 ppmv) or methylene chloride vapor (approximately 530,000 ppmv) at ambient temperature and pressure. Given that many applications for such sorbents would involve high relative humidity air streams, the weight gain by these same commercial polymers was also measured after they had been equilibrated with water vapor at 30°C.
The uptake of water vapor at 30°C was also measured as was the rate of TCE and methylene chloride desorption under ambient temperature and pressure conditions. In this way, greater than 90 commercial polymers, synthetic sorbents and activated carbons were screened for TCE sorption. Of those sorbents that did nor dissolve, fuse or melt under saturated TCE conditions, approximately 30 were selected for methylene chloride screening. Finally, greater than 50 sorbents were screened for water vapor uptake.
Based upon the criteria mentioned above, a few select top-candidate sorbents could then be more carefully examined in CVOC sorption isotherm studies at CVOC concentrations more closely approximating those to be found in air stripper and SVE processes. In these initial experiments no effort was made to study the effect of temperature on sorption/desorption.
9
1-17

22. Experimental
A vapor tank apparatus was constructed to allow approximately 30 sorbents to be contacted with a saturated TCE, methylene or water vapor environment. Approximately 1.0 g samples of a given polymer sorbent or carbon adsorbent were weighed into 1.5 in diameter x 0.25 in tall aluminum pans that were stamped with an experiment number using a metal stamp. Each pan was capped with an aluminum cap. The pans were loaded onto a two-stage perforated metal shelf held together by four support rods. A maximum of thirty pans could be loaded onto the three-stage shelving unit. The loaded shelving unit was lowered into a 5 x 9 x 9.5 in. chromatography developing tank that contained 0.5 in of organic solvent at its bottom. The tank was set inside a water bath maintained at 30°C. A drawing of the apparatus is given in Figure 2.1. Two pieces of filter paper (24.0 cm diameter) were cut to fit the vapor tank and were placed on the two largest tank walls to act as a solvent wick. The tank was covered by a glass plate and these conditions provided a saturated solvent vapor to the polymer sorbents. No effort was made to dry the polymers or carbon adsorbents prior to their introduction to the vapor tank.
Figure 2.1 Vapor Tank Assembly
At designated intervals (typically 2,4,6,24,48,96 and 120h), the shelving unit containing the sorbent-filled pans was removed from the vapor tank. Each pan was removed from a shelf and capped with its designated aluminum cap. After each pan had been capped, the pans were weighed to the nearest 0.001 g, their caps removed, and restaged in the vapor tank. The entire process of removing the pans from the vapor tank to restaging them took on average 5 min.
Control experiments were also performed in which no polymer sorbent was added to a pan. The weight of solvent adsorbed onto the surface of this control pan at each designated sampling time was subtracted from the weight measured for all other pans at that same sampling time. Typically, less than 0.005 g solvent was adsorbed onto the control pan. The weight of solvent gained by each polymer was then compared to its initial weight (accurate to 0.001 g) and was represented as weight % sorbed: (weight solvent/weight polymer) x 100.
10
1-18

This screening protocol, in addition to determining CVOC sorption capacity, also provided sorption kinetic data, albeit limited by the frequency of sampling. In Appendix I are listed the results of the TCE, methylene chloride and water vapor uptake studies. The uptake of water vapor at relative humidities varying between 20 and 90% were also measured. These results will be presented in Chapter 5.
2.3 Results
Given in Table 2.1 are TCE, methylene chloride and water vapor capacities at equilibrium for a representative group of commercial polymers, synthetic sorbents and activated carbons. Many commercial polymers were found to sorb higher quantities of TCE and methylene chloride than did the commercial activated carbons. The mechanism by which these sorbents sorb CVOC vapors (partitioning) is different from that describing adsorbents (surface adsorption) such as carbon. Of equal importance, many of these commercial sorbents retained their physical integrity even after sorbing as much as 3 times their weight of TCE. Approximately one-third of the commercial polymers either fused, dissolved or swelled after reaching TCE sorption capacity. These materials would not be of use as a CVOC vapor sorbent in that pressure problems would develop in a column application. When the TCE was desorbed from these materials, the polymer often did not retain its initial physical form.
Among the Lomod resins, the TCE sorption capacity was highest for the resins with the highest softblock content (lowest modulus and lowest Tm)-Polyethylene terephthalate), PET, sorbed very little TCE (only 2% after 2h and 8% after 48h), indicating that the sorptive phase in Lomod resin is not the PBT hardblock, but the polyether softblock.
The carbon-filled NBR, SBR and EPDM materials also sorbed high amounts of CVOC. For comparison, an unfilled NBR material (Uniroyal Paracril C) was examined. Although this material sorbed a good amount of TCE (317% after 48h), it dissolved immediately (within 2h), indicating the necessity of carbon filling and/or increased crosslinking to provide structural support.
Figures 2.2 and 2.3 show the uptake as a function of time of TCE and methylene chloride from a saturated vapor for a few select sorbents. Sorption rates for all of the commercial polymers screened are given in Appendix I. While the activated carbons sorbed only moderate amounts of CVOCs (typically less than 80% by weight), they did, however, demonstrate reasonably fast initial rates of CVOC sorption. The commercial polymers indicated, in general, a much faster rate of CVOC vapor sorption than did the activated carbons. As one might predict, the rate of TCE uptake was fastest for the Lomod resins with the highest softblock content.
11
1-19

Table 2.1. TCE, CH2CI2 and Water Vapor Sorption Capacities of Select Sorbents Measured under Saturated Vapor Conditions at 30°C
sorbent class TCE uptake wt% @ 120h
methylene chloride uptake
wt% @ 144h
water vapor uptake
wt% @ 22h Lomod JB610/ JE630
polyether/polyester block copolymer
143 191 2.0
Baker rubber tire TR40
carbon-filled styrene-butadiene rubber
123 119 2.6
carbon-filled NBR acrylonitrile-butadiene rubber
111 168 1.4
Estane 58300 thermoplastic polyurethane
162 - -
Pebax 2533A polyether-polyamide block copolymer
314 - ~
HRG370 rubber-grafted styrene-acrylonitrile copolymer
270 186 0.6
Amberlite XAD-4 porous styrene-DVB polymer
50 - 0.0
Ambersorb 563 carbonaceous resin 57 46 8.2
Ambersorb 572 carbonaceous resin 104 78 44.1
DowXUS43493.01 macroporous styrenic polymer
165 - 52
Geolast 701-70 polypropylene-NBR blend
213 234 —
Santoprene 201.73 polypropylene-EPDM blend
181 88 -
NoritRB activated carbon 62 - -
NoritSG activated carbon 54 48 21.5
Calgon 12v40 medium
activated carbon 76 60 38.2
Sorbonorit B-2 activated carbon 81 ~ 41
12
1-20

LomodJBttO LomodJE630 Activated carbon, Calgon _|_ HRG370 Carbon filled NBR Baker rubber tire TR40
6 time,h
- 1 -10 12
Figure 2.2. Rate of Sorption of TCE Vapor by Polymeric Sorbents and Activated Carbon
under Saturated Vapor Conditions
160
S 120
4
!
Figure 2 3 . Rate of Sorption of Methylene Chloride Vapor by Polymeric Sorbents and Activated Carbon
under Saturated Vapor Conditions
13
1-21

Many of the commercial polymers screened for TCE and methylene chloride sorption capacities and sorption rates were in a finely ground, particulate form to provide a high surface area to volume ratio. It was expected that the rate of diffusion of VOCs into a polymer matrix would be dependent to some degree upon this ratio. In general, the particle size range for many of these materials fell between 0.10mm and 1.00 mm.
To measure the effect of sorbent particle size upon TCE sorption rate, a commercial rubber tire (finely ground by the supplier and available at $0.15 / lb.) and a thermoplastic elastomer, Lomod JB610, were size-fractionated. The particle size distribution for these and other polymers in this same class of sorbents is shown in Table 2.2. The TCE vapor sorption rate was then measured gravimetrically over a period of 120h under a saturated TCE environment (approximately 100,000 ppmv).
The TCE sorption rate profile for rubber tire is shown in Figure 2.4. As can be seen from the graph, there are essentially no differences in the rate of TCE sorption between the different size fractions. After 6h, approximately l.Og TCE is sorbed into the l.Og rubber tire; over a period of 90h, an additional 0.25g TCE is sorbed. The independence of rubber particle size with TCE sorption rate is presumably due to the extremely fast diffusional rate of TCE through such a rubber matrix. This same independence of particle size on TCE sorption rate was also observed for the Lomod JB610 resin (each fraction sorbed 80% TCE by weight after 22h).
Table 2.2. Particle Size Distributions of Select Lomod® JB610 Thermoplastic Elastomers (GE Plastics) and Carbon-Filled Rubbers
% weight J Taction sorbent 0.11-0.25mm 0.25-0.50mm 0.50-1.0mm >1.00mm
Lomod JB610 0.62 0.22 0.08 0.02 Lomod JE630 0.18 0.24 0.45 0.14 Lomod XJ1013 0.19 0.25 0.38 0.18
rubber tire 0.04 0.19 0.77 0.00 carbon-filled
NBR 0.32 0.31 0.23 0.11
As can be seen in Table 2.1, these commercial polymers sorb very little water relative to the activated carbons and synthetic adsorbents (e.g., Ambersorb 572). This is due to their relatively more hydrophobic nature and lack of surface sites. As shown in Table 2.3, equilibration of the activated carbons, Lomod polyefher-polyester block copolymers, and rubber tire with water vapor at 30°C prior to TCE or methylene chloride sorption does affect their CVOC sorption capacity and rate of sorption. Sorption of CVOCs into the commercial polymers is by solubility and hence is a noncompetitive process with respect to water. This, coupled with the very low concentration of water sorbed (2.0-2.6 weight %), makes it difficult to explain the low CVOC sorption capacities of the commercial polymers in the presence of water. It is possible that the sorbed water strongly hydrogen bonds with the polyether and polyester functionality of the Lomod resins. The strong hydrogen bonding may then influence the diffusion rate of the CVOC into the polymer matrix. A simple layer of water coating the surface of the sorbent may also be a factor. The effect of relative humidity is studied in more detail in Chapter 5.
14
1-22

o * o
500-1000 urn 250-500 um 150-250 um 90-150 um
- 1 —
25 - 1 « r-50 75
t ime / h 100 125
Figure 2.4: Sorption of TCE b y Rubber Tire Under Saturated TCE Vapor Conditions:
Effect of Rubber Particle Size
Desorption of TCE and methylene chloride from saturated sorbents was also measured at ambient temperature and pressure. Weight loss of CVOC was measure gravimetrically at 2 minute intervals over a period of several hours. The Lomod thermoplastic elastomers demonstrated the fastest desorption rate under these conditions; the carbon-filled rubber also demonstrated fast desorption (Figures 2.5 and 2.6). These materials, as with most of the other organic polymers, completely desorbed their equilibrium capacity of TCE and methylene chloride in less than lh; for comparison, the activated carbon lost only 50% of its equilibrium capacity in lh. Other more practical modes for desorption will be discussed in later chapters. These studies served to demonstrate the reversible and fast sorption of CVOCs from a wide variety of commercial, inexpensive polymers.
15
1-23

Table 2.3. Effect of Water on TCE and Methylene Chloride Sorption Capacities Measured after 6 h Contact with a Saturated CVOC Vapor at 30°C
after Equilibration with Water Vapor at 30°C
sorbent class wt% water sorbed after
equilibration
wt% TCE sorbed after 6h
wt% MC sorbed after 6h
Lomod JB610 polyether-polyester block copolymer
2.0 65 34
// « no water vapor pre-treatment
118 114
rubber tire styrene-butadiene rubber
2.6 30 14
« // no water vapor pre-treatment
103 71
Ambersorb 563
carbonaceous resin 8.2 40 27
// « no water vapor pre-treatment
49 32
HRG370 rubber-grafted
styrene-acrylonitrile copolymer
0.6 105 116
// // no water vapor pre-treatment
132 109
NoritSG activated carbon 21.5 47 39
// // no water vapor pre-treatment
52 74
Calgon GAC activated carbon 38.2 56 43 « « no water
vapor pre-treatment
74 60
16
1-24

200 time,min
Figure 2.5: Rate of Desorption of TCE from TCE-Loaded Sorbents at
Ambient Temperature and Pressure
cv 'fifep
1*1 Us
100- ipngpniHiiBDHDin • • i n n D •
80"
DJ 60-
a Lomod JE630 powder • Lomod 139 foam
40- • carbon-filled NBR powder • Baker ground rubber tire tread
20 1 1
• activated carbon, Calgon
n-
]
1 1 r • 1 ' 1 • 1 1
100 200 time, min
300 400
Figure 2.6: Rate of Desorption of Methylene Chloride from MC-Loaded Sorbents at Ambient Temperature and Pressure
17
1-25

2.4 Discussion and Conclusions
In a series of C VOC vapor sorption studies, a large number of commercial organic polymers, synthetic sorbents and activated carbons were exposed to dry air saturated with vapors of TCE and methylene chloride. Lomod and Hytrel thermoplastic elastomers (available from GE Plastics and DuPont, respectively) and carbon-filled synthetic rubbers including NBR, SBR, EPDM and rubber tire regrind demonstrated superior sorption capacities and fast sorption/desorption rates. Equally important, these materials retained their physical integrity with no apparent dissolution after sorbing as much as 200-300 weight % TCE. The other classes of sorbents that performed superiorly to activated carbons under these saturated vapor phase conditions were the macroporous styrenic and carbonaceous resins marketed by Dow (XUS resin) and Rohm & Haas (Amberlite® and Ambersorb®). A summary of the top-performing polymers and rubbers with respect to the criteria set at the outset of this work is given in Table 2.4. Several of these sorbents were selected for further evaluation. These results are given in the following chapters.
The rate of TCE sorption into Lomod resin and its sorption capacity were determined to be highly dependent upon its softblock content. The rate of TCE sorption was fastest in Lomod resins with the highest percentage softblock content, lowest flex modulus and lowest melting temperature. While it is the polyether softblocks in Lomod and Hytrel resins mat are the sorptive phases for CVOCs, the polyester (PBT) hardblock units are required to give the C VOC-loaded polymer its dimensional stability. In the same way, the elastomeric rubber in the carbon-filled rubber materials is believed to act as the sorptive phase with the carbon black filler and rubber crosslinking providing structural integrity to the VOC-loaded rubber. The crosslinking in the Rohm & Haas and Dow adsorbents serve this same purpose.
Most of these above-mentioned sorbents sorb only very low levels of water vapor. In this way, sorption of CVOC vapor is noncompetitive with sorption of water. The rate of diffusion of TCE and methylene chloride is extremely fast, allowing for fast sorption/desorption cycles at ambient temperature and pressure. There was no measured effect of sorbent particle size on CVOC sorption rate under these saturated CVOC conditions.
18
1-26

Table 2.4. Top-Performing Commercial Polymers and Rubbers Selected for Further Examination
Criteria: (1) high CVOC sorption capacity under saturated CVOC vapor conditions; (2) fast CVOC sorption/desorption rates; (3) retention of structural and dimensional
integrity at sorption capacity; and (4) cost/availability
sorbent class supplier approx. cost/lb. (bulk)
DowXUS macroporous styrenic polymer
Dow Chemical Co. $25.00
Ambersorb carbonaceous resin
. Rohm & Haas $ 35.00-50.00
Amberlite porous styrene-DVB copolymer
Rohm & Haas $490.00/ff3
Lomod thermoplastic
elastomer
polyefher-polyester block
copolymer
GE Plastics $1.50
Hytrel thermoplastic
elastomer
polyether-polyester block
copolymer
DuPont $1.50
HRG 370 rubber-grafted SAN
GE Plastics $ 0.75-1.00
Estane thermoplastic polyurethane
BF Goodrich $ 3.17-3.23
carbon-filled rubber
SBR,NBR,EPDM Midwest Elastomers,
Rouse Rubber, Teknor Apex,
Uniroyal
$ 0.26-0.35
rubber tire regrind carbon-filled SBR Baker Rubber Inc. $ 0.13-0.24
Santoprene, Geolast, Vyram,
Vistaflex
PP-rubber blends Advanced Elastomer Systems
$ 1.68-2.64
Pebax polyether-polyamide
block copolymer
Atochem Inc. $ 3.53-3.68
19
1-27

Chapter 3: SORPTION ISOTHERMS
3.1 Purpose and Background
Capacity of a sorbent for a given contaminant, in the concentration range of interest, is one of the most important properties of a sorbent. Isotherms express the concentration of contaminant in the sorbent as a function of the concentration of contaminant in the fluid stream, at a constant temperature. This information is useful in determining the quantity of a sorbent that will be needed to treat a given stream volume, given the concentration of that stream. The higher the capacity, the less sorbent needed.
32 Experimental
Since this work was focused on sorbents to remove CVOCs from air streams from either ground water air strippers or SVE wells, isotherms were measured in the concentration range of 0.1 - 300 ppmv for TCE and 0.2 -12000 ppmv for CH2CI2. To measure a given point, a known weight of sorbent was added to a 22 ml vial. A known volume of neat CVOC was then added via syringe to a smaller vial (GC vial), that vial was dropped into the larger vial, and the larger vial quickly crimp capped with a teflon-lined septa. Sorbent weights varied from 0.01 - 5 g, CVOC volumes from 0.5 - 9 ul. After the contents had equilibrated, the headspace of the vial was sampled by a Tekmar 7000 Equilibrium Headspace Autosampler. The complete details of the headspace analysis are given in Appendix n. Equilibration was generally at least 24 hours at room temperature, followed by 30 minutes at 30°C in the headspace analyzer. Preliminary experiments had shown that this equilibration time was more than sufficient and that no significant leakage of CVOC from the vial occurred during this time. Loading on the sorbent was calculated by difference, although in all of the experiments the amount of TCE left in the vapor phase was insignificant compared to that on the sorbent. Most of the work focused on TCE, with a lesser focus on CH2CI2.
The sorbents to be studied were chosen either because of their high capacities from saturated vapors as measured in the weight uptake experiments (Chapter 2) or based on manufacturer recommendations. The latter included: Rohm and Haas Ambersorb 563, Calgon BPL 4x6, American Norit Sorbonorit B2, and Dow XUS 43493.01 and XUS 43502.01. Table 3.1 lists all of the sorbents studied, along with their CVOC weight uptakes from Chapter 2.
3.3 Results
The isotherms reported here are presented as g CVOC/g sorbent versus the partial pressure of CVOC in the vapor phase, expressed,in units of atmospheres, on a ppm basis. The equilibrium partial pressure of the CVOC in the vapor phase is the thermodynamically relevant parameter. At atmospheric pressure, it is numerically equal to concentration on a volume (ppmv) or molar (ppmm) basis.
20
1-28

TABLE 3.1: Sorbents Selected for Isotherm Studies
Sorbent Class Source TCE Uptake (wt%) (from
saturated vapor)
CH2C12
Uptake (wt%) (fro m 1
saturated vapor)
Sorbonorit-B-2 activated carbon Norit 81 -49 BPL4x6 activated carbon Calgon -76 -61 DowXUS43493.01 (small - 350-850 urn)
macroporous styrenic polymer
Dow 165 -
DowXUS43502.01 (large - 1.5mm)
macroporous styrenic polymer
Dow - -
Ambersorb 563 carbonaceous Rohm and Haas
57 45
AmberliteXAD-4 porous polymeric styrene-DVB
Rohm and Haas
50 Isotherm not measured
Tenax poly(p-2,6-diphenyl-phenylene oxide)
- Isotherm not measured
HRG370 styrene-butadiene-acrylonitrile polymer
270 163
Pebax 2533A polyether-polyamide block copolymer
314 -
Estane 58300 polyurethane blend 162 -
Baker Rubber Tire TR40
styrene-butadiene rubber
Baker 174 320
Lomod JB610 polyether/polyester block copolymer
GE 143 178
The technique used here for measuring isotherms worked very well. In Figure 3.1 the measured isotherms are compared with manufacturer data for Calgon BPL 4x6 for both TCE and CH2CI2 (Calgon). In Figure 3.2, a comparison is made with data reported by Dow (Jones) for TCE. The data compare well, although the isotherms measured here are slightly below the literature values. This is typical when comparing isotherms among different researchers (Kong and DiGiano). Comparison of data for Sorbonorit B2 with manufacturer data (American Norit) showed the same result - sorption capacity at a given vapor phase concentration was slightly less than what the manufacturer reports.
21
1-29

Comparison to Manufacturer Isotherms for BPL 4x6
Calgon Data
1 • 25°C /I
to X
^^J50eC ^ 25°C
5l 0 . 1 - r^TCE sg^s'00
o O 0.01 • o
0.001 •
- < < .GE Data and Fit
30 "C NSA
>
^
• ^ H 2 C I 2
H 1 1 0.01 100 10000 1000000
P CVOC (atm, ppm)
FIGURE 3.1: Comparison to Calgon Reported Data for BPL 4x6.
V) 3 X e> ul o
1 -r
0.1 -•
0.01 . .
0.001 0.1
Comparison to Manufacturer Isotherms for Dow XUS
4- •+• •+• -4 1 10 100 1000
P TCE (atm, ppm)
FIGURE 32: Comparison to Dow Reported Data for Dow XUS.
22
1-30

Considering all of the isotherms measured, the sorbents can be placed into four groups according to their TCE sorption ability, with the sorbents in each group having similar isotherms:
Sorbonorit XAD4 HRG370 Lomod BPL4x6 > DowXUS > Tenax » Pebax > Rubber Tire Ambersorb 563 Estane
For CH2CI2, the sorbents can be placed into four similar groups:
Sorbonorit HRG370 Lomod BPL4x6 > DowXUS » Pebax > Rubber Tire Ambersorb 563 Estane
Figure 3.3 summarizes some of the isotherm data for TCE. Representatives from each of the classes are shown. Figure 3.4 shows similar data for CH2CI2. For both CVOCs, activated carbon and the commercial synthetic sorbents have one to two orders of magnitude greater capacity in the low concentration range than the commercial polymers and rubbers, such as HRG370 and TR40 rubber tire. However, at high concentrations, approaching a saturated vapor, these isotherms cross so that the commercial polymers and rubbers have the greatest capacity. Such behavior has been suggested or observed by others in aqueous systems (Browne and Cohen; Weber and van Vliet; Simpson et al.), and is also reported here, in Chapter 8. The differences in sorption capacity between the "good" sorbents and the "poor" sorbents at low concentration is somewhat less for CH2CI2 than for TCE.
Figures 3.5 and 3.6 compare the data for the two CVOCs. In all cases, TCE is sorbed to a greater extent than CH2CI2, although the effect is not as large for the commercial polymers and rubbers. Kong and DiGiano also saw a greater difference in sorbability among CVOCs on activated carbon than on synthetic sorbents.
Under these conditions, there was no difference in the isotherms for the two Dow materials (large and small).
The Freundlich equation is an empirical relationship frequently used to fit nonlinear isotherm data:
q = K P ^
where q = sorption capacity (gcvoc/gsorbent) and P = partial pressure of CVOC (aim, ppm). K has been associated with the adsorbability of the contaminant and 1/n (sensitivity to concentration) to the ease or difficulty of removing the compound from solution (Stenzel). A log-log isotherm plot gives a slope of 1/n and an intercept of log K.
The isotherms measured here were fitted to the Freundlich equation. The results are given in Table 3.2 for TCE and Table 3.3 for CH2CI2. The relatively less steep curves (higher n) for carbon and the carbonaceous sorbent compared to the polymeric sorbent is typical (Weber and van Vliet).
23
1-31

10 T
1 • •
w 0.01 -• o » 0 .001 -•
0.0001
TCE Sorption: 30°C, Low Humidity
I I 0.1 +A563 -..4*\
$ • " " ^ A . ^ » * " # »
XUS-.-'"* • ' . ' ' •' saturated vapor XAD4 ,-a - ° -'
°-Tf
"*&*" TR40
•+-I
^ 0.01 100 10000 1000000
P TCE (atm, ppm)
FIGURE 3.3: Isotherms for TCE at Ambient Conditions
c © JO w o (0
u S
1 0
1
0.1
0.01
0.001 4- *
0.0001
Methylene Chloride Sorption: 30°C, Low Humidity
4 saturated vapor A563 tfw??S~ A>\
•fepL rXUS 0 - ^ 1 0.1 1 0 1000 100000 1000000C
P MC (atm, ppm)
FIGURE 3.4: Isotherms for CH2CI2 at Ambient Conditions
24
1-32

1 -
I «• 8 a 0.01 -
8 „ 0.001 .
MC and TCE Sorption: 30°C, Low Humidity
*« . *-' * .<^s?>-» B P L .***&* .<rP
- • " C D " JO xus . . - ' .'-.-•
p - ' V tx' closed-TCE • . ' open«MC
U.UUU1 1 0.G 1 0.1 1 10 100 1000 10000
P CVOC (atm, ppm)
FIGURE 3.5: Sorption of TCE and CH2CI2 by Activated Carbon and Synthetic Sorbents
MC and TCE Sorption: 30°C, Low Humidity
U . l -
C l 0 S e d = T C E Lomod*. I 0.01 - • open=MC .' *. A . * .'0 L *
8 _ hFG ;' %4a OJ 0.001 . . ' " . ^ . A O-"
voc/
WGjr#*'°' A
a .«o TR40 0 "T^ffWO OS 0.0001 •
0.00001 -
Lomod
1 1 1 1 1 0 100 1000 10000
P CVOC (atm, ppm) 100000
FIGURE 3.6: Sorption of TCE and CH2CI2 by Commercial Polymers and Rubbers
25
1-33

TABLE 3.2: Freundlich Parameters for TCE at 30°C and Ambient (low) Humidity
Sorbent K n Ambersorb 563
0.02<p<163; 2.92xl0"2<q<0.19 DowXUS
03<p<243; 2.9xl0"3<q<0.18 BPL4x6
0.1<p<289; 3xl0"2<q<0.31
6.7 x 10⁻²
5.9 x 10⁻³
5.7 x 10⁻²
4.4
1.6
3.6
Lomod JB610 58<p<293; Ixl0-4<q<7xl0"4
9.4 x 10⁻⁷ 0.84
TABLE 3.3: Freundlich Parameters for CH2CI2 at 30°C and Ambient (low) Humidity
Sorbent K n Ambersorb 563
0.24<P<350; 1.3xl0-3<q<8.8xl<)-2 3.04 x 10⁻³ 1.69 350<P<12028; 8.8xl0"2<q<0.19 2.66 x 10⁻² 4.72
DowXUS 1.4<P<11700; 4.4xl0-4<q<0.23 2.91 x 10⁻⁴ 1.36
BPL4x6 0.75<P<7034; 13xl0"3<q<0.31 1.85 x 10⁻³ 1.77
3.4 Discussion and Conclusions
Since the sorption capacity of the commercial polymers and rubbers is orders of magnitude less than that of activated carbon or the synthetic sorbents in the concentration range encountered in remediation applications (1-1000 ppmv for TCE), these polymers will generally not be useful in these applications. Any savings in sorbent purchase cost ($0.15/lb for ground rubber tire versus $25/lb for Dow XUS) will be overshadowed by the cost of the extra vessels and blowers. Therefore the only sorbents considered for design purposes were Rohm and Haas Ambersorb 563, Dow XUS and Calgon BPL 4x6. At the lower end of the concentration range, Ambersorb 563 has a considerable capacity advantage over XUS. At the higher concentrations, the capacity difference is small. To gain insight into the nature of their sorption properties, some of the commercial polymers and rubber tire were also included in later studies. These sorbents will be referred to throughout the rest of this report and Table 3.4 summarizes some of their important properties.
Detailed plots showing the data and Freundlich fits for selected sorbents under various conditions are given in Appendix HI. Those figures illustrate the significance of the value of n in the Freundlich fit. As n —> 1, the isotherm becomes linear in a normal plot. That is, loading is proportional to concentration. This is typical of a solubility, or Henry's Law type, sorption mechanism. Large values of n reflect an isotherm that flattens out as concentration increases. This is typical of a non-homogeneous surface-area driven mechanism. In sorption processes, this results in a favorable, self-sharpening breakthrough curve (Brusseau and Rao).
26
1-34

TABLE 3.4: Properties of Sorbents Used in Subsequent Testing
Size (mm)
Bulk Density (g/cc)
Price ($/lb)
Surface Area (mVg)
Ambersorb 563 (Rohm and Haas)
0.3-0.84 0.53 35 550
XUS small (Dow-43493.01)
0.3 - 0.84 0.34 25 1100
XUS large (Dow-43502.01)
1.5 0.40 25 1100
BPL4x6 (Catyon)
3.4-4.8 0.48 2 1100
Lomod JB610 (GE)
4 -0.5 1.50 <10
TR40 rubber tire (Baker)
0.42 -0.5 0.15 <10
The commercial polymers and rubbers all had basically linear isotherms, with n close to (or less than) 1. Deviations from 1 probably reflect data scatter. Thus the CVOC tends to "dissolve" in these sorbents. Activated carbon and Ambersorb 563 have larger values of n. The CVOC adsorbs to surface sites of these sorbents. Dow XUS appears to have components of both types of mechanisms. It has a high capacity from a saturated vapor (high concentration) and has n values closer to 1 compared to carbon and Ambersorb 563.
The crossing of the isotherms for the "good" sorbents and the commercial polymers and rubbers at high concentrations can be explained by the differences in their sorption mechanisms. The commercial polymers and rubbers have low surface area, but have the ability to absorb contaminants. Activated carbon and the commercial synthetic sorbents have high surface areas good for adsorption, but little absorption capability. At low concentrations, the surface area mechanism predominates and the high surface area sorbents excel. However, as the concentration increases and the surface becomes covered, the solubility mechanism of the commercial polymers and rubbers continues to allow sorption, and the capacity of these sorbents surpasses that of the adsorbents.
Dow XUS is unique in that it has a capacity close to, but slightly less than, activated carbon and Ambersorb 563 at low concentrations, but a much higher capacity at saturated vapor concentrations. Even within the concentration range of interest here for remediation applications the difference in capacity between Dow XUS and the other two diminishes as concentration increases, such that there is little difference at 400 ppmv TCE. Again this indicates that Dow XUS has both an adsorption and an absorption component.
27
1-35

The greater difference in sorption capacity of activated carbon and the synthetic sorbents for TCE versus CH2CI2 (Figure 3.5) compared to the commercial polymers and rubbers (Figure 3.6) may be due to the 7C-bonding ability of TCE, which enhances surface interactions. Such an effect would not be as important for absorption. This supports the classification of activated carbon and the synthetic sorbents as adsorbents, and the commercial polymers and rubbers as absorbents.
As stated above, the commercial polymers and rubbers have such low capacity for these CVOCs in the low concentration range that they were not considered for process design purposes. However their very high capacity at high concentrations may find application in treating industrial emissions or the initial surges of an SVE well.
28
1-36

CHAPTERS SORPTION RATE
4.1 Purpose and Background
In general gas phase sorption is a rapid process. This results in sharp breakthrough curves and short column mass transfer zones (MTZ). However, as Empty Bed Contact Times (EBCT) approach the time constant for the overall sorption process (reciprocal of the mass transfer rate constant), a broadening of the breakthrough curve and the MTZ may occur (Schwarzenbach and Westall), resulting in premature breakthrough. The faster the sorption rate, the shorter the allowable EBCT. For a given flow rate, this translates into shorter beds and hence lower sorbent inventory and sorber vessel costs. Thus, it is important to have some understanding of relative sorption rates.
4.2 Experimental
These experiments were run in the same way as those to measure sorption isotherms, except that the headspace was sampled as a function of time. Each sample was sacrificial, so that a new vial was used for every time point.
4.3 Results
Several different experiments were attempted in this part of the work. It was concluded that the best way to compare sorbents was under conditions of identical final loading. The only successful comparison was between Sorbonorit B2 activated carbon and Dow XUS small. In this case, the vials were loaded with 0.05 g sorbent and 5 ul TCE, resulting in a final loading of 0.14 g TCE/g sorbent. The first vial was sampled at 30 minutes and subsequent vials at progressively longer times. Figure 4.1 shows the headspace concentrations for the Sorbonorit system as a function of time. The range for the expected equilibrium value is shown by the horizontal dashed lines. Figure 4.2 shows the same data for Dow XUS. The Sorbonorit data were fit to a first order rate expression, and that fit is also shown in Figure 4.1.
These results show that Dow XUS reached equilibrium faster than the activated carbon, suggesting that it has a faster sorption rate. In general, polymeric sorbents are expected to have faster sorption kinetics than activated carbon (Noll et al.).
A comparison between Dow XUS small and Lomod JB610 pellets at very low loadings (required so that the headspace concentration in the Lomod system did not exceed the calibration range of the GC) gave some unusual results. At a target loading of 9.6xl(H g/g, both sorbents took greater than 10 hours to reach equilibrium! After 12 hours, the headspace in the XUS vial was 38 ppmv, compared to an equilibrium value of <lppmv. The Lomod system was >400ppmv (off scale) compared to an equilibrium value of about 350 ppmv. These results are not explainable at this time.
29
1-37

Sorbonorit: Sorption Rate q = 0.14g/g
160 -I •
140 - •
o o
CM O
(uidd ; ^
1 80 -CO
UJ 60 -H 40 • °" 20 -
0 -
^ * V -+•
1 80 -CO
UJ 60 -H 40 • °" 20 -
0 -
%.r..^v»~—•—^r ._.,, A
1 80 -CO
UJ 60 -H 40 • °" 20 -
0 -
j _ * ^
1 80 -CO
UJ 60 -H 40 • °" 20 -
0 - • i
c ) 1 2 3
Time (hours)
4 5
Figure 4.1: Sorption Rate for Sorbonorit 82
XUS 43493.01: Sorption Rate q = 0.14g/g
285 j
E* 265 --a a. - 245 -•
E «. 225 --UJ
O 205 --a 185 -•
165 -I 1 1 1 1 1 0 1 2 3 4 5
Time (hours)
Figure 4.2: Sorption Rate for Dow XUS small particles
30 1-38

4.4 Discussion and Conclusions
In general, mass transfer rates are fast for gas adsorption and consequently mass transfer zones are short. Crittenden et al. report MTZ lengths of 5 cm for gas phase adsorption versus 180 cm for aqueous phase adsorption. Therefore, for gas phase processes the shape of the breakthrough curve may be more affected by fluid dispersion man mass transfer rates. However, as discussed above, as short EBCTs are approached, the effect of a faster sorption rate may become significant. The limited work here suggests Dow XUS has a faster sorption rate than activated carbon. Thus, it may allow use of shorter EBCTs, permitting either higher flow rates or smaller beds and shorter cycle times.
31
1-39

Chapter 5: EFFECT OF RELATIVE HUMIDITY ON SORBENT PROPERTIES
5.1 Purpose and Background
Air streams from either soil vapor extraction wells or air strippers are likely to have very high relative humidity. Thus, quantifying the effect of relative humidity on sorbent properties is critical. Two properties were examined here: the water sorption isotherms and the effect of relative humidity on CVOC sorption isotherm. The greater the capacity of a sorbent for water, the more water will be co-desorbed with the CVOC. This will generate an aqueous effluent which will have to be treated. If the capacity of a sorbent for the CVOC is diminished in the presence of water, then more sorbent will be required to handle a given volume of contaminated air.
5.2 Experimental
The water sorption isotherm was measured by placing known amounts of sorbent in a controlled humidity chamber. The sorbent was allowed to equilibrate for 24 hours, at which time the sorbent was reweighed to determine water uptake. The humidity in the chamber was then increased and the process repeated. At the higher humidity levels, the equilibration time was increased.
The effect of relative humidity on CVOC sorption isotherm was determined by first equilibrating known weights of sorbent (already in the headspace analyzer vials) in a constant humidity chamber. After a minimum of 24 hours, the CVOC was added to the vial (via a smaller GC vial) and the vial quickly capped. Care was taken to minimize the time a given vial was out of the humidity chamber. The CVOC was allowed to equilibrate with the water-pre-equilibrated sorbent for at least 24 hours and then the headspace was analyzed as in Appendix H
5.3 Results
Figure 5.1 shows the water sorption isotherms measured here. As relative humidity increases above about 30%, activated carbon sorbs significant amounts of water. Dow XUS also sorbs water, but less so than carbon. Both of these trends have been reported by Dow. Ambersorb 563, which was not included in this part of the study, is the most hydrophobic of the Ambersorb line, and so sorbs very little water (Rohm and Haas). In Figure 5.1, it would be slightly above the isotherm for Lomod JE630. The commercial polymers and rubbers sorb trivial amounts of water.
Figure 5.2 compares the TCE and CH2CI2 sorption isotherms for Ambersorb 563 at 85% relative humidity measured here with that reported by Purus at 100% relative humidity. The agreement is very good, although as discussed below, an isotherm at 85% relative humidity should be above one at 100% relative humidity. Nonetheless, this comparison shows that the approach used here to study the effect of relative humidity on CVOC sorption is valid.
32
1-40

60
5 0 - -
5 At\-'-40-
£ 30-%
20"
1 0 - -
-Lomod]E630 -Lomod]E630 — B - LomodJB610 — O— BaVer tire TRW - -X---NBRME40
+ Pebax2533A —A - Geolast 701-70
- Vyram 6101-70 - Vyram 6101-70 —©-- •Santoprene 201-73
-Santoprene 203-40 -Santoprene 203-40 - - A - - •HRG370 - • • - - - Dow XUS43493 - - • - - Norit RB2 - - S - -- Sorbonorit B2
H h
•H
/ / / /
/ /
. H l ' " | - " l f — ^
10 20 30 40 50 60 70 80 90 100
% relative humidity
FIGURE 5.1: Water Sorption by Various Sorbents
CO
8 o s © E <
1 T
0 . 1 ••
^ 0 . 0 1 •• o o 5 o 0.001
Comparison to Manufacturer isotherms for Ambersorb 563
Purus Data: 100%RH
GE Data and Fit: 85% R
H 0.1 1 10 100 1000
P CVOC (atm, ppm)
1 0 0 0 0
FIGURE 5.2: Comparison to Literature Data at High Humidity
33
1-41

The effect of relative humidity on CVOC isotherm varied with class of sorbent. As seen in Figure 5.3, for the activated carbon Sorbonorit B2 no effect was seen at 50% relative humidity compared to ambient (<40% relative humidity). But as humidity increases beyond that, the capacity for TCE decreases. This is typical for activated carbons. Figure 5.4 shows the data for Lomod JB610 and TR40 rubber tire. For these and all of other the commercial polymers and rubbers, no effect on capacity for CVOC was seen up to 85% relative humidity.
Among the sorbents of interest in this study, BPL 4x6 is most affected by relative humidity. Ambersorb 563 is least affected, and Dow XUS is moderately affected. Figures 5.5 and 5.5 summarize these data for TCE and CH2CI2, respectively.
More detailed isotherm plots for many sorbents are given in Appendix HI.
The Freundlich parameters for these isotherms at 85% relative humidity are given in Tables 5.1 and 5.2 for TCE and CH2CI2, respectively.
Sorbonorit: Effect of Relative Humidity
4.0e-1 1
3.5e-1 -• Ambient
0 3.0e-1 • .0 0 2.5e-1 •
CO m/SzW* R H
0 2.06-1 - - *jf A 70% RH
g 1.5e-1 •
*1 1.0e-1 -
5.0e-2J 1 ,^~ +*•*' 85% RH
0 100 200 300 400 500
P TCE in Vapor (atm, ppm)
FIGURE 5.3: Effect of Relative Humidity on Sorption Capacity of Activated Carbon
34
1-42

9.0e-4-| ^ 8 .0e-4-§ 7.0e-4-I 6 .0e-4-« 5 .0e-4-w 4 .0e-4-§ 3 .0e-4-H 2 .0e-4-w 1.06-4-
O.OeO -
JB610: Humidity Effect
A 9.0e-4-| ^ 8 .0e-4-§ 7.0e-4-I 6 .0e-4-« 5 .0e-4-w 4 .0e-4-§ 3 .0e-4-H 2 .0e-4-w 1.06-4-
O.OeO -
•
A
• Ambient
• 50% RH
A 70% RH
• 85% RH
9.0e-4-| ^ 8 .0e-4-§ 7.0e-4-I 6 .0e-4-« 5 .0e-4-w 4 .0e-4-§ 3 .0e-4-H 2 .0e-4-w 1.06-4-
O.OeO -
• Ambient
• 50% RH
A 70% RH
• 85% RH
C 100 200 300 400
P TCE in Vapor (atm, ppm)
Rubber Tire: Humidity Effect
o n o
UJ
u H
9 .0e-4 --8 . 0 e - 4 - -7 . 0 6 - 4 - -6 . 0 6 - 4 - -5 . 0 6 - 4 - -4 . 0 e - 4 - -3 . 0 e - 4 - -2 . 0 e - 4 - -1 . 0 e - 4 - -
O.OeO 4-
*L"
•+• •+• 4-
• ambient
• 50% RH
A 70% RH
• 85% RH
100 200 300 400 500
P TCE In Vapor (atm, ppm)
FIGURE 5.4: Effect of Relative Humidity on Sorption Capacity of Commercial Polymers and Rubbers
35
1-43
*-%wy5 o : ~/jrr

Effect of Relative Humidity on TCE Sorption
0.25 j ^ ^ —
closed=ambient BPL ^^«— -~^~~"^ - 0 . 2 0 -c
• open=85%RH J P - ^ ^ ^ - ^ " ^ - ' ^ ^ * e o 0 . 1 5 -W D)
uj 0 . l a s' » 0.05 J
n nn J
^ ^ ^ ^ * ^ ^ ^ ^ . A 5 6 3 _ ^ • • X T ^ ^ -
0 50 100 150 200
P TCE (atm, ppm)
FIGURE 5.5: Effect of Relative Humidity on TCE Sorption
Effect of Relative Humidity on CH2CI2 Sorption
0.35 -r closed=ambient open=85%RH
0.30 + BPL
-I 5000 10000
P MC (atm, ppm)
15000
FIGURE 5.6: Effect of Relative Humidity on CH 2C1 2 Sorption
36
1-44

TABLE 5.1 Freundlich Parameters for TCE Sorption at 30°C and 85% Relative Humidity
Sorbent K n Ambersorb 563 3.2 x 10⁻² 3.0
0.82<p<283; 2.6xl0"2<q<0.17 DowXUS 1.5 x 10⁻³ 1.5
1.5<p<133; 2/7xl0-3<q<0.04 BPL4x6 5.6 x 10⁻³ 2.3
0.2<p<134; 4.8xl0-3<q<0.05
TABLE 5.2: Freundlich Parameters for CH2CI2 Sorption at 30°C and 85% Relative Humidity
Sorbent K n Ambersorb 563
0.5<P<6367; 132xl0'3<q<0.29 2.05 x 10⁻³ 1.79 DowXUS
4.4<P<10950; 4.4xl0-4<q<0.11 1.86x10⁻⁴ 1.43 BPL4x6
2.6<P<9234; 4.4xl0-4<q<6.6xl0"2 4.59 x 10⁻⁴ 1.87
5.4 Discussion and Conclusions
Their high level of water sorption and the decrease in their CVOC capacity as relative humidity increases are significant drawbacks for using activated carbons to treat high humidity streams. To deal with these limitations in a sorption process the relative humidity of the air stream is generally reduced prior to the sorption column by heating or cooling (to condense water). Ambersorb 563 sorbs very little water and its CVOC capacity is relatively unaffected by % relative humidity. In fact, at 85% relative humidity, its CVOC capacity exceeds that of BPL 4x6. Dow XUS sorbs some water and its CVOC isotherm is somewhat affected by relative humidity. At 85% relative humidity its CVOC capacity is similar to carbon, but it sorbs less water. Low water uptake is advantageous, since less water is present to co-desorb with the CVOC, minimizing the generation of aqueous waste. Based on these properties, Ambersorb 563 would be preferred over Dow XUS, which would be preferred over carbon.
The data shown here for Sorbonorit and that for Dow XUS (in Appendix HI) show that the effect of relative humidity is not significant below 50%. The ambient data were identical to the 50% relative humidity data. By 70% relative humidity, however, the effect becomes significant.
r
Ambersorb 563 is manufactured to have very hydrophobic surfaces and this is reflected in its insensitivity to relative humidity. Dow XUS also has a hydrophobic surface, albeit less so than Ambersorb 563. Activated carbon is even
37
1-45

less hydrophobic, and so sorbs the most water. Since these sorbents sorb CVOCs by adsorption onto a limited number of surface sites, there is a competition between CVOC and water for these sites. Thus, the capacity for CVOC is reduced as water sorption increases with increased relative humidity.
The commercial polymers and rubbers are hydrophobic and so sorb little water. Consequently, their CVOC isotherms are unaffected by relative humidity. Also, since these materials are viewed as sorbing by a solubility mechanism, they would be expected to show little competitive effect between CVOC and water anyway.
For TCE, the slopes of the isotherms for activated carbon and Ambersorb 563 are higher at 85% relative humidity than at low humidity, as indicated by the decrease in the Freundlich parameter n. This may be indicative of more of a solubility mechanism occurring (n approaching 1). Specifically, at high relative humidity, the CVOC may be dissolving in the water in the pore spaces. This decrease may also be due to data scatter. For CH2CI2, such a trend is not evident.
38
1-46

Chapter 6: THERMAL DESORPTION ISOTHERMS
6.1 Purpose and Background
Thermal desorption of a sorbent requires that there be a decrease in sorbent capacity as temperature is increased. The greater this shift, the smaller the amount of desorbing gas required. Thus, measuring isotherms at elevated temperatures . gives insight into relative desorbability of sorbents.
6.2 Experimental
The technique used to measure isotherms at room temperature was adapted for this work. After the headspace vials were filled with sorbent and CVOC and capped, the vials were equilibrated in the platen of the headspace analyzer at the desired temperature. An equilibration time of 16 hours was included in the Tekmar Method (see Appendix H).
6.3 Results
For all of the sorbents studied here, as temperature increases, the capacity for CVOC decreases, as expected. Some detailed isotherms are given in Appendix HI.
In Figure 6.1 the TCE isotherms at 30°C and 90°C are compared for the sorbents of interest for remediation applications. Figure 6.2 shows the data for CH2CI2. For both CVOCs, the effect of temperature is greatest for Dow XUS sorbent. Tables 6.1 and 6.2 summarize the Freundlich parameters for these sorbents for TCE and CH2CI2, respectively.
From data taken at 30°C, 50°C, 70°C, and 90°C, an attempt was made to calculate heats of sorption. These varied with loading on the sorbent. Values ranged from 4-20 kcal/mol, but were not considered reliable enough to report in detail here.
TABLE 6.1: Freundlich Parameters for TCE at 90°C
Sorbent K n Ambersorb 563 9.2 x IO-3 2.0
0.71<p<139; 6.9xl0"3<q<0.096 Dow XUS 1.1 x 10^ 1.1
6.4<p<136; 4.8xl0"4<q<0.01 BPL4x6 9.3 x 10⁻³ 2.2
23<p<166; 13xl0"2<q<0.09
39
1-47

TCE Sorption: Effect of Temperature
1 T
C
o 0)
UJ o » -
0.1 •-
0.01 - •
0.001 +
0.0001
closed=30°C open=90°C *>*£!&
$&^ A 563 ~+-~*
w BPL BPL, 90°C-a2' A563,90°C ..•*&** £>
Dow*- ' a'
Dow, 90°£. 0
p '
+ + 0.01 0.1 1 10
P TCE (atm, ppm)
100 1000
FIGURE 6.1: Effect of Temperature on TCE Isotherms
CH2CI2 Sorption: Effect of Temperature
1 T
dosed=30°C § 0.1 -I- open=90°C
o CO
U S
0.01 •-
0.001
0.0001
srt? A 563
• • ' J*BPL , * JKftJ
t •' <£ Q ca D 0 , ^583.90 B P U 9 0 ° C
—\ 1 h-
,?-*' ft' Dow, 90°C
+ + -\ 0.1 10 100 1000 10000 100000
P MC (atm, ppm)
FIGURE 6.2: Effect of Temperature on CH2CI2 Isotherms
40
148

TABLE 6.2 Freundlich Parameters for C H 2 a 2 at 90°C
Sorbent K n Ambersorb 563
4.1<P<580; ^ x l O ^ ^ ^ x l O - 2
580<P<12200; 2.6xl0"2<q<0.10 DowXUS
small: 112<P<12954;4.4xl0"4<q<3.8xl0-2
large: 98<P<8000; 4.4xl0"4<q<4.4xl0-2
BPL4x6 30<P<973; 13xl0"3<q<6.9xl0-2
1.33 X lO"4
1.31 x 10⁻³
8.09 x 10⁻⁶
4.93 x 10⁻⁶
2.54 x 10"4
1.21 2.12
1.1 0.98
1.57
6.4 Discussion and Conclusions
The importance of a large decrease in capacity as temperature is increased can be illustrated by considering a hypothetical sorption/ desorption system with infinitely sharp breakthrough and elution curves. During the sorption step, the bed becomes loaded with CVOC to the capacity that is in equilibrium with the feed. During desorption the bed is heated to an elevated temperature and a stripping gas is passed through it. The stripping gas is assumed to leave the bed with a CVOC concentration equal to that which is in equilibrium with the loaded bed at the elevated temperature. Tailing is ignored. If all of the CVOC is removed from the bed, a mass balance shows:
Ccvoc, feed x F = Ccvoc, desorb x D
where Ccvoc, feed = the feed concentration to the sorption bed, F = the feed flow rate, Ccvoc, desorb = m e CVOC concentration in the desorbing gas, and D = the desorbing gas flow rate. The equilibrium loading on the bed (qequil) can be calculated given Ccvoc, feed and the Freundlich parameters at ambient conditions (see Chapter 3). Ccvoc, desorb can he calculated using the equilibrium loading on the bed and the Freundlich parameters at the desorption temperature:
C = (q/K)n
The ratio of desorbing gas to feed gas is given as:
D / F = Ccvoc, desorb / Ccvoc, feed
Minimizing this ratio and thereby increasing the concentration factor of the process can result in obvious cost savings.
Examples of such calculations for the three sorbents of interest are summarized in Table 6.3, for a desorption temperature of 90°C. Note that for the higher concentration case, the values of Ccvoc, desorb/ 90°C are extrapolations beyond the range of data measured here. Based on these equilibrium considerations, Dow
41
1-49

XUS is the most readily thermally desorbable sorbent and Ambersorb 563 the least. This difference is even greater as concentration increases. This general trend is expected to hold at slightly higher temperatures.
TABLE 6.3: Relative Desorbability
Ccvoc, feed (ppm)
10
Sorbent qequil (g/g)
Ccvoc, desortv 90°C
Cdesorb/ Cfeed
D / F Ccvoc, feed (ppm)
10 BPL 4x6 0.11 220 22 0.045 10 Ambersorb 563 0.11 151 15 0.066 10 Dow XUS 0.03 391 39 0.026
Ccvoc, feed (ppm)
Sorbent <lequil (g/g)
Ccvoc, desorb/ 90°C
Cdesorb/ Cfeed
D / F
30 BPL 4x6 0.15 431 14 0.070 30 Ambersorb 563 0.14 249 8.3 0.121 30 Dow XUS 0.05 832 28 0.036
Other factors would affect an actual desorption process. For instance, if steam is used carbon may well desorb better than the other sorbents, since its isotherms are most affected by relative humidity. The rate of desorption is also important (Chapter 7), as this will affect the extent of tailing of the desorption front and hence the amount of gas needed in excess of the minimum calculated here.
Nonetheless, based on the change in isotherms with temperature, Dow XUS appears to be the most readily thermally desorbable sorbent, followed by BPL 4x6 carbon, and then Ambersorb 563.
42
1-50

CHAPTER 7: THERMAL DESORPTION RATE
7.1 Purpose and Background
The rate at which a sorbed contaminant can be removed from a sorbent will affect both the desorption cycle time and the amount of desorbing gas required. Being able to rapidly desorb a bed can result in smaller bed sizes, since the sorption cycle time (which dictates bed size) need only be as long as the desorption cycle time. Smaller beds translate into lower initial costs for sorbent purchase and for the sorber units themselves. A decrease in the amount of desorbing gas (due to the reduced tailing associated with a rapid desorption rate) results in a higher final concentration factor for the process. This is generally beneficial for the downstream collection or treatment process, and the reduced flow volume will result in smaller sizes (and lower costs) for downstream vessels. Hence, it is valuable to understand the relative desorption rates of the various sorbents.
7.2 Experimental
The sorbents of interest were loaded with the CVOC (usually TCE) by the method used to measure sorption isotherms (Chapter 3). Briefly, this involved equilibrating a known weight of sorbent with a known volume of TCE in a closed vial. After equilibration the headspace of the vial was sampled. The vial was then uncapped and placed in a vacuum oven (~26" Hg) at about 90°C for a given time period. After that time, the vial was recapped and allowed to equilibrate for 16 hours at 90°C, at which time the headspace was sampled. The vial was then uncapped and returned to the vacuum oven. These steps were repeated as desired. All vials in a given set that were to be compared were placed in the vacuum oven together so that their heat and vacuum history were identical. The headspace of desorbed samples was measured at 90°C, rather than 30°C, so that there would always be enough TCE in the headspace to detect.
Sorbents were compared under two types of conditions:
1) constant initial loading, usually 0.14 g/g.
2) the same initial TCE concentration in the gas phase at 30°C. That is, sorbents were loaded so that the equilibrium TCE concentration in the headspace would be a predetermined amount. For Dow XUS this meant a lower loading than for carbon or Ambersorb 563.
The measured TCE headspace concentrations at 90°C were converted to an equilibrium loading on the sorbent by using the Freundlich equation and the parameters at 90°C given in Chapter 6. This was assumed to be the loading in the sorbent after the given desorption time (this assumes the vials had reached equilibrium during the 16 hour equilibration time). In some cases this loading was then converted to an expected equilibrium concentration at 30°C, using the Freundlich equation and the parameters given in Chapter 3. For Sorbonorit the values of these parameters are: K = 8.4xl0"3, n = 2.0 @ 90°C, and K = 4.2xl0'2, n = 2.6 @30°C.
43
1-51

7.3 Results
Two sets of experiments were run in which the sorbents were initially loaded to 0.14 g TCE/g sorbent. These results are presented in Figures 7.1 and 7.2. In both cases Dow XUS desorbed much quicker than activated carbon (BPL 4x6 or Sorbonorit) or Ambersorb 563. Thus, the working capacity of XUS, defined as the difference between the initial loading and the residual loading after a given desorption time, was greater than that for the other sorbents.
Similar experiments were conducted for sorbents initially loaded with 0.001 and 0.1 g CH2Cl2/g sorbent. These results are shown in Figures 7.3 and 7.4, respectively. Again, Dow XUS desorbed faster than BPL 4x6 or Ambersorb 563. Indeed, at the lower loading it appears that no CH2CI2 desorbed from the latter two sorbents. At this low loading very tightly binding sites may be dominating. Note that, for the higher loading case, the residual loading appears to approach this same absolute level of 0.001 g CH2Cl2/g sorbent (loading/initial = 0.01). Also note that the small Dow material desorbed slightly faster than the large.
Comparing Figure 7.1,7.2 and 7.4, which are all at about the same initial loading of CVOC, it appears that CH2CI2 desorbs faster than TCE. Since the experiments were run at different times, the desorption conditions may not be the same and so this comparison is not conclusive. However, it would be expected that the smaller CH2CI2 molecule would desorb faster than TCE.
05
CO
o
03
CO
o
Desorption: q initial = 0.14 g/g
1 .9 .8 .7 .6 .5 .4 .3 .2 .1 0
I I t
. i' 4 1» " , 1 * %
-i» '«. 1' » Sorbonorit • A * 1
"1 \ w » 1 V »
""* » A '»
1 » w * —
1 50 100 150
Desorption Time (hrs)
FIGURE 7.1: TCE Desorption at Constant Initial Loading
44 1-52

Desorption: qinitials0.14g/g
CO
c CO
o
(0 o
1 0.9 0.8 0.7 0.6 0.5 0.4 0.3 0.2 0.1
0
• BPL*>
. . %0<US smal
*^. SorbonoritB2
t::t'-Z • - * - = * - + - • 0 - . t -JO -H —9 1
20 40 60 80
Desorption Time (hrs)
FIGURE 7.2: TCE Desorption at Constant Initial Loading
Desorption: q initial = 0.001 g MC/g sorbent
Ambersorb 563
4-4 8 12
Desorption Time (hours)
16
FIGURE 7.3: CH2CI2 Desorption at Constant, Low Initial Loading
45
1-53

Desorptlon: q initial = 0.1 g MC/ g sorbent
1 lo
adin
g 0.1
Itiai
0.01
ng/
inl
0.001
IB 0.0001 Mi
0.00001 0 4 8 12 16
Desorption Time (hours)
FIGURE 7.4: CH2CI2 Desorption at Constant, High Initial Loading
To better simulate effects seen under actual process conditions, it is more valid to make a comparison under conditions of equal initial TCE gas phase concentration. In a column operation, the sorbent would be loaded to near equilibrium with the gas feed. Given their relative isotherms, Dow XUS would have a lower sorbent loading than activated carbon or Ambersorb 563. After a given desorption time, two parameters are important: 1) the gas phase concentration that is in equilibrium with the residual loading on the sorbent, at the sorption temperature (30°C), which will determine the bleed level of TCE from the column during the sorption step. The column effluent can never be below this value (unless the incoming feed drops below this level); and 2) the working capacity (initial minus residual loading), which defines the actual usable capacity of the sorbent.
Figures 7.5 and 7.6 show these parameters for a case where the sorbents were initially in equilibrium with about 100 ppmv TCE in the gas phase. Note that this is approximate and that there are also some differences between values calculated from the Freundlich equation and those measured. However none of these issues are important in discerning the overall trend. Note that Dow XUS resulted in the lowest calculated TCE gas phase concentration at 30°C, meaning it would have the lowest column bleed of TCE during a sorption process. Ambersorb 563 and activated carbon would have a higher bleed level. The working capacity of Dow XUS approached the original capacity much more rapidly than that for the other two materials. In fact the capacity of Dow XUS exceeded that of Ambersorb 563 for the shorter desorption times.
BPL4x6
Ambersorb 563
XUS (large)
46
1-54

E a. <V E •S. o o o CO
® UJ O t-
I
Desorption: P initial = 100 atm, ppm
1000
100 L 10 + \ ' *•
1 0.1 • •
0.01 -•
0.001 - •
5 0.0001 + 8 0.00001
Sorbonorit (0.3g/g)
A563 (0.17g/g) % „
© '
XUS sml (0.084g/g)
+ + 10 20 30 40
Desorption Time (hrs)
50
FIGURE 7.5: Desorption at Constant Initial TCE Gas Concentration
Desorption: P initial = 100 atm, ppm
^ 0.30-r
3 0.25
| 0.20 +
« 0.15+ • a •
• o 0.10--,' c •£ 0.05 o ^ 0.00
^ - • • v Sorbonorit (0.3g/g)
A563 (0.17g/g)
,'9.-O'0-4;-9 •>'•&- «
.*
XUS sml (0.084g/g)
+ —\ 50 100
Desorption T ime (hrs)
150
FIGURE 7.6: Desorption at Constant Initial TCE Gas Concentration
47 1-55

Figures 7.7 and 7.8 show similar data for a case with a lower initial TCE concentration in the gas phase - about 25 ppmv. The advantage of Dow XUS over the other sorbents is not as apparent in these experiments. In fact, its expected column bleed level of TCE is equal to, or slightly greater than, that for BPL 4x6 or Ambersorb 563 until very long desorption times. Although the working capacity of Dow XUS is restored to the level of virgin material more rapidly than that for the other sorbents, it is always below that for the other sorbents. The difference between these two sets of experiments may be due to the difference in initial loading levels (25 versus 100 ppmv TCE). It may also reflect differences in the desorption conditions (strength of house vacuum on a given day).
The effect of sorbent size is shown in Figure 7.9 for several different loadings of Dow XUS. The larger Dow material (1.5mm) desorbed only a little more slowly than the smaller material (350-850um), as expected.
In similar experiments, it was found that Lomod JB610 and TR40 rubber tire desorb very rapidly compared to any of the other sorbents. These data could not be analyzed as rigorously since isotherm data at 90°C were not available. It was also found that Lomod powder (~250um average) desorbed more rapidly than Lomod pellets (~4mm). After 3 hours of desorption, powder gave a 90°C headspace concentration of 1.4 ppmv, versus 46 ppmv for pellets for a low initial loading case and 0.4 ppmv and >300 ppmv, respectively at a high initial loading case. The difference in desorption rate was greater here than for Dow XUS because the particle size difference was not as great in that case.
1
Desorption: Pinitial = 20-26 atm, ppm
100 T o o o »
o. . 0.1 4-•o B | 3 0.01 --3
"5 0.001 + o
0.0001
10 - -v .
qinitial: Sor=0.19g/g BPL»0.14g/g A563=0.14g/g XUS=»0.04g/g
- • - . Sorbonorit
* r-'-t: **- .,gPL 4x6
XUS small _ Ambersorb 563 -2*
-t-
20 40
Desorption Time (hrs)
60 80
FIGURE 7.7: Desorption at Constant Initial TCE Gas Concentration
48
1-56

Desorption: Plnltlal = 20-26 atm, ppm
0.2 ^^
g/g 0.18
^ • ^ 0.16 >» ** 0.14 u a a. 0.12 • a
0.1 a» 0.08 r-2 0.06 ! •
o 5
0.04 o 5 0.02
0
. - . - * -. * - "
Sor=0.19g/g__ - • •
» BPL=0.14g/g -_._^
= s*J » . - s S « « • * • ' ""A563=0.14g/g
-O-XUS=0.04g/g
20 40
Desorption Time (hrs) 60 80
FIGURE 7.8: Desorption at Constant Initial TCE Gas Concentration
Desorption of TCE from Dow XUS: Small vs Large
I o 0.1 i
0.001
qinitial = 0.057g/g
open=small particles closed=large particles
qinitial=0.028g/g
•+• •+•
qinitial = 0.14 g/g "n H 1 1
4 6 8 Desorption Time (hrs)
10 12
FIGURE 7.9: Effect of Sorbent Size on Desorption Rate
49
1-57

7.4 Discussion and Conclusions
In general, Dow XUS desorbs more rapidly than activated carbon or Ambersorb 563. This rapid desorption rate has numerous process advantages. The quick restoration of working capacity to original loading capacity allows more reliable design with this material. No gradual loss of sorption capacity due to a heel build up is expected. In addition, as explained above, shorter desorption cycle times and lower desorption gas volumes result in cost savings both in terms of downstream equipment size and sorber vessel size and amount of sorbent inventory.
Most of the comparisons with the other sorbents were done with the small Dow XUS particles. However, since there was no large difference in desorption rate between the two sizes of Dow XUS, the above comments are assumed to hold for Dow XUS large also.
The rapid desorption of the commercial polymer Lomod JB610 and ground rubber tire TR40 reflects the reversibility of their solubility-based sorption mechanism compared to adsorption. Dow XUS may rely on some of each mechanism, accounting for its ease of regenerability compared to activated carbon and Ambersorb 563, which are thought to rely solely on adsorption. Weber and van Vliet also attribute sorption reversibility to the nature of sorption interactions.
50
1-58

CHAPTER 8: AQUEOUS DESORPTION ISOTHERMS
8.1 Purpose and Background
In order to couple a vapor phase sorption process with a fluidized bed bioreactor, it is necessary to transfer the sorbed contaminants into an aqueous phase. This can be accomplished by either desorbing the loaded bed with water or steam regenerating the loaded bed and sending the aqueous condensate to the bioreactor. To determine whether the first approach is feasible, aqueous phase isotherms were measured. For this application a "poor" isotherm is desirable, that is one in which a given sorbent loading is in equilibrium with a high aqueous phase concentration.
8.2 Experimental
Isotherm points were determined by batch equilibrations. A known quantity of sorbent (0.05-lg for good sorbents, 0.5-10g for poor sorbents) was placed in a 122 ml vial. Eighty ml of water containing a known concentration of TCE (25-50 ppmw) were added and the vials closed with septa crimp caps. Samples were mixed for 24 hours on an orbital shaker at ambient conditions or in a 90-95°C water bath. After the equilibration time samples were withdrawn via syringe and added to an equal volume of hexane. After 1 minute of shaking the hexane was withdrawn for direct GC analysis using an ECD detector. Concentration in the sorbent was calculated by mass balance (loss from the aqueous phase). Similar experiments were conducted withCH 2Cl 2 .
For the high concentration isotherms, a saturated TCE solution was used and later experiments were run with zero headspace. In early experiments, data points that were found to be affected by TCE loss to the headspace were deleted.
8.3 Results
Isotherms were run for numerous commercial polymers and rubbers. Kp values, defined as the equilibrium concentration in the sorbent divided by the equilibrium concentration in water, for these sorbents for both TCE and CH2CI2 are given in Appendix IV. Figure 8.1 shows the data for the sorbents focused on here: BPL 4x6 carbon, Dow XUS, and Lomod JB610. Data for Ambersorb 563 are not included because they consistently fell well below those reported by Rohm and Haas. This was attributed to the difficulty of hydrating this very hydrophobic sorbent. In Figure 8.1, the isotherm data from Rohm and Haas would be about an order of magnitude better than that for activated carbon (higher capacity). The BPL 4x6 data compared very well when extrapolating data reported by Crittenden et al. Other commercial polymers and rubbers were very similar to Lomod. As seen in the vapor phase work (Chapter 3), activated carbon and commercial synthetic sorbents are 1-2 orders of magnitude better sorbents than the commercial polymers and rubbers in the low concentration range.
51
1-59

c a>
O w O)
UJ O O)
Low Concentration Aqueous Isotherms: TCE
0.1 --
0.01
0.001 - j ^
0.0001
X CalgonBPL A DowXUS • JB610
.V** TAX
• * X i
+ + 5 10
mg/L in Aqueous
15
FIGURE 8.1: Low Concentration Aqueous Isotherms
Studies were also conducted to determine the effect of temperature on isotherms. In these experiments there was some issue with equilibration time - as long as 4 days may be required for some systems. Overall, however, no significant effect of temperature was seen for BPL 4x6 or Lomod JB610. Dow XUS may have a slightly poorer isotherm (higher aqueous concentration for a given loading) at 93°C, which is desirable for the desorption application being considered here. Crittenden et al. found no effect of temperature when comparing data for BPL 4x6 measured at 22.5°C with an estimated 100°C aqueous isotherm.
To further pursue the analogy between aqueous and vapor phase isotherms, aqueous isotherms were measured at high concentration. The results are shown in Figure 8.2.
At high concentration, the sorption capacities of the commercial polymer (Lomod JB610) and rubber tire (TR40) are only about a factor of 5 less than BPL 4x6 and Dow XUS, as compared with 1 to 2 orders of magnitude at low concentration. This same effect was seen to a greater extent in the vapor phase, where at low concentration the sorption capacity of the commercial polymers and rubbers are much less than for activated carbon and synthetic sorbents, but at high concentrations the sorption capacity of the commercial polymers and rubbers actually exceeds that of activated carbon and synthetic sorbents (Chapter 3).
52
1-60

High Concentration Aqueous Isotherms: TCE
2 -I 1.8-
£ 1.6 -5 1.4-
X CalgonBPL • A DowXUS . « TR40 A " x _ A
• JB610 ,X""
° 1 2 -CD 1 -UJ 0.8 -P 0.6-O) 0.4 •
0.2 • n .
- open=set 2 / ' ; cfosed=set 1 v # p
-•A ! -- • ° ,' . . , - i * A - X ' " x j / . - a
X A«- .nr ' # * + 0.-0--P-0' . X Xi f o-ffo*
0 200 400 600 800 1000
mg/L in Aqueous
FIGURE 8.2: High Concentration Aqueous Isotherms
This approach of sorption capacity as concentration increases is more clearly seen in Figure 8.3, which shows isotherms over the whole range of concentration. The isotherm for Lomod JB610 is steeper than that for Dow XUS and BPL 4x6, resulting in a closer approach of sorption capacity as concentration increases. In the vapor phase this was manifested in higher values of n in the Freundlich equation (reciprocal of the isotherm slope on a log-log plot) for Dow XUS and BPL 4x6 than for Lomod. Simpson et al. saw similar effects, including a crossing of isotherms, when comparing aqueous isotherms for XAD4 and activated carbon.
The vertical rise in some of the isotherm close to TCE saturation (1000 ppmw) seen in both Figures 8.2 and 8.3 may be due to formation of a neat TCE phase. In this case the calculated sorbent concentration (by difference from the aqueous phase) would be too high.
53
1-61
~^777^W:T- •i&x&i

Aqueous Isotherms: TCE
1 U •
bent
•
* & " $
8 0.1 •
UJ 0 . 0 1 • o
TO 0.001 -
DowXUa- m' o-" Calgon BPL 0 - °
*%o ^ . ^ J B e i O
o « ! * *
0.0001 -o-
1 1 1 1 1
0.01 0.1 1 10 100
mg/L in Aqueous
1000
FIGURE 8.3: Aqueous Isotherms - Entire Concentration Range
8.4 Discussion and Conclusions
For aqueous desorption to be viable a very "poor" aqueous isotherm is required. Specifically, the ideal sorbent would have the best isotherm in the vapor phase and the worst isotherm in the aqueous phase. Since BPL 4x6 appears to have about the same aqueous phase isotherm as Dow XUS, but it has a better vapor phase isotherm, BPL 4x6 would be the preferred sorbent for this type of desorption. The relatively poor sorption capacity of BPL 4x6 in the aqueous phase compared to the vapor phase is not surprising given the reduction in its CVOC capacity from the vapor phase as relative humidity increases (Chapter 5).
These data can be used to estimate the water flow rate needed to desorb the sorbent. As in the discussion on thermal desorption (Chapter 6) it is assumed that the loaded bed is in equilibrium with the TCE concentration in the feed gas. For aqueous desorption, it is assumed that the water leaves in equilibrium with this bed loading, which is the best case scenario. Hence this calculation results in the minimum water flow rate. A TCE feed of 30 ppmv at a flow rate of 2000 SCFM is assumed, giving a treatment rate of 1.2 lb TCE/hr. Dow XUS would be loaded to 0.05 g/g. The aqueous concentration in equilibrium with this loading is about 1.9 ppmw (extrapolated from data covering 0.1-1 ppmw). To match the TCE feed rate, a minimum of 1265 GPM water are required. For BPL 4x6, given the comments in
54 1-62

the above paragraph, a somewhat lower water flow rate could be used. For Ambersorb 563 the loading would be 0.15 g/g, and the aqueous concentration would be 0.34 ppmw (Rohm and Haas), resulting in a minimum water flow rate of 7055 GPM.
The concentration for the above example was chosen so as not to exceed the aqueous concentration limits for which data are available. In practice, aqueous desorption would make sense for treating an effluent from an SVE well, which would have a higher concentration. Whether this results in an increase or decrease in water flow rate depends on the relative shape of the vapor phase and aqueous phase isotherms. For Ambersorb 563, a 13x increase in the TCE vapor concentration to 400 ppmv results in only a 3x increase in aqueous concentration. As a result the minimum water flow rate increases by a factor of about 4.3.
These minimum water flow rates were deemed to be excessive, requiring massive bioreactors. In addition, it was found that attempting to biodegrade all of the TCE from the SVE stream under consideration here (400 ppmv, 2000 SCFM = 400 lb/day) resulted in such a high COD (due to the need for the phenol cometabolite) that the bioreactor capital cost would be prohibitive regardless of water flow rate (see Part II). For these reasons, aqueous desorption as a coupling to the bioreactor was not pursued further.
The analogy between vapor phase and aqueous phase sorption can be seen in Table 8.1, in which Henry's law is used to predict the vapor phase distribution coefficient at 100% relative humidity (Kv) from the aqueous phase distribution coefficient (Kp):
K v = Kp/ H, with H=69 atmTcE • gwater/gTCE
For the commercial polymers and rubbers, K v, defined as the slope of the vapor phase isotherms, was essentially independent of relative humidity. K v is only meaningful for linear isotherms, and hence was calculated only for these two types of sorbents. It was also calculated for the Dow XUS isotherm at 85% relative humidity, which was nearly linear. The agreement between predicted and actual K v
values is excellent.
The approach of the isotherms of the commercial polymers and rubber tire to those of activated carbon and Dow XUS as concentration increases suggests that the former sorb by an absorption or solubility mechanism which does not become limited at high concentration. The surface sites on activated carbon become saturated at a given concentration and no further sorption occurs. This same effect was seen in the vapor phase, and, as was the case there, suggests that these commercial polymers and rubber tire may be useful for treating very concentrated streams, either vapor or aqueous.
55 1-63

TABLE 8.1: Prediction of Vapor Phase Distribution Coefficient (Kv) from Aqueous Phase Distribution Coefficient (Kp)
Sorbent K p
[(g TCE/g sorbent)/ (gTCE/g water)]
K v
[(gTCE/gsorbent)/ atm TCE]
predicted measured @85%RH
HRG370 403 5.8 4.7 Pebax 2533A 414 6.0 4.6 Estane 58300 261 3.8 4.5 Baker Rubber Tire 155 2.2 1.9 Lomod JB610 212 3.1 2.8 Dow XUS small 25900 375 307
56 1-64

CHAPTER 9: SORBENT LIFETIME
9.1 Purpose and Background
The physical nature of a sorbent may change upon repeated use, resulting in a decrease in intrinsic capacity, especially if a thermal desorption step is used. Knowledge of how this capacity changes with time is needed to properly size sorption equipment for a given project life and to determine the replacement rate for the sorbent.
9.2 Experimental
Five types of experiments were undertaken to determine whether intrinsic sorbent capacity is affected by heat history and/or by repeated sorption and desorption. To determine whether sorption capacity had changed, the equilibrium headspace concentration of the treated sorbent was compared with virgin material under identical loading conditions. An increase for the treated material represents a shift in the isotherm position toward the right, meaning diminished capacity.
1. Virgin sorbents were preheated in a vacuum oven at 90°C prior to sorption. The equilibrium headspace concentration at a given loading was then compared with virgin material.
2. Sorbents were loaded with TCE and then desorbed in a vacuum oven at 90°C for extended periods. These sorbents were then reloaded with CVOC and the equilibrium headspace concentration at a given loading was compared with virgin material. Then the process was repeated several times.
3. Sorbents were "cycled" in the headspace analyzer. Sorbents were loaded with CVOC and the equilibrium headspace measured. The pierced septa-containing caps were then quickly removed and replaced. The vials were then heated at 70°C for 16 hours after which the headspace was analyzed. After recapping, the sorbents were reequilibrated at room temperature and the headspace measured and compared with virgin material. The steps were then repeated. Assuming no loss of TCE on recapping, their should be no change in headspace concentration measured at a given temperature.
4. Sorbents were heated and cooled in a Perkin Elmer Cetus DNA Thermal Cycler. Sorbents were heated to 95°C, held for 3 minutes, cooled to 30°C, held for three minutes, with each cycle taking about 8 minutes. After 250,500,750 and 1000 cycles, some sorbent was removed and loaded with TCE. The equilibrium headspace concentration at a given loading was compared with virgin material. This was an effective way to simulate many heat cycles in a process in an accelerated manner.
5. The same procedure as in #4 was followed, except the sorbents were first loaded with TCE. This tested the effect on sorbent lifetime of repeated sorption and desorption. After 250,500,750 and 1000 cycles, sorbent was removed and desorbed in a vacuum oven at 90°C. The sorbents were then reloaded with TCE and the
57 1-65

equilibrium headspace concentration at a given loading was compared with virgin material and with heat-treated virgin material. This was an effective way to simulate many desorption cycles in a process in an accelerated manner.
9.3 Results
1. For Dow XUS, preheating generally had little effect on the isotherm position, although in some cases, there may have been a slight effect. For Sorbonorit B2 and BPL 4x6, preheating almost always resulted in a poorer isotherm. Lomod JB610 and XAD4 showed no effect of preheating. However, these and any of the experiments that involved a vacuum oven may be suspect. Frequently an extraneous peak was seen in the GC trace. The significance of this is not known, but contamination in the oven may be responsible for some of the results. The commercial polymers and rubber tire, with their generally low capacity, may not have been affected by any contamination. No strong conclusions can be drawn from these tests.
2. When BPL 4x6 and Sorbonorit activated carbons were loaded and then desorbed in a vacuum oven, there was almost always a worsening of the isotherm. Dow XUS performed much better, with only small changes in sorption behavior. Ambersorb 563 appeared to behave more like activated carbon. The commercial polymer Lomod JB610 and rubber tire (TR40) never showed a change in sorption behavior. Data discussed in Chapter 7 (Thermal Desorption Rate) show that some residual TCE may have been present after desorption in some cases, especially for activated carbon and Ambersorb 563. This may be partially responsible for the poor reloading seen for these materials. Also, as mentioned above, contamination in the oven may be an issue here also.
3. Cycling of Dow XUS and Sorbonorit B2 on the headspace analyzer showed no change in their sorption behavior after two sorption/ desorption cycles. This is inconsistent with the results seen above for activated carbon when it was either preheated or desorbed in a vacuum oven and then its sorption capacity tested.
4. Figures 9.1 and 9.2 show the headspace concentration as a function of number of cycles in the DNA Thermal Cycler for the experiments in which no TCE was present during cycling. Upon removal from the Thermal Analyzer, all sorbents were loaded to 0.14 g TCE/g sorbent. No significant change in sorption capacity for BPL 4x6, Ambersorb 563 and Dow XUS is seen, even after 1000 cycles.
5. Figures 9.3 and 9.4 show the headspace concentration as a function of number of cycles in the DNA Thermal Cycler for the experiments in which the sorbents were loaded with 0.14 g TCE/g sorbent prior to the thermal cycling. Upon removal from the Thermal Analyzer, all sorbents were desorbed and then reloaded to 0.14 g TCE/g sorbent. Unintentionally, the desorption time for the different sets varied: 10 days for the 750 cycle, 4 days for the 1000 cycle, and 6 days for the others, including heat-treated virgin material. Although there is some scatter in the data, no significant change in sorption capacity for either Dow XUS small or large is seen. For BPL 4x6 there is a slight rise in headspace concentration with number of cycles. For Ambersorb 563, there is a definite increase in headspace concentration,
58 1-66

indicating a shifting of the isotherm toward poorer sorption. However this trend also correlates with desorption time - the samples that were desorbed the longest, 750 cycles, are low compared to the others. The difficulty of desorbing Ambersorb 563 and BPL 4x6 was seen in Chapter 7. This suggests that residual TCE remaining in these sorbents may account for some of the rise in equilibrium headspace concentration with number of cycles, and that it is not necessarily due to an intrinsic change in the sorbent itself.
9.4 Discussion and Conclusions
The inconsistencies in the data from the first three types of experiments make it difficult to use them to draw conclusions about sorbent lifetime. The results from the Thermal Cycler experiments (last two) indicate that sorption behavior for Dow XUS is not affected by this type of accelerated thermal cycling. Ambersorb 563 and BPL 4x6 are unaffected by repeated heat cycling but may be slightly affected by repeated sorption/ desorption. Whether this effect is due to incomplete desorption or an intrinsic change in the nature of the sorbent can not be determined from the experiments reported here. More work in this area is needed. However, whatever the reason, it is difficult to restore Ambersorb 563 and BPL 4x6 to their virgin sorption capacity.
250
| 200 Q.
I a m 1 0 ° o H 50 +
Sorption Behavior After Thermal Cycling w/ no TCE Present
E 1 5 0 i _ _ . _ . . .
... Dow small
Dow large
'D D
M .
•+ • -i
250 500 # of cycles
750 1000
FIGURE 9.1: Sorption Behavior of Dow XUS (small and large) After Thermal Cycling with No TCE Present
59 1-67

Sorption Behavior After Thermal Cycling w/ no TCE Present
E Q. Q.
E" 3L iu o
I 35
30
25 20 rV 15 • •
10 •-5 - -0 - -
BPL 4x6
n -.6. D
Ambersorb 563
250 1
500
# of cycles
750
• * - i i - - - • - - * *p .
1000
FIGURE 9.2: Sorption Behavior of BPL 4x6 and Ambersorb 563 After Thermal Cycling with No TCE Present
Sorption Behavior After Thermal Cycling with TCE Present
400 j E* 350 --a 300 •-g 250 -• «. 200 -• UJ 150 I H 100 -• a 50 --
0 - -
Dow large n
:fi::::::..s..:::...f-.-;. Dow small
—I 1 250 500
# of cycles
750 1000
FIGURE 9.3: Sorption Behavior of Dow XUS (small and large) After Thermal Cycling with TCE Present
60 1-68

Sorption Behavior After Thermal Cycling with TCE Present
60 j
f 50 • a. . 40 •
E «. 30 |
Ambersorb 563 D
D a r,.._-.-:— • • - '
0 *> *
•
g 20 \ ' ' " BPL4x6 1-0. 1 0 -
n . 0 250 500 750 1000
# of cycles
FIGURE 9.4: Sorption Behavior of BPL 4x6 and Ambersorb 563 After Thermal Cycling with TCE Present
61 1-69

CHAPTER 10: DYNAMIC PERFORMANCE - COLUMN EXPERIMENTS
10.1 Purpose and Background
Although batch tests give valuable information about the properties of sorbents, the ultimate comparison among sorbents is their dynamic performance in column tests designed to simulate actual use in an air treatment process. Thus, column tests were performed to compare sorbent capacity, shape of the breakthrough curve (BTC), working capacity (difference between final capacity and residual left after regeneration), and CVOC bleed from a regenerated column.
10.2 Experimental
Figure 10.1 shows the experimental set up. The column used was a 1.5" ID x 18" threaded glass chromatography column from Ace, with teflon end caps. Gas flow was downward and a 100 urn glass frit was used in the bottom of the column. Since sorbent bed height was only about 3", the remaining 15" was filled with 5 mm glass beads. Gas flow was controlled by a Miller Nelson Research control system (HCS-401-20), which allows control of temperature, relative humidity and temperature. TCE was metered into the gas stream via a Hamilton Apparatus Syringe Pump (Model 22) through a vaporizer (Miller Nelson Research). Pressure across the column was measured with a differential pressure transducer (Omega), although most of the pressure drop occurred across the frit, so this measurement was not considered further. For the last four runs (3rd loading of sorbents, after desorption) an MKS flow controller was used because of an unexpected failure of the MNR equipment.
Each sorbent was tested three times (virgin and after two regenerations). All column tests were run under identical conditions, listed below:
Mass of Sorbent: 33g (1st loading); 32g (2nd); 28g (3rd) Bed Height: 2.5 - 3" Column Diameter: 37 mm I.D. Air Flow Rate: 10 SLPM TCE How Rate: 0.15 ml/hr = 0.22 g/hr TCE Concentration: ~60 ppmv Relative Humidity: < 30% Temperature: Ambient
Under these conditions, the Empty Bed Contact Time was 0.45 sec. Typical values range from 0.2 - 20 sec (Dvorak). This value was chosen to accentuate any mass transfer effects. The velocity in the column, 30 fpm, is within the 30-100 fpm range typically used in industrial processes Nelson et al.
Four sorbents were studied: Dow XUS small particles, Dow XUS large particles, Ambersorb 563, and BPL 4x6 activated carbon. In Table 10.1 the equilibrium sorbent loading at 60 ppmv, as calculated from the Freundlich parameters in Chapter 3 are given, along with the time for this amount of TCE to
62 1-70

be delivered to the column at the design rate of 0.22 g/hr. Based on the diameter of the particles, two parameters important to good column hydrodynamics are listed. These parameters show that some dispersion and wall effects may be expected from the two largest particles - BPL 4x6 and XUS large. Table 10.1 also lists the expected pressure drops under these conditions.
0.15ml TCE/hr
Syrlng* pump
Air I n -
H20 In ESI
• en • EJ • Bin 10SLPM
<40%RH
Vaporiztr
GC-ECD
- ^
FIGURE 10.1: Column Set Up
TABLE 10.1: Properties of Sorbents for Column Studies
expected loading
@60 ppmv <R/R>
expected time for
saturation (hrs)
dp (mm)
D c /dp (want >35)
L c /dp (want >75)
AP/L® 30fpm
(in H 2 0/f t )
APfor 3" bed
(in H 2 0 )
XUS large
0.076 11.5 1.5 25 50 3 0.75
XUS small
0.76 11.5 0.3-0.84 123-44 254-91 15 3.8
A 563 0.17 25.6 0.3-0.84 123-44 254-91 30 7.5 BPL 4x6 0.18 26.7 3.4-4.8 11-7.7 22-16 1 0.25
To follow the BTC, the effluent from the column was measured as a function of time. The sample loop and 6-way valve in the Tekmar Equilibrium Headspace Analyzer were used. Since the flow rate was too high for these 1/16" lines, the column effluent was split, with only a small portion going to the sample loop, the remaining going out a vent (split controlled by a Whitey needle valve). The column effluent was connected across two ports of the 6-way valve on the Tekmar. The 100 ul sample loop was connected across two other ports, and the GC carrier gas was connected across the remaining ports. In sample mode, the column effluent continually flowed through the sample loop. At desired times, the Tekmar was programmed to switch the position of the 6-way
63 1-71

valve so that the contents of the sample loop were sent to the GC. The analysis conditions are discussed in Appendix H
Since the GC program time was only 10 minutes, numerous samples were taken. To simplify presentation, data are shown as lines rather than discrete points. Detailed calibrations had been generated from standards introduced from headspace vials. However these vials were pressurized (diluted) prior to injection on the GC. Since this pressurization was never changed, its absolute amount did not matter for comparing standards and samples. However, for analyzing effluents from the sorption columns, these calibrations were not relevant. Thus, since no detailed calibration was performed with standards introduced to the GC in the way the sorption column effluents were (direct - no pressurization), and since relative behavior is what is of interest, data are presented here simply as GC area counts. The feed area counts for the column feeds (about 35MM) agreed well with the expected counts based on samples introduced via headspace vials.
To study the effect of desorption on subsequent column behavior, sorbents were first loaded to exhaustion in the column (1st loading), meaning to the end of the BTC when the effluent concentration equals the feed concentration and the sorbent is assumed to be in equilibrium with the feed, so that no further sorption takes place. The sorbents were then removed, desorbed in a vacuum oven, and then returned to the column and the BTC remeasured (2nd loading). This process was repeated for a total of three sorption runs per sorbent. The sorbent conditions preceding the three loadings were:
1st loading: virgin material 2nd loading: after 8 hrs desorption in 90°C vacuum oven 3rd loading: after desorption of 16 hrs @ 80°C, 24 hrs @
110°C in vacuum oven (thinner sorbent layers)
10.3 Results
Figures 10.2 (Dow XUS large), 10.3 (Dow XUS small), 10.4 (Ambersorb 563), and 10.5 (BPL 4x6) show the three successive BTCs for each sorbent. To facilitate comparison, all plots are on the same scale on both axes. Figures 10.6 (1st), 10.7 (2nd), and 10.8 (3rd) show the same data, but presented by sorption cycle number. Again, all plots are on the same scale. Figures 10.9,10.10, and 10.11 expand the early time part of the BTCs so that low levels of TCE in the effluent may be compared. The time scale is the same for these three figures.
Two runs were performed with virgin Dow XUS large. As seen in Figure 10.2, they were essentially identical.
For the 1st loading (virgin material), Dow XUS small and Ambersorb 563 showed very sharp BTCs, occurring very close to the time predicted from assuming bed loading in equilibrium with the feed gas (Table 10.1). Dow XUS
64 1-72

large and BPL 4x6 both had less sharp BTCs and a low level of TCE was always present in effluent. This poor behavior may well be attributable to dispersion and wall effects since these materials were large for the column dimensions used (Table 10.1). At the end of the first loading, samples of each of the sorbents were placed in headspace vials, and after time was given for TCE to equilibrate into the headspace, the headspace was sampled; The equilibrium loading calculated using this vapor concentration and the Freundlich equation (Chapter 3) agreed very well with those predicted in Table 10.1. (Note that only an insignificant amount of TCE is needed to saturate the headspace so that the loading on the sorbent is essentially unchanged.)
Prior to the 2nd loading, the sorbents were desorbed under "mild" conditions (short time, thick layer in dish). The result was incomplete desorption in all cases as can be seen from Figure 10.10 in which all the sorbents immediately showed TCE in the effluent. This bleed of TCE is presumably that which is in equilibrium with the TCE level left in the partially desorbed sorbent. The resulting loss in working capacity of the sorbents can be seen in Figures 10.2, 10.3 and 10.5 where the BTCs are shifted to shorter times. During the 2nd loading of Ambersorb 563, the flow controller malfunctioned. These data had to be discarded.
The incomplete desorption under these "mild" conditions was confirmed by measuring the equilibrium TCE vapor concentration in equilibrium with these "desorbed" sorbents. As above, the loading on the sorbents was calculated using the Freundlich equation. Comparing these results to the initial loadings, 45-60% of the initial TCE remained on the Dow XUS sorbents, 70% on Ambersorb 563, and 75% on BPL 4x6. The working capacity, calculated as the initial capacity minus the residual loading of TCE on the sorbent, was about the same for the Dow XUS sorbents and BPL 4x6. It was slightly higher for Ambersorb 563.
The similarity of working capacities for the sorbents is evident from the BTCs (Figure 10.7 and 10.10). If the level of TCE bleed in the effluent is acceptable, then these "mild" desorption conditions are all that are required, and Dow XUS small and BPL 4x6 are equally good sorbent choices. No comment can be made about Ambersorb 563 since no data are available under these conditions.
Prior to the 3rd sorption, the sorbents were desorbed more completely (longer time, higher temperature, spread out in thin layers in dish). As seen in Figure 10.11, this resulted in substantially lower levels of TCE in the initial effluent from the columns. BPL 4x6 had a slightly higher level than the other sorbents. Compared to the 2nd loading, the BTCs for all of the sorbents were closer toward those for the 1st loading.
In fact, for Dow XUS small the 1st and 3rd BTCs were very similar and for Dow XUS large the 3rd BTC was actually slightly better than the 1st (Figures 10.3 and 10.2). The working capacity of Dow XUS was essentially restored to that of virgin material. For Ambersorb 563 and BPL 4x6 a significant reduction in working capacity is apparent (Figures 10.4 and 10.5). Figure 10.11 shows that the working capacity of Ambersorb 563 was only slightly greater than Dow XUS
65
1-73

small. A similar result was seen in one of the thermal desorption rate experiments discussed in Chapter 7.
The general shape of the BTC for a given sorbent did not change on each successive loading. This suggests that column packing was reproducible.
10.4 Discussion and Conclusions
The more favorable isotherms for Ambersorb 563 and BPL 4x6 compared to Dow XUS, reported in Chapter 3, are reflected in the later breakthrough times for the former. However, the ease of desorbability of Dow XUS compared to Ambersorb 563 and BPL 4x6, as reported in Chapter 7, is evident from the similarity of the 1st and 3rd BTCs for Dow XUS and the progressively poorer BTCs for Ambersorb 563 and BPL 4x6.
Under "mild" desorption conditions, all of the sorbents lost working capacity. Under more extensive desorption conditions, Ambersorb 563 and BPL 4x6 still showed a loss in working capacity. This loss of working capacity is not necessarily irreversible. Instead it is associated mainly with incomplete desorption under the conditions examined. Under these same desorption conditions, Dow XUS desorbed nearly completely and its working capacity approached that of virgin material.
The sorption capacity of the Dow XUS sorbents is more easily restored. Although its working capacity may still be less than that of Ambersorb 563 or BPL 4x6, the reproducibility of the Dow XUS capacity is useful to avoid either overdesign or underdesign of bed volume. Also, as concentration increases the initial capacity difference between Ambersorb 563 and Dow XUS diminishes (Chapter 3), and presumably this would translate into closer working capacities. Thus, based on their behavior on repeated use in sorption columns, Dow XUS sorbents are preferred.
The broadening of the BTCs for the two larger particles is most likely due to the geometry of the laboratory column. In a large scale process, this would not be an issue and sharper BTCs would be expected. Thus, based on the lower AP it requires, Dow XUS large would be the preferred sorbent.
These experiments also serve to demonstrate the feasibility of the overall process. These two commercial synthetic sorbents, Dow XUS and Ambersorb 563, can completely remove TCE from a TCE-contaminated air stream, be desorbed, and then reused to treat another TCE-contaminated stream.
66
1-74

CO 0)
Columns Runs: Dow XUS large particles
10 15 20 25 30 35 40 45 50
time (hours)
FIGURE 10.2: Column Runs: Dow XUS large particles
Columns Runs: Dow XUS small particles
4.0e7 -r 3.5e7 3.0e7 --2.5e7 --
£ 2.0e7 -• " 1.5e7 ••
1.0e7 5.0e6 + O.OeO
10 15 20 25 30
time (hours)
35 40 45 50
FIGURE 10.3: Column Runs: Dow XUS small particles
67 1-75
'i-^s^i

Columns Runs: Ambersorb 563
10 20 30
time (hours)
40 50
FIGURE 10.4: Column Runs: Ambersorb 563
Columns Runs: BPL 4x6
as a>
10 20 30
time (hours)
40 50
FIGURE 10.5: Column Runs: Calgon BPL 4x6
68 1-76

Columns Runs: 1st Loading
CO o
4.087
3.587
3.087
2.587
2.087
1.587
1.087
5.0e6
O.OeO 10 15 20 25 30
time (hours)
35 40 45 50
FIGURE 10.6: 1st Loading: Virgin Materials
Columns Runs: 2nd Loading
1.087
5.0e6
O.OeO 10 15 20 25 30
time (hours)
35 40 45 50
FIGURE 10.7: 2nd Loading: After "Mild" Desorption
69 1-77

Columns Runs: 3rd Loading
£ 2.0e7 +
I 'I I I \ 1 1 I 1 1 0 5 10 15 20 25 30 35 40 45 50
time (hours)
FIGURE 10.8: 3rd Loading: After More Extensive Desorption
Columns Runs: 1st Loading; Expanded View
3.0e5 T j
2.5e5 -- $ H Dow large
2.0e5 4- "
£ 1.5e5 --(0 I
1.0e5 -J
5.0e4
O.OeO 15 20
time (hours)
30
FIGURE 10.9: 1st Loading: Virgin Materials - Expanded View
70 1-78

2.0e7 -r
1.5e7 --
Columns Runs: 2nd Loading; Expanded View
Dow small I I /
Dow large ^ / - '
5.0e6 --
O.OeO
BPL4x6
+ 10 20
time (hours)
30
FIGURE 10.10: 2nd Loading: After "Mild" Desorption - Expanded View
Columns Runs: 3rd Loading; Expanded View
Dow small
S 4.0e5
time (hours)
FIGURE 10.11: 3rd Loading: After More Extensive Desorption - Expanded View
71 1-79
^r~^<. -..*-

CHAPTER 11: SUMMARY OF PROCESS DESIGN AND COST ANALYSIS
11.1 Sorbent Choice
For the remediation type of applications considered here - effluents from ground water air strippers and SVE wells - the air stream concentration is low enough (10's - 100's of ppmv) that commercial polymers and rubbers have too low a capacity to be of interest. For these applications Rohm and Haas1 Ambersorb 563 and Dow's XUS are the best choices as replacements for activated carbon. Generally, Ambersorb 563 has a higher capacity than Dow XUS, but as concentration increases (still within the range of interest here), the capacity of Dow XUS approaches that of Ambersorb 563. Dow XUS is more readily thermally regenerable than Ambersorb 563 and gave better reloading results in column experiments. Both of these sorbents were considered for design purposes.
11.2 Conceptual Process Design
A straightforward sorption/ desorption process based on either Dow's XUS or Rohm and Haas' Ambersorb 563 was developed and compared with activated carbon. The complete details of the design criteria, conceptual designs, and cost estimates are given in Part HI of this report. Only an overview of the processes is given here with the intent of delineating areas for process improvement.
Two design cases were considered:
1) 2000 SCFM, 30 ppmv TCE (30 lb TCE/day) - chosen to simulate a ground water air stripper effluent
2) 2000 SCFM, 400 ppmv TCE (400 lb TCE/day) - chosen to simulate an in situ air stripper/ SVE well effluent.
Three types of processes were developed, all based on a packed bed sorber design. The differences were in the regeneration schemes:
1) desorb the loaded sorbent bed with hot N2 and recover neat TCE In this process, the N2 is heated with an oil heater and a small electric heater and the design incorporates heat recovery. The TCE-laden N2 stream is then sent to a two-stage chiller to condense neat TCE.
2) desorb the loaded sorbent bed with steam and send the aqueous condensate to a fluidized bed bioreactor for destruction of TCE. After the steam is condensed, the neat TCE phase is removed and only the TCE-saturated water is sent to a fluidized bed bioreactor for destruction of the TCE. For the design conditions used here, about 83% of the TCE would be recovered as neat TCE and about 17% would be destroyed in the bioreactor. Since the bioreactor uses an aqueous feed, this approach was not considered for the air stripper effluent (low concentration case). For that case, the ground water could be sent directly to the bioreactor.
71 1-80

3) desorb the loaded sorbent bed with water and send the water to a fluidized bed bioreactor for destruction of the TCE. In this process, all of the TCE would be destroyed. As above, this approach was applied only to the high concentration, SVE effluent case. Based on the cost of the bioreactor for treating this mass of TCE, this approach was deemed unacceptable. Careful analysis of the factors controlling cost of the bioreactor showed that the limitation is the rate of oxygen input into the reactor (via dissolution of O2). This mass of TCE, combined with the required phenol cometabolite, has such a high COD that a large recycle stream is required and this sets the diameter, and hence cost, of the reactor. In addition, the high water flow rates needed to desorb the beds, as calculated in Chapter 8, were considered excessive. This approach was not pursued.
These desorption scenarios were considered only for the synthetic sorbents. To compare their use with activated carbon, a one-pass/ off site regeneration of activated carbon was evaluated. Although processes based upon on-site regeneration of carbon are available, in practice, most applications of activated carbon involve off-site regeneration. Thus, this was considered the most likely competing process.
Figure 11.1 shows the process flowsheet for the cases using hot N2 desorption. The flowsheets for the steam regeneration/ bioreactor case and for the one pass/ off-site regenerated activated carbon case are in Part HI of this report. Some of the assumptions in the process design are listed below:
1. The TCE-contaminated air stream was assumed to be available. Modifications to an existing air blower and blower electrical costs were included to meet the pressure drop required for the sorber beds.
2. The entering air stream was assumed to be at 15°C and 100% relative humidity. It was preheated to 27°C to reduce relative humidity to less than 50%. This may not have been necessary, since these synthetic sorbents are not much affected by relative humidity.
3. Beds sizes were chosen to be "typical" adsorber beds. About 5000 lbs of sorbent were allotted per bed. Three sorber beds were provided, two for operation in series, one in regeneration mode.
4. Two GAC beds were included after the sorber units to serve as polishers. Since this is a new technology, such safe guard was considered necessary.
5. The loading on the sorbents was assumed to be between 60 and 80% of the equilibrium values calculated from the 30°C, low humidity Freundlich equation and parameters given in Chapter 3.
6. The uptake of water by the synthetic sorbents was estimated from vendor literature to be about 2 weight% in all cases.
73 1-81

to
3 o
o
s-n>
N CD O
•a o 3. re
o CO o
O 3
o r> CO co
Existing Faellltlet
1-C-1 Knock-out
Drum
Attamate Exhaust from Soil Vapor Extraction Systam
Anti Sealant
Ground Water From ~ Equalization Tank
^f JS2SS
Pump
Air Stripping Tower* (Dual-Stage)
Second Stage Air Stripper)
£*
A/VIA
CVOCatoRseycta or Disposal
1-C2 Sponge Adsorber*
(Three Unit*, Two Operating in Series, One in Regoneration Mode)
Treated Air to Stack
l-C-3 Vapor Phase
QAC Adsorber* (Two In Series)
L ^ - ' • • ' • • • ' • • • ' • • • ' • • ' • • • • • ' • • • ' • ' • • '
J"»'•'••'•' v V v S v w X v j i ^ w K Hot on Haatar !w^ / / /S>>«Sv> />>^ Haatar Kv/Xr j p y f - f . - T I p v ^ v . y . v . ^ w w . w f r W t a t ^ , ^ ! ! . ! , . , . x-v-v-Xv:
if
- » Sponge Adsorber T*T»TV.V..-..-..T.TT. .-..-.•. Z siHajenaratlonModa ' i ' 7 / °» vtyJ-XWy
i -n . l .v.'! Ragtnarsfen v . VV/X-X- Hot 03 Pump £ v Kowar
X v / X ^ ^ X y / r ^ 4 ^ ' ^ % y - ^ i i ^ ^ - ^ ^ y X ' /
^S^;X'X"XX'X*Xv*v:Xv: ftaosGaa** :X*Xv;X • A * W j A - W M W - f e i t o 8 * ' * " sfcn0» •:':':'.•'.•'//;
Phaat •'*.'*.•'.".•'.•'.',',**.•,'.•* •#•.• . ••* .• . -' Saparator '••'•:•'••'•'•••'/•':•':•: CVOCetoBacyda
* •./X-.y.vX'-'X-.v.y-' °* Disposal i -n.2
CVQCStonoa ffi%
Xv Thermal Xv Regeneration of Mf$&&£'£&2 Xv Organic Sponge ;X;!w^JJvWj
1 - C - B v.v.v.v.y.y/ • UquWPtna* Xv-yvvvX
QACMsoibsn XXvlv.v.v:.
r.Trsstld Condense* .V.V.; ''•toOischsrgs
fcy^^^ r Proce** Flow Diagram • Air Stripper Exhaust Treated by Sponge Adsorption System - Thermal Regeneration -Casas 1A, 1B, 2A * 2B
JOB NO. 21307 ROURE J-t

7. The amount of N2 needed to regenerate the sorbents was estimated from the Freundlich equation and parameters given for the 90°C isotherms given in Chapter 6. The minimum amount of N2 needed under these conditions was calculated assuming all of the N2 left the bed in equilibrium with the loaded bed at 90°C. This amount of N2 was then multiplied by a factor of 3 to account for tailing of the desorption curve and as a safety factor (since these calculations required a significant extrapolation of the data measured here at 90°C). This was a conservative approach. First, the actual desorption temperature would be 100°C, lowering the amount of N2 required. Further, Dow has reported desorption curves mat show very little tailing (Jones) also lowering the N2 requirement. The N2 flow rate was 1500 SCFM and four hours was allotted for heating the bed (Westates Carbon).
8. The steam rate for the steam regeneration/ bioreactor case was 25 lb steam/ lb sorbent, based on work by Crittenden et al.
9. An Empty Bed Contact Time of 6 seconds was used. Typical EBCTs for vapor sorption systems range from 0.2 - 20 sec, with 5 sec about average (Dvorak et al.).
Some cases were eliminated based on preliminary results. The 90°C isotherm for Ambersorb 563 showed that too much N2 was required to regenerate it under the high loading case. For the same reason, it was not considered for steam regeneration. In addition, there was not much advantage to using Ambersorb 563 at the higher concentration anyway, since Dow XUS had basically the same capacity and better regeneration properties. As stated above, water regeneration of the sorbents was also eliminated, due to high bioreactor costs. The 6 cases considered in detail were:
1A: Stream: 2000 SCFM, 30 ppmv TCE Sorbent: Dow XUS large particles Equilibrium Loading: 5% Sorbent Cost: $25/lb Bed Size: 8 ft diameter x 4 feet height; 5000 lb AP across bed: 18 inches of H2O Sorption Time: 6 days Desorption: HotN2 Desorption Time: 25 hours
IB: Stream: 2000 SCFM, 30 ppmv TCE Sorbent: Ambersorb 563 Equilibrium Loading: 14.5% Sorbent Cost: $35/lb Bed Size: 10 ft diameter x 2 feet height; 5000 lb AP across bed: 52 inches of H2O Sorption Time: 19 days Desorption: HotN2 Desorption Time: 9 days
75 1-83

l R Stream: 2000 SCFM, 30 ppmv TCE GAC Adsorption/ Off-Site Regeneration Sorbent: BPL4x6 Equilibrium Loading: 15% Sorbent Cost: $2.50/lb Bed Size: 8 ft diameter x 4 feet height; 6000 lb AP across bed: 4.8 inches of H2O Sorption Time: 27 days
2A: Stream: 2000 SCFM, 400 ppmv TCE Sorbent: Dow XUS large particles Equilibrium Loading: 25% Sorbent Cost: $25/lb Bed Size: 8 ft diameter x 4 feet height; 5000 lb AP across bed: 18 inches of H2O Sorption Time: 2 days Desorption: HotN2 Desorption Time: 20 hours
2D: Stream: 2000 SCFM, 400 ppmv TCE Sorbent: Dow XUS large particles Equilibrium Loading: 25% Sorbent Cost: $25/lb Bed Size: 8 ft diameter x 4 feet height; 5000 lb AP across bed: 18 inches of H2O Sorption Time: 2 days Desorption: Steam Desorption Time: 20 hours (Bioreactor runs around the clock)
2R: Stream: 2000 SCFM, 400 ppmv TCE GAC Adsorption/ Off-Site Regeneration Sorbent: BPL4x6 Equilibrium Loading: 30% Sorbent Cost: $2.50/lb Bed Size: 8 ft diameter x 4 feet height; 6000 lb AP across bed: 4.8 inches of H2O Sorption Time: Two beds replaced every 8 days
11.3 Summary of Cost Analysis
Table 11.1 summarizes the results of the economic analysis detailed in Part HI. These costs are complete. Total Capital Cost includes all items shown in the flow sheet and incorporates direct and indirect field costs, EPCM (engineering, procurement and construction management) and contingency. Annual O&M costs include electricity, materials and supplies (N2 makeup, CVOC disposal, GAC polisher replacement), maintenance, and labor. For 1A, IB and 1R, the annualized cost factor was 0.08 (5% return, 20 years project life). For 2A, 2D, and 2R, the annualized cost factor was 0.23 (5% return, 5 years project life).
76 1-84

TABLE 11.1: Comparison of Estimated Costs
Case Description Project Ufe (yrs)
Total Capital ($MM)
Total Present Worth ($MM)
Annual O&M Costs
($K)
Total Annualized Costs ($K)
1A 30ppmv; Dow; N2
20 1.2 3.8 214 307
IB 30ppmv, A563;N 2
20 1.4 4.5 250 363
1R 30 ppmv, BPL; off-
site
20 0.19 3.8 292 307
2A 400ppmv; Dow; N2
5 1.2 2.9 396 665
2D 400ppmv, Dow;
steam/bio
5 1.9 5.1 735 1166
2R 400 ppmv, BPL; off-
site
5 0.25 6.2 1382 1439
For the low TCE concentration case, off-site regeneration of activated carbon is a good choice. For the high TCE concentration case, the cost for off-site regeneration of carbon becomes prohibitive. Carbon replacement costs dominate the annual O&M and more than off set any savings in capital. Of the remaining cases, hot N2 thermal regeneration of Dow XUS (2A) is preferred over steam regeneration coupled to biodegradation (2D). The savings here comes in both lower capital and O&M costs. For all of the on-site regenerated synthetic sorbent cases (1A, IB, 2A, 2D), labor costs account for about 50-60% of the total O&M. Costs for CVOC disposal ($0.50/lb) are the next biggest cost. For case 2D, the cost for natural gas to generate steam and some additional labor costs drive its O&M above that for case 2A.
11.4 Refinement of Process Design
Of the cases considered, only 2A, hot N2 regeneration of Dow XUS sorbent, at high TCE concentrations, is considered further. An analysis of some of the major cost factors shows where improvements can be made. Table 11.2 summarizes the annualized costs and also shows the lowered costs resulting from the changes discussed below. CVOC disposal costs is considered fixed at this point. Labor costs are high due to the fact that this would be a new technology. These costs would be reduced as experience with the process increased.
1) Reduce Sorber Bed Size: The largest cost is capital recovery. The sorbers comprise 65% of this cost, and this is mainly due to the cost for the initial sorbent purchase. In the current process, the sorber is on-line for 2 days, regenerated for 20
77
1-85

days, and idle for 28 hours. Ideally, the sorption and desorption times would be more closely matched. As a step in that direction, if the size of the sorber beds was cut in half, a savings of $195K in equipment purchase results. This lowers the annualized cost for installed capital to $122K. Maintenance costs would also be lowered, to $16K.
2) Reduce N2 Regenerant Gas Consumption: The major factors in electricity costs are: air blower (40% of total, fixed), refrigeration (22%, fixed), air preheater (17%), electric heater for N2 regenerant (14%) and N2 blower (8%). The N2 regenerant rate was conservatively chosen. Data from Dow (Jones) indicates that the extrapolation of the 90°C isotherm used here resulted in too low an estimated gas phase concentration, causing overestimation the N2 usage. Dow also found rather sharp desorption curves. Thus it may be reasonable to reduce the N2 regenerant amount by a factor of 1/3. The resulting electricity savings for the N2 heater and blower would be $7.8K/yr.
3) Minimize Preheat of Air Stream: The capacity of Dow XUS is only slightly affected by relative humidity, so it may not be necessary to preheat the air stream to reduce relative humidity. However, one drawback to this is that the uptake of water will increase some above about 50% relative humidity, resulting in more aqueous effluent to treat. If the preheater electrical costs are reduced 50%, a savings of $4.4K/yr results.
TABLE 11.2: Analysis of Annualized Costs
- Annualized Costs ($K)
Current Case 2A Improved Case 2A Electricity (Sorption) 25.8 21.4
Electricity (Regeneration) 26.6 18.8 Maintenance 23.3 16 N2 Makeup 3.9 2.6
CVOC Disposal 65.6 65.6 GAC Polisher Replacement
6.8 6.8
Capital Recovery (based on installed costs)
178 122
Total (non-labor) 330 253 Labor 244 244
Clearly, the largest impact on cost comes from reducing the size of the sorber beds, and hence the amount of sorbent purchased. To that end, ways to reduce bed" size need to be explored. One approach is to reduce the desorption cycle time which translates into shorter sorption cycle time and hence smaller beds. Purus, Inc. currently sells units based on the same synthetic sorbents used here. They have succeeded in reducing desorption time by more quickly heating and cooling the bed through the use of in-bed electric heaters and cooling coils. Thus, less of the
78
1-86

desorption time is spent in heating and cooling the bed and more is spent in actually desorbing the sorbent. Desorption is accomplished by vacuum and the N2 flow rate is low, since it is not needed to heat the bed. A typical Purus unit consists of several 6" high beds.
11.5 Recommendations for Process Improvements
To further delineate the importance of various cost factors, the process designed here was compared with that of Purus, using a cost estimate obtained for treating a 2000 SCFM stream with 400 ppmv TCE. This cost estimate is included in the Appendix of Part HI of this report. The costs are compared in Table 11.3. To fairly compare the processes, some additional capital items were added to the Purus quote: knock out drum, aqueous GAC system, GAC polisher for air, equalization tank, and modifications to air blower. These amounted to $82K. The electricity to run the air blower was not included in either operating cost (~$20K/yr). Labor costs were also not included.
TABLE 11.3: Comparison with Purus Quote
Improved Case 2A Purus Quote Capital (uninstalled) $425000 $313000
Electricity ($K/yr) 20 8.2 N2 replacement ($K/yr) 2.6 3.0
Maintenance ($K/yr) 16 23 CVOC Disposal ($K/yr) 65.6 65.6 Total Operating ($K/yr) 104 99.8
Operating costs for the two processes are similar. The real impact of using a Purus-type design is in capital cost. As has been demonstrated in the previous chapters of this report, synthetic sorbents offer many advantages over activated carbon. However, they are also much more expensive. The key, then, is to design a cost-effective process that makes use of these advantages, while minimizing bed volume. Providing for rapid heating and cooling of the bed to minimize desorption time, and then closely matching sorption and desorption times, such as is done in the Purus units, is one such implementation.
Another approach to reducing cycle time and hence bed volume is to shorten the regeneration time so that the bed is only partially desorbed. However, as seen in Chapter 10, such "mild" desorption conditions will result in a continual, albeit low concentration, CVOC bleed when the bed is brought back on-line for sorption. This bleed could be treated by a biotic or abiotic destruction process that may work best at low concentrations. Such a hybrid system maximizes the strength of each process. The sorption process handles the bulk of the CVOC, but it is not hampered by an excessively long desorption step. Most of the CVOC is still recovered as neat product. The destruction process handles only the reduced load resulting from the column bleed. The savings in capital cost for the sorption process due to the smaller beds may exceed the added cost for this small destruction unit.
79
1-87

For streams containing several contaminants, an approach to reducing bed size is to intentionally allow the least sorbed components, which control the size of the bed, to pass through unsorbed. These contaminants could then be treated by a coupled destruction process. Again, the reduced cost for the smaller sorber beds may off set the added cost for the second unit operation.
80
1-88

CHAPTER 12: CONCLUSIONS and RECOMMENDATIONS
12.1 Summary of Sorbent Properties
The important conclusions regarding each of the sorbent properties in Part I of this study are summarized below.
1. Based on the initial screening/ weight uptake measurements, commercial polymers and rubbers have very high capacities for CVOCs from saturated vapors. Equally important, these materials retained their physical integrity at these high loadings.
2. Sorption isotherms in the concentration range of interest for remediation applications (1 - 1000 ppmv for TCE) show that these commercial polymers and rubbers have 1 to 2 orders of magnitude lower capacity for CVOCs than commercial synthetic sorbents and activated carbon. This crossover of isotherms is attributed to the difference between the absorption (solubility) mechanism of the commercial polymers and rubbers and the adsorption (surface area dependent) mechanism of the synthetic sorbents and activated carbon. Absorption continues to operate after the adsorption sites are exhausted.
3. Limited work on sorption rate suggests that the commercial polymeric sorbent, Dow XUS, has a higher sorption rate than activated carbon.
4. The CVOC sorption isotherms for activated carbon are most affected by relative humidity; the commercial carbonaceous sorbent, Ambersorb 563, is relatively unaffected, and the commercial polymeric sorbent, Dow XUS, is only somewhat affected. Similarly, the amount of water sorbed at a given relative humidity increases in the order Ambersorb 563, Dow XUS, activated carbon. These behaviors reflect the differences in the hydrophobicity of the sorbents. The CVOC capacity of the commercial polymers and rubbers are also unaffected by relative humidity and these materials sorb little water.
5. The thermal desorption isotherms (isotherms measured at elevated temperatures) are more favorable for Dow XUS than Ambersorb 563 or activated carbon. That is, there is a greater decrease in sorption capacity as temperature increases for Dow XUS than for the other sorbents.
6. Dow XUS has a higher thermal desorption rate than Ambersorb 563 or activated carbon. The commercial polymers and rubbers also desorb rapidly. This reflects the reversibility of their solubility-based sorption mechanism compared to adsorption.
7. The aqueous desorption isotherms show that activated carbon (BPL 4x6) is the most readily desorbable by this approach, followed closely by Dow XUS. Ambersorb 563 is least readily desorbed. Due to the load on the bioreactor, for which this desorption mode was to be the coupling step, this type of regeneration process was deemed too costly and so was not pursued. As with
81
1-89

the gas phase isotherms, the capacities of the commercial polymers and rubbers approach those of the synthetic sorbents and activated carbon as concentration increases, again reflecting the differences in sorption mechanisms.
8. The intrinsic sorbent lifetime for any of the sorbents is not diminished by repeated thermal cycling. However, for Ambersorb 563, a reduction in sorption capacity on repeated sorption/ desorption cycling occurs, but probably reflects incomplete desorption rather than some intrinsic change in the sorbent. Activated carbon is only slightly affected and Dow XUS is unaffected by repeated sorption/ desorption.
9. Under the conditions evaluated here, Dow XUS performed the best in dynamic column experiments. After two sorption/ desorption cycles, Dow XUS recovered essentially all of its original sorption capacity, while Ambersorb 563 and BPL 4x6 showed significant losses. All sorbents showed immediate bleed of TCE in the column effluent when they had been only partially desorbed prior to reuse in a sorption column. These experiments demonstrate the feasibility of using commercial synthetic sorbents in a sorption/ desorption process.
10. Based on all of the above properties, Dow XUS and Ambersorb 563 were chosen as the sorbents for a conceptual process design and cost analysis. The cost analysis points to the size of the sorber bed as the main driver of process economics.
12.2 Sorbent Choice for Remediation Applications
From the evaluation of sorbent properties reported here, it is apparent that sorbent choice depends on application. For instance, for air streams with very high concentrations of CVOCs, some commercial polymers and ground rubber tire have real advantages: higher capacity and lower cost. Even for very concentrated water streams, these sorbents have a capacity similar enough to activated carbon or some commercial synthetic sorbents, that their low cost may make them the sorbent of choice. However, for the remediation type of applications considered here - effluents from ground water air strippers and SVE wells - the air stream concentration is low enough (10's - 100's of ppmv) that:fhese commercial polymers and rubbers have too low a capacity to be of interest. For these applications Rohm and Haas' Ambersorb 563 and Dow's XUS are the best choices as replacements for activated carbon.
Table 12.1 compares the properties of these sorbents with respect to the important properties considered in selecting a sorbent for use in a sorption/ thermal desorption process for treating air streams encountered in remediation applications. The impact of each property on process cost is also listed.
82
1-90

TABLE 12.1: Ratings of Sorbents versus Properties of "Ideal" Sorbent for Removing CVOCs from Air Streams in Remediation Applications
Proper ty Impact on Process Costs DowXUS Ambersorb 563 Commercial
Polymers and Rubber Tire
Activated Carbon
High Capacity Smaller adsorber, lower capital and maintenance
•k~k (capacity approaches Ambersorb
as cone increases)
• • 0 (negligible capacity for this concentration
range)
• • •
High Sorption Rate Small mass transfer zone -smaller beds
• • • not measured hot measured *
Capacity hot affected by%RH
No steam to heat incoming gas or heal exchanger to cool and condense out water
• • * * • 'kk'k *
Hydrophobic - Low Water Sorption
Lower volume of aqueous effluent to dispose or destroy
* • • * • kkk *
Favorable Thermal Desorption Isotherm
Lower volume of regenerant effluent to treat; shorter cycle time
kkk . * • •
Rapid Thermal Desorption Rate
Sharper elution - minimize regenerant; restore working capacity faster; shorter cycle time
kkk * kkk *
Long Lifetime No loss of sorption capacity with repeated use
kkk kk (no effect of thermal cycling, but
reduced capacity due to incomplete desorption)
kkk kk (no effect of thermal cycling, but reduced working capacity due to
incomplete desorption) Dynamic Performance Behavior under process
conditions kkk (good on
repeated use; broad BTC of larger particles could be eliminated in
larger column)
kk (good initial BTC, but loss of
capacity on repeated use)
not measured * * (good initial BTC, but loss of capacity on
repeated use; broad BTC could be eliminated in
larger column) Not catalytic Lower materials of construction
cost due to no HCl formation * • * ? * • • •
Low AP Lower blower costs k~kk. (for large particles)
• - • • * Low Attrition Lower replacement costs * • * • * • * * * • Low Fire Hazard Safety * * * • • * • * • • Low Purchase Cost Low initial capital expense • * • * * • * Readily Acceptable to Remediation and Regulatory Communities
Ease of permitting; Critical to success
• • * * • *
Rating System: kkk = best sorbent choice; kk = good choice, but may be some issues; k = sorbent may perform poorly.

The commercial polymeric sorbent, Dow XUS, offers many advantages over activated carbon:
• similar, although slightly lower, capacity for CVOC • higher sorption rate • CVOC capacity much less affected by relative humidity • much lower sorption of water • greater change in sorption capacity as temperature is increased, making
it more thermally desorbable • faster thermal desorption rate • no effect of repeated sorption/ desorption on capacity for CVOC • better dynamic performance in a column - quicker restoration of
sorption capacity • not catalytic • not friable - low attrition • low fire hazard
The commercial carbonaceous sorbent, Ambersorb 563, offers some of these same advantages, however, it is not as thermally regenerable and did not perform as well on repeated use in a column. Although Ambersorb 563 has a higher capacity than Dow XUS at the lower end of the concentration range considered here, the difference is much smaller at the higher end. Ambersorb 563 does sorb much less water at higher relative humidities than does Dow XUS. Overall, Dow XUS is the preferred sorbent, but Ambersorb 563 is also acceptable;.
Both of these synthetic sorbents have a significant disadvantage compared to activated carbon - cost of the sorbent, which ranges from $25-$35/lb versus <$2.50/lb for activated carbon.
12.3 Recommendations
The key to capitalizing on the many advantages commercial synthetic sorbents offer over activated carbon is to minimize the effect of sorbent purchase price. This leads to designs using small sorber beds and hence short sorption cycle times. This in turn translates into short desorption times and a close matching of these times. Significant progress toward these goals has been made by various vendors, such as Purus, Inc. Further improvements, such as reduced desorption time and separate treatment of the column bleed resulting from this partial desorption, may create an even more cost-effective process.
84
1-92

REFERENCES
American Norit Company literature, Atlanta, GA.
Basta, N. Chem. Eng. Mar 1994,43-48.
Browne, T.E.; Cohen, Y. Ind. Eng. Chem. Res. 1990,29(7), 1338-1345.
Brusseau, M.L.; Rao, P.S.C. CRC Crit. Rev. Environ. Control 1989,29(2), 33-99.
Calgon Carbon Corporation, "Type BPL Granular Carbon," and other company literature, Pittsburgh, PA.
Dvorak, B.I.; Lawler, D.F.; Speitel, G.E.; Jones, D.L.; Boadway, D.A. Water Environ. Res. 1993,65(7), 827-838.
Crittenden, J.C.; Cortright, R.D.; Rick, B.G.; Tang, S.R.; Perram, D.L.,; Rigg, T.J. "An Evaluation of the Technical Feasibility of the Air Stripping Solvent Recovery Process," American Water Works Assoc, June 1987.
Dow Chemical Company "Polymeric Adsorbent XUS 43493, Technical Bulletin 3.03" and "Polymeric Adsorbent XUS 43502, Technical Bulletin 2.03," Midland, ML
Gascoyne, D.G.; Webb, J.L. "Kinetics of PCB Sorption from Aqueous Surfactant Solutions to Polymer," GE Internal Report: 92CRD201, Oct 1992.
Graham, J.R.; Ramaratnam, M. Chem Eng. Feb 1993.
Haselow, J.S.; Jarosch, T.R; Rossabi, J.; Burdick, S,; Lombard, K. "Interim Report on Testing of Off-Gas Treatment Technologies for Abatement of Atmospheric Emissions of Chlorinated Volatile Organic Compounds." WSRC-RP-93-1604, Westinghouse Savannah River Company, Dec 1993.
Hradil, J.; Svec, F.; Podlesnyuk, V.V.; Marutovskij, R.M.; Friedman, L.E.; Klimenko, N.A. Ind. Eng. Chem. Res. 1991,30(8), 1926-1931.
Jones, K.C. personal communication, Dow Chemical Company, Midland, MI, Nov 1993.
Kong, E.J.; DiGiano, F.A. /. Amer. Water Works Ass. 1986, 181-188.
Kumar, K.S.; Pennington, R.L.; Zmuda, J.T. Chem. Eng. Jun 1993,12-17.
Mukhopadhyay, N.; Moretti, E.C. Current and Potential Future Industrial Practices for Reducing and Controlling Volatile Organic Compounds; Center for Waste Reduction Technologies, American Institute of Chemical Engineers: New York, 1993.
Nelson, T.P.; Blacksmith, J.R.; Randall, J.L. Environ. Prog. 1985,4(1), 14-19.
85
1-93
-- - - ;.-T7c<v'.v>' ^wr.r^^^^^^-^w^'^^r-: '

Noll, K.E. et al. Adsorption Technology for Air and Water Pollution Control; Lewis Publishers, Inc.: Chelsea, ML 1992.
NUCON International, Inc. company literature, Columbus, OH.
Parmele, C.S.; OConnell, W.L.; Basdekis, H.S. Chem. Eng. Dec 1979,58-70.
Purus, Inc. company literature, San Jose, CA.
Rohm and Haas Company, "Laboratory Guide" and "Ambersorb Carbonaceous Adsorbents," Spring House, PA.
Ruddy, E.N.; Carroll, L.A. Chem. Eng. Progress 1993,89(7), 28-35.
Ruhl, M.J. Chem. Eng. Progress 1993,89(7), 37-41.
Schoene, K.; Steinhanses, J.; Konig, A. /. Chromatogr. 1988,455,67-75 and /. Chromatogr. 1990,524,279-286.
Schwarzenbach, R.P.; Westall, J. Environ. Sci. Technol. 1981,15(11), 1360-1366.
Simpson, E.J.; Abukhadra, R.K.; Koros, W.J.; Schechter, R.S. "Sorption Equilibrium Isotherms for Volatile Organics an Aqueous Solution: Comparison of Head-Space Gas Chromatography and On-line UV Stirred Cell Results," submitted to Ind. Eng. Chem. Res. 1993, and Simpson, E.J. "Recovery of Volatile Organic Compounds from Aqueous Solution using Polymeric Sorbents," Research Proposal, Department of Chemical Engineering, University of Texas at Austin, 1993.
Soffel, R.W. In Encyclopedia of Chemical Technology, "Activated Carbon" under "Carbon" Vol 4,561-570.
Sontheimer, H.; Crittenden, J.C.; Summers, R.S. Activated Carbon for Water Treatment; AWWA Research Foundation: Denver, CO, 1988.
Stenzel, M.H. Chem. Eng. Progress 1993,89(4), 36-43.
Stenzel, M.H.; SenGupta, U. APCA Journal 1985,35(12), 1304-1309.
Riley, G.N.; SenGupta, U. "Selecting an Appropriate Control Technology for Air Stripper VOC Emissions," from Calgon Carbon Corporation, Pittsburgh. PA.
Vandersall, M.T.; McMurtrie, J.L.; Maroldo, S.G. "Humidity Effects on the Adsorption of Organic Vapors Using Carbonaceous Adsorbents," presented at AIChE Annual Conference, Nov 1992 (in Rohm and Haas Company literature).
Weber, W.J.; van Vliet, B.M. /. Amer. Water Works Ass. 1981,73,420-426 and 426-431.
Westates Carbon, Inc "Hot Gas Regenerable Adsorption System," Los Angeles, CA, Sep 1993.
86
1-94

APPENDIX I: WEIGHT UPTAKE RESULTS
In the following tables the data for all of the initial screening of sorbents via weight uptake from a saturated vapor are listed. These results are discussed in Chapter 2. The data are presented as follows:
Table 1.1: Percent Uptake of TCE on Polymers at 30°C Table 1.2: Percent Uptake of Methylene Chloride on Polymers at 30°C Table 1.3: Percent Uptake of TCE on Water-Saturated Polymers at 30°C Table 1.4: Percent Uptake of Methylene Chloride on Water-Saturated
Polymers at 30°C Table 1.5: Percent Uptake of Water on Dry Polymers at 30°C
87
1-95

Table 1.1: Percent up! take of TCE on polymers at 30 C Polymer Wt Gross wt. 2hr 4hr 6hr 24hr 48hr 96hr 120hr
Lomod JB610 1.000 10.730 88.60% 106.50% 118.10% 131.60% 139.40% 143.00% 143.10% Lomod XJ1013 1.000 10.641 71.80% 84.70% 92.50% 100.20% 104.80% 107.90% 108.00% Lomod JE630 1.000 10.728 89.40% 107.90% 120.00% 135.10% 141.40% 147.50% 147.70% Lomod J613 1.000 10.637 82.20% 100.60% 111.00% 124.40% 137.00% 137.70% 137.70% Lomod 139 60% PBT 1.000 10.604 42.10% 47.00% 48.80% 50.80% 52.10% 53.20% 53.30% Fine activated charcoal Norit SG 1.000 10.665 50.40% 51.30% 52.30% 53.60% 53.50% 53.20% 53.50% Calgon activated charcoal 1.000 10.488 73.20% 73.90% 74.40% 75.00% 75.80% 76.00% 76.00% Ambersorb 563 1.000 10.508 42.90% 46.80% 49.40% 51.10% 56.30% 56.70% 56.70% Ambersorb 572 1.000 10.708 87.30% 91.90% 95.20% 96.10% 100.60% 103.90% 104.10% HRG 360 1.000 10.602 97.20% 119.90% 132.70% 166.20% 168.80% 170.10% 170.10% HRG 370 1.000 10.611 96.50% 119.40% 132.00% 196.00% 228.40% 270.20% 270.40% PolySep 1.0% DVB 200-400 mesh 1.000 10.498 79.50% 97.70% 106.40% 111.80% 130.00% 130.70% 130.80% Buna N-IPA 1.000 10.642 75.20% 90.60% 97.00% 100.80% 112.70% 114.90% 114.80% ME 40 NBR 1.000 10.561 74.20% 88.20% 93.70% 95.60% 105.60% 110.90% 111.00% ME 40 NBR-IPA 1.000 10.823 53.70% 60.30% 62.40% 64.10% 67.50% 73.10% 73.20% SBR coarse black 1.000 10.702 52.40% 60.30% 62.10% 64.70% 67.30% 74.10% 74.10% Carbon filled SBR coarse black -IPA 1.000 10.628 44.60% 50.00% 50.00% 50.50% 51.00% 58.50% 58.50% GF 80/116 1.000 10.633 84.50% 103.00% 108.50% 114.70% 118.50% 136.10% 136.20% GF 80/SBR -IPA 1.000 10.532 60.50% 71.70% 73.20% 73.30% 73.80% 84.60% 84.70% Baker tire 500um<x<1 OOOum 1.000 10.592 83.90% 96.90% 102.70% 112.00% 116.50% 123.80% 123.80% Baker tire 250um<x<500um 1.000 10.637 81.80% 97.20% 104.40% 112.80% 118.00% 133.90% 134.00% Baker tire 150um<x<250um 1.000 10.694 79.60% 95.70% 102.90% 110.10% 115.00% 130.80% 130.90% Baker tire 90um<x<150um 0.500 10.224 85.80% 97.20% 98.80% 100.60% 103.20% 119.20% 119.20% Baker tire TR-40 1.000 10.659 81.20% 96.10% 103.90% 112.20% 118.00% 129.90% 130.00% TR-20 1.000 10.652 76.20% 94.20% 101.80% 113.70% 120.40% 131.50% 131.50% TR-4/10 1.000 10.644 81.10% 102.10% 110.80% 124.00% 135.00% 143.90% 144.10% WTP-20 1.000 10.612 84.20% 97.90% 104.80% 113.90% 126.90% 134.90% 134.80%
UPTAKE OF TCE @ 30 C. SAMPLES WERE NOT EXPOSED TO WATER PRIOR TO EXPOSURE TO TCE IN VAPOR TANK.

Tab e 1.1: Percent uptake of TCE on polymers at 30 C (continued) POLYMER Polymer Wt Gross wt. 2hr 4hr 6hr 24hr 48hr 96hr 120hr Estane 58133-025 1.000 10.594 48.10% 54.40% 54.50% 58.40% 59.00% 59.30% 62.80% Estane 5701 FIP 1.000 10.688 64.20% 73.50% 75.10% 88.10% 88.70% 89.80% 96.40% Estane 58144-026D 1.000 10.651 47.70% 53.20% 52.50% 56.30% 56.30% 157.40% 61.60% Estane 58315-028P 1.000 10.615 83.20% 98.70% 102.40% 123.80% 123.30% 126.30% 141.60% Estane 58300-031P 1.000 10.602 91.50% 109.50% 113.90% 138.00% 138.30% 143.90% 162.20% Estane 58134-025-D 1.000 10.444 63.40% 72.80% 73.20% 82.90% 86.10% 85.40% 90.60% Estane 5703 P (fused, swollen) 1.000 10.541 84.80% 99.70% 107.80% 467.90% 483.50% 207.80% 151.90% Estane 58881-025P 1.000 10.626 99.10% 116.20% 118.70% 146.10% 146.00% 149.70% 167.80% Estane 58137-025 1.000 10.642 31.10% 34.70% 33.70% 97.10% 37.90% 38.50% 42.30% Estane 58130-025D 1.000 10.636 55.40% 62.30% 61.80% 67.30% 67.00% 70.40% 75.20% Estane 58212-021P 1.000 10.653 60.00% 67.00% 66.50% 76.00% 75.70% 78.90% 85.40% Estane 5707 FIP 1.000 10.661 43.90% 51.20% 51.00% 57.20% 57.20% 59.50% 62.90% Pebax 2533A (swoller 1.000 10.627 133.20% 162.90% 181.20% 262.30% 261.80% 283.90% 314.40% Pebax 6333SR 1.000 10.525 16.70% 24.20% 32.40% 40.40% 40.70% 41.50% 43.00% XAD-4/1090 1.000 10.700 46.80% 47.20% 45.30% 47.50% 47.70% 47.20% 49.80% XAD-16/1090 1.000 10.538 37.80% 43.30% 42.50% 42.80% 40.50% 32.40% 37.60% Dow XUS-40323 1.000 10.671 40.80% 58.10% 58.30% 62.50% 62.80% 67.00% 77.70% Dow XUS-43493 1.000 10.475 0.40% 30.40% 40.40% 76.00% 85.80% 103.00% 145.40% Lomod 8859-1 1.000 10.707 71.30% 94.50% 107.70% 148.50% 147.80% 128.90% 138.10% Lomod 8859-3 1.000 10.585 55.80% 73.50% 83.00% 111.10% 111.20% 104.70% 105.00% Lomod HS 1.000 10.694 5.00% 7.40% 9.60% 27.00% 29.30% 28.50% 30.20% Lomod 90-2-250 , 1.000 10.676 37.80% 48.80% 54.80% 75.20% 74.60% 72.00% 76.00% Butadiene MM A KM653(F172) (swollen 1.000 10.630 110.40% 141.80% 159.40% 318.60% 316.40% 238.00% 218.50% CRDAES 1.000 10.670 63.80% 93.20% 107.80% 176.30% 173.50% 158.20% 157.90% Geolast 701-70 (oily) 1.000 10.452 89.90% 123.20% 145.50% 233.90% 233.90% 207.80% 212.60% Vyram 6101-70 (oily) 1.000 10.651 89.60% 117.30% 132.10% 204.30% 203.70% 172.00% 174.90% Santoprene 201-73 (oily) 1.000 10.520 79.60% 108.50% 125.80% 211.40% 210.70% 176.60% 181.30% Santoprene 203-40 (oily) 1.000 10.699 59.80% 81.80% 94.20% 150.30% 148.00% 129.30% 129.00% Lomod JE630 1.000 10.637 93.10% 112.20% 125.60% 183.10% 182.90% 163.80% 169.60% Baker TR40 1.000 10.532 77.20%| 97.80% 113.00% 186.00% 187.00% 161.50% 160.90%
UPTAKE OF TCE @ RT. SAMPLES WERE NOT EXPOSED TO WATER PRIOR TO EXPOSURE TO TCE IN VAPOR TANK.

Table 1.1: Percent uptake of TCE on polymers at 30 C (contined) POLYMER Polymer Wt Gross wt. 2hr 4hr 6hr 24hr 48hr 96hr 120hr Lomod JB 610 1.000 10.680 102.00% 137.30% 152.30% 174.30% 178.60% 180.10% 181.60% Baker tire TR 40 1.000 10.635 103.40% 131.50% 146.50% 167.30% 167.50% 171.50% 174.50% Norit RB 1.000 10.504 60.60% 62.10% 61.60% 61.60% 61.50% 61.70% 61.90% Dow XUS 43493.01 1.000 10.605 133.20% 149.50% 156.20% 162.60% 164.40% 165.00% 165.30% Sorbonorit 1.000 10.562 79.90% 82.80% 82.60% 81.80% 81.10% 81.10% 81.20%
UPTAKE OF TCE @ RT. SAMPLES WERE NOT EXPOSED TO WATER PRIOR TO EXPOSURE TO TCE IN VAPOR TANK.

T a b l e 1 .2: Percent u p t a k e o f m e t h y l e n e c h l o r i d e o n p o l y m e r s at 30 C POLYMER Polymer Wt Gross wt. 2hr 4hr 6hr 24hr 48hr 96hr 120hr 144hr Lomod JB610 1.000 10.441 105.40% 115.40% 113.70% 132.30% 132.60% 172.30% 177.50% 191.10% Lomod XJ1013 1.000 10.581 87.10% 95.50% 94.70% 107.80% 108.20% 133.70% 140.30% 150.20% Lomod JE630 1.000 10.643 115.20% 129.90% 130.80% 150.60% 151.70% 177.50% 191.90% 206.30% Lomod J613 1.000 10.680 98.40% 113.40% 114.20% 132.70% 134.00% 160.90% 167.20% 176.10% Lomod 139 60% PBT 1.000 10.593 49.00% 54.80% 55.30% 60.20% 60.70% 65.40% 73.70% 74.90% Fine activated charcoal Norit SG 1.000 10.529 44.20% 45.10% 45.40% 46.40% 46.90% 48.00% 49.20% 48.50% Calgon activated charcoal 1.000 10.684 57.40% 59.70% 59.70% 60.10% 60.40% 60.90% 61.70% 60.50% Ambersorb 563 1.000 10.512 38.80% 50.30% 61.60% 72.60% 83.00% 88.80% 91.90% 46.40% Ambersorb 572 1.000 10.744 57.90% 60.20% 61.30% 62.30% 63.00% 70.70% 77.20% 78.00% HRG 360 1.000 10.461 97.80% 111.50% 115.10% 119.40% 120.70% 135.10% 164.70% 174.50% HRG 370 1.000 10.597 99.50% 110.00% 108.90% 119.00% 123.50% 160.00% 163.50% 185.60% PolySep 1.0% DVB 200-400 mesh 1.000 10.705 71.30% 82.10% 80.70% 88.00% 92.60% 113.50% 117.50% 130.20% Buna N-IPA 1.000 10.674 44.70% 54.50% 54.30% 58.40% 60.30% 83.60% 90.20% 96.70% ME40NBR 1.000 10.532 74.50% 89.20% 89.00% 95.70% 97.70% 148.60% 147.80% 167.50% ME 40 NBR-IPA 1.000 10.697 59.60% 69.90% 71.20% 74.10% 76.70% 106.50% 110.10% 122.00% SBR coarse black 1.000 10.676 24.80% 31.30% 32.40% 32.50% 34.80% 43.90% 55.50% 59.20% Carbon filled SBR coarse black -IPA 1.000 10.611 26.80% 31.30% 32.20% 32.40% 34.60% 44.30% 49.20% 51.00% GF 80/116 1.000 10.672 57.00% 72.60% 72.60% 76.70% 81.10% 121.50% 126.90% 130.00% GF 80/SBR -IPA 1.000 10.648 74.70% 91.70% 92.10% 96.90% 103.30% 219.00% 227.10% 226.70% Baker tire 500um<x<1000um 1.000 10.703 55.60% 70.20% 70.60% 74.50% 79.90% 96.80% 118.70% 119.40% Baker tire 250um<x<500um 1.000 10.628 54.90% 72.30% 72.40% 77.40% 82.20% 102.80% 119.20% 119.60% Baker tire 150um<x<250um 1.000 10.651 50.20% 61.80% 63.40% 67.00% 67.90% 94.90% 102.60% 108.60% Baker tire 90um<x<150um 0.250 10.022 33.60% 44.40% 44.80% 46.00% 49.20% 74.00% 88.40% 94.00% Baker tire TR-40 1.000 10.554 52.50% 68.10% 68.90% 72.40% 75.70% 235.40% 320.60% 166.30% TR-20 1.000 10.680 51.90% 67.60% 68.10% 72.60% 75.20% 225.80% 306.30% 157.10% TR-4/10 1.000 10.606 55.40% 70.40% 72.60% 81.80% 85.40% 106.30% 119.60% 127.10% WTP-20 1.000 10.557 45.70% 61.10% 61.50% 62.70% 64.90% 94.70% 102.10% 109.20% WTP-4/10 1.000 10.696 45.10% 60.90% 61.30% 66.30% 66.50% 98.70% 109.20% 112.50% Santoprene 201-73 1.000 10.688 34.40% 50.60% 52.10% 57.50% 57.90% 72.10% 80.20% 88.30% Vyram 6101-70 1.000 10.852 42.30% 59.70% 60.50% 68.60% 69.40% 88.30% 99.10% 109.30% Santoprene 203-40 1.000 10.767 23.40% 34.70% 37.50% 42.60% 43.00% 54.10% 60.80% 67.30% Geolast 701-70 1.000 10.551 97.10% 135.00% 144.90% 162.40% 164.40% 209.90% 229.80% 233.90%
UPTAKE OF METHYLENE CHLORIDE @ 30 C. SAMPLES WERE NOT EXPOSED TO WATER PRIOR TO EXPOSURE TO METHYLENE CHLORIDE IN VAPOR TANK. DP HORNEY 2/9/93

1 Table 1.3: Percent uptake of TCE on water-saturated polvmers at 30 C POLYMER Polymer Wl Grot* wi . Vrt.% 1hr Wt.% 2hr Wt.% 3hr Wt.% 4hr WL% Ohr Lomod B1013 1.002 10.443 6.39% 11.58% 15.77% 21.26% 25.05% Lomod JB610 1.005 10.848 14.40% 19.60% 24.70% 58.30% 64.90% Lomod XJ1013 1.000 10.585 6.70% 12.30% 17.60% 22.40% 28.40% Lomod JE630 1.002 10.542 5.29% 11.48% 18.06% 23.75% 30.94% Lomod J613 1.002 10.614 9.38% 12.97% 19.46% 26.65% 34.53% Lomod NBE11S closed celt 15PCF 1.000 10.624 4.20% 7.50% 11.10% 22.40% 26.70% Lomod 139 60% PBT 1.006 10.686 2.09% 4.97% 8.95% 13.22% 15.61% Hylrel 4056 1.000 10.648 6.00% 10.90% 16.40% 22.60% 26.00% Hytrel 6236 1.000 10.563 9.80% 11.30% 12.40% 14.80% 16.40% Catbon filed NBR ME 40 1.000 10.673 12.60% 15.60% 20.70% 24.80% 34.60% Carbon filled NBR ME 40-IPA 1.003 10.686 3.29% 5.08% 9.67% 13.36% 16.15% ME 40 NBR 0£5< x <O.Smm 1.002 10.636 4.59% 9.88% 13.47% 19.26% 23.05% ME40NBR0.5<x<1.0mm 1.001 10.564 5.19% 10.49% 13.79% 19.28% 23.68% ME40NBR>1.0mm 1.000 10.560 5.20% 11.30% 13.60% 19.80% 24.30% SBR fine brown • 1.000 10.460 3.20% 7.00% 12.80% 17.90% 19.50% SBR coarse Mack 1.002 10.755 2.40% 4.59% 8.38% 10.58% 13.77% Carbon filled SBR coarse black -IPA 1.003 10.700 2.29% 4.29% 6.58% 9.67% 13.36% Rubber tire 1.002 10.507 7.78% 13.87% 18.76% 24.15% 29.84% GF 80/116 1.001 10.721 28.67% 37.76% 47.45% 74.43% 91.81% GF 80/SBR -IPA 1.000 10.669 22.20% 31.70% 40.50% 56.70% 67.80% EPDM-80 -IPA 1.000 10.677 17.30% 24.90% 33.60% 44.60% 56.60% Buna N-IPA 1.001 10.616 25.77% 38.16% 51.45% 70.33% 86.31% Fine activated charcoal Norlt SQ 1.002 10.881 38.32% 39.72% 41.52% 46.11% 47.41% Calgon activated charcoal 12v40 med. 1.002 11.075 50.50% 51.90% 52.59% 55.69% 55.79% Amberllte XAD4 1.003 10.584 35.00% 41.67% 48.06% 55.83% 58.42% Amberllte XAD7 20-60 mesh 1.000 10.552 0.10% 1.10% 1.80% 4.10% 6.70% Ambersorb 663 1.001 10.569 28.07% 29.97% 31.37% 34.37% 39.96% Ambersorb 572 1.000 11.090 81.00% 84.10% 86.60% 94.40% 97.70% Valox 1.003 10.707 0.50% 2.19% 3.99% 9.37% 11.76% Noryl QTX 1.003 10.685 5.98% 13.16% 22.23% 32.30% 42.37% Zytel 101L 1.001 10.727 0.20% 0.20% 0.30% 0.40% 0.50% Tenax GC 35/60 1.000 10.773 14.00% 15.40% 18.20% 20.00% 21.90% Tenax GC 80/100 1.000 10.665 13.40% 14.60% 16.70% 19.40% 23.40% Kraton G 1650 1.002 10.683 28.24% 46.31% 61.68% 78.74% 98.20% HRQ360 1.000 10.780 . 28.20% 43.40% 66.50% 82.60% 101.00% HRG370 1.001 10.679 31.27% 52.25% 69.93% 84.82% 105.29% P O floor* BROWNISH 1.001 10.635 57.54% 63.04% 67.83% 74.63% 74.73% Polyfethylene terephthalate) 1.019 10.662 1.08% 1.08% 1.08% 1.18% 1.77% Polyvinyl chloride low mw 1.000 10.670 16.50% 24.30% 32.60% 42.60% 47.00% Polyethylene low density 1.002 10.701 15.37% 16.07% 17.56% 21.16% 22.95% PotySop 1.0% DVB 200-400 mesh 1.000 10.769 60.90% 83.10% 96.90% 108.60% 125.40% PolySep 8.0% DVB 1.003 10.541 46.26% 57.63% 70.59% 80.86% 89.93% PolySep 1&0% DVB 1.001 10.529 46.05% 54.45% 62.04% 68.73% 73.13% Poly(acrylamlde) 1.002 10.987 0.20% 0.30% 0.40% 1.00% 1.20% Poly(propylene) Isotactlc 1.002 10.531 19.06% 20.96% 22.55% 24.95% 25.15% Polyfethyl methacrylate) high mw DISSOLVEC 1.002 10.624 84.03% 107.09% 122.85% 153.89% 186.23% PolylBlyrene dtvlnyl benzene) 50% DVB 1.000 10.848 61.80% 67.40% 74.80% 89.80% 92.10% Polypropylene melt-blown 1.005 10.520 15.72% 16.62% 1 8 2 1 % 21.00% 23.48% Poly(1.4-Butylene adlpate) DISSOLVEC 1.002 10.622 56.29% 79.24% 111.38% 151.90% 189.92% Lomod JB810 1.000 10.595 49.50% 60.60% 73.20% 100.60% 114.30%
UPTAKE OF TCE & 30 C. SAMPLES WERE EXPOSED TO WATER PRIOR TO EXPOSURE TO TCE IN VAPOR TANK.

Table 1.4: Percent uptake of methylene chloride on water-saturated polymers at 30 C POLYMER Polymer Wt Gross wt. Wt.% 1hr Wt.% 2hr Wt.% 3hr Wt.% 4hr Wt.% 6hr Lomod B1013 1.000 10.681 21.70% 20.10% 22.20% 22.30% 25.70% Lomod JB610 1.005 10.480 28.40% 26.90% 29.20% 29.30% 34.10% Lomod XJ1013 1.000 10.664 24.60% 22.70% 24.40% 24.50% 28.70% Lomod JE630 1.000 10.715 31.30% 28.50% 31.10% 31.30% 37.30% Lomod J613 1.000 10.619 28.40% 25.70% 27.90% 27.90% 33.40% Lomod NBE115 closed cell 15PCF 1.000 10.609 25.60% 24.10% 25.90% 25.60% 30.20% Lomod 139 60% PBT 1.000 10.642 16.30% 15.30% 16.60% 16.20% 18.90% Hytrel 4056 1.000 10.664 22.90% 21.60% 23.20% 23.20% 27.60% Hytrel 8236 1.000 10.689 7.90% 7.40% 7.90% 8.00% 8.90% Carbon filled NBR ME 40 1.000 10.842 20.70% 17.80% 19.90% 20.00% 24.40% Carbon filled NBR ME 40-IPA 1.000 10.636 16.40% 15.60% 17.00% 16.80% 19.80% SBR fine brown 1.000 10.807 10.10% 9.30% 9.70% 10.30% 11.80% SBR coarse black 1.000 10.543 6.10% 5.50% 5.70% 6.40% 7.60% Carbon filled SBR coarse black -IPA 1.000 10.405 4.70% 4.00% 4.50% 4.90% 5.50% Rubber tire 1.000 10.771 11.80% 9.40% 11.40% 11.40% 14.10% GF 80/116 1.000 10.606 11.10% 9.20% 10.80% 11.00% 13.20% GF 80/SBR -IPA 1.000 10.583 18.60% 15.70% 18.40% 18.20% 22.00% EPDM-80 -IPA 1.000 10.700 3.10% 2.20% 2.70% 3.00% 3.60% Buna N-IPA .1.000 10.663 35.60% 36.50% 41.30% 41.40% 63.00% Fine activated charcoal Norit SG 1.000 10.831 37.00% 36.60% 36.30% 36.10% 39.20% Calgon activated charcoal 12v40 med. 1.000 10.948 48.70% 48.70% 46.10% 45.20% 43.10% Amberlite XAD4 1.000 10.667 47.80% 48.80% 49.10% 48.90% 56.70% Amberlite XAD7 20-60 mesh 1.000 10.417 113.50% 112.80% 112.50% 113.10% 120.40% Ambersorb 563 1.000 10.688 22.60% 22.00% 20.50% 20.60% 26.60% Ambersorb 572 1.000 10.912 48.50% 48.00% 46.10% 45.90% 51.90% Noryl GTX 1.000 10.578 23.10% 25.60% 25.80% 26.00% 29.50% Rubber tire Baker TR-40 1.000 10.667 33.60% 36.00% 38.80% 40.30% 62.30% Tenax GC 80/100 1.000 10.643 16.20% 17.10% 17.50% 18.60% 34.00% HRG360 1.000 10.685 68.30% 71.00% 78.60% 78.80% 118.50% HRG 370 1.000 10.625 66.70% 70.00% 76.90% 77.70% 116.30% P O fibers 1.000 10.655 39.60% 41.50% 45.80% 45.90% 65.50% Poly(ethylene terephthalate) 1.000 10.603 2.60% 3.70% 5.00% 6.00% 9.90% PolySep 1.0% DVB 200-400 mesh 1.000 10.734 43.30% 45.40% 49.30% 49.90% 71.90% PolySep 8.0% DVB 1.000 10.658 41.10% 43.00% 46.50% 46.90% 64.10% PolySep 12.0% DVB 1.000 10.642 37.00% 38.40% 40.60% 41.30% 52.30% Polypropylene melt-blown 1.000 10.709 3.50% 3.80% 3.60% 4.00% 4.90% Lomod JB610 (middle rack) 1.000 10.532 77.50% 76.40% 81.30% 79.40% 94.70% Lomod JB610 (lower rack) 1.000 10.512 126.20% 140.80% 152.10% 154.00% 176.10%
UPTAKE OF METHYLENE CHLORIDE AT 30 C. SAMPLES WERE EXPOSED TO WATER PRIOR TO EXPOSURE IN VAPOR TANK

Table L5: Percent uptake of water on dry polymers at 30 C POLYMER Polymer Wt Gross wt. Wt.% 1hr Wt.% 2hr Wt.% 4hr Wt.% 6hr Wt.% 22hr Lomod B1013 1.002 10.439 -0.10% 0.10% 0.20% 0.30% 0.40% Lomod JB610 1.005 10.838 0.50% 0.60% 0.80% 1.00% 2.00% Lomod XJ1013 1.000 10.576 0.50% 0.60% 0.70% 0.80% 1.00% Lomod JE630 1.002 10.503 1.90% 2.40% 2.70% 3.10% 3.90% Lomod J613 1.002 10.608 0.20% 0.30% 0.40% 0.50% 0.60% Lomod NBE115 closed cell 15PCF 1.000 10.610 0.70% 1.10% 1.20% 1.30% 1.40% Lomod 139 60% PBT 1.006 10.677 0.40% 0.80% 0.80% 0.90% 0.90% Carbon filled NBR ME 40 1.000 10.669 0.10% 0.20% 0.40% 0.60% 1.40% Carbon filled NBR ME 40-1 PA 1.003 10.683 0.10% 0.10% 0.10% 0.30% 0.30% SBR fine brown 1.002 10.454 0.10% 0.20% 0.30% 0.40% 0.60% SBR coarse black 1.001 10.748 0.30% 0.40% 0.50% 0.70% 0.70% Carbon filled SBR coarse black -IPA 1.000 10.695 0.10% 0.20% 0.30% 0.40% 0.50% Baker rubber tire TR40 1.002 10.481 1.90% 2.40% 2.50% 2.60% 2.60% Fine activated charcoal Norit SG 1.002 10.673 6.99% 9.68% 11.98% 13.67% 21.46% Calgon activated charcoal 12v40 med. 1.002 10.692 7.09% 8.78% 14.17% 17.66% 38.22% Amberlite XAD4 1.003 10.584 -0.10% 0.00% 0.00% 0.00% 0.00% Ambertite XAD7 20-60 mesh 1.000 10.551 -0.20% 0.00% 0.00% 0.10% 0.10% Ambersorb 563 1.001 10.487 2.90% 3.90% 5.00% 5.70% 8.20% Ambersorb 572 1.000 10.649 5.40% 7.70% 12.20% 15.30% 44.10% HRG 360 1.000 10.774 0.10% 0.30% 0.40% 0.60% 0.60% HRG 370 1.001 10.673 0.00% 0.30% 0.40% 0.50% 0.60% PolySep 1.0% DVB 200-400 mesh 1.000 10.665 3.50% 4.60% 5.70% 6.60% 10.40% Poly(acrylamide) 1.002 10.652 5.19% 5.89% 8.78% 11.58% 33.43% Poly(styrene divinyl benzene) 50%DVB 1.000 10.644 4.10% 5.70% 7.60% 9.00% 20.40%
UPTAKE OF WATER ON DRY POLYMERS AT 30 C IN VAPOR TANK.

APPENDIX II: USE of TEKMAR AUTOMATIC HEADSPACE ANALYZER
A Tekmar Equilibrium Headspace Autosampler, Model 7000 equipped with a Model 7050 Autosampler, was used throughout this work. This headspace analyzer samples the headspace in a vial and injects a fixed volume directly to a GC. For this work, a Perkin Elmer 9000 Autosystem with a J & W DB-VRX column (0.32mm x 30 m, 1.8 |X film) and an ECD detector were used. Column temperature was either 60°C (batch runs) or 100°C (column runs), injector temperature 250°C, and detector temperature 450°C. Column flow rate of UPC helium was about 2.1 ml/min; vent flow was ~55 ml/min (split ratio about 27); and detector make up flow of UPC nitrogen was ~35 ml/min.
The sampling sequence for the headspace analyzer is shown in Figure HI. In standby mode, the vial (containing sorbent and CVOC) is allowed to equilibrate at the platen temperature. At a preset time, the vial is raised onto the needle and the vial pressurized. For these runs, this pressure was set at about 15 psig. The exact value is not important as long as it is not changed between standards and samples. Once the vial is pressurized, the vent valve opens and the headspace sample from the vial vents through the sample loop. After a preset time, the 6-way valve switches to put the sample loop in line with the GC, thus sending the sample through the GC column.
For sorption column runs, the headspace analyzer was used as a sampling device. The lines leading to the vent (#1) and the vial (#6) were disconnected. In their place a line from the column effluent was connected. In this way the column effluent continuously flowed through the sample loop. Through adjustment of the Tekmar operating parameters the valve position was switched at preset times, thus sending the sample of the column effluent to the GC for analysis. This procedure allowed for frequent sampling, the only limitation being the time required for the GC to run a sample (about 10 minutes total at a column temperature of 100°C).
Converting GC area into concentration in the sample vial is straightforward in this system. The sampling sequence steps are listed below along with values of the relevant variables. The net goal is an equation relating the partial pressure of the CVOC in the equilibrated vial (Pcvoc) to the area measured by the GC (Area).
For analyzing unknowns, the procedure is:
STEP 1: Fill vial with known amount of CVOC and sorbent. Vi = headspace volume = 22ml minus that occupied by sorbent and
vial used to introduce CVOC (if used)
STEP 2: Equilibrate vial at chosen temperature (T2). T2 = temperature set by user V 2 = Vi Pcvoc = partial pressure of CVOC in vial = unknown
_ p _ nCVOC,2-^^2 — JfCVOC,!1 ~ 7}
V 2
95
1-103

7000 Sampling Sequence
Via) Flow Control 4 PressunzaDon
Pressurize • Valve
Internal Vent I Vial In Platen Restndor 1 •
m— t VentVahre
Vial Flow Comroia Pressunzaoon
Pressurize Valve
^WX J^J ; j [ ' y o Q 0 o = l ^"'1° c^31 ^ " p o O 0 1 ^
Internal Vent 1 Resmoof J vaionNeedle
@t\
VUPA (Opnocal) VJJ>.R (OpaonaJ)
STANDBY • * • • • • VIAL PRESSURIZATION 44 • •
V.LP.R (Optional) V.LP.R (OptxxBI)
INJECT + + + *- L00P FILL
Carrier Gas Pressurization Gas Heated Zone
FIGURE II.l: Tekmar 7000 Sampling Sequence
96
1-104

where: ycvOQ2 = mole fraction of CVOC in vial after equilibration
P = total pressure in vial ncvoc^ = moles CVOC in headspace in vial after
equilibration R = gas constant
STEP 3: Pressurize vial to preset pressure (P3): helium gas added to vial - dilutes headspace
T 3 = T 2
V 3 = Vi P3 = fixed by user ncVOO = moles CVOC in headspace in vial (unchanged from
STEP 2), therefore: ncvoc,3 = ncvoc,2
n 3 = total moles of gas in vial: air + CVOC + added helium ncvoc,3
VCVOQ3 = n 3
STEP 4: Vent sample through sample loop (known volume, V4) to atmospheric pressure (P4)
T4 = temperature of sample loop = fixed by user V4 = volume of sample loop = 100|il for this work P4 = pressure of sample loop = atmospheric for this work ncvOCA = moles of CVOC in sample loop = moles CVOC sent to
GC, therefore: ncvoc,4 ~ Axe*
ycvOC,4 = c v o c ' 4 = unchanged from STEP 3 = ycvoC,3 n 4
To relate P c v o c t o Area:
„ _ , , _ _ „ _ _ n cvoc ,3 _ ftcvoc^ _ PcvocV2 n 4 nCVOC,4 — ycVOC,4n4 _ ycvOC,3n4 - _ n 4 ~ n 4 ~ ZZZ. ~
n 3 n 3 RT 2 n 3
RT, "l r CVOC v 2
^ R T 2 j
(vtvt) [RTJ . p
3 v 3 . canceling equal terms:
' c v o c ^ P 3 j
_ * cvoc RT4
K
97 1-105

since all the variables in the second parenthesis are held constant for all samples and standards.
Thus, since
ncvoc,4 x cvoc K
and
ncvoc,4 * A 1 * 3
and assuming T4 is held constant, then:
Pcvoc ~ Area
Thus, if standards of known Pcvoc a T e r u n / a calibration curve can be generated, provided the sample loop size, vial pressurization setting, and sample loop temperature and pressure are held constant. The partial pressure of CVOC in the equilibrated vial can be determined, independent of the vial temperature of the sample or the standard (T2).
Standards were prepared by adding a known weight of CVOC to a fixed volume of hexane. Known volumes of standard (or diluted standard) were added to a headspace vial and the vial equilibrated at 70°C (T2). Pcvoc for the standard was calculated by assuming all the moles of CVOC added to the vial were in the headspace, according to the equation:
p _ ncvocRT2 ^CVOC _ TT
V 2
This assumption was verified by running standards equilibrated at 90°C. The resulting areas were not affected, indicating all of the CVOC had evaporated. The areas obtained agreed with that expected from direct injection on the GC of liquid standards.
The operating conditions for the Tekmar Headspace Analyzer are summarized in Table HI .
Table n.2 lists the results of a typical calibration run and Figure n.2 shows the fit for these data.
98 1-106

TABLE II.l: Methods for Tekmar Headspace Analyzer
Method 1 (Standards) 3 (Samples) 2 (High Temp Isotherms)
Platen Temp 70°C 30°C 70°C Platen Equil 0.1 0.1 0.1 Smpl Equil 15.0 5.0 960 (16hrs) Vial Size 20 20 20 Mixer ON ON on Mix Time 3 5 5.0 Mix Power 3 3 3 Stabilize 0.5 20 5.0 Press Time 1.0 1.0 1.0 Press Equil 0.1 0.1 0.1 Loop Fill 0.25 0.25 0.25 Loop Equil 0.1 0.1 0.1 Inject 1.0 1.0 1.0 Valve Temp 90°C 90°C 90°C Line Temp 90°C 90°C 90°C GC Cycle Time 35 35 35 MOM off off off
Loop Size lOOul lOOul lOOul Needle Flow Rate ~55 ml/min ~55 ml/min -55 ml/min Vial Pressure Reg 15 psig 15 psig 15 psig
TABLE II.2: Typical Calibration Data for TCE Standards are TCE in hexane (ECD grade)
STD #
1
uLSTD STD (ppm w/v)
ngTCE nTCE (nmol)
Vi = V 2 T 2 PTCE (ppm)
Area STD #
1 1 58.1 58.1 0.44 22 343 0.57 304087 2 1 179 179 1.4 22 343 1.74 797911 3 5 58.1 290.5 2.2 22 343 2.83 1228355 4 3 179 537 4.1 22 343 5.23 2084673 5 2 581 1162 8.8 22 343 11.3 4073005 6 1 1790 1790 13.6 22 343 17.4 6223311 7 5 581 2905 22.1 22 343 28.3 8989553 8 4 1790 7160 54.5 22 343 69.7 22102488 9 6 1790 10740 81.7 22 343 104.6 28218420
10 8 1790 14320 109.0 22 343 139.4 35510464 11 10 1790 17900 136.2 22 343 174.3 50516120 12 4 5810 23240 176.9 22 343 226.3 off scale 13 5 5810 29050 221.1 22 343 282.8 off scale
99 1-107

TCE Calibration Apr 6: Tekmar HS Analyzer
2 0 0 T
E O. o- 150 E~ « 100 + in O 50 +
o : : ) * -O.OeO
H 2.0e7 4.0e7
area
6.0e7
FIGURE II.2: Resul t s of Typical Cal ibra t ion
100
1-108

APPENDIX III: Freundlich Fits
The following Figures show the Freundlich Fits for the sorbents of most interest in this work. Expansion of a given concentration range is shown when relevant. ForTCE:
Ambaraorb 563: Fraundllch Fit (11/93)
2.56-1 •.
? 2.06-1 .
8 1.56-1 .
s O 1.06-1 . a » 5 .06-2"
•mbtont^,»•» —
" i * ^ ^ • a ^ * ^ " ^ 85% RH
'y jpf^* «o»c
0.0050.00 100.00 150.00 200.00 250.00 300.00
PTCE(atm,ppm)
A m b a r a o r b S 6 3 : F r a u n d l l c h Fit ( 1 1 / 9 3 )
5.00 10.0015.0020.0025.00 P TCE (atm, ppm)
B P L 4 x 6 : Fraundllch Fit (11/93)
0.0 30.0100.0 150.0 200.0 250.0 300.0
P TCE (aim, ppm)
BPL 4x6: Fraundllch Fit (11/93)
1.08-1 1 g.0a-2 • . / ambient
? 8.0e-2 , J a
•S 7.0e-2 . S 6.0e-2 .
I * ^0*"*****^^ » S.Oo-2 • I ^*^~~^ 90*C o 4 .0e-2 .
a 3.0O-2 i ~ 2.0O-2 •
> * . , — ~ " " 85% RH
1 .06 -2 . O.OoO .
0. 0 20.0 40.0 60.0 80.0 100.0
P TCE (atm, ppm)
Dow XUS: Fraundllch Fit (11/93)
2.06-1 i I .Be-1 •
2 1.6e-1 . ? 1.4e-1 • 3 1.2a-1 .
g 8.06-2 .
w 4.06-2 . X * or
2.06-2 • f - - -0.060 W
0.00
.•ft*
• * • * Ambient
, . « » * "
85% RH
BO-C H
50.00 100.00 150.00 200.00 250.00
P TCE (atm, ppm)
D o w X U S : F r e u n d l i c h Fit ( 11 /93 )
4.06-2 y.
§ 2.0.-2 y g 1.56-2
S 1 .0 . -2 | j ^
V* / Ambient A'*
J 85% RH
5 0 ° - 3 if .-.-*r"'*" 0.0e0 a^*~ I
90*C
•+• • + • 0.00 50.00 100.00 150.00
P TCE (atm, ppm)
200.00
101
1-109
^•&^rj&z>-:wWF. ^ . " M ^ f •*•;•<•

DOW XUS 43493.01: Fmundllch Fit
100 200 300 400 500
PTCE In Vapor (Mm, pam)
D O W X U S 4 3 4 9 3 . 0 1 : F r a u n d i i c h Fit
1.6B-1 j
1.4S-1 -V"x • A/biont S 1.2e-1 ^ r i ^r
a 8.09-2 f
a 8.09-2 mf£ < ,<»450oC
o 6.0e-2
/ - " " " » 4.0e-2 * +* _ ^ - - « 70oC
S f S - X - S s o o c 2.0O-2
* +* _ ^ - - « 70oC
S f S - X - S s o o c
0 100 200 300 400
P TCE In Vapor (atm, ppm)
Lomod JB610: Fraundiich Fit
Ambient
^..•SOoC
70oC
•+• 100 200 300 400
P TCE In Vapor (atm, ppm)
500
Lomod JB610: Freundllch Fit
f 70% RH
100 200 300
P TCE In Vapor (atm, ppm)
TR40: Humidity Effect
P TCE In Vapor (atm, ppm)
XAD 4: Fraundiich Fit
5.0.-2-_ 4.6»-a> £ *-0*-2-£ 3.5.-2-£ 3.0. -2. g 2 .5 . -2 . o> 2.0.-2-g 1.5.-2-•- 1.0.-2. ™ 5.0.-3-
0.0.0 • 0
• A/tibiont
- Ambi.nt Fit
- N o l l Fit
50% RH
70% RH
85% RH
- 5 0 % R H Fit
- 70% RH Fit
• 85% RH H I
5.0.-2-_ 4.6»-a> £ *-0*-2-£ 3.5.-2-£ 3.0. -2. g 2 .5 . -2 . o> 2.0.-2-g 1.5.-2-•- 1.0.-2. ™ 5.0.-3-
0.0.0 • 0
A/tibiont
- Ambi.nt Fit
- N o l l Fit
50% RH
70% RH
85% RH
- 5 0 % R H Fit
- 70% RH Fit
• 85% RH H I
5.0.-2-_ 4.6»-a> £ *-0*-2-£ 3.5.-2-£ 3.0. -2. g 2 .5 . -2 . o> 2.0.-2-g 1.5.-2-•- 1.0.-2. ™ 5.0.-3-
0.0.0 • 0
« • A
A/tibiont
- Ambi.nt Fit
- N o l l Fit
50% RH
70% RH
85% RH
- 5 0 % R H Fit
- 70% RH Fit
• 85% RH H I
5.0.-2-_ 4.6»-a> £ *-0*-2-£ 3.5.-2-£ 3.0. -2. g 2 .5 . -2 . o> 2.0.-2-g 1.5.-2-•- 1.0.-2. ™ 5.0.-3-
0.0.0 • 0 100 200 300
P TCE In Vapor (aim, ppm)
« • A
A/tibiont
- Ambi.nt Fit
- N o l l Fit
50% RH
70% RH
85% RH
- 5 0 % R H Fit
- 70% RH Fit
• 85% RH H I
102
1-110

ForCH2Cl2:
Fraundllch Flf. BPL4x6
0.35 •
0.30 • • | 0.25 •
Amble n t ^ ^ ^ l g 0.20 •
Amble n t ^ ^ ^ l
g 0.15 •
a 0.10 .
0.05 .
0.00 I
mf flO*C __
^ J e * - 1 ' 85%RH JT»
C 2000 4000 6000 8000
PUC(«1m,ppm) 10000
Fraundllch Fit: Ambersorb 563
5000 10000 P MC («tm, ppm)
15000
Fraundllch Fit: DowXUS Lomod JB610
0.30 -r
0.25 • open-large particles ^
, doted- amall particles ^y* 1.4e-2n • -^r m „ 1 . 2 e - 2 .
1 0.20 • Amblent^^ c 5 1.0e-2- y *
B w ^r * 0.15 • S 8.0e-3- f n " ' " S^ 85%HH
™ 6 . 0 e - 3 -f
0 ™ 6 . 0 e - 3 - f a o. io • J f t l n A - - ^ ^ * o %f a 3 4 . 0 e - 3 - f
0.05 • *jT~M^^^ .4 8 0 ° C 0 1 2 . 0 e - 3 - - V ^
ify^ji • ' t * "" O.OeO • O.OeO •
0 5000 10000 15000 C ) 5000 10000 15000
PMC(dm,ppm) P MC (atm, ppm)
TR40: Ambient
5.00-3 -, • 4.5e-3-
• £ 4.0e-3-2 3.5e-3-o 3.06-3 -„ 2.56-3.
5 2.0e-3-a 1.56-3-
^r • 5 2.0e-3-a 1.56-3-oi 1.06-3- • ^r
5.0e-4-
0 2000 4000
P MC (atm, ppm)
6000
103
1-111

APPENDIX IV: AQUEOUS PARTITION COEFFICIENTS Table IV.l: Equilibrium Partitioning Coefficients Describing the Partitioning of TCE and Methylene Chloride between Aqueous and Polymer Phases at 25°C
TCE and MC aqueous concentrations were varied between 0.10 and 25 mg/L
methylene TCE chloride
polvmer polvmer class Kg KB Lomod J613 polyether/polyester block copolymer 362 16 Lomod J2513 polyether/polyester block copolymer 329 15 Lomod XJ1013 polyether/polyester block copolymer 305 20 Lomod JB610 polyether/polyester block copolymer 212 165 Lomod JE630 polyether/polyester block copolymer 149 148 Lomod JB1410-2000PEG polyether/polyester block copolymer 824 19 Lomod JB1410-1000PEG polyether/polyester block copolymer 718 17 Lomod B1013 polyether/polyester block copolymer 298 36 Lomod B2013 polyether/polyester block copolymer 295 37 Lomod EX10-1000PEG polyether/polyester block copolymer 41 -Lomod EX10-2000PEG polyether/polyester block copolymer 241 -Lomod EX1O4000PEG polyether/polyester block copolymer 55 -Hytrel4056 polyether/polyester block copolymer 368 24
DowXUS-43493.01 macroporous polystyrene adsorbent 26,300 259 DowXUS-40323.00 macroporous polystyrene adsorbent 1571 81 Ambersorb 563 carbonaceous adsorbent 6170 4561 Ambersorb 572 carbonaceous adsorbent 152,000 2942 Amberlite XAD-2 macroporous polystyrene adsorbent 865 100 Amberlite XAD-4 macroporous polystyrene adsorbent 2496 209 Amberlite XAD-7 macroporous polyacrylate 125 27 Pebax2533A polyether-polyamide block copolymer 414 59 PolySep 12% DVB crosslinked polystyrene, 12% divinylbenzenel510 38 PolySep50%DVB crosslinked polystyrene, 50% divinylbenzene3210 99
poly(propylene) poly(propylene), AmocolO-4018 899 11 poly(l-butene) poly(l-butene) 70 5 polyethylene HD polyethylene, high density 10 3 Vestenamer 8012 polyoctenamer rubber 210 7 poly(vinyl acetate) poly(vinyl acetate), low MW 55 4
Santoprene 201-73 polypropylene-EPDM rubber blend 54 18 Vyram 6101-70 polypropylene-natural rubber blend 38 7 Geolast 701-70 polypropylene-NBR rubber blend 349 46
rubber tire tread, TR-40 styrene-butadiene rubber 155 131 carbon-filled NBR, ME40nitrile-butadiene rubber 159 71
Estane 58300 polyurethane-polyether thermoplastic 261 15 Estane 58881 polyurethane-polyether thermoplastic 297 50 PBT polybutylene terepthalate, Valox 315 53 2 PBT polybutylene terepthalate, Aldrich 13 6 nylon 6,6 Zytel 101L 13 6 HRG 370 ABS sryrene-butadiene-acrylonitrile polymer 403 98 Siltem2000 silicone polyimide 53 189 Noryl PX0888 PPO-polystyrene blend 66 11
activated carbon Calgon, granular medium 38,400 1137 activated carbon Sorbonorit-B-2, pellet; 2 mm 61,700 1309
104
1-112

Organic Sponges for Cost-Effective CVOC Abatement
Part II: Bio degradation of Methylene Chloride and Trichloroethylene
n-i
'^•••:j'^w"^s£%m-r^


Part II Summary: Biodegradation of Methylene Chloride and Trichloroethylene
This section of the report describes efforts to develop microbial destruction technologies for the treatment of aqueous-phase methylene chloride or trichloroethylene (TCE). Our original goal was to couple aqueous microbial destruction technology to the regeneration step of the vapor-phase sorption process, either through water or steam regeneration of the loaded bed. The microbial technologies are also applicable to the direct treatment of contaminated ground water or industrial process wastewater.
Microbial degradation was accomplished in a biological fluidized-bed reactor (FBR), a biofilm-based configuration which we feel is both reliable and cost-effective. Microorganisms attach naturally to an inert support such as sand or granular activated carbon (GAC). An upward flow of aqueous feed/recycle expands or "fluidizes" the biomass/ carbon bed. This approach allows high biomass concentrations, fast hydraulic throughput rates, and steady-state operation with respect to biomass. In GAC-based systems, the GAC acts both as a support for biomass growth and as an adsorbent to protect against excessive contaminant loadings. FBRs are gaining increased acceptance for biodegradation-based waste treatment; there are over 80 industrial and municipal FBR installations in North America and Europe for a variety of biological waste treatment applications.
Chapter 1 describes the development of methylene chloride biodegradation technology using an FBR configuration. The first phase of this effort demonstrated that attachment of fresh activated sludge to GAC and subsequent acclimation of the biomass to methylene chloride were both successful. By gradually increasing the methylene chloride loadings, it was determined that the maximum degradation capacity of the system ranged from 1.2 to 1.6 g/L-hr, and that this degradation rate was limited by oxygen transfer rather than intrinsic microbial kinetics. The FBR system was operated successfully in continuous mode for 2-1/2 months. Steady-state data was collected for process scale-up and cost analyses.
A second research phase demonstrated an aggressive start-up protocol in which a continuous feed of aqueous methylene chloride was initiated within 24 hours of biomass inoculation. Although breakthrough of methylene chloride was initially observed, effluent methylene chloride concentrations became non-detectable after only 10 days of operation. The degradation capacity of the bioreactor system surpassed the previous maximum within two weeks of startup.
ES-1 n-3

Operation of the fluid bed at a 50% greater fluidization velocity resulted in higher biodegradation rates due to increased oxygen transfer capacity. After only four weeks of operation, the fluid bed reactor had attained a methylene chloride loading rate in excess of 2 g/L-hr with no detectable methylene chloride in the reactor effluent. The biodegradation rate based on inorganic chloride recovery was 53% higher than had been attained during the initial investigation.
Methylene chloride biodegradation represents an environmentally acceptable approach that results in the removal and destruction of methylene chloride to innocuous products such as CO z, inorganic chloride, and biomass. We achieved significant biodegradation of methylene chloride using a mixed culture of microorganisms which are naturally occurring in an industrial activated sludge system. A series of cost analyses demonstrated that the process is cost-effective. Although this study focused on the coupling of biodegradation to vapor-phase sorption, the biodegradation process has potential application to the direct treatment of ground water or industrial process wastewater contaminated with methylene chloride. We are actively pursuing opportunities to implement the methylene chloride biodegradation process within GE.
Due to the unexpected early success of the methylene chloride biodegradation effort, additional research was conducted to determine if TCE could also be successfully degraded in a biological fluidized-bed reactor.
Chapter 2 describes laboratory efforts to isolate and characterize a TCE-degrading microorganism from industrial activated sludge. The organism selected for further study required phenol both as a growth substrate and as an inducer of the TCE-degrading enzyme system. A number of experiments were conducted to determine the suitability of the selected organism for further investigation in the FBR.
Chapter 3 describes efforts to biodegrade TCE in the fluidized-bed bioreactor using the selected phenol/TCE-degrading microorganism. The approach taken was similar to the methylene chloride biodegradation study reported in Chapter 1.
Operation of the bioreactor with a feed phenol:TCE mass ratio of 1:1 resulted in ~30% biodegradation of the feed TCE. Despite the relatively low biodegradation efficiency, this result was encouraging since the phenol:TCE mass ratio and the retention time had not yet been optimized.
Preliminary cost estimates performed using idealized performance predictions revealed that the TCE biodegradation process was relatively expensive (compared to methylene chloride biodegradation) due to the high chemical oxygen demand (COD) associated with phenol. TCE biodegradation may ultimately prove useful for remediation applications, although the current
ES-2 H-4

coupling of aqueous-phase TCE biodegradation with the vapor-phase sorption process was determined to be uneconomical.
Although further effort would be required in order to develop a commercially viable TCE biodegradation process, the work conducted during this study has achieved the following results:
•Naturally occurring microorganisms were evaluated for their ability to degrade TCE. Laboratory optimization studies resulted in the identification of a phenol:TCE degrading microbe suitable for scale-up in a GAC-fluid bed bioreactor.
•Non-optimized continuous bioreactor studies resulted in ~30% biodegradation of TCE. The system performance could most likely be improved by optimizing phenohTCE ratio and retention time.
•Microbiological assays revealed that the TCE-degrading competency of the selected microorganism remained strong even after five weeks of continuous culture in a non-sterile bioreactor environment. Long-term microbial survival is a critical aspect of system performance.
•Detailed cost analyses will serve as valuable tools for evaluating future applications and process marketability.
Based on these results, we recommend that future development activities be directed towards the co-optimization of the phenolrTCE mass ratio and the retention time. Since the presence of the sorptive GAC tends to mask changes in TCE/phenol feed concentrations, a non-sorptive biomass support such as sand should be used. A design-of-experiments protocol would accelerate the determination of optimal design parameters.
ES-3 n-5


TABLE of CONTENTS
Part II Summary: Biodegradation of Methylene Chloride and Trichloroethylene ES-1
CHAPTER 1: BIODEGRADATION OF METHYLENE CHLORIDE IN A GAC-FLUID BED BIOREACTOR 1
1.1 Introduction 1 Biochemistry 2 Background 3 Fluidized-Bed Bioreactor Technology 3 Study Objective 4
1.2 Experimental 6 GAC-Fluid Bed Bioreactor 6 Biomass Inoculum 7 Methylene Chloride Analysis 9 Inorganic Chloride Analysis 9 Dissolved Oxygen Measurements 9 Biomass Measurements 9
1.3 Results (Run I) 10 Inoculation/Acclimation 10 Continuous Operation 10 Steady-State Analysis/Mass Balances 12 Bed Profiles 18
1.4 Results (Run H) 23 Inoculation/Acclimation 23 Continuous Operation 24
1.5 Cost Analyses 28 1.6 Discussion and Conclusions 30
CHAPTER 2: LABORATORY STUDIES ON THE BIODEGRADATION OF TRICHLOROETHYLENE 33
2.1 Introduction 33 2.2 Experimental 34 2.3 Results 35 2.4 Discussion and Conclusions 40
CHAPTER 3: BIODEGRADATION OF TRICHLOROETHYLENE IN A GAC-FLUID BED BIOREACTOR 43
3.1 Introduction 43 3.2 Experimental 43
GAC-Fluid Bed Bioreactor 43 Biomass Inoculum 44
- l -
n-7

TCE Analysis 44 Inorganic Chloride Analysis 44 Dissolved Oxygen Measurements 44 Microbiological Analysis 45
3.3 Results 45 3.4 Cost Analyses 51 3.5 Discussion and Conclusions 53
REFERENCES 57
APPENDIX I: Steady-State Data (MeCl2 Run I) 61 APPENDIX H: Fluid Bed Data and Sludge Age (MeCl2 Run I) 63 APPENDIX IE: Microbial Stoichiometry (MeCl2 Run I) 67 APPENDIX TV: Operating Data 69 APPENDIX V: Biodegradation Cost Analyses 83
-u-n-8

LIST of TABLES
1.1 Bacterial Nutrients 7 1.2 Initial Operation of Fluid Bed Bioreactor in Batch Mode 11 1.3 Parameters Required for Process Scale-Up 16 1.4 Summary of Steady-State Parameters 17 1.5 Effluent Biomass Concentrations During Steady-State Operation 18 1.6 Description of MeC12 Waste Streams Chosen for Cost Analyses 29 1.7 Summary of Methylene Chloride Biodegradation Cost Analyses 30 1.8 Summary Comparison of Selected Parameters for Rims I and II 31
3.1 Description of TCE Waste Streams Chosen for Cost Analyses 53 3.2 Summary of Trichloroethylene Biodegradation Cost Analyses 54
1.1 Chloride Mass Balance 61 1.2 Sodium Hydroxide Mass Balance 61 1.3 Oxygen Mass Balance 62
n.l Fluid Bed Biomass Profile 63
n.2 Fluid Bed Profile Data 65
in.l Microbial Stoichiometry 68
rV.l Operational Data: Methylene Chloride Run I 70 rv.2 Operational Data: Methylene Chloride Run n 76 rV.3 Operational Data: Trichloroethylene 79 V.l Index to Biodegradation Cost Analyses 83
-111-
n-9

LIST of FIGURES
1.1 Methylene Chloride Biodegradation Pathway 2 1.2 Schematic of GAC-Fluid Bed Bioreactor 5 1.3 Schematic of Bioreactor Feed System 8 1.4 Methylene Chloride and Inorganic Chloride
Concentrations During Run I 13 1.5 Temperatur e and pH During Run I 13 1.6 Recycle Ratio and Dilution Rate During Run I 14 1.7 Bed Height and Methylene Chloride Feed Rate During Run I 14 1.8 Column Dissolved Oxygen Drop and Oxygen Supply
Rate During Run I 15 1.9 Sodium Hydroxide Consumption During Run I 15 1.10 Steady-State Mass Balance During Run I: Methylene Chloride 19 1.11 Steady-State Mass Balance During Run I: Inorganic Chloride Ion 19 1.12 Steady-State Mass Balance During Run I:
Column Dissolved Oxygen Drop 20 1.13 Steady-State Mass Balance During Run I: Oxygen Supply Rate 20 1.14 Steady-State Mass Balance During Run I: Sodium Hydroxide 21 1.15 Steady-State Fluid Bed Profile During Run I 22 1.16 Methylene Chloride and Inorganic Chloride
Concentrations During Run II 24 1.17 Comparison of Methylene Chloride Loading Rates
During Runs I and II 25 1.18 Temperatur e and pH During Run II 26 1.19 Recycle Ratio and Dilution Rate During Run II 26 1.20 Bed Height and Methylene Chloride Feed Rate During Run II 27 1.21 Column Dissolved Oxygen Drop and Oxygen Supply
Rate During Run H 27 1.22 Sodium Hydroxide Consumption During Run II 28
2.1 Effect of Initial Inoculum Size on TCE Biodegradation in Vials with Limited Head-Space 37
2.2 Effect of Starting Inoculum Size on TCE Biodegradation in Vials with/without Oxygen Limitation 38
2.3 Effect of Initial Concentration on TCE Biodegradation. 38 2.4 Effect of Phenol Concentration on TCE Biodegradation 39 2.5 Optimal Phenol Concentration 39 2.6 Effect of Inoculum Size and Phenol Concentration on
TCE Biodegradation in Vials without Oxygen Limitation 41
-IV-
n-io

3.1 TCE and Inorganic Chloride Concentrations 3.2 Phenol concentrations 3.3 Feed PhenolrTCE Mass Ratio 3.4 Bed Height and Phenol/TCE Feed Rates 3.5 Temperature and pH 3.6 Recycle Ratio and Dilution Rate 3.7 Column Dissolved Oxygen Drop and
Sodium Hydroxide Consumption
-v-n-n


CHAPTER 1: BIODEGRADATION OF METHYLENE CHLORIDE IN A GAC-FLUID BED BIOREACTOR
1.1 Introduction
Methylene chloride is widely used as a solvent in industry due to its properties of high solvency, low inflammability, and low corrosiveness. For example, methylene chloride is often used in degreasing operations, paint stripping, and as a solvent in various chemical and polymer syntheses. In 1991, the demand for methylene chloride was 400 million pounds. Much of this methylene chloride is lost into the environment due to the low boiling point and high vapor pressure of methylene chloride. Traditional approaches to methylene chloride removal such as steam stripping, air stripping/carbon adsorption, or incineration cannot economically attain the low residual levels of methylene chloride that will ultimately be required. New technology is therefore needed for the cost-effective elimination of methylene chloride from contaminated wastewaters.
Biological approaches have long been used to treat a variety of municipal and industrial waste streams due to the ability of naturally occurring microorganisms to degrade many organic contaminants to biomass and C0 2
under mild conditions. The benefits of microbial technology for methylene chloride treatment are numerous:
•Environmentally acceptable approach to wastewater cleanup - removal and destruction of methylene chloride to biomass, C0 2 , and inorganic chloride.
•Lower energy useage- greatly reduced energy expenditure compared to steam stripping or incineration, since microbes can reduce methylene chloride concentrations in wastewater to <1 ppm under mild conditions.
•Reduced capital investment and operational costs - compared to alternative approaches such as steam stripping, air stripping/carbon adsorption, and incineration.
•Readily adaptable system - effective low-cost approach can be used to treat contaminated groundwater, industrial process wastewater, or contaminated vapor-phase waste streams (following capture via sorption).
-1-n-13

DCM dehalogenase
CH2CL2 ^ — » GS-CH2CL ^ - . » GS-CH2OH _ CH 20 + GSH
GSH HCI H 2 0 HCI
Figure 1.1 Methylene Chloride Biodegradation Pathway.
Biochemistry
Bacteria capable of using methylene chloride (MeCl 2 / DCM, dichloromethane) as sole carbon and energy source for growth can be found in sewage sludge or soil exposed to methylene chloride for extended periods of time (Klecka; Rittman and McCarty; Stucki et al., 1981a). Pure cultures of methylene chloride-degrading bacteria have been isolated from these sources, and the isolates have been identified as facultative methylotrophs of the genera Pseudomonas, Hyphomicrobium, and Methylobacterium (Brunner et al.; LaPat-Polasko et al.; Stucki et al., 1981b; Galli and Leisinger, 1985; 1988). In addition to these aerobic methylene chloride-degraders, there have been several reports of methylene chloride biodegradation under anaerobic conditions (Battacharya and Parkin; Freedman and Gossett; Davis and Madison). However, pure cultures capable of degrading DCM under anaerobic conditions have not been reported.
Under aerobic conditions, DCM dehalogenase catalyzes the conversion of methylene chloride to formaldehyde and inorganic chloride (Stucki et al., 1981b), as shown in Figure 1. DCM dehalogenase (dcmA) is a glutathione-dependent enzyme with a subunit molecular weight of 37,000. Two classes of dcmA activity have been reported (Scholtz et al.). In class A, the dcmA protein is highly conserved between species, and the degree of sequence similarity between genera suggests that this gene may have been distributed by horizontal transfer (Kohler-Staub et al.). Unfortunately, the specific activity of the class A dehalogenase is extremely low at ~0.15 mmoles DCM degraded/mmole dehalogenase-sec. The class B dcmA protein has a specific activity nearly six fold higher than the class A enzymes and bears significant differences in amino acid composition (Scholtz et al.). Both dehalogenases are inducible by methylene chloride and can account for as much as 20% of the total soluble cell protein.
The class A DCM dehalogenase isolated from Methylobacterium sp. DM4 was the first bacterial dehalogenase to have been cloned and thereby sequenced in its entirety (LaRoche and Leisinger). The sequence data shows a striking sequence homology (38-51%) between DCM dehalogenase and the eucaryotic glutathione S-transferases. However, several key differences exist. First, the bacterial DCM dehalogenase is a hexamer with identical 37,000 mw subunits, as compared to the dimeric structure of eucaryotic dehalogenases with 23,000-
-2-n-14

26,000 mw subunits. Secondly, DCM dehalogenase does not degrade 1-chloro-2,4-dinitrobenzene, a substrate that can be attacked by all known eucaryotic GSH S transferases.
Background
Previous laboratory research on the aerobic biodegradation of methylene chloride has been conducted at GE Corporate Research and Development (Spivack et al.). Key results are summarized as follows:
•Bacterial sludge from an industrial wastewater treatment plant was induced to consume methylene chloride in shake flasks. The maximum activity levels were above 1000 ppm/hr.
•This bacterial activity was transferred to a 1-liter continuous-stirred reactor (CSTR). Steady-state operation at a feed rate of 150 mg/hr methylene chloride and 29 ml/hr total aqueous flow resulted in effluent methylene chloride in the 1-10 ppm range. A relatively slow microbial growth rate (doubling time of 20 hr at 30°C) implied a minimum retention time in the reactor of about 30 hr. Therefore it was concluded that a practical reactor configuration must involve immobilization of the biomass such that the volumetric reaction rates can be increased by at least a factor of 10.
•The next step was operation of trickling bed reactors. Methylene chloride (100-1000 ppm), nutrients, and air were delivered to the top of a bed of granular activated carbon that had been inoculated with the methylene chloride-degrading bacterial sludge. Experiments aimed at measuring maximum activity levels reproducibly attained biodegradation rates of 1 g MeCl2/L-hr. At a retention time of 20 minutes, a feed of 200 ppm methylene chloride was reduced to sub-ppm levels. While these results were promising, the trickling bed reactor configuration was prone to biomass fouling and slow to attain steady-state operation.
Fluidized-Bed Bioreactor Technology
Methylene chloride, which is the most water soluble chlorinated aliphatic compound (13.2 g/L at 30°C), exhibits a low boiling point (40.1°C) and a high vapor pressure (362.3 mm Hg at 20°C) which make it particularly susceptible to evaporative losses. This, in combination with the apparent low growth rate of methylene chloride-degrading bacteria, dictates that the successful reactor design must maintain a high concentration of the appropriate biomass and eliminate potential evaporative losses.
-3-n-i5

One such reactor configuration which is gaining increasing acceptance for wastewater treatment is the biological fluidized-bed reactor (Sutton and Mishra). This approach has several advantages compared with other microbial film bioreactors, including lower shear forces, control of biofilm thickness, no unmixed zones and insensitivity to clogging (Galli). Since 1981 over 80 commercial fluidized-bed bioreactors have been installed for municipal and industrial wastewater treatment throughout North America and Europe (Sutton and Mishra). Typical applications include denitrification of nitrified wastewater, removal of petroleum hydrocarbons from contaminated ground water, anoxic treatment of chlorinated phenols, and aerobic treatment of trace organics (Sutton and Mishra).
A schematic of a fluidized-bed bioreactor is shown in Figure 1.2. The contaminated wastewater to be treated flows upward through a long vertical cylinder. Heterogeneous biocatalyst particles (i.e., microorganisms adsorbed to particulate supports such as sand or granular activated carbon) are suspended by drag forces exerted by the rising liquid. Entrained biocatalyst pellets are released at the top of the tower as a result of reduced liquid drag at the expanding cross section and fed back into the tower via gravity. Frequently, a shear mechanism at the top of the column is used to remove excess biomass from the particulate supports such that a steady-state biomass concentration with a desirable average biofilm thickness is maintained.
Granular activated carbon (GAC) is often used as the biomass support. In this case the GAC acts both as a support for biomass growth and as an adsorbent to protect against shock loadings. The combined mechanisms of biodegradation and carbon adsorption lead to a consistently clean effluent stream independent of fluctuations in inlet concentration. Two major advantages of the biological fluidized-bed reactor include:
•The GAC particles provide a very high surface area for biomass attachment. Fluid bed reactors typically contain anywhere from 5 to 10 times greater biomass per unit volume than found in activated sludge systems. This results in a high-rate treatment system in a relatively small reactor volume.
•Oxygen supply is provided in a closed loop which eliminates stripping losses. This aspect is critical when treating highly volatile organics such as methylene chloride.
Study Objective
The objective of this study was to determine whether a GAC-fluid bed reactor configuration could be used for methylene chloride biodegradation, and to collect steady-state data needed for process scale-up and cost analyses. The overall objective can be broken down as follows:
-4-n-i6

Effluent
Media Abrasion Pump I ( E±J
"©
Fluid Bed Reactor
Bubble Contactor Loop • Oxygen
H J = Nutrients Process Waste Stream
NaOH
I_L , . . . Fluidization -H—LI Pump
Figure 1.2 Schematic of GAC-Fluid Bed Bioreactor.
•Study the use of a fluidized-bed reactor to overcome the limitations of a trickling bed reactor (i.e., fouling, lack of steady-state operation) for biodegradation of methylene chloride using a consortium of microbes derived from wastewater sludge.
•Test methods of bioreactor inoculation to determine which would bring up methylene chloride-degrading activity in the least amount of time.
•Determine the maximum degradation capacity of the fluidized-bed bioreactor system.
•Collect steady-state data for scale-up and cost analyses.
The work was conducted during two research phases. The first research phase (Run I) successfully addressed all four objectives. A second research phase (Run II) was subsequently conducted to examine methods of obtaining enhanced system performance.
-5-n-17
; /-.^rv.T" ,?mm~?i&&%m&mznz&£~ ;w$'

1.2 Experimental
GAC-Fluid Bed Bioreactor
The GAC-fluid bed bioreactor used for this study was supplied by Envirex Ltd. (Waukesha, WI). The system consisted of a vertical column constructed of 2" diameter clear PVC with a working bed height of 8 feet (corresponding to a maximum bed volume of 4.7 liters; see Figure 1.2). Above this was a 3 foot expansion section of 3" diameter clear PVC. Approximately 3 liters of granular activated carbon (a blend similar to Calgon Filtrasorb 300, 10x30 mesh) was added to the reactor such that the settled carbon bed height was 50-55". A Watson-Marlow 302S peristaltic pump was used to circulate a combined feed/recycle stream through the column at a flow rate of 1.125 L/min (corresponding to a flux rate of 13.6 gpm/ft2). Under these flow conditions the non-inoculated carbon bed expanded by 20% to a height of 66". Following biomass inoculation and growth, control of maximum bed height was accomplished via a shear mechanism. Liquid effluent was withdrawn from the 3" diameter expansion section above the active bed and re-injected horizontally at the desired maximum bed height (89"). The resulting shear was sufficient to remove excess biomass from GAC particles; the sloughed biomass left with the liquid effluent while the naked GAC particles returned to the active bed via gravity. Oxygenation was achieved by injecting bottled oxygen into a downflow bubble contactor mounted in a piggy-backed liquid recycle loop. This approach provided inlet dissolved oxygen concentrations as high as 40 mg/L with negligible stripping losses of methylene chloride. Oxygen flow to the reactor was controlled manually and monitored by an Aalborg GFM17 mass flow meter. pH was maintained at 7.0±0.5 by feeding NaOH on demand. The pH control system utilized a Cole-Parmer Chemcadet pH meter/controller and a Great Lakes combination pH electrode mounted in the primary recycle stream. Bioreactor temperature was monitored but not controlled.
During the second run (Run II), a larger GAC particle size was used (Calgon BPL 6x16 mesh) to allow operation of the fluid bed at a 50% higher fluidization velocity. The Watson-Marlow 302S peristaltic pump was used to circulate a combined feed/recycle stream through the column at a flow rate of 1.64 L/min (corresponding to a flux rate of 19.8 gpm/ft 2). Under these flow conditions the non-inoculated carbon bed expanded by 22% from an initial settled height of 55" to an expanded height of 67".
A biomass inoculum was added to the bioreactor along with a batch addition of methylene chloride and bacterial nutrients. The system was initially operated in batch mode (100% recycle) to allow for biomass attachment to the GAC particles.
-6-n-18

Table 1.1 Bacterial Nutrients (modified from Spivack et al.)
Compound Weight Concentration Molar Concentration
(NH4)2S04 lg/L 15.15 mMNRt MgS04-7H20 0.1 g/L 0.406 mM Mg CaS0 4-2H 20 0.018 g/L 0.105 mMCa K 2HP0 4 0.565 g/L 3.25 mM KH2PO4 0.235 g/L 1.75 mM
FeS04-7H20 0.5mg/L 1.80 uM Fe ZnS0 4-7H 20 0.4mg/L 1.39 uMZn MnS04-4H20 0.02 mgL 0.090 JIM Mn H3BO3 0.015 mg/L 0.24 uMB NiCl2-6H20 0.01 mgL 0.042 uM Ni EDTA 0.25 mg/L CoCl2-6H20 0.05 mg/L 0.21 uM Co CuCl2-2H20 0.005 mg/L 0.029 iM Cu
Fe-NaEDTA-2H20 0.5 mg/L 1.24 uM Fe and Na NaMo04-2H20 0.2 mg/L 0.91 |iM Mo and Na
A continuous feed of aqueous methylene chloride was introduced to the bioreactor along with bacterial nutrients. A saturated aqueous-phase was maintained in contact with neat methylene chloride in a thermostated 5-gallon carboy (25°C). The saturated phase was combined with the bacterial nutrient solution (Table 1.1), which was fed from a 400-liter storage tank; the desired feed flow rate and methylene chloride concentration were obtained by balancing the flow rates of the methylene chloride and nutrient pumps. A schematic of the feed system is shown in Figure 1.3.
Biomass Inoculum
Previous research conducted at GE-CRD indicated that WWTP activated sludge collected from a GE-Plastics manufacturing facility (Mt. Vernon, IN) could be induced to biodegrade methylene chloride (following a suitable acclimation period) at rates comparable to those observed with a patented methylene chloride-degrading microorganism (Celgene Hyphomicrobia CEL5002; Spivack et al.). One advantage of using sludge as the inoculum is the ready access to the fairly large amounts needed to seed a full scale bioreactor. In addition, a mixed culture derived from activated sludge could, if properly induced, degrade a wide variety of compounds with a single inoculation.
-7-n-19

A A A A A A
FMI Pump
Up to 40.7 mL/min
Nutrient Feed Reservoir -100 gallon (375 L) tank -IX nutrient solution GAC-
Upto Up to pH7
00 I
s Saturated aqueous MeC12 »>
Neat MeC12
^
KWWM Magnetic Stirplate
LC Pump or FMI pump
Up to 8 mL/min 19,450 mg/LMeC12
MeC12 Feed Reservoir -5 gallon (19 L) glass carboy -Temp, control consisted of:
internal SS coil external copper coil wrap 1" fiberglass insulation recirulator Temp, bath at 25 deg-C
-Sat. aqueous phase replenished with sat aqueous from a second reservoir
Figure 1.3 Schematic of Bioreactor Feed System

Methylene Chloride Analysis
Aqueous-phase methylene chloride was analyzed by direct injection onto a gas chromatograph coupled to a flame-ionization detector (FID) equipped with either of two GC columns. Samples from the first phase of the methylene chloride biodegradation study were analyzed using a DB-624 macro-bore capillary GC column (J&W Scientific) with a detection limit for methylene chloride of 1 ppm. Samples from the second research phase were analyzed using a Tenax 60/80 GC column with a detection limit for methylene chloride of 5 ppm. Upon removal from the bioreactor, aqueous samples were immediately filtered through 0.2 um cellulose filters to remove active biomass. Since methylene chloride is highly volatile and tends to escape over time even from tightly-sealed vials, all analyses were performed within 24-hours of sample collection following intermediate storage at 4°C. During collection of steady-state data for scale-up and cost analyses, samples were filtered immediately and analyzed within one hour of collection.
Inorganic Chloride Analysis
Inorganic chloride analysis was accomplished via ion chromatography using a Waters IC-Pak Anion HR 4.6 x 75 mm column. The injection volume was 10 |il with a mobile-phase flow rate of 1 ml/min. The HPLC system consisted of a Waters 510 pump, a Waters 712 Intellagent Sample processer, and a Waters 431 conductivity detector. Prior to analysis, samples were filtered through 0.45 mm cellulose filters and diluted 1:10 with deionized water.
Dissolved Oxygen Measurements
Influent and effluent dissolved oxygen (D.O.) measurements were conducted using a New Brunswick stainless-steel D.O. probe and a Cole-Parmer Model 01972-00 D.O. meter. The probe was calibrated in oxygen-saturated distilled water prior to each measurement. Effluent measurements were obtained by suspending the D.O. probe in the bioreactor column above the maximum bed height. Influent measurements were obtained by removing influent grab samples immediately upstream of the column inlet. Bioreactor D.O. bed profiles were obtained by removing liquid grab samples from four sample ports distributedvertically along the column length.
Biomass Measurement
Effluent biomass concentrations were determined via TSS/VSS measurement (total suspended solids, volatile suspended solids; Standard Methods, 18th Ed. - Methods 2540D and 2540E).
-9-n-21

Bed biomass concentrations were determined using a modified TSS procedure (P.M. Sutton, personal communication). Biofilm-coated carbon samples were removed from the bioreactor and dried to constant weight at 105°C The biomass was digested overnight with NaOH. The NaOH was decanted, the carbon was rinsed several times with distilled water, then the clean carbon was again dried to constant weight at 105°C Biomass was calculated as the weight difference between the non-digested and digested samples.
1.3 Results (Run I)
Inoculation / Acclimation
During the early planning stages of this work it was recognized that inoculation of the bioreactor with fresh non-acclimated sludge would be desirable, since this approach eliminates the need for a separate, potentially costly, pre-acclimation step. The bioreactor was therefore inoculated with ~1 liter of fresh non-acclimated GEP-Mt. Vernon WWTP sludge, along with bacterial nutrients, methylene chloride (312 ppm), and methanol as a supplemental carbon source (372 ppm). The system was operated in batch mode (100% recycle) for 22 days with periodic additions of methylene chloride, methanol, and nutrients (Table 1.2). During this period, methanol additions were gradually eliminated while methylene chloride additions increased to ~0.04 g/L-hr. Visible biofilm growth on the GAC particles was observed, indicating successful biomass attachment. Sodium hydroxide consumption rates gradually increased to 270-450 mmoles/day, providing circumstantial evidence for ongoing methylene chloride biodegradation. Oxygen consumption gradually increased as well, indicating general aerobic biological activity.
While the 22-day batch operation period provided an opportunity to monitor biomass attachment and acclimation to methylene chloride, the length of this acclimation period was thought to be excessive and generally unsuitable for industrial application. In addition, the initial use of methanol as a supplemental carbon source during acclimation may not be required, and could in some cases be detrimental (Spivack et al.). These issues were subsequently addressed during the second research phase (Run II), as discussed later in this report.
Continuous Operation
Following the 22-day batch operation period, a continuous feed of aqueous methylene chloride and bacterial nutrients was introduced. The initial methylene chloride loading rate was 0.25 g/L-hr (1000 ppm methylene chloride at a flow rate of 14.4 L/day). This rate was gradually increased throughout 55 days of continuous operation until breakthrough was observed at a loading rate of 1.6 g/L-hr (Figure 1.4). It is believed that this breakthrough occurred due to oxygen limitation conditions within the bioreactor system. The loading rate was
-10-n-22

Table 1.2 Initial Operation of Fluid Bed Bioreactor in Batch Mode.
MeCh MeOH Total MeCte in M e O H in Time Added Added NaOH Reactor Reactor (days) (ppm)1 (ppm)1 (3N; ml) 2 (ppm)3 (ppm)4
0.00 312 372 H 281 0.04 - 196 0.71 556 207 - 316 1.02 556 207 - 350 1.58 + 190 1.96 1000 200 + 153 3.06 500 200 + 49 3.88 1000 100 - 15 4.88 110 - -
6.96 200 100 _ _ 7.92 535 - -9.00 1000 100 810 - -
10.77 1030 _ _ 11.79 520 595 1055 - -12.81 1270 - -13.77 1330 - -14.98 1000 100 1380 + + 15.71 1000 100 1545 - -16.79 1000 100 1650
18.71 717 100 2035 _ .. 19.92 1000 50 2315 - -21.00 1000 50 2465 - -21.96 1000 2555 - -22.96 2635 - -
lppm=mg/l based on total system volume of 12.7 L ^accumulated total NaOH (ml of 3 N) added to system 3(3C detection limit for MeCl2=5 ppm. Plus (+) indicates low-level (non-quantifiable) detection of MeC12 (5-10 ppm). Note that MeCl2 adsorbs to activated carbon; thus the absence of MeCl2 in reactor samples is not necessarily indicative of biodegradation
^MeOH consumption is directly observable since MeOH does not adsorb well to activated carbon
-11-
H-23
'"^rr^rTTT^?."..'-' v1? 7:^f^^;-^L;^W'm^^^^M^^^^m^r^z''r -^;

therefore reduced to 1.2 g/L-hr (2018 ppm methylene chloride at a flow rate of 65.4 L/day) and held constant for an additional 20 days in order to attain steady-state operation with respect to biomass growth, biodegradation rate, and carbon adsorption/desorption. Effluent methylene chloride levels remained below detection limit (<5 ppm) throughout the 81 days of continuous operation, except during the excessive methylene chloride loading which occurred on days 53-56.
Additional operational data for Run I is shown in Figures 1.5-1.9. The bioreactor pH was maintained at 7.0±0.5 throughout most of the 81 days of continuous operation (Figure 1.5). The temperature fluctuated between 18-32°C and consistently remained several degrees above ambient temperature (Figure 1.5), most likely due to friction imparted by the peristaltic fluid pumps. As the feed flow rate increased, the initial recycle ratio of 120 (dilution rate=0.15 hr 1 ) decreased to a final steady-state recycle ratio of 25 (dilution rate=0.72 hr 1 ) as shown in Figure 1.6. As expected, the bed height steadily rose due to the stimulation of biomass growth by increasing methylene chloride loadings (Figure 1.7). Full bed height was achieved after 42 days; subsequent increases in biomass were removed by the bioreactor shear mechanism, thereby allowing steady-state operation with respect to bed biomass concentration. Two spontaneous biomass sloughing events were observed. The first occurred ~15 days into continuous operation, and may reflect the loss of methanol-degrading microbes which had grown during initial batch operation. The second sloughing event coincided with a sharp pH decrease at day 35 (Figure 1.5) that resulted from a pH control system failure. Oxygen supply flow rate and oxygen consumption within the bioreactor (column D.O. drop) are shown in Figure 1.8. The observed sodium hydroxide consumption rate (Figure 1.9) slightly exceeded the amount of NaOH theoretically required to neutralize the HC1 generated during biodegradation (Figure 1.1).
Steady-State Analysis/Mass Balances
Data required for scale-up and cost analyses was collected during a one-week period following the establishment of steady-state continuous operation at a methylene chloride loading rate of 1.2 g/L-hr (days 74-81). Table 1.3 lists the typical parameters required for process scale-up (P.M. Sutton, personal communication). A summary of system characteristics and parameters during steady-state operation is shown in Table 1.4. Note that although the methylene chloride loading rate was held constant at 1.2 g/L-hr in order to obtain steady-state operation, this loading rate did not necessarily represent the maximum system capacity. The biodegradation capacity had been exceeded at a loading rate of 1.6 g/L-hr and was subsequently reduced to the lower value. The maximum degradation capacity therefore lies somewhere between 1.2 and 1.6 g/L-hr.
-12-n-24

3500 5000
- 4000
- 3000
2000
1000
20 40 60 Time (days)
80 1 00
Figure 1.4 Methylene Chloride and Inorganic Chloride Concentrations During Run I.
6 0
^ 5 0-o • TO O
4 0
2 3 0-O a. E o I- 2 0-
8 . 0
Time (days)
Figure 1.5 Temperature and pH During Run I.
- 6 .0 x a.
-13-H-25

140
120
O 1 0 0 -cs DC o 80 -u >. o o
a 60 H
40 -
20
<D6
Recycle Ratio ©—Dilution Rate
0 .8
0 .7
- 0 . 6
- 0.5 2 n en
-\ 0.4 c
0.3 5
0 . 2
2 0
r - i 1 • - 1 —
40
i — i — | — i — i
60
1—•—T"
80 Time (days)
0.1
1 0 0
Figure 1.6 Recycle Ratio and Dilution Rate During Run I.
1 2-
- . 1 o-
O)
cc •a 9 O U.
o 9
-9— Bed Height -&— MeCI2 Feed (g/hr)
i i I i i i i I i i i i I i i i i i i I i i i i 5 0
1 0 0
0 10 20 30 40 50 60 7 0 80
Time (days)
Figure 1.7 Bed Height and Methylene Chloride Feed Rate During Run I.
-14-n-26

5 0-• D.O. drop across column • Oxygen supplied to FBR
i i i i
1 0 0
E o so 8
co 6 0 CC
_>. Q. O.
4 0 3 t(i
CD D>
2 0 >• O
9 0
Time (days)
Figure 1.8 Column Dissolved Oxygen Drop and Oxygen Supply Rate During Run I.
7.0 a
o E
c a. E 3 CO c o o X O a
5.0-
4.0
3 .0
2 .0
1 . 0 H
0.0
• Observed NaOH Consumption - - • Expected NaOH Consumption
; •
• 5 J / ^ •••• j tf ' i i '"
~>—»—r— 20
i i I i i i I i i i I i i 40 60 80 1 0 0
Time (days)
Figure 1.9 Sodium Hydroxide Consumption During Run I.
-15-n-27

Table 1.3 Parameters Required for Process Scale-Up.
1. mass balances (methylene chloride, inorganic chloride) 2. biomass concentrations (bed, effluent, sludge age) 3. bed expansion rate 4. oxygen consumption rates (column D.O. drop, oxygen supply rate) 5. sodium hydroxide required to neutralize HC1 6. nutrients required 7. pH optimum and range 8. adsorption isotherm for methylene chloride on GAC
Methylene chloride feed concentrations were constant at 2018 ppm throughout the one-week data collection period (Figure 1.10). Effluent methylene chloride concentrations remained below detectable limit (<1 ppm). Recovery of inorganic chloride (Figure 1.11) indicated that 82.7 to 94.2% of the methylene chloride was biodegraded. The gradual increase in percent chloride recovery indicated that the process was close to but had not yet reached true equilibrium with respect to carbon adsorption/desorption.
The biomass generation rate is a critical parameter since it is used to estimate the theoretical oxygen demand of the system. Most of the feed methylene chloride is completely oxidized to C0 2 and H 2 0 ; the remainder is partially oxidized to form new biomass. Thus the theoretical oxygen demand should be less than the chemical oxygen demand (i.e., the oxygen required for complete oxidation of all the feed methylene chloride). The biomass generation rate can be used to determine the ratio of completely to partially oxidized methylene chloride (see Appendix EI). A steady-state biomass generation rate of 8.17 g VSS/day was calculated as the effluent biomass concentration (Table 1.5) times the flow rate. This assumed that a steady-state biomass concentration was maintained within the fluid bed. The resulting theoretical oxygen demand was calculated to be 77% of the chemical oxygen demand.
The consumption of dissolved oxygen within the fluid bed was somewhat less than stoichiometric compared to the theoretical oxygen demand (Figure 1.12). There are several possible explanations for this. First, measurement of dissolved oxygen in the influent grab samples may have been underestimated due to the slow response time of the D.O. probe. Second, the column influent may have contained "microbubbles" of non-dissolved oxygen which would not be measured as D.O. but would nevertheless be consumed as oxygen within the fluid bed. Third, the effluent biomass concentrations could have been
-16-n-28

Table 1.4 Summary of Steady-State Parameters (Run I).
Svstem characteristics: Empty bed volume 4.7 L Operating height of fluid bed 226 cm (89") Diameter of fluid bed 5.08 cm Axial fluid velocity in fluid bed 33.3 m/hr Fluidization flow rate 1.125 L/min Total system volume 12.7 L Settled height of GAC (no biomass) ' 140 cm (55") Fluidized height of GAC (no biomass) 168 cm (66")
Steadv-state operation ("average valuesV. Feed flow rate 65.4 L/day Feed MeC^ concentration 2,018 mg/L Effluent MeCh concentration < 1 mg/L Effluent chloride concentration 42.5 raM MeCl2 biodegradation rate1" 1.18g/L-hr Hydraulic retention time 1.38 hr Dilution rate 0.72 hri Recycle ratio 25.3 pH 7.0±0.4 NaOH consumption rate 3.73 moles/day Oxygen feed rate 22.5 seem D.O. drop across fluid bed 17.2 mg/L Specific oxygen consumption 0.21-0.32 g*02/g MeCl 2
Bed biomass concentration (average) 13,130 mgTSS/L Biomass in effluent 125 mg VSS/L Yield of biomass 62 mg VSS/g MeCl2
Sludge Age 7.5 days Reactor temperature 24.4±1.6°C Fluidized height of GAC/biomass 226 cm (89")
t Assuming no volatilization losses.
underestimated, since only four data points were collected and the day-to-day standard deviation seemed quite high (Table 1.5). As expected, the supply of oxygen to the bioreactor exceeded the theoretical oxygen demand (Figure 1.13). Based on the oxygen supply and consumption rates, the system oxygen demand was determined to lie somewhere between 0.21-0.32 g 0 2 / g MeCl2.
Sodium hydroxide consumption slightly exceeded the stoichiometrically required amount (Figure 1.14). Although the demand for sodium hydroxide was most likely dominated by the generation of HC1 during biodegradation, end-product C 0 2 would also contribute to acidification within the bioreactor.
-17-n-29

Table 1.5 Effluent Biomass Concentrations During Steady-State Operation.
Date Effluent TSSfm g/U* Effluent VSSfmg/LV
6/3/93 6/7/93 6/8/93 6/9/93
99 ±51 217 ±9 135 ±4 124 ±4
96 ±45 187 ±4 118±0 101 ±9
Average 6/3-9/93 144±51 125 ±42
* Average of two samples ± standard deviation. TSS=total suspended solids. VSS=volatile suspended solids.
Bed Profiles
Following the collection of steady-state data, a series of bed profiles was conducted (Figure 1.15). Samples removed from the fluid bed at heights of 35, 94,152, and 211 cm above the column inlet flange were analyzed for methylene chloride, dissolved oxygen and biomass concentrations. The methylene chloride profile indicated that all methylene chloride was consumed within the lower 94 cm of the fluid bed. The dissolved oxygen profile was less conclusive, but indicated that much of the dissolved oxygen was also consumed within the lower portion of the fluid bed. The biomass concentration in the lower-most sample was significantly higher relative to the rest of the fluid bed, suggesting that much of the active biomass growth occurred in the lower portion of the fluid bed. Subsequent biomass redistribution occurred due to the effect of particle diameter on buoyancy.
The average bed biomass concentration and the biomass generation rate were used to calculate an average sludge age (i.e., an approximation of mean cell residence time). The average sludge age in the bioreactor was 7.5 days, although it should be noted that the sludge age may vary with bed height depending on how quickly the biofilm-coated GAC particles redistribute in response to changes in particle diameter (P.M. Sutton, personal communication).
-18-n-30

3000
2500-
2000
1S00
1000-
500-
5/31 6/2 6/4 6/6 6/8 6/10
Date
Figure 1.10 Steady-State Mass Balance During Run I: Methylene Chloride.
©
o
8 0
7 0
6 0
5 0
4 0'
3 0'
2 0
1 0
0
5 /
o o o-
(82.7%)
- Ellluent chloride (measured) •Effluent chloride (expected)
O O X=8 (94.2%)
Average Mass Balance 89.4%
i i i i i i i I i i i I i i i I i i
3 1 6 / 2 6 / 4 6 / 6
Date
T 6 / 8 6 /1 0
Figure 1.11 Steady-State Mass Balance During Run I: Inorganic Chloride Ion.
-19-n-31

TO £ •v 9 m M (0 o o < Q. O
O Q
4 0
3 5
3 0
2 5
2 0;
1 5-
1 0:
6 -
5 / 3 1
•Actual -Theoretical
-e •
Mass Balance 60-84% (Average 72%)
1 6/2
I 6/4
i i i
Date
—T—r-6/6
- » — I — f 6/8 6/10
Figure 1.12 Steady-State Mass Balance During Run I: Column Dissolved Oxygen Drop.
L >. <0
•D ^ W JO o E
a a.
"5. a. 3 V) c o O) >> X
o
3.0
2.5
2 . 0 -
1.5-
1.0
0.5
e e e-
- Actual - Theoretical
-o &•
Mass Balance 112-131% (Average 121%)
0 . 0 | i i i i • i i i i i i i i i i i 5/31 6/2 6/4 6/6 6/8 6/10
Date
Figure 1.13 Steady-State Mass Balance During Run I: Oxygen Supply Rate.
-20-n-32

*>! a
o E
c o
5.0-
4.0-O. | 3.0 CO c o O 2.0
S 1-01 z
0.0-5 /31
•Actual -Theoretical
Mass Balance 82-138% (Averags 117%)
6/2 6/4 • i I i
6/6 " « — I — 6/8 6/10
Date
Figure 1.14 Steady-State Mass Balance During Run I: Sodium Hydroxide.
-21-H-33
mmz xr:ff^PWSi:'M^' ' ^jrs:^smm^Km^m:-

E • 2 - 1 6 2
1
a 6/8/83 D 6/0/03
Methylene Chloride (mg/L)
1,., I I "
B 6/8/63 • 6/0/93
0 4 * 12 16 20
Dissolved Oxygen (mg/L)
TSS (mg/L)
Figure 1.15 Steady-State Fluid Bed Profile During Run I: Methylene Chloride (top); Dissolved Oxygen (middle); Biomass (bottom).
-22-n-34

1.4 Results II
Although the work completed during the first research phase (Run I) satisfied the formal requirements of this contract, a second research phase (Run II) was undertaken to pursue two additional objectives:
•Attempt an aggressive start-up designed to minimize the time required for initial biomass growth and acclimation.
•Operate the bioreactor at a 50% higher fluidization velocity to provide greater oxygen transfer into the bioreactor.
The mass transfer of oxygen into the fluid bed is a product of the dissolved oxygen concentration and the liquid flow rate of the column inlet stream. The dissolved oxygen concentration is limited by Henry's Law solubilities and by the oxygen transfer efficiency of the downflow bubble contactor. Although it would be possible to attain higher dissolved oxygen concentrations by operating the oxygen transfer system under increased pressure, such hardware modifications were beyond the scope of the current investigation. The liquid flow rate, on the other hand, could easily be increased as long as the GAC particles were resized to allow operation within the same fluidization regime.
Larger diameter GAC particles (Calgon BPL 6x16 mesh) were obtained to allow operation of the fluid bed bioreactor at a 50% higher fluidization velocity. Calculation of the desired GAC particle size was performed using the Richardson-Zaki equations. These conditions should provide a 50% increase in oxygen mass transfer to the fluid bed, thereby allowing a 50% increase in methylene chloride biodegradation capacity.
Inoculation / Acclimation
In order to minimize the time required for initial biomass growth and acclimation, an aggressive start-up protocol was required. It was hypothesized that substantial biomass attachment to GAC should occur within 12-24 hours of bioreactor inoculation, and that rapid acclimation of biomass to methylene chloride could only be accomplished by supplying aggressive methylene chloride loadings from the onset. In addition, no methanol was supplied at any time during Run n.
Continuous feed was therefore initiated 24 hours after inoculation (rather than 22 days as in Run I) with ~1 liter of fresh non-acclimated GEP-Mt. Vernon WWTP sludge. The initial loading rate was 0.25 g/L-hr (~700 ppm methylene chloride at a flow rate of 42.8 L/day). Methylene chloride was detectable in the effluent stream as early as four days following inoculation (Figure 1.16). After 8 days, however, the effluent methylene chloride concentration had begun to
-23-n-35

3500'
«-. 3000-
E 2500'
5 2000-o e c o
« X
1500H
1000
500-
•FeedMeCK ' Effluent MeCI2
•Effluent Chloride
» >> I
5000
4000 =d
3000 J
u -J2000 _
c
- 1000 u
-4^pTT-Tii*0<K>0^0 i i filftO i i i | OOP i | OO iQ | I I I I
0 5 1 0 1 5 2 0 2 5 3 0 3 5 4 0
Time (days)
Figure 1.16 Methylene Chloride and Inorganic Chloride Concentrations During Run n.
decrease, and the effluent inorganic chloride concentration had begun to increase. This indicated that acclimation of the biomass to methylene chloride had begun.
Continuous Operation
The methylene chloride loading rate was progressively increased, and within two weeks of inoculation had surpassed the steady-state loading rate of 1.18 g/L-hr attained during the previous study (Run I). Effluent methylene chloride concentrations became non-detectable (< 5 ppm) after only 10 days of continuous operation (Figure 1.16).
After only four weeks of operation, the FBR had attained a methylene chloride loading rate in excess of 2 g/L-hr (this is 72% higher than was attained during Run I; see Figure 1.17) with no detectable methylene chloride (< 5 ppm) in the process effluent. An inorganic chloride recovery of 83.5% was observed, suggesting that the system was not operated long enough to come to steady-state equilibrium with respect to carbon adsorption/desorption. The methylene chloride biodegradation rate based on chloride recovery was 1.7 g/L-hr (this is 53% higher than was obtained during Run I).
-24-n-36

Time (days)
Figure 1.17 Comparison of Methylene Chloride Loading Rates During Runs I and n.
Additional operational data for Run II is shown in Figures 1.18-1.22. The pH was held at 7.0+0.5 throughout the run (Figure 1.18). The bioreactor temperature was typically between 20-25°C/ tracking several degrees above the ambient temperature (Figure 1.18). The initial recycle ratio was 55 (dilution rate 0.48 hr 1 ) , and the final recycle ratio was 25 (dilution rate 0.79 hr 1 ) , as shown in Figure 1.19. The fluid bed height gradually increased throughout the run, reaching a maximum after 28 days of continuous operation (Figure 1.20). Oxygen consumption and supply rates gradually increased throughout the run (Figure 1.21). Sodium hydroxide consumption lagged slightly behind the stoichiometrically expected amount (Figure 1.22). This was perhaps reflective of the aggressive methylene chloride loading rate: the majority of the methylene chloride was biodegraded while a small excess portion was adsorbed by the activated carbon.
The bioreactor was shut down after 5 weeks of sustained continuous operation. The improved operation of the fluid bed bioreactor at the higher fluidization velocity was consistent with our hypothesis that the rate of aerobic methylene chloride biodegradation is limited by oxygen transfer considerations (as dictated by Henry's Law) rather than intrinsic microbial kinetics.
-25-n-37
IM&vnzW^^J^-'^At/

5 0 -
1 3 . 3 3 2 6 . 6 7
Time (days)
8 . 0
- 7.0
pH - 6 . 0
5 . 0
- 4.0
3.0 0
Figure 1.18. Temperature and pH During Run II.
8 0
70 "
O Recycle Ratio -*—Dilution Rate (1/hr)
— »-
e—ee© eoo oo e o
1 . 3
1.1
0 . 9
0 .7
0 . 5
2 0 | i ' i i | ' ' i i | ' ' ' ' I ' ' ' ' I ' ' ' ' I ' ' ' ' I ' ' ' ' I ' ' ' ' I 0.3 0 5 10 15 20 25 30 35 40
Time (days)
Figure 1.19 Recycle Ratio and Dilution Rate During Run n.
-26-H-38

1 2-
^ 10 '
o>
o
•D o o
O <D
E
8 -
6 -
4 -
2 -
•MeCB Feed Rale - © — Bed Height
I i i i i I i i i i I i i i i I i i i i I i i i i I 1 0 1 5 2 0 2 5 3 0 3 5
1 10
100 ^ CO O
o c
9 0 *=•
o 80 x
m 7 0
6 0 0
Time (days)
Figure 1.20 Bed Height and Methylene Chloride Feed Rate During Run H
• D.O. Drop Across Column
E a. o
O 6 o m
u.
20 Time (days)
• i i i i i 30 4
7 0
6 0
5 0
4 0
3 0
2 0
1 0
0
- 1 0 0
E u o
co cc
a. a. CO
o >• X O
Figure 1.21 Column Dissolved Oxygen Drop and Oxygen Supply Rate During Run II.
-27-n-39

10.0
I
§ ••
0-
o. E
c o O
4.0
X 2. O CB Z
Observed NaOH Consumption • Expected NaOH Consumption
• •
• •
/ • • • > •
_ _ • - • •
. 0 | i i i l ^ f i i i i i i i i | i i i i i i i i i | i i i i i i i i i | i i i i 0 5 10 15 2 0 2 5 3 0 3 5 4 0
Time (days)
Figure 1.22 Sodium Hydroxide Consumption During Run H
1.5 Cost Analyses
The scale-up data collected during the methylene chloride biodegradation study was used to perform cost analyses for several treatment scenarios. The primary application involved coupling the biodegradation process with the vapor-phase sorption process described elsewhere in this report. Two design cases were considered:
1) 2000 SCFM, 30 ppmv methylene chloride - chosen to simulate a ground water air stripper effluent. This is based on air stripping a 500 gpm ground water stream containing 5 ppm of methylene chloride.
2) 2000 SCFM, 400 ppmv methylene chloride - chosen to simulate an in situ air stripper/SVE well effluent.
Biodegradation would be used for destruction of an aqueous methylene chloride desorption stream following regeneration of the sponge beds. Three methods of desorption were studied:
1) Desorb the loaded sorbent bed with hot N 2 and recover neat methylene chloride. This mode of regeneration is generally not suitable
-28-H-40

Table 1.6 Description of MeCl2 Waste Streams Chosen for Cost Analyses.
Case Vapor-Phase Waste Stream
Method of Desorption
Aqueous Desorption/ Condensate Stream*
(gpm)
MeCl2
Concentration* (mg/1)
1 2000 SCFM 400 ppmv MeCl2
Hot water 500 66
2 2000 SCFM 30 ppmv MeCl2
Hot water 500 5
3 2000 SCFM 400 ppmv MeCl2
Steam 6.2 5,360
4 2000 SCFM 30 ppmv MeCl2
Steam 6.2 400
tTo be treated via biodegradation
for coupling with biodegradation, since the neat methylene chloride is suitable for re-use.
2) Desorb the loaded sorbent bed with steam and send the aqueous condensate to a fluid bed bioreactor for destruction of methylene chloride. After the steam is condensed, all of the methylene chloride resides in aqueous phase due to the high solubility of methylene chloride in water (20,000 mg/L at 20°C).
3) Desorb the loaded sorbent bed with hot water and send the water to a fluid bed bioreactor for destruction of methylene chloride. Note that for the simulated air stripper stream (2000 SCFM, 30 ppmv), this regeneration approach results in a 500 gpm aqueous desorption stream containing 5 ppm methylene chloride, which is virtually identical to the original ground water stream. In this case the contaminated ground water should be sent directly to the fluid bed bioreactor for treatment.
Costs were determined for the four waste streams described in Table 1.6. In general, although the scenarios outlined here represent an effort to couple biodegradation with vapor-phase sorption, it should be noted that the methylene chloride biodegradation process is well-suited for the stand-alone treatment of contaminated ground water or industrial process wastewater.
-29-n-41

Table 1.7 Summary of Methylene Chloride Biodegradation Cost Analyses
Operating Capital Case Flow MeCl, Size Cost Cost
(gpm) (mg/1) (Dia./Height) ($/yr) ($)
1 500 66 6 ft/ 11 ft $33,700 $260,000 2 500 5 6 ft/ 11 ft $6,200 $260,000 3 6.2 5360 4.5 ft/11 ft $32,500 $175,000 4 6.2 400 1.7 ft/ 11 ft $3,900 $95,000
The cost analyses were performed by Envirex Ltd. (Waukesha, WI) based on the scale-up data generated during this study. The following assumptions were made:
1) The methylene chloride biodegradation rate is 2 g MeCl2/L-hr. 2) Specific oxygen consumption rate is 0.3 g 0 2 / g MeCl2. 3) Specific NaOH consumption rate is 0.74 g NaOH/g MeCl2. 4) Bioreactor hydraulic flux rate is 14 to 20 gpm/ft 2.
It should be noted that in Cases 1 and 2 the bioreactors are sized based on the flow rate rather than the biodegradation rate. In other words, the reactors could treat additional mass of organics but could not accept a greater volumetric flow rate. Case 3 is sized based on the chemical oxygen demand (COD) of the feed methylene chloride. The biodegradation rate in this case is limited by the oxygen transfer capacity of the equipment. Case 4 is over-sized and therefore is not limited by either COD or flow rate factors. The capital and operating costs for each Case are summarized in Table 1.7. Details can be found in Appendix V.
1.6 Discussion and Conclusions
The first phase of the methylene chloride biodegradation effort (Run I) demonstrated that attachment of fresh activated sludge to GAC and subsequent acclimation of the biomass to methylene chloride were both successful. By gradually increasing the methylene chloride loadings, it was determined that the maximum degradation capacity of the system ranged from 1.2 to 1.6 g/L-hr, and that this degradation rate was limited by oxygen transfer rather than intrinsic microbial kinetics. Fluid bed profile analyses indicated that the majority of biodegradation occurred in the lower portion of the fluid bed. The bioreactor system was operated successfully in continuous mode for 2-1/2 months. Steady-state data was collected for process scale-up and cost analyses.
-30-11-42

Table 1.8 Summary Comparison of Selected Parameters for Runs I and II
Parameter
Loading rate (g MeCl2/L-hr) Biodegradation rate (g MeCl2/L-hr)* Feed MeCl2 concentration (mg/L) Effluent MeCl2 concentration (mg/L) Fluidization flux velocity (gpm/ft2)
Run I
1.18 1.11 2,018 non-detect* 13.6
Runn
2.03 1.70 2,596 non-detect* 19.8
fas indicated by recovery of inorganic chloride *MeCl2 GC detection limits during runs I and II were 1 ppm and 5 ppm, respectively
The second research phase (Run II) demonstrated an aggressive start-up protocol in which a continuous feed of aqueous methylene chloride was initiated 24 hours following biomass inoculation. Although breakthrough of methylene chloride was initially observed, effluent methylene chloride concentrations became non-detectable (< 5 ppm) after only 10 days of operation. The degradation capacity of the bioreactor system surpassed the previous maximum within two weeks of start-up.
Operation of the fluid bed at a 50% greater fluidization velocity resulted in higher biodegradation rates due to increased oxygen transfer capacity. After only four weeks of operation, the fluid bed system had attained a methylene chloride loading rate in excess of 2 g/L-hr with no detectable methylene chloride in the reactor effluent (<5 ppm). The biodegradation rate based on inorganic chloride recovery was 53% higher than had been attained during the initial investigation. A summary comparison of Runs I and II is shown in Table 1.8.
The methylene chloride biodegradation process developed during this study represents an environmentally acceptable approach that results in the removal and destruction of methylene chloride to innocuous products such as CO z, inorganic chloride, and biomass. The process achieved significant biodegradation of methylene chloride using a mixed culture of microorganisms which are naturally occurring in a conventional activated sludge system. A series of cost analyses demonstrated that the process is cost-effective. Although this work focused on the coupling of biodegradation to the vapor-phase sorption process described elsewhere in this report, the process also has significant potential application to the direct treatment of ground water or industrial process wastewaters contaminated with methylene chloride. Based on the success of this study, we are actively pursuing opportunities for implementation of the methylene chloride process within GE.
-31-1143

-32-H44

CHAPTER 2: LABORATORY STUDIES ON THE BIODEGRADATION OF TRICHLOROETHYLENE
2.1 Introduction
Trichloroethylene (TCE) is a volatile chlorinated aliphatic hydrocarbon regarded as the most prevalent ground water contaminant in the United States (US-EPA, 1982). It is among fourteen organic compounds regulated under the Safe Drinking Water Act Amendments of 1986 and is the most frequently reported contaminant at hazardous waste sites on the National Priority List of the EPA. TCE's wide distribution can be attributed to excellent solvent and degreasing properties that made it desirable for many industrial applications. Its use became subject to regulation when it was found to be a suspected carcinogen in mice (Miller et al, 1982).
Given the observations above, it is not surprising that extensive effort has been expended studying the biodegradation of TCE by microbial organisms. Biologically mediated degradation of TCE can occur under both aerobic and anaerobic conditions. Of the two, the anaerobic process takes place more slowly and can produce such undesirable metabolites as dichloroethylene and vinyl chloride. These metabolites are of similar or greater toxicity than TCE and are also regulated under the Safe Drinking Water Act.
Aerobic biodegradation results in the complete mineralization of TCE, but the metabolism involved is not straight forward. No bacteria have yet been discovered that can utilize TCE as a sole source of carbon and energy. The gratuitous microbial oxidation that destroys TCE results from cometabolism (Folsom et al, 1990; Little et al, 1988). Wilson and Wilson (1985) first reported aerobic metabolism of TCE when soil columns were exposed to natural gas. Methanotrophs were implicated in this degradation and numerous researchers have pursued this lead (Little et al, 1988; Oldenhuis et al, 1989; Tsien et al, 1989; Fogel et al, 1986; Henson et al, 1988; Janssen et al, 1988; Strandberg et al, 1989; Semprini et al, 1990).
Methanotrophs utilize a mono-oxygenase pathway to degrade TCE. Methane monooxygenase is the principal enzyme in the degradation pathway and its primary function is the conversion of methane to methanol (McFarland et al.,.1992). The enzyme's low substrate specificity enables it to oxidize TCE, but since both TCE and methane are initially oxidized by the same enzyme, methane can act as a competitive inhibitor of TCE oxidation (Little et al, 1988). However, TCE degradation does not take place in the absence of substrates (such as methane) needed to induce the appropriate enzymatic pathway. Other inducers shown to stimulate this pathway include propane (Wackett et al., 1989) and methanol (Hyman et al, 1988; Little et al, 1988).
-33-n-45

TCE can also be degraded via a dioxygenase pathway by such organisms as Pseudomonas putida Fl (Nelson et al., 1988; Wackett et al., 1988). This enzyme system is induced by aromatic substrates such as phenol (Folsom et al., 1990, Harker et al., 1990; Montgomery et al., 1989; Nelson et al., 1986; 1987), toluene (Nelson et ah, 1988; Wackett et al., 1988; Winter et al., 1989), and naphthalene (Haigler et al., 1992).
The aerobic TCE-degrading microorganism studied in the fluidized bed reactor was cultivated from clarifier sludge collected from an aeration basin at a General Electric Plastics manufacturing facility. This sludge was believed to be a good candidate for enrichment of TCE degrading organisms since bacteria with a wide variety of degradation capabilities had previously been cultured from it. This is the same sludge that served as the inoculum to the fluidized bed reactor during the methylene chloride degradation study.
2.2 Experimental
The aerobic TCE degrader was enriched from clarifier sludge by packing a 250 ml glass addition funnel with a plug of glass wool and 2 cm of clean sand. To this was added lOOg of granular activated charcoal that served as a support. The medium that was trickled through this column from a 125 ml addition funnel was a phosphate- ammonium salts mixture (PAS) amended with 2 ml methanol, 1 ml acetone, and 1 ml TCE per liter. After three weeks 0.1 ml/L phenol was also added to the mixture. The inoculum for the column consisted of 10 ml of clarifier sludge. Media flow to the column was 100 ml daily. Spent media was collected into a 1 L flask that had a glass sidearm adapter with a restricted vent to atmosphere. The collected media was respiked with solvents and re-fed to the column. After eight weeks a sample of the effluent was removed and tested for its ability to degrade TCE using phenol and methanol as the sole source of carbon and energy.
TCE degradation assays were carried out in triplicate. Losses were calculated relative to the amounts of aqueous TCE detected in autoclaved and non-inoculated controls. Reporting the relative rather than the absolute losses eliminated issues associated with TCE partitioning into the head space of the experimental vials. Assays were performed in 10 ml Wheaton bottles or 27 ml Bellco aluminum seal tubes. The fluid volume of the assays was 5 ml. The medium used in the assays was either PAS or the medium described in Table 1.1 (MeCl2 medium). The experimental vials typically received 1.0 ml if the inoculum was from a liquid culture. If the vials were inoculated from a bacterial colony on a plate, a loop of cells was aseptically transferred to 1.0 ml of medium and the vials were inoculated with 0.1 ml of that mixture.
Inducers were added to the experimental vials as stock solutions. The phenol stock solution was prepared by dissolving 2 g of liquefied phenol into sterile water (final volume 100 ml). Final concentrations of phenol used in the
-34-H-46

assay were in the 0.25-16 mM range. A stock solution of methanol was similarly prepared. Solid aromatic substrates such as biphenyl and naphthalene were dissolved in 1 ml of diethyl ether before the appropriate quantities were added to experimental vials. After additions of the appropriate inducer, experimental vials were crimp sealed with Teflon lined rubber septa. For vials that received substrates in ether, the vials were well shaken and vented before being sealed. Controls were autoclaved for 20 minutes at 120°C. A saturated aqueous solution of TCE was added to each vial through the septa using a gas tight 100 1 syringe. The final TCE concentration in the vials, assuming that all of the added TCE stayed in the aqueous phase, was 5 ppm (wt/vol). The experimental vials were then placed in a rotary shaker where they were incubated at 30°C.
The experimental vials were typically sampled after one to seven days by removing 1 ml samples through the septa using 1 cc disposable syringes. The samples were transferred to 8 ml screw cap vials that contained 2 ml of a solution of 1 ppm dibromoethane in hexane. The dibromoethane served as an internal standard for the extraction and analytical procedures. After brief extraction on a shaker platform, the organic phase was transferred to another vial and analyzed by gas chromatography with an electron capture detector. TCE was quantified using multipoint calibration standards.
A color change assay was also used in the laboratory biodegradation studies (Wackett et ah, 1983). This assay identified bacteria with dioxygenase activity and served as a further enrichment step. Bacterial cultures were serially diluted onto a rich agar (RjA medium) plate covered with a sterile nylon filter. Plates were incubated at 30°C and when bacterial growth was observed, the nylon filter was transferred from the RjA plate to a PAS-indole plate (100 mg indole/L agar). Colonies that grew up on the R,A plate were transferred along with the filter. Those bacteria harboring dioxygenase activity were able to convert the indole to indigo resulting in a color change. The blue colonies that resulted were each tested for TCE degradation using phenol or other aromatic substrates as an inducer.
2.3 Results
The enriched clarifier sludge was tested for TCE degradation using both phenol and methanol as inducers. Four ml of PAS and one ml of inoculum culture were added to 27 ml tubes amended with 2.0 mM phenol or methanol and 5.0 ppm TCE. These vials were sampled weekly for three weeks without any observable TCE degradation. The dioxygenase screening assay was run in parallel to the TCE degradation assay and the numerous blue colonies that resulted were each tested for TCE degradation ability. One particularly capable TCE degrader was isolated from the clarifier sludge. Under appropriate conditions, this organism exhibited 100% loss of TCE, relative to controls, in less than one day.
-35-n-47

Once a suitable TCE degrader was isolated, it was characterized to optimize its degradation abilities. Experiments were run to determine if the organism could grow utilizing TCE as the sole carbon source, if TCE degradation activity required an inducer, and if substrates other than phenol could also serve as inducers. As expected, the TCE degrader was not found to be constitutive nor did it grow on TCE. Several other aromatic substrates such as toluene, biphenyl, and naphthalene were found to serve as inducers.
The minimal numbers of cells required to degrade 5.0 ppm TCE in aqueous culture was the first parameter examined. A series of three day assays was carried out in 10 ml vials with PAS amended with 2.0 mM phenol. For low starting concentrations of cells (0.15-1.2xl06 colony forming units/ml (cfu/ml)), TCE degradation of at least 90% was observed. Only 20-30% TCE degradation was observed at higher cell concentrations (2.5-10xl06 cfu/ml), see Figure 2.1. To test if oxygen limitation was the cause of this effect, the assay was repeated using 10 and 27 ml vessels. The head space of the larger vessel allowed for increased oxygen availability.
In the 27 ml tubes, higher starting concentrations of cells exhibited more extensive TCE degradation than was observed under identical conditions in the 10 ml vials (Figure 2.2). Under the conditions selected, initial cell concentration was not observed to have an effect on TCE degradation in the larger tubes. Cells added at low density seem to have time to increase their numbers sufficiently to achieve effective TCE degradation.
Another issue that required investigation involved the competitive inhibition of phenol and TCE. It was wondered whether TCE degradation by organisms in the fluid bed reactor could be sustained over multiple generations in the presence of both phenol and TCE. This question was addressed by carrying out a series of growth studies where cultures were grown to high density in the presence of both TCE and phenol and then transferred to fresh medium amended with both substrates for another round of growth. The phenol levels in this study were in the 2.0-4.0 mM range with the TCE levels at 5.0 ppm. Three such sequential transfers were carried out and then the culture was assayed for TCE degradation ability. The culture was able to maintain competence throughout this study.
Other parameters with relevance to the fluidized bed reactor study were phenolrTCE ratio and TCE toxicity effects. For a starting cell concentration of 0.5X10⁶ cfu/ml and 2.0 mM phenol, increasing TCE levels from 5.0 to 40.0 ppm led to a decrease in the percentage of TCE degraded (Figure 2.3). The absolute amounts of TCE consumed remained constant for those vials with 10.0 ppm or greater TCE. At 5.0 ppm TCE, complete degradation was observed. This suggested that for TCE concentrations up to 40.0 ppm degradation is not limited due to toxicity. A limitation in some other factor is suggested as the cause of the undegraded TCE at higher concentration.
-36-n-48

Number of Cells ( 1 0 6 c f u / m l )
Figure 2.1 Effect of Initial Inoculum Size on TCE Biodegradation in Vials with Limited Head-Space
For 5.0 ppm TCE and a starting cell concentration of 0.5xl06 cfu/ml, TCE degradation dropped from 90% to 20% as phenol levels were increased from 2.0 to 8.0 mM (Figure 2.4). Increased phenol may have inhibited degradation or oxygen limitation may have become an issue even in the larger tubes due to phenol's high chemical oxygen demand. It is not surprising that phenol would demonstrate inhibitory properties since it is used as a disinfectant in many applications.
If small numbers of cells show significant degradation of TCE at low phenol levels, it is reasonable to think that they must be using phenol and oxygen for growth. At high phenol levels, low levels of TCE degradation are observed unless numerous cells are present at time zero. This suggested that phenol's inhibitory effects are manifested primarily against growing cells or that the nutrient requirements to grow cells to sufficient density taxed the oxygen availability of the system. Presumably cells added in high numbers do not divert oxygen into growth and can use it solely for TCE degradation.
Phenol levels were also optimized. For low starting cell densities (OD = lxlO6 cfu/ml), phenol concentrations above 0.5 mM were needed to achieve at least 80% degradation of 5.0 ppm TCE (Figure 2.5). For higher cell densities (OD = 10x10s cfu/ml), 80% or greater TCE degradation was observed when phenol
-37-H49

100
90-1
80
70 ~
60 -
50
40 "
30 -
20 ~
1 0
10 m! 27 ml
to CM
to CM CO
CM CM in CM to
Number of Cells ( 1 0 c f u / m l )
Figure 2.2 Effect of Starting Inoculum Size on TCE Biodegradation in Vials with/without Oxygen Limitation
100 0.5x10 c f u / m l 2 mM phanol
Figure 2.3 Effect of Initial Concentration on TCE Biodegradation. Percent losses decrease, but absolute losses remain constant.
-38-II-50

100
90
80
70
? w 60 w to
° 50 1 UJ O 40
30 20
10
0 4 6
Phenol (mM)
0.5x10° cfu/ml 5 ppm TCE
Figure 2.4 Effect of Phenol Concentration on TCE Biodegradation
100
s? CO CO
o UJ
90 1
80
70 -
60 ~
50 "
40 -
30 -
20
10 -j
i r 0.5
H 1 0' c f u / m l D 1 o 6 c f u / m l
T r 0.2 0.1
Phenol (mM)
Figure 2.5 Optimal Phenol Concentration (dependent upon inoculum size)
-39-II-51

was present in the 0.2-1.0 mM range. The higher phenol requirements at low cell numbers agreed with the assertion above that phenol was diverted into cellular growth. When cell numbers were high, degradation activities were not inhibited if sufficient oxygen is available. Phenol's inhibitory properties do not manifest themselves. Combined with the observations above, this more strongly suggested that oxygen limitations were the primary issue.
To test oxygen availability, experiments were repeated in the 27 ml tubes. For tubes with phenol at 0.5 mM, increasing starting OD from lOxlO6 to 40xl06
cfu/ml resulted only in a small improvement in the degradation of 5.0 ppm TCE (Figure 2.6). These assays were sampled on days one and four, but the extra time resulted in degradation improvements of less than 10% in all cases (not shown). In addition, phenol levels were reduced as starting cell concentration was increased. Cell numbers were increased by four fold at the same time that phenol levels were cut by four. No significant effect on TCE degradation was observed (80-90% seen in all cases), as shown in Figure 2.6. This was in agreement with previous observations in that higher cell densities required less phenol to accomplish a given level of TCE degradation. An additional experiment seemed to provide a similar insight. At constant cell numbers, increasing available phenol only slightly improved degradation.
2.4 Discussion and Conclusions
An aerobic TCE degrader was enriched from an industrial sludge and was characterized for use in a fluidized bed reactor system. Like all other TCE degraders identified thus far, it did not utilize TCE as a sole carbon and energy source. It also required an inducing substrate to degrade TCE. A number of aromatic substrates — phenol, toluene, naphthalene, and biphenyl — were found to induce TCE degradation in this organism, strongly suggesting that the dioxygenase enzyme was involved in the degradation.
The batch experiments described above demonstrated that carefully balancing the levels of phenol, cells, and oxygen is critical to achieving extensive TCE degradation. Low levels of cells can adequately degrade TCE with only moderate phenol and oxygen requirements. With oxygen requirements met, initial cell numbers do not affect degradation if moderate amounts of phenol are available.
There are literature precedents to suggest that a TCE toxicity effect could be expected (Wackett and Householder, 1989; Alvarez-Cohen, et ah, 1991; Oldenhuis, et ah, 1991). For small numbers of cells and moderate phenol levels, no toxicity effect was observed as TCE levels were increased from 5.0 to 40.0 ppm. Under the particular assay conditions selected, the absolute amount of TCE degraded appeared to be a fixed quantity that did not change as concentration of TCE increased. No inhibition effects were observed.
-40-n-52

1 0 0
90 -
8 0 "
70 -(%
)
60 '
Loss
50 '
TCE 40 -
30 -
20 '
10 '
o -o -10;0.S 20;0 .S 40;0.S 10;0 .5 20 ;0 .25 40 ;0 .125
Number of Cells ( 1 0 6 cells/ml); Phenol (mM)
Figure 2.6 Effect of Inoculum Size and Phenol Concentration on TCE Biodegradation in Vials without Oxygen Limitation
High levels of phenol were seen to inhibit TCE degradation but it was not determined if the effect was due to the presence of phenol itself or to the oxygen limitations that resulted from the chemical oxygen demand associated with the high levels of phenol.
Low levels of cells were observed to require a higher phenol concentration for significant TCE degradation than did higher cell densities. This suggested that lower cell numbers were able to demonstrate degradation comparable to cells whose concentrations were an order of magnitude higher by utilizing some of the added phenol for growth. The oxygen requirements for degrading 5.0 ppm TCE would seem to be quite low in comparison.
All of these results suggested that oxygen limitation was the real issue for TCE degradation. The amount of phenol required for optimal degradation seemed to depend on the numbers of cells present. Low levels of cells required more phenol, presumably due to their growth requirements, than cells whose numbers were higher. In a long term reactor study this observation would seem to argue in favor of higher phenol concentrations, but additional phenol requires significant oxygen. Fortunately there does not seem to be a toxicity effect due to the TCE itself, at least up to the 40 ppm level.
-41-11-53

-42-n-54

CHAPTER 3: BIODEGRADATION OF TRICHLOROETHYLENE IN A GAC-FLUID BED BIOREACTOR
3.1 Introduction
Laboratory efforts described in Chapter 2 resulted in the isolation of a superior TCE/phenol-degrading microorganism from industrial activated sludge. A number of experiments were conducted to determine: (1) the required mass ratio of phenol:TCE, with a desired target maximum of 1:1 (to minimize the phenol-associated chemical oxygen demand of the feed); (2) the inductability of the TCE-degrading enzyme system during growth on phenol in the presence of TCE, since both compounds would need to be fed at a fixed ratio in a GAC-based system; (3) the sustainability of TCE degradation through several generations of growth in the presence of both phenol and TCE; (4) approximate TCE toxicity levels. The results of these experiments were favorable (see Chapter 2) and suggested that the isolate was suitable for further investigation in the GAC-fluid bed bioreactor.
This chapter describes efforts to biodegrade TCE in a GAC-fluid bed bioreactor. The approach taken was similar to the methylene chloride biodegradation study reported in Chapter 1.
3.2 Experimental
GAC-Fluid Bed Bioreactor
The GAC-fluid bed bioreactor was described earlier (Chapter 1). Approximately 3 liters of granular activated carbon (a blend similar to Calgon Filtrasorb 300,10x30 mesh) was added to the reactor such that the settled carbon bed height was 50-55". A Watson-Marlow 302S peristaltic pump was used to circulate a combined feed/recycle stream through the column at a flow rate of 1.125 L/min (corresponding to a flux rate of 13.6 gpm/ft2).
A continuous feed of TCE was introduced to the bioreactor along with phenol and bacterial nutrients. A TCE-saturated aqueous-phase was maintained in contact with neat TCE in a thermostated 5-gallon carboy (25°C). The TCE-saturated aqueous solution was combined with the bacterial nutrient solution (Table 1.1) and an aqueous phenol solution which ranged in concentration from 0.8 to 2% (w/v). The desired total feed flow rate, TCE concentration, and phenol concentration were controlled by balancing the flow rates of the various feed pumps. The feed system was similar to that used for methylene chloride (Chapter 1; Figure 1.3), with the addition of a separate aqueous phenol feed stream.
-43-H-55

Biomass Inoculum
The aerobic TCE-degrading microorganism used as an inoculum in the GAC-fluid bed bioreactor was cultivated from clarifier sludge collected from an aeration basin at a General Electric Plastics manufacturing facility. This sludge was believed to be a good candidate for enrichment of TCE-degrading microorganisms since bacteria with a wide variety of degradation capabilities had previously been cultured from it. This is the same sludge that served as the inoculum to the fluidized bed reactor during the methylene chloride degradation study (Chapter 1). Isolation of the TCE-degrading microorganism used in the bioreactor study is described in Chapter 2.
TCE Analysis
Samples were taken from the top sampling port of the bioreactor to determine effluent TCE concentration. Upon removal from the bioreactor, two or three ml of this fluid were immediately transferred to 8 ml screw cap vials that contained 2 ml of a solution of 1 ppm dibromoethane in hexane. The dibromoethane served as an internal standard for the extraction and analytical procedures. After brief extraction on a shaker platform, the organic phase was transferred to another vial and analyzed by gas chromatography with an electron capture detector. TCE was quantified using multipoint calibration standards.
Feed reservoir samples were taken to determine the TCE concentration in the bioreactor inlet. Samples were immediately extracted by combining 1 ml of sample with 5 ml of hexane/dibromoethane extractant solution. The organic phase was then diluted 100 fold to bring the TCE concentration into the linear range of the GC. The TCE feed concentration appeared quite variable for the first three weeks of the second run. When an improperly prepared extraction fluid was replaced and multiple feed samples collected for each time point, the variability disappeared. The inlet TCE concentrations were very stable from that point on.
Inorganic Chloride Analysis
Inorganic chloride analysis was accomplished via ion chromatography as described in Chapter 1. Since the chloride levels were relatively low compared to those obtained during the methylene chloride biodegradation study, samples were analyzed directly without dilution.
Dissolved Oxygen Measurements
Influent and effluent dissolved oxygen (D.O.) measurements were conducted as described in Chapter 1.
-44-U-56

Microbiological Analysis
Daily samples were taken from the bioreactor for microbiological analysis. These samples were assayed for TCE biodegradation using the experimental protocols discussed in Chapter 2. The bacterial medium used for this assay was the same as the medium used in the bioreactor (Chapter 1; Table 1.1). The biodegradation assays were performed to verify that the bioreactor contained viable microorganisms with TCE-degrading ability, since the bioreactor system was operated under non-selective conditions.
The daily sample taken for microbiological work was also plated periodically to characterize the microbial populations living in the reactor. Plating was performed using rich medium (R2A) and, when growth was seen, colonies were transferred to indole plates to test for dioxygenase activity. Organisms demonstrating dioxygenase activity were detected in the bioreactor throughout the entire run. The TCE biodegradation assays also showed that the bioreactor harbored microorganisms with TCE-degrading ability throughout the five weeks of continuous operation.
3.3 Results
The first experimental run was inoculated with 2 L of bacterial cells at an optical density (OD) of 0.193. The organism added to the reactor, studied extensively in Chapter 2, was grown up in PAS with 0.005% yeast extract (Difco Laboratories, Detroit, Michigan). TCE degradation assays carried out using the inoculum culture exhibited greater than 95% degradation of 5 ppm TCE in one day. Cells transferred to indole plates after being grown up on P^A plates turned dark blue as expected. Plated cells appeared to be of a single morphology and were yellow in color.
After 10 days the reactor system was shut down due to massive contamination. The microbiological samples taken from the reactor throughout the run exhibited evidence of TCE degradative competence as seen from results of indole and TCE degradation assays.
Several cellular morphologies were present in the reactor at time zero. Two organisms (one yellow, one white) observed on plates from effluent samples collected on day two were assayed for TCE degradation competence. Surprisingly, both organisms demonstrated TCE degradation competence. Fifteen percent of the organisms that grew on rich media from the first day's sample turned blue when exposed to indole.
Reactor effluent collected on day three was serially diluted and plated onto rich media to estimate numbers of organisms in the reactor. The number of colony forming units/ml in the effluent was calculated to be 8.5 x 10⁶. A white organism seemed to dominate the population.
-45-11-57

By the fourth day, the phenol reservoir (which also held the yeast extract fed to the reactor) was noticeably cloudy. This suggested a contamination problem that the phenol in the reactor would not be able to contain. Another four liters of the inoculum culture was grown up and added to the reactor to enhance survival of the TCE degradation activity. It is interesting to note that plates streaked with organisms collected from the reactor at days six and seven and the second batch of cells used to inoculate the reactor were white after one day of growth, turning yellow as they aged. While still white, these organisms exhibited significant TCE degradation in a one day assay. By day ten a white organism dominated the culture and had grown to high levels in the reactor. The experimental run was therefore halted. The contaminant that shut down the reactor at day ten was found to be unable to degrade TCE.
BIOLOG identification kits were used to determine if the organism that was fed to the reactor was present in the effluent at various time points. The strain used as the inoculum was compared to the white and yellow strains retrieved from the reactor at day two and the white organism that remained at ten days. All four showed unique patterns of substrate utilization, indicating four different organisms.
Before a second run was carried out, it was decided to reformulate the medium fed to the reactor. The yeast extract was eliminated to reduce issues of contamination; chloride levels were reduced to facilitate mass balance calculations. A number of studies were carried out to determine the effect of medium alterations on growth and degradation. The white organism cultured from the day two effluent sample proved to be the most adaptable to the reformulated medium. This organism was used to prepare 2 L of inoculum for the reactor (OD = 0.22). It was grown up in the methylene chloride medium discussed previously (Chapter 1; Table 1.1). For degradation it was found that PAS was best, but the medium used for the methylene chloride work was adequate for the TCE degrader. A BIOLOG test was run on the inoculum culture added to the second reactor. Though its substrate utilization pattern was unlike any of the other four that had been carried out, it was similar in many ways to the pattern observed for the organism isolated from the clarifier sludge.
Between runs the reactor was cleaned out and the carbon replaced, though no efforts were made to sterilize the system. A sample of reactor fluid taken before the second inoculation was assayed for TCE degradation activity and found to be active, though at a low level. Less than 30% degradation was observed for a one day assay, but the statistics for the assay suggested the results were valid at 95% confidence.
The bioreactor was inoculated with two liters of pure culture. A continuous feed was introduced 22 hours following inoculation. The initial continuous feed contained a 1:1 mass ratio of phenolrTCE (~67 ppm of each) at a
-46-11-58

flow rate of 50 L/day (Figures 3.1 and 3.2). The effluent inorganic chloride concentration increased noticeably to ~0.4 mM after 14 days of continuous operation (Figure 3.1). This level of inorganic chloride recovery corresponded to -26% biodegradation of the feed TCE.
Despite the relatively low recovery of inorganic chloride, this result was encouraging since the phenohTCE ratio and the retention time had not yet been optimized. It was therefore decided to institute two sequential setpoint changes to determine their effect on TCE biodegradation: (1) eliminate phenol from the continuous feed in an attempt to stimulate TCE biodegradation by "resting cells" (i.e., in the absence of cell growth); (2) increase the feed phenohTCE mass ratio to 5:1.
The phenol was eliminated from the feed on day 20 (Figures 3.2 and 3.3), resulting in an immediate drop in inorganic chloride recovery (Figure 3.1). The phenol feed was therefore reintroduced on day 24 at a phenohTCE mass ratio of 5:1 (Figures 3.2-4). Although this resulted in a significant increase in biomass growth rate as indicated by an increase in bed height (Figure 3.4), effluent inorganic chloride levels remained low throughout the remainder of the experiment (Figure 3.1).
Additional operating data is shown in Figures 3.5-7. The bioreactor pH was successfully maintained at 7.0±0.5 throughout the experiment (Figure 3.5). The bioreactor temperature generally remained between 22-35°C (Figure 3.5). The recycle ratio remained essentially constant, while the dilution rate decreased slightly due to the increase in bed height (Figure 3.6). The dissolved oxygen consumption across the column ranged from 2 to 28 ppm (Figure 3.7). Sodium hydroxide consumption increased dramatically in response to the increased phenohTCE ratio (Figure 3.7). Consumption of sodium hydroxide was thought to reflect primarily phenol rather than TCE degradation, since the amount of HC1 theoretically released upon TCE dechlorination is relatively small, especially at higher phenohTCE ratios.
Degradation and dioxygenase assays were run for the daily samples. The samples continually demonstrated the presence of organisms with dioxygenase activity as seen from the blue colonies that resulted in the indole assays. The methylene chloride medium used in the reactor was also used for the TCE degradation assays. The growth and degradation of the organism was found to be suboptimal with this medium. As a result, the degradation assays for culture effluent samples did not show the complete degradation of TCE that was observed previously. Periodically a daily sample was streaked out and when grown up, the cells were used to inoculate a TCE degradation assay. Under these circumstances, TCE degradation competence was much higher, presumably since cell numbers were larger. Duplicate samples run in MeCl2 medium and PAS showed significantly higher degradation for one day assays when PAS was used. This demonstrated that degradation activity was maintained in the reactor, but
-47-n-59

2 5 0 -
E a. a. 2 0 0 -
^ 1 5 0 -
c a> o c o a
UJ
o
1 0 0 -
5 0 -
-•—FeedTCE -Effluent TCE
Effluent Chloride
T — f - T * * — ' — • — • "
1 . 5
1 . 0
- 0 . 5
0 . 0 1 0 2 0 3 0
Time (days)
4 0 5 0
Figure 3.1 TCE and Inorganic Chloride Concentrations.
5 0 0
E CL 3 400H c o a 3 0 0 c o o c O 2 0 0
o © 1 0 0
• Feed Phenol • Effluent Phenol
>•*« 0 fCOOe08O«9»09O»0 I 9 9 0 B M 4 » 9 8 0 9 O 8 O 0 0 I O O 0 » O I i—r-0 1 0 2 0 3 0 4 0
Time (days)
5 0
Figure 3.2 Phenol Concentrations.
-48-n-60

5 0
Time (days)
Figure 3.3 Feed Phenol:TCE Mass Ratio.
o>
©
cc •a a .° u. UJ U
c a
o x: CL
» Phenol Feed Rate (g/hr) •TCE Feed Rate (g/hr)
Bed Height
0 . 0 - < * —r 1 o
1 0 0
9 0
8 0
- 70
- 6 0
- 50
4 0 20 Time (days)
5 0
Figure 3.4 Bed Height and Phenol/TCE Feed Rates.
-49-n-6i
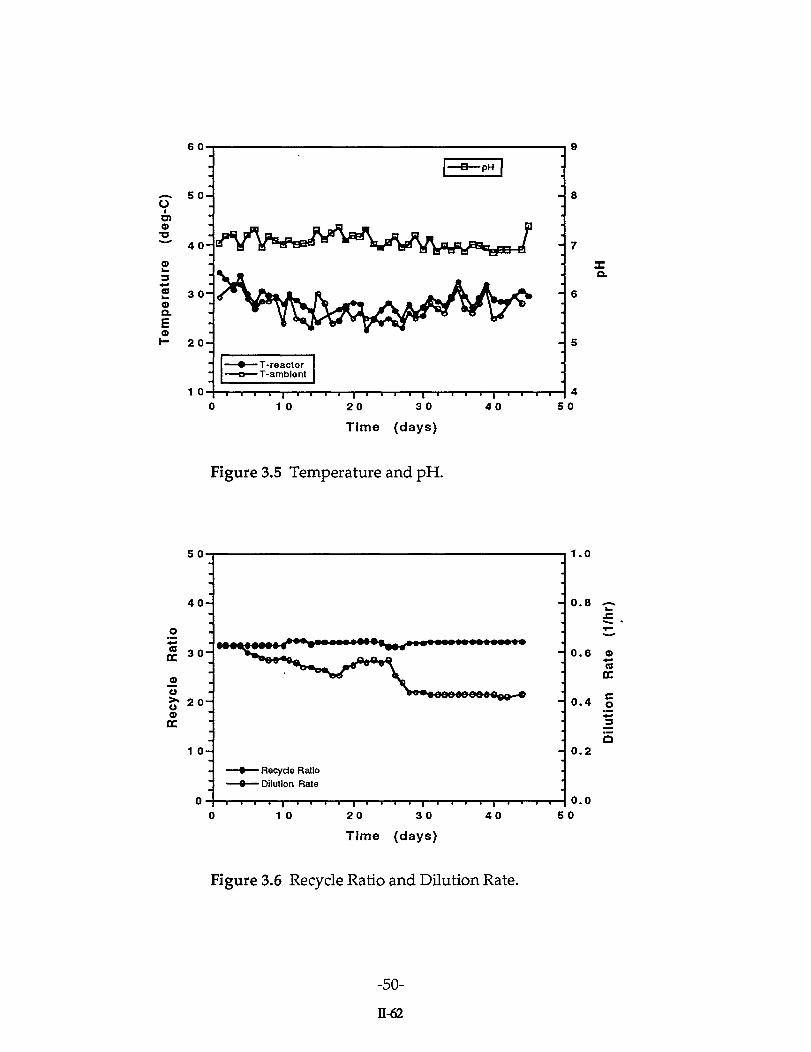
6 0 -
—* 5 0 -O i o> a> •a
a> 3
2 30-Q. E a> 2 0 -
-e—PH |
> T-reactor -o—T-ambient
1 0 — — i i i i — | i i i—i | i i—i i | i i i i | i i i i 4
0 10 20 30 40 50 Time (days)
Figure 3.5 Temperature and pH.
5 0-
4 0 -
«? - » n -3 0 -
o S* 20- | ©
CC
1 0-
» » m » M i
^•^oooooooaa^a-*
% Recycle Ratio 9 Dilution Rate
1.0
0 .8
0 .6
0 .4
0 . 2
0 — i i i i | i i i i | i i i i | i i i i | i i i i | 0 . 0
0 10 20 30 40 50 Time (days)
Figure 3.6 Recycle Ratio and Dilution Rate.
-50-n-62

5 0-
=> 4 0 -
- 2 0-d
- 3 0
• O.O. drop across column • NaOH Consumption
vV 'V" " i •—i i | i—i—r—t—j^HA—r—I—|—r-
10 20 30
Time (days)
' l ' 40
4 . 0
3.5 (8
3.0 |
2 . 5 C
2.0 | 3 W
O 1.0 _
0.5
0.0 0
Figure 3.7 Column Dissolved Oxygen Drop and Sodium Hydroxide Consumption.
that the TCE degrader was living in a suboptimal environment. These suboptimal conditions agree with the chloride mass balance numbers that showed that TCE degradation losses never rose above 30%.
Multiple bacterial morphologies were seen to be present throughout the entire run, even before the inoculum was added. Removing the yeast extract from the medium contributed significantly to reducing the contamination issues.
3.4 Cost Analyses
A series of preliminary cost analyses was conducted even though the TCE biodegradation study did not proceed to the point of steady-state data collection. Instead, the preliminary design was based on a series of assumptions concerning the desirable performance characteristics of the system.
Two design cases were considered:
1) 2000 SCFM, 30 ppmv TCE - chosen to simulate a ground water air stripper effluent. This is based on air stripping a 500 gpm ground water stream containing 5 ppm of TCE.
-51-
n-63

2) 2000 SCFM, 400 ppmv TCE - chosen to simulate an in situ air stripper/SVE well effluent.
Biodegradation would be used for destruction of an aqueous TCE desorption stream following regeneration of the sponge beds. Three methods of desorption were studied:
1) Desorb the loaded sorbent bed with hot N 2 and recover neat TCE. This mode of regeneration is generally not suitable for coupling with biodegradation, since the neat TCE is suitable for re-use.
2) Desorb the loaded sorbent bed with steam and send the aqueous condensate to a fluid bed bioreactor for destruction of TCE. The steam condensate is saturated with TCE at 1100 mg/L. Additional neat TCE is re-used or disposed of rather than biodegraded.
3) Desorb the loaded sorbent bed with hot water and send the water to a fluid bed bioreactor for destruction of TCE. Note that for the simulated air stripper stream (2000 SCFM, 30 ppmv), this regeneration approach results in a 500 gpm aqueous desorption stream containing 5 ppm TCE, which is virtually identical to the original ground water stream. In this case the contaminated ground water should be sent directly to the fluid bed bioreactor for treatment.
Costs were determined for the three waste streams described in Table 3.1. In general, although the scenarios outlined here represent an effort to couple biodegradation with vapor-phase sorption, it should be noted that the TCE biodegradation process may alternatively be applied directly to the treatment of contaminated ground water. Also, note that case 3 results in the generation of neat TCE in addition to a TCE-saturated condensate. The condensate is sent to the bioreactor while the neat TCE is recovered for re-use or disposal.
The cost analyses were performed by Envirex Ltd. (Waukesha, WI) based on the following assumptions:
1) The TCE biodegradation rate is limited by oxygen transfer rather than microbial kinetics. This has not been demonstrated in the laboratory and therefore represents idealized bioreactor performance.
2) All of the TCE is successfully biodegraded using a phenohTCE mass ratio of 1:1, again representing idealized performance.
The capital and operating costs for each Case are summarized in Table 3.2. In Case 2 the bioreactor is sized based on the flow rate rather than the biodegradation rate. In other words, the reactor could treat additional mass of organics but could not accept a greater volumetric flow rate. Cases 1 and 3 are sized based on the chemical oxygen demand (COD) of the feed phenol/TCE. It
-52-n-64

Table 3.1 Description of TCE Waste Streams Chosen for Cost Analyses.
Case Vapor-Phase Waste Stream
Method of Desorption
Aqueous Desorption/ Condensate Stream*
(gpm)
TCE Concentration*
(mg/1) 1 2000 SCFM
400 ppmv TCE Hot water 500 66
2 2000 SCFM 30 ppmv TCE
Hot water 500 5
3 2000 SCFM 30 fir 400 ppmv TCE
Steam 5.2* 1,100
*To be treated via biodegradation. *The condensate in this case represents only a portion of the total TCE removed by the organic sponge sorption process — the remainder is recovered as neat TCE for re-use or disposal.
is critical to note that a higher phenol:TCE mass ratio would increase costs significantly due to the high COD associated with phenol. These cost estimates represent idealized performance which has yet to be achieved in the laboratory; these costs should therefore be interpreted with utmost caution. Details of the cost analyses can be found in Appendix V.
3.5 Discussion and Conclusions
The effort to biodegrade TCE in a GAC-fluid bed bioreactor consisted of two experimental runs. The initial run resulted in the identification of several key issues, the foremost of which involved catastrophic contamination of the bioreactor by ambient non-TCE-degrading bacteria. Interim laboratory efforts involved bacterial nutrient recipe adjustments, TCE feed system diagnostics, and construction and replacement of a faulty reactor component. It was determined that the presence of yeast extract in the bacterial nutrient solution was responsible for the contamination. Attempts were made to suitably modify the PAS medium, but it was ultimately decided that the bioreactor should be operated using the same nutrient medium as had been used successfully for the methylene chloride biodegradation study. This medium provided adequate growth and degradation rates for the TCE-degrading microorganism, but was nevertheless suboptimal due to the absence of yeast extract.
The bioreactor was subsequently re-inoculated and operated in continuous mode for five weeks with no evidence of detrimental contamination. After 20 days of continuous operation at a phenokTCE mass ratio of 1:1, effluent
-53-n-65
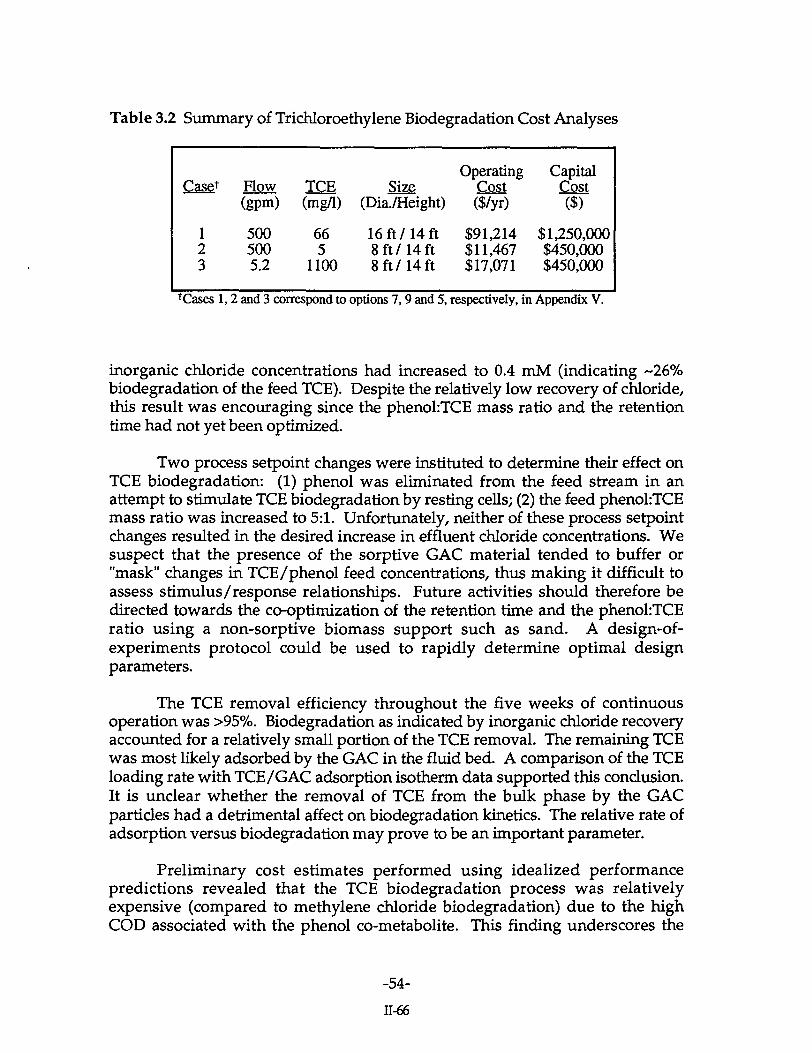
Table 3.2 Summary of Trichloroethylene Biodegradation Cost Analyses
Case* Flow (gpm)
TCE (mg/1)
Size (Dia./Height)
Operating Cost ($/yr)
Capital Cost ($)
1 2 3
500 500 5.2
66 5
1100
16 ft/14 ft 8 ft/14 ft 8 ft/14 ft
$91,214 $11,467 $17,071
$1,250,000 $450,000 $450,000
TCases 1,2 and 3 correspond to options 7,9 and 5, respectively, in Appendix V.
inorganic chloride concentrations had increased to 0.4 mM (indicating ~26% biodegradation of the feed TCE). Despite the relatively low recovery of chloride, this result was encouraging since the phenol:TCE mass ratio and the retention time had not yet been optimized.
Two process setpoint changes were instituted to determine their effect on TCE biodegradation: (1) phenol was eliminated from the feed stream in an attempt to stimulate TCE biodegradation by resting cells; (2) the feed phenol:TCE mass ratio was increased to 5:1. Unfortunately, neither of these process setpoint changes resulted in the desired increase in effluent chloride concentrations. We suspect that the presence of the sorptive GAC material tended to buffer or "mask" changes in TCE/phenol feed concentrations, thus making it difficult to assess stimulus/response relationships. Future activities should therefore be directed towards the co-optimization of the retention time and the phenokTCE ratio using a non-sorptive biomass support such as sand. A design-of-experiments protocol could be used to rapidly determine optimal design parameters.
The TCE removal efficiency throughout the five weeks of continuous operation was >95%. Biodegradation as indicated by inorganic chloride recovery accounted for a relatively small portion of the TCE removal. The remaining TCE was most likely adsorbed by the GAC in the fluid bed. A comparison of the TCE loading rate with TCE/GAC adsorption isotherm data supported this conclusion. It is unclear whether the removal of TCE from the bulk phase by the GAC particles had a detrimental affect on biodegradation kinetics. The relative rate of adsorption versus biodegradation may prove to be an important parameter.
Preliminary cost estimates performed using idealized performance predictions revealed that the TCE biodegradation process was relatively expensive (compared to methylene chloride biodegradation) due to the high COD associated with the phenol co-metabolite. This finding underscores the
-54-n-66

need to identify or develop a microbial system which does not require large amounts of co-metabolite. With further development, aerobic TCE biodegradation may prove useful for remediation applications, although the current coupling of aqueous-phase TCE biodegradation with the vapor-phase sorption process was determined to be uneconomical.
Although further effort would be required in order to develop a commercially viable TCE biodegradation process, the work conducted during this study has achieved a number of significant results:
•Naturally occurring microorganisms were evaluated for their ability to degrade TCE. Laboratory optimization studies resulted in the identification of a phenolrTCE degrading microbe suitable for scale-up in a GAC-fluid bed bioreactor.
•Non-optimized continuous bioreactor studies resulted in ~30% biodegradation of TCE. The system performance could most likely be improved by optimizing phenolrTCE ratio and retention time.
•Microbiological assays revealed that the TCE-degrading competency of the selected microorganism remained strong even after five weeks of continuous culture in a non-sterile bioreactor environment. Long-term microbial survival is a critical aspect of system performance.
•Although this contract does not provide for additional bioreactor optimization work, an optimization strategy has nevertheless been suggested which may guide future efforts.
•Detailed cost analyses performed by Envirex Ltd. will serve as valuable tools for evaluating potential applications and overall process marketability.
-55-II-67

REFERENCES
Alvarez-Cohen, L., and P.L. McCarty. 1991. Effects of toxicity, aeration, and reductant supply on trichloroethylene transformation by a mixed methanotrophic culture. Appl.Envir. Microbiol. 57:228-235.
Bhattacharya, S.K. and G.F. Parkin, 1988. "Fate and effect of methylene chloride and formaldehyde in methane fermentation systems." Journal WPCF 60,531-536.
Brunner, W., D. Staub, and T. Leisinger, 1980. "Bacterial degradation of dichloromethane." Appl. Environ. Microbiol. 40,950-958.
Davis, J.W. and S.S. Madsen, 1991. "The biodegradation of methylene chloride in soils." Environ. Toxicol. Chem. 10,463-47'A.
Fogel, M.M., A.R. Taddeo, and S. Fogel. 1986. Biodegradation of chlorinated ethenes by a methane-utilizing mixed culture. Appl. Envir. Microbiol. 51:720-724.
Folsom, B.R., P.J. Chapman, and P.H. Pritchard. 1990. Phenol and trichloroethylene degradation by Pseudomonas cepacia G4: kinetics and interactions between substrates. Appl. Envir. Microbiol. 56:1279-1285.
Freedman, D.L. and J.M. Gossett, 1991. "Biodegradation of dichloromethane and its utilization as a growth substrate under methanogenic conditions." Appl. Environ. Microbiol. 57,2847-2857.
Galli, R.,1987. "Biodegradation of dichloromethane in waste water using a fluidized bed bioreactor." Appl. Microbiol. Biotechnol. 27,206-213.
Galli, R. and T. Leisinger, 1985. "Specialized bacterial strains for the removal of dichloromethane from industrial waste." Conservation & Recycling 8,91-100.
Galli, R. and T. Leisinger, 1988. "Plasmid analysis and cloning of the dichloromethane utilization genes of Methylobacterium sp. DM4." /. Gen. Microbiol. 134,943-952.
Haigler, B.E., C.A. Pettigrew, and J.C. Spain. Biodegradation of mixtures of substituted benzenes by Pseudomonas sp. strain JS150. Appl. Envir. Microbiol. 58: 2237-2244.
Harker, A.R., and Y. Kim. 1990. Trichloroethylene degradation by two independent aromatic-degrading pathways in Alcaligenes eutrophus JMP134. Appl. Envir. Microbiol. 56:1179-1181.
-57-11-68

Henson, J.M., M.V. Yates, J.V. Cochran, and D.L. Shacleford. 1988. Microbial removal of halogenated methanes, ethanes, and ethylenes in an aerobic soil exposed to methane. FEMS Microbiol. Ecol. 53:193-201.
Hyman, M.R., LB. Murton, and D.J. Arp. 1988. Interaction of ammonia monoxygenase from Nitrosomonas europaea with alkanes, alkenes, and alkynes. Appl. Envir. Microbiol. 54:3187-3190.
Janssen, D.B., G. Grobben, R. Hoekstra, R. Oldenhuis, and B. Witholt. 1988. Degradation of trans-l,2-dichloroethene by mixed and pure cultures of methanotrophic bacteria. Appl. Microbiol. Biotechnol. 29:392-399.
Klecka, G.M., 1982. "Fate and effects of methylene chloride in activated sludge." Appl. Environ. Microbiol. 44,701-707.
Kohler-Staub, D., S. Hartmans, R. Galli, F. Suter, and T. Leisinger, 1986. "Evidence for identical dichloromethane dehalogenases in different methylotrophic bacteria." /. Gen Microbiol. 132,2837-2843.
LaPat-Polasko, L.T., P.L. McCarty, and A.J.B. Zehnder, 1984. "Secondary substrate utilization of methylene chloride by an isolated strain of Pseudomonas sp." Appl. Environ. Microbiol. 47,825-830.
LaRoche, S.D. and T. Leisinger, 1990. "Sequence analysis and expression of the bacterial dechloromethane dehalogenase structural gene, a member of the glutathione S-transferase supergene family." /. Bacteriol. 172,164-171.
Little, CD., A.V. Palumbo, S.E. Herbes, M.E. Lidstrom, R.L.Tyndall, and P.J. Gilmer. 1988. Trichloroethylene biodegradation by a methane-oxidizing bacterium. Appl. Envir. Microbiol. 54:951-956.
McFarland, M.J., CM. Vogel, J.C Spain. 1992. Methanotrophic cometabolism of trichloroethylene (TCE) in a two stage bioreactor system. Wat. Res. 26:259-265.
Miller, R.E., and F.P. Guengerich. 1982. Oxidation of trichloroethylene by liver microsomal cytochrome P-450: evidence for chlorine migration in a transition state not involving trichloroethylene oxide. Biochemistry 21:1090-1097.
Montgomery, S.O., M.S. Shields, P.J. Chapman, and P.H. Pritchard. 1989. Identification and characterization of trichloroethylene-degrading bacteria, abstr. K-68, p. 256. Abstr. 89th Annu. Meet. Am. Soc. Microbiol. 1989.
Nelson, M.J.K., S.O. Montgomery, E.J. O'Neill, and P.H. Pritchard. 1986. Aerobic metabolism of trichloroethylene by a bacterial isolate. Appl. Environ. Microbiol. 52:383-384.
-58-H-69

Nelson, M.J.K., S.O. Montgomery, W.R. Mahaffey, and P.H. Pritchard. 1987. Biodegradation of trichloroethylene and involvement of an aromatic biodegradative pathway. Appl. Environ. Microbiol. 53:949-954.
Nelson, M.J.K., S.O. Montgomery, and P.H. Pritchard. 1988. Trichloroethylene metabolism by microorganisms that degrade aromatic compounds. Appl. Environ. Microbiol. 54: 604-606.
Oldenhuis, R., R.L.J.M. Vink, D.B. Janssen, and B. Witholt. 1989. Degradation of chlorinated aliphatic hydrocarbons by Methylosinus trichospotium OB3b expressing soluble methane monooxygenase. Appl. Environ. Microbiol. 55:2819-2826.
Oldenhuis, R., J.Y. Oedzes, J.J. Van Der Waarde, and D.B. Janssen. 1991. Kinetics of chlorinated hydrocarbon by Methylosinus trichosporium OB3b and toxicity of trichoroethylene. Appl. Environ. Microbiol. 57:7-14.
Rittmann, B.E. and P.L. McCarty, 1980. "Utilization of dichloromethane by suspended and fixed film bacteria." Appl. Environ. Microbiol. 39,1225-1226.
Scholtz, R., L.P. Wackett, C. Egli, A.M. Cook, and T. Leisinger, 1988. "Dichloromethane dehalogenase with improved catalytic activity isolated from a fast-growing dichloromethane-utilizing bacterium." /. Bacteriol. 170,5698-5704.
Semprini, L., P.V. Roberts, G.P. Hopkins, and P.L. McCarty. 1990. A field evaluation of in-situ biodegradation of chlorinated ethenes: part results of biostimulation and biotransformation experiments. Groundwater. 28:715-727.
Spivack, J.L., G.K. Shank, R.J. Nick, and J.R. Conuel. "Biodegradation of methylene chloride: comparison of Celgene's CEL5002 with Mt. Vernon WWTP sludge in shake flasks, CSTRs and trickling bed reactors." General Electric Corporate Research and Development Class 1 Technical Report, 93CRD099 (1993).
Strandberg, G.W., T.L. Donaldson, and L.L. Farr. 1989. Degradation of trichloroethylene and trans-l,2-dichloroethylene by a methanotrophic consortium in a mixed-film, packed-bed reactor. Envir. Sci. Technol. 23:1422-1425.
Stucki, G., W. Brunner, D. Staub, and T. Leisinger, 1981a. "Microbial degradation of chlorinated CI and C2 hydrocarbons." In Microbial Degradation of Xenobiotics and Recalcitrant Compounds (T. Leisinger, A.M. Cook, R. Hutter, and J. Nuesch, eds), pp-131-137, Academic Press, New York.
-59-n-70

Stucki, G., R. Galli, H.-R. Ebersold and T. Leisinger, 1981b. "Dehalogenation of dichloromethane by cell extracts of Hyphomicrobium DM2." Arch. Microbiol 130, 366-371.
Sutton, P.M. and P.N. Mishra. "Activated carbon based biological fluidized beds for contaminated water and wastewater treatment: a state-of-the-art review." Presented at Second International Specialized Conference on Biofilm Reactors, Paris, France, Sept. /Oct. 1993.
Tsien, H.C., G.A. Brusseau, R.S. Hanson, and L.P. Wackett. 1989. Biodegradation of trichloroethylene by Methylosinus trichosporium OB3b. Appl. Environ. Microbiol. 55:3155-3161.
U.S. Environmental Protection Agency. 1982. National revised drinking water regulations, volatile synthetic organic chemicals in drinking water; advanced notice of proposed rulemaking: Fed. Reg. 47:9349-9358.
Wackett, L.P., D.T. Gibson, B.D. Ensley, B.J. Ratzkin, T.D. Osslund, and M.J. Simon. 1983. Expression of naphthalene oxidation genes in Escherichia coli results in the biosynthesis of indigo. Science 222:167-169.
Wackett, L.P., and D.T. Gibson. 1988. Degradation of trichloroethylene by toluene dioxygenase in whole-cell studies with Pseudomonas putida Fl. Appl. Environ. Microbiol. 54:1703-1708.
Wackett, L.P., and S.R. Householder. 1989. Toxicity of trichloroethylene to Pseudomonas putida Fl is mediated by toluene dioxygenase. Appl. Environ. Microbiol. 55: 2723-2725.
Wackett, L.P., G.A. Brusseau, S.R. Householder, and R.S. Hanson. 1989. Survey of microbial oxygenases: trichloroethylene degradation by propane-oxidizing bacteria. Appl. Envir. Microbiol. 55:2960-2964.
Wilson, J.T., and B.H. Wilson. 1985. Biotransformation of trichloroethylene in soil. Appl. Environ. Microbiol. 49: 242-243.
Winter, R.B., K.-M. Yen, and B.D. Ensley. 1989. Efficient degradation of trichloroethylene by a recombinant Escherichia coli. Bio/Technology. 7:282-285.
-60-n-7i

APPENDIX I: Steady-State Data (MeCl2 Run I)
Table 1.1 Chloride Mass Balance
Date MeCj2Feed CI- Effluent CI- Expected* CI- Mass Balance (mg/L) (mM) (mM) (%)
6/1/93 2011 39.2 47.4 82.7 6/2/93 2011 41.0 47.4 86.5 6/3/93 2011 41.8 47.4 88.2 6/4/93 2030 43.3 47.8 90.6 6/5/93 2030 43.1 47.8 90.2 6/6/93 2030 43.5 47.8 91.0 6/7/93 2030 43.8 47.8 91.6 6/8/93 1988 44.1 46.8 94.2
Average 2018 42.5 47.5 89.4
t Assuming complete biodegradation and no volatilization or abiotic losses.
Table 1.2 Sodium Hydroxide Mass Balance
Feed Flow NaOH NaOH Required NaOH Mass Date MeCh Feed Rate Consumption to Neutralize HC1* Balance*
(mg/L) (L/day) (moles/day) (moles/day) (%)
6/1/93 2011 66.3 2.58 3.14 82.2 6/2/93 2011 66.3 3.70 3.14 117.8 6/3/93 2011 66.3 3.73 3.14 118.8 6/4/93 2030 65.4 3.38 3.13 108.0 6/5/93 2030 65.4 4.67 3.13 149.0 6/6/93 2030 65.4 2.94 3.13 93.9 6/7/93 2030 65.4 3.76 3.13 120.1 6/8/93 1988 65.4 4.31 3.13 137.7
Average 2018 65.7 3.73t 3.13 115.9-119.2
""Calculated based on MeC12 feed rate, assuming complete biodegradation and no volatilization losses. tNaOH average was calculated from raw data for 11 am 6/1 to 2 pm 6/9. *Note that 100% balance is not necessarily expected for NaOH, since other factors can affect the pH, including nutrient consumption (P04) and dissolved carbon dioxide.
-61-
11-72

Table 1.3 Oxygen Mass Balance
Feed D.O. Drop TOD Oxygen Mass Oxygen Oxygen Oxygen Mass MeCl2 Flow Across Across Balance, Based Supply Supply
Rate* Balance, Based
Date Feed Rate Column Column1 on D.O. Drop2 Rate Supply Rate* TOD on O2 Supplv
(mg/L) (L/day) (mg/L) (mg/L) (%) (seem) (mol/day) (mol/day) (%)
6/1/93 2011 66.3 16.8 23.7 71 23.6 1.39 1.21 115 6/2/93 2011 66.3 18.5 23.7 78 24.2 1.42 1.21 117 6/3/93 2011 66.3 17.5 23.7 74 23.1 1.36 1.21 112 6/4/93 2030 65.4 16.1 23.7 68 26.7 1.57 1.20 131 6/5/93 2030 65.4 20.0 23.7 84 24.7 1.45 1.20 121 6/6/93 2030 65.4 17.0 23.7 72 26.6 1.57 1.20 131 6/7/93 2030 65.4 14.2 23.7 60 25.8 1.52 1.20 127 6/8/93 1988 65.4 - 23.1 - 23.5 1.38 1.18 117
Average 2018 65.7 17.2 23.6 72 22.5 1.32 1.20 121
Stoichiometric theoretical oxygen demand. Assumes complete biodegradation, fluidization flow rate of 1.125 L/min, 77% oxidation of MeCl2. 2D.O. drop is considerably lower than stoichiometric TOD. One possibility is that small, undissolved microbubbles (not measured as D.O.) entered the column and were consumed.
3Using ideal gas law at standard conditions. Based on manual calibration of mass flow meter subsequent to experiment.

APPENDIX II: Fluid Bed Data and Sludge Age <MeCl2 Run I)
Table II.l Fluid Bed Biomass Profile
Bed Height (inches)
Bed Height (cm)
TSS* (mg biomass/g carbon)
TSS*t (mg biomass/L bed volume)
83 60 37 14
211 152 94 35
41.64 ±0.69 41.44±0.91 42.45 ± 2.75 52.32 ±2.43
12,138 ±202 12,080 ±264 12,373 ± 802 15,252 ±709
•Average of two samples ± standard deviation. tSee calculation below.
Calculations:
TSS (mg biomass/L bed volume) = TSS (mg biomass/g carbon) x Expanded GAC density (g carbon/L)
where,
•n AAni^A -. f U / T N Total GAC in reactor (g) Expanded GAC density (g carbon/L) = — ;—;— •^L
Empty bed volume (L) and,
Total GAC in reactor (g) = Settled GAC density (g/L) x Settled GAC volume (L)
Settled GAC density = -29 lbs/ft3 (Calgon literature) = 464.5 g/L Settled GAC volume = 2.95 L (initial GAC loading to 55" bed height) Empty bed volume = 4.7 L (89" bed height) Settled height of GAC/biomass ~1 week prior to bed profile = 65.75"
(last number not used in calculation)
Note: Use of "expanded GAC density" assumes GAC is distributed equally. In actuality, GAC distribution may be a function of biomass thickness, which varies with bed height.
-63-11-74

Calculation of Sludge Age, during steady-state operation:
Sludge age = 8C = bed biomass concentration net rate of biomass generation
Bed biomass (weighted average) = (12,138 mg/L) x (0.9 L) + (12,080) x (1.2) + (12,373) x (1.2) + (15,252) x (1.43) = 61,710 mg
Net rate of biomass generation = average effluent VSS x flow rate = (125 mg/L) x (65.4 L/day) = 8,201 mg/day
Sludge age = 6C = fl^10"S = 7.5 days ^ 8,201 mg/day
-64-n-75

Table II.2 Fluid Bed Profile Data
Bed Height (inches)
83 60 37 14
Bed Height (cm)
211 152 94 35
TSS* (mg/L)
12,138 ±202 12,080 + 264 12,373 ± 802 15,252 ±709
MeCl2 (6/8/93)* (mg/L)
0 0 0
94.8 ± 0.7
MeCh (6/9/931* (mg/L)
0 0 0
82.4 ±1.4
P.O. (6/8/93)*t (mg/L)
2.50 ±0.4 1.23 ±0.2 1.16 ±0.04 5.26 ±0.0
P.O. (6/9/93)* (mg/L)
2.62 ± 0.4 2.39 ± 0.3 2.40 ± 0.7
CJ1
•Average of two samples ± standard deviation. tThe D.O. profiles for 6/8/93 and 6/9/93 are different. This may be a function of temperature, since the 6/8 profile was conducted in the morning and the 6/9 profile was conducted in the afternoon (estimated ~5°C warmer). The change in temperature may have affected the biodegradation rate, and therefore the amount of column required. Sampling for both methylene chloride profiles was conducted in the morning. Sample withdrawal through the port at 83" was slow. I suspect that D.O. levels in these samples were slightly elevated due to absorption of oxygen from air during sampling (~3 or 4 minutes required to withdraw sufficient sample from this port for D.O. measurement).

APPENDIX III: Microbial Stoichiometry (MeCl2 Run I)
Mass Balance Calculations
DCM dehalogenase
CH 2CL 2 ^ - ^ » GS-CH2CL ^ - ^ » GS-CH2OH ^ CH 20 + GSH — JI ^ m vao-<-ri 2vyu — y t s- '
GSH HCI H 2 0 HCI
The product formaldehyde is further converted: CH2O + O2 > CO2 + H2O
Microbial Stoichiometry:
C5H7NO2 + 502 > 5C02 + 2H20 + NH 3
where C5H7NO2 is a molecular formula representation of biomass.
Biomass "COD Equivalent" = 5 , X ^ 2 g = 1.42 g O^/g VSS 113 g
[Actual oxygen demand] = [MeCb COD] -1.42 x [biomass formed]
= 0.77 x[MeCl2 COD]
In words, the chemical oxygen demand (COD) represents the oxygen required to completely oxidize all of the MeCl2 to C0 2 and H 20. However, not all of the MeCl2is completely oxidized. A portion of the MeCl2is only partially oxidized and ends up as new bibmass. The actual oxygen demand can therefore be determined by subtracting the oxygen required to further oxidize this newly formed biomass to C0 2 and H 2 0 (biomass COD equivalent) from the total COD.
-67-11-77

Table III.l Microbial Stoichiometry
Biomass Feed Flow MeC12 Biomass COD
MeC12 Rate COD Formed "Equivalent (mg/L) (L/day) £g/day) (gVSS/day) (g/day)
2011 66.3 50.23 8.288 11.77 2011 66.3 50.23 8.288 11.77 2011 66.3 50.23 8.288 11.77 2030 65.4 50.02 8.175 11.61 2030 65.4 50.02 8.175 11.61 2030 65.4 50.02 8.175 11.61 2030 65.4 50.02 8.175 11.61 1988 65.4 48.98 8.175 11.61
2017.6 65.74 49.97 8.217 11.67
TOD TOD Actual DO Drop Oxygen Oxygen Fraction Across Supply Demand Oxidized Column Rate (g/day) (mg/L) (mol/day)
38.46 0.77 23.7 1.21 38.46 0.77 23.7 1.21 38.46 0.77 23.7 1.21 38.41 0.77 23.7 1.20 38.41 0.77 23.7 1.20 38.41 0.77 23.7 1.20 38.41 0.77 23.7 1.20 37.37 0.76 23.1 1.18
38.30 0.77 23.6 1.20
COD=chemical oxygen demand TOD=theoretical oxygen demand, based on microbial stoichiometry Last row represents average values during steady-state data collection

APPENDIX IV: Operating Data
The following pages contain raw operational fluid bed bioreactor data for the following runs:
-Methylene Chloride Run I -Methylene Chloride Run II -Trichloroethylene
-69-n-79

Table IV.l Operational Data: Methylene Chloride Run I
NaOH NaOH MeCI2 Nutrient Bed Bed Temp. Temp. NaOH Cons. Cons. 02 Delta- Feed Feed Dil.
lime Height .Volume ambient reactor PH Lexel Bale Rats Flow IX) in DO OUt DQ Rate Rate HRT Rale (days) (inches) (L) (deg-C) (deg-C) (ml) (ml/day) (mol/day) (seem) (ppm) (ppm) (ppm) (ml/min) (ml/min) (hr) (1/hr)
0.00 66.25 3.53 21.5 nd 7.50 1680 nd 6.7 0.5 9.5 6.32 0.16 0.73 67.75 3.61 21.5 nd 7.15 1640 55 0.25 7.1 2.08 67.00 3.57 25.0 nd 7.05 1590 37 0.17 5.7 3.00 67.00 3.57 23.0 nd 7.06 1515 82 0.38 53.2 32.1 32.1 0.0 3.92 67.75 3.61 23.0 28.0 7.03 1430 93 0.43 4.4 28.9 27.3 1.6 4.75 67.50 3.60 25.0 29.0 7.16 1320 132 0.61 4.2 25.4 24.0 1.4 5.75 68.50 3.65 23.0 29.0 7.37 1280 40 0.18 4.4 37.5 37.6 -0.1 9.22 6.77 71.50 3.80 25.0 30.0 7.14 1220 59 0.27 3.9 33.2 32.8 0.4 0.71 9.22 6.36 0.16 7.73 72.75 3.87 25.0 30.5 7.05 1075 151 0.69 4.0 24.5 23.1 1.4 0.71 9.22 6.36 0.16 8.75 74.00 3.93 26.0 31.0 7.02 840 230 1.06 3.7 7.6 4.4 3.2 0.71 9.22 6.36 0.16 9.79 75.00 3.98 26.0 32.0 7.12 615 216 0.99 5.1 16.8 12.2 4.6 0.71 9.22 6.36 0.16 10.75 76.75 4.07 23.0 29.0 7.04 410 214 0.98 5.2 21.7 17.5 4.2 0.71 9.22 6.36 0.16 11.75 76.50 4.06 25.0 31.0 7.20 1220 180 0.83 4.9 20.3 17.4 2.9 0.71 9.22 6.36 0.16 12.88 78.00 4.14 22.0 28.0 7.05 1025 173 0.80 5.3 21.9 18.6 3.3 0.72 9 6.50 0.15 13.71 78.50 4.16 22.0 28.0 7.20 885 168 0.77 5.2 20.5 18.6 1.9 1.01 13.87 4.25 0.24 14.71 83.50 4.42 25.0 29.0 7.04 1820 180 0.83 5.1 17.7 14.9 2.8 1.01 13.87 4.25 0.24 16.71 80.00 4.24 27.0 29.0 7.10 1265 278 1.27 5.4 6.2 0.0 6.2 1.01 13.87 4.25 0.24 17.88 71.00 3.78 27.0 30.5 7.20 795 403 1.85 10.2 18.0 6.9 11.1 1.01 13.87 4.25 0.24 18.71 72.00 3.83 27.0 30.0 7.40 480 378 1.74 10.4 22.2 13.2 9.0 1.01 13.87 4.25 0.24 19.75 73.00 3.88 25.5 30.0 7.20 1635 350 1.61 10.5 31.7 29.0 2.8 1.01 13.87 4.25 0.24 20.75 73.00 3.88 27.0 32.0 7.10 1275 360 1.65 10.0 16.0 5.4 10.6 1.01 13.47 4.36 0.23 21.88 75.50 4.01 25.0 27.5 7.07 1090 164 0.75 10.0 0.0 1.01 13.47 4.36 0.23 22.71 75.50 4.01 21.0 26.0 7.06 860 276 1.27 15.9 38.1 1.01 13.47 4.36 0.23 23.71 76.00 4.03 20.0 25.5 7.05 515 345 1.58 9.0 13.0 7.0 6.0 1.01 13.47 4.36 0.23 24.75 76.50 4.06 21.0 26.0 7.20 1730 259 1.19 14.0 39.0 1.01 13.47 4.36 0.23 25.79 76.00 4.03 23.0 27.0 7.08 1305 408 1.87 8.5 10.3 3.8 6.6 1.48 20.25 2.91 0.34 26.77 75.00 3.98 24.0 28.5 7.00 805 511 2.34 11.7 15.2 0.0 15.2 1.48 20.25 2.91 0.34 27.67 75.00 3.98 25.5 30.0 7.26 440 407 1.87 18.0 40.0 40.0 0.0 1.48 20.25 2.91 0.34

Table IV.l Operational Data: Methylene Chloride Run I (continued)
s
NaOH NaOH MeC12 Nutrient Bed Bed Temp. Temp. NaOH Cons. Cons. 02 Delta- Feed Feed Dil.
lime Height Volume ambient reacioi PH Level Rate Eats Flow POin DO out DQ Rate Rale HRT Rate (days) (inches) (L) (deg-C) (deg-C) (ml) (ml/day) (mol/day) (seem) (ppm) (ppm) (ppm) (ml/min) (ml/min) (hr) (l/hr)
29.88 77.00 4.08 1060 335 1.54 15.0 1.48 20.25 2.91 0.34 30.75 77.00 4.08 25.0 29.0 7.13 690 423 1.94 9.0 33.9 29.3 4.6 2.25 29.7 1.98 0.51 31.71 79.00 4.19 23.0 27.0 7.13 90 626 2.87 11.5 2.25 29.7 1.98 0.51 32.92 79.50 4.21 25.0 29.0 7.05 1575 352 1.61 13.5 38.5 17.4 21.1 2.25 29.7 1.98 0.51 34.04 74.00 3.93 20.0 25.1 5.80 1185 347 1.59 11.6 2.25 29.7 1.98 0.51 34.75 75.00 3.98 19.0 25.0 7.10 900 402 1.85 12.3 38.1 22.8 15.3 2.25 29.7 1.98 0.51 35.71 76.00 4.03 23.0 27.0 7.23 1655 360 1.65 11.1 38.3 28.3 10.0 2.25 29.7 1.98 0.51 36.71 77.00 4.08 24.0 28.5 7.04 1270 385 1.77 10.4 22.0 3.9 18.1 2.25 29.7 1.98 0.51 37.67 78.00 4.14 7.10 900 386 1.77 12.3 35.8 23.4 12.4 2.25 29.7 1.98 0.51 38.79 79.50 4.21 22.0 26.5 7.26 480 373 1.71 12.7 36.1 28.6 7.5 2.25 39.6 1.51 0.66 39.77 81.00 4.29 24.0 27.0 6.80 1590 419 1.92 12.9 32.2 12.1 20.1 2.96 39.6 1.48 0.67
1 1—1 40.75 83.50 4.42 26.0 29.5 6.82 1115 485 2.23 11.5 17.9 0.0 17.9 3.27 39.6 1.47 0.68 1 41.75 84.00 4.44 26.0 31.0 6.79 510 605 2.78 29.5 39.2 0.0 39.2 3.68 39.6 1.46 6.69
42.71 89.50 4.73 25.0 29.0 6.95 1120 814 3.74 41.3 39.5 0.0 39.5 4.09 39.6 1.45 0.69 43.81 89.50 4.73 27.0 30.5 7.00 250 788 3.62 38.0 40.4 0.0 40.4 4.09 39.6 1.45 0.69 44.71 89.50 4.73 26.0 30.0 7.00 1320 759 3.48 39.8 40.1 0.0 40.1 4.09 39.6 1.45 0.69 45.69 89.50 4.73 25.0 29.5 6.64 460 878 4.03 42.0 39.6 0.0 39.6 4.49 39.6 1.43 0.70 46.75 89.50 4.73 27.0 31.0 6.62 1100 847 3.89 39.3 39.4 0.0 39.4 5.1 39.6 1.41 0.71 47.85 89.50 4.73 29.0 32.5 6.73 1225 946 4.34 37.3 38.5 0.0 38.5 5.61 39.6 1.40 0.72 48.88 89.50 4.73 27.0 32.0 6.60 1020 1122 5.15 39.5 39.1 0.0 39.1 6.12 39.6 1.38 0.72 49.73 89.50 4.73 25.5 30.0 6.78 1175 966 4.43 39.4 38.6 0.0 38.6 6.12 39.6 1.38 0.72 50.73 89.50 4.73 27.0 31.0 6.70 1065 935 4.29 38.6 39.3 0.0 39.3 6.12 39.6 1.38 0.72 51.67 89.50 4.73 26.0 30.5 6.76 1170 885 4.06 40.5 39.2 0.0 39.2 6.12 39.6 1.38 0.72 52.71 89.50 4.73 22.0 22.0 7.00 500 643 2.95 46.7 38.6 0.0 38.6 6.12 39.6 1.38 0.72 54.96 89.50 4.73 20.5 25.0 7.20 1385 273 1.25 24.0 27.0 0.0 27.0 6.63 39.6 1.37 0.73 55.94 89.50 4.73 20.0 24.0 6.76 965 429 3.94 28.0 31.5 0.0 31.5 5.1 39.6 1.41 0.71 58.88 89.50 4.73 19.5 23.0 6.85 1445 121 1.11 24.0 38.3 2.7 35.6 5.17 36.7 1.51 0.66 60.85 89.50 4.73 15.0 19.0 6.64 805 323 2.97 17.1 24.8 0.0 24.8 4.59 38.4 1.47 0.68

Table IV.l Operational Data: Methylene Chloride Run I (continued)
NaOH NaOH MeC12 Nutrient Bed Bed Temp. Temp. NaOH Cons. Cons. 02 Delia- Feed Feed Dil.
Time Height Volume ambient macjoi pH Leiel Rate Rate Em DO in DO out DQ Rale Rate HR1 Rale (days) (inches) (L) (deg-C) (deg-C) (ml) (ml/day) (mol/day) (seem) (ppm) (ppm) (ppm) (ml/min) (ml/min) (hr) (1/hr)
61.79 89.50 4.73 16.0 19.0 7.15 1685 421 3.87 21.0 31.6 0.0 31.6 4.59 38.4 1.47 0.68 62.94 89.50 4.73 21.5 25.0 7.09 1235 393 3.61 13.5 30.4 0.0 30.4 4.59 38.4 1.47 0.68 65.67 89.50 4.73 17.0 21.0 7.08 1230 405 3.72 19.0 20.1 0.0 20.1 4.58 39.5 1.43 0.70 66.71 89.50 4.73 25.5 28.5 6.96 795 418 3.83 19.9 32.1 0.0 32.1 4.58 39.5 1.43 0.70 67.67 89.50 4.73 14.0 18.0 7.32 1585 433 3.98 26.4 27.8 0.0 27.8 4.8 39.5 1.43 0.70 68.75 89.50 4.73 15.0 19.0 6.90 1130 420 3.86 25.5 24.6 6.7 17.9 4.8 39.5 1.43 0.70 73.79 89.50 4.73 21.5 25.5 7.13 510 282 2.59 21.3 16.8 0.0 16.8 4.75 41.3 1.37 0.73 74.71 89.50 4.73 20.5 24.0 7.88 1630 404 3.71 21.9 18.5 0.0 18.5 4.75 41.3 1.37 0.73 75.73 89.50 4.73 23.0 26.0 6.78 1215 407 3.73 20.8 17.5 0.0 17.5 4.75 41.3 1.37 0.73 76.67 89.50 4.73 20.0 24.0 6.88 870 368 3.38 24.4 16.1 0.0 16.1 4.73 40.7 1.39 0.72 77.71 89.50 4.73 19.0 22.0 6.70 1470 509 4.67 22.4 20.0 0.0 20.0 4.73 40.7 1.39 0.72 78.71 89.50 4.73 18.0 23.0 7.15 1150 320 2.94 24.3 17.0 0.0 17.0 4.73 40.7 1.39 0.72 79.71 89.50 4.73 21.0 24.0 6.67 740 410 3.76 23.5 14.2 0.0 14.2 4.73 40.7 1.39 0.72 80.67 89.50 4.73 23.0 27.0 6.75 290 470 4.31 21.2 4.73 40.7 1.39 0.72

Table IV. l Operational Data: Methylene Chloride Run I (continued)
TOD Theor. MeC12 MeC12 Feed MeC12 Across NaOH Deg. FeedRes Stream Effluent Feed Effluent Effluent Effluent Effluent Feed MeC12
lime Recycle Column Cons. Bale. Cone. MeC12 MeC12 a a CI Stdev a CI Stdev Rate Load (days) Ratio (mg/l) (mol/day) (g/L/hr) (mg/l) (mg/l) (mg/l) (mM) (mM) (mM) (ppm) (ppm) (g/hr) (g/L-nr)
0.00 0.73 2.08 3.00 3.92
119.00 0.00 9972 <50 97 96 184
0.04 1.72 0.07 0.05
19.00 20.61 12.84 4.99
1.176 1.056 0.366 0.199
673.614 730.529 455.289 176.992
41.696 37.443 12.962 7.071
4.75 5.75
14573 323 nd 0.05
2.88 3.69
0.275 0.022
102.234 130.876
9.752 0.774
6.77 119.85 2.10 0.21 0.10 632 0.05 3.30 0.288 116.935 10.193 7.73 119.85 0.90 0.09 0.04 271 0.05 5.10 0.382 180.655 13.525 8.75 119.85 0.50 0.05 0.02 149 0.08 6.24 0.997 221.138 35.353 9.79 119.85 2.22 0.22 0.10 668 0.06 7.90 0.600 280.015 21.260
P0. o3 10.75 119.85 0.74 0.07 0.03 222 0.13 7.57 0.552 268.306 19.564 UJ Y 11.75
12.88 119.85 122.46 2.49 0.25 0.11 765
12.25 0.713 434.440 25.291
13.71 79.65 4.99 0.51 0.21 20002 1001 0 11.67 0.449 413.730 15.927 1.212 0.26 14.71 79.65 3.24 0.33 0.13 651 0 8.14 0.059 288.738 2.102 16.71 79.65 4.27 0.43 0.18 856 0 5.89 0.067 208.857 2.389 17.88 79.65 4.49 0.46 0.21 17125 902 0 10.36 0.143 367.196 5.064 1.038 0.22 18.71 79.65 4.48 0.45 0.21 21930 900 0 11.76 0.052 417.044 1.843 1.329 0.28 19.75 20.75 21.88 22.71
79.65 81.87 81.87 81.87
7.53 0.76 0.35 22273 1512 0 0 + 0
12.89 10.13 5.68 12.98
0.039 0.199 0.101 0.368
456.994 359.100 201.349 460.150
1.368 7.052 3.570 13.045
1.350 0.29
23.71 24.75
81.87 81.87
4.27 0.43 0.19 23040 881 0 0
24.80 4.87
0.775 0.035
879.315 172.691
27.459 1.242
1.396 0.30
25.79 54.22 6.64 0.67 0.29 13396 912 0 8.78 1.416 311.386 50.184 1.190 0.25 26.77 54.22 9.09 0.92 0.41 18347 1250 0 8.68 0.055 307.668 1.942 1.629 0.35 27.67 54.22 10.64 1.08 0.48 21468 1462 0 14.29 0.041 506.595 1.438 1.906 0.41

Table IV.l Operational Data: Methylene Chloride Run I (continued)
TOD Theor. MeC12 MeC12 Feed MeCl2 Across NaOH Deg. FeedRes Stream Effluent Feed Effluent Effluent Effluent Effluent Feed MeC12
lime EscyclS Column Cons. Bate. Cone. McC12 MeCI2 CI CI CI Stdev CI CI Stdev fialfi Lead (days) RaUo (mg/1) (mol/day) (g/Uhr) (mg/1) (mg/1) (mg/1) (mM) (mM) (mM) (ppm) (ppm) (g/hr) (g/L-nr)
29.88 0 13.30 0.113 471.604 4.022 30.75 54.22 0 9.45 0.070 335.195 2.474 31.71 36.56 1.41 0.60 18498 1303 0 10.04 0.031 356.063 1.104 2.497 0.53 32.92 36.56 13.94 1.21 0.51 15839 1115 0 12.60 0.009 446.882 0.317 2.138 0.45 34.04 36.56 11.93 0 13.91 0.010 493.080 0.366 34.75 36.56 0 26.37 0.018 934.722 0.639 35.71 36.56 1.52 0.67 19940 1404 0 10.69 0.034 378.987 1.196 2.692 0.57 36.71 36.56 15.02 1.17 0.51 15317 1079 0 16.97 0.059 601.577 2.109 2.068 0.44 37.67 36.56 11.54 0 10.09 0.049 357.666 1.748 38.79 36.56 1.57 0.66 20636 1109 0 10.91 0.040 386.846 1.404 2.786 0.59 39.77 27.67 15.55 0.76 0.32 7622 530 0 23.51 0.106 833.642 3.753 1.354 0.29 40.75 27.20 7.56 0.94 0.38 8451 645 0 26.81 950.371 1.658 0.35 41.75 26.99 9.25 2.32 0.92 18617 1583 0 24.13 855.449 4.111 0.87 42.71 26.73 22.94 1.26 0.47 9060 848 31.85 1129.151 2.223 0.47 43.81 26.47 12.41 2.49 0.93 17969 1682 27.34 969.201 4.409 0.94 44.71 26.47 24.61 1.59 0.60 11473 1074 0 30.94 1096.947 2.815 0.60 45.69 26.47 15.71 2.04 0.76 13379 1362 0 21.27 754.248 3.604 0.77 46.75 26.22 20.12 1.37 0.51 7932 905 0 18.31 649.201 2.427 0.52 47.85 25.85 13.55 0 17.63 624.938 48.88 25.54 0 35.15 1246.168 49.73 25.25 0 42.82 1518.105 50.73 25.25 0 36.22 1284.084 51.67 25.25 4.48 1.68 21608 2892 0 36.25 1285.270 7.934 1.69 52.71 25.25 44.28 4.48 1.68 21608 2892 135.2 22.52 798.409 7.934 1.69 54.96 25.25 44.28 4.86 1.82 21608 3099 192.3 37.46 1328.071 8.596 1.83 55.94 24.96 47.97 3.58 1.34 20697 2361 54.7 61.74 2188.822 6.333 1.35 58.88 25.85 35.35 3.42 1.28 19500 2408 0 23.40 829.586 6.049 1.29 60.85 27.66 33.76 3.03 1.14 19500 2082 0 25.94 919.626 5.370 1.14

Table IV.l Operational Data: Methylene Chloride Run I (continued)
Theor. MeC12 MeC12 Feed MeCl2 Across NaOH Deg. FeedRes Stream Effluent Feed Effluent Effluent Effluent Effluent Feed MeC12
lime Recvcle Column Cons* Bats Cone* MeC12 MeC12 ci a CI Stdev a CI Stdev Eats Load (days) Ratio (mg/l) (mol/day) (g/L/hr) (mg/l) (mg/l) (mg/l) (mM) (mM) (mM) (ppm) (ppm) (g/hr) (g/L-hr)
61.79 26.91 29.97 3.03 1.14 19500 2082 0 23.22 823.252 5.370 1.14 62.94 26.91 29.97 3.03 1.14 19500 2082 0 39.15 1387.888 5.370 1.14 65.67 26.22 29.91 3.03 1.13 19500 2026 0 17.15 608.051 5.359 1.14 66.71 26.22 29.91 3.03 1.13 19500 2026 0 35.96 1274.829 5.359 1.14 67.67 26.09 31.34 3.17 1.19 19500 2113 0 25.11 890.346 5.616 1.19 68.75 26.09 31.34 3.17 1.19 19500 2113 0 34.42 1220.197 5.616 1.19 73.79 25.06 31.02 3.14 1.18 19500 2011 0 39.22 0.007 1390.337 0.240 5.558 1.18 74.71 25.06 31.02 3.14 1.18 19500 2011 0 40.98 0.208 1452.807 7.391 5.558 1.18 75.73 25.06 31.02 3.14 1.18 19500 2011 0 41.83 0.375 1482.954 13.292 5.558 1.18 76.67 25.41 30.89 3.13 1.17 19500 2030 0 43.28 0.677 1534.234 24.001 5.534 1.18 77.71 25.41 30.89 3.13 1.17 19500 2030 0 43.13 0.222 1529.098 7.884 5.534 1.18 78.71 25.41 30.89 3.13 1.17 19500 2030 0 43.47 0.535 1541.304 18.981 5.534 1.18 79.71 25.41 30.89 .3.13 1.17 19500 2030 0 43.83 0.331 1553.793 11.741 5.534 1.18 80.67 25.41 30.25 3.06 1.15 19097 1988 0 44.06 0.342 1562.019 12.128 5.420 1.15

Table IV.2 Operational Data: Methylene Chloride Run II
MeC12 MeC12 Nutrient Total Feed MeC12 Feed FeedRes Feed Feed Stream Effluent MeC12 Feed Effluent Effluent
Time Rate Cone. Rate Rate MeC12 MeC12 Load Rate CI a (days) (ml/min) (mg/1) (ml/min) (mL/min) (mg/1) (mg/1) (g/L-hr) (g/hr) (mM) (mg/L)
0 0 0 0 0 0 1.2 1 19,500 28.7 29.7 656.6 0.32 1.17 4.0 1 21,297 28.7 29.7 717.1 136.8 0.35 1.28 0.52 18.5 4.9 1 22,015 28.7 29.7 741.2 180.7 0.37 1.32 0.78 27.8 6.1 7.3 1 20,937 28.7 29.7 704.9 187.2 0.35 1.26 10.70 379.4 8.2 1 20,937 28.7 29.7 704.9 114 0.35 1.26 25.98 921.2
10.9 2 22,120 28.7 30.7 1441.0 0 0.74 2.65 17.29 613.0 12.0 3 21233 28.7 31.7 2009.4 0 1.06 3.82 34.12 1209.7 12.8 3 24052 28.7 31.7 2276.2 0 1.19 4.33 55.27 1959.4 14.0 5.3 21796 53 58.3 1981.5 0 1.89 6.93 37.08 1314.6 14.8 5.3 21796 56.2 61.5 1878.4 0 1.87 6.93 33.25 1179.0 15.8 5.3 21796 56.2 61.5 1878.4 0 1.89 6.93 42.31 1499.9 16.8 18.0 19.3 5.3 21796 55.5 60.8 1900.0 0 1.85 6.93 45.81 1624.2 20.1 5.3 21796 55.5 60.8 1900.0 0 1.83 6.93 27.60 978.6 20.8 5.3 21796 55.5 60.8 1900.0 0 1.85 6.93 31.14 1104.2 21.9 6.33 21796 64.4 70.73 1950.6 22.1 5 21796 64.4 69.4 1570.3 22.5 5 21796 64.4 69.4 1570.3 23.5 5 21796 64.4 69.4 1570.3 24.5 5 21796 64.4 69.4 1570.3 1.53 6.54 25.9 7.3 21796 53.4 60.7 2621.3 0 2.25 9.55 31.06 1101.3 26.9 7.3 21796 54 61.3 2595.6 0 2.22 9.55 20.41 723.6 27.1 27.9 7.3 21796 54 61.3 2595.6 0 2.03 9.55 41.56 1473.5 28.1 29.0 29.1 29.9 30.9 7.3 21796 54 61.3 2595.6 0 2.03 9.55 48.36 1714.7 31.8 7.3 21796 54 61.3 2595.6 0 2.03 9.55 37.43 1327.2 32.2 33.1 33.8 7.3 21796 54 61.3 2595.6 0 2.03 9.55 51.02 1808.7 34.1 34.9 35.9 8.2 21796 54 62.2 2873.4 2.28 10.72 53.17 1885.1
-76-
11-86

Table IV.2 Operational Data: Methylene Chloride Run II (continued)
Bed Bed Temp. Temp. 02 DO Delta-Time Height Volume pH reactor ambient Flow DO out DO in 02-sat DO (days) (inches) (L) (deg-C) (deg-C) (seem) (ppm) (ppm) (ppm) (ppm)
0 61.7 3.30 6 1.2 69.75 3.71 7.5 7.6 0 4.0 68.5 3.65 6.88 25 20 10 980 1004 1017 0.94 4.9 67.5 3.60 6.82 25 20 7.1 982 1004 1017 0.87 6.1 67.25 3.58 7.3 67.5 3.60 6.65 5.6 711 1004 1017 11.52 8.2 67.25 3.58 6.77 25 20.5 10 0 140 946 5.92 10.9 67.6 3.60 6.85 28 24.5 11.5 811 12.0 68 3.62 7.05 28 23 10.1 765 768 866 0.14 12.8 68.5 3.65 6.68 26 21 10.7 655 698 940 1.83 14.0 69 3.67 6.89 27 24 10.1 68 200 897 5.89 14.8 69.5 3.70 6.95 23 19.5 16.7 385 595 1042 8.06 15.8 69 3.67 15.4 65 16.8 69.75 3.71 6.94 20.1 387 18.0 70.25 3.74 19.1 130 19.3 70.25 3.74 25 20 16.3 123 20.1 71.25 3.79 7.45 16 10 22.5 486 672 1042 7.14 20.8 70.6 3.75 7.03 26 23 15.4 0 197 937 8.41 21.9 22.1 22.5 23.5 24.5 80.5 4.26 25.9 80 4.24 6.76 22.5 19 23 543 808 1054 10.06 26.9 81.25 4.30 7.27 24.5 20.5 20.7 630 839 960 8.71 27.1 27.9 89 4.70 6.9 24.5 20 31.5 114 764 975 26.67 28.1 29.0 89 4.70 6.6 23 19 31.7 112 29.1 29.9 30 30.9 89 4.70 35 0 31.8 89 4.70 6.6 24 19 36 122 984 1019 33.84 32.2 33.1 40 33.8 89 4.70 45 2 852 1000 34.00 34.1 34.9 35.9 89 4.70
-77-H-87

Table IV.2 Operational Data: Methylene Chloride Run II (continued)
NaOH Tneor. Recycle Dil. NaOH Cons. NaOH
Time Ratio HRT Rate Level Rate Cons. (days) (min) (l/hr) (ml) (mol/day) (mol/day)
0 1.2 54.2 124.9 0.48 2000 4.0 54.2 122.8 0.49 2000 0.00 0.72 4.9 54.2 121.0 0.50 2000 0.00 0.75 6.1 1860 0.11 7.3 54.2 121.0 0.50 1380 0.39 0.71 8.2 54.2 120.6 0.50 490 1.07 0.71 10.9 52.4 117.3 0.51 1350 1.09 1.50 12.0 50.7 114.2 0.53 1070 1.16 2.16 12.8 50.7 115.0 0.52 650 2.31 2.45 14.0 27.1 63.0 0.95 1430 2.28 3.92 14.8 25.7 60.1 1.00 715 4.04 3.92 15.8 25.7 59.7 1.00 1335 2.97 3.92 16.8 1220 3.58 18.0 580 5.59 19.3 26.0 61.5 0.98 230 3.11 3.92 20.1 26.0 62.3 0.96 1395 4.71 3.92 20.8 26.0 61.8 0.97 815 4.64 3.92 21.9 0.00 22.1 1115 3.07 0.00 22.5 0.00 23.5 0.00 24.5 660 3.45 3.70 25.9 26.0 69.8 0.86 1525 2.04 5.39 26.9 25.8 70.2 0.85 1010 2.97 5.39 27.1 890 2.88 27.9 25.8 76.7 0.78 1325 5.40 5.39 28.1 1105 5.28 29.0 1220 5.48 29.1 1120 4.43 29.9 1180 6.85 30.9 25.8 76.7 0.78 1115 5.31 5.39 31.8 25.8 76.7 0.78 1140 5.38 5.39 32.2 840 4.80 33.1 1100 5.76 33.8 25.8 76.7 0.78 1180 6.95 5.39 34.1 980 4.80 34.9 1000 7.38 35.9 25.4 75.6 0.79 1235 4.69 6.06
-78-U-88

Table IV.3 Operational Data: Trichloroethylene
NaOH Feed Effluent NaOH delta- Cons. Effluent Res. Effluent Effluent Phenol
Time PH Level NaOH Rale TCEConc. TCEConc. CI Cone. CI Stdev Cone. (days) (ml) (ml) (mol/day) (ppm) (ppm) (mM) (mM) (ppm)
0 0.26 0.9 7.03 1915 0.37 0.055 0.019 0.00 1.8 7.18 1687 228 0.26 0.29 0.017 0.002 0.09 2.9 7.22 1425 262 0.22 0.33 1478.8 0.023 0.005 0.07 3.9 6.95 1190 235 0.24 0.37 1299.7 0.065 0.00 4.9 7.21 1760 240 0.24 0.36 1231.2 0.081 0.013 0.40 5.9 7.32 1550 210 0.21 0.39 957.0 0.072 0.010 0.19 6.9 6.95 1310 240 0.24 0.46 1441.3 0.083 0.005 0.15 7.9 7.16 1090 220 0.22 0.51 2579.3 0.045 0.008 0.21 8.9 7.09 910 180 0.18 0.62 1620.7 0.030 0.008 0.16 10.0 7.00 600 310 0.28 0.73 1215.2 0.018 0.007 0.07 10.8 7.10 1815 185 0.24 0.033 0.004 0.07 11.8 7.01 1675 140 0.14 1.01 1431.34 0.111 0.002 0.08 12.8 7.04 1495 180 0.18 1.13 1765.30 0.086 0.005 0.08 13.9 7.06 1280 215 0.19 1.28 3113.06 0.094 0.031 0.06 14.8 7.30 1155 125 0.15 1.54 0.320 0.025 0.07 15.8 7.12 1030 125 0.13 16.9 7.25 1820 180 0.16 1.71 1278.59 0.370 0.030 0.04 17.9 7.37 1710 110 0.11 1.96 1851.90 0.405 0.024 0.03 18.9 7.10 1590 120 0.12 0.388 0.008 0.03 19.9 7.20 1450 140 0.14 0.369 0.009 0.08 20.9 7.16 1340 110 0.11 0.361 0.001 0.00 21.8 7.32 1290 50 0.06 2.70 1057.62 0.126 0.004 0.00 22.9 7.02 1290 0 0.00 3.08 1178.00 0.102 0.004 0.00 23.9 6.94 1290 0 0.00 3.30 1069.53 0.108 0.006 0.00 24.9 7.07 1200 90 0.09 4.44 1162.32 0.118 0.015 0.00 25.9 7.16 860 340 0.34 5.57 1190.16 0.048 0.000 0.20 26.9 6.95 970 840 0.84 4.46 1128.56 0.085 0.003 0.27 27.9 7.01 1760 240 0.72 3.97 1123.62 0.194 0.001 0.00 28.8 '7.20 1555 205 0.74 4.60 1070.38 0.146 0.004 0.00 29.9 6.90 1190 365 0.94 4.25 1125.23 0.119 0.009 0.00 30.9 7.13 910 280 0.84 4.72 1156.54 0.099 0.000 0.00 31.9 6.88 1810 220 0.66 5.41 960.60 0.036 0.000 0.00 32.9 6.97 1550 260 0.78 4.90 906.60 0.074 0.000 0.00 33.9 6.90 1290 260 0.78 4.81 937.40 0.060 0.006 34.9 6.98 1020 270 0.81 6.43 1197.13 0.083 0.001 0.00 35.8 6.86 1820 200 0.70 6.41 1180.46 0.062 0.000 0.00 36.9 7.00 1520 300 0.79 6.37 1182.83 0.050 0.002 0.00 37.9 6.98 1210 310 0.93 7.09 1208.27 0.064 0.005 0.00 38.9 6.94 940 270 0.81 7.45 1227.06 0.055 0.007 0.00 39.9 6.85 660 280 0.84 7.45 1230.81 0.014 0.005 40.9 6.9 1780 220 0.66 7.48 1173.31 0.002 0.002 41.9 6.91 1500 280 0.84 7.71 1188.92 0.000 0.000 42.9 0.00 7.55 1139.80 43.9 6.91 1690 310 0.93 7.91 1051.00 44.9 7.39 1340 350 1.05 7.28 1092.85
-79-H-89

Table IV.3 Operational Data: Trichloroethylene (continued)
Max. Bed Bed DO Delta- Temp. Temp.
Tim? Height Volume D O OUt D O out 02-Sat. D O in D O in DQ reactor reactor (days) (in.) (L) (reading) (ppm) (reading) (reading) (ppm) (ppm) (deg-C) (deg-C)
0 0.9 62.0 3.31 738 39.4 750 34.3 34.3 1.8 62.0 3.31 270 14.4 750 33.0. 34.3 2.9 62.0 3.31 483 25.2 766 500 26.1 0.9 30.8 35.8 3.9 62.0 3.31 197 10.7 739 310 16.8 6.1 33.9 35.8 4.9 64.5 3.44 442 21.0 843 448 21.3 0.3 29.9 35.8 5.9 66.0 3.52 450 19.5 922 526 22.8 3.3 28.1 35.8 6.9 66.8 3.56 336 15.9 843 390 18.5 2.6 30.6 31.1 7.9 68.0 3.62 322 14.9 866 390 18.0 3.1 29.7 30.7 8.9 68.3 3.63 421 19.5 862 390 18.1 0.0 29.5 29.7 10.0 67.5 3.60 494 22.4 884 537 24.3 1.9 27.9 29.7 10.8 66.5 3.54 315 14.7 860 360 16.7 2.1 29.2 29.3 11.8 67.3 3.58 276 12.9 854 332 15.6 2.6 28.7 29.3 12.8 71.0 3.78 371 16.5 899 433 19.3 2.8 27.5 29.7 13.9 71.5 3.80 464 19.5 954 503 21.1 1.6 26.5 28.7 14.8 73.0 3.88 244 11.0 885 271 12.2 1.2 24.2 24.4 15.8 73.0 3.88 16.9 75.0 3.98 316 13.1 963 450 18.7 5.6 17.9 76.0 4.03 297 13.0 911 450 19.8 6.7 26.9 27.1 18.9 71.3 3.79 460 20.6 895 615 27.5 6.9 27.7 29.0 19.9 69.5 3.70 551 25.1 877 615 28.1 2.9 28.2 29.7 20.9 66.5 3.54 • 608 26.6 916 594 25.9 0.0 27.9 28.5 21.8 67.8 3.61 22.6 29.2 22.9 66.5 3.54 29 1.3 911 809 35.5 34.2 24.7 28.1 23.9 68.8 3.66 802 33.7 952 809 34.0 0.3 26.7 24.9 68.8 3.66 618 27.6 895 595 26.6 0.0 28.2 28.2 25.9 77.0 4.08 -13 0.0 950 115 4.8 4.8 26.5 29.7 26.9 83.4 4.41 -13 0.0 1037 575 22.2 22.2 24.7 26.5 27.9 89.0 4.70 31 1.4 904 453 20.0 18.7 27.8 27.9 28.8 89.0 4.70 328 13.5 971 770 31.7 18.2 25.9 28.3 29.9 89.0 4.70 -13 0.0 920 400 17.4 17.4 27.2 28.8 30.9 89.0 4.70 -12 0.0 850 274 12.9 12.9 29.3 29.4 31.9 89.0 4.70 -12 0.0 874 177 8.1 8.1 28.4 30.4 32.9 89.0 4.70 -13 0.0 895 352 15.7 15.7 27.7 29.1 33.9 89.0 4.70 -12 0.0 819 195 9.5 9.5 29.4 28.8 34.9 89.0 4.70 -10 0.0 744 270 14.5 14.5 32.5 32.6 35.8 89.0 4.70 0 0.0 808 789 39.1 39.1 29.6 37.2 36.9 89.0 4.70 340 15.2 893 550 24.6 9.4 27.2 30.7 37.9 89.0 4.70 119 5.7 833 450 21.6 15.9 29.1 29.1 38.9 89.0 4.70 -9 0.0 752 332 17.7 17.7 31.9 32.0 39.9 89.0 4.70 70 3.5 810 400 19.8 16.3 28.8 32.5 40.9 91.0 4.80 -11 0.0 882 550 24.9 24.9 28.5 30 41.9 92.0 4.86 -12 0.0 872 630 28.9 28.9 28.3 28.8 42.9 43.9 89.0 4.70 -11 0.0 795 44 2.2 2.2 30.6 30.6 44.9 91.0 4.80 -12 0.0 830 3 0.1 0.1 29.5 34.7
-80-
11-90

Table IV.3 Operational Data: Trichloroethylene (continued)
Min. Nutrient TCE Phenol Phenol Total Feed Temp. Temp. Temp. Feed Feed Feed Reservoir Feed Stream
Time reactor amiient TCE res. Rate Rate Rate Cone. Rate TCE (days) (deg-C) (deg-C) (deg-C) (ml/min) (ml/min) (ml/min) (%) (L/day) (ppm)
0 0.9 28.7 29.3 19.6 32.5 ,.1.83 0.29 0.8 49.85 1.8 32.3 19.7 32.5 1.83 0.29 0.8 49.85 2.9 29.6 32.0 '32.5 1.83 0.29 0.8 49.85 78.2 3.9 28.2 32.0 32.5 1.83 0.29 0.8 49.85 68.7 4.9 28.2 29.0 32.5 1.83 0.29 0.8 49.85 65.1 5.9 26.4 27.0 32.5 1.83 0.29 0.8 49.85 50.6 6.9 27.9 28.5 32.5 1.83 0.29 0.8 49.85 76.2 7.9 27.3 28.5 32.5 1.83 0.29 0.8 49.85 136.3 8.9 28.6 29.0 32.5 1.83 0.29 0.8 49.85 85.7 10.0 26.5 24.0 19.6 32.5 1.83 0.29 0.8 49.85 64.2 10.8 26.5 30.0 19.6 31.6 1.83 0.29 0.8 48.56 11.8 26.3 25.0 22.4 31.6 1.83 0.29 0.8 48.56 77.7 12.8 25.8 24.5 24.2 31.6 1.83 0.29 0.8 48.56 95.8 13.9 25.6 23.0 24.2 31.6 2.39 0.3 0.8 49.38 217.0 14.8 23.7 30.0 29.1 31.6 2.13 0.3 0.8 49.00 15.8 28.0 24.2 31.6 2.13 0.3 0.8 49.00 16.9 24.0 24.3 31.6 2.13 0.3 0.8 49.00 80.0 17.9 25.7 24.5 24.2 31.6 2.13 0.3 0.8 49.00 115.9 18.9 25.8 27.0 24.2 31.6 2.13 0.3 0.8 49.00 19.9 26.0 25.0 24.2 31.6 2.13 0.3 0.8 49.00 20.9 25.7 26.0 24.2 31.6 2.14 0 0.8 48.59 21.8 22.1 25.0 24.2 31.6 2.14 0 0.8 48.59 67.1 22.9 22.1 25.0 31.6 2.14 0 0.8 48.59 74.7 23.9 21.8 24.0 31.6 2.14 0.3 0.8 49.02 67.2 24.9 24.4 25.0 24.2 31.6 2.13 1.24 1 50.36 70.8 25.9 25.6 24.0 24.2 31.6 2.13 1.24 1 50.36 72.5 26.9 24.2 23.0 24.2 31.6 2.1 1.3 1 50.40 67.7 27.9 21.9 26.0 24.2 31.6 1.94 0.63 2 49.20 63.8 28.8 24.4 25.0 24.1 31.6 1.94 0.63 2 49.20 60.8 29.9 25.4 25.5 24.0 31.6 1.94 0.63 2 49.20 63.9 30.9 25.3 .28.0 24.2 31.1 2.08 0.67 2 48.74 71.1 31.9 22.6 27.0 24.3 31.1 2.08 0.67 2 48.74 59.0 32.9 26.0 26.0 23.8 31.1 2.08 0.67 2 48.74 55.7 33.9 29.0 24.3 31.1 2.08 0.67 2 48.74 57.6 34.9 26.3 31.0 24.4 31.1 2.08 0.67 2 48.74 73.6 35.8 29.5 27.0 24.2 31.1 2.08 0.67 2 48.74 72.5 36.9 26.2 26.0 23.9 31.1 2.08 0.67 2 48.74 72.7 37.9 25.7 28.0 24.2 31.1 2.08 0.67 2 48.74 74.2 38.9 27.0 31.0 24.3 31.1 2.09 0.67 2 48.76 75.7 39.9 23.8 25 23.9 31.1 2.09 0.67 2 48.76 76.0 40.9 25 25.5 24 31.1 2.09 0.67 2 48.76 72.4 41.9 31.1 2.09 0.67 2 48.76 73.4 42.9 25.4 29.5 24.2 31.1 2.09 0.67 2 48.76 70.4 43.9 27.4 28 24 31.1 2.09 0.67 2 48.76 64.9 44.9 31.1
-81-11-91

Table IV.3 Operational Data: Trichloroethylene (continued)
Feed Feed TCE Phenol Stream Phenol: Feed TCE Feed Phenol Recycle Dil.
Time Phenol ICE Rate Load Rate Load BaHQ HRT Bale JS£ XSS. (days) (ppm) Ratio (g/hr) (g/L-hr) (g/hr) (g/L-br) (min) (1/hr) (mg/L) (mg/L)
0 0.000 0.000 0.9 67.0 0.000 0.000 0.139 0.042 31.5 95.7 0.63 1.8 67.0 0.000 0.000 0.139 0.042 31.5 95.7 0.63 2.9 67.0 0.9 0.162 0.049 0.139 0.042 31.5 95.7 0.63 3.9 67.0 1.0 0.143 0.043 0.139 0.042 31.5 95.7 0.63 4.9 67.0 1.0 0.135 0.039 0.139 0.040 31.5 99.4 0.60 5.9 67.0 1.3 0.105 0.030 0.139 0.040 31.5 101.6 0.59 6.9 67.0 0.9 0.158 0.044 0.139 0.039 31.5 102.7 0.58 7.9 67.0 0.5 0.283 0.078 0.139 0.038 31.5 104.6 0.57 8.9 67.0 0.8 0.178 0.049 0.139 0.038 31.5 105.0 0.57 10.0 67.0 1.0 0.133 0.037 0.139 0.039 31.5 103.8 0.58 10.8 68.8 0.000 0.000 0.139 0.039 32.4 105.1 0.57 11.8 68.8 0.9 0.157 0.044 0.139 0.039 32.4 106.2 0.56 14.7 21.5 12.8 68.8 0.7 0.194 0.051 0.139 0.037 32.4 112.0 0.54 19.4 23.4 13.9 70.0 0.3 0.446 0.117 0.144 0.038 31.8 110.9 0.54 14.8 70.5 0.000 0.000 0.144 0.037 32.1 114.0 0.53 15.8 70.5 0.000 0.000 0.144 0.037 32.1 114.0 0.53 16.9 70.5 0.9 0.163 0.041 0.144 0.036 32.1 117.0 0.51 17.9 70.5 0.6 0.237 0.059 0.144 0.036 32.1 118.5 0.51 18.9 70.5 0.000 0.000 0.144 0.038 32.1 111.3 0.54 19.9 70.5 0.000 0.000 0.144 0.039 32.1 108.7 0.55 20.9 0.0 0.0 0.000 0.000 0.000 0.000 32.3 105.0 0.57 21.8 0.0 0.0 0.136 0.038 0.000 0.000 32.3 106.9 0.56 22.9 0.0 0.0 0.151 0.043 0.000 0.000 32.3 105.0 0.57 23.9 70.5 1.0 0.137 0.038 0.144 0.039 32.0 107.5 0.56 24.9 354.6 5.0 0.149 0.041 0.744 0.203 31.2 104.6 0.57 25.9 354.6 4.9 0.152 0.037 0.744 0.182 31.2 116.8 0.51 26.9 371.4 5.5 0.142 0.032 0.780 0.177 31.1 126.1 0.48 27.9 368.7 5.8 0.131 0.028 0.756 0.161 31.9 137.6 0.44 28.8 368.7 6.1 0.125 0.026 0.756 0.161 31.9 137.6 0.44 29.9 368.7 5.8 0.131 0.028 0.756 0.161 31.9 137.6 0.44 30.9 395.9 5.6 0.144 0.031 0.804 0.171 32.2 138.9 0.43 303 257.5 31.9 395.9 6.7 0.120 0.025 0.804 0.171 32.2 138.9 0.43 231 197 32.9 395.9 7.1 0.113 0.024 0.804 0.171 32.2 138.9 0.43 113.8 90.1 33.9 395.9 6.9 0.117 0.025 0.804 0.171 32.2 138.9 0.43 34.9 395.9 5.4 0.149 0.032 0.804 0.171 32.2 138.9 0.43 35.8 395.9 5.5 0.147 0.031 0.804 0.171 32.2 138.9 0.43 36.9 395.9 5.4 0.148 0.031 0.804 0.171 32.2 138.9 0.43 37.9 395.9 5.3 0.151 0.032 0.804 0.171 32.2 138.9 0.43 38.9 395.7 5.2 0.154 0.033 0.804 0.171 32.2 138.9 0.43 39.9 395.7 5.2 0.154 0.033 0.804 0.171 32.2 138.9 0.43 40.9 395.7 5.5 0.147 0.031 0.804 0.167 32.2 141.9 0.42 41.9 395.7 5.4 0.149 0.031 0.804 0.166 32.2 143.4 0.42 42.9 395.7 5.6 0.143 0.804 32.2 43.9 395.7 6.1 0.132 0.028 0.804 0.171 32.2 138.9 0.43
-82-11-92

APPENDIX V: Biodegradation Cost Analyses
This appendix contains all of the cost analyses quotes provided by Envirex Ltd. An index is shown in Table V.l:
Table V.l Index to Biodegradation Cost Analyses
Option Compound Concentration (ppm)
How Rate (gpm)
Page Number
l TCE 1100 6.2 86-87 2 TCE 1100 6.2 88-89 3 TCE 55 6.2 90-91
3B TCE 55 6.2 92-93 4 TCE 1100 3 94-95 5 TCE 1100 5.2 97-98 6 TCE 1100 5.2 99-100 7 TCE 55 600 101-102 8 TCE 55 500 105-106 9 TCE 5 500 107-108
1 MeCl2 66 500 109-110 2 MeCl2 5 500 111-112 3 MeCl2 5360 6.2 113-114 4 MeCl2 400 6.2 115-116
In addition, descriptive information is included as follows:
Option
1-4 (TCE) 5-7 (TCE)
8-9 (TCE); 1-4 (MeCl2)
Page Number
84-85 96
103-104
-83-H-93
1ZS&&&S A&ZJRgv.

E N V X R E X : L T D . • 414-547-4120-FAX •
414-54-7-01-41-PHONE. MAILING- ADDRESS:' PO: :B0X:-1.6.24:.,7 • ;.,::
WAUKESHA, WI ..531-87•"
i-ri llfij
FAX TO: COMPAii Y FAX NO:
Habib Amin : Bechtel
415-768-3580 PHONE: 415-768-3118
1 i
DATE : December 7, 1993 FROM: Jeff Devine 414-521-8208 Sr. Process Engineer
page: 1 of 12 pages Subject: fluid Bed Treatment of TCE Contaminated Wastewater
If" all. pages - ar-e' not. received' please .call" 4.1.4-5 2.1-8-3 66:.. Thank.. you.
Habib, Included with this fax are the computer print-outs of five possible designs of <BAC Fluid Bed systems to treat the TCE wastewater. The following are our assumptions for Options 1 and 2:
Flow Rate (gpm) = 6.2 TCE Concentration (mg/1) = 1,100 Phenol : TCE ratio (mass/mass) = 1:1
Option 1 maJces use of a single 8-ft diameter reactor and Option 2 provides a similar level of treatment using two 6-ft diameter reactors. For Option 3 and 3B, ve assumed a 6.2 gpm flow at a concentration of 55 mg/1. Option 3B is a more -ggressive design and therefore more limited in terms of the range of design conditions that could be evaluated. Option 3 is a conservative design and woluld likely be able to treat a higher concentration or flow rate. For Option 4, we assumed a 3.0 gpm flow rate at the higher concentration of 1,100 mg/1. Our efforts to research and determine the optimum Phenol to TCE ratio produced 'arying results. Some suggest a 1:1 ratio and others support a higher ratio, as igh as 10:1- We hope that we can optimize the fluid bed system and operate at
_:1. Bench-scale testing would be very benefiaial to better evaluate tjhis variable. A note on methanotrophic systems is that this system requires a methane to TCE ratio of 30-40:1. Under the high TCE concentrations for this project, tyhis would be prohibitively expensive to design a reactor to -handle the high COD loading that would result from these methanotrophic ratios. Methanotrophic systems appear to be more cost effective for low concentrations of TCE (low J>pm) in wastewater.
The first page of each design shows the design conditions and the second page -84-11-94

providass estimates for annual operating costs and capital costs of the equipment. Included on the second page is the quantity and cost of adding caustic soda to maintain an adequate pH within the reactor. What we have not been able to compile at this point is a cost for the phenol zhaz will be consumed in the cometabolic reaction. The quantity of phenol is again assumed to be equal on a mass basis to the amount of TCE degraded. Perhaps we will be able to locate a somewhat: inexpensive phenol supply from a neighboring industry. We request Bechtel's input on this matter. For options l and 2 we will need approximately 80 lb/day OL phenol.
One additional note on the influent feed pump that Bechtel would provide along with the influent equalization basin. The pressure that this pump would have to overcome would be the pressure of an influent valve, basket strainer, and the pressure of the recycle stream from the top of the fluid bed. This pump should be capable of delivering a minimum pressure of 15 psig and should not deliver at pressures greater than 40 psig.
Depending on the duration of the onsite testing that Bechtel and G.t;. will undertake, Envirex w i n be able to .offer attractive lease agreements for the fluid bed equipment. Rather than a lump sum capital cost, the equipment could either be rented or leased on a monthly basis. Please review the enclosed information. and if you have any questions, do not hesitate to give me a call.
Sincerely,
-85-E-95

* AVE. CONDITIONS +
INF. CHARACTERISTICS;
FLOW (GPM) HTRX <mg/l)
BENZENE TOLUENE T-XYLENES ETH BENZENE OTHER AROMATICS
AMMONIA-N (mg/1) TPH'S (mg/1) CHLORINATED (mg/1) PHENOL (mg/1) IRON (mg/1) TEMP DEG F
ENVIREX LTD. CAC-FLUID BED
PROJECT: DATE;
Heehtel—TCK j 12/7/93 1
OPTION I
6.2 FLOW (MGD)
OPTION
0.01 0.0 BTEX (#/D)
OPTION
0.0 . 0.0 BTX-coD(mgA)
BTX-OD<mg/1)
BTX-OD (#/D) NH3 OD (#/D) TPH COD (#/D) CL ORG OD (#/D) TOTAL COD (mg/1) TOTAL COD (1/D) T02 DEMAND (#/D)
OPTION
0.0 0.0
BTX-coD(mgA) BTX-OD<mg/1)
BTX-OD (#/D) NH3 OD (#/D) TPH COD (#/D) CL ORG OD (#/D) TOTAL COD (mg/1) TOTAL COD (1/D) T02 DEMAND (#/D)
OPTION
0.0 0.0
BTX-coD(mgA) BTX-OD<mg/1)
BTX-OD (#/D) NH3 OD (#/D) TPH COD (#/D) CL ORG OD (#/D) TOTAL COD (mg/1) TOTAL COD (1/D) T02 DEMAND (#/D)
OPTION
0.0
BTX-coD(mgA) BTX-OD<mg/1)
BTX-OD (#/D) NH3 OD (#/D) TPH COD (#/D) CL ORG OD (#/D) TOTAL COD (mg/1) TOTAL COD (1/D) T02 DEMAND (#/D)
OPTION
0.0
BTX-coD(mgA) BTX-OD<mg/1)
BTX-OD (#/D) NH3 OD (#/D) TPH COD (#/D) CL ORG OD (#/D) TOTAL COD (mg/1) TOTAL COD (1/D) T02 DEMAND (#/D)
OPTION
0.0 • o.o
BTX-coD(mgA) BTX-OD<mg/1)
BTX-OD (#/D) NH3 OD (#/D) TPH COD (#/D) CL ORG OD (#/D) TOTAL COD (mg/1) TOTAL COD (1/D) T02 DEMAND (#/D)
OPTION
0.0 0.0
BTX-coD(mgA) BTX-OD<mg/1)
BTX-OD (#/D) NH3 OD (#/D) TPH COD (#/D) CL ORG OD (#/D) TOTAL COD (mg/1) TOTAL COD (1/D) T02 DEMAND (#/D)
OPTION
0.0 1100.0
BTX-coD(mgA) BTX-OD<mg/1)
BTX-OD (#/D) NH3 OD (#/D) TPH COD (#/D) CL ORG OD (#/D) TOTAL COD (mg/1) TOTAL COD (1/D) T02 DEMAND (#/D)
OPTION
31.1 1100.0
BTX-coD(mgA) BTX-OD<mg/1)
BTX-OD (#/D) NH3 OD (#/D) TPH COD (#/D) CL ORG OD (#/D) TOTAL COD (mg/1) TOTAL COD (1/D) T02 DEMAND (#/D)
OPTION
3025.0 0.0
BTX-coD(mgA) BTX-OD<mg/1)
BTX-OD (#/D) NH3 OD (#/D) TPH COD (#/D) CL ORG OD (#/D) TOTAL COD (mg/1) TOTAL COD (1/D) T02 DEMAND (#/D)
OPTION
225.1 65.0
BTX-coD(mgA) BTX-OD<mg/1)
BTX-OD (#/D) NH3 OD (#/D) TPH COD (#/D) CL ORG OD (#/D) TOTAL COD (mg/1) TOTAL COD (1/D) T02 DEMAND (#/D)
OPTION
191.3
ACTUAL DESIGN: REACTOR DIAM NO. REACTORS BED DEPTH (FT) FLUX (GPM/FT2)
8.0 REACTOR DIAM NO. REACTORS BED DEPTH (FT) FLUX (GPM/FT2)
1 REACTOR DIAM NO. REACTORS BED DEPTH (FT) FLUX (GPM/FT2)
14
REACTOR DIAM NO. REACTORS BED DEPTH (FT) FLUX (GPM/FT2) 13 TCOD LOAD (#/DKCF) BTXCOD LD (#/DKCF)
320 0
BED VOL (FT3) 704 R+Q FLOW (GPM) 653 R/Q RATIO 104.4 HRT (MIN) 849 CARBON {# ea) 10556 CARBON TOTAL 10556
#/D 02 USED EFF 02 (mg/1) REACTOR INF 02 TSS OUT (mg/1)
191.4 2.0
26.4 514.3
PSA SIZE (SCFH)
TSS (#/DAY)
139
38.3
-86-H-96

ELECT COST (S/KWhr)
FLUID PUMP BHP ea: PHC PUM£» HHP «a: Gli CONTROL IIP
NO. UNITS DIAMETER
CJXYHKN PSA ( # / D )
STD NUTR (GAL/D)
CAUSTIC SODA (#/D)
ATTRITION (#/D)
ESTIMA1 CED B e c h t e l — T C i i OPERATING COSTS 0PT\6\ N \
$ 0 . 0 6 PUMP fcjyf % ?3 MOTOR EFF % 94
7 . 9 PUMP $ / D $ 0 . 4 6 7 . 8 PUMP $ / D 9 5 . 3 7 l . S PUMP $ / D S I . C I
1 TOTAL PUMP S / D $ 1 8 . 4 4 8 . 0
1 9 1 0 2 $ / D $ 5 . 1 7
4 . 0 NUTR ? / D $5 .11
7 5 . 3 CAUSTIC $ / D $ 1 9 . 5 8
3 CARBON ( S / D )
TOTAL DAILY
$ 3 . 3 0 CARBON ( S / D )
TOTAL DAILY $ 5 1 . 5 8
TOTAL A N N U A L . . . $ 1 8 , , 8 2 8 . 2 2
BUDGETARY CAPITAL COST
3ASIS: Complete skid package includes installation assistance end stcrt lip. Concrete pad rp.nuirflr)
IMCLUOCS: engineering, all equipment rintrnl^/iivrtrvtmisn+aKcn, ecben.
02 generator, start-up, training MAIL BASIS' 30 d ss fac to r , gak
structural skid. NEMA 4X ss panel :JVC: pipinrj/voives. modulated 00 control
C A P I T A L . . . $ 4 b 0 , 0 0 0
-87-n-97

ENVIREX LTD. G,\C-Fi.T.TD RED
* AVE. CONDITIONS * PROJECT: DATE:
Bechtel—TCE 12/7/93
INF. CHARACTERISTICS:
FLOW (GPM) BTEX (mg/1)
BENZENE TOLUENE T-XYLENES ETH BENZENE OTHER AROMATICS
AMMONIA-N (mg/1) TPH'S (mg/1) CHLORINATED (rag/1) PHENOL (mg/1) IRON (mg/1) TEMP DEG F
6.2 0.0 0 .0 0 .0 0 .0 0 .0 0 ,0 • o ,0
0 ,0 1 100. 0 1100. 0
0. 0 65. 0
OPTION 2
FLOW (MGD) 0.01 BTEX (#/D) 0.0 BTX-COD(mg/l) 0.0 BTX-OD(mg/l) 0.0
BTX-OD (#/D) 0.0 NH3 OU (#/D) n.o TPH COD (#/D) 0.0 CL ORG OD (#/D) 31.1 TOTAL COD (mg/1) 3025.0 TOTAL COD (#/D) 225.1 T02 DEMAND (#/D) 191.3
ACTUAL DESIGN: REACTOR DIAM NO. REACTORS BED DEPTH (FT) FLUX (GPM/FT2)
6.0 REACTOR DIAM NO. REACTORS BED DEPTH (FT) FLUX (GPM/FT2)
2 REACTOR DIAM NO. REACTORS BED DEPTH (FT) FLUX (GPM/FT2)
11
REACTOR DIAM NO. REACTORS BED DEPTH (FT) FLUX (GPM/FT2) 13 TCOD LOAD (#/DKCF) BTXCOD LD (#/DKCF)
362 0
BED VOL (FT3) 311 R+Q FLOW (GPM) 368 R/Q RATIO 117.6 HRT (MIN) 750 CARBON (# ea) 4665 CARBON TOTAL 9331
#/D 02 USED EFF 02 (mg/1) REACTOR INF 02 TSS OUT (mg/1)
191.4 2.0
23.7 514.3
PSA SIZE (SCFH)
TSS (#/DAY)
139
38.3
-88-n-98

ELECT COST ($/KWhr)
FLU 113 PUMP BHP ©a: PBC PUMP BHP ea: GR CONTROL HP
NO. UNITS DIAMETER
OXYGEN PSA (#/D)
STD NUTK (GAL/O)
CAUSTIC SOnA (#/D)
ATTRITION (#/D)
ESTIMATED 3echt< Si—TCE OPERATING COSTS OPTION L
50.06 PUMP EFF % 78 MOTOR EFF % 04
10.0 PUMP $/D $10.74 0.0 PUMP $/D $0.00 0.5 PUMP $/D $0.54
2 TOTAL PUMP $/D $22.55 6.0
191 02 §/D $5.17
4.0 NUTR $/D $5.11
7b. 3 CAUSTIC $/D $19.58
3 CARBON (S/D)
TOTAL DAILY
$2.91 CARBON (S/D)
TOTAL DAILY $55.32
TOTAL ANNUAL... $20; ,190.04
BUDGETARY CAPITAL COST
3ASIS: Comolete skid package 'ncludss Installation assistance end stcrt up. Concrete pad required.
INCUDES: engineering, all eauipment controls/instrumentation, carbon. 02 generator, start-up, training
AM7L BASIS: 304- ss reactor, galv. structural skid, NEMA 4X 33 pand PVC .uiping/valves. modulated CO control
C A P I T A L . . . $ 5 5 0 , 0 0 0
-89-E-99

EiWlREX LTD. CAC-FLUID BED
* AVE. CONDITIONS *
INF. CHARACTERISTICS:
FLOW (GPM) BTEX (mg/i)
BENZENE TOLUENE T-XYLENES £TH BENZENE OTHER AROMATICS
AMMONIA-N (mg/1) TPH'S (mg/1) CHLORINATED (mg/1) PHENOL (mg/1) IKON (mg/1) TEMP DEG F
PROJECT: DATE:
Bechlel 12/7/93
—TCE i 1
! OPTION 3
i 6.2 FLOW (MGD)
OPTION
0.01 0.0 BTEX (#/D)
OPTION
0.0 0.0 BTX-COD(mg/l)
BTX-OD(mg/1)
BTX-OD (#/D) NH3 OD (#/D) TPH COD (#/D) CL ORG QO (t/D) TOTAL COD (mg/1) TOTAL COD (#/D) T02 DEMAND (#/D)
OPTION
0.0 0.0
BTX-COD(mg/l) BTX-OD(mg/1)
BTX-OD (#/D) NH3 OD (#/D) TPH COD (#/D) CL ORG QO (t/D) TOTAL COD (mg/1) TOTAL COD (#/D) T02 DEMAND (#/D)
OPTION
0.0 0.0
BTX-COD(mg/l) BTX-OD(mg/1)
BTX-OD (#/D) NH3 OD (#/D) TPH COD (#/D) CL ORG QO (t/D) TOTAL COD (mg/1) TOTAL COD (#/D) T02 DEMAND (#/D)
OPTION
0.0
BTX-COD(mg/l) BTX-OD(mg/1)
BTX-OD (#/D) NH3 OD (#/D) TPH COD (#/D) CL ORG QO (t/D) TOTAL COD (mg/1) TOTAL COD (#/D) T02 DEMAND (#/D)
OPTION
0.0
BTX-COD(mg/l) BTX-OD(mg/1)
BTX-OD (#/D) NH3 OD (#/D) TPH COD (#/D) CL ORG QO (t/D) TOTAL COD (mg/1) TOTAL COD (#/D) T02 DEMAND (#/D)
OPTION
0.0 * 0.0
BTX-COD(mg/l) BTX-OD(mg/1)
BTX-OD (#/D) NH3 OD (#/D) TPH COD (#/D) CL ORG QO (t/D) TOTAL COD (mg/1) TOTAL COD (#/D) T02 DEMAND (#/D)
OPTION
0.0 0.0
BTX-COD(mg/l) BTX-OD(mg/1)
BTX-OD (#/D) NH3 OD (#/D) TPH COD (#/D) CL ORG QO (t/D) TOTAL COD (mg/1) TOTAL COD (#/D) T02 DEMAND (#/D)
OPTION
0.0 55.0
BTX-COD(mg/l) BTX-OD(mg/1)
BTX-OD (#/D) NH3 OD (#/D) TPH COD (#/D) CL ORG QO (t/D) TOTAL COD (mg/1) TOTAL COD (#/D) T02 DEMAND (#/D)
OPTION
1.6 55.0
BTX-COD(mg/l) BTX-OD(mg/1)
BTX-OD (#/D) NH3 OD (#/D) TPH COD (#/D) CL ORG QO (t/D) TOTAL COD (mg/1) TOTAL COD (#/D) T02 DEMAND (#/D)
OPTION
151.3 0.0
BTX-COD(mg/l) BTX-OD(mg/1)
BTX-OD (#/D) NH3 OD (#/D) TPH COD (#/D) CL ORG QO (t/D) TOTAL COD (mg/1) TOTAL COD (#/D) T02 DEMAND (#/D)
OPTION
11.3 65.0
BTX-COD(mg/l) BTX-OD(mg/1)
BTX-OD (#/D) NH3 OD (#/D) TPH COD (#/D) CL ORG QO (t/D) TOTAL COD (mg/1) TOTAL COD (#/D) T02 DEMAND (#/D)
OPTION
9.C
ACTUAL DESIGN: REACTOR DIAM NO, REACTORS BED DEPTH (FT) FLUX (GPM/FT2) TCOD LOAD (J/DKCF) BTXCOD LD (#/DKCF)
4.5 REACTOR DIAM NO, REACTORS BED DEPTH (FT) FLUX (GPM/FT2) TCOD LOAD (J/DKCF) BTXCOD LD (#/DKCF)
1 REACTOR DIAM NO, REACTORS BED DEPTH (FT) FLUX (GPM/FT2) TCOD LOAD (J/DKCF) BTXCOD LD (#/DKCF)
11
REACTOR DIAM NO, REACTORS BED DEPTH (FT) FLUX (GPM/FT2) TCOD LOAD (J/DKCF) BTXCOD LD (#/DKCF)
13
REACTOR DIAM NO, REACTORS BED DEPTH (FT) FLUX (GPM/FT2) TCOD LOAD (J/DKCF) BTXCOD LD (#/DKCF)
64 0
BED VOL (FT3) 175 R+Q FLOW (GPM) 207 R/Q RATIO 32.3 HRT (MIN) 211 CARBON (# ea) 2624 CARBON TOTAL 2624
#/U 02 USED EFF 02 (mg/1) REACTOR INF 02 TSS OUT (mg/1)
9.7 2.0 5.9
25.7
PSA SIZE (SCFH)
TSS <#/DAY) 1.9
-90-n-ioo

ELECT COST (?/KWhr)
FLUID PUMP BHP ea: PBC PUMP BHP ea: GR CONTROL HP
NO. UNITS DIAMETER
OXYGEN PSA (#/D)
STD NUTR (CAL/D)
CAUSTIC SODA (#/D)
ATTRITION (#/D)
ESTIMATED Bechtel—TCE OPERATING COSTS OpTio«\» 3
$0.06 PUMP Ei'F % 78 MOTOR EFF % 94
6.0 PUMP $/D $6.44 0.0 PUMP S/D $0.00 0.5 PUMP S/D $0.54
1 TOTAL PUMP S/D $6.98 4.5
10 02 S/D $0.26
0.2 NUTR $/D $0.26
3.8 CAUSTIC $/D $0.98
1 CARBON (?/D)
TOTAL DAILY
$0.02 CARBON (?/D)
TOTAL DAILY $9.30
TOTAL ANNUAI. $3,392.94
BUDGETARY CAPITAL COST
3ASIS: Complete skid package •nnlurifls lastmlntinn assistant end start -jp. Concrete sad required.
NCLUDC3: engineering, all equipment cont'olr/instrumentation, carbon, 02 generator, start-up. training
MATL BASIS: 3C4 ss rocctor. galv. structural skic. NEMA 4X ss panel FVC piping/valves, modulated DO control
CAPITAL.. $ 1 7 5 , 0 0 0
-91-11-101

ENVIREX LTD. (rAC-J-LI.'il) DLL!
* AVE. CONDITIONS * .PROJECT: DATE:
Bechtel—TCE 12/7/93
INF. CHARACTERISTICS:
FLOW (GPM) BTEX (mg/l)
BENZENE TOLUENE T-XYLENES ETH BENZENE OTHER AROMATICS
AMMONIA-N (mg/l) TPH'S (mg/l) CHLORINATED (mg/l) PHENOL (mg/l) IRON (mg/l) TEMP DEC? P
6.2 0.0 0.0 0.0 0.0 0.0 0.0
— , 0.0 0.0 55.0 55.0 0.0 6 5.0
OPTION 3B
FLOW (MGD) 0.01 BTEX (tf/D) 0.0 BTX-COD(mg71) 0.0 BTX-OD(mg/l) 0.0
HTX-OU (#/•) O.U NH3 OD (#/D) 0.0 TPH COD (#/D) 0.0 CL ORG OD (#/D) 1.6 TOTAT. COD (Tng/1) 1S1.3 TOTAL COD (#/D) 11.3 TQ2 DEMAND (#/D) 9.6
ACTUAL DESIGN: REALTOR DIAM NO. REACTORS BED DEPTH (FT) FLUX (GPM/FT2)
1.7 REALTOR DIAM NO. REACTORS BED DEPTH (FT) FLUX (GPM/FT2)
1 REALTOR DIAM NO. REACTORS BED DEPTH (FT) FLUX (GPM/FT2)
11
REALTOR DIAM NO. REACTORS BED DEPTH (FT) FLUX (GPM/FT2) 13 TCOD LOAD (#/DKCF) BTXCOD LD (f/DKCF)
451 0
BED VOL (FT3> 25 R+Q FLOW (GPM) 30 R/Q RATIO 3.9 HRT (MIN) 30 CARBON (# ea) 375 CARBON TOTAL 375
I/D02 USED EFF 02 (mg/l) REACTOR INF 02 TSS OUT (mg/l)
9.7 2.0 29.0 25.7
PSA SIZE (SCFH)
TSS (#/DAY) 1.9
-92-11-102

ELECT COST (S/KWhr!
FLUID PUMP BHP ea: PBC PUMP BHP ea: GR CONTROL HP
NO. UNITS DIAMETER
OXYGEN PSA (#/D)
STD NUTR (GAL/D)
CAUSTIC SODA (#/D)
ATTRITION (#/D)
ESTIMATED OPERATING COSTS
$0.06 PUMP EFF % MOTOR EFf %
1.0 PUMP S/D 0.0 PUMP S/D 0.5 PUMP $/D
1 TOTAL PUMP 1.7
10 02 S/D
0.2 NUTR $/D
3.8 CAUSTIC ?/D
0 CARBON ($/D)
TOTAL DAILY
Bechtel—TCE
78 94
$1.07 $0.00 $0.54
SI.61
TOT AT, ANNUA!-..
$0, .26
$0. .26
$0. .98
$0. . 12
$3. 22
$ 1 , .176. 78
BUDGETARY CAPITAL COST
BASIS: Complete skid pcckage includes ins'.ulluliort ussisiunc» and start up. Concrete pad required.
INCLUDES: anginanring, nil aquipmsnr confrols/instrumentatioa ccrbon, 02 generator, start-up, training
MAIL BASIS: 304 ss reactor. ga;v. struc:ural sxid, NEMA 4-X ss panel PVC oiping/vclves. modulated 20 nonrrni
CAPITAL. $ 9 5 , 0 0 0
-93-n-103

ENVIREX LTD. GAC-nriD BCD
* AVE. CONDITIONS * PROJECT: DATE :
Bee 12/
htel 7/93
— T C E j
CHARACTERISTICS: OPTION 4
FLOW (GPM) 3 FLOW (MGD)
OPTION
0.00 BTEX (mg/1) 0.0 BTEX (#/D)
OPTION
0.0 BENZENE 0.0 BTX-COD(mg/l)
BTX-OD(mg/1)
BTX-OD (#/D) NH3 OD (#/D) TPH COD (#/D) CL ORG OD (#/D) TOTAL COD (rag/1) TOTAL COD (-#/D) TO? DEMAND (#/D)
OPTION
0.0 TOLUENE 0.0
BTX-COD(mg/l) BTX-OD(mg/1)
BTX-OD (#/D) NH3 OD (#/D) TPH COD (#/D) CL ORG OD (#/D) TOTAL COD (rag/1) TOTAL COD (-#/D) TO? DEMAND (#/D)
OPTION
0.0 T-XYLENES 0.0
BTX-COD(mg/l) BTX-OD(mg/1)
BTX-OD (#/D) NH3 OD (#/D) TPH COD (#/D) CL ORG OD (#/D) TOTAL COD (rag/1) TOTAL COD (-#/D) TO? DEMAND (#/D)
OPTION
ETH BENZENE 0.0
BTX-COD(mg/l) BTX-OD(mg/1)
BTX-OD (#/D) NH3 OD (#/D) TPH COD (#/D) CL ORG OD (#/D) TOTAL COD (rag/1) TOTAL COD (-#/D) TO? DEMAND (#/D)
OPTION
OTHER AROMATICS 0.0
BTX-COD(mg/l) BTX-OD(mg/1)
BTX-OD (#/D) NH3 OD (#/D) TPH COD (#/D) CL ORG OD (#/D) TOTAL COD (rag/1) TOTAL COD (-#/D) TO? DEMAND (#/D)
OPTION
0.0 AMMONIA-N (mg/1) • 0.0
BTX-COD(mg/l) BTX-OD(mg/1)
BTX-OD (#/D) NH3 OD (#/D) TPH COD (#/D) CL ORG OD (#/D) TOTAL COD (rag/1) TOTAL COD (-#/D) TO? DEMAND (#/D)
OPTION
0.0 TPH'S (mg/1) 0.0
BTX-COD(mg/l) BTX-OD(mg/1)
BTX-OD (#/D) NH3 OD (#/D) TPH COD (#/D) CL ORG OD (#/D) TOTAL COD (rag/1) TOTAL COD (-#/D) TO? DEMAND (#/D)
OPTION
0.0 CHLORINATED (mg/1) PHENOL (mg/1)
1100.0 1100.0
BTX-COD(mg/l) BTX-OD(mg/1)
BTX-OD (#/D) NH3 OD (#/D) TPH COD (#/D) CL ORG OD (#/D) TOTAL COD (rag/1) TOTAL COD (-#/D) TO? DEMAND (#/D)
OPTION
15.0 025.0
IRON (mg/1) 0.0
BTX-COD(mg/l) BTX-OD(mg/1)
BTX-OD (#/D) NH3 OD (#/D) TPH COD (#/D) CL ORG OD (#/D) TOTAL COD (rag/1) TOTAL COD (-#/D) TO? DEMAND (#/D)
OPTION
108.9 TEMP D£G F 65.0
BTX-COD(mg/l) BTX-OD(mg/1)
BTX-OD (#/D) NH3 OD (#/D) TPH COD (#/D) CL ORG OD (#/D) TOTAL COD (rag/1) TOTAL COD (-#/D) TO? DEMAND (#/D)
OPTION
92.6
ACTUAL DESIGN: REACTOR OIAM NO. REACTORS BED DEPTH (FT) FLUX (GPM/FT2) TCOD LOAD (#/DKCF) BTXCOD LD (#/DKCF)
6.0 REACTOR OIAM NO. REACTORS BED DEPTH (FT) FLUX (GPM/FT2) TCOD LOAD (#/DKCF) BTXCOD LD (#/DKCF)
1 REACTOR OIAM NO. REACTORS BED DEPTH (FT) FLUX (GPM/FT2) TCOD LOAD (#/DKCF) BTXCOD LD (#/DKCF)
11
REACTOR OIAM NO. REACTORS BED DEPTH (FT) FLUX (GPM/FT2) TCOD LOAD (#/DKCF) BTXCOD LD (#/DKCF)
13
REACTOR OIAM NO. REACTORS BED DEPTH (FT) FLUX (GPM/FT2) TCOD LOAD (#/DKCF) BTXCOD LD (#/DKCF)
350 0
BED VOL (FT3> 311 R+Q FLOW (GPM) 368 R/Q RATIO 121.5 HRT (MIN) 775 CARBON (* •&) 4665 CARBON TOTAL 4665
#/D 02 USED EFF 02 (mg/1) REACTOR INF 02 TSS OUT (mg/1)
92.6 2.0
23.0 514.3
PSA SIZE (SCFH)
TSS (#/DA?)
67
18.5
-94-n-i04

HLblC'V COST ($/KWhr)
FLUID- PUMP DHP ea: PRC: PUMP BHP eas GR CONTROL HP
NO. UNITS DIAMETER
OXYGEN PSA <#/D)
STD NUTR (GAL/D)
CAUSTIC SODA (#/D)
ATTRITION (#/D)
ESTIMATED Bennt.i S I — TCE OPERATING COSTS OPT/dW u
$0.06 PUMP rp-p % 78 MOTOR EPF % 94
10.0 PUMP S/D $10.74 0.0 PUMP S/D $0.00 0.5 PUMP S/D $0.54
1 TOTAL PUMP S/D $11.27 6.0
93 02 S/D $2.50
1.9 NUTR S/D $2.47
36.4 CAUSTIC S/D $9.47
2 CARBON (S/D)
TOTAL DAILY
$1.46 CARBON (S/D)
TOTAL DAILY $27.18
TOTAL ANNUAL... $9 ,919.29
BUDGETARY CAPITAL COST
OASIS: Complete slcid pcckaga includes instollation assistance and start- up. Concrete pad
'9QU\rid.
INCLUDES: engineering, ell equipment controls/instrumentation, carbon. 02 generator, start-up. training
UATL BASIS: 304 ss raaetor, gaiv. structural skid. NEMA 4X ss pcnel HVC piping/volvw. modulated DO control
C A P I T A L . . $ 2 7 5 , 0 0 0
-95-H-105

E N V I R E X X ^ T O i . . 4 I 4 - 5 4 7 - 4 1 2 0 - F A X ' . .
'" •414-547-Oi41.-FHONE" MAILING' ADDRESS:: -PC:.BOX .1.624 ,
1 .. .." WAUKESHA,---WI- 5-S1S-7 -• . 1 i FAX TO: COMPANY FAX NO:
Habib Amin : Bechtel
415-768-3580 PHONEJ 415-768-3113 [ DATK: December 8, 1993 FROM: Jeff Devine 414-521-8208
Sr. Process Engineer Page: 1 of 15 pages Subject: Fluid B«d Treatment of T C E
Contaminated Wastewater If- •all" pages are: hot received-please-: :ca£I:';'4:;l:'4'-^2i"-i3-6€';-; Thank!' you-.
Habib, included with this fax are the computer print-outs of three additional scenarios for fluid bed treatment of the TCE contaminated wastewater. Also included is an -.xample of our Work Scope for supply of an FBR. The Work Scope is for our Model 370 skid unit. The Options 5 and 6 are for a flow of 5.2 gpm and 1100 ppm TCE. Option 7 is a fail-scale design of an la-et diameter reactor to treat 600 gpm of 55 mg/1 TCE, This would not be a skid mounted system. Please let me know if you require additional input from Envirex for this work. p . e g a r d s ,
r IW
-96-n-i06
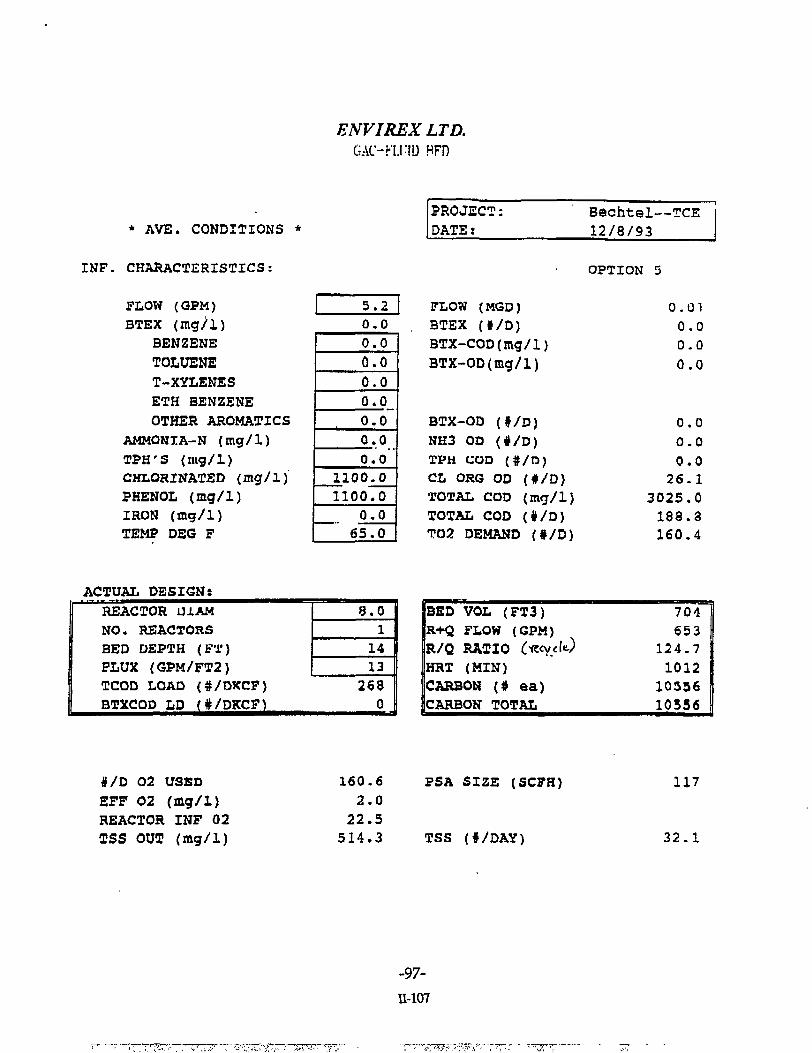
ENVIREXLTD. GAOFl.ni) BFD
* AVE. CONDITIONS *
INF. CHARACTERISTICS:
FLOW (GPM) BTEX (mg/'l)
BENZENE TOLUENE T-XYLENES ETH BENZENE OTHER AROMATICS
AMMONIA-N (mg/1) TPH'S (utg/1) CHLORINATED {mg/1) PHENOL (mg/1) IRON (mg/1) TEMP DEG F
PROJECT: DATE:
Bechtel—TCE 12/8/93
5 .2 0 .0 0 .0 0 .0 0 .0 0 .0 .0 0 .0 .0
0. .0 0 0. .0 0
1100. 1100.
0 0
0. 0 65. 0
OPTION 5
FLOW (MGD) 0.01 BTEX (#/D) 0.0 BTX-COD(mg/l) 0.0 BTX-OD(mg/l) 0.0
BTX-OD (#/D) 0.0 NH3 OD <#/D) 0.0 TPH COD (#/D) 0.0 CL ORG OD (#/D) 26.1 TOTAL COD (mg/1) 3025.0 TOTAL COD (#/D) 188.3 T02 DEMAND (#/D) 160.4
ACTUAL DESIGN: REACTOR U1AM NO. REACTORS
8.0 REACTOR U1AM NO. REACTORS 1 BED DEPTH (FT) 14 FLUX (GPM/FT2) 13 TCOD LOAD (#/OKCF) BTXCOD LD (#/DKCF)
268 0
BED VOL (FT3) 704 R+Q FLOW (GPM) 653 R/Q RATIO (ftcycU) 124.7 HRT (MIN) 1012
10356 CARBON (# ea) 1012
10356 CARBON TOTAL 10356
#/D 02 USED EFF 02 (mg/1) REACTOR INF 02 TSS OUT (mg/1)
160.6 2.0
22.5 514.3
PSA SIZE (SCFH)
TSS (#/DAY)
117
32.1
-97-11-107

ELECT COST (S/KWhr)
FLUID PUMP BHP ea: P3C PUMP 3HP ea: CR CONTROL HP
NO. UNITS DlAMETKR
OXYGKN PSA. <f/D)
STD NUTR (GAL/D)
CAUSTIC SODA (#/D)
ATTRITION (#/D)
5STIMATED aeffhr.R.l. — TCE OPERATING COSTS 0 P 7 \o *j 5
$0.06 PUMP EFF * 78 MOTOR EFF % 94
7.9 PUMP $/D $8.46 7.8 PUMP $/D S8.3 7 1-5 PUMP ?/D $1.61
1 TOTAL PUMP $/D $18.44 8.0
161 02 $/D $4.34
3.3 NUTR S/D $4.28
63.1 CAUSTIC $/D $16.42
3 CARBON ($/D)
TOTAL DAILY
$3.30 CARBON ($/D)
TOTAL DAILY $46.77
TOTAL ANNUAL... $17, ,070.86
BUDGETARY CAPITAL COST
BASIS: Corr.piete skid packcge includes installation assistance end start up. Concrete pad reauircrt.
NCLUDCS: «ngineering. oil equipment r.nnTDis/insTnjmentnticin. earoon. 02 generator, srert-up, trcining
UAH. yi«;iS: iOA ss r»aetor. gclv. structural skid, MCMA 4X ss panel h'VC piping/valves, modulated DO control
CAPITAL. $450,000
-98-n-ios

ENVIREX LTD. (r\r-FU.TD BED
+ AVE. CONDITIONS *
INF. CHARACTERISTICS:
FLOW (GFM) BTEX (mg/1)
BENZENE TOLUENE T-XYLENES ETH BENZENE OTHER AROMA'X'ICS
AMMONIA-N (mg/1) TPH'S (mg/1) CHLORINATED (mg/1) PHENOL (mg/1) IRON (mg/1) TEMP DEG F
5.2 0.0 0 .0 0 .0 0 .0 0 .0 0 .0
• o .0 0 0
1100. 0 1100. 0
0. 0 65. 0
PROJECT: DATE :
Bechtel—TCE 12/8/93
OPTION 6
FLOW (MGD) 0.01 BTEX (*/D) 0.0 BTX-COD(mg/l) 0.0 BTX-OD(mg/l) 0.0
BTX-OD (#/D) 0.0 NH3 OD (#/D) 0.0 TPH COD (#/D) 0.0 CL ORG OD (#/D) 26.1 TOTAL COD (Itig/1) 3025.0 TOTAL COD (*/D) 188.6 TQ2 DEMAND (#/D) 160.4
ACTUAL DESIGN: REACTOR DIAM 6.0 NO. REACTORS 2 BED DEPTH (FT) 11 FLUX (GPM/FT2) 13 TCOD LOAD (#/DKCF) BTXCOD LD (#/DKCF)
303 0
BED VOL (FT3) 311 R+O FLOW (GPM) 368 R/Q RATIO 140.4 HRT (MIN) 895 CARBON (# ea) 4665 CARBON TOTAL 9331
#/D 02 USED EFF 02 (mg/1) REACTOR INF 02 TSS OUT (mg/1)
1 6 0 . 6 2 . 0
2 0 . 2 5 1 4 . 3
PSA StZR (SCFH)
TSS (#/DAY)
117
3 2 . 1
-99-n-109

ELECT COST (S/KWhr)
FLUID PUMP BHP ea: PBC: PUMP BHP eas GR CONTROL HP
NO. UNITS DIAMETER
OXYGEN PSA (#/D)
STD NUTR (GAL/D)
CAUSTIC SODA (#/D)
ATTRITION (#/D)
ESTIMATED Bechtel—TCE SRATING r COSTS OPTldKi fe
$0.06 PUMP EFF % 70 MOTOR EFF % 94
10.0 PUMP 5/D $10. /4 0.0 PUMP S/D $0.00 Q.5 PUMP $/D S0.54
2 TOTAL PUMP 5/D $22.55 6.0
161 02 $/D $4.34
3.3 NUTR $/D $4.28
03.1 CAUSTIC $/D $16.42
3 CARSON <$/D)
TOTAL DAILY
$2.91 CARSON <$/D)
TOTAL DAILY $50.50
TOTAL ANNUAL $18 ,432.69
BUDGETARY CAPITAL COST
BASIS- Complete skid puckuye includes installation assistance and s t a t uii. Concrete pad required.
INCL'JCES: engineering, all equipmnnt controls/instrumentation, carbon. C2 generator, stnrt-up, training
MAIL BASIS: 30-1 S3 rtactor, galv. structure! skid, NEMA AX ss panel PVC piDi'ng/valv«*. modulated DO
control
CAPITAL. $ 5 5 0 , 0 0 0
-100-n-iio

* AVE. CONDITIONS *
INF. CHARACTERISTICS:
FLOW (G±»M) BTEX (mg/1)
HENZKNR TOLUENE T-XVT..ENES ETH BENZENE OTHER AROHATICS
AMMONIA-N (mg/1) TPH'S (mg/1) CHLORINATED (mg/1) PHENOL (mg/1) inON (mg/1) TEMP DEG F
ENVWEX LTD. GAC-J'LLiU JJl'J)
PROJECT: DATE i
3eclvcel l 2 / 8 / < ) 3
. — TCE
OPTION 7
6 0 0 | FLOW (MGD) BTEX ( # / D )
OPTION
0 . 3 6 0 . 0
| FLOW (MGD) BTEX ( # / D )
OPTION
0 . 0 0 . 0 BTX-COD(mg/l)
BTX-OD(mg/1 )
BTX-OD ( # / D ) NH3 OD ( # / D ) TPH COD ( # / D ) CL ORG OD ( # / D ) TOTAL COD ( m g / 1 ) TOTAL COD ( # / D ) T02 DEMAND ( # / D )
OPTION
0 . 0 0 . 0
BTX-COD(mg/l) BTX-OD(mg/1 )
BTX-OD ( # / D ) NH3 OD ( # / D ) TPH COD ( # / D ) CL ORG OD ( # / D ) TOTAL COD ( m g / 1 ) TOTAL COD ( # / D ) T02 DEMAND ( # / D )
OPTION
0 . 0 0 . 0
BTX-COD(mg/l) BTX-OD(mg/1 )
BTX-OD ( # / D ) NH3 OD ( # / D ) TPH COD ( # / D ) CL ORG OD ( # / D ) TOTAL COD ( m g / 1 ) TOTAL COD ( # / D ) T02 DEMAND ( # / D )
OPTION
0 . 0
BTX-COD(mg/l) BTX-OD(mg/1 )
BTX-OD ( # / D ) NH3 OD ( # / D ) TPH COD ( # / D ) CL ORG OD ( # / D ) TOTAL COD ( m g / 1 ) TOTAL COD ( # / D ) T02 DEMAND ( # / D )
OPTION
0 . 0
BTX-COD(mg/l) BTX-OD(mg/1 )
BTX-OD ( # / D ) NH3 OD ( # / D ) TPH COD ( # / D ) CL ORG OD ( # / D ) TOTAL COD ( m g / 1 ) TOTAL COD ( # / D ) T02 DEMAND ( # / D )
OPTION
0 . 0 0 . 0
BTX-COD(mg/l) BTX-OD(mg/1 )
BTX-OD ( # / D ) NH3 OD ( # / D ) TPH COD ( # / D ) CL ORG OD ( # / D ) TOTAL COD ( m g / 1 ) TOTAL COD ( # / D ) T02 DEMAND ( # / D )
OPTION
0 . 0 0 . 0
BTX-COD(mg/l) BTX-OD(mg/1 )
BTX-OD ( # / D ) NH3 OD ( # / D ) TPH COD ( # / D ) CL ORG OD ( # / D ) TOTAL COD ( m g / 1 ) TOTAL COD ( # / D ) T02 DEMAND ( # / D )
OPTION
0 . 0 5 5 . 0
BTX-COD(mg/l) BTX-OD(mg/1 )
BTX-OD ( # / D ) NH3 OD ( # / D ) TPH COD ( # / D ) CL ORG OD ( # / D ) TOTAL COD ( m g / 1 ) TOTAL COD ( # / D ) T02 DEMAND ( # / D )
OPTION
1 5 0 . 5 5 5 . 0
BTX-COD(mg/l) BTX-OD(mg/1 )
BTX-OD ( # / D ) NH3 OD ( # / D ) TPH COD ( # / D ) CL ORG OD ( # / D ) TOTAL COD ( m g / 1 ) TOTAL COD ( # / D ) T02 DEMAND ( # / D )
OPTION
1 5 1 . 3 0 . 0
BTX-COD(mg/l) BTX-OD(mg/1 )
BTX-OD ( # / D ) NH3 OD ( # / D ) TPH COD ( # / D ) CL ORG OD ( # / D ) TOTAL COD ( m g / 1 ) TOTAL COD ( # / D ) T02 DEMAND ( # / D )
OPTION
L 0 8 9 . 0 6 5 . 0
BTX-COD(mg/l) BTX-OD(mg/1 )
BTX-OD ( # / D ) NH3 OD ( # / D ) TPH COD ( # / D ) CL ORG OD ( # / D ) TOTAL COD ( m g / 1 ) TOTAL COD ( # / D ) T02 DEMAND ( # / D )
OPTION
9 2 5 . 7
ACTUAL DESIGN: REACTOR DIAM NO. REACTORS BED DEPTH (FT) FLUX (GPM/FT2) TCOD LOAD (# /DKCF) 3TXCOD LD (# /DKCF)
1 8 . 0 | 1
REACTOR DIAM NO. REACTORS BED DEPTH (FT) FLUX (GPM/FT2) TCOD LOAD (# /DKCF) 3TXCOD LD (# /DKCF)
14
REACTOR DIAM NO. REACTORS BED DEPTH (FT) FLUX (GPM/FT2) TCOD LOAD (# /DKCF) 3TXCOD LD (# /DKCF)
13
REACTOR DIAM NO. REACTORS BED DEPTH (FT) FLUX (GPM/FT2) TCOD LOAD (# /DKCF) 3TXCOD LD (# /DKCF)
3 0 6 O
BED VOL ( F T 3 ) 3 5 6 3 R+Q FLOW (G±>M) 3 3 0 8
4 . 5 R/Q RATIO 3 3 0 8
4 . 5 HPT (MIN) 44 CARBON (# e a ) 5 3 4 3 8 CARBON TOTAL 5 3 4 3 8
#/D 02 USED EFF 02 (mg/1) REACTOR INF 02 TSS OUT (mg/1)
940.1 2.0
25.3 25.7
PSA SIZE (SCFH)
TSS (#/DAY)
553
185.1
-101-n-in

ESTIMATED OPERATING COSTS
ELECT COST ($/KWHr)
FLUID PUMP BHP ea: ?3C PUMP BHP ea: GR CONTROL HP
NO. UNITS DIAMETER
OXYGEN PSA (#/D)
STD NUTR (GAL/D)
CAUSTIC SODA (#/D)
ATTRITION (#/D)
SO.06
39.9 39.5 3.0
1 18.0
940
19.2
364.3
18
PUMP EFF % MOTOR EFF %
PUMP $/D ±»UMF $/D PUMP $/D
TOTAL PUMP $/D
02 S/D
NUTR S/D
CAUSTIC $/D
CARBON (S/D)
TOTAL DAILY
TOTAL ANNUAL...
aech te l—TC:E O P T I O M 7
7 8 94
$42 . 80 $42 . 3 8
S3 . 22
$88.40
$25.38
$24.71
$94.72
$16.69
$249.90
$91,213.88
BUDGETARY CAPITAL COST
3ASIS: Reactors only installed on ijstemir's concrete non-union site, aces not indude interconnecting pipe. =rcc building, finish paint/insui
INCLUDES: engineering, all equipment controls/instrumentation, curbon. C2 generator, obc, start—jp. training
MATL BASIS: API 650 tanks/Plnsitfi 71'/? .nt ANSI 31.3 st«ei pipe, ductile pumps. ducHe valves/ss trim CAPITAL. $ 1 , 2 5 0 , 0 0 0
-102-
n-ii2

zmsAmmxvmtmz^.
FAX TO: Bill Flanagan (K1-3C19)
COMPANY: General Electric
FAX NO: 518/387-7611 PHONE: 518/387-5070
DATE: January 12, 1994 FROM: Jeff Devine 414-521-8208 ST. Process Engineer
Page: 1 of 14 pages Subject: Plaid Bed Treatment Scenarios for TCE and MeC12.
Wiffff&l^
Bill,
Enclosed are computer print-outs of our design program to size and cost Fluid Bed Reactors (FBRs) for treatment o the TCE and Methylene Chloride waste streams that you described to me. The evaluations made fur TCE includ the same assumptions used in prior preliminary designs. This includes an assumed phenol to TCE ratio of 1 to 1 o a mass basis.
The four scenarios of methylene chloride treatment are summarized in Table 1:
Table 1. Summary of MeCl, Case Studies
Case Flow (gpm)
MeCI* (mg/n
Size (Di.i./Model1)
HRT (min)
Operating Cost
(S/yO
Capital Cost ($)
Oj Transfer Device
1 500 66 6 ft / 370 5 $33,700 $260,000 Standard
2 500 5 6 ft / 370 5 $6,200 $260,000 Standard
3 6.2 5360 4.5 ft / 190 211 $32,500 $175,000 PBC
4 6.2 400 1.7 ft/30 29 $3,900 $95,000 Standard
-103-n-113

The following assumptions along with our observations and recommendations have been made:
1) The reported MeCI,. degradation rate is 2 g MeCVl/hr. 2) Specific oxygen consumption rate is 0.3 g 02/g MeCk 3) Specific NaOH consumption rate is 0.74 g NaOH/g MeCI2. 4) Reactor hydraulic flux rate is 14 to 20 gpm/sf.
While the reported methylene chloride degradation rate is 2 g/1/hr, it will require some ingenuity 10 design an FBI to meet the associated oxygen uptake rate. The two approaches that seem to be the most feasible to permit a increased organic loading rate to the reactor are as follows:
• Operate at an increased hydraulic flux through the reactor. This will require the use of a larger size UA( particle than we normally use.
• Use a pressurized bubble contactor (PBC), typical of our larger (> 6 ft) full-scale installations. Case 3 make use of a PBC. We have limited experience using a PBC on the smaller skid mounted units but anticipate bein' able to routinely supply between 40 and 50 mg/1 of D.O. to the base of the reactor. The key will be to asses at these high rates whether stripping of VOCs occurs.
It should be noted mat in Cases 1 and 2 the reactors are sized based on the flow rate rather than die test degradatir rate. In other words, the reactors could treat additional mass of organics, but cannot accept a greater volumetric fie rate. Normally, the 6-ft diameter rcaaors are designed to treat a maximum of 370 gpm. By increasing die OA( particle size, we think we could operate at a flux of 20 gpm/sf, which would allow us to treat 500 gpm.
Our smallest commercial unit, die Model 30, can easily handle the waste stream identified in Case 4.
If you have any questions or if wc can provide you with additional information, please give mc a call. Wc woul; also be glad to assist in any way we can with the upcoming TCE treatability work that you are planning.
Best Regards,
)^py^^Z^
-104-n-ii4
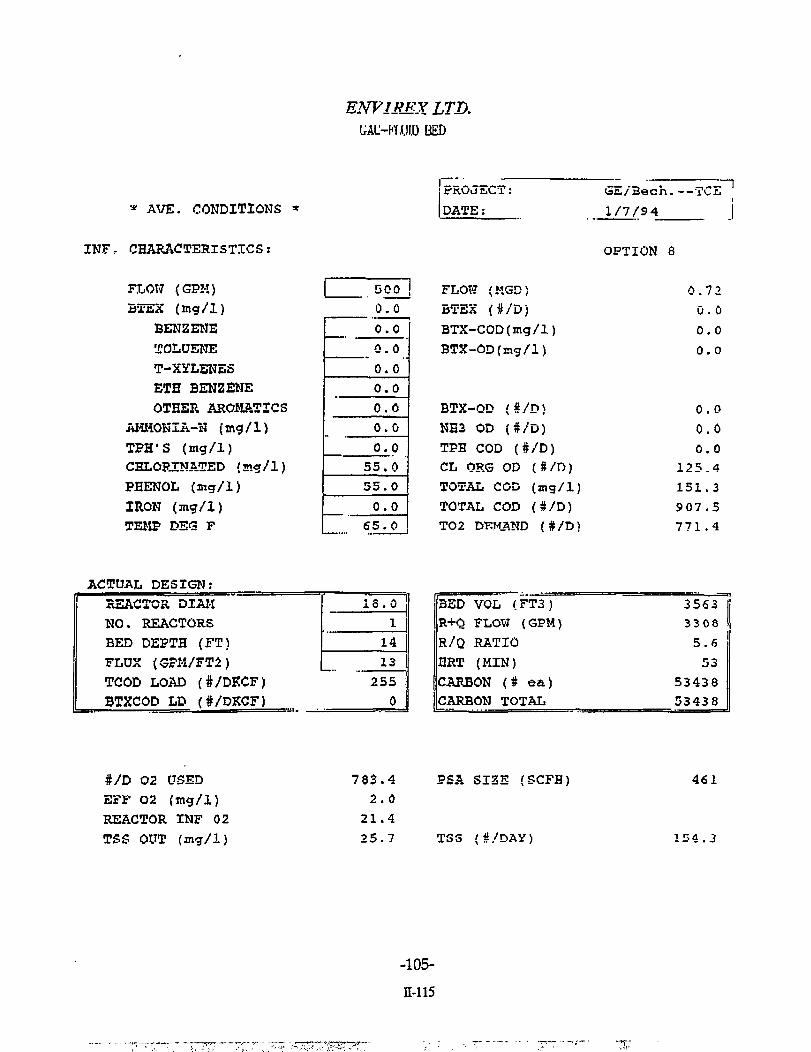
ENVIREXLTD. WC-WJUU) BED
* AVE. CONDITIONS *
INF, CHARACTERISTICS:
FLOW (GPM) BxEX (mg/l)
BENZENE TOLUENE T-XYLENES ETH BENZENE OTHER AROMATICS
A K H O K I A - N (jng /1) TPH'S (mg/l) CHLORINATED (mg/l) PHENOL (mg/l) IRON (mg/l) TEMP DEG F
rROJcCT: DATE:
GiL/'Becri 1/7/94
. — T C E 1
OPTION 8
500 FLOW (MGD)
OPTION
0.72 0.0 BTEX (#/D)
OPTION
0. 0 0.0 BTX-COD(mg/l)
BTX-OD(ng/1)
BTX-OD (#/D) NH3 OD (#/D) TPH COD (#/D) CL OF.G OD ( # /D) TOTAL COD (mg/1) TOTAL COD (#/D) T02 DK.KAND (#/D)
OPTION
0.0 G.O
BTX-COD(mg/l) BTX-OD(ng/1)
BTX-OD (#/D) NH3 OD (#/D) TPH COD (#/D) CL OF.G OD ( # /D) TOTAL COD (mg/1) TOTAL COD (#/D) T02 DK.KAND (#/D)
OPTION
0. 0 0.0
BTX-COD(mg/l) BTX-OD(ng/1)
BTX-OD (#/D) NH3 OD (#/D) TPH COD (#/D) CL OF.G OD ( # /D) TOTAL COD (mg/1) TOTAL COD (#/D) T02 DK.KAND (#/D)
OPTION
0.0
BTX-COD(mg/l) BTX-OD(ng/1)
BTX-OD (#/D) NH3 OD (#/D) TPH COD (#/D) CL OF.G OD ( # /D) TOTAL COD (mg/1) TOTAL COD (#/D) T02 DK.KAND (#/D)
OPTION
0.0
BTX-COD(mg/l) BTX-OD(ng/1)
BTX-OD (#/D) NH3 OD (#/D) TPH COD (#/D) CL OF.G OD ( # /D) TOTAL COD (mg/1) TOTAL COD (#/D) T02 DK.KAND (#/D)
OPTION
0.0 0.0
BTX-COD(mg/l) BTX-OD(ng/1)
BTX-OD (#/D) NH3 OD (#/D) TPH COD (#/D) CL OF.G OD ( # /D) TOTAL COD (mg/1) TOTAL COD (#/D) T02 DK.KAND (#/D)
OPTION
0.0 0.0
BTX-COD(mg/l) BTX-OD(ng/1)
BTX-OD (#/D) NH3 OD (#/D) TPH COD (#/D) CL OF.G OD ( # /D) TOTAL COD (mg/1) TOTAL COD (#/D) T02 DK.KAND (#/D)
OPTION
0.0 55.0
BTX-COD(mg/l) BTX-OD(ng/1)
BTX-OD (#/D) NH3 OD (#/D) TPH COD (#/D) CL OF.G OD ( # /D) TOTAL COD (mg/1) TOTAL COD (#/D) T02 DK.KAND (#/D)
OPTION
125.4 55.0
BTX-COD(mg/l) BTX-OD(ng/1)
BTX-OD (#/D) NH3 OD (#/D) TPH COD (#/D) CL OF.G OD ( # /D) TOTAL COD (mg/1) TOTAL COD (#/D) T02 DK.KAND (#/D)
OPTION
151.3 0.0
BTX-COD(mg/l) BTX-OD(ng/1)
BTX-OD (#/D) NH3 OD (#/D) TPH COD (#/D) CL OF.G OD ( # /D) TOTAL COD (mg/1) TOTAL COD (#/D) T02 DK.KAND (#/D)
OPTION
907.5 65.0
BTX-COD(mg/l) BTX-OD(ng/1)
BTX-OD (#/D) NH3 OD (#/D) TPH COD (#/D) CL OF.G OD ( # /D) TOTAL COD (mg/1) TOTAL COD (#/D) T02 DK.KAND (#/D)
OPTION
771 .4
ACTUAL DESIGN: REACTOR DIAM NO. REACTORS BED DEPTH (FT) FLUX (GPM/FT2) TCOD LOAD (#/DKCF) BTXCOD LD (#/DKCF)
xo . 0 | BED VOL (FT3) R+Q FLOW (GPM) R/Q RATIO HRT (MIN) CARBON (# ea) CARBON TOTAL
3563 3308 5.6 53
53438 53438
REACTOR DIAM NO. REACTORS BED DEPTH (FT) FLUX (GPM/FT2) TCOD LOAD (#/DKCF) BTXCOD LD (#/DKCF)
1 1 1
BED VOL (FT3) R+Q FLOW (GPM) R/Q RATIO HRT (MIN) CARBON (# ea) CARBON TOTAL
3563 3308 5.6 53
53438 53438
REACTOR DIAM NO. REACTORS BED DEPTH (FT) FLUX (GPM/FT2) TCOD LOAD (#/DKCF) BTXCOD LD (#/DKCF)
14 |
BED VOL (FT3) R+Q FLOW (GPM) R/Q RATIO HRT (MIN) CARBON (# ea) CARBON TOTAL
3563 3308 5.6 53
53438 53438
REACTOR DIAM NO. REACTORS BED DEPTH (FT) FLUX (GPM/FT2) TCOD LOAD (#/DKCF) BTXCOD LD (#/DKCF)
13 1
BED VOL (FT3) R+Q FLOW (GPM) R/Q RATIO HRT (MIN) CARBON (# ea) CARBON TOTAL
3563 3308 5.6 53
53438 53438
REACTOR DIAM NO. REACTORS BED DEPTH (FT) FLUX (GPM/FT2) TCOD LOAD (#/DKCF) BTXCOD LD (#/DKCF)
255 o I
BED VOL (FT3) R+Q FLOW (GPM) R/Q RATIO HRT (MIN) CARBON (# ea) CARBON TOTAL
3563 3308 5.6 53
53438 53438
#/D 02 USED EFF 02 (mg/l) REACTOR INF 02 TSS OUT (mg/l)
783.4 2.0
21.4 25.7
PSA SIZE (SCFH)
TSS (#/DAY)
461
-105-H-115

ESTIMATED OPERATING COSTS
GE/Beeh.—TCE OPTION 8
ELECT COST ($/KWhr) $0.06 PUMP EFF % MOTOR EFF %
78 94
FLUID PUMP BHP ©a; PBC PUMP BHP e-a: <3R CONTROL HP
MO, UNITS DIAMETER
39.9 39.5 3.0
1 18.0
PUMP $/D PUMP $/D PUMP $/D
TOTAL PUMP $/D
$42.80 $42.30 S3. 2 2
S*8.40
OXYGEN PSA (#/D)
STD NUTR (GAL/D)
CAUSTIC SODA (#/D)
ATTRITION (#/D)
783 02 $/D
16.0 NUTR $/D
3 03.6 CAUSTIC $/D
10 CARBON (S/D)
TOTAL DAILY
TOTAL ANNUAL.
$21.15
$20.59
$76.94
$16.69
$225.77
$82,404.61
BUDGETARY CAPITAL COST
SASIS: Reactors oriy InstnllnH on
eusloiTinr's concrete non-union
si ic does not IndixJo Interconnecting
pipe, men. building, finish palnJ/Insid
INCLUDES: enginaarlng, all equipment
confrols/instrumflnfnllon. carboa
02 generator, pba atari-up, training
MATL 9ASIS: API 650 fonks/Plasitc 7122 int
ANSI 31.3 steal pipe, duetllo ounnps.
riijr.lils valves/ss trim CAPITAL. $ 1 , 2 5 0 , 0 0 0
-106-
11-116

ENVIREX LTD, GAIJ-Ftint) RED
* AVE. CONDITIONS *
I N F . CHARACTERISTICS:
FLOW (GPM) BTEX (my/1)
BENZENE TOLUENE T-XYLENES ETH BENZENE OTHER AROMATICS
AMMONIA-K (mg / i') TPH'S (aicr/1) CHLORINATED (mg/1) PHENOL (ag/i) IRON (mg/1) TEMP DEG F
PROJECT: DATE:
GE/Bsch. 1/7/94
OPTION 9
—TCE ' 1 GE/Bsch. 1/7/94
OPTION 9
L 500 0. 0
FLOW (MGD) BTEX (#/D) BTX-COD(mg/l) BTX-OD(m?/I)
BTX-OD (#/D) NH3 OD (#/D) TPH COD (#/D) CT. ORG OD (#/D) TOTAL COD (mg/1) TOTAL COD (#/D) T02 DEMAND (#/D)
GE/Bsch. 1/7/94
OPTION 9
0.72 0.0
0.0 0.0
FLOW (MGD) BTEX (#/D) BTX-COD(mg/l) BTX-OD(m?/I)
BTX-OD (#/D) NH3 OD (#/D) TPH COD (#/D) CT. ORG OD (#/D) TOTAL COD (mg/1) TOTAL COD (#/D) T02 DEMAND (#/D)
GE/Bsch. 1/7/94
OPTION 9
0.0 0.0 0.0
FLOW (MGD) BTEX (#/D) BTX-COD(mg/l) BTX-OD(m?/I)
BTX-OD (#/D) NH3 OD (#/D) TPH COD (#/D) CT. ORG OD (#/D) TOTAL COD (mg/1) TOTAL COD (#/D) T02 DEMAND (#/D)
GE/Bsch. 1/7/94
OPTION 9
0.0 — 0.0
FLOW (MGD) BTEX (#/D) BTX-COD(mg/l) BTX-OD(m?/I)
BTX-OD (#/D) NH3 OD (#/D) TPH COD (#/D) CT. ORG OD (#/D) TOTAL COD (mg/1) TOTAL COD (#/D) T02 DEMAND (#/D)
GE/Bsch. 1/7/94
OPTION 9
— ja.o
FLOW (MGD) BTEX (#/D) BTX-COD(mg/l) BTX-OD(m?/I)
BTX-OD (#/D) NH3 OD (#/D) TPH COD (#/D) CT. ORG OD (#/D) TOTAL COD (mg/1) TOTAL COD (#/D) T02 DEMAND (#/D)
GE/Bsch. 1/7/94
OPTION 9
0.0
FLOW (MGD) BTEX (#/D) BTX-COD(mg/l) BTX-OD(m?/I)
BTX-OD (#/D) NH3 OD (#/D) TPH COD (#/D) CT. ORG OD (#/D) TOTAL COD (mg/1) TOTAL COD (#/D) T02 DEMAND (#/D)
GE/Bsch. 1/7/94
OPTION 9
0.0 0.0
FLOW (MGD) BTEX (#/D) BTX-COD(mg/l) BTX-OD(m?/I)
BTX-OD (#/D) NH3 OD (#/D) TPH COD (#/D) CT. ORG OD (#/D) TOTAL COD (mg/1) TOTAL COD (#/D) T02 DEMAND (#/D)
GE/Bsch. 1/7/94
OPTION 9
0.0 o.o
FLOW (MGD) BTEX (#/D) BTX-COD(mg/l) BTX-OD(m?/I)
BTX-OD (#/D) NH3 OD (#/D) TPH COD (#/D) CT. ORG OD (#/D) TOTAL COD (mg/1) TOTAL COD (#/D) T02 DEMAND (#/D)
GE/Bsch. 1/7/94
OPTION 9
0.0 5. 0
FLOW (MGD) BTEX (#/D) BTX-COD(mg/l) BTX-OD(m?/I)
BTX-OD (#/D) NH3 OD (#/D) TPH COD (#/D) CT. ORG OD (#/D) TOTAL COD (mg/1) TOTAL COD (#/D) T02 DEMAND (#/D)
GE/Bsch. 1/7/94
OPTION 9
11 .4 5,0
FLOW (MGD) BTEX (#/D) BTX-COD(mg/l) BTX-OD(m?/I)
BTX-OD (#/D) NH3 OD (#/D) TPH COD (#/D) CT. ORG OD (#/D) TOTAL COD (mg/1) TOTAL COD (#/D) T02 DEMAND (#/D)
GE/Bsch. 1/7/94
OPTION 9
13.0 -- 0.0
FLOW (MGD) BTEX (#/D) BTX-COD(mg/l) BTX-OD(m?/I)
BTX-OD (#/D) NH3 OD (#/D) TPH COD (#/D) CT. ORG OD (#/D) TOTAL COD (mg/1) TOTAL COD (#/D) T02 DEMAND (#/D)
GE/Bsch. 1/7/94
OPTION 9
82.5 -- an. o
FLOW (MGD) BTEX (#/D) BTX-COD(mg/l) BTX-OD(m?/I)
BTX-OD (#/D) NH3 OD (#/D) TPH COD (#/D) CT. ORG OD (#/D) TOTAL COD (mg/1) TOTAL COD (#/D) T02 DEMAND (#/D)
GE/Bsch. 1/7/94
OPTION 9
70.1
ACTUAL DESIGN: REACTOR DIAH NO, REACTORS BED DEPTH (FT) FLUX (GPM/FT2) TCOD LOAD (#/DKCF) BTXCOD LD (#/DKCF)
8.0 BED VOL (FT3) R+G FLOW (GPM) R/0. RATIO HRT (MIN) CARBON (# aa) CARBON TOTAL
7 04 ! 653 0.3
REACTOR DIAH NO, REACTORS BED DEPTH (FT) FLUX (GPM/FT2) TCOD LOAD (#/DKCF) BTXCOD LD (#/DKCF)
1 BED VOL (FT3) R+G FLOW (GPM) R/0. RATIO HRT (MIN) CARBON (# aa) CARBON TOTAL
7 04 ! 653 0.3
REACTOR DIAH NO, REACTORS BED DEPTH (FT) FLUX (GPM/FT2) TCOD LOAD (#/DKCF) BTXCOD LD (#/DKCF)
14
BED VOL (FT3) R+G FLOW (GPM) R/0. RATIO HRT (MIN) CARBON (# aa) CARBON TOTAL
7 04 ! 653 0.3
REACTOR DIAH NO, REACTORS BED DEPTH (FT) FLUX (GPM/FT2) TCOD LOAD (#/DKCF) BTXCOD LD (#/DKCF)
13
BED VOL (FT3) R+G FLOW (GPM) R/0. RATIO HRT (MIN) CARBON (# aa) CARBON TOTAL
11
REACTOR DIAH NO, REACTORS BED DEPTH (FT) FLUX (GPM/FT2) TCOD LOAD (#/DKCF) BTXCOD LD (#/DKCF)
117 0
BED VOL (FT3) R+G FLOW (GPM) R/0. RATIO HRT (MIN) CARBON (# aa) CARBON TOTAL
10556 10556 :
#/D 02 USED EFF 02 (mg/1) REACTOR INF 02 TSS OUT (mg/1)
02.1 2.0 10.9 2.3
PSA SISE (SCFH)
TSS (#/DAY)
48
14.0
-107-n-ii7

ESTIMATED OPERATING COSTS
GE/Bech.—TCE OPTION 9
ELECT COST ($/KWhr)
FLUID PUMP BHP ea: PBC PUMP BHP ca: GR CONTROL HP
NO. UNITS DIAMETER
OXYGEN PSA (#/D)
STD NUTR (GAL/D)
CAUSTIC SODA (#/D)
ATTRITION (#/D>
SO.06
9.0 5.2 1.5
1 a.o
82
1-5
27.6
PUHP EFF % MOTOR EFF ?,
PUHP S/D PUMP $/D PUMP $/D
TOTAL PUMP $/D
02 5/D
NUTR $/D
CAUSTIC $/D
3 CARBON (S/D)
TOTAL DAILY
TOTAL ANNUAL,
73 94
$9.66 $5.58 $1.61
$16.85
$2.22
SI. 87
$7. 18
$3.30
$31.42
$11,466.78
BUDGETARY CAPITAL COST
BASISl Reactors only Installed an
raretnmnr's oonecete nan union
Site, does not include, Intertttfinfir.ting
pipe, mec, building, finish paiiil/in3ii
INCLUDES: engineering, oil eqiipmsnl
uurili uls/inslrumentailon, carban,
02 generator, pbc. slnrl-up. training
MAT1 BASIS: API 6SO tcnks/Plnsitrt 717? inf
ANSI 3 1.3 sinnl pipo. ziuitlc pumpa,
dueMa valves/ss trim CAPITAL. 5 4 5 0 , 0 0 0
-108-n-ii8

ENVIREX LTD. GAC-FLUID BED
+ AVK. CONDITIONS * PROJECT: DATE:
GE/MeCl2 CASE 1 1/10/94
INT. CHARACTERISTICS:
. FLOW (GPM) BTEX (mg/1)
BENZENE TOLUENE T-XYLENES ETH BENZENE OTHER AROMATICS
AMMONIA-N (mg/1) TPH'S (mg/i) MeCl2 (mg/1) PHENOL (mg/1) IRON (mg/1) TEMP DEG F
500 0 .0 0 .0 0 .0 0 .0 0 ,0 0. .0
OJT 66. 0 0. 0 0. 0
65. 0
FLOW (MGD) BTEX (#/D) BTX-COD(mg/l) BTX-OD(TTtg/l)
BTX-OD (#/D) NH3 OD (#/D) TPH COD (#/D) MeCl2 OD (ft/D) TOTAL COD (ing/1) TOTAL COD (ff/D) T02 DEMAND (#/D)
0.72 0.0 0.0 0.0
0.0 0.0 0.0
118.8 19.8 118.8 110.8
ACTUAL DESIGNS REACTOR DIAM NO. REACTORS BED DEPTH (FT) FLUX (GPM/FT2)
6.0 REACTOR DIAM NO. REACTORS BED DEPTH (FT) FLUX (GPM/FT2)
1 REACTOR DIAM NO. REACTORS BED DEPTH (FT) FLUX (GPM/FT2)
11
REACTOR DIAM NO. REACTORS BED DEPTH (FT) FLUX (GPM/FT2) 20 TCOD LOAD (#/DKCF) DTXCOD LD (#/DKCF)
382 0
BED VOL (FT3) R+Q FLOW (GPM) R/Q RATIO HRT (MIN) CARBON (# ea) Total CARBON (#/d)
311 565 0.1 5
4665
#/D 02 USED EFF 02 (mg/1) REACTOR INF 02 TSS OUT (mg/1)
1 3 0 . 8 2 . 0
1 9 . 5 3 . 4
PSA SIZE (SCFH)
TSS (if/DAY)
77
20 .2
-109-n-ii9
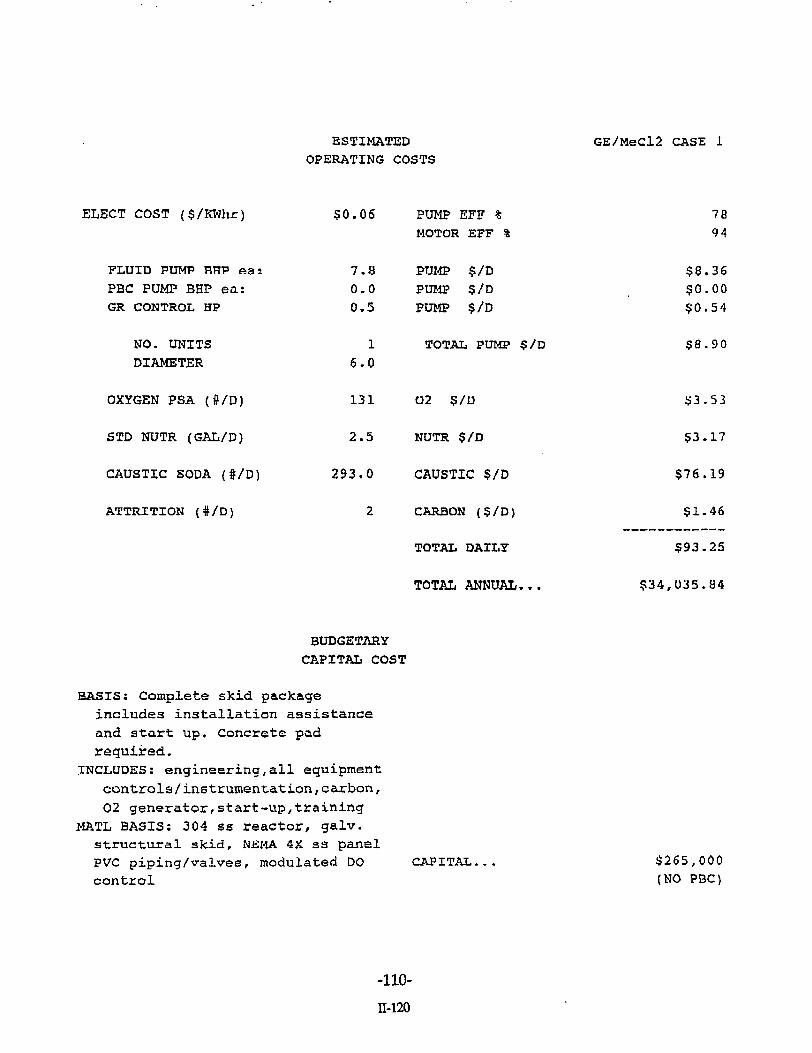
ESTIMATED OPERATING COSTS
GE/MeCl2 CASE 1
ELECT COST ($/KWhr)
FLUID PUMP HHP «a i PBC PUMP BHP ea: GR CONTROL HP
NO. UNITS DIAMETER
OXYGEN PSA (#/D)
STD NUTR (GAL/D)
CAUSTIC SODA (#/D)
ATTRITION (#/D)
$0.06 PUMP EFF % MOTOR EFF %
7.8 PUMP $/D 0.0 PUMP $/D 0.5 PUMP S/D
1 TOTAL PUMP 6.0
131 02 S/U
2.5 NUTR $/D
293.0 CAUSTIC S/D
2 CARBON ($/D)
TOTAL DAILY
TOTAL ANNUAL...
78 94
$8.36 $0.00 $0.54
$8.90
$3.53
$3.17
$76.19
$1.46
$93.25
$34,035.84
BUDGETARY CAPITAL COST
BASIS: Complete skid package includes installation assistance and start up. Concrete pad required.
INCLUDES: engineering,all equipment controls/instrumentation,carbon, 02 generator,start-up,training
MATL BASIS: 304 ss reactor, galv. structural skid, NEMA 4X sa panel PVC piping/valves, modulated DO CAPITAL.. control
$265,000 (NO PBC)
-110-n-120

ENVTREXLTD. GAC-FLUTO BED
* AVE. CONDITIONS * PROJECT: DATE :
GE/MeC12 CASE 2 1/10/94
INF. CHARACTERISTICS:
FLOW (GPM) BTEX (mg/1)
BENZENE TOLUENE T-XYLENES ETH BENZENE OTHER AROMATICS
AMMONIA-N (mg/1) TPH'S (mg/1) MeCl2 (mg/1) PHENOL (mq/1) IRON (mg/1) TEMP DEC F
500 0.0 0 .0 0 .0 0 .0 0 .0 0 .0
...P.: " b . 0 0
5. 0 0, 0 0. 0
65. 0
FLOW (MGD) BTEX (#/D) BTX-COD(mg/l) BTX-OD(mg/l)
RTX-On (#/D) NH3 OD (#/D) TPH COD (#/D) MeCl2 OD (f/D) TOTAL COD (mg/1) TOTAL COD (#/D) T02 DEMAND (#/D)
0.72 0.0 0.0 0.0
0.0 0.0 0. 9, 1. 9. 9.
ACTUAL DESIGN: REACTOR DIAM NO. REACTORS BED DEPTH (FT) FLUX (GPM/FT2) TCOD LOAD (4/DKCF) BTXCOD LD (#/DKCF)
6.0 REACTOR DIAM NO. REACTORS BED DEPTH (FT) FLUX (GPM/FT2) TCOD LOAD (4/DKCF) BTXCOD LD (#/DKCF)
1 REACTOR DIAM NO. REACTORS BED DEPTH (FT) FLUX (GPM/FT2) TCOD LOAD (4/DKCF) BTXCOD LD (#/DKCF)
11
REACTOR DIAM NO. REACTORS BED DEPTH (FT) FLUX (GPM/FT2) TCOD LOAD (4/DKCF) BTXCOD LD (#/DKCF)
20
REACTOR DIAM NO. REACTORS BED DEPTH (FT) FLUX (GPM/FT2) TCOD LOAD (4/DKCF) BTXCOD LD (#/DKCF)
29 0
BED VOL (FT3) 311 R+O. FLOW (GPM) 565 R/Q RATIO 0.1 IIRT (MIN) 5 CARBON (# ea) 4665 Total CARBON (ft/d) 4665
#/D OS USKD EFF 02 (mg/1) REACTOR INF 02 TSS OUT (mg/1)
21-0 2-0 3.3 0.3
PSA SIZE (SCFH)
TSS (ft/DAY)
12
1.5
-111-n-i2i

ESTIMATED OPERATING COSTS
GE/MeCl2 CASE 2
ELECT COST ($/KWhr)
FT.UTD PUMP BHP ea: PBC PUMP BHP ea: GR CONTROL HP •
NO. UNITS DIAMETER
OXXGEN PSA (f/n)
STD NUTR (GAL/D)
CAUSTIC SODA (#/D)
ATTRITION (#/D)
$0.06 PUMP EFF % MOTOR EFF %
7.8 PUMP $/D 0.0 PUMP $/D 0.5 PUMP $/U
1 TOTAL PUMP S/D 6.0
21 02 5/D
0.2 NUTR $/D
22.2 CAUSTIC $/D
2 CARBON ($/D)
TOTAL DAILY
TOTAL ANNUAL
78 94
$8.36 SO.00 Sfl.b4
$8.90
$0.57
50.24
$5.77
$1.46
$16.94
$6,181.40
BUDGETARY CAPITAL COST
BASISs Complete skid package includes installation assistance and start up. Concrete pad required.
INCLUDES: engineering,all equipment controls/instrumentation,carbon, 02 generator,start-up,training
MATL BASISs 3 04 ss reactor, galv. structural skid, TJEMR 4X ss pans! PVC piping/valves, modulated DO CAPITAL. control
$265,000 (NO TBC)
-112-H-122

* AVE. CONDITIONS •
INF. CHARACTERISTICS:
ENVIREX LTD. GAC-RJUn) KRD
PROJECT: DATE:
GE/MeCl2 CASE 3 1 / 1 0 / 9 4
FLOW (GPM) BTEX (ing/1)
BENZENE TOLUENE T-XYLENES ETH BENZENE OTHER AKOHAT1CS
AMMONIA-N (mg/1) TPH'S (mg/1) MeCl2 (mg/1) PHENOL (mg/1) TRON (mg/1) TEMP DEG F
1 * .2 0 .0 0 .0 0 ,0 0 .0 0. .0 0. 0 0. 0.
0 0
5360. 0 0. 0 0. 0
65. 0
FLOW (MGD) BTEX (#/D) BTX-COD(mg/l) BTX-OD(mg/l)
HTX-OD (#/D) NH3 OD (#/D) TPH COD (#/D) MeC12 OD (*/D) TOTAL COD (iug/1) TOTAL COD (#/D) T02 DEMAND (#/D)
0 . 0 1 0 . 0 0 . 0 0 . 0
0.0 0.0 0,
1 1 9 . 1 6 0 8 .
1 1 9 . 1 1 9 . 6
ACTUAL DESIGN: REACTOR DIAM NO. REACTORS BED DEPTH (FT) FLUX (GPM/FT2) TCOD LOAD (#/DKCF) BTXCOD LD (#/DKCF)
4-5 REACTOR DIAM NO. REACTORS BED DEPTH (FT) FLUX (GPM/FT2) TCOD LOAD (#/DKCF) BTXCOD LD (#/DKCF)
1 REACTOR DIAM NO. REACTORS BED DEPTH (FT) FLUX (GPM/FT2) TCOD LOAD (#/DKCF) BTXCOD LD (#/DKCF)
11
REACTOR DIAM NO. REACTORS BED DEPTH (FT) FLUX (GPM/FT2) TCOD LOAD (#/DKCF) BTXCOD LD (#/DKCF)
20
REACTOR DIAM NO. REACTORS BED DEPTH (FT) FLUX (GPM/FT2) TCOD LOAD (#/DKCF) BTXCOD LD (#/DKCF)
684 0
BED VOL (FT3) 175 R+Q FLOW (GPM) 318 R/Q RATIO 5 0.3 HRT (MIN) 211 CARBON (# ea) 2624 Total CARBON (#/d) 2624
#/D 02 USED EFF 02 ( m g / 1 ) REACTOR INF 02 TSS OUT (mg/1)
1 1 9 . 8 2 . 0
3 3 . 3 2 7 3 . 4
PSA SIZE (SCFH)
TSS (S/DAY)
87
20.3
-113-n-i23
•"r^v .

ESTIMATED GE/MeCl2 CAStf 3 OPERATING COSTS
ELECT COST ($/KWhr)
FLUID PUMP BHP ea: PBC PUMP BHP ea: GR CONTROL HP
NO- UNITS DIAMETER
OXYGEN PSA (#/D)
STD NUTR (GAL/D)
CAUSTIC SODA (#/D)
ATTRITION (#/D)
$0.06 . PUMP EFF % MOTOR EFF %
5.0 PUMP $/D 0.0 PUMP $/D 0.5 PUMP S/D
1 TOTAL PUMP 4.5
120 02 S/D
2.5 NUTR $/D
295.1 CAUSTIC S/D
1 CARBON (S/D)
TOTAL DAILY
TOTAT, ANNTTAT..
78 9 4
$0.00 SO.54
$5.91
$3.23
S3.19
$76.73
$0.82
$89.88
532,81)5.7*
BUDGETARY CAPITAL COST
BASIS: Complete skid package includes installation assistance and start up. Concrete pad required.
INCLUDES: engineering,all equipment controls/instrumentation,carbon, 02 generator,start-up,training
MATL BASIS: 304 ss reactor, galv. structural skid, NEMA 4 X SS panel PVC piping/valves, modulated DO CAPITAL... c o n t r o l
$175 ,000 (INCLUDES PBC)
-114-
11-124

ENVTREX LTD. GAC-FLUID BED
* AVE. CONDITIONS + PROJECT: nATHi
GE/MeCl?. CASE 4 1/10/94
INF. CHARACTERISTICS:
FLOW (GPM) HTEX (mg/1)
BENZENE TOLUENE T-XYLENES ETH BENZENE OTHER AROMATICS
AMMONIA-N (rog/1) TPH'S (mg/1) MeCl2 (mg/1) PHENOL (mg/1) IRON (mg/1) TEMP DEG F
6.2 FLOW (MGD) 0.0 BTEX (#/D) 0.0 BTX-COD(mg/l) 0.0 BTX-OD(ing/l) 0.0 0.0 0.0 BTX-OD (#/D) 0.0 NH3 OD (#/D) 0.0 TPH COD (#/D)
400_._0_ b i o
MeCl2 OD (ft/D) TOTAL COD (mg/1)
0.0 TOTAL COD (#/D) 65.0 T02 DEMAND (#/D)
0.01 n.o 0.0 0.0
0.0 0.0 11.0 8.9
120.0 8.9 3.9
ACTUAL DESIGN: REACTOR DIAM NO. REACTORS BED DEPTH (FT) FLUX (GPM/FT2)
1.7 REACTOR DIAM NO. REACTORS BED DEPTH (FT) FLUX (GPM/FT2)
1 REACTOR DIAM NO. REACTORS BED DEPTH (FT) FLUX (GPM/FT2)
11
REACTOR DIAM NO. REACTORS BED DEPTH (FT) FLUX (GPM/FT2) 14 TCOD LOAD (#/DKCF) DTXCOD LD (#/DKCF)
372 0
BED VOL (FT3) 24 R+Q FLOW (GPM) 31 R/Q RATIO 3.9 HRT (MIN) 29 CARBON (S ea) A hi)
Total CARDON (#/d) 360
#/D 02 USED EFF 02 (mg/1) REACTOR INF 02 TSS OUT (mg/1)
9.1 2.0 26-4 20.4
PSA SIZE (SCFH)
TSS (#/DAY) 1.5
-115-H-125

ESTIMATED OPERATING COSTS
GE/MeCl2 CASE 4
ELECT COST ($/KWhr)
FLUID PUMP HHP em t PBC PUMP BHP ca: GR CONTROL HP
NO. UNITS DIAMETER
OXYGEN PSA (#/D)
STD NUTR (GAL/D)
CAUSTIC SODA (£/D)
ATTRITION (#/D)
;o.06 PUMP EFF % MOTOR EFF %
3.5 PUMP $/D 0.0 PUMP $/D 0.5 PUMP $/D
1 TOTAL PUMP 1.7
9 02 $/D
0.2 NUTR S/D
22.0 CAUSTIC S/D
0 CARBON (S/D)
TOTAL DAILY
TOTAL ANNUAL...
7 8 94
$ 3 . 7 6 $ 0 . 0 0 $ 0 . 5 4
$ 4 . 3 0
$0.25
$0.24
$5.73
$0.11
$10.62
$3,875.15
BUDGETARY CAPITAL COST
BASIS: Complete skid package includes installation assistance and start up. Concrete pad required.
INCLUDES: engineering,all equipment controls/instrumentation,carbon, 02 generator,atart-up,training
MATL BASISi 304 ss reactor, galv. structural skid, NEMA 4X ss panel PVC piping/valves, modulated DO CAPITAL. control
$95,000 (NO PBC)
-116-H-126

Organic Sponges for Cost-Effective CVOC Abatement
Part III: Process Design and Cost Analysis
ffl-1


Table of Contents
Section Page
PART HI Summary: Process Design and Cost Analysis ES-1
1 INTRODUCTION 1.1 Background 1-1
1.2 Report Scope and Organization 1-2
2 PRELIMINARY DESIGN CRITERIA 2-1
3 CONCEPTUAL DESIGNS FOR EXHAUST TREATMENT CASES 3.1 Sorbents 3-1 3.2 Conceptual Designs for Low TCE Concentration 3-2
3.2.1 Case 1A - Sponge Adsorption/Thermal Regeneration 3-2 3.2.2 Case IB - Sponge Adsorption/Thermal Regeneration 3-3 3.2.3 Case 1R - Granular Activated Carbon (GAC) Adsorption/Off-Site
Regeneration 3-4 3.3 Conceptual Designs for High TCE Concentration 3-4
3.3.1 Case 2A - Sponge Adsorption/Thermal Regeneration 3-5 3.3.2 Case 2B - Sponge Adsorption/Thermal Regeneration 3-5 3.3.3 Case 2C - Sponge Adsorption/Regeneration Using Hot Water
and Biodegradation 3-6 3.3.4 Case 2D - Sponge Adsorption/Regeneration Using Steam and
Biodegradation 3-6 3.3.5 Case 2R - GAC Adsorption/Off-Site Regeneration 3-7
3.4 Identification of Competing Technologies 3-7
4 CAPITAL AND OPERATING AND MAINTENANCE COST ESTIMATES 4.1 General 4-1
4.1.1 Capital Cost Estimating Approach 4-2 4.1.2 Operating and Maintenance (O&M) Costs and Present Worth Basis 4-3
4.2 Cost Estimates for Low TCE Concentration 4-3 4.2.1 Case 1A - Sponge Adsorption/Thermal Regeneration 4-3 4.2.2 Case IB - Sponge Adsorption/Thermal Regeneration 4-4 4.2.3 Case 1R - GAC Adsorption/Off-Site Regeneration 4-4
4.3 Cost Estimates for High TCE Concentration 4-4 4.3.1 Case 2A - Sponge Adsorption/Thermal Regeneration 4-4 4.3.2 Case 2D - Sponge Adsorption/Regeneration Using Steam and
Biodegradation 4-5 4.3.3 Case 2R - GAC Adsorption/Off-Site Regeneration 4-5
Evaluation of Organic Sponges for CVOC Abatement
ra-3

Table of Contents
Section Page
4.4 Comparison of Estimated Costs 4-6 4.4.1 Comparison for Low TCE Concentration 4-6 4.4.2 Comparison for High TCE Concentration 4-7
5 CONCLUSIONS 5-1
6 ISSUES FOR FURTHER CONSIDERATION 6.1 Potential Process Improvements 6-1 6.2 Challenges for Future Phases 6-2
6.2.1 Technical Issues 6-2 6.2.2 Economic Issues 6-3 6.2.3 Other Significant Issues 6-3
7 LITERATURE 7-1
Appendix Page
A Abbreviation List and Acronyms A-l
B Data on Organic Sponges B-l
C Data on Granular Activated Carbon C-l
D Envirex Estimate D-l
Evaluation of Organic Sponges for CVOC Abatement ii
ni-4

Table of Contents
TABLES
Table Page
ES-1 Comparison of Estimated Costs for the Treatment Cases Considered ES-5
2-1 Preliminary Design Criteria 2-3
2-2 Summary of Key Design Parameters for AS Exhaust Gas Treatment Cases 2-7
3-1 Adsorber Design Parameters 3-9
3-2 TCE and Water Adsorbed on Sorbent at Equilibrium 3-10
3-3 Material Balance - Air Stripper Exhaust Treated by Sponge Adsorption System/Thermal Regeneration - Case 1A 3-11
3-4 Air Stripper Exhaust Treated by Sponge Adsorption/ Thermal Regeneration, Cases 1A & 2A - Major Equipment List 3-12
3-5 Material Balance - Air Stripper Exhaust Treated by Sponge Adsorption System/Thermal Regeneration - Case IB 3-15
3-6 Air Stripper Exhaust Treated by Sponge Adsorption/Thermal Regeneration, Case IB-Major Equipment List 3-16
3-7 Material Balance - Air Stripper Exhaust Treated by GAC Adsorption System/ Off-Site Regeneration-Case 1R 3-19
3-8 Air Stripper Exhaust Treated by GAC Adsorption System/Off-Site Regeneration -Case 1R-Major Equipment List 3-20
3-9 Material Balance - Air Stripper Exhaust Treated by Sponge Adsorption System/ Thermal Regeneration - Case 2A 3-21
3-10 Material Balance - Air Stripper Exhaust Treated by Sponge Adsorption System/ Thermal Regeneration-Case 2B 3-22
3-11 Material Balance - Air Stripper Exhaust Treated by Sponge Adsorption System/ Regeneration Using Hot Water/ Biodegradation - Case 2C 3-23
3-12 Air Stripper Exhaust Treated by Sponge Adsorption System/Regeneration Using Hot Water/Biodegradation-Case 2C-Major Equipment List 3-24
3-13 Material Balance - Air Stripper Exhaust Treated by Sponge Adsorption System/ Regeneration Using Steam/Biodegradation-Case 2D 3-27
Evaluation of Organic Sponges for CVOC Abatement iii
ffl-5

Table of Contents
Table Page
3-14 Air Stripper Exhaust Treated by Sponge Adsorption System/Regeneration Using Steam/Biodegradation - Case 2D - Major Equipment List 3-28
3-15 Material Balance - Air Stripper Exhaust Treated by GAC Adsorption System/ Off-Site Regeneration - Case 2R 3-31
3-16 Air Stripper Exhaust Treated by GAC Adsorption System/Off-Site Regeneration -Case 2R - Major Equipment List 3-32
4-1 Major Parameters for Estimating the Operating and Maintenance (O&M) Costs, Annualized Costs, and Present Worth 4-8
4-2 Capital Cost Estimate Summary - Air Stripper Exhaust Treated by Sponge Adsorption/Thermal Regeneration - Cases 1A&2A 4-9
4-3 Air Stripper Exhaust Treated by Sponge Adsorption System/Thermal Regeneration, Summary of Operating and Maintenance Costs, Total Annualized Costs, and Total Present Worth-Case 1A 4-10
4-4 Capital Cost Estimate Summary - Air Stripper Exhaust Treated by Sponge Adsorption/Thermal Regeneration - Case IB 4-11
4-5 Air Stripper Exhaust Treated by Sponge Adsorption System/Thermal Regeneration, Summary of Operating and Maintenance Costs, Total Annualized Costs, and Total Present Worth - Case IB 4-12
4-6 Capital Cost Estimate Summary - Air Stripper Exhaust Treated by GAC Adsorption/ Off-Site Regeneration - Case 1R 4-13
4-7 Air Stripper Exhaust Treated by GAC Adsorption System/Off-Site Regeneration, Summary of Operating and Maintenance Costs, Total Annualized Costs, and Total Present Worth - Case 1R 4-14
4-8 Air Stripper Exhaust Treated by Sponge Adsorption System/Thermal Regeneration, Summary of Operating and Maintenance Costs, Total Annualized Costs, and Total Present Worth-Case 2A 4-15
4-9 Capital Cost Estimate Summary - Air Stripper Exhaust Treated by Sponge Adsorption System/Regeneration Using Steam/Biodegradation - Case 2D 4-16
4-10 Air Stripper Exhaust Treated by Sponge Adsorption System/Regeneration Using Steam/ Biodegradation, Summary of Operating and Maintenance Costs, Total Annualized Costs, and Total Present Worth-Case 2D 4-17
Evaluation of Organic Sponges for CVOC Abatement IV
ffl-6

Table of Contents
Table Page
4-11 Capital Cost Estimate Summary - Air Stripper Exhaust Treated by GAC Adsorption/ Off-Site Regeneration-Case 2R 4-18
4-12 Air Stripper Exhaust Treated by GAC Adsorption System/Off-Site Regeneration, Summary of Operating and Maintenance Costs, Total Annualized Costs, and Total Present Worth-Case 2R 4-19
4-13 Comparison of Estimated Costs for the Treatment Cases Considered 4-20
Evaluation of Organic Sponges for CVOC Abatement V
m-7

Table of Contents
ILLUSTRATIONS
Figure Page
ES-1 Comparison of Annual O&M Costs and Total Annualized Costs for the Treatment Cases Considered ES-6
3-1 Process Flow Diagram - Air Stripper Exhaust Treated by Sponge Adsorption System - Thermal Regeneration - Cases 1 A, 1B.2A&2B 3-33
3-2 Process Flow Diagram - Air Stripper Exhaust Treated by GAC Adsorption System-Cases lRand2R 3-34
3-3 Process Flow Diagram - Air Stripper Exhaust Treated by Sponge Adsorption -Regeneration Using Hot Water/Biodegradation - Case 2C 3-35
3-4 Process Flow Diagram - Air Stripper Exhaust Treated by Sponge Adsorption -Regeneration Using Steam/Biodegradation - Case 2D 3-36
4-1 Comparison of Annual O&M Costs and Total Annualized Costs for the Treatment Cases Considered 4-21
4-2 Total Annualized Costs as a Function of Rate of Return for Cases 1 A, IB andlR 4-22
4-3 Total Annualized Costs as a Function of Rate of Return for Cases 2A, 2D and2R 4-23
Evaluation of Organic Sponges for CVOC Abatement vi
m-8

Part HI Summary: Process Design and Cost Analysis
Bechtel and General Electric Corporate Research and Development (GE/CRD) performed an engineering analysis and feasibility study to evaluate selected organic sponges for abatement of chlorinated volatile organic compounds (CVOCs) from air emissions of a typical groundwater air stripping (AS) and/or soil vapor extraction system at the U.S. Department of Energy's (DOE) restoration facilities. This study forms part of the DOE's program "Organic Sponges for Cost-Effective CVOC Abatement," (Contract No. DE-AC21-92MC29110). Envirex Ltd., a firm specializing in water and wastewater treatment using a fluidized bed biodegradation system, and a number of other technology/product vendors, provided input on process requirements and costs for their equipment/product.
PRELIMINARY DESIGN CRITERIA
GE/CRD initiated this feasibility evaluation by a series of laboratory tests to identify and examine organic sponges with the most potential for efficient adsorption/desorption of CVOCs. GE/CRD identified two organic sponges as candidates for further evaluation. These included a new sorbent from Dow Chemical Company (XU 43502.01) and a commercially available sorbent from Rohm and Haas Company (Ambersorb 563). For baseline comparison, Granular activated carbon (GAC BPL 4x6) from Calgon Carbon Corporation was selected. GE/CRD collected adsorption/desorption data for CVOCs on these sorbents and with information available from the vendors, this formed the basis for conceptual designs.
> Using the data collected by GE/CRD, Bechtel prepared conceptual designs and cost estimates for selected cases treating CVOCs from AS exhaust. The cases used the identified organic sponges with either thermal regeneration of sponge using hot nitrogen, or regeneration of sponge using hot water/steam and biodegradation of cooled water/condensed steam. The performance and costs of these cases are compared with a commercially available vapor phase GAC adsorption system.
Relatively conservative assumptions have been made in conceptual design of alternative cases using sponge adsorption system. One of the major design criteria is the allowed time for thermal regeneration. This evaluation assumes that a regeneration time three times the theoretically calculated value would be required. If future work indicates less time is required, the design can be refined.
CONCEPTUAL DESIGNS AND COST ESTIMATES
This report summarizes conceptual design of several cases for treatment of air exhaust from a groundwater AS system. These cases consider treatment of exhaust from an exiting dual-stage AS system with a flow rate of 2,000 SCFM and a TCE concentration of either 30 ppmv or 400 ppmv. Both of these TCE concentrations, especially the higher TCE concentration in the air exhaust, also reflect contaminant concentrations typically observed for a soil vapor extraction system exhaust.
Evaluation of Organic Sponges for CVOC Abatement ES-1
ffl-9

Part i n Summary
The cases considered for conceptual design and evaluation at the low TCE concentration (30 ppmv) include:
o Case 1A - Sponge Adsorption Using Dow XU as Sorbent/Thermal Regeneration
o Case IB - Sponge Adsorption Using Ambersorb 563 as Sorbent/ZThermal Regeneration
o Case 1R - GAC Adsorption/Off-Site Regeneration
The cases considered for conceptual design and evaluation at the high TCE concentration (400 ppmv) include:
o Case 2A - Sponge Adsorption Using Dow XU as Sorbent/Thermal Regeneration
o Case 2B - Sponge Adsorption Using Ambersorb as Sorbent/Thermal Regeneration
o Case 2C - Sponge Adsorption Using Dow XU as Sorbent/Regeneration Using Hot Water and Biodegradation
o Case 2D - Sponge Adsorption Using Dow XU as Sorbent/Regeneration Using Steam and Biodegradation
o Case 2R - GAC Adsorption/Off-Site Regeneration
Based on adsorption/desorption characteristics for Ambersorb sorbent, Case 2B was preliminarily screened out for high capital and operating costs. Also, the use of hot water for desorption of TCE and treatment of cooled water with the Envirex biodegradation process, Case 2C, was considered to be too expensive due to the water treatment costs. Therefore Case 2C was also dropped from further consideration. Conceptual capital and annual operating and maintenance (O&M) costs were estimated for the remaining cases.
Table ES-1 compares estimated costs for the cases considered. For each case, estimated costs of capital, present worth, annual O&M, and total annualized costs are summarized. Figure ES-1 graphically compares the annual O&M costs, capital charges, and total annualized costs for the cases. These results are based on full amortization of capital at an annual rate of return of 5 percent per annum.
CONCLUSIONS
The major conclusions are as follows:
o Based on the technical and economic guidelines set for this report, sponge adsorption is more attractive than GAC adsorption for treatment of high TCE concentrations in the exhaust Soil vapor extraction schemes often have high exhaust CVOC concentrations and would thus be suitable for sponge adsorption systems. Selected air stripper operations dealing with high groundwater concentrations of CVOCs would also be potentially suitable applications.
Evaluation of Organic Sponges for CVOC Abatement ES-2
in-io

Part i n Summary
o For a TCE concentrations of 30 ppmv in the AS exhaust, sponge adsorption using Dow XU sorbent and thermal regeneration with hot nitrogen has about the same present worth cost as GAC adsorption and off-site regeneration.
o For a TCE concentration of 400 ppmv in the exhaust, the sponge adsorption process using Dow XU sorbent and regeneration using hot nitrogen is more cost competitive than the GAC adsorption process.
o For a TCE concentration of 400 ppmv in the exhaust, the use of Dow XU sorbent and regeneration with steam and biodegradation of condensate is not cost competitive with thermal regeneration using hot nitrogen.
Further work may show that a significant reduction in the time required for regeneration of sponge is possible. A reduced regeneration time will allow the use of significantly less sorbent per sponge adsorption vessel. The reduction of sorbent in each vessel will substantially reduce capital costs for cases using sponge adsorption units. For example, the capital cost for Case 2A would be reduced at least 36 percent (to about $750,000 from $1,170,000) by reducing the amount of sorbent in the adsorption vessels and the reduced cost of the vessels. O&M costs would also be less because of the reduced pressure drop across the thinner sorbent beds and the subsequently reduced power required for the air stripper blower and the regeneration blower.
ISSUES FOR FURTHER CONSIDERATION
Sponge adsorption offers a potentially attractive means for treatment of the air exhaust from AS or soil vapor extraction schemes with high concentration CVOCs. A number of engineering decisions relating to design parameters and product quality have been made during the preparation of the conceptual designs and cost estimates. One of the prime objectives of the Phase II program, Pilot-Scale Demonstration, and Phase HI program, Full-Scale Demonstration, should be to validate the assumptions and refine the estimated economics for applying sponge adsorption technology at a DOE site.
Potential Process Improvements
A number of process improvements are possible to better utilize the designed equipment and thus reduce capital and operating costs for the alternatives using sponge adsorption. The major process improvements that should be considered include the following:
o The amount of sorbent in each sponge adsorption vessel and the size of the vessel can be reduced so as to match the frequency of regeneration required for a given contaminant concentration.
o Process modeling of the regeneration cycle would provide insight to the optimum temperature used for condensation of CVOCs of concern.
Evaluation of Organic Sponges for CVOC Abatement ES-3
III-ll

Part i n Summary
o The commercial availability of an adsorption vessel design that can provide in-bed heating should be researched. The major potential advantage of an in-bed heating design for a sponge adsorption system would be to allow rapid heating and cooling of the sorbent, which would require only a small stream of nitrogen for sweeping the CVOCs off the spent sponge.
o In general, further consideration should be given to sponge adsorber configuration and design, regeneration temperature selection, and setting the flow rate and pressure (vacuum or positive) for operation of the regeneration cycle.
Future Phases
The demonstration of organic sponge systems for CVOC removal is planned in three phases. These are as follows:
o Phase I - Laboratory-Scale Evaluation of Sponges for CVOC Abatement
o Phase II - Pilot-Scale Demonstration
o Phase HI - Full-Scale Demonstration
This report is part of Phase I, and will be used by GE/CRD to develop a final report on this phase. Phase II envisions a sponge adsorption scheme with a capacity of 100 to 200 SCFM of air exhaust either from an existing air stripper operation or from an existing soil vapor extraction system. The process to be demonstrated should be sponge adsorption using Dow XU sorbent and regeneration with hot nitrogen gas.
Evaluation of Organic Sponges for CVOC Abatement ES-4
ffl-12

Table ES-1 Comparison of Estimated Costs for the Treatment Cases Considered
Case Description
1A Sponge Adsorption/Thermal Regeneration TCE Cone. = 30 ppmv, Sorbent: Dow XU
IB Sponge Adsorption/Thermal Regeneration TCE Cone. = 30 ppmv, Sorbent: Ambersorb
1R GAC Adsorption/ Off-Site Regeneration TCE Cone. = 30 ppmv, Sorbent: GAC BPL
2A Sponge Adsorption/Thermal Regeneration TCE Cone. = 400 ppmv, Sorbent: Dow XU
2D Sponge AdsorpVRegen. Using Steam/Biodeg. TCE Cone. = 400 ppmv, Sorbent: Dow XU
2R GAC Adsorption/ Off-Site Regeneration TCE Cone. = 400 ppmv, Sorbent: GAC BPL
Project Total Capital Total Annual Life Cost Present Worth O&M Costs
(Years) ($) ($) ($)
20 $1,166,000 $3,830,000 $214,000
20 $1,406,000 $4,530,000 $250,000
20 $187,000 $3,820,000 $292,000
5 $1,166,000 $2,880,000 $396,000
5 $1,866,000 $5,050,000 $735,000
5 $248,000 $6,220,000 $1,382,000
Total Unit Costs Annualized Costs (cents (cents
($) /1,000SCF) /100m3)
$307,000 32.40 114.50
$363,000 38.20 135.50
$307,000 32.30 114.20
$665,000 70.30 248.40
$1,166,000 123.00 434.90
$1,439,000 151.80 536.30

$1,400,000
$1,200,000
$ $1,000,000 CO o O c c <
§ $800,000
$600,000
$400,000--
$ 2 0 0 , 0 0 0 "
$0
Legend:
Annual 0&M Costs
Capital Charges
Total Annualized Costs
2Zl
Case 1A Case 1B Case 1R Case 2A Case 2D Case 2R
Figure ES-1 Comparison of Annual O&M Costs and Total Annualized Costs for the Treatment Cases Considered

Section 1
Introduction
Bechtel and General Electric Corporate Research and Development (GE/CRD) have conducted an engineering analysis and feasibility study to evaluate selected organic sponges for abatement of chlorinated volatile organic compounds (CVOCs) from air emissions of a typical groundwater air stripping (AS) and/or soil vapor extraction system at the U.S. Department of Energy's (DOE) restoration facilities. This study forms part of the DOE's program "Organic Sponges for Cost-Effective CVOC Abatement" (Contract No. DE-AC21-92MC29110). Envirex Ltd., a firm specializing in water and wastewater treatment using a fluidized bed biodegradation system, and a number of other technology/product vendors, have provided input on process requirements and costs for their equipment/product
1.1 BACKGROUND Abatement of CVOCs from air emissions of air strippers and or soil vapor extraction exhausts is currently a challenge for environmental engineers. Granular activated carbon (GAC) adsorption has been the most common treatment process used for these applications. Although the GAC adsorption process is commercially available today, its use is expensive and it generally requires the use of transportable GAC adsorption vessels (or manual vacuuming of the spent GAC to approved containers), hauling the spent GAC (usually considered a hazardous waste) to a qualified and US EPA permitted off-site reactivation facility, and thermal regeneration of spent GAC to destroy the hazardous organics. A number of alternative technologies are being developed or tested by various technology vendors/contractors. The use of organic sponge is a relatively new method for abatement of CVOCs from AS/soil vapor extraction systems. Compared to GAC, organic sponge potentially offers higher adsorption capacity for CVOCs (at high concentrations) and offers the ability to sustain frequent thermal regeneration and reuse.
GE/CRD initiated this feasibility evaluation by conducting a series of laboratory tests to identify and examine organic sponges with the most potential for efficient adsorption/desorption of CVOCs. Based on these activities, GE/CRD identified two organic sponges as the most likely candidates for further evaluation. These included a new sorbent from Dow (XU 43502.01) and a commercially available sorbent from Rohm and Haas Company (Ambersorb 563). For baseline comparison, granular activated carbon (GAC BPL 4x6) from Calgon Carbon Corporation was selected. GE/CRD has developed data on adsorption/desorption of CVOCs on these sorbents and these data, along with information available from the vendors, have formed the basis for
. conceptual designs developed in this evaluation.
Using the data collected by GE/CRD, Bechtel has developed conceptual designs and cost estimates for selected alternative cases for treatment of CVOCs from AS exhaust. The alternative cases use the identified organic sponges with thermal regeneration of sponge using hot nitrogen or regeneration of sponge using hot water/steam and biodegradation of cooled water/condensed steam. Performance and costs are then compared with the use of the commercially available vapor phase GAC adsorption system for, baseline comparison.
Evaluation of Organic Sponges for CVOC Abatement 1-1
in-15
-iTfr~

Introduction
1.2 REPORT SCOPE AND ORGANIZATION
This report summarizes conceptual design of several alternative cases for treatment of air exhaust from a groundwater air stripper (AS) system which would be similarly applicable to soil vapor extraction systems. These alternative cases consider treatment of exhaust from an exiting dual stage AS system with a flow rate of 2,000 SCFM and a TCE concentration of either 30 pprnv or 400 ppmv (by volume). Both of these TCE concentrations, especially the higher TCE concentration in air exhaust, also reflect contaminant concentrations typically observed for a soil vapor extraction system exhaust
This report does not evaluate all technologies for abatement of CVOCs from air exhaust of AS/soil vapor extraction systems. However, the major competing technologies are identified.
Section 2 provides the preliminary design criteria for the conceptual design of alternative cases considered. The cases to be evaluated are defmed and the parameters for each case are described.
Section 3 describes the conceptual designs for the AS exhaust treatment cases considered. For each case, a process flow diagram, a material balance, and an equipment list are presented.
Section 4 presents the capital, operating and maintenance cost estimates for the alternative cases considered. A comparison of the alternative cases and their associated capital and operating and maintenance costs is then presented.
Section 5 presents the conclusions of this study. Section 6 presents a discussion of potential process improvements and the challenges for future phases of this program. Some areas where further investigations or considerations may be required to further enhance the application of organic sponges are discussed.
Section 7 presents a list of key literature references which have been reviewed during the conceptual design and preparation of this report
Appendix A provides a list of abbreviations and acronyms. Appendix B presents technical data, including adsorption isotherms data for organic sponges considered in this report and provided to Bechtel by GE/CRD. Appendix C provides technical data on vapor phase GAC and also includes an adsorption isotherm for liquid phase GAC from Calgon Carbon Corporation. Appendix D provides a copy of an estimate for the Envirex Biodegradation system.
Evaluation of Organic Sponges for CVOC Abatement 1-2
in-i6

Section 2
Preliminary Design Criteria
This section identifies the cases that are considered in this report for treatment of air exhaust from a groundwater air stripper (AS) system. These cases consider treatment of exhaust from an exiting dual stage AS system treating a 500 gpm groundwater stream with two different TCE concentrations of 5 ppm and 66 ppm (mg/L).
The corresponding air exhaust flow rate is 2,000 SCFM and the exhaust TCE concentrations are either 30 ppmv or 400 ppmv. Both of these TCE concentrations, especially the higher TCE concentration in the air exhaust, also reflect contaminant concentrations typically observed for a soil vapor extraction system exhaust Based on laboratory tests and evaluations conducted by GE/CRD, three types of sorbents have been selected for consideration as follows:
• Organic Sponge: Dow XU 43502.01
• Organic Sponge: Ambersorb563
• Granular Activated Carbon (GAC): Calgon BPL 4x6 (Baseline Comparison)
The cases considered for conceptual design and evaluation at the low TCE concentration (30 ppmv) include:
• Case 1A - Sponge Adsorption Using Dow XU as Sorbem/Thermal Regeneration
• Case IB - Sponge Adsorption Using Ambersorb 563 as Sorbent//Thermal Regeneration
• Case 1R - GAC Adsorption/Off-Site Regeneration
The cases considered for conceptual design and evaluation at the high TCE concentration (400 ppmv) include:
• Case 2A - Sponge Adsorption Using Dow XU as Sorbent/Thermal Regeneration
• Case 2B - Sponge Adsorption Using Ambersorb as Sorbent/Thermal Regeneration
Q Case 2C - Sponge Adsorption Using Dow XU as Sorbent/Regeneration Using Hot Water and Biodegradation
• Case 2D - Sponge Adsorption Using Dow XU as Sorbent/Regeneration Using Steam and Biodegradation
• Case 2R- GAC Adsorption/Off-Site Regeneration
Table 2-1 provides the preliminary design criteria and further definition of eight alternative cases considered. The alternative cases are made up from consideration of the two contaminant levels, the different sorbents, and the choice of sorbent regeneration schemes (thermal, biodegradation, or off-site). Biodegradation schemes are considered only for the higher contaminant concentration level cases.
Evaluation of Organic Sponges for CVOC Abatement 2-1
ffl-17

Preliminary Design Criteria
Table 2-2 provides a summary of key design parameters for the alternative cases considered.
Evaluation of Organic Sponges for CVOC Abatement 2-2
111-18

Table 2-1 Preliminary Design Criteria
Parameter Units
I PROCESSING SCHEMES EVALUATED
Case 1 A- Groundwater air stripper (AS) exhaust treated by vapor phase organic sponge (sponge) adsorbers with granular activated carbon (GAC) adsorbers as back-up, sponge adsorbers regenerated thermally using nitrogen gas Sorbent: Dow XU43502.01; Air Stripper Exhaust TCE Concentration = 30 ppmv
Case IB- Groundwater AS exhaust treated by vapor phase organic sponge (sponge) adsorbers with granular activated carbon (GAC) adsorbers as back-up, sponge adsorbers regenerated thermally Sorbent: Ambersorb 563; Air Stripper Exhaust TCE Concentration = 30 ppmv
Case 1R- Groundwater AS exhaust treated by vapor phase GAC adsorbers, spent GAC regenerated off-site Air Stripper Exhaust TCE Concentration = 30 ppmv
Case 2 A - Similar to Case 1 A, except for: AS Exhaust TCE Concentration = 400 ppmv
Case 2B - Similar to Case IB, except for AS Exhaust TCE Concentration = 400 ppmv
Case 2C- Groundwater AS exhaust treated by vapor phase organic sponge (sponge) adsorbers with granular activated carbon (GAC) adsorbers as back-up, sponge adsorbers regenerated using water/biodegradation Sorbent: Dow XU43502.01; Air Stripper Exhaust TCE Concentration = 400 ppmv
Case 2D - Similar to Case 2C, except for Sponge Adsorbers regenerated using steam/biodegradation
Case 2R- Groundwater AS exhaust treated by vapor phase GAC adsorbers, spent GAC regenerated off-site Air Stripper Exhaust TCE Concentration = 400 ppmv
See Table 2-2 for a summary of key design parameters for alternative AS exhaust gas treatment alternatives
H BASIC PARAMETERS
Groundwater temperature Atmospheric air temperature Atmospheric air relative humidity Atmospheric pressure
HI CASE 1A - AS EXHAUST TREATED BY SPONGE ADSORBERS/THERMAL REGENERATION
59(15) °F(°C) 68 (20) °F(°C)
70 % 14.7 psia
M:^ KK.
GrouwJwaterconrJrraraani^^ 4'-U# "'^•'•<z&M ^M-Mis^I.^^S^^'i:i^M, AS Design
<ppra(by.wt)
AS exhaust air feed to sponge adsorbers Demonstration Scale
Relative humidity, exhaust air from AS Temperature, exhaust air from AS Pressure, exhaust air from AS (before modification, AS blower has a 10 HP motor) Contaminant concentration in feed to sponge adsorbers Exhaust gas heater to reduce relative humidity to < 50% Organic sponge used for evaluation Thermal regeneration media for sponge adsorbers Upon regeneration, sponge adsorption capacity is restored to Spent GAC Regeneration
2000 SCFM 100 % 60 °F 15 psia 30 ppmv
Heat gas at least 20°F Dow XU 43502.01
Heated N2 Gas '% of original capacity
Off-Site
Design Criteria -Rev.2, 2/28/94
m-19

Table 2-1 Preliminary Design Criteria
Parameter Units
HI CASE IB • AS EXHAUST TREATED BY SPONGE ADSORBERS/THERMAL REGENERATION
G r o u x ^ r c o n u ™ c o o c n t ™ . ^ $ £ & S / * i « i --Di»t^Satge£;.": *' '":. r ; >
AS exhaust air feed to sponge adsorbers Demonstration Scale
Relative humidity, exhaust air from AS Temperature, exhaust air from AS Pressure, exhaust air from AS (before modification, AS blower has a 10 HP motor) Contaminant concentration in feed to sponge adsorbers Exhaust gas heater to reduce relative humidity to < 50% Organic sponge used for evaluation Thermal regeneration media for sponge adsorbers Spent GAC Regeneration
2000 SCFM 100 % 60 o F
15 psia 30 ppmv
Heat gas at least 20°F Ambersorb 563
Heated N2 Gas Off-Site
HI CASE 1R . AS EXHAUST TREATED BY VAPOR PHASE GAC ADSORBERS (BASELINE COMPARISON)
Groundwater Fkwrae to AS COQUHU: Groundwater conti A&Design.-5 i***-' - ~ ^zm- -a~s*s Dufll-Satge AS exhaust air feed to vapor phase GAC adsorbers 2000 SCFM Relative humidity, exhaust air from AS 100 % Temperature, exhaust air from AS 60 °F Pressure, exhaust air from AS (before modification, AS blower has a 10 HP motor) 15 psia Exhaust gas heater to reduce relative humidity to < 50% Heat gas at least 20°F Contaminant concentration in feed to vapor phase GAC adsorbers 30 ppmv Sorbent used for evaluation Calgon BPL 4x6 Spent GAC Regeneration Off-Site
TV CASE 2A - AS EXHAUST TREATED BY SPONGE ADSORBERS/THERMAL REGENERATION
Existing Facilrties
fe.i •mi
1 8 ^ 1 ^ ^ -Dual-Satgc
ppm(bywt)
AS exhaust air feed to sponge adsorbers Demonstration Scale
Relative humidity, exhaust air from AS Temperature, exhaust air from AS Pressure, exhaust air from AS (before modification, AS blower has a 10 HP motor) Contaminant concentration in feed to sponge adsorbers Exhaust gas heater to reduce relative humidity to < 50% Organic sponge used for evaluation Thermal regeneration media for sponge adsorbers Upon regeneration, sponge adsorption capacity is restored to Spent GAC Regeneration
2000 SCFM 100 % 60 °F 15 psia
400 ppmv Heat gas at least 20°F
Dow XU 43502.01 Heated N2 Gas
80% of original capacity Off-Site
Design Criteria -Rev.2, 2/28/94 IH-20

Table 2-1 Preliminary Design Criteria
Parameter Units
IV CASE 2B - AS EXHAUST TREATED BY SPONGE ADSORBERS/THERMAL REGENERATION
- . " - ' ' ' • - " : ? - /v-i'^-'-j'-^ v .,i'i'.- ' -'.- Existing Facilities - " *V~ -
Groundwater Howrate to A S - ; - , / ', lc:,S>. :'•"'' -.'':' .';? , - » - i - -'">"; - - .£ ' - •? , - *," "^ ' -500 - gpm Contaminant - - .' •' •-"'•- ., . -•*'!>;'-?;<•, •?...J'•- - * ' " *'-" * ' ' * " ' . "•-" '<T". . -.- • TCE Groundwater contanutoto&nceaWttioa' ;,- ->~; ' .;=' v - • ' . ; -% s,_ v "*' : . * ' ^ "V- ~ ' >. ""' 66 ppm(bywt) ASDesign . ;'' -, ••'- -; '/.'':•:>•• r -:-' ,--'•'-.'< Dual-Satge AS exhaust air feed to sponge adsorbers
Demonstration Scale Relative humidity, exhaust air from AS Temperature, exhaust air from AS Pressure, exhaust air from AS (before modification, AS blower has a 10 HP motor) Contaminant concentration in feed to sponge adsorbers Exhaust gas heater to reduce relative humidity to < 50% Organic sponge used for evaluation Thermal regeneration media for sponge adsorbers Upon regeneration, sponge adsorption capacity is restored to Spent GAC Regeneration
IV CASE 2C-AS EXHAUST TREATED WITH SPONGE ADSORBERS/REGENERATION USING HOT WATER/BIODEGRADATION
2000 SCFM 100 % 60 op 15 psia
400 ppmv Heat gas at least 20°F
Ambersorb 563 Heated N2 Gas
80% of original capacity Off-Site
Existing Facilities Groundwater Howrate to AS . ; > : ' ; Contaminant , - - . * - . Groundwater contaminant concenttatkra ASDesign
.500* '• •• TCE
66 Dual-Satge
gpm
ppra(bywt)
AS exhaust air feed to sponge adsorbers Demonstration Scale
Relative humidity, exhaust air from AS Temperature, exhaust air from AS Pressure, exhaust air from AS (before modification, AS blower has a 10 HP motor) Contaminant concentration in feed to sponge adsorbers Exhaust gas heater to reduce relative humidity to < 50% Organic Sponge used for evaluation
2000 SCFM 100 % 60 op 15 psia
400 ppmv Heat gas at least 20°F
Dow XU 43502.01 Regeneration media for sponge adsorbers Spent GAC Regeneration (Vapor Phase)
Hot Water/ Phenol/ GAC Fluidized Bed Off-Site
IV CASE 2D - AS EXHAUST TREATED WITH SPONGE ADSORBERS/REGENERATION USING STEAM/BIODEGRADATION
-'' '-. -V .--/ -J-i">, •> "' Existing Facilities GroundwaterFfowratetc*AS". / < : ' . & ^ : ? " •- -'" - • ' " ' "/•*'/ . / ;-'7-T - ' soo gpm Contaminant /;'-'.' . , -/-• ~ " v
;' •„'.;-;-•-' , • ' ,.' : ' < •'"', '. '. " ' V ' •" " . TCB Groundwatercotitarnmnntconcentration :~ -,"- -/""'' ' ? : ' ' - " - ' ' • • . ' < - „ ' " " * - . :•'"•-. 6 6 - ppm (by wt) ASDesign V " ' -'-' ,-'' ""' --'--*' ,-.',' •' - v .- - _ - / • , --• - „-..-. Dual-Satge AS exhaust air feed to sponge adsorbers
Demonstration Scale Relative humidity, exhaust air from AS Temperature, exhaust air from AS Pressure, exhaust air from AS (before modification, AS blower has a 10 HP motor) Contaminant concentration in feed to sponge adsorbers Exhaust gas heater to reduce relative humidity to < 50% Organic sponge used for evaluation
2000 100 60 15 400
Heat gas at least 20CF Dow XU 43502.01
Regeneration media for sponge adsorbers Spent GAC Regeneration (Vapor Phase)
Steam/ Phenol/ GAC Fluidized Bed Off-Site
SCFM % op psia ppmv
Design Criteria -Rev.2, 2/28/94
in-21 2-5
JST"

Table 2-1 Preliminary Design Criteria
Parameter Units
IV CASE 2R - AS EXHAUST TREATED BY VAPOR PHASE GAC ADSORBERS (BASELINE COMPARISON)
. ; : - ; ? ^ ^ ^r&^§;4>-<> - V S-<?-f -,i-C V ' f-x ' * ' « ' - * V ^ ' ^ ' 5 ' ' -'*•-'* v ' v
GrouodwaterFlowratetnAS *.. s ^ / . ^ - S S - ^ ? . --•• -^ :?- h^i$- - ,*:i<-"'.'*'-*•'-. ioo^;; :'gimv;;" . CoatwniuBt> --^;\- V-.'.wSc >5.1 o ^ r ' ^ ^ v ^ p j ^ ' ; /;->-/ i;: ^ ;:TdCE?;:^6.'- -'.'*' '.
•&i^,**M*-&X ••':• -&* - P 4 ^ ; ' l» '?- t*F»^W ASDwten^V..:.: - - • • • -'-• ' •**•<• • .-; "•-' - -." •, - - --- '"-'DnafrSJ^e^'*-'- "'-'.-'--AS exhaust air feed to vapor phase GAC adsorbers 2000 SCFM Relative humidity, exhaust air from AS 100 % Temperature, exhaust air from AS 60 °F Pressure, exhaust air from AS (before modification, AS blower has a 10 HP motor) 15 psia Exhaust gas heater to reduce relative humidity to < 50% Heat gas at least 20°F Contaminant concentration in feed to vapor phase GAC adsorbers 400 ppmv Sorbent used for evaluation Calgon BPL 4X6 Spent GAC Regeneration Off-Site
Design Criteria -Rev.2, 2/28/94 in-22

Table 2-2 Summary of Key Design Parameters for AS Exhaust Gas Treatment Cases
Case
Parameter 1A 1B 1R 2A 2B 2C 2D 2R
Existing Facilities Groundwater flow rate to AS, gpm 500 . , ^ , Contaminant TCE . - — . — . .—, . ^ Groundwater TCE concen., ppm{bywt.) 5 ^ 66: • • • - ^
Exhaust Treatment System AS exhaust conditions - Air feed to treatment, SCFM 2,000 ^ - Relative humidity, % 100 ^ - Pressure, psia 15 . ^ - Temperature, °F 60 ^ - Contaminant concentration, ppmv 30 ^ 400 ^
Sorbent used Dow Ambersorb GAC Dow Ambersorb Dow Dow GAC Sorbent regeneration scheme - Heated N2 gas / • • / - Off-Site (GAC regeneration) / • _ - Hot water/biodegradation • - Steam/biodegradation •
i


Section 3
Conceptual Designs for Exhaust Treatment Cases
This section presents the conceptual designs for the eight air stripper (AS) exhaust treatment cases considered. The conceptual designs include development of process flow diagrams, material and energy balances, and equipment lists.
The cases are designed for the two contaminant levels in AS exhaust, 30 ppmv and 400 ppmv of TCE, the different sorbents -Dow XU (43502.01), Ambersorb 563, and Calgon vapor phase GAC (BPL 4x6) - and the choice of sorbent regeneration schemes (thermal, biodegradation, or off-site). Biodegradation schemes are considered only for the higher contaminant concentration level cases. Section 2 presented the preliminary design criteria for the alternatives considered for this evaluation.
3.1 SORBENTS
Table 3-1 presents the adsorber design parameters and a calculation of the mass of sorbent provided as a function of sorbent type used. This table also illustrates the pressure drop for each sorbent and shows that the use of Ambersorb would result in a significantly higher pressure drop when compared to Dow XU and Calgon GAC BPL. Based on a design flow rate of 2,000 SCFM and a design superficial velocity criteria of 40 feet per minute, the adsorber diameter is 8 feet (and cross-sectional area is 50 square feet) for the use of Dow XU sorbent and GAC BPL. To provide an adequate quantity of sorbent for adsorption, a bed depth of 4 feet was used. The corresponding amount of sorbent required would then be 5,000 lbs for Dow XU sorbent and 6,000 lbs for GAC. For Ambersorb, a bed height of 4 feet would result in too high a pressure drop, and thus a bed depth of 2 feet was chosen. In order to have a comparable mass of sorbent for the cases using Ambersorb, the diameter of the adsorber was increased to 10 feet. The corresponding mass of Ambersorb would men be 5,000 lbs.
Appendix B summarizes GE/CRD data on adsorption capacity of these sorbents for TCE. Tables 3-2a and 3-2b present the adsorption capacities for the sorbents used at TCE concentrations of 30 ppmv and 400 ppmv in the AS exhaust. As shown, Ambersorb and GAC have relatively high adsorption capacities of about 15 percent at the lower TCE concentration of 30 ppmv, whereas Dow XU has a lower adsorption capacity of 5 percent. At the higher TCE concentration of 400 ppmv, all sorbents have relatively high adsorption capacities, ranging from 25 to 30 percent by weight, with GAC at the highest adsorption capacity level.
Tables 3-2a and 3-2b also show the amounts of TCE adsorbed at equilibrium and the water adsorbed on sorbent. As shown, vapor phase GAC adsorbs higher amounts of water vapor than either of the other sorbents. With a relative humidity of 50 percent in exhaust air being treated, the GAC adsorption bed would adsorb nearly 720 lbs of water vapor (12% by wt) whereas either of the two organic sponges adsorb only 100 lbs of water vapor (2% by wt). This observation indicates that GAC would not be as efficient of a thermally regenerable sorbent as the organic sponges because evaporation of the adsorbed water vapor would require additional energy. Upon frequent on-site thermal regeneration, GAC is also expected to have a shorter service life than sponge.
Evaluation of Organic Sponges for CVOC Abatement 3-1
m-25

Conceptual Designs for Exhaust Treatment Cases
3.2 CONCEPTUAL DESIGNS FOR LOW TCE CONCENTRATION The alternative cases are designed for treatment of air exhaust from an existing air stripper facility with a groundwater flow rate of approximately 500 gpm and a TCE concentration of 5 ppm (by weight). The corresponding air flow rate is 2,000 SCFM, and thus the exhaust TCE concentration would be 30 ppmv.
Conceptual designs are developed for comparison of the two organic sponges at a TCE concentration of 30 ppmv in the AS exhaust Each of the concept designs for Dow or Ambersorb sponges envisions thermal regeneration of spent sorbent using hot nitrogen. For baseline comparison, the use of GAC adsorption with off-site regeneration is evaluated.
3.2.1 Case 1A - Sponge Adsorption/Thermal Regeneration
Figure 3-1 presents a process flow diagram for Case 1A, sponge adsorption using Dow XU43502.01 as sorbent and thermal regeneration using hot nitrogen. This figure also is common to Cases IB, 2A, and 2B, defined in Table 2-1. Table 3-3 provides a material balance for this case. A major equipment list is presented in Table 3-4.
Process Description
The AS exhaust with the TCE concentration of 30 ppmv provides the feed to the sponge adsorption system. The exhaust is first directed to a knock-out drum (Figure 3-1, equipment 1-C-l) to remove any residual free moisture from the air stream. The air is then heated in an air heater (equipment 1-E-l) to reduce the relative humidity of the exhaust air to below 50 percent This is accomplished by increasing the air temperature by about 20°F. The air is then directed to two sponge adsorbers in series (equipment l-C-2). Based on information from other projects, a removal efficiency of 90 to 98 percent is generally required for gas cleanup schemes. For this evaluation, a removal efficiency of 98 percent is used as design criteria for all cases considered.
Three sponge adsorbers are provided. One is in a regeneration mode or standby while the other two are operating in series in the main exhaust treatment train. After the leading sponge adsorber approaches saturation, it will be taken out of the main stream and connected to the regeneration train and the unit in standby will be placed on the main treatment train. After adequate experience develops with this process, one of the sponge adsorbers could possibly be eliminated, resulting in a smaller capital cost
To assure that exhaust is treated to the required level, sponge adsorbers are followed by a pair of vapor phase granular activated carbon (GAC) adsorbers (equipment l-C-3) using Calgon BPL carbon and operated in series. This is a conservative assumption.
Hot nitrogen is used for thermal regeneration of the spent sponge. Liquid nitrogen (99%+) stored on site and converted to a gaseous stream on site, as demanded by process requirements. The thermal regeneration train consists of a hot oil heater, a blower, a gas heater, the sponge adsorber in regeneration mode, a heat recovery exchanger, a two-stage chiller, and a phase separator. The flow rate of nitrogen is set using a design superficial velocity of 30 feet per minute, based on experience on a pilot-scale regenerable GAC system by Westates Carbon (1993). Based on this velocity, the design flow rate for the nitrogen circulation is 1,500 SCFM.
Evaluation of Organic Sponges for CVOC Abatement 3-2
m-26

Conceptual Designs for Exhaust Treatment Cases
The nitrogen gas is heated in the hot oil heater (equipment l-E-2) to a temperature of about 170°F, and after going through the blower (equipment l-K-2), is heated to a temperature of 248°F in a gas heater (equipment l-E-3) before it is introduced to the sponge adsorber. The gas then goes through the adsorber, heating the bed to desorption temperature and desorbing the CVOCs, in this case TCE, from the sorbent. The hot gases then go through the heat recovery exchanger (equipment l-E-4) to recover heat, using the hot oil loop, and condense part of the water and TCE. The gas is introduced to a chiller to condense the remaining water and TCE, using a two-stage chiller (equipment l-E-5). A two-stage chiller is chosen so as to minimize the freezing of water droplets in the chiller. Based on experience by Westates Carbon (1993) on their pilot scale system, a chiller temperature of -15°F is incorporated into the concept design.
The condensed water and TCE are then separated in the phase separator (equipment l-C-4). The non aqueous stream, containing primarily TCE, is sent to a storage tank (equipment l-D-2) and then to recycle or disposal. The saturated water is stored in an equalization tank (equipment 1-D-l) and periodically pumped through a set of two liquid phase GAC adsorbers (equipment l-C-5) in series to remove the contaminants to the required limits. The spent GAC is sent off-site for regeneration. For TCE, a treated groundwater concentration of 5 ppb is generally required.
Based on equilibrium calculations for nitrogen with the TCE-saturated sorbent at a temperature of 194°F (90°C isotherm is the highest temperature that GE/CRD has measured in the laboratory, see Appendix B), it would take approximately 7 hours to regenerate the spent sorbent Allowing a factor of three times the theoretical amount for regeneration and considering that it takes approximately 4 hours to heat up the bed to temperature, it is assumed that the regeneration would be completed in 25 hours for Case 1 A.
3.2.2 Case IB - Sponge Adsorption/Thermal Regeneration
As indicated above, Figure 3-1 presents a process flow diagram for Case IB, sponge adsorption using Ambersorb 563 (manufactured by Rohm and Haas) as sorbent, and thermal regeneration using hot nitrogen. Table 3-5 provides a material balance for this case. A major equipment list is presented in Table 3-6.
The process description is similar to that for Case 1A presented above. The major differences for Case IB as compared to Case 1A are as follows:
• The use of Ambersorb results in a higher pressure drop in the main AS exhaust treatment train as well as in the regeneration train. This requires a larger motor to replace the existing AS blower motor and a larger regeneration blower.
• A larger vessel with a diameter of 10 feet (rather than 8 feet as for Case 1 A) is provided to allow a lower bed depth of 2 feet (rather than 4 feet allowed for Case 1 A) to reduce pressure drop across the bed.
Q The regeneration gas heater for Case IB is designed to be smaller than that for Case 1A because of the higher energy provided to heat the gas by the larger regeneration blower.
Evaluation of Organic Sponges for CVOC Abatement 3-3
ra-27

Conceptual Designs for Exhaust Treatment Cases
Based on equilibrium calculations for nitrogen with the TCE-saturated sorbent at a temperature of 194°F (90°C isotherm is the highest temperature that GE/CRD has measured in the laboratory; see Appendix B), it would take approximately three days to regenerate the spent sorbent Allowing a factor of three times the theoretical amount for regeneration, it is assumed that regeneration would be conducted for a total of nine days for Case IB. Aside from the key differences summarized above. Case IB is otherwise similar to Case 1A, as described in Subsection 3.2.1
3.2.3 Case 1R • Granular Activated Carbon (GAC) Adsorption/Off-site Regeneration
Figure 3-2 presents a process flow diagram for Case 1R, GAC adsorption and off-site regeneration, to be used for baseline comparison. This figure also is common to Case 2R defined in Table 2-1. Table 3-7 provides a material balance for this case. A major equipment list is presented in Table 3-8.
Process Description
The use of vapor phase GAC for removal of CVOCs from air emissions from remediation facilities is a fully commercial technology. After the AS exhaust passes through a knock-out drum to remove free moisture and an air heater to lower the relative humidity below 50 percent, it is introduced to a set of vapor phase GAC adsorption units operated in series. The clean air is then sent to the stack.
As air is passed through the GAC bed, CVOCs are adsorbed onto the GAC until the leading bed reaches saturation. The spent GAC is subsequently transported to an approved reactivation facility. Spent GAC is then treated in a high temperature furnace where the CVOCs are destroyed.
The removal efficiency of CVOCs (and VOCs in general) is dependent on temperature, residence time, and relative humidity. For optimal performance (because water vapor will compete for carbon adsorption sites), the influent stream should have a temperature below 100°F (~40°C) and a low relative humidity between 40 and 50 percent
The equilibrium adsorption capacity for GAC BPL is approximately 15 percent by weight when the TCE concentration is 30 ppmv in air to be treated (see Table 3-2a). Assuming that we can reach 90 percent of the equilibrium capacity, about 5,000 lbs of spent GAC has to be replaced every 27 days.
3.3 CONCEPTUAL DESIGNS FOR HIGH TCE CONCENTRATION
The cases are to be designed for treatment of air exhaust from an existing air snipper facility with a groundwater flow rate of approximately 500 gpm and a TCE concentration of 66 ppm (by weight). The corresponding air flow rate is 2,000 SCFM, and thus the exhaust TCE concentration would be 400 ppmv.
Conceptual designs are developed for comparison of the processes using the two organic sponges at a TCE concentration of 400 ppmv in the air exhaust The first two concept designs, Cases 2A and 2B, use Dow and Ambersorb sponges, respectively. In both cases, thermal regeneration of spent sorbent is conducted using hot nitrogen. Case 2C incorporates the use of Dow sorbent and regeneration using hot water and biodegradation of water from regeneration. Case 2D incorporates the use of Dow sorbent and regeneration with steam and biodegradation of condensate obtained. For a baseline comparison, the use of GAC adsorption with off-site regeneration is evaluated as Case2R.
Evaluation of Organic Sponges for CVOC Abatement 3-4
111-28

Conceptual Designs for Exhaust Treatment Cases
3.3.1 Case 2A - Sponge Adsorption/Thermal Regeneration Figure 3-1 presents a process flow diagram for Case 2A, sponge adsorption using Dow XU as sorbent and thermal regeneration using hot nitrogen. This figure also is common to Cases 1A, IB, and 2B, defined in Table 2-1. Table 3-9 provides a material balance for this case. The major equipment list is common with that of Case 1A which was presented in Table 3-4.
Process Description
The AS exhaust with the TCE concentration of 400 ppmv provides the feed to the sponge adsorption system. The exhaust is first directed to a knock-out drum to remove any residual free moisture from the air stream. The air is then heated in an air heater to reduce the relative humidity of the exhaust air to below 50 percent This is accomplished by increasing the air temperature by about 20°F. The air is then directed to two sponge adsorbers in series. A removal efficiency of 90 to 98 percent is generally required for gas cleanup schemes from remediation facilities. For this evaluation, a removal efficiency of 98 percent is assumed to be required for all cases considered.
Case 2A would require similar equipment to that for Case 1 A. However, due to a higher TCE concentration in the air exhaust feed to the process, the sponge would require more frequent regeneration. The higher TCE concentration would result in a higher equilibrium TCE holdup on sponge, and upon more frequent regeneration, it would result in significantly higher TCE amounts recovered.
Based on equilibrium calculations for nitrogen with the TCE-saturated sorbent at a temperature of 194°F (90°C isotherm is the highest temperature that GE/CRD has measured in the laboratory; see Appendix B), it would take approximately 5.2 hours to regenerate the spent sorbent. Allowing a factor of three times the theoretical amount for regeneration and considering that it takes approximately 4 hours to heat up the bed to temperature, it is assumed that regeneration would be conducted for a total of 20 hours for Case 2A.
3.3.2 Case 2B - Sponge Adsorption/Thermal Regeneration
Figure 3-1 presents a process flow diagram for Case 2B, sponge adsorption using Ambersorb 563 (manufactured by Rohm and Haas) as sorbent and thermal regeneration using hot nitrogen. This figure also is common to Cases 1A, IB, and 2A, defined above. Table 3-10 provides a material balance for this case.
Process Description
Case 2B would require similar equipment to that for Case IB, presented in Table 3-6. However, due to higher TCE concentration in the air exhaust feed to the process, the sponge would require more frequent regeneration. The higher TCE concentration would result in a higher equilibrium TCE holdup on the sponge, and upon more frequent regeneration, it would result in significantly higher TCE amounts recovered.
Based on equilibrium calculations for nitrogen with the TCE saturated sorbent at a temperature of 194°F (90°C isotherm is the highest temperature that GE/CRD has measured in the laboratory, see Appendix B), it would take approximately 32 hours to regenerate the spent sorbent. Allowing a factor of three times the theoretical amount for regeneration and considering that it takes approximately 4 hours to heat up the bed to temperature, it is assumed that regeneration would require a total of 100 hours for Case 2B. Considering that one bed has to be regenerated every two days, Case 2B design would not be adequate to handle the higher TCE concentration in the feed
Evaluation of Organic Sponges for CVOC Abatement 3-5
m-29

Conceptual Designs for Exhaust Treatment Cases
air. Because Ambersorb has a similar adsorption capacity to that of Dow XU for the higher TCE concentration case, Case 2B has been dropped from further consideration.
3.3.3 Case 2C - Sponge Adsorption/Regeneration Using Hot Water and Biodegradation
Figure 3-3 presents a process flow diagram for Case 2C, sponge adsorption using Dow XU as sorbent and regeneration using hot water and biodegradation of water containing TCE with the Envirex biodegradation system. Table 3-11 provides a material balance for this case. A major equipment list is presented in Table 3-12.
Process Description
Case 2C is similar to Case 2A except for the regeneration scheme used. Water is heated in a water heater (equipment 2C-F-1) to a temperature of 194°F (90°C) and is passed over the spent sponge saturated with TCE. Water containing TCE is then cooled in a hot water cooler (equipment 2C-E-2) and stored in an equalization tank (equipment 2C-D-1) to provide a uniform feed to the Envirex Biodegradation system. The Envirex biodegradation system consists of an 18-foot-diameter reactor with a fluidized GAC bed depth of 14 feet, a pressure swing adsorption system for generation of 90 to 95 percent pure oxygen for oxidation of the organics, and a bubble contactor to mix oxygen with the feed water. Phenol is used as a cometabolizer substrate for bacteria in the biodegradation reactor and caustic is added to control pH. Nutrient is added to enhance the biodegradation of CVOCs. The data for performance of the biodegradation system are provided by Envirex and are presented in Appendix D (as Envirex Option 7).
GE/CRD has provided Bechtel with laboratory test results on adsorption isotherm for TCE with Dow XU sorbent in hot water at a temperature of 194°F. At equilibrium with saturated sorbent, the concentration of TCE in hot water (at 194°F) is 55 ppm (by weight). To desorb the TCE adsorbed on the sponge, a stream of 600 gpm of water would be required around the clock. The Envirex system would take this 600 gpm stream of water and process it through the fluidized bed reactor. Based on the high volume water stream required to be treated, the equipment cost for the biodegradation system was estimated by Envirex to be $1,250,000 (see Appendix D, Option 7). Due to the high cost of processing the water produced, Case 2C has been dropped from further consideration.
3.3.4 Case 2D - Sponge Adsorption/Regeneration Using Steam and Biodegradation
Figure 3-4 presents a process flow diagram for Case 2D, sponge adsorption using Dow XU as sorbent and regeneration using steam and biodegradation of condensate saturated with TCE by the Envirex biodegradation system. Table 3-13 provides a material balance for this case. A major equipment list is presented in Table 3-14.
Process Description
Case 2D is similar to Case 2C except for the regeneration scheme used. Steam (rather than hot water, as in Case 2C) is passed over the spent sponge saturated with TCE. Steam/condensate containing TCE is then cooled in a condenser, and further processed in a phase separator to separate condensed steam from relatively pure TCE. The condensed TCE is separated, stored and sent to a recycler or to disposal. The TCE-saturated water is then processed through the Envirex biodegradation system. For Case 2D, the Envirex biodegradation system consists of an 8-foot-diameter reactor with a fluidized GAC bed depth of 14 feet, a pressure swing adsorption system
Evaluation of Organic Sponges for CVOC Abatement 3-6
111-30

Conceptual Designs for Exhaust Treatment Cases
for generation of 90 to 95 percent pure oxygen for oxidation of the organics, and a bubble contactor to mix oxygen with the feedwater. As in Case 2C, phenol is used as food for bacteria in the biodegradation reactor, and caustic is added to control the pH. Nutrient is added to enhance the biodegradation of CVOCs. The data for performance of the biodegradation system are provided by Envirex and are presented in Appendix D (as Envirex Option 5).
Based on data available in literature (see Appendix B), the steam regeneration of sponge is expected to use one bed volume of steam per hour for 20 hours. Steam use corresponds to 6,250 lbs/hr. To desorb the TCE adsorbed on the sponge, a stream of 5.2 gprn of condensate would need to be treated around the clock. The Envirex system would take this 5.2 gpm stream of water and process it through the fluidized bed reactor. Based on the low volume stream of water that is to be treated, the cost for the biodegradation system was estimated by Envirex to be $450,000. This cost appears to be more reasonable than that for Case 2C, and thus Case 2D was selected for further evaluation.
3.3.5 Case 2R - GAC Adsorption/Off-site Regeneration
Figure 3-2 presents a process flow diagram for Case 2R, GAC adsorption and off-site regeneration, to be used for baseline comparison. This figure also is common to the previously described Case 1R. Table 3-15 provides a material balance for this case. A major equipment list is presented in Table 3-16.
Case 2R is designed to treat an air stream containing a TCE concentration of 400 ppmv rather than 30 ppmv for Case 1R The higher TCE concentration results in a much more frequent GAC saturation and replacement requirement The major difference in equipment provided for Case 2R, as compared to Case 1R, is that an additional GAC adsorption vessel is included to provide adequate time between regeneration cycles. This makes it possible for spent GAC from two vessels to be simultaneously sent off-site for regeneration.
The equilibrium adsorption capacity for GAC BPL is approximately 30 percent by weight when the TCE concentration is 400 ppmv in air to be treated (see Table 3-2a). Assuming that we can reach 90 percent of the equilibrium capacity, about 12,000 lbs of spent GAC has to be replaced every 8.1 days.
3.4 IDENTIFICATION OF COMPETING TECHNOLOGIES
Technologies that are either commercially available today, or are claimed to be available for treatment of CVOCs from AS or soil vapor extraction system exhaust or similar gas streams from process industries, include the following:
• Vapor phase GAC adsorption and off-site regeneration of spent GAC (Cases 1R and 2R)
• Vapor phase GAC adsorption and steam regeneration of spent GAC on-site
• Catalytic oxidation followed by acid gas scrubbing
• Thermal oxidation followed by acid scrubbing
• PureCycle resin adsorption process developed by Purus, Inc.
Evaluation of Organic Sponges for CVOC Abatement 3-7
IU-31

Conceptual Designs for Exhaust Treatment Cases
Vapor phase GAC adsorption and off-site regeneration has been the most common approach for abatement of CVOCs from AS or soil vapor extraction system exhausts. Because of their broad applicability to a wide variety of VOC emission streams, GAC adsorption, thermal and catalytic oxidizers followed by possible acid gas scrubbing, and PureCycle resin adsorption have been considered more frequently.
In addition to the above technologies, flares, absorbers, boilers/process heaters, membrane separators, ultraviolet oxidizers, Corona destruction reactors, and plasma technology devices are among the VOC abatement technologies that have been considered for various applications (Moretti and Mukhopadhyay, 1993). Carbon wheel concentrators combined with steam regeneration have also been developed for the recovery of CVOCs for industrial applications (Kenson, 1993).
Nucon International, Inc. (1993) has also developed a GAC adsorption system combined with a regeneration technique called the Braysorb process. This process uses an inert gas in combination with a Brayton cycle heat pump that offers potential for energy savings and reduction in operating costs. This process has been applied to pharmaceutical and other industrial applications.
GAC adsorption and steam regeneration of spent GAC for the abatement of CVOCs would result in the generation of acid gases, which can complicate the regeneration process. The life of GAC upon frequent regeneration is also of concern. Because oxidation of CVOCs generates hydrochloric acid (HC1), thermal and catalytic oxidation processes would generally have to use an acid gas scrubbing unit to control HC1 emissions. Because of the presence of acid gases, heat recovery from the exhaust is usually costly and requires expensive heat exchangers. Smaller thermal or catalytic oxidation devices have avoided the use of heat recovery to minimize costly heat exchanger equipment
The PureCycle resin adsorption system operates on a principle similar to that of the sponge adsorption system described in mis report. The process involves a minimum of two filter beds which alternate between an adsorption and desorption cycle and use their proprietary resins, which are similar to those considered in this evaluation. The primary differences that the PureCycle system offers with respect to the sponge adsorption process are described below.
The PureCycle system uses a proprietary aerodynamic approach for feeding the influent air stream and discharge of effluent which uses the concept of stacking the adsorption resin beds in a chamber and provides reduced pressure drop. Purus also uses in-bed heating with finned electrical heaters and cooling with Dowtherm fluid to rapidly heat and cool the relatively small resin beds used for treatment of the gases. The rapid heating and cooling allows the use of a smaller mass of sorbent in the process, and thus match the regeneration cycle better with the adsorption cycle. By operating the resin beds under vacuum, a smaller stream of inert nitrogen gas is allowed to work as a carrier gas. The smaller nitrogen gas flow required results in a smaller design flow rate for the regeneration scheme and thus a potentially less expensive regeneration system.
The major disadvantage for the Purus system is that the in-bed heaters may heat up beyond the temperature the resin can tolerate and thus deactivate the resin permanently. Uniform heating of the resin bed would also be a problem. Operation of the regeneration train under vacuum would also result in a relatively more expensive regeneration process train and higher O&M costs.
Evaluation of Organic Sponges for CVOC Abatement 3-8
111-32

Table 3-1 Adsorber Design Parameters (a)
Bulk Pres. Drop O Bed Height Tot. Pres. Tot. Pies. Diameter Cross Sectional Volume of Mass of Sorbent Density Design Row Rate (ft) Drop Drop (ft) Area Sorbent Used SorbentUsed
(Ib/ft3) (Inches of H20) (Inches of H2Q) (psi) (ft2) (ft3) (lbs, rounded)
DOW XU 43502.01 25.0 4.5 4 18 0.65 8 50 200 5,000 Ambersorb563 33.1 26 2 52 1.88 10 78.5 157 5,000
Carbon BPL 4x6 30.0 1.2 4 4.8 0.17 8 50 200 6,000
(a) Based on a gas flow rate of 2,000 SCFM and an average feed TCE concentration of 400 ppmv (see Table 3-2).
Calc. Mass of Sorbent

Table 3-2a TCE and Water Vapor Adsorbed on Sorbent at Equilibrium
TCE Cone. = 30 ppmv (86°F, 50% Relative Humidity)
Adsorption Capacity Mass of TCE Adsorbed Water Vapor Water Vapor Sorbent @ 30 ppmv TCE (a) Sorbent at Equilib. on Sorbent on Sorbent
(Wt%) (lb) (lb) (Wt%) (lb)
Dow XUS 43502.01 5 5,000 250 2 100 Ambersorb563 14.5 5,000 725 2 100 GACBPL4x6 15 6,000 900 12 720
(a) Based on isotherm data from GE/CRD, see Appendix B
Table 3-2b TCE and Water Vapor Adsorbed on Sorbent at Equilibrium
TCE Cone. = 400 ppmv (86°F, 50% Relative Humidity)
Adsorption Capacity Mass of TCE Adsorbed Water Vapor Water Vapor Sorbent @ 400 ppmv TCE (a) Sorbent at Equilibrium on Sorbent on Sorbent
(Wt%) (lb) (lb) (Wt%) (lb)
Dow XUS 43502.01 25 5,000 1,250 2 100 Ambersorb563 26 5,000 1,300 2 100 GACBPL4x6 30 6,000 1,800 12 720
(a) Based on isotherm data from GE/CRD, see Appendix B
Calc. VOC Adsorbed 2/14/94 5:07 PM

Table 3-3 Material Balance
Air Stripper Exhaust Treated by Sponge Adsorption System/Thermal Regeneration Case 1A: Sorbent: Dow XU43502.01; Air Stripper Exhaust TCE Concentration = 30 ppmv
Stream No. 1 2 3 4 4a . 5 6 Description Ground
Water Treated Water
Air Fed to Air Stripper
Air Strippar Exhaust
Preheated Air to Sponge Adsorbers
Treated Air from Sponge Adsorbers
Treated Air to Stack
Ground Water opm 500 500
Air/CVOCs/Nitrogen SCFM 2000 2000.06 2000.06 2000.00 2000.00 Air Relative Humidity, % 100 50 50 50
Water Vapor/Condensate, Ib/dav/rogeneratton
CVOC* ppm.wt 5 0.0025 ppm, vol. 30 30 < 0.6 < 0.01 Ib/hr 1.25 0.00 1.25 1.25 lb/day 30.02 0.02 30.00 30.00 < 0.6 < 0.01 lb-moles/day 0.23 0.00
SCFM 0.06 0.06
Temperature, °F 60 80 80 80 Pressure, pela 17.4 17 15.4 14.8
Stream No. 7 8 9 10 11 12 13 14 15 Description Nitrogen feed
to Hot Oil Heater Nitrogen to
Blower Heated Nitrogen NHrogen/CVOCs to Nitrogen/CVOCs
to Sponge Adsorber Exchanger to Chiller NItrogen/CVOCs
to Separator CVOCsto
Recycle/Dlsp. Sat'd Water to Equaflz. Tank
Treated Cond. to Disposal
Ground Water gpm
Alr/CVOCs/Nitrogen _ _ ^ Regeneration conducted every six days (For a total of 25 hours)
SCFM i soo". -}j»:<-< isopx>- •-.-:'.,., isoo ,..!.-,.rM:..isoofas,J ;, .,;,<goo.ag.'- 1S00.35 Air Relative Humidity. % ,-,\; hA^m^t^ilj^i^^A >:.......
Water Vapor/Condensate, ? « w w T^trt too " . '-"/:' t00' 100 too 100
Ib/day/regeneratlon < . . ; « . , . . . . . . „ , , > , . , , CVOCs ^^ryfy,^-^-;-^'^'^.^-;^; (*n4^*K j i * in .«».«v ' "w ^ • i .p .n i . i t f . i . . . . . I .
ppm, wt m>.;, 1100 0,0025 ppm, vol. :..f-<^^;. o., !"-,-.-,; g 30 .,•-,; ,y Ib/hr •4—A-
( . . . . • ; • ; • • : ; . , : , % .y .............y..^..^-...,.
lb/day *< i - y - . -: "-:^u^:'-:?'-''N'i73=''K 173 ' . 173 173 lb-mole s/day ^ ± ; V b h ^f,>,i:,-,,;,:^.a;- r t;i^,,a,?,i iL JJLUL
SCFM 0.36 S2J>AS 0.35 ' t ? ; : " " - > • , • / , . 4 , •!•'•!.'.;,',• s. .,' r^r^r^^m^r):^^, Temperature, *F ,:y visv:-^.. •• vi70vj.^:.;'-:;:r248 - .'.r:,.:, ':aia 40 -1S
Pressure, p»l« ^ - ^ . a u . - - --14.7-.- 18.3: ^-v..,- ' 15.5 Ama^x 15,1
W
MB.AS/Ttwrm.CM« 1A 2/28/M 8:11 PM

Table 3-4 Air Stripper Exhaust Treated by Sponge Adsorption System/Thermal Regeneration
Cases 1A & 2A: Sorbent: Dow XU, Air Stripper Exhaust TCE Concentration = 30 or 400 ppmv Major Equipment List
Serial Equipment Title Qty. Description Motor Motor No. I. D. No. kW-ea. kW
Total
1 1A-C-1 Knock-out Drum 1 Volume: 430 ft3 (12.3 m3) Construction: Carbon Steel, Epoxy Lined (40 mills thickness for all epoxy lined vessels) Shape: Cylindrical Diameter 6.5 ft (2 m) Length: 13 ft (4 m) Residence Time = 10 seconds Weight 2.6 tons (5/16 inch thick)
0.0 0.0
2 1A-C-2 Sponge Adsorbers 3' Volume: 400 ft3 (11.3 m3) Construction: Carbon Steel, Epoxy Lined Shape: Cylindrical Diameter 8 ft (2.4 m) Length: 8 ft (2.4 m) Empty Bed Contact Time = 6 seconds Weight 2.3 tons (5/16 inch thick) Organic Sponge: Dow XU43502.01, 5,000 lb
0.0 0.0
3 1A-C-3 GAC Adsorbers 2 Volume: 400 ft3 (11.3 m3) Construction: Carbon Steel, Epoxy Lined Shape: Cylindrical Diameter 8 ft (2.4 m) Length: 8 ft (2.4 m) Empty Bed Contact Time = 6 seconds Weight 2.3 tons (5/16 inch thick) GAC: BPL 4X6, 6,000 lb
0.0 0.0
4 1A-C4 Phase Separator 1 Volume: 330 ft3 (9.4 m3) Construction: Carbon Steel, Epoxy Lined Shape: Cylindrical Diameter: 6 ft (1.8 m) Length: 12 ft (3.6 m) Residence Time = 10 seconds Weight 2.6 tons (5/16 inch thick) Insulated
0.0 0.0
5 1A-C-5 Liquid Phase GAC Adsorbers 2 Calgon 350 Gallon Disposorb or Equivalent Capacity: 5 to 15 gpm EBCT: 20 minutes GAC: 1,000 lb of RItrasorb 300 or Equivalent Polyethylene Canisters
0.0 0.0
6 1A-D-1 Equalization Tank 1 Volume: 16 ft3 (120 gal., 0.45 m3) Construction: Carbon Steel, Epoxy Lined Shape: Cylindrical Diameter 2.4 ft (0.72 m) Length: 4 ft (1.1 m) Weight 0.3 tons (5/16 inch thick)
0.0 0.0
7 1A-D-2 CVOC Storage 1 Volume: 7 ft3 (0.2 m3) Construction: Polyethylene Shape: Cylindrical
0.0 0.0
C«so1A42A-Eq.Lt$t 1208 PM 3/23/94 1of3 111-36

Table 3-4 Air Stripper Exhaust Treated by Sponge Adsorption System/Thermal Regeneration
Cases 1A & 2A: Sorbent: Dow XU, Air Stripper Exhaust TCE Concentration = 30 or 400 ppmv Major Equipment List
Serial No.
Equipment I. 0. No.
Title Qty. Description Motor kW-ea.
Motor kW
Total
8 1A-D-3 Hot Oil Storage 1 Volume: 13 ft3 (100 gal., 0.38 m3) Construction: Carbon Steel, Epoxy Lined Shape: Cylindrical Diameter 2.2 ft (0.68 m) Length: 3.4 ft (1 m) Residence Time = 10 minutes Weight 0.24 tons (5/16 inch thick) Insulated
0.0 0.0
9 1A-E-1 Air Heater 1 Capacity: 2000 SCFM Heat Source: Electricity Heat Provided: 44,000 Btu/hr Electricity Required: 16 kW Material: Stainless Steel 304L (housing) Elements: Indoy 800
16.0 16.0
10 1A-E-2 Hot Oil Heater 1 Type: Finned tube exchanger Tube Side Fluid; 50% Ethylene Glycol/Water Duty: 0.31 MM Btu/hr (0.33 MM J/hr) Area: 1000 ft2 (90 m2) Material: Stainless Steel 304L for housing & drain tubes are copper & fins are aluminum
0.0
pan.
0.0
11 1A-E-3 Regeneration Gas Heater 1 Capacity: 1500 SCFM Heat Source: Electricity Heat Provided: 96,000 Btu/hr Electricity Required: 34 kW Material: Stainless Steel 304L (housing) Elements: Indoy 800
34.0 34.0
12 1A-E-4 Heat Recovery Exchanger 1 Type: Finned Tube Exchanger Tube Side Fluid: 50% Ethylene Glycol/Water Duty: 0.35 MM Btu/hr (0.37 MM J/hr) Area: 1450 ft2 (135 m2) Material: Stainless Steel 304L for housing & drain tubes are copper & fins are aluminum
0.0
pan,
0.0
13 1A-E-5 Chiller 1 Type: Finned Tube Exchanger Tube Side Fluid: Freon (Chlorodffluoromethane, Refrigerant 22) Duty: 0.14 MM Btu/hr (0.15 MM J/hr) Area: 320 ft2 (30 m2) Material: Stainless Steel 304L for housing & drain tubes are copper & fins are aluminum
0.0
pan,
0.0
14 Refrigeration Package 1 Type: Direct Expansion, Using Freon (R22) Duty: 0.14 MM Btumr (0.15 MM J/hr) Compressor Power Required
Brake kW: 45 (60 HP) Motor kW: 52 (70 HP)
52.0 52.0
C«MlA&2A-Eq.Ust 12:08 PM 3/23/94 2 of 3 111-37

Table 3-4 Air Stripper Exhaust Treated by Sponge Adsorption System/Thermal Regeneration
Cases 1A & 2A: Sorbent: Dow XU, Air Stripper Exhaust TCE Concentration = 30 or 400 ppmv Major Equipment List
Serial No.
Equipment I. D. No.
Title Qty. Description Motor kW-ea.
Motor kW
Total
15
16
17
18
1A-G-1
1A-G-2
1A-K-2
Hot Oil Pump
Condensate Pump
Modification to Existing Rotary
Positive AS Blower (From 10 HP to 50 HP Motor)
Regeneration Blower
2
1
1
1
Type: Centrifugal Pump Liquid Pumped: 50% Ethylene Glycol Flow: 10 gpm (2.3 m3/hr) Specific Gravity: 1.1 Brake kW: 0.08 kW (0.11 HP) Motor kW: 0.19 (055 HP)
Type: Centrifugal Pump Liquid Pumped: Condensate Safd with TCE Row: 5 gpm (1.1 m3/hr) Specific Gravity: 1 Brake kW: 0.03 kW (0.04 HP) Motor kW: 0.19 {025 HP)
A New Motor Installed Flow: 2,000 SCFM (3,400 m3/hr) Flow: 2,031 ACFM (3,450 m3/hr) Feed Pressure: 14.7 Psia Discharge Pressure: 17.9 Psia Brake kW: 28 (38 HP) Motor kW: 37.3 (50 HP)
Type: Rotary Positive Blower Flow: 1,500 SCFM (2,500 m3/hr) Flow: 1,800 ACFM (3,000 m3/hr) Feed Pressure: 14.7 Psia Discharge Pressure: 16.5 Psia Brake kW: 14.6 (19.5 HP) Motor kW: 18.6 (25 HP) Construction: Fiber glass (Housing & Blades)
02
02
37.3
18.6
0.4
02
37.3
18.6
Total Installed Motor kW 158
Normal Operation (excluding regeneration). Power ReqU kW (a)
Regeneration Cycle, Power Required, kW
41
101
(a) Includes a credit of 5.6 kW (Brake) for the existing AS blower power requirement
CaMlA&2A-£q.Lki 12:06 PM 3/23/94 3 of 3 m-38 3-14

g
Table 3-5 Material Balance
Air Stripper Exhaust Treated by Sponge Adsorption System/Thermal Regeneration Case IB; Sorbant: Ambersorb 563; Air Stripper Exhaust TCE Concentration = 30 ppmv
Stream No. 1 2 3 4 4a 5 6 Description Ground
Water Treated Water
Air Fed to Air Stripper
Air Stripper Exhaust
Preheated Air to Sponge Adsorbers
Treated Air from Sponge Adsorbers
Treated Air to Stack
Ground Water fjpm 500 500
Alr/CVOCs/Nitrogen SCFM 2000 2000.06 2000.06 2000.00 2000.00 Air Relative Humidity, % 100.00 50.00 50.00 50.00
Water Vapor/Condenaate. Ib/day/regeneration
CVOCe ppm, wt 5 0.0025 ppm, vol. 30 30 < 0.6 <0.01 Mir 1.2S 0.00 1.25 1.25 lb/day 30.02 0.02 30.00 30.00 < 0.6 < 0.01 lb-mole a/day 0.23 0.00
SCFM 0.06 0.06
Temperature, 'F 60 80 80 80 Praaaure, paia 10.6 19.4 15.4 14.8
Stream No. 7 a 9 10 11 12 13 14 15 Description Nitrogen feed
to Hot Oil Heater Nitrogen to
Blower Heated Nitrogen NItrogen/CVOCa to NItrogen/CVOCa
to Sponge Adsorber Exchanger to Chiller NItrogen/CVOCa
to Separator CVOCs to
Recycle/Olsp. Sat'd Water to Equaliz. Tank
Treated Cond. to Disposal
Ground Water apm
Regeneration conducted every 19 days (For a total of Hftlays) Alr/CVOCa/Nltrogen ; ^ V v , 4 ^ ^ , ;<;•- iV(A-. •* '"';r'.*^!»-:i-vi>#>>*>^rV ''••-•;-"''* !;•;'.«/M-~ H\. ;•«*•• • , A - v '<• SCFM ^ I S O O ^ Y V » , | M 0 Y •« ^ ;v 'v i , 1 soo <^^ «-•;.. A ; tsoM'tu-'v ' . ' 1800.38'^<'>V;.1500.00 • ' Air Relative Humidity, % AW v-Ik*.;•..•• v - f W , - •>•"'.!*',."». , \M'!<i''M :,','"-, '.»•"'* ; v , V , ,- •.'.•;--<<f,f >'• ,V<;> •< •• .
Water Vapor/Condenaate, ':':'•>?••:::.:...'."'*»*i. '. ' / - - ' i o o ^ ••;>.. ...""•jr-'tbb1.',-;.;., '-'*••'•, 1.00 •' 100 100 Ib/day/regeneratlon '•^.f T^-«i;.?f,:, v:.,v.. . 1 , " •'-•^v„v.;.••'•;;^' ; ••<• •-
CVOCs ;v^L:....'i^....'.:'•'?!:;<:» <'.- , !"V ; \v, : ' , ' , ' \ '"••"«'c*. i v., i . : . , / ,';>-":>•;•'•• v'A •! . . .; .•.•..'• •/••<•>••. . " '« ppm, wt '•''.''!•'•'' • > •**•• '• ;•'>\v,. , „~j;5-s"^'- * " ' • " ' < ' ' ' ' • • ' : ; • • ; ' . * " ' '."' > - • " ' 1100 0.0026 ppm, vol. ••••%>,''.\ " • ! ' . . . " - . . - ; - - ' < < • > • • • < • •' M M ' ^ ^ ' V ' , ' ' -r ' .&«-. '^880-"' ' :"••<:••• v. , ''•••: fi.i;^'- . - / . , • fc/hr •?•-•;i..l-*.:. v > ' - , :---;•!• ^/aev.^-,,, " . ^ w . ."::,•-<'";:-• '3a " , <• ' lb/day \ * A '.•'••• ' ; ; • . ' , ' ' > . : • - , ' • • > * . " V —*•.*•?.. ' •; ' • ' ..:.•-;• J » 7 " . - •',.•'.•• 187 187 b-molea/day '*V>Y;V:>V< > ,,. -'•.>•'•»:. . . . ^ v ' , r - * v - * . •«,•*«. '-"" •••<-r:,iiJ^"»^'"-<^J;-iM"/' ' .
SCFM y - . e - Y . " . . , ' ^ . . - - •::•;• ;.c^.--. *••> v-•"'!->'' < \-.''"V.,OM » ••' •';-'-"'o»30->-<vt';>. ^ ' : : > ' , w « .\.,-^'->'-:.:^.-r •••:•. • ••'/!'''•••'••';•> l'\'. -{i'iVv- t, <,-/.'-V«v" s' • • .. . ' ; ' >-y-':>-"!-V '-."'. •.*?'*'''''• ••••
Temperature, "F T.\»W^w no'. ->•..>:> «4s;=v.;;..j•'•„; ''••«a.v?;.r-; '.:'.'.-. ! -v40 "<"*'•< >•'.' ' *1S Pressure, psta • ; 1 4 . 9 . >^' 14.7 : •..••• ' 1 W . ' . > " - - f 5 . 5 ^ / • i "«>1* t»Hiv / ; ' ' - 15.1
MB.AS/Th«rm.CaM IB 2/28/04 6:49 PM

Table 3-6 Air Stripper Exhaust Treated by Sponge Adsorption System/Thermal Regeneration
Case 1B: Sorbent: Ambersorb 563, Air Stripper Exhaust TCE Concentration = 30 ppmv Major Equipment List
Serial Equipment Title 0.ty. Description Motor Motor No. I. D. No. kW-ea. kW
Total
1 1B-C-1 Knock-out Drum 1 Volume: 430 ft3 (12.3 m3) Construction: Carbon Steel, Epoxy Lined (40 mills thickness for all epoxy lined vessels) Shape: Cylindrical Diameter: 6.5 ft (2 m) Length: 13 ft (4 m) Residence Time = 10 seconds Weight: 2.6 tons (5/16 inch thick)
0.0 0.0
2 1B-C-2 Sponge Adsorbers 3 Volume: 470 ft3 (14.1 m3) Construction: Carbon Steel, Epoxy Lined Shape: Cylindrical Diameter: 10 ft (3.1 m) Length: 6 ft (1.8 m) Empty Bed Contact Time = 5 seconds Weight 2.7 tons (5/16 inch thick) Organic Sponge: Ambersorb 563,5,000 lb
0.0 0.0
3 1B-C-3 GAC Adsorbers 2 Volume: 400 ft3 (11.3 m3) Construction: Carbon Steel, Epoxy Lined Shape: Cylindrical Diameter: 8 ft (2.4 m) Length: 8 ft (2.4 m) Empty Bed Contact Time = 6 seconds Weight 2.3 tons (5/16 inch thick) GAC: BPL 4X6,6,000 lb
0.0 0.0
4 1B-C-4 Phase Separator 1 Volume: 330 fB (9.4 m3) Construction: Carbon Steel, Epoxy Lined Shape: Cylindrical Diameter: 6 ft (1.8 m) Length: 12 ft (3.6 m) Residence Time = 10 seconds Weight 2.6 tons (5/16 inch thick) Insulated
0.0 0.0
5 1B-C-5 Liquid Phase GAC Adsorbers 2 Calgon 350 Gallon Disposorb or Equivalent Capacity: 5to15gpm EBCT: 20 minutes GAC: 1,000 lb of Filtrasorb 300 or Equivalent Polyethylene Canisters
0.0 0.0
6 1B-D-1 Equalization Tank 1 Volume: 16 ft3 (120 gal., 0.45 m3) Construction: Carbon Steel, Epoxy Lined Shape: Cylindrical Diameter: 2.4 ft (0.72 m) Length: 4 ft (1.1m) Weight 0.3 tons (5/16 inch thick)
0.0 0.0
7 1B-D-2 CVOC Storage 1 Volume: 7 ft3 (0.2 m3) Construction: Polyethylene Shape: Cylindrical
0.0 0.0
C«e1B-Eq.Lfct 12:07 PM 3/23/94 1of3 m-40 3-10

Table 3-6 Air Stripper Exhaust Treated by Sponge Adsorption System/Thermal Regeneration
Case 1B: Sorbent: Ambersorb 563, Air Stripper Exhaust TCE Concentration = 30 ppmv Major Equipment List
Serial No.
Equipment I. D. No.
Title Qty. Description Motor kW-ea.
Motor kW
Total
e 1A-D-3 Hot Oil Storage 1 Volume: 13 ft3 (100 gal., 0.38 m3) Construction: Carbon Steel, Epoxy Lined Shape: Cylindrical Diameter: 22 ft (0.68 m) Length: 3.4 ft (1m) Residence Time = 10 minutes Weight- 0.24 tons (5/16 inch thick) Insulated
0.0 0.0
9 1B-E-1 Air Heater 1 Capacity: 2000 SCFM Heat Source: Electricity Heat Provided: 44,000 Btu/hr Electricity Required: 16kW Material: Stainless Steel 3041 (housing) Elements: Inctoy 800
16.0 16.0
10 1B-E-2 Hot Oil Heater 1 Type: Finned tube exchanger 0.0 Tube Side Fluid: 50% Ethylene Glycol/Water Duty: 0.31 MM Btu/hr (0.33 MM J/hr) Area: 1000 ft2 (90 m2) Material: Stainless Steel 304L for housing & drain pan, tubes are copper & fins are aluminum
0.0
11 1B-E-3 Regeneration Gas Heater 1 Capacity: 1500 SCFM Heat Source: Electricity Heat Provided: 73,000 BbVhr Electricity Required: 26 kW Material: Stainless Steel 304L (housing) Elements: Inctoy 800
26.0 26.0
12 1B-E-4 , Heat Recovery Exchanger 1 Type: Firmed Tube Exchanger Tube Side Fluid: 50% Ethylene Glycol/Water Duty: 0.35 MM Btu/hr (0.37 MM J/hr) Area: 1450 ft2 (135 m2) Material: Stainless Steel 304L for housing & drain tubes are copper, & fins are aluminum
0.0
pan.
0.0
13 1B-E-5 Chiller 1 Type: Finned Tube Exchanger Tube Side Fluid: Freon (Chlorodifluoromethane, Refrigerant 22) Duty: 0.14 MM Btu/hr (0.15 MM J/hr) Area: 320 ft2 (30 m2) Material: Stainless Steel 304L for housing & drain tubes are copper & fins are aluminum
0.0
pan,
0.0
14 Refrigeration Package 1 Type: Direct Expansion, Using Freon (R22) Duty: 0.14 MM Btu/hr (0.15 MM J/hr) Compressor Power Required
Brake kW: 45 (60 HP) Motor kW: 52 (70 HP)
52.0 52.0
15 1B-G-1 Hot Oil Pump 2 Type: Centrifugal Pump Liquid Pumped: 50% Ethylene Glycol Flow: 10 gpm (2.3 m3/hr) Specific Gravity: 1.1 Brake kW: 0.08 kW (0.11 HP) Motor kW: 0.19 (0.25 HP)
02 0.4
CaMlB-Eq.Utt 1207PM 3/23/94 2of 3 111-41

Table 3-6 Air Stripper Exhaust Treated by Sponge Adsorption System/Thermal Regeneration
Case 1B: Sorbent: Ambersorb 563, Air Stripper Exhaust TCE Concentration = 30 ppmv Major Equipment List
Serial No.
Equipment I. D. No.
Title. Qty. Description Motor kW-ja.
Motor kW
Total
16
17
18
1B-G-2
1B-K-2
Condensate Pump
Modification to Existing Rotary Positive AS Blower (from 10 HP to 75 HP)
Regeneration Blower
1
1
1
Type: Centrifugal Pump Liquid Pumped: Condensate Safd with TCE Row: 5gpm (1.1 m3/hr) Specific Gravity: 1 Brake kW: 0.03 kW (0.04 HP) Motor kW: 0.19 (0.25 HP)
A New Motor Installed Flow: 2,000 SCFM (3,400 m3/hr) Row: 2,031 ACFM (3,450 m3/hr) Feed Pressure: 14.7 Psia Discharge Pressure: 20.3 Psia Brake kW: 46.9 (62.9 HP) Motor kW: 55.9 (75 HP)
Type: Rotary Positive Blower Flow: 1500 SCFM (2,500 m3/hr) Flow: 1,800 ACFM (3,000 m3/hr) Feed Pressure: 14.7 Psia Discharge Pressure: 17.7 Psia Brake kW: 23.7 (31.7 HP) Motor kW: 29.8 (40 HP) Construction: Fiber glass (Housing &• Blades)
0.2
55.9
29.8
0.2
55.9
29.8
Total Installed Motor kW 180
Normal Operation (excluding regeneration), Power Recfd, kW (a)
Regeneration Cycle, Power Required, kW
62
102
(a) Includes a cradit of 5.6 kW (Brake) for the existing AS blower power requirement
CaMl&£q.Utt 1207 PM 3/23/94 3o<3 ffl-42 3-18

Table 3-7
!
Material Balance Air Stripper Exhaust Treated by GAC Adsorption System/ Off-Site Regeneration
Case 1R: Sorbent: GAC BPL; Air Stripper Exhaust TCE Concentration = 30 ppmv (a) Stream No. 1 2 . 3 4 5 6 Description Ground
Water Treated Water
Air Fed to Air Stripper
Air Stripper Exhaust
Preheated Air to Sponge Adsorbers
Treated Air to Stack
Ground Water gpm 500 500
Air/CVOCs/Nitrogen SCFM 2000 2000.06 2000.06 2000.00 Air Relative Humidity, % 100.00 50.00 50.00
CVOCs ppm, wt 5 0.0025 ppm, vol. 30 30 < 0.6 Ib/hr 1.25 0.00 1.25 1.25 lb/day 30.02 0.02 30.00 30.00 < 0.6 Ib-moles/day 0.23 0.00
SCFM 0.06 0.06
Temperature, °F 60 80 80 Pressure, psia 15.8 15.4 14.8
(a) One of the spent GAC beds are regenerated every 27 days
vo MB.AS/GAC Case 1R 2/28/94 5:34 PM

Table 3-8 Air Stripper Exhaust Treated by GAC Adsorption System/Off-Site Regeneration
Cases 1R: Sorbent: GAC BPL, Air Stripper Exhaust TCE Concentration = 30 ppmv Major Equipment List
Serial No.
Equipment I. D. No.
Title Qty. Description Motor kW-ea.
Motor kW
Total
1
2
3
4
1R-C-1
1R-C-2
1R-E-1
Knock-out Drum
GAC Adsorbers
Air Heater
Modification to Exisiting Rotary Positive AS Blower (From 10 HP to 25 HP)
1
2
1
1
Volume: 430 ft3 (12.3 m3) Construction: Carbon Steel, Epoxy Lined (40 mills thickness for all epoxy lined vessels) Shape: Cylindrical Diameter: 6.5 ft (2 m) Length: 13 ft (4 m) Residence Time = 10 seconds Weight 2.6 tons (5/16 inch thick)
Volume:400ft3(11.3m3) Construction: Carbon Steel, Epoxy Lined Shape: Cylindrical Diameter: 8 ft (2.4 m) Length: 8 ft (2.4 m) Empty Bed Contact Time = 6 seconds Weight 2.3 tons (5/16 inch thick) GAC: BPL 4X6,6.000 lb
Capacity: 2000 SCFM Heat Source: Electricity Heat Provided: 44,000 Btu/hr Electricity Required: 18 kW Material: Stainless Steel 304L (housing) Elements: Indoy 800
A New Motor Installed Flow: 2,000 SCFM (3,400 m3/hr) Flow: 2,031 ACFM (3,450 m3/hr) Feed Pressure: 14.7 Psia Discharge Pressure: 16.3 Psia Brake kW: 14.5 (19.5 HP) Motor kW: 18.6 (25 HP)
0.0
0.0
16.0
18.6
0.0
0.0
16.0
18.6
Total installed Motor kW 35
Normal Operation, Power Req'd, kW (a) 26
(a) Includes a credit of 5.6 kW (Brake) for the existing AS blower power requirement
Ccse1R-Eq.U*t 1206 PM 3/23/94 1 oM m-44 3-20

Table 3-9
B
Material Balance Air Stripper Exhaust Treated by Sponge Adsorption System/Thermal Regeneration
Case 2A; Sorbent: Dow XU43502.01; Air Stripper Exhaust TCE Concentration » 400 ppmv Stream No. 1 2 3 4 4a 5 . 6 Description Ground
Water Treated Water
Air Fed to Air Stripper
Air Stripper Exhaust
Preheated Air to Sponge Adsorbers
Treated Air from Sponge Adsorbers
Treated Air to Stack
Ground Water opm GOO 500
Air/CVOCa/Nltrogen SCFM 2000 2000.S0 2000.80 2000.00 2000.00 Air Relative Humidtty, % 100.00 50.00 50.00 50.00
Water Vapor/Condensate. Ib/day/regeneratlon
CVOOs ppm, wt 06.5 0.003325 ppm. vol. 400 400 < 8 < 0 . 2 •Vhr 17 0 17 17 lb/d«y ago 0 3BS 399 < 8 < 0.2 Ib-motes/day 3.04 0.00 3.04 3.04
SCFM 0.80 0.80
Temperature. *F 60 80 80 80 Pressure, pita 17.4 17 15.4 14.8
Stream No. 7 8 0 10 11 12 13 14 15 Description Nitrogen feed
to Hot Oil Heater Nitrogen to
Blower Heated Nitrogen NItrogen/CVOCs to NItrogen/CVOCs
to Sponge Adsorber Exchanger to ChtKer NItrogen/CVOCs
to Separator CVOCsto
Recvde/Dlsp. Sat'd Water to Equaliz. Tank
Treated Cond. to Disposal
Ground Water opm
Regeneration conducted every two days (For a total of 20 hours) Alr/CVOCs/Nltrogen \ ^Vxt C*/ >* *' " ' "':V' ' yHC",?* -\'. v ' :..«<'••W&W.'to..:,. :v.-;:«:'.>;».V::t^fi,-:..', - , •' v >v> .••.•>> '"•:•":' — • ' • 7 ' . ' " •' •','/•' '•/ *
SCFM "R-". ,«otf'; *v* -;c- 'tsoo':<>,* w.«> *.-. i «o* >:•. ,v.;.»»e«Jta •••<..-isot.«2-<^: isOQ.do- 1 • • • ' - < - ™ 1 , , - „ ' • , ' . . . ' . , . . . . . • -Air Relative Humidity. % :v{-*•*:•?•?,•'''-}i * * • • « < - X s * V - ^ w ' :• "1 r:":"-\'^i>^J'V' • .••y-y^t^7"^'i,^'A~- ' *. ' . - ' • ' , ' . •>• . „
' . <• • : • ' • . - •
Water Vapor/Condensate, •L^:™*m*mm' .;; ^^m,-^^ ; ^ 0 O V - . / . -,•: i O O " " 100 Ib/day/regeneration V \- %*)'<" *J\J .'.S/'IY ••> ' '' %' *•''"* • ; «*" 'Vt f^ CVOCs i-j".'!>',.!.,,'<-<{••>/-•- • • • . . • , . , V " .::^ ll'-l<I-,:.;'. ->-:. ::,.;V- .>- '''--r.xf. ;v:':.. rA,f'',:-.--.--:,/: /;. . . K ' ' f> •*• „ r : ; ? , , , , , - --
ppm, wt h \ h v \ ' • - : • . " : ; . ' • ..'.,• ••%••>• . ' . : , ' - ' • ' ' • ' • "•'• iibb 0.0025 ppm, vol. , , ... ., , ;, Ib/hr ? ° ' ''* ?.\-'! •{ ' > v ^ '*'* ' •' • ' • ? • * ' , * ' :?..,:Z£:LZLX^^ ' 60 ' •'' '.'•• ' U " ; ; *
lb/day )'::E™^vlvl:'^^:™^"l'''lv^^'l^''^•"^,. .-.. ^ . ^ / , : ' i j i i ' ' ' ^ ' . ' ' ' , : 7 M ''*-«•>. 'W.7M •:•...•• * • ''• 700 ' lb-mole s/day • «*(«;v-.:..- ' . ' , • ' • - > • > . :;-.v'.:r•:•' ••:.iA....< y * : : : ^ « . o a v y - , ^ * « J M I * • ; ; . • ; : ; „ > ' «.0B ; 1 < ^ >. • >
SCFM • ' ; . . . , . v : , ^ ; ; i * ' ' f r . v v > I U » ^ ^ , x ' • ' < * ' • ' : ! ' - - " ; \ . ' . ' ' ' • ,''•. * ^ : ' % - •. t *' . - • • . , v % " ' . v ' f'i *--.J.h " * ':":"": 7'",'"
Temperature, *F -.,-.' -WIS"-* v'--- • 1 7 0 ' ' .' -' * W v r - - a i 2 . . r M > - . ,-•,,*,,• .: •• - . 1 8 ' ' Pressure, pels :-'.>'-:\Ufi> ••<?••'. ' 1 4 . 7 - : . . . , . . I » : * . > ^ ^ ' - 1 » . « - . - - ; f i w ^ i A * . ' . " :.,.MB,1 '• . .
u> I
to MB.AS/Th«m.C»»» 2A 2/28/94 6.S4-PM -

B k
Table 3-10 Material Balance
Air Stripper Exhaust Treated by Sponge Adsorption System/Thermal Regeneration Case 2B: Sorbent; Ambersorb 563; Air Stripper Exhaust TCE Concentration = 400 ppmv
Stream No. 1 2 3 4 4a 5 6 Description Ground
Water Treated Water
Air Fed to Air Stripper
Air Stripper Exhaust
Preheated Air to Sponge Adsorbers
Treated Air from Treated Air to Stack
Groundwater opm 500 500
Air/CVOCs/Nttrogen SCFM 2000 2000.80 2000.80 2000.00 2000.00 Air Relative Humidity. % 100.00 50.00 50.00 50.00
Water Vapor/Condensate. kVday/regeneration
CVOCa pom, wt 66.5 0.003325 pom, vol. 400 400 < 8 < 0.2 to/hr 16.63 0.00 16.63 16.63 fc/day 309.23 0.02 399.21 399.21 < 8 < 0.2 lb-mote*/day 3.04 0.00
SCFM 0.80 0.80 < 0.02
Temperature, "F 60 80 80 80 Pressure, peia 19.8 19.4 15.4 14.8
Stream No. 7 8 9 10 11 12 13 14 15 Description Nitrogen feed
to Hot Oil Heater Nitrogen to
Heater Heated Nitrogen Nitrogen/CVOCs to
to Sponge Adsorber Exchanger Nitrogen/CVOCs
to Chiller Nitrogen/CVOCs
to Separator CVOCs to
Recycle/Dlsp. Sat'd Water to Equallz. Tank
Treated Cond. to Disposal
Ground Water opm
Alr/CVOCs/Nltrogen ¥SM HoP i -y^jfew •* vc? >iv;t%>?tsi'^;r^
Regeneration conducted every two days (For a total of 100 hours)
ga»' SCFM I I I I I I I IMI I I I I I I IH I -
1500 ••xisoo;; ss i80p;ae;;a;^?ffvifioo,3e: ^TXtecx^yxM***-^
1500.38 Air Relative Humidity, %
$MiM$&7i:*l. ^r-^a* Water Vapor/Condensate, ^Si2 ^K^&m^^M*^**-^ mm* 'w^iwBtfft -tz^r • fob 100 100
lb/day/regeneratlon ^ f ^ V , ! ^ ^ - -1- ,;m^- *; e^a4^ CVOCs ; ) ; ^ ^ - ^ pom, wt rmlinnrtir Tiriimittiirtiniriii- I I I I I I I I ' ' • • ^ j . . . . \ . . j . ^ . . •>
1100 0.0025 ppm, vol.
»*H*«jfoH. ^ A V > ^ ^ « >^t+^wrv*»v*'^ ^ ^ ^ - r -Ib/hr !Tffi lb/day v«s^:v«-«i S„.--
MllTllH.jffll.IIM MIHl'I'M """'lj •• i t -
?^^m-::\x**»ii9&\K .192 ^ i i M i i ^ t i W g a M :.
182 to-moles/day 6 ? * _ MMlS3!lZi££5Sl^ ^^^s-^^gSi^Sf" SCFM
Temperature, *F 15 17-5 1S.B , M 15.1 Pressure, peia
i to to MB.AS/Th»rm.C«s» 2B 2/28794 6:68 PM

Table 3-11 Material Balance
Air Stripper Exhaust Treated by Sponge Adsorption System/Regeneration Using Hot Water/Blodegradatlon Case 2C; Sorbent: Dow XU43502.01; Air Stripper Exhaust TCE Concentration = 400 ppmv
Stream No. 1 2 3 4 4a 5 6 Description Ground
Water Treated Water
Air Fed to Air Stripper
Air Stripper Exhaust
Preheated Air to Sponge Adsorbers
Treated Air from Sponge Adsorbers
Treated Air to Stack
Ground Water gpm 500 500
Alr/CVOCs SCFM 2000 2000.80 2000.80 2000.00 2000.00 Air Relative Humidity, % 100.00 • 50.00 50.00 50.00
Water, Ib/day/regeneratlon
CVOOs ppm. wt 66.5 0.003325 pom. vol. 400 400 < 8 < 0.2 M i r 17 0 KVday 399 0 399 399 < 8 < 0.2 lb-mole s/dav 3.04 0.00 3.04 3.04
SCFM 0.80 0.80 < 0.02 Natural Gas, MMBtu/hr Temperature. *F 60 80 80 80 Pressure, psia 17.4 17 15.4 14.fl
\
Stream No. 7 8 9 10 11 12 13 14 15 Description Hot Water to Water Water to Water to Natural Gas Phenol Oxygen to Purge Water
Sponge Adsorber from Cooler Biodeg. System Heater to Water Heater Feed to Reactor Reactor to GAC Adsorber Treated Water
to Makeup
Ground Water Regeneration conducted every two days (Hot water regeneration and blodegradatlon system operate around the clock) gpm '*W'Y$o0 •>'.;•;,'*;*>;'* QQO ,: .'"; •>•" :«00 '^"•yi'A'-%'")iitli6u,:~'"" " ''-' •: ! *'* •-'.: •':'• ' • S.0 5.0
Alr/CVOCs | ? < < ^ ' l ^ ^ '" " • " . ' : ; , : •'•,' • ' SCFM '.?.'»'•&:•*. *.. ,',•'.{. •'i".>!w,s"wp'->.-.. ••*•>: • .*X*i.<•>!••*'&••>:< •i:^>-L-:~'~-7<-'-K^'-''-<;''^ '';•"/ - V " •./•'. '• ." • - ' • Air Relative Humidity, % .'.'<-T" }K ••;.'**•.•",•<' V - - ; * '',,...>.''•'•••-•• ">'•;'•••• ;<?.i.....:.,K.,h,,f.:<\w?i-'-: "< ' "•'•"• ' • • ' • •
Water. /V-' ••<;:•.*? ,*:';,4*.w •->•.:.• ->>•'<""' '• " .,"-'-;"•" - ' ' '^ " • -.;.,• . ... ">!* , i.V,'; •"!';'*".' -^; '-'- " : ; " " ' : •;-• ' Ib/day/regeneration . ^1 , ^ ,000- : - rtaoo,oo"6" ,, 7,200,000.'.-; :?fiiciiiMo^y-;-.v-j:;.-; •-•""• : ,
CVOCs/Phenot/Oxygen i 'K '.'",• • - ' ' > ' - '..•<'!• " • - • ' ; • • • • ' • - - . • ' • - :' ' " . - v ; . , - . . . ; < V . ' , . . - . ; , - • .,' .; • . , ; . : . " ' • < • ' :•' . •
ppm, wt >••><><;,•.•• <*\>;. "•'• SS •< , • ; . ' - ' . : SB •' :••*,*.->:,;,»:»r" <:^/^<- ••.-••><'. •. -•• 85 ' - 131 - 0 . 5 0.002S ppm, vol. ib/hr ^\. •- '•'.iwwuW-- w , - ' . 1 7 - ' ^ > ••'•'«. , >'• : • ' :.'\i-f. •-:•.,•..:•:••••!•. :>\ i f . - 39 Ib/dav , , V , ' i V . V ' '•'•>'•'•'•"'•'Wtf'-C '.-.'/ >••.< 39V'-*>• i\':-••;.:>!:•.;••••< \ - i • • •. \ .. " • ;•> .; -->:.. 399 - 940 b-moles/day . ;£ .*{•* ' * ' • ••/?.. . . •.'.$.«< .^ • • ; - ! : v ;3 .64 ' : : ; , :•':- '••;. "V ' - ^ "; ? - ? \ ! ' ' f ^ V ' ^ ;<' {'-: '-4.84 , . 89 .38 - ••
SCFM <V. ;s>-s- -, ," • -• '' " ' . ' '-- !..' ' . '- - ,> ' . • • ' . ;" •/-.':*•;••'',..-.•-!•>• s-4%v-V;i"-',-'•' • " ' Natural Gas. MMBtu/hr ..'..', . '• "•: ; !-"',••.'>;.''>';'•'- ' ''••".'•:•:>.;''/' " ' •••,.••<•'•'.I •r/stfS..'-J-:.•• •?:'.'< >•. •<•'-• •'• " . • Temperature, "F '--;-\ifl4".:..•.:. vioo ., .' r i » : ' . : > ' . " . 1 too*.•••.••"• -;-,; »»..• ;*'•..-">;.• ,•• ee 68 Pressure, psia * -. \7~ •:W'' -i - <'..16•••( ' ,• -iS;8'• • "-<"* v"- ,*. - 1 ft - • -'* • •'.',.>,«<„"<j,-!?*** ,\. - ' - ' - - • 17 15
U>
to MB.AS/Bk>d«g.C«s» 2C 2/287B4 5:35 PM

Table 3-12 Air Stripper Exhaust Treated by Sponge Adsorption System •
Regeneration Using Hot Water/Biodegradation Case 2C: Sorbent: Dow XU, Air Stripper Exhaust TCE Concentration = 400 ppmv
Major Equipment List
Serial Equipment Title Qty. Description Motor Motor No. I. D. No. kW-ea. kW
Total
1 2C-C-1 Knock-out Drum 1 Volume: 430 A3 (12.3 m3) Construction: Carbon Steel, Epoxy Lined (40 mills thickness for all epoxy lined vessels) Shape: Cylindrical Diameter 6.5 ft (2 m) Length: 13 ft (4 m) Residence Time = 10 seconds Weight 2.6 tons (5/16 inch thick)
0.0 0.0
2 2C-C-2 Sponge Adsorbers 3 Volume: 400 ft3(11.3 m3) Construction: Carbon Steel, Epoxy Lined Shape: Cylindrical Diameter. 8 ft (2.4 m) Length: 8 ft (2.4 m) Empty Bed Contact Time = 6 seconds Weight 2.3 tons (5/16 inch thick) Organic Sponge: Dow XU43502.01,5,000 lb
0.0 0.0
3 2C-C-3 GAC Adsorbers 2 Volume: 400 A3 (11.3 m3) Construction: Carbon Steel, Epoxy Lined Shape: Cylindrical Diameter 8 ft (2.4 m) Length: 8 ft (2.4 m) Empty Bed Contact Time = 6 seconds Weight 2.3 tons (5/16 inch thick) GAC: BPL 4X6, 6,000 lb
0.0 0.0
4 2C-C-4 Dual Media Filter 1 Volume: 40 rt3 (1.1 m3) Construction: Carbon Steel, Epoxy Lined Shape: Cylindrical Diameter 3 ft (0.9 m) Length: 6 ft (1.8 m) EBCT: 20 minutes Weight 0.47 tons (5/16 inch thick) Dual Meda: 1,000 lb
0.0 0.0
5 2C-C-5 Liquid Phase GAC Adsorbers 2 Cakjon 350 Gallon Disposorb or Equivalent Capacity: 5 to 15 gpm EBCT: 20 minutes GAC: 1,000IbofFtttrasorb300 Polyethylene Canisters
0.0 0.0
6 2C-C-6 Basket Strainer 1 Capacity: 600 gpm Construction: Carbon Steel, Epoxy Lined or Stainless Steel 304L
Strainers: Stainless Steel 304L
7 2C-0-1 Equalization Tank 1 Volume: 240 A3 (6.8 m3) Construction: Carbon Steel, Epoxy Lined Shape: Cylindrical Diameter. 6 ft (1.8 m) Length: 9 ft (2.7 m) Residense Time = 3 minutes Weight 1.7 tons (5/16 inch thick)
0.0 0.0
C«»«2C-Eq.LI«t 12KMPM 312319* 1o»3 111-48 3-24

Table 3-12 Air Stripper Exhaust Treated by Sponge Adsorption System -
Regeneration Using Hot Water/Biodegradation Case 2C: Sorbent: Dow XU, Air Stripper Exhaust TCE Concentration = 400 ppmv
Major Equipment List
Serial No.
Equipment I. D. No.
Title Qty. Description Motor kW-ea.
Motor kW
Total 8 2C-D-2 Equalization Tank 1 Volume: 16 ft3 (120 gal., 0.45 m3)
Construction: Carbon Steel, Epoxy Lined Shape: Cylindrical Diameter 2.4 ft (0.72 m) Length: 4 ft (1.1 m) Residence Time = 12 minutes Weight 0.3 tons (5/16 inch thick)
0.0 0.0
9 2C-E-1 Air Heater 1 Capacity: 2000 SCFM Heat Source: Electricity Heat Provided: 44.000 Btu/hr Electricity Required: 16kW Material: Stainless Steel 304L (housing) Elements: Indoy 800
16.0 16.0
10 2C-E-2 Hot Water Cooler 1 Type: Shell and Tube Exchanger Tube Side Fluid: Cooling Water Duty: 31.8 MM Btu/hr (33.6 MM J/hr) Area: 4120 rt2 (380 m2) Material: Carbon Steel (tubes & housing)
0.0 0.0
11 2C-F-1 Water Heater 1 Capacity: 600 gpm Heat Source: Natural Gas Efficiency = 88% Natural Gs Required: 43 MM Btu/hr
0.0 0.0
12 2C-G-1 Polishing Pump 1 Type: Centrifugal Pump Liquid Pumped: Water Ftow:5gpm(1.1 m3/hr) Specific Gravity: 1 Brake kW: 0.03 kW (0.04 HP) Motor kW: 0.19 (0.25 HP)
0.2 0.2
13 2C-G-2 Recycle Pump 1 Type: Centrifugal Pump Liquid Pumped: Water Flow: 600 gpm (136 m3/hr) Specific Gravity: 1 Feed Pressure: Atmospheric Discharge Pressure: 9 psig Brake kW: 3.2 kW (4.3 HP) Motor kW: 4.5 (6 HP)
4.5 4.5
Ca*e2C-Eq.LiJt 1204 PM 3/23/94 2 of 3 111-49

Table 3-12 Air Stripper Exhaust Treated by Sponge Adsorption System •
Regeneration Using Hot Water/Biodegradation Case 2C: Sorbent: Dow XU, Air Stripper Exhaust TCE Concentration = 400 ppmv
Major Equipment List
Serial No.
Equipment I. D. No.
Title Qty. Description Motor kW-ea.
Motor kW
Total 14
15
Modification to Existing Rotary Positive AS Blower (from 10 HP to 50 HP)
Envirex Biodegradation System
1
1
A New Motor Installed 37.3 Flow: 2,000 SCFM (3,400 m3/hr) Flow: 2,031 ACFM (3.450 m3/hr) Feed Pressure: 14.7 Psia Discharge Pressure: 17.9 Psia Brake kW: 28 (38 HP) Motor kW: 37.3 (50 HP)
Includes an 18-foot-olametsr reactor, with a fluid 75.0 QAC bed depth of 14 ft (53,400 lb GAC), and the required pumps and auxiliary equipment Capacity: 600 gpm (136 m3/hr), TCE conc.=55 mg/L Power required: Brake kW 61.5 (Break HP 82.4) Motor kW 75 (100 HP)
37.3
75.0
Total Installed Motor KW 133
Normal Operation, Power Roq'd, kW (a)
Regeneration, Power Ftetfd, kW
41
72
CastfC-Eq.Uot 1204 PM 3Q3/S4 3ot3 ffl-50 3

Table 3-13 Material Balance
Air Stripper Exhaust Treated by Sponge Adsorption System/Regeneration Using Steam/Blodegradatlon Case 2D: Sorbent: Dow XU43502.01; Air Stripper Exhaust TCE Concentration = 400 ppmv
Stream No. 1 2 3 4 4a 5 6 Description Ground
Water Treated Water
Air Fed to Air Stripper
Air Stripper Exhaust
Preheated Air to Sponge Adsorbers
Treated Air from Sponge Adsorbers
Treated Air to Stack
Ground Water/Condensate gpm 500 500
Alr/CVOCs/Stoam SCFM 2000 2000.80 2000.80 2000.00 2000.00 Air Relative Humidity, % 100.00 50.00 50.00 50.00
Water Vapor/Condensate, Ib/day/reoeneratlor
CVOCe ppm. wt 66.5 0.003325 ppm. vol. 400 400 < 8 < 0.2 fc/hr 16.63 0.00 lb/day 309.23 0.02 399 399 < 8 < 0.2 tt>-mole*/day 3.04 0.00 3.04 3.04
SCFM 0.80 0.80 < 0.02
Temperature. *F 60 80 80 80 Pressure, psta 17.4 17 15.4 14.8
Stream No. 10 11 12 13 14 15 Description Steam to Condensate CVOCs to Condensate to Condensate to Phenol Oxygen to Cond. Treated by Treated Cond.
Sponge Adsorber horn Condenser Storage/Disposal Equalization Treatment Feed to Reactor Reactor Blodanradatlon to Disposal
Ground Water/Condensate gpm
Regeneration conducted every two days (steam regeneration: 20 hra/day; blodegradatlon: around the clock) Al . l l l l TWl lV l l l I ' l ' l " H I ' I " 'IIJ'llHI »—i»- 5.2 5.2
Alr/CVOCa/Steam ^^«^-:.'i :-v¥r^'' , : '^ SCFM bm^^/Mm? i*!OT? Air Relative Humidity. %
..,„,;,„;, ,„„,,« yi,,,,,,,,!,,. ,&iW*.;&v.\\!.rt,4ii.,
I T Water Vapor/Condensate, lb/day/reoenaratlon h"it»M9jr--.^7mm^:: 125,000 -'•ca^oo-i-.-
CVOCs/Oxvoen/Phenol .li&L ppm, wt I \ ' ' • .•.' • «3»y ;- 1100 ' " JfifiOL 1100 0.0025 PPm, vol. KVhr £.;..;.'• M 0 " -:-• 33.o ••.:;.- «.9 . 2 ,9 Jt.9 8.0 to/day mwrww j m \wxt&w*nm oa-a 68.8 191,4 0.31 lb-mo lea/day 8.08 MLii O.S2^;-^. ' '^ .V^O.y3 • 6.08
SCFM ~ ~ * ~ •< 7 s ; ^ v v J V / , . ; ' \ - > ^ ' <.';. •;'• s . >; ' llljj.fl IIIIJI.
Temperature, *F Pressure, psia TT,
250 ,100 •30 ; t r - - . ' - ; - - : i e . >'* 1S.8
...•.-'loa,,-,, ;• 15.6
e«v ^ -^Wt l^ i ,,08 17 - *
MB.ASmiodM.Cu* 20 2/28/94 6:38 PM

Table 3-14 Air Stripper Exhaust Treated by Sponge Adsorption System -
Regeneration Using Steam/Biodegradation Case 2D: Sorbent: Dow XU, Air Stripper Exhaust TCE Concentration = 400 ppmv
Major Equipment List
Serial Equipment Title Qty. Description Motor Motor No. I. D. No. kW-ea. kW
Total
1 2D-C-1 Knock-out Drum 1 Volume: 430 ft3 (12.3 m3) Construction: Carbon Steel, Epoxy Lined (40 mills thickness for all epoxy lined vessels) Shape: Cylindrical Diameter 6.5 ft (2 m) Length: 13 ft (4 m) Residence Time = 10 seconds Weight 2.6 tons (5/16 inch thick)
0.0 0.0
2 2D-C-2 Sponge Adsorbers 3 Volume: 400 ft3(11.3 m3) Construction: Carbon Steel, Epoxy Lined Shape: Cylindrical Diameter 8 ft (2.4 m) Length: 8 ft (2.4 m) Empty Bed Contact Time = 6 seconds Weight 2.3 tons (5/16 inch thick) Organic Sponge: Dow XU43502.01, 5,000 lb
0.0 0.0
3 2D-C-3 GAC Adsorbers 2 Volume: 400 ft3 (11.3 m3) Construction: Carbon Steel, Epoxy Lined Shape: Cylindrical Diameter: 8 ft (2.4 m) Length: 8 ft (2.4 m) Empty Bed Contact Time = 6 seconds Weight 2.3 tons (5/16 inch thick) GAC: BPL 4X6, 6,000 lb
0.0 0.0
4 2D-C-4 Dual Media Filter 1 Volume: 40 ft3 (1.1 m3) Construction: Carbon Steel, Epoxy Lined Shape: Cylindrical Diameter 3 ft (0.9 m) Length: 6 ft (1.8 m) EBCT: 20 minutes Weight 0.47 tons (5/16 inch thick) Dual MeoTa: 1.000 lb
0.0 0.0
5 2D-C-5 Liquid Phase GAC Adsorbers 2 Cakjon 350 Gallon Disposorb or Equivalent Capacity: 5 to 15 gpm EBCT: 20 minutes GAC: 1,000lbofFHtrasorb300 Polyethylene Canisters
0.0 0.0
6 2D-D-1 Equalization Tank 1 Volume: 2000 A3 (15000gallons, 57 m3) Construction: Carbon Steel, Epoxy Lined Shape: Cylindrical Diameter 12 ft (3.6 m) Length: 18 ft (5.5 m) Residense Time - 20 hrs Weight 6.95 tons (5/16 inch thick)
0.0 0.0
Case2D-Eq.Lfet 1204 PM 3/23/94 1 0(3 ffl-52 3-28

Table 3-14 Air Stripper Exhaust Treated by Sponge Adsorption System -
Regeneration Using SteanVBiodegradation Case 2D: Sorbent: Dow XU, Air Stripper Exhaust TCE Concentration = 400 ppmv
Major Equipment List
Serial No.
Equipment I. D. No.
Title Qty. Description Motor kW-ea.
Motor kW
Total 7 2D-D-2 Equalization Tank 1 Volume: 51 ft3(1.44m3)
Construction: Carbon Steel, Epoxy Lined Shape: Cylindrical Diameter 2 ft (1.1m) Length: 6 ft (1.6 m) Residense Time = 70 minutes Weight 0.77 tons (5/16 inch thick)
0.0 0.0
8 2D-D-3 CVOC Storage 1 Volume: 75 ft3 (2.1 m3) Construction: Polyethylene Shape: Cylindrical Diameter 4 ft (1.2 m) Length: 6 ft (1.6 m) Residense Time = 7 regenerations
0.0 0.0
9 2D-E-1 Air Heater 1 Capacity: 2000 SCFM Heat Source: Electricity Heat Provided: 44,000 Btu/hr Electricity Required: 16kW Material: Stainless Steel 304L (housing) Elements: Indoy BOO
16.0 16.0
10 2D-E-2 Condenser 1 Type: Shell and Tube Exchanger Tube Side Fluid: Cooling Water Duty: 7.1 MM Btu/hr (7.5 GJ/hr) Area: 1000 ft2 (90 m2) Material: Stainless Steel 304L (tubes, & housing)
0.0 0.0
11 2D-F-1 Staam Generator 1 Capacity: 6,250 lb/h of 15 Psig Steam Heat Source: Natural Gas Efficiency = 75% Natural Gas Required: 9.4 MM Btu/hr (9.9 GJ/hr) BrakekW:3.7kW(5HP) Motor kW: 5.6 (7.5 HP)
5.6 5.6
12 2D-G-1 Polishing Pump 1 Type: Centrifugal Pump Liquid pumped: Water Flow: 6 gpm (1.3 m3/hr) Specific Gravity: 1 Brake kW: 0.03 kW (0.04 HP) Motor kW: 0.19 (0.25 HP)
0.2 0.2
CaM20-Eq.U*t 1204 PM 3/23/04 2 of 3 111-53

Table 3-14 Air Stripper Exhaust Treated by Sponge Adsorption System -
Regeneration Using Steam/Biodegradation Case 20: Sorbent: Dow XU, Air Stripper Exhaust TCE Concentration = 400 ppmv
Major Equipment List
Serial No.
Equipment I. D. No.
Title Qty. Description
1
Motor kW-ea.
Motor kW
Total 13
14
Modification to Existing Rotary Positive AS Blower (From 10 HP to 50 HP)
Envirex Btodegradatkxi System
1
1
A New Motor Installed 37.3 Flow: 2,000 SCFM (3,400 m3/hr) Flow: 2,031 ACFM (3.450 m3/hr) Feed Pressure: 14.7 Psia Discharge Pressure: 17.9 Psia Brake kW: 28 (38 HP) Motor kW: 37.3 (50 HP)
Includes an 8-foot-diameter reactor, with a fluid 22.4 GAC bed depth of 14 ft (10,600 lb GAC), and the required pumps and auxiliary equipment Capacity: 5.2 gpm (1.2 m3/hr), TCE conc.=1100 mg/L Power required: Brake kW 16.6 (Brake HP 22.2) Motor kW 22.4 (30 HP)
37.3
22.4
Total Installed Motor kW 81
Normal Operation, Power Req'd, kW (a)
Regeneration, Power Req'd, kW
41
23
CaM2D-EqXbt 1204 PM 3/23/94 3 of 3 IU-54

Table 3-15 Material Balance
Air Stripper Exhaust Treated by GAC Adsorption System/ Off-Site Regeneration Case 2R: Sorbent: GAC BPL; Air Stripper Exhaust TCE Concentration = 400 ppmv (a)
Stream No. 1 2 3 4 5 6 Description Ground
Water Treated Water
Air Fed to Air Stripper
Air Stripper Exhaust
Preheated Air to GAC Adsorbers
Treated Air to Stack
Ground Water gpm 500 500
Air/CVOCs/Nitrogen SCFM 2000 2000.80 2000.80 2000.00 Air Relative Humidity, % 100.00 50.00 50.00
CVOCs ppm, wt 66.5 0.003 ppm, vol. 400 400 < 8 Ib/hr 16.63 0.00 17 17 lb/day 399.23 0.02 399.22 399.22 < 8 Ib-moles/day 3.04 0.00
SCFM 0.80 0.80
Temperature, °F 60 80 80 Pressure, psia 15.8 15.4 14.8
(a) Two of the spent GAC beds are regenerated every 8 days
MB.AS/GAC Case 2R 2/28/94 6:07 PM

Table 3-16 Air Stripper Exhaust Treated by GAC Adsorption System/Off-Srte Regeneration
Case 2R: Sorbent: GAC BPL, Air Stripper Exhaust TCE Concentration = 400 ppmv Major Equipment List
Serial No.
Equipment I. D. No.
Title Qty. Description Motor kW-ea,
Motor kW
Total
1
2
3
4
2R-C-1
2R-C-2
2R-E-1
Knock-out Drum
GAC Adsorbers
Air Heater
Modification to Exisiting Rotary Positive AS Blower (From 10 HP to 25 HP)
1
3
1
1
Volume: 430 ft3 (12.3 m3) Construction: Carbon Steel, Epoxy Lined (40 mills thickness for all epoxy lined vessels) Shape: Cylindrical Diameter: 65 ft (2 m) Length: 13 ft (4 m) Residence Time =10 seconds Weight 2.6 tons (5/16 inch thick)
Volume:400ft3(11.3m3) Construction: Carbon Steel, Epoxy Lined Shape: Cylindrical Diameter: 8 ft (2.4 m) Length: 8 ft (2.4 m) Empty Bed Contact Time = 6 seconds Weight 2.3 tons (5/16 inch thick) GAC: BPL 4X6,6,000 lb
Capacity: 2000 SCFM Heat Source: Electricity Heat Provided: 44.000 Btumr Electricity Required: 16 kW Material: Stainless Steel 304L (housing) Elements: Indoy 800
A New Motor Installed Flow: 2,000 SCFM (3,400 m3/hr) Flow: 2,031 ACFM (3,450 m3/hr) Feed Pressure: 14.7 Psia Discharge Pressure: 16.3 Psia Brake kW: 14.5 (195 HP) Motor kW: 18.6 (25 HP)
0.0
0.0
16.0
18.6
0.0
0.0
16.0
18.6
Total Motor kW 35
Normal Operation, Power Req'd, kW (a) 26
(a) Includes a credit of 5.6 kW (Brake) for the existing AS blower power requirement
C**e2R-Eq.U*t 1202 PM 3/23/94 1o<1 IH-56 3-32

Existing Facilities
1-P-1 Knock-out
Drum
Alternate Exhaust from Soil Vapor Extraction System
Ground Water From Equalization Tank
<i> >»*.y-^y
Water to Equalization Tank
Pump
Air Stripping Towers (Dual-Stage)
Air (Fed to Second Stage Air Stripper)
•+
\ \ \ \ x v x ' • • • • • • / X \ \ X X X X
' • • • • X • • X \ \ \ X X X
» • • • • • • • X X X X X X X
' • • • • • • • X X X X X X X
> • • • • • • • X X X X X X X
» • • . / • • • • X X X X X X X
' • • • y V • * X X X X X X X
' • • • / • • • • X X X X X X X
* f • • • • • • X X X X X X X
• • • • • • • X X X X X X X
» X X X X • X • X X X X X X X
' X X X • X X • X X X X X X X X X X X X X X
' • • • • • • / X X X X X X X
4> Treated Water to Discharge
•*C Id
A Het
CVOCs to Recycle or Disposal
.•.••'j?r*i»*»:S
SB J-P-.3 X Hot Oil -f Storage 7 • •/ yty y y-:
X;. Then Xv Rege XX Orgat
L.

} ^ ^ &
••••••••< ••••••••< ••••••••< £-1-C-2
Sponge Adsorbers (Three Units, Two Operating in
Series, One in Regeneration Mode)
Treated Air to Stack
Vapor Phase GAC Adsorbers (Two in Series)
- • • r i i ' » - • • . . • . . X!/!*/\Equaliz.Tank/•/.•/.:•/.!
eration of v:\X;X;XyIy*;Xy/Xf *" iJsik" iC S p o n g e XX'XXXXXXX Condensate
-. - .v.v.v.v.v.y.v.v.v; Pump
. • • • • • • • • • • • •
•••.-.•.T.-.-.-mm •:x-:t-:-:
1-G-5 Liquid Phase
- GAC Adsoibers
15
.'/. Treated Condensate to Discharge
ff Process Flow Diagram - Air Stripper Exhaust Treated by Sponge Adsorption System - Thermal Regeneration -Cases 1A, IB , 2A & 2B
JOB NO. 22307 FIGURE 3-1
3-33 nr-57

Existing Facilities
00
1R-C-1 Knock-out
Drum Treated Air to Stack
Process Flow Diagram -Air Stripper Exhaust Treated by GAC Adsorption System -Cases 1R & 2R
JOB NO. 22307 FIGURE 3-2

2C-C-1
Existing Facilities Knock-out
Drum
Alternate Exhaust from Soil Vapor Extraction System
Ground Water From Equalization Tank
<3> Water to Equalization Tank
Pump
Air Stripping Towers (Dual-Stage)
A i r (Fed to Second Stage Air Stripper)
, v v. x » X X X X X X X X X X X X X . \ \ \ \ \ \ ' X X X X X X X
X X X X \ \ X / X X X / X X
X X X X X X X X X X X X X X
X \ \ V X \ X • X X X X X X X
X N \ N X X \ ' / X X X / X X
X X X X X X X .Vx 'xVx'x '
x'x'x'xVx'x' /x 'x 'xVx'x' X X X X X X X
> X X X X X X X X X X X X X
X X X X X X X ' X X X / X X
> X X X X X • X X X / X X
L X X X X X x e t f x t
$L Treated Water to Discharge
zzzz
CVOCstoRecyt or .Disposal
• 2£d
v HotWate
Regene Using I

Process Flow Diagram - Air Stripper Exhaust Treated by Sponge Adsorption Regeneration Using Hot Water/ Blodegradation - Case 2C
® Job No. 22307 Figure 3 3
m-59 3-35

2D-C-1
Existing Facilities Knock-out
Drum
Alternate Exhaust from Soil Vapor Extraction System 1
Ground Water From Equalization Tank
<J> yyyy,
Water to Equalization Tank
Pump
Air Stripping Towers (Dual-Stage)
A i r (Fed to Second Stage Air Stripper)
essssss A AAA
X X X X X X X ' ******* X X X X X X X < ******* \ X X X X X X ' ******* X X X X X X X * ******* X X X X X X X < ******* X X X \ X X X ' ******* X X X X X X X ' ******* X X X X X X X • ******* X X X X X X X < ******* X X X X X X X ' ******* X X X \ X X X ' ******* X \ X X X X X ' ******* X X X X X X X « ******* X X X X X X X <
* * t * * * *
V 7
< 2 > , < 2 > , Treated Water to Discharge
+c 2G
He
CVOCs to Recycle or Disposal
Condeni
* * * * • m :•>:." Regenera ft': Using S
• * *jiJd^* i ' i * •
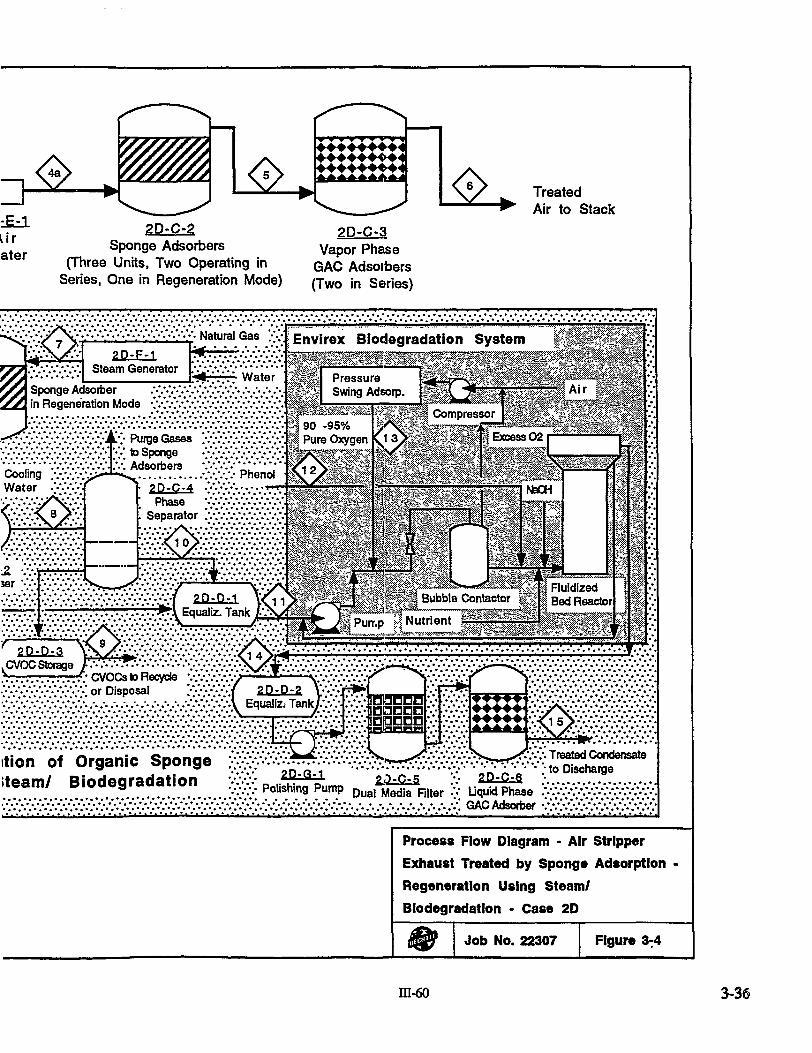
&
ur ater
^
4> 2D-C-2
Sponge Adsorbers (Three Units, Two Operating in
Series, One in Regeneration Mode)
••••••••« ••••••••<
2D-C-3 Vapor Phase
GAC Adsorbers (Two in Series)
£. Treated Air to Stack
2P-F-1 Steam Generator
Natural Gas
Sponge Adsorber in Regeneration Mode
Envirex Biodegradation System
tion of Organic Sponge tteam/ Biodegradation y/Xv P n , ^ f u m a 2Jh&& :> , . % ^ s . 7 . . . . . . . . .•"•.•'•/ P o l l s h m 9 P u m P Dual Media Filter •/ UqukJPhase X-!v/XvXv///XvX-XvX-X".V- ^^^•^y^/:/:^^^^:.:..:;.:.:.:.:..-..-.;.'. GAC Adsorber
Treated Condensate ; to Discharge
**'**-•* I • • • ^ • f a * i l i ^ * A f c l ^ ^ * * i> . * *J . i >
Process Flow Diagram - Air Stripper Exhaust Treated by Sponge Adsorption Regeneration Using Steam/ Biodegradation - Case 2D
Job No. 22307 Figure 3 4
m-60 3-36

Section 4
Capital and Operating and Maintenance Cost Estimates
This section presents the conceptual cost estimates for the six AS exhaust treatment cases considered. The conceptual cost estimates include capital costs, annual operating and maintenance (O&M) costs, annualized costs and present worth calculations. Capital costs are expected to have an accuracy of+30 percent/-30 percent
The alternative cases considered for cost estimation at the low TCE concentration (30 ppmv) include:
• Case 1A - Sponge Adsorption Using Dow XU as Sorbent/Thermal Regeneration
• Case IB - Sponge Adsorption Using Ambersorb 563 as Sorbent/ZThermal Regeneration
• Case 1R - GAC Adsorption/Off-Site Regeneration
The alternative cases considered for cost estimation at the high TCE concentration (400 ppmv) include:
• Case 2A - Sponge Adsorption Using Dow XU as Sorbent/Thermal Regeneration
• Case 2D - Sponge Adsorption Using Dow XU as Sorbent/Regeneration Using Steam and Biodegradation
• Case 2R-GAC Adsorption/Off-Site Regeneration
As discussed in Section 3.3, Case 2B (Sponge Adsorption Using Ambersorb as Sorbent/Thermal Regeneration) was dropped due to the longer desorption time that would be required and the higher cost of Ambersorb when compared to Case 2 A. Case 2C (Sponge Adsorption Using Dow XU as Sorbent/Regeneration Using Hot Water and Biodegradation) was also dropped from consideration due to the high volume of water stream that results from hot water regeneration and would be required to be treated. The biodegradation scheme is thus considered only for one case (Case 2D) at the high TCE contaminant concentration level Section 2 presented the preliminary design criteria and Section 3 presented the process flow diagrams, material balances, and equipment lists for the alternative cases considered.
4.1 GENERAL
4.1.1 Capita] Cost Estimating Approach
Conceptual capital cost estimates for installation of the treatment processes were developed based on the description, process flow diagrams, mass balances and major equipment included in Section 3. The estimating methods used for the development of the capital costs are consistent with the conceptual nature of the engineering data. These include informal vendor contact for pricing majGr equipment as well as extrapolation from current Bechtel data. Major vendors that have contributed to this cost estimate are listed below:
Evaluation of Organic Sponges for CVOC Abatement 4-1
in-6i

Capital and Operating and Maintenance Cost Estimates
Equipment
Air Heater Or Gas Heater
Hot Oil Heater
Envirex Biodegradation System
Refrigeration Package
Steam Boiler
DowXUSorbent
Ambersorb 563 Sorbent
GAC
Vendor
Chromalox Milpitas, CA
Xchanger, Inc. Hopkins, MN
Envirex Ltd. Waukesha, WI
Johnson Emerson Associates Milbrae, CA
Eclipse Thermal Systems Chicago, EL
Dow Chemical Company Midland, Michigan
Rohm and Haas Company Spring House, PA
Calgon Carbon Pittsburgh, PA
Quantities of bulk materials for civil, structural, and site preparation were estimated based on Bechtel experience on similar projects. Quantities of bulk materials for electrical, instrumentation and piping work for the construction of the exhaust gas treatment process were not estimated due to the lack of detailed engineering. The costs of these items were estimated as percentages of identified equipment cost based on similar Bechtel projects with suitable adjustments.
The capital cost estimate includes direct field cost, indirect field cost, engineering, procurement and construction management (EPCM) and contingency. The estimate is based on 1994 first quarter price and wage level and escalation is excluded from the estimate. The direct field cost includes mechanical equipment, civil, structural and site preparation, piping, electrical and instrumentation, and construction labor. Construction or field labor costs for installation were estimated at an average labor cost of $25 per hour. Indirect field costs, which include costs for items such as temporary construction facilities, tools and tackle, and contractor's overhead and profit, were estimated as a percentage of total field labor costs. The capital costs include allowances for EPCM and contingencies. The total capital costs do not include interest during construction and other owners' costs. Also, for purposes of this preliminary evaluation, costs such as working capital, spares inventory, and start-up costs have not been considered.
Evaluation of Organic Sponges for CVOC Abatement
m-62
4-2

Capital and Operating and Maintenance Cost Estimates
4.1.2 Operating and Maintenance (O&M) Costs and Present Worth Basis
Table 4-1 presents the major parameters for estimating the O&M costs, annualized costs, and present worth for the alternative cases considered. The parameters include the annual load factor, cost of electricity and other materials consumed, and O&M labor cost To estimate the labor required, it is assumed that the project is part of an existing site, so that the O&M labor costs are allocated to this part of the project in conjunction with operation of the remainder of the clean-up activities for the site. Continuous monitoring would be required for any first demonstration plant for Cases 1 A, IB, 2A, or 2D. Project performance analysis (including sampling and analysis) for process checkout/optimization of the alternative systems is not included in the operating cost calculations.
To calculate annualized costs and present worth, a rate of return on money at 5 percent per annum is assumed for full amortization of the capital over the life of the project This rate of return reflects government financing of the project A project life of 20 years is assumed for Cases 1A, IB, and 1R, reflecting the longer operation required for the low TCE concentration cases. The low TCE concentration cases can represent groundwater air stripper project offgases which are typically designed to operate for 15 to 20 years. A project life of 5 years is assumed for Cases 2A, 2D, and 2R, reflecting a shorter project expectancy for the higher TCE concentration cases. Although these cases were assumed to be treating groundwater air stripper project offgases, the high TCE concentration better represents soil vapor extraction offgases and these operations usually have a shorter project duration expected. A sensitivity analysis with respect to variations in rate of return on money is presented at the end of this section.
4.2 COST ESTIMATES FOR LOW TCE CONCENTRATION
4.2.1 Case 1A - Sponge Adsorption/Thermal Regeneration
Table 4-2 presents a summary of capital costs for Case 1 A, the use of Dow XU sorbent and thermal regeneration using hot nitrogen. The major equipment include sponge adsorbers, GAC adsorbers, and equipment associated with thermal regeneration. The most expensive equipment are sponge adsorbers at $403,000 for three units, including Dow XU sorbent The major equipment cost is estimated at $601,000. Including installation costs, site preparation, piping and instrumentation, indirect field cost, EPCM, and contingencies, the total capital cost is estimated at $1,170,000.
Table 4-3 presents a summary of the O&M costs, the total annualized costs, and the total present worth for this alternative. Electricity, labor, and annual maintenance materials costs are the major components of the total O&M costs which is estimated at $214,000 per year. This represents a cost of 22.5 cents per 1,000 SCF of gas treated (79.6 cents per 100 m3 treated) assuming a load factor of 90 percent The annualized cost of the total capital at an annual rate of return of 5 percent for 20 years is $93,600 (9.9 cents per 1,000 SCF). The total annualized cost is thus estimated at $307,000 (32.4 cents per 1,000 SCF). The total present worth for this alternative is estimated at $3,830,000.
Evaluation of Organic Sponges for CVOC Abatement 4-3
111-63

Capital and Operating and Maintenance Cost Estimates
4.2.2 Case IB - Sponge Adsorption/ Thermal Regeneration
Table 4-4 presents a summary of capital costs for Case IB, the use of Ambersorb 563 as sorbent and thermal regeneration using hot nitrogen. The major equipment include sponge adsorbers, GAC adsorbers, and equipment associated with thermal regeneration. The most expensive equipment are sponge adsorbers at $557,000 for three units, which includes Ambersorb 563 sorbent. The major equipment cost is estimated at $762,000. Including installation costs, site preparation, piping and instrumentation, indirect field cost, EPCM, and contingencies, the total capital cost is estimated at $1,410,000.
Table 4-5 presents a summary of the O&M costs, the total annualized costs and the total present worth for this alternative. Electricity, labor, and annual maintenance materials costs are the major components of the total O&M costs which is estimated at $250,000 per year. This represents a cost of 26.3 cents per 1,000 SCF of gas treated (93.4 cents per 100 m 3 treated). The annualized cost of the total capital at an annual rate of return of 5 percent for 20 years is $112,800 (11.9 cents per 1,000 SCF). The total annualized cost is thus estimated at $363,000 (38.2 cents per 1,000 SCF). The total present worth for this alternative is estimated at $4,530,000.
4.2.3 Case 1R - GAC Adsorption/Off-Site Regeneration
Table 4-6 presents a summary of capital costs for Case 1R, the use of GAC adsorption and off-site regeneration of spent GAC. The major purchased equipment include knock-out drum, GAC adsorbers, and air heater. The most expensive equipment are the GAC adsorbers. The major equipment cost is estimated at $64,700. Including installation costs, site preparation, piping and instrumentation, indirect field cost, EPCM, and contingencies, the total capital cost is estimated at $187,000.
Table 4-7 presents a summary of the O&M costs, the total annualized costs and the total present • worth for this alternative. Electricity, labor, and spent vapor phase GAC replacement costs are the major components of the total O&M costs which is estimated at $292,000 per year. This represents a cost of 30.7 cents per 1,000 SCF of gas treated (109 cents per 100 m 3 treated). The annualized cost of the total capital at an annual rate of return of 5 percent for 20 years is $15,000 (1.6 cents per 1,000 SCF). The total annualized cost is thus estimated at $307,000 (32.3 cents per 1,000 SCF). The total present worth for this alternative is estimated at $3,820,000.
4.3 COST ESTIMATES FOR HIGH TCE CONCENTRATION
4.3.1 Case 2A - Sponge Adsorption/Thermal Regeneration
Table 4-2 presented a summary of capital costs for Case 2A, the use of Dow XU sorbent and thermal regeneration using hot nitrogen. The major equipment required and the total capital cost are similar to those of Case 1A. The major purchased equipment include sponge adsorbers, GAC adsorbers, and equipment associated with thermal regeneration. The most expensive equipment are sponge adsorbers at $403,000 for three units, including Dow XU sorbent The major equipment cost is estimated at $601,000. Including installation costs, site preparation, piping and instrumentation, indirect field cost, EPCM, and contingencies, the total capital cost is estimated at $1,170,000.
Evaluation of Organic Sponges for CVOC Abatement 4-4
m-64

Capital and Operating and Maintenance Cost Estimates
Table 4-8 presents a summary of the O&M costs, the total annualized costs, and the total present worth for mis alternative. Electricity, labor, and annual maintenance materials costs are the major components of the total O&M costs which is estimated at $396,000 per year. This represents a cost of 41.8 cents per 1,000 SCF of gas treated (148 cents per 100 m^ treated), assuming a load factor of 90 percent The annualized cost of the total capital at an annual rate of return of 5 percent for 5 years is $269,000 (28.5 cents per 1,000 SCF). The total annualized cost is thus estimated at $665,000 (70.3 cents per 1,000 SCF). The total present worth for this alternative is estimated at $2,880,000.
4.3.2 Case 2D - Sponge Adsorption/ Regeneration Using Steam and Biodegradation
Table 4-9 presented a summary of capital costs for Case 2D, the use of Dow XU sorbent and thermal regeneration using steam and biodegradation. The major equipment include sponge adsorbers, GAC adsorbers, and equipment associated with steam regeneration and the Envirex biodegradation system subcontract The most expensive equipment are sponge adsorbers at $403,000 for three units, including Dow XU sorbent and the Envirex biodegradation system at $495,000. The major equipment cost is estimated at $1,080,000. Including installation costs, site preparation, piping and instrumentation, indirect field cost EPCM, and contingencies, the total capital cost is estimated at $ 1,870,000.
Table 4-10 presents a summary of the O&M costs, the total annualized costs and the total present worth for this alternative. Electricity, operating labor, annual maintenance materials costs, natural gas and disposal of CVOCs are the major components of the total O&M costs which is estimated at $735,000 per year. This represents a cost of 77.4 cents per 1,000 SCF of gas treated (274 cents per 100 nw treated) assuming a load factor of 90 percent The annualized cost of the total capital at an annual rate of return of 5 percent for 5 years is $431,000 (45.6 cents per 1,000 SCF). The total annualized cost is thus estimated at $1,170,000 (123 cents per 1,000 SCF). The total present worth for this alternative is estimated at $5,050,000.
4.3.3 Case 2R - GAC Adsorption/Off-Site Regeneration
Table 4-11 presents a summary of capital costs for Case 2R, the use of GAC adsorption and off-site regeneration of spent GAC. The major purchased equipment include knock-out drum, GAC adsorbers and air heater. The most expensive equipment are the GAC adsorbers. The major equipment cost is estimated at $85,900. Including installation costs, site preparation, piping and instrumentation, indirect field cost, EPCM, and contingencies, the total capital cost is estimated at $248,000.
Table 4-12 presents a summary of the O&M costs, the total annualized costs and the total present worth for this alternative. Electricity, labor, and spent vapor phase GAC replacement costs are the major components of the total O&M costs which is estimated at $1,380,000 per year. This represents a cost of 146 cents per 1,000 SCF of gas treated (515 cents per 100 m^ treated). The annualized cost of the total capital at an annual rate of return of 5 percent for 5 years is $57,300 (6.1 cents per 1,000 SCF). The total annualized cost is thus estimated at $1,439,000 (152 cents per 1,000 SCF). The total present worth for this alternative is estimated at $6,220,000.
Evaluation of Organic Sponges for CVOC Abatement 4-5
in-65

Capital and Operating and Maintenance Cost Estimates
4.4 COMPARISON OF ESTIMATED COSTS
Table 4-13 presents a comparison of estimated costs for the treatment alternatives considered. For each alternative case considered, estimated costs of capital, present worth, annual O&M, and total annualized costs are summarized. Figure 4-1 presents a graphical comparison of the capital charges, the annual O&M costs and the total annualized costs.
4.4.1 Comparison for Low TCE Concentration
As presented in Table 4-13, at a TCE concentration of 30 ppmv in AS exhaust, the total capital costs are lowest for GAC adsorption at $187,000, and are highest for sponge adsorption using Ambersorb as sorbent, at $1,410,000. Sponge adsorption using Dow XU as sorbent would require a capital cost of $1,170,000. The annual O&M costs are the lowest for Case 1 A, using Dow XU sorbent, and are highest for Case 1R, using GAC adsorption. The total annualized costs are the sum of the annual O&M costs and the capital amortization. The total annualized costs are lowest for Case 1 A, using Dow XU sorbent or for Case 1R (GAC adsorption) at $307,000 and are highest for Case IB at $363,000.
The major differences for Case IB as compared to Case 1A are as follows:
• Ambersorb costs $35/lb versus $25/lb for Dow XU sorbent. In addition, a larger motor to replace the existing AS blower motor and a larger regeneration blower are required due to the higher pressure drop through Ambersorb. These both result in a higher capital cost and operating costs for Case IB.
• Ambersorb has a higher adsorption capacity than Dow sorbent for TCE at 30 ppmv concentration. However, due to a longer time required for regeneration of Ambersorb, regeneration operating costs are higher for Case IB.
The major differences for Case 1R as compared to Case 1A or IB are as follows:
• Case 1R has a significantly lower capital cost than Cases 1A or IB.
• Case 1R has a significantly higher operating cost than either of Cases 1A or IB.
• Although Case 1A has a higher capital cost than Case 1R, Case lA's lower operating costs compensate for its capital charges and thus Case 1A results in about the same present worth as Case 1R. The present worth of Case IB is higher than that of Case 1R.
• The use of Dow XU sorbent appears to offer competitive costs to the use of GAC adsorption at a TCE concentration of 30 ppmv in AS exhaust The use of Ambersorb 563 sorbent appears to be less favorable than that for the use of Dow XU sorbent It should be pointed out that both Cases 1A and IB have not been optimized for parameters such as the amount of sorbent in each vessel or the optimum refrigeration temperature. The amount of sorbent in each adsorption vessel, and thus the size of the vessel, could be reduced to match the frequency of regeneration expected. Better understanding of a site-specific project could develop the basis for such optimization. Future phases of this project should consider optimization of these parameters.
The rate of return on money is an important parameter for determining the total annualized costs or the total present worth of the alternative cases. Figure 4-2 presents a graphical comparison of the total annualized costs as a function of rate of return on money for Cases 1 A, IB and 1R, when the
Evaluation of Organic Sponges for CVOC Abatement 4-6
m-66

Capital and Operating and Maintenance Cost Estimates
annual rate of return is varied from 5 percent to 15 percent. As can be seen, at higher rates of return, Cases 1A or IB (as currently designed) can become less favorable than Case 1R. This is due to the higher capital cost required for Cases 1A and IB when compared with Case 1R.
4.4.2 Comparison for High TCE Concentration
As presented in Table 4-13, at a TCE concentration of 400 ppmv in AS exhaust, the total capital costs are lowest for Case 2R - GAC adsorption at $248,000, and are highest for Case 2D using sponge adsorption and Dow as sorbent and regeneration with steam and biodegradation of condensate at $1,870,000. Sponge adsorption using Dow XU as sorbent and regeneration with hot nitrogen would require a capital cost of $1,170,000. The annual O&M costs are the lowest for Case 2A using Dow XU sorbent and are highest for Case 2R, using GAC adsorption. The total annualized costs are the sum of the annual O&M costs and the capital amortization. The total annualized costs are lowest for Case 2A at $665,000 and are highest for Case 2R at $1,440,000. The total annualized cost for Case 2D is $1,170,000.
The major differences for Case 2R as compared to Cases 2A or 2D are as follows:
• Case 2R has a significantly lower capital cost than Cases 2A or 2D.
• Case 2R has a significantly higher operating cost than Cases 2A or 2D.
Q Although Case 2A has a higher capital cost than Case 2R, the lower operating costs for Case 2A more than compensate for its capital charges; thus Case 2A results in a lower present worth than Case 2R. Present worth of Case 2D is higher than that of Case 2A but remains lower than that of Case 2R.
• The use of Dow XU sorbent appears to offer significant economic advantage to the use of GAC adsorption. It should be pointed out that Cases 2A has not been optimized for parameters such as the amount of sorbent in each vessel or selection of the optimum refrigeration temperature. The amount of sorbent in each adsorption vessel, and thus the size of the vessel, could be reduced to match the frequency of regeneration expected. A better understanding of a site-specific project could identify the basis for such optimization. Future phases of this project should consider optimization of these parameters.
• Case 2D considers the use of the Envirex biodegradation system for treatment of steam condensate saturated with TCE. Direct use of die liquid phase GAC adsorption appears to • be an alternative that may have a slightly lower cost than the use of biodegradation system for this application. The primary advantage of the use of Envirex biodegradation system is that CVOCs are converted to carbon dioxide and water, benign products. The formation of small amounts of acids is neutralized by the addition of caustic.
The rate of return on money is an important parameter for deterrnining the total annualized costs and the total present worth of the alternative cases. Figure 4-3 presents a graphical comparison of the total annualized costs as a function of rate of return on money for Cases 2A, 2D and 2R, when the annual rate of return is varied from 5 percent to 15 percent As can be seen, at the higher rates of return, both Cases 2A and 2D and especially Case 2A remain to be more competitive than Case 2R. The reason is that although the capital costs are higher for Cases 2A and 2D, the short amortization period of 5 years does not cause significantly higher capital charges so as to change the relative ranking of the total annualized costs for these cases.
Evaluation of Organic Sponges for CVOC Abatement 4-7
ra-67

Table 4-1 Major Parameters for Estimating the Operating and Maintenance (O&M) Costs,
Annualized Costs, and Present Worth
Parameters for Operating and Maintenance Cost Calculations Parameter Value
Annual Load Factor 90% Annual Quantity of Exhaust Air Treated 946 MMSCF
(26,800,000 m3) Cost of Electricity $0.08/kWh Labor Cost (Fully Burdened Rates)
Supervising $70/hr O&M $50/hr
O&M Labor Required, Operation Assumed as Part of an Existing Site (a) Case 1A or IB, Supervising/O&M 520 hrs/2080 hrs Case 1R, Supervising/O&M 520 hrs/ 1040 hrs Case 2A, Supervising/O&M 520 hrs/4160 hrs Case 2D, Supervising/O&M 1040 hrs/ 8650 hrs Case 2R, Supervising/O&M 520 hrs/ 2080 hrs
Annual Maintenance Materials and Labor Costs @ 2% of Total Capital Cost Regeneration Time/Frequency Required
Case 1A 25 hrs every 6 days Case IB 9 days every 19 days Case 1R (frequency of replacement of 6000 lbs of spent GAC) Every 27 days Case2A 20 hrs every 2 days Case 2D Around the clock Case 2R (frequency of replacement of 12,000 lbs of spent GAC) Every 8.1 days
Nitrogen Gas S15/MSCF CVOC Disposal $0.50/lb Virgin Vapor Phase GAC (Calgon BPL 4X6) $2/lb Virgin Liquid Phase GAC (Calgon Filtrasorb 300) $l/lb Spent Vapor Phase GAC Replacement $2.50/lb Spent Liquid Phase GAC Replacement S2/lb Dow XU43502.1 Adsorbent $25/lb Ambersorb 563 Adsorbent S35/lb Natural Gas $2.50/MMBtu City Water $2/Mgal Cooling Water (allowance) $0.20/Mgal Phenol $0.32/lb Caustic Soda $0.30/lb Nutrients $0.30/lb
Parameters for Calculation of Annualized Costs and Present Worth Parameter Value
Project Life Case 1A, IB, and 1R (TCE Concentration = 30 ppmv) 20 years Cases 2A, 2D, & 2R (TCE Concentration = 400 ppmv) 5 years
Rate of Return on Money per Annum 5%
(a) Continuous monitoring would be required for any first demonstration plant for Cases 1 A, IB, 2A or 2D.
Assump.-O&M Costs 3/23/94 1:34 PM in-68

Table 4-2 Capital Cost Estimate Summary
Air Stripper Exhaust Treated by Sponge Adsorption/Thermal Regeneration -Case 1A & 2A: Sorbent: Dow XU, AS Exhaust TCE Concentration = 30 & 400 ppmv
Item/Description Quantity Major Installation Total Cost (each) Equipment
($) Labor
($) ($)
Major Mechanical Equipment Knock-out Drum 1 10,400 1,300 11,700 Sponge Adsorbers (1) 3 402,600 3,800 406,400 GAC Adsorbers 2 42,400 2,500 44,900 Phase Separator 1 12,400 1,300 13,700 Liquid Phase GAC Adsorbers 2 12,000 1,300 13,300 Equalization Tank 1 1,500 300 1,800 CVOC Storage Tank 1 1,000 300 1,300 Hot Oil Storage Tank 1 1,000 300 1,300 Air Heater 1 8,400 600 9,000 Hot Oil Heater 1 15,000 600 15,600 Regeneration Gas Heater 1 12,000 600 12,600 Heat Recovery Exchanger 1 13,500 600 14,100 Chiller 1 16,000 600 16,600 Refrigeration Package 1 29,500 uoo 30,800 Hot Oil Pump 2 2,000 500 2,500 Condensate Pump 1 1,000 300 uoo Regeneration Blower 1 12,000 1,300 13,300 Modification to AS Blower 1 8,000 1,900 9,900
Total Major Mech. Equip. Cost 23 $600,700 $19,400 $620,100
Civil and Site Preparation $60,000 Piping, Electrical, & Instrumentati on
traction Mc magement (EPCM)
$91,200 Total Direct Field Cost
on
traction Mc magement (EPCM)
$771,300
Indirect Field Cost
on
traction Mc magement (EPCM)
$40,100
Total Field Cost
on
traction Mc magement (EPCM)
$811,400
Engineering, Procurement & Com
on
traction Mc magement (EPCM) $202,900 Contingency
(rounded) $152,100
Total Capital Cost (rounded) $1,166,000 (rounded)
Notes: Major equipment includes adsorbent as required. Sponge adsorbers equipment cost includes the cost for Dow XU sorbent ($25/lb, 5,000 lbs per adsorber). Indirect field costs include construction equipment & supplies, temporary facilities & contractor's overhead & profit Engineering, procurement and construction management are assumed at 25% of total field cost. Contingency is calculated as 15% of the sum of total field cost and EPCM.
Capital Cost- Case 1A 2/28/94 7:02 PM m-69 4-9

Table 4-3 Air Stripper Exhaust Treated by Sponge Adsorption System/Thermal Regeneration -
Summary of Operating and Maintenance Costs, Total Annualized Costs and Total Present Worth Case 1 A: Sorbent: Dow XU, AS Exhaust TCE Concentration = 30 ppmv
Item/Description Rate Annual Usage Costs
($) (cents /1.000SCF)
(cents /100 m3)
$25,800 $11,000
2.70 1.20
9.60 4.10
$36,400 $104,000
3.80 11.00
13.60 38.80
Electricity Major Equipment, Normal Operation Major Equipment, Regeneration Cycle
Labor Supervising O&M
Annual Maintenance Materials % of Total Capital Requirement
Materials and Supplies Nitrogen Makeup CVOV Disposal Spent Vapor Phase GAC Replacement Spent Liquid Phase OAC Replacement
$0.08 /kWhr $0.08 /kWhr
$70 /hr $50 /hr
2%
323,000 kWhr 138,000 kWhr
520 hr 2,080 hr
Total Annual Operating & Maintenance Costs
$23,300 2.50
$213,600 2250
8.70
$15.00 /MSCF 88 MSCF $1,300 0.10 0.50 $0.50 /lb 9,9001b $5,000 0.50 1.80 $2.50 /lb 2,400 1b $6,000 0.60 2.20 $2.00 /lb 4001b $800 0.10 0.30
79.60
Annualized Costs Total Capital Cost $1,166,000
Rate of Return on Money 5% Years 20
Annualized Cost Factor 0.080
Annualized Cost of Capital $93,600
Total Annualized Cost (rounded) | $307,000"
9.90
32.40
34.90
11450
Present Worth Present Worth Factor 12.46
Present Worth of O&M Costs $2,660,000
Total Present Worth (rounded) | $3,830,000]
Case 1A-OAM Cost 3W94 6:58 PM

Table 4-4 Capital Cost Estimate Summary
Air Stripper Exhaust Treated by Sponge Adsorption/Thermal Regeneration • Case IB: Sorbent: Ambersorb, AS Exhaust TCE Concentration = 30 ppmv
Item/Description Quantity Major Installation Total Cost (each) Equipment
($) Labor
($) ($)
Major Mechanical Equipment Knock-out Drum 1 10,400 1,300 11,700 Sponge Adsorbers (1) 3 557,400 3,800 561,200 GAC Adsorbers 2 42,400 2,500 44,900 Phase Separator 1 12,400 1,300 13,700 Liquid Phase GAC Adsorbers 2 12,000 1,300 13,300 Equalization Tank 1 1,500 300 1,800 CVOC Storage Tank 1 1,000 300 1,300 Hot Oil Storage Tank 1 1,000 300 1,300 Air Heater 1 8,400 600 9,000 Hot Oil Heater 1 15,000 600 15,600 Regeneration Gas Heater 1 10,000 600 10,600 Heat Recovery Exchanger 1 13,500 600 14,100 Chiller 1 16,000 600 16,600 Refrigeration Package 1 29,500 uoo 30,800 Hot Oil Pump 2 2,000 500 2,500 Condensate Pump 1 1,000 300 1,300 Regeneration Blower 1 16,000 UOO 17,300 Modification to AS Blower 1 12,000 1,900 13,900
Total Major Mech. Equip. Cost 23 $761,500
Civil and Site Preparation Piping, Electrical, & Instrumentation
Total Direct Field Cost
Indirect Field Cost
Total Field Cost
Engineering, Procurement & Construction Management (EPCM)
Contingency Total Capital Cost
$19,400 $780,900
$60,000 $96,200
$937,100
$41,000
$244,500
$183,400
$978,100 1
(rounded) | $1,406,000"
Notes: 1. Major equipment includes adsorbent as required. Sponge adsorbers equipment cost includes
the cost for Ambersorb 563 ($35/lb, 5,000 lbs per adsorber). 2. Indirect field costs include construction equipment & supplies, temporary facilities &
contractor's overhead & profit. 3. Engineering, procurement and construction management are assumed at 25% of total field cost 4. Contingency is calculated as 15% of the sum of total field cost and EPCM.
Capital Coat- Case 1B 2/28/94 7:04 PM m-71 4-11

Table 4-5 Air Stripper Exhaust Treated by Sponge Adsorption System/Thermal Regeneration -
Summary of Operating and Maintenance Costs, Total Annualized Costs and Total Present Worth Case IB: Sorbent: Ambersorb, AS Exhaust TCE Concentration = 30 ppmv
Item/Description Rate Annual Usage Costs
($) (cents /1.000SCF)
(cents /100m3)
19,100 430,500
4.10 3.20
14.60 11.40
$36,400 $104,000
3.80 11.00
13.60 38.80
-J
Electricity Major Equipment, Normal Operation Major Equipment, Regeneration Cycle
Labor Supervising O&M
Annual Maintenance Materials % of Total Capital Requirement
Materials and Supplies Nitrogen Makeup CVOV Disposal Spent Vapor Phase GAC Replacement Spent Liquid Phase GAC Replacement
$0.08 /kWhr $0.08 /kWhr
$70 /hr $50 /hr
2%
489,000 kWhr 381,000 kWhr
520 hr 2,080 hr
Total Annual Operating & Maintenance Costs
$28,100 3.00
$250,300 26.30
10.50
$15.00 /MSCF 28 MSCF $400 0.00 0.20 $0.50 /lb 9,900 1b $5,000 0.50 1.80 $2.50 /lb 2,400 1b $6,000 0.60 2.20 $2.00 /lb 4001b $800 0.10 0.30
93.40
Annualized Costs Total Capital Cost
Rate of Return on Money 5% Years 20
Annualized Cost Factor 0.08
$1,406,000
Annualized Cost of Capital
Total Annualized Cost (rounded)
$112,800
$363,000
11.90
38.20
42.10
135.50 |
•
Present Worth Present Worth Factor 12.46
Present Worth of O&M Costs $3,120,000
Total Present Worth (rounded) | $4,530,000"
Case IB-O&M Cost 3/4/04 7:01 PM

Table 4-6 Capital Cost Estimate Summary
Air Stripper Exhaust Treated by GAC Adsorption/Off-Site Regeneration Case 1R: Sorbent: GAC BPL, AS Exhaust TCE Concentration = 30 ppmv
Item/Description Quantity (each)
Major Equipment
($)
Installation Labor
($)
Total Cost ($)
Major Mechanical Equipment Knock-out Drum GAC Adsorbers (1) Air Heater Modification to AS Blower
1 2 1 1
10,400 42,400
8,400 3,500
1,300 2,500
600 600
11,700 44,900
9,000 4,100
Total Major Mech. Equip. Cost
Civil and Site Preparation Piping, Electrical, & Instrumentat
5 $64,700
ion
'truction Management (EPCM)
$5,000
1
1
(rounded)
$69,700
$30,000 $18,800
Total Direct Field Cost
5 $64,700
ion
'truction Management (EPCM)
$5,000
1
1
(rounded)
$118,500 |
Indirect Field Cost
5 $64,700
ion
'truction Management (EPCM)
$5,000
1
1
(rounded)
$11,800
Total Field Cost
5 $64,700
ion
'truction Management (EPCM)
$5,000
1
1
(rounded)
$130,300 |
Engineering, Procurement & Com
Contingency
5 $64,700
ion
'truction Management (EPCM)
$5,000
1
1
(rounded)
$32,600
$24,400
Total Capital Cost
5 $64,700
ion
'truction Management (EPCM)
$5,000
1
1
(rounded) $187,000
5 $64,700
ion
'truction Management (EPCM)
$5,000
1
1
(rounded)
Notes; 1. GAC adsorbers equipment cost includes the cost of virgin GAC ($2/lb, 6,0001bs per adsorber). 2. Indirect field costs include construction equipment & supplies, temporary facilities &
contractor's overhead & profit 3. Engineering, procurement and construction management are assumed at 25% of total field cost. 4. Contingency is calculated as 15% of the sum of total field cost and EPCM.
Capital Cost- Case 1R3/2/94 5:55 PM m-73 4-13

Table 4-7 Air Stripper Exhaust Treated by GAC Adsorption System/Off-Site Regeneration -
Summary of Operating and Maintenance Costs, Total Annualized Costs and Total Present Worth CaselR: Sorbent: GAC BPL, AS Exhaust TCE Concentration = 30 ppmv
Item/Description Rate Annual Usage Costs
($T (cents /l,0OOSCF)
(cents /100m3)
Electricity Major Equipment, Normal Operation
Labor Supervising O&M
Annual Maintenance Materials % of Total Capital Requirement
Materials and Supplies Spent Vapor Phase. O AC Replacement
$0.08 /lcWhr 205,000 kWhr $16,400 1.70 6.10
$70 /hr $50 /hr
520 hr 1,040 hr
$36,400 $52,000
3.80 5.50
13.60 19.40
2% $3,700 0.40 1.40
$2.50 /lb 73,000 lb $183,000 19.30 68.10
Total Annual Operating & Maintenance Costs $291,500 30.70 108.60 |
Annualized Costs Total Capital Cost $187,000
Rate of Return on Money 5% Years 20
Annualized Cost Factor 0.08
Annualized Cost of Capital $ 15,000
Total Annualized Cost (rounded) | $307,000"
1.60
32.30
5.60
114.20
Present Worth Present Worth Factor 12.46
Present Worth of O&M Costs $3,630,000
Total Present Worth (rounded) | $3,820,0001
Case 1 R-O&M Cost 3/4/94 7:05 PM

Table 4-8 Air Stripper Exhaust Treated by Sponge Adsorption System/Thermal Regeneration -
Summary of Operating and Maintenance Costs, Total Annualized Costs and Total Present Worth Case 2A: Sorbent: Dow XU, AS Exhaust TCE Concentration = 400 ppmv
Item/Description Costs
te Annual Usage ($) (cents /1.000SCF)
(cents /100m3)
$0.08 /kWhr $0.08 /kWhr
323.000 kWhr 332,000 kWhr
$25,800 $26,600
2.7* 2.80
9.6* 9.9*
$70 /hr $50 /hr
520 hr 4,160 hr
$36,400 $208,000
3.8* 22.0*
13.6* 77.6*
•~1
Electricity Major Equipment, Normal Operation Major Equipment, Regeneration Cycle
Labor Supervising O&M
Annual Maintenance Materials % of Total Capital Requirement
Materials and Supplies Nitrogen Makeup CVOV Disposal Spent Vapor Phase GAC Replacement Spent Liquid Phase GAC Replacement
2%
Total Annual Operating & Maintenance Costs
$23,300 2.5*
$396,400 41.8*
8.7*
$15.00 /MSCF 263 MSCF $3,900 0.4* 1.5* $0.50 /lb 131,100 lb $65,600 6.9* 24.5* $2.50 /lb 2,400 1b $6,000 0.6* 2.2* $2.00 /lb 4001b $800 0.1* 0.3*
147.9*
Annualized Costs Total Capital Cost
Rate of Return on Money 5% Years 5
Annualized Cost Factor 0.23
Annualized Cost of Capital
Total Annualized Cost (rounded)
$1,166,000
$269,000 28.5*
$665,000 70.3*
100.5*
248.4* |
Present Worth Present Worth Factor 4.33
Present Worth or O&M Costs $ 1,716,000
Total Present Worth (rounded) | $2,880,0001
Case 2A-Q&M Cost 3/4/94 7:07 PM

Table 4-9 Capital Cost Estimate Summary
Air Stripper Exhaust Treated by Sponge Adsorption System Regeneration Using Steam/Biodegradation -
Case 2D: Sorbent: Dow XU, AS Exhaust TCE Concentration = 400 ppmv
Item/Description Quantity Major Installation Total Cost (each) Equipment
($) Labor
($) ($)
Major Mechanical Equipment Knock-out Drum 1 10,400 1,300 11,700 Sponge Adsorbers (1) 3 402,600 3,800 406,400 GAC Adsorbers 2 42,400 2,500 44,900 Dua Media Filter 1 6,000 1,300 7,300 Liquid Phase GAC Adsorbers 2 12,000 1,300 13,300 Equalization Tank, (2D-D-1) 1 28,000 1,300 29,300 Equalization Tank, (2D-D-2) 1 3,200 600 3,800 CVOC Storage Tank 1 1,000 300 1,300 Air Heater 1 8,400 600 9,000 Condenser 1 25,000 1,300 26,300 Steam Generator 1 35,000 1,300 36,300 Polishing Pump 1 1,000 600 1,600 Modification to AS Blower 1 8,000 1,900 9,900 Envirex Biodegradation System (S/C) 1 495,000 495,000
Total Major Mech. Equip. Cost 18 $1,078,000 $18,100 $1,096,100
Civil and Site Preparation $83,000 Piping, Electrical, & Instrumentation
i Managem ent
$79,400
Total Direct Field Cost
i Managem ent
$1,258,500
Indirect Field Cost
i Managem ent
$39,800
Total Field Cost
i Managem ent
$1,298,300
Engineering, Procurement & Constructioi i Managem ent $324,600
Contingency
(rounded)
$243,400
Total Capital Cost (rounded) $1,866,000 (rounded)
Notes: 1. Major equipment includes adsorbent as required. Sponge adsorbers equipment cost includes
the cost for Dow XU sorbent ($25/lb, 5,000 lbs per adsorber). 2. Indirect field costs include construction equipment & supplies, temporary facilities &
contractor's overhead & profit 3. Engineering, procurement and construction management are assumed at 25% of total field cost 4. Contingency is calculated as 15% of the sum of total field cost and EPCM.
Capital Cost- Case 2D 2/28/94 7:08 PM 1H-76 4-16

Table 4-10 Air Stripper Exhaust Treated by Sponge Adsorption System/Regeneration Using Steam/ Biodegradation •
Summary of Operating and Maintenance Costs, Total Annualized Costs and Total Present Worth Case 2D: Sorbent: Dow XU, AS Exhaust TCE Concentration = 400 ppmv
Costs Item/Description ite Annual Usage ($) (cents
/1.000SCF) (cents
/100m3)
$0.08 /kWhr $0.08 /kWhr
323,000 kWhr 181,000 kWhr
$25,800 $14,500
170 1.50
9.60 5.40
$70 /hr $50 /hr
520 hr 8,650 hr
$36,400 $433,000
3.80 45.70
13.60 161.50
Electricity Major Equipment, Normal Operation Major Equipment, Regeneration Cycle
Labor Supervising OAM
Annual Maintenance Materials % of Total Capital Requirement
Materials and Supplies Natural Gas Water for Steam Generator Cooling Water (allowance) Nutrients Phenol Caustic Soda (50% by weight solution) CVOV Disposal Spent Vapor Phase G AC Replacement Spent Liquid Phase GAC Replacement
2%
$150 /MMBtu $100 /Mgal $0.20 /Mgal $1.50 /gal $0.32 /lb $0.30 /lb $0.50 /lb $150 /lb $100 /lb
30,600 MMBtu 2,460 Mgal
139,000 Mgal 1,080 gal
22,600 lb 20,700 lb
108,600 lb 2,400 1b 1,540 lb
$37300 3.90
$77,000 8.10 $4,900 0.50
$28,000 190 $1,600 0.20 $7,200 0.80 $6,200 0.70
$54300 5.70 $6,000 0.60 $3,100 0.30
13.90
28.60 1.80 10.40 0.60 2.70 2.30
20.30 2.20 1.10
Total Annual Operating & Maintenance Costs | $735300 77.40 274.00
Annualized Costs Total Capital Cost $1,866,000
Rate of Return on Money 5% Years 5
Annualized Cost Factor 0.23
Annualized Cost of Capital $431,000 45.60
Total Annualized Cost (rounded) [ $1,166,000 123.67"
160.90
434.90 |
Present Worth Present Worth Factor 4.33
Present Worth of O&M Costs $3,179,000
Total Present Worth (rounded) | $5,050,000"!
C M » 2 T > O S M Coat 3QA4 527 PU

Table 4-11 Capital Cost Estimate Summary
Air Stripper Exhaust Treated by GAC Adsorption/ Off-Site Regeneration -Case 2R: Sorbent: GAC BPL, AS Exhaust TCE Concentration = 400 ppmv
Item/Description Quantity (each)
Major Equipment
($)
Installation Labor
($)
Total Cost ($)
Major Mechanical Equipment Knock-out Drum 1 GAC Adsorbers (1) 3 Air Heater 1 Modification to AS Blower 1
10,400 63,600 8,400 3,500
1,300 3,800
600 600
11,700 67,400 9,000 4,100
Total Major Mech. Equip. Cost 6
Civil and Site Preparation Piping, Electrical & Instrumentation
$85,900
magement (EPCM)
$6,300
(rounded)
$92,200
$42,000 $23,000
Total Direct Field Cost
$85,900
magement (EPCM)
$6,300
(rounded)
$157,200 |
Indirect Field Cost
$85,900
magement (EPCM)
$6,300
(rounded)
$15,600
Total Field Cost
$85,900
magement (EPCM)
$6,300
(rounded)
$172,800 |
Engineering, Procurement & Construction Mc
Contingency
$85,900
magement (EPCM)
$6,300
(rounded)
$43,200
$32,400
Total Capital Cost
$85,900
magement (EPCM)
$6,300
(rounded) $248,000
$85,900
magement (EPCM)
$6,300
(rounded)
Notes: 1. GAC adsorbers equipment cost includes the cost of virgin GAC ($2/lb, 6,000 lbs per adsorber). 2. Indirect field costs include construction equipment & supplies, temporary facilities &
contractor's overhead & profit 3. Engineering, procurement and construction management are assumed at 25% of total field cost. 4. Contingency is calculated as 15% of the sum of total field cost and EPCM.
Capital Cost- Case 2R 3/2/94 5:54 PM IU-78 4

Table 4-12 Air Stripper Exhaust Treated by GAC Adsorption System/Off-Site Regeneration -
Summary of Operating and Maintenance Costs, Total Annualized Costs and Total Present Worth Case2R: Sorbent: GAC BPL, AS Exhaust TCE Concentration = 400 ppmv
Item/Description Rate Annual Usage Costs
W (cents /1.000SCF)
(cents /100m3)
Electricity Major Equipment, Normal Operation
Labor Supervising O&M
Annual Maintenance Materials % of Total Capital Requirement
Materials and Supplies Spent Vapor Phase O AC Replacement
$0.08 /kWhr 205,000 kWhr $16,400 1.7* 6.1*
$70 /hr $50 /hr
520 hr 2,080 hr
$36,400 $104,000
3.8* 11.0*
13.6* 38.8*
2% $5,000 0.5* 1.9*
$2.50 /lb 487,000 lb $1,220,000 128.7* 454.5*
Total Annual Operating & Maintenance Costs | $1,381,800 14S.7*~ 514.9*
Annualized Costs Total Capital Cost $248,000
Rate of Return on Money 5% Years 5
Annualized Cost Factor 0.23
Annualized Cost of Capital $57,300 6.1* 21.4*
Total Annualized Cost (rounded) | $1/139,000 151.8* S363*~
Present Worth Present Worth Factor
Present Worth of O&M Costs
4.33
$5,971,000
Total Present Worth (rounded) | $6,220,000]
Case 2RO&M Cost 2/28/94 7:39 PM

Table 4-13 Comparison of Estimated Costs for the Treatment Cases Considered
Project Total Capital Total Annual Total Unit Costs Case Description Life Cost Present Worth O&M Costs Annualized Costs (cents (cents
(Years) ($) ($) ($) ($) /LOOOSCF) /100m3)
1A Sponge AdsorptionAThermal Regeneration 20 $1,166,000 $3,830,000 $214,000 TCE Cone. = 30 ppmv, Sorbent: Dow XU
IB Sponge Adsorption/Thermal Regeneration 20 $1,406,000 $4,530,000 $250,000 TCE Cone. = 30 ppmv, Sorbent: Ambersorb
1R GAC Adsorption/Off-Site Regeneration 20 $187,000 $3,820,000 $292,000 TCE Cone. = 30 ppmv, Sorbent: GAC BPL
$307,000 32.40 114.50
$363,000 38.20 135.50
$307,000 32.30 114.20
$665,000 70.30 248.40
$1,166,000 123.00 434.90
$1,439,000 151.80 536.30
00 o
2A Sponge Adsorption/Thermal Regeneration 5 $1,166,000 $2,880,000 $396,000 TCE Cone. = 400 ppmv, Sorbent: Dow XU
2D Sponge AdsorpTRegen. Using Steam/Biodeg. 5 $1,866,000 $5,050,000 $735,000 TCE Cone. = 400 ppmv, Sorbent: Dow XU
2R GAC Adsorption/Off-Site Regeneration 5 $248,000 $6,220,000 $1,382,000 TCE Cone. = 400 ppmv, Sorbent: GAC BPL
^ S
CapHal/O&M Cod Compar. 3/2/94 6:34 PM

H I 00
$1,400,000"
$1,200,000-
§ $1,000,000 in O o c c <
§ $800,000
$600,000
$400,000
$ 2 0 0 , 0 0 0 "
$0
Legend:
Annual O&M Costs
Capital Charges
Total Annualized Costs
1
Case 1A Case 1B Case 1R Case 2A Case 2D Case 2R
Figure 4-1 Comparison off Annual O&M Costs and Total Annualized Costs for the Treatment Cases Considered
to

$500,000
$450,000 --
$400,000 --
$350,000
$300,000 i
$250,000 - -
$200,000 - -
$150,000 . .
$100,000 -|-
$50 ,000
$ 0
5%
Case 1B
Case 1A
— • -Cass 1R
Case 1A Case 1B • Case 1R
10% 15%
Annual Rate of Return
Figure 4-2 Total Annualized Costs as a Function of Rate of Return for Cases 1A, 1Band 1R

d C
osts
$1,600,000 -,
$1 ,400,000 .
$1 ,200,000 (
I d
Cos
ts
$1,600,000 -,
$1 ,400,000 .
$1 ,200,000 (
Case 2R . 1
d C
osts
$1,600,000 -,
$1 ,400,000 .
$1 ,200,000 (
Case 2D
lize $1,000,000 •
1 Ann
ua
$800,000 •
$600,000 •
—•
1 Ann
ua
$800,000 •
$600,000 • Case 2A • Case 2A
,2 $400,000 . ,2 $400,000 . • case 2D
$200,000 . • Case 2R o
$ 0 . 1 00 $ 0 . 1
5% 10%
Annual Rate of Return 15%
Figure 4-3 Total Annualized Costs as a Function of Rate of Return for Cases 2A, 2D and 2R
to


Section 5
Conclusions
The major conclusions of this evaluation for treatment of AS exhaust at a concentration of 30 ppmv are as follows:
• The sponge adsorption process using Ambersorb 563 results in a higher capital cost than the process using Dow XU sorbent because Ambersorb is a more expensive sorbent The use of Ambersorb also results in a higher pressure drop in the main exhaust treatment train as well as the regeneration train. Although Ambersorb's adsorption capacity is higher at the TCE concentration of 30 ppmv, it requires a relatively longer regeneration time when compared with Dow XU sorbent The total annualized costs and present worth remain higher than those for the use of Dow sorbent due to the higher capital and O&M costs.
• The sponge adsorption process using Dow XU sorbent and hot nitrogen regeneration offers competitive costs to the use of commercially available GAC adsorption system with off-site regeneration of spent GAC. The GAC adsorption process has a significantly lower capital cost than the process using Dow XU sorbent. However, GAC adsorption has significantly higher O&M costs. The lower O&M costs for the sponge adsorption process using Dow sorbent compensates for its higher capital charges and thus is shown to have about the same total annualized costs and present worth as for the use of GAC adsorption process at a rate of return of 5 percent per annum. At higher rates of return ranging from 10 to 15 percent per annum, the use of sponge adsorption process becomes less attractive than that for GAC adsorption process.
The major conclusions of this evaluation for treatment of AS exhaust at a concentration of 400 ppmv are as follows:
• At the higher TCE concentration of 400 ppmv in the exhaust, the use of Dow XU sorbent becomes significantly more attractive than that for Ambersorb due to the higher capital cost required for the case using Ambersorb and the excessive time required to desorb TCE from Ambersorb.
• The sponge adsorption process using Dow XU sorbent and hot nitrogen regeneration offers a significant economic advantage over the use of GAC adsorption. The reason is that at higher TCE concentrations, GAC usage increases and thus the cost of spent GAC replacement becomes very high, whereas the cost for thermal regeneration does not go as high. The GAC adsorption process has a significantly lower capital cost than the process using Dow XU sorbent However, GAC adsorption has significantly higher O&M costs. The lower O&M costs for the sponge adsorption process using Dow sorbent more than compensates for its higher capital charges and thus is shown to have a lower total annualized costs and present worth at a rate of return of 5 percent per annum. At higher rates of return ranging from 10 to 15 percent per annum, the use of sponge adsorption process remains more attractive than that for GAC adsorption process.
Evaluation of Organic Sponges for CVOC Abatement 5-1
m-85

Conclusions
Q The sponge adsorption process using Dow XU sorbent combined with steam regeneration and the Envirex biodegradation scheme for treatment of steam condensate is less attractive than that for straight thermal regeneration using hot nitrogen. This process results in a higher capital cost and also a higher present worth cost than those for hot nitrogen regeneration. For the treatment of condensate, direct use of liquid phase GAC adsorption appears to be an alternative which would have lower cost than that for the use of Envirex biodegradation system.
The major overall conclusions are as follows:
• Based on the technical and economic guidelines set for this report, sponge adsorption is more attractive than GAC adsorption for treatment of high TCE concentrations rather than low TCE concentrations in the exhaust. Soil vapor extraction schemes often have high exhaust CVOC concentrations and would thus be suitable for sponge adsorption systems. Selected air snipper operations dealing with high groundwater concentrations of CVOCs would also be potentially suitable applications.
• Based on relatively conservative assumptions made, a significant reduction in time required for regeneration of sponge is possible. A possibly reduced regeneration time will allow the use of significantly less amounts of sorbent per sponge adsorption vessel. The reduction of sorbent amount in each vessel will result is substantial reduction in capital costs for cases using sponge adsorption units. For example, the capital cost for Case 2A could be reduced at least about 36 percent (to about $750,000 from $1,170,000) when only considering the reduction in the amount of sorbent provided in the adsorption vessels and the reduced cost of the vessels. O&M costs would also be reduced due to the reduced pressure drop across the thinner sorbent beds and the subsequently reduced power required for the air stripper blower and the regeneration blower.
Evaluation of Organic Sponges for CVOC Abatement 5-2
in-86

Section 6
Issues for Further Consideration
Sponge adsorption offers a potentially attractive means for treatment of the air exhaust from AS or soil vapor extraction schemes with high concentration CVOCs. A number of engineering decisions relating to design parameters and product quality have been made during the preparation of the conceptual designs and cost estimates. One of the prime objectives of the Phase n program, Pilot-Scale Demonstration, and Phase in program, Full-Scale Demonstration, should be to validate the assumptions and refine the estimated economics for applying sponge adsorption technology at a DOE site. Potential process improvements and challenges for the future phases of this program are presented below.
6.1 POTENTIAL PROCESS IMPROVEMENTS
A number of process improvements are possible to better utilize the designed equipment and thus reduce capital and operating costs for the alternatives using sponge adsorption. Below is a brief description of the major possible improvements:
• The amount of sorbent in each sponge adsorption vessel and the size of the vessel can be reduced to match the frequency of regeneration required for a given contaminant concentration. Better understanding of the average and maximum contaminant concentration in the exhaust system throughout the project could develop the basis for such optimization.
• Process modeling of the regeneration cycle would provide insight to the optimum temperature used for condensation of CVOCs of concern. Theoretical analysis and optimization of a refrigeration temperature that would result in more efficient recovery of TCE and other CVOCs of concern would be desirable. Computer models such as CHEMCAD or Aspen Plus can be used for the analysis.
• The commercial availability of an adsorption vessel design that can provide in-bed heating should be researched. The major potential advantages of an in-bed heating design for a sponge adsorption system would be to allow rapid heating and cooling of the sorbent and to require only a small stream of nitrogen for sweeping the CVOCs off the spent sponge. The smaller stream of nitrogen would then require a smaller regeneration design flow and thus a potentially reduced capital and operating costs.
• In general, further consideration should be given to sponge adsorber configuration and design, regeneration temperature selection, and setting the flow rate and pressure (vacuum or positive) for operation of the regeneration cycle.
Evaluation of Organic Sponges for CVOC Abatement 6-1
ffl-87

Issues for Further Consideration
6.2 CHALLENGES FOR FUTURE PHASES
A number of challenges face Bechtel and GE/CRD team for undertaking the follow-on phases of this program. The demonstration of the application of organic sponges has been envisioned to be conducted in three phases. These are as follows:
Q Phase I - Laboratory-Scale Evaluation of Sponges for CVOC Abatement
• Phase n - Pilot-Scale Demonstration
• Phase in - Full-Scale Demonstration
The Phase I effort, the main topic addressed in this report, will be used by GE/CRD to develop a final report on this phase. Phase II of this program envisions a sponge adsorption scheme with a capacity of 100 to 200 SCFM of air exhaust either from an existing air stripper operation or from an existing soil vapor extraction system. The process to be demonstrated should be sponge adsorption using Dow XU sorbent and regeneration with hot nitrogen gas, a scaled-down version of the process described in Section 3 for Cases 1A or 2A.
Technical, economic, and other significant issues that would need to be addressed are presented below.
6.2.1 Technical Issues
The pilot- and full-scale development phases of this program should address the technical issues with respect to use of the organic sponge technology for removal of TCE and other CVOCs from vapors. The significant issues are as follows:
• Rate and capacity limitations of the organic sponge for removal of TCE and other CVOC vapors with varying concentrations in the incoming feed.
• Effect of other contaminants on the rate and removal capacity of the sponge. These contaminants may be present in either liquid or vapor phases (poisoning effect).
• Feasibility of procuring acid corrosive resistant components such as heat exchangers for long-term reliability and longevity (5 to 20 years).
• Reliability and regeneration capability of the organic sponge and determination of how often it will require replacement
• Consideration of potential process improvements such as the selection of near optimum temperature for operation of the refrigeration system to achieve more efficient recovery of CVOCs (see Section 6.1).
• Demonstration of reliability, availability, and maintainability (RAM) of the full-scale components versus RAM analysis of the system and components and its effect on the economics.
Evaluation of Organic Sponges for CVOC Abatement 6-2
ffl-88

Issues for Further Consideration
6.2.2 Economic Issues
The significant economic issues related to the pilot- and full-scale development are as follows:
• Cost of capital equipment and its life expectancy
• Site requirement and costs of construction, checkout, start-up, and obtaining regulatory approval
• Facility operating cost This includes the cost per unit of waste treated, cost per unit of contaminant removed, and cost of disposal of unit of contaminant removed. Other facility operating costs e.g. labor, maintenance, energy, reporting and compliance, etc. will also be significant economic issues.
• Cost of the organic sponge per unit of waste treated. This includes initial cost, any replacement cost, royalty, and any other costs unique to the use of the sponge.
• Cost comparison with other competing technologies
6.2.3 Other Significant Issues
Other significant issues for pilot- and full scale development include the following:
• Site and location of the demonstration unit
• Environmental issues related to the use and disposal of the sponge
• Use of the organic sponge technology for other applications
• Flexibility of the processing components - i.e., whether they are permanently located or could be placed on a skid-mounted transportable unit
Evaluation of Organic Sponges for CVOC Abatement 6-3
in-89


Section 7
Literature
This section presents a list of references which have been reviewed during the conceptual design and preparation of this report.
Cheremisinoff, P. N. (1993), Solvent Recovery and Recycling, The National Environmental Journal, September/October, 1993.
Fang, C. S. and Khor, S. (1989), Reduction of Volatile Organic Compounds in Aqueous Solutions Through Air Stripping and Gas-Phase Carbon Adsorption, Environmental Progress, November, 1989.
Enneking, J. C. (1993), Brayton Solvent Recovery Heat Pump Technology Update, Industrial Energy Technology Conference, Houston, Texas, March 1993.
Graham, J. R., Ramaratnam, M. (1993), Recover VOCs Using Activated Carbon, Chemical Engineering, February, 1993.
Harris, J. M.(1993), Removal of Volatile Organic Compounds from Soil or Water - Two Case Studies, Florida Environmental Chemistry Conference, November, 1993.
Kenson, R. E.(1993), Recovery of Chlorinated and Fluorinated Solvents for Reuse in the Electronic Industry, Met-pro Corporation, 1993.
Moretti, E. C, Mukhopadhyay, N. (1993), VOC Control: Current Practices and Future Trends, Chemical Engineering Progress, July, 1993.
Mukhopadhyay, N„ Moretti, E. C. (1993), Current and Potential Future Industrial Practices for Reducing and Controlling Volatile Organic Compounds. Center for Waste Reduction Technologies, American Institute of Chemical Engineers, New York, 1993.
Nuton International, Inc. (1992), Bray sorb - Advanced Technology for Pollution Control and Solvent Recovery, Technical Brochure, Columbus, Ohio, 1992.
Parmele, C. S., OConnell, W. L., and H. S. Basdekis (1979), Vapor-Phase Adsorption Cuts Air Pollution, Recovers Solvents, Chemical Engineering, December, 1979.
Ramaratnam, M., Graham, J. (1992), Water Treatment and Recovery Using Closed-Loop Control System, Air and Waste Management Association Conference, June, 1992.
Ruddy, E. N., CarroL L. A. (1993), Select the Best VOC Control Strategy, Chemical Engineering Progress, July, 1993.
Ruhl, M. J. (1993), Recover VOCs via Adsorption on Activated Carbon, Chemical Engineering Progress, July, 1993.
Westates Carbon, Inc. (1993), Hot Gas Regenerable Adsorption System Testing - A Report, Los Angeles, CA, September, 1993.
Evaluation of Organic Sponges for CVOC Abatement 7-1
111-91


Appendix A
Abbreviation List and Acronyms
Below is a list of abbreviations and acronyms used in this report
ABBREVIATIONS AND ACRONYMS
AS Air Stripper or Air Stripping Btu British thermal unit CVOCs Chlorinated Volatile Organic Compounds DOE Department of Energy (United States) EPA Environmental Protection Agency (United States) EPCM Engineering, Procurement, and Construction Management g gram GAC Granular Activated Carbon GJ Giga Joules (10^ Joules) gpm gallons per minute HP Horsepower hr hour k Thousand kg kilogram L liter lbs pounds m meter m3 Cubic Meter MM Million NA Not Available O&M Operating and Maintenance ppb parts per billion ppm part per million ppmv parts per million by volume psi pounds per square inch RD Remedial Design RUFS Remedial Investigation/Feasibility Study ROD Record of Decision SCF Standard Cubic Feet SCFM Standard Cubic Feet per Minute TCE Trichloroethylene US EPA United States Environmental Protection Agency VOCs Volatile Organic Compounds yr year <c Degree Celsius Jig/L Micrograms per Liter
Evaluation of Organic Sponges for CVOC Abatement A-l
m-93


Appendix B
Data on Organic Sponges
This appendix provides data used on Dow XU and Ambersorb 563 sorbents. The adsorption isotherms for TCE on these sorbents, as well as Calgon GAC BPL 4x6, were supplied by GE/CRD.
Evaluation of Organic Sponges for CVOC Abatement B-l
m-95

Sorption Isotherms 11/93
My isotherms have been fit to the Freundlich equation, given by:
q = KPl/n
with q = g TCE/g sorbent and P = atm TCE in vapor (ppm). The tables below lists the the Freundlich parameters obtained at ambient conditions, 30°C, 85% reletive humidity, and 90°C for the five sorbents under consideration:
TABLE 1: Freundlich Parameters at 30°C and Ambient (low) Humidity
Sorbent K 6.7 x 10⁻² 5.9 x 10⁻³ 5.7 x 10⁻²
n 4.4 1.6 3.6
Ambersorb 563 DowXUS BPL4x6
K 6.7 x 10⁻² 5.9 x 10⁻³ 5.7 x 10⁻²
n 4.4 1.6 3.6
TABLE 2: Freundlich Parameters at 30°C and 85% Relative Humidity
TABLE 3: Freundlich Parameters at 90°C
ffl-96 B-2

Ambersorb - new
PUun. oe(Ti[ a (fl/O) IMP) imol 1(1(6) IM r a mi) 27-OCl Ambcraorb S t3 0.02 2.94-2 •3 .87 •3.92 •3.89 2.84*2 2?;.Q9l AmbtftMft) 513 0.44 6.46*8 -0 .17 •2.93 nsouir* 3.97833117 •2 .74 6.44-2 27*001 Ambaraarb 943 3.01 8.34.2 1-12 •2.48 Otuarvatloni 10 •2.43 8.66-2
t O / 1 1 . n i « Amo4f*om M S 3.4,1 8.74*2 1.28 -2.46 •2.41 9.08-2 87*Oa1 AnWwrtwrb ( 6 9 7.48 1.14-1 2.01 •2.20 Intsroeoi ' -2 .7048380 -2.26 1.16-1 a 7 . o a t AmBamstfc 363 H i ? 1 1.44-1 2.84 -1 .87 X1 0-22780392 -2 .10 1.28-1
1Q/ l l .n»v» AmMftiUB 613 20.41 1.46*1 3.03 -1.B6 n 4.4 •2.01 1,36-1 27*Oat Amtatrtoni E(3 44. (81 1.76*1 " a.80 .1 .77 Kto- t fQ) 6.(96.2, •1 .84 1.96-1 87-001 Ambanaib 989 ( 4 . 4 8 1.84.1 4.44< -1 .71 - 1 . ( 9 1.6>-1 27*Oct Ametrwm sss 183.21 1.(4-1 6.101 -1 .84 • 1.64 8.16-1
1 0 / 1 1 - n i w Ambartortj. 313 o« «cali 2.06-1
' j 1
27-Oet AmMffOre 683 0.71 8.«4*3 M ' C -0.341 .4 .08 •4 .J6 7.86-3 27 -001 Ambtrwm M S 2 . ( 4 1.44.2 (0«C 0.97! -4.2S ftSouAM 0^94568109 •4 .21 1.94-2 27*Oet Amatrum 683 _ 8.37 2,96-2 90*C 1.88 .3 .64 ObMrvation* a, •3 .77 2.36-2 2 7 . 0 6 I Arnuaraorb M S l t . 3 3 4.14*2 80-C 2.92 •3 .19 -3.24 3.66-8 tJ7.0ct AmtMnort) S I 3 38 .47 8.74*2 8o*c 3.67 . 2 . 8 7 il»6r0(Dt •4 .6662446 •2 .92 3.46-2 2 7 - 0 0 ! Ambaturts 343 84.17 4 . 8 . - 2 80*C 4.06 • 2 . ( 7 X I 0^49874362 -8 .87 6.98-2 27-Oel Amtonum H 3 »»i°f 6.46*2 » 5 * C , , 4.37 2 . 4 ( n 2.0 • 2 .48 6.96-2 27 'Oet Ambartom 663 138.24 S.66-3 90 'C 4.94 •2.34 K <Q.a/o> 9.826-3, -a .84 1.14-1
1 Ig-Nav AmMrtom 883 0.88 2.86*2 86% RH -0 .80 -3 .67 .3 .61 3.09-2
2*Nov AmbarMrb M S ,_.__ ° - M S.Ba-2 ( 9 % m -0 .10 •3.63 R Bquarn 0 .973(3911 •3.48 3.16-2 12-Nov AfflMtWfb M S 4.38 9 . (4 *2 eeuflH | 1.4(1 - 2 . ( 9 06 t«rv i l lon j 12 -2 .98 6.28-2 2*N0V Ambaraorb 5*3 4.77 5.6a-2 63% HH 1.66 •2.91 •2 .92 9.46-2 2-Nov AfflMrtorb 613 18-09 9 . (4 *2 85% RH 2.77 -2.34 iniareBBi •3 .4443141 .2 .65 B.I 0-2
ig.Wiw Air**ncra M S ' 8 - 1 f l , 8.24.8 M S AH 2.90 •2 .39 x l °-»aiiPBB •2 .48 9.44-2 8*N0¥. AmlMtiwb 9 ( 3 . _ * • * • * ' 1.34.1 (9%HH 4.02 •2.08 n 3.0 •2 .10 1.24-1
12-Nov A m M t S f b 6*3 87,48 1.34-1 SS%flH 4.09 -2 .07 Klo-oyoi 3.196-8 .2 .09 1.26-1 2*Nov AmtMtMfD 543 _ . '*•« 1.4S-1 •*%W_.,., 4.28 . 1 . 6 7 •2.01 1.34-1
12-NOV Amoansm 943 78.34 1.46*1 89% RH 4.38 - 1 . ( 7 • 1.98 1.4a*1 2-N8W Amtwnore 913 178.78 1.74*1 «*""... 6.17 • 1.76 •1 .72 1.66-1
ia*Nev 12-NOV
Ambaraorb 943 283.12 1.76-1 89% HH B.6B • 1.78 • 1.58 2.16*1 ia*Nev 12-NOV M W » W M S on I U I J " ).»••! _ VU4H 111 1
1 1
I m h u tafia 4 ) U l 1
4mbJ*;st
K " " " ^ off
*>«utullleh
m ^^^.
(BWRH
•
Fit (11/83)
a
Amboriorb 9
1.46*1 r
L S3: Frtundlfeh Fit (11/93)
«mbl»nt • h
^-—-"""" r
< ^ - * - " ^ 66%flH (•
96*C [
I m h u tafia 4 ) U l 1
4mbJ*;st
K " " " ^ off
*>«utullleh
m ^^^.
(BWRH
•
Fit (11/83)
a
Amboriorb 9
1.46*1 r
L S3: Frtundlfeh Fit (11/93)
«mbl»nt • h
^-—-"""" r
< ^ - * - " ^ 66%flH (•
96*C [
2 . 5 * . 1 T
tafia 4 ) U l 1
4mbJ*;st
K " " " ^ off
*>«utullleh
m ^^^.
(BWRH
•
Fit (11/83)
a
Amboriorb 9
1.46*1 r
L S3: Frtundlfeh Fit (11/93)
«mbl»nt • h
^-—-"""" r
< ^ - * - " ^ 66%flH (•
96*C [
2 . 5 * . 1 T
tafia 4 ) U l 1
4mbJ*;st
K " " " ^ off
*>«utullleh
m ^^^.
(BWRH
•
Fit (11/83)
a
Amboriorb 9
1.46*1 r
L S3: Frtundlfeh Fit (11/93)
«mbl»nt • h
^-—-"""" r
< ^ - * - " ^ 66%flH (•
96*C [
•^
tafia 4 ) U l 1
4mbJ*;st
K " " " ^ off
*>«utullleh
m ^^^.
(BWRH
•
Fit (11/83)
a
1.24-1
, | l .0e*1
9 (.04*2
. 3 8.04-2
" 4 .06.2 . * 1
2.06-a
m.
L S3: Frtundlfeh Fit (11/93)
«mbl»nt • h
^-—-"""" r
< ^ - * - " ^ 66%flH (•
96*C [
•^
tafia 4 ) U l 1
4mbJ*;st
K " " " ^ off
*>«utullleh
m ^^^.
(BWRH
•
Fit (11/83)
a
1.24-1
, | l .0e*1
9 (.04*2
. 3 8.04-2
" 4 .06.2 . * 1
2.06-a
m.
L S3: Frtundlfeh Fit (11/93)
«mbl»nt • h
^-—-"""" r
< ^ - * - " ^ 66%flH (•
96*C [
2.0»-1 I g i.e«.i
y 1.0«' l
3 W S.Oi-2 '
•^
tafia 4 ) U l 1
4mbJ*;st
K " " " ^ off
*>«utullleh
m ^^^.
(BWRH
•
Fit (11/83)
a
1.24-1
, | l .0e*1
9 (.04*2
. 3 8.04-2
" 4 .06.2 . * 1
2.06-a
m.
L S3: Frtundlfeh Fit (11/93)
«mbl»nt • h
^-—-"""" r
< ^ - * - " ^ 66%flH (•
96*C [
2.0»-1 I g i.e«.i
y 1.0«' l
3 W S.Oi-2 '
•^
tafia 4 ) U l 1
4mbJ*;st
K " " " ^ off
*>«utullleh
m ^^^.
(BWRH
•
Fit (11/83)
a
1.24-1
, | l .0e*1
9 (.04*2
. 3 8.04-2
" 4 .06.2 . * 1
2.06-a
m.
L S3: Frtundlfeh Fit (11/93)
«mbl»nt • h
^-—-"""" r
< ^ - * - " ^ 66%flH (•
96*C [
2.0»-1 I g i.e«.i
y 1.0«' l
3 W S.Oi-2 '
•^
tafia 4 ) U l 1
4mbJ*;st
K " " " ^ off
*>«utullleh
m ^^^.
(BWRH
•
Fit (11/83)
a
1.24-1
, | l .0e*1
9 (.04*2
. 3 8.04-2
" 4 .06.2 . * 1
2.06-a
m.
L S3: Frtundlfeh Fit (11/93)
«mbl»nt • h
^-—-"""" r
< ^ - * - " ^ 66%flH (•
96*C [
2.0»-1 I g i.e«.i
y 1.0«' l
3 W S.Oi-2 '
•^
tafia 4 ) U l 1
4mbJ*;st
K " " " ^ off
*>«utullleh
m ^^^.
(BWRH
•
Fit (11/83)
a
1.24-1
, | l .0e*1
9 (.04*2
. 3 8.04-2
" 4 .06.2 . * 1
2.06-a
m.
L S3: Frtundlfeh Fit (11/93)
«mbl»nt • h
^-—-"""" r
< ^ - * - " ^ 66%flH (•
96*C [
2.0»-1 I g i.e«.i
y 1.0«' l
3 W S.Oi-2 '
•^
tafia 4 ) U l 1
4mbJ*;st
K " " " ^ off
*>«utullleh
m ^^^.
(BWRH
•
Fit (11/83)
a
1.24-1
, | l .0e*1
9 (.04*2
. 3 8.04-2
" 4 .06.2 . * 1
2.06-a
m.
L S3: Frtundlfeh Fit (11/93)
«mbl»nt • h
^-—-"""" r
< ^ - * - " ^ 66%flH (•
96*C [
2.0»-1 I g i.e«.i
y 1.0«' l
3 W S.Oi-2 '
•^
tafia 4 ) U l 1
4mbJ*;st
K " " " ^ off
*>«utullleh
m ^^^.
(BWRH
•
Fit (11/83)
a
1.24-1
, | l .0e*1
9 (.04*2
. 3 8.04-2
" 4 .06.2 . * 1
2.06-a
m.
L S3: Frtundlfeh Fit (11/93)
«mbl»nt • h
^-—-"""" r
< ^ - * - " ^ 66%flH (•
96*C [
2.0»-1 I g i.e«.i
y 1.0«' l
3 W S.Oi-2 '
•^
tafia 4 ) U l 1
4mbJ*;st
K " " " ^ off
*>«utullleh
m ^^^.
(BWRH
•
Fit (11/83)
a
1.24-1
, | l .0e*1
9 (.04*2
. 3 8.04-2
" 4 .06.2 . * 1
2.06-a
m.
L S3: Frtundlfeh Fit (11/93)
«mbl»nt • h
^-—-"""" r
< ^ - * - " ^ 66%flH (•
96*C [
2.0»-1 I g i.e«.i
y 1.0«' l
3 W S.Oi-2 '
•^
tafia 4 ) U l 1
4mbJ*;st
K " " " ^ off
*>«utullleh
m ^^^.
(BWRH
•
Fit (11/83)
a
1.24-1
, | l .0e*1
9 (.04*2
. 3 8.04-2
" 4 .06.2 . * 1
2.06-a
m.
L S3: Frtundlfeh Fit (11/93)
«mbl»nt • h
^-—-"""" r
< ^ - * - " ^ 66%flH (•
96*C [
2.0»-1 I g i.e«.i
y 1.0«' l
3 W S.Oi-2 '
•^
tafia 4 ) U l 1
4mbJ*;st
K " " " ^ off
*>«utullleh
m ^^^.
(BWRH
•
Fit (11/83)
a
1.24-1
, | l .0e*1
9 (.04*2
. 3 8.04-2
" 4 .06.2 . * 1
2.06-a
m.
L S3: Frtundlfeh Fit (11/93)
«mbl»nt • h
^-—-"""" r
< ^ - * - " ^ 66%flH (•
96*C [
2.0»-1 I g i.e«.i
y 1.0«' l
3 W S.Oi-2 '
•^
tafia 4 ) U l 1
4mbJ*;st
K " " " ^ off
*>«utullleh
m ^^^.
(BWRH
•
Fit (11/83)
a
1.24-1
, | l .0e*1
9 (.04*2
. 3 8.04-2
" 4 .06.2 . * 1
2.06-a
m.
L S3: Frtundlfeh Fit (11/93)
«mbl»nt • h
^-—-"""" r
< ^ - * - " ^ 66%flH (•
96*C [
2.0»-1 I g i.e«.i
y 1.0«' l
3 W S.Oi-2 '
•^
tafia 4 ) U l 1
4mbJ*;st
K " " " ^ off
*>«utullleh
m ^^^.
(BWRH
•
Fit (11/83)
a
1.24-1
, | l .0e*1
9 (.04*2
. 3 8.04-2
" 4 .06.2 . * 1
2.06-a
m.
L S3: Frtundlfeh Fit (11/93)
«mbl»nt • h
^-—-"""" r
< ^ - * - " ^ 66%flH (•
96*C [
2.0»-1 I g i.e«.i
y 1.0«' l
3 W S.Oi-2 '
•^
tafia 4 ) U l 1
4mbJ*;st
K " " " ^ off
*>«utullleh
m ^^^.
(BWRH
•
.00
1.24-1
, | l .0e*1
9 (.04*2
. 3 8.04-2
" 4 .06.2 . * 1
2.06-a
m.
L S3: Frtundlfeh Fit (11/93)
«mbl»nt • h
^-—-"""" r
< ^ - * - " ^ 66%flH (•
96*C [ D, i n 100.00
* T C E
200.00
(»«* , faun)
300 .00 O.L 1ft 10.00 20.00
TCE (»t™, ppm) • 100.00
* T C E
200.00
(»«* , faun) H p
i , 10.00 20.00
TCE (»t™, ppm) • 100.00
* T C E
200.00
(»«* , faun) H p
i , 10.00 20.00
TCE (»t™, ppm) • 100.00
* T C E
200.00
(»«* , faun) H p
i , 10.00 20.00
TCE (»t™, ppm) •
I I
P406 1
m-97 B-3

xus.rww
~f Dow XUS: Fraundllch Ftt (11/83)
2.0e-1 i.B«-l 1.69-1 1.4B-1 1.28-1 1.0»-1 B.Oa-2 S.Os-2 4.00-3 2.01-2
d5
^pti
D
- - • •
Amblsnl
aa%RM
90*C
0.00 100.00 200.00 P TOE («tm, ppm)
100.00
Dow XUS: Fraundlloh Fit (11/93)
! . * » • ! i(5 •*
1.2»-2
8 8.06-9
£ 6.06-3
S *.o»-a
'85HRH
B0«C
2.0a-3 '
O.OiO • '
0.00 80.00 100.00 150.00 P TCE (aim, PM»
r 1-
200.00 r r h h
Daw XUS: Freundllch Fit (11/93)
4.06-8 T
3.S»-2
3.0*.2
| 2.8»-8
* 2.0B-2
£ 1.5»-2
Ambient
-4 8S»RH
<V 4
S.06-3 u
0.0*0 - * - " • '
. - • ' ' so*c , • • - '
0.00 80.00 100.00 190.00 J» TCE (Mm, ppm)
200.00
_L
Pii« 1
m-98 B-4

BPL-
-. 1 iniPl l i (q) Inlo) (Hi) o llltl 27-001 i B P L 4 I 6 •VALUEI •VALUEI ' (VALUE! •VALUE! 8VALUE! •VALUEI 27 -Oc i . BPt 4x6 o.: 3.C8-2 • 2 . 7 : •S. iS n « i ^ f » C.9"*?CS*:22 » 3.62 S.^B 2 Z7-Ocl j BPL4X6 1 *'* 6.28-3 , 1.47 •2.60 Observations a -2.48 4.e«-e
10 /11-newi BPL 4x6 1 • • * S.3»-2 2.10 •2 .48 •2.26 1.0s-1 I 0 / I 1 . n t w i BPL 4x6 26.2 1.48-1 3.27 -1.98 intaroaot 1 •2 .6832786 •1.85 1.48.1
27-Oct BPL 4x8 31.3 1.46-1 3.44 •1 .06 11 1 0.27938913" •1 .90 1.60-1 l O / H - n o w BPL 4x8 79.1 1.96-1 ; 4.37 • 1.64 n .'•• •1.64 1.98-1
27-Oct BPL 4x6 99.8 2.19-1 4.80 -1.68IK (q-o/fl) S.718-2 •1 .68 2.18-1 27-Oct BPL 4x8 ) 200.2 2.68-1 6.301 -1 .86! 1.36 2 .6«- l 27-Oct BPL 4x6 j 889.2 3.18-1 6.671 -I.19J •1.26 2.88-1 27-Oet 3PL 4x6 244.2 2.48-1 not inetudad S.50, -1 .44! -1.33 2.78-1
•
. 1 1 ! 1
| 27-Oct BPL 4x6 0.00 7.08-3 »o«c •NUMI -4.9.8 •NUMI tNUMI 27-Oct BPL 4x6 2.29 1.38-1 8 C C 0.63 • 4 , j e l q Square 0.97964892 •4.31 1.38-2 27-Oet BPL 4x6 14.34 2.88-2 80'C 2.66 •3.66|Ot>aarvatlona 8 -a .46 3.18-2 S7 -OM BPL 4x6 27.72 4.28-2 90"C 3.32 •3.181 •3 .18 4.18-2 27-Octi BPL 4x6 39.26 9.9a-2 90»C 6.87 -2.44llntoro»pI ••».8818861 -3 .03 4 .98.2 27-Oct- BPL 4x6 98.64 7.28-2 90*C 4.57 • 2 . 6 3 x 1 0.45116285 •8.6C 7.38-8 27-O0t> BPL 4IS 166.20 8.68-2 80*0 6.11 •2.4S|n 3.9 - 2 .37 9 . 3 8 3 27-Oet: BPL 4xfl Alt 88618 9.98.2 80*c XVALUEI •2 .31 K (q.tt-fl) 9.266-3 tVALUEl •VALUEI
t l - N a v i BPL 4x6 0.20 4.88-3 86% RH 1 -1.61 •6.351 •5 .88 2.88-3 ( t -Nov i BPL 4X8 1.20 9.18-3 86% RH i o- 1*! -4.70;R SQOare 0.89924612 •6 .11 6.08-3
8-Oet BPL 4x6 1.22 3.68-3 85% RH 0.20 •5.64 Oaurvailans 14 •8.11 6.18-3 n-Nov BPL 416 1,63 6.78-3 68% RM I ° - 4 9 l •8 .00 •4.96 6.98:3
8-Oot BPL 4x6 1.84 4 . 8 a - ! Knfc RH I 0.61 •6 .39 Intareapt -5 .1104464 . 4 . 9 3 7.26.3 a-oot BPL 4X6 3.41 7.06-3 68% RH 1.23J •4 .98 11 0.42688691 •4 .67 8.48.3
11 -Novi BPL 4x6 4.94 1.48-2 88% HH 1.601 •4.26 n 2.3 •4 .31 1.18.2 8-Osl BPL 4x8 ^ 6.01 a.68-3 8 8 * PH ' 1.79 -4 .64 K l o - M I S.976.3 •4 .43 1.26.2 8-O0t BPL 4x6 11.22 1.48-2 86% RH ' 2.42 •4 .27 •4 .16 1.6B-2
11-Nov BPL 4x6 S1.S2 3.48-2 86% RH 1 3,96 -3 .37 •3.31 3.08-2 6-Oot BPL 4X8 66.34 3.68-2 89% RH 4.46 •3 .34 . -3 .29 3.78-2 8-OOt BPL 4X6 91.78 4.26-2 86% RH I 4.52 •3.16 •3 .26 3.8s-2
n - t t a v BPL 4x6 126.01 4.98-2 89% RH 4.83 -3.01 •3 .13 4.48-2 e-Oot BPL 4X8 133.67 4.88.C I 6 H R H 4.90 •3.01 • 3 .10 4.5a<2 e - o c i BPL 4x8 oil ceal* S.48-2 63% RH . a.Oct BPL 4x6 all seal* 6.78-2 86% RH
) t - N o v | BPL 4X« •AMLUB •VALUEI 6S%RH 2-Nov; BPL 4x8 0.06 4.7a-i 68% RH, not Induced . 2-Novj BPL 4x6 0.88 7.16-9 89% RH. net Inoludad ' "'"' 2-Novj BPL 4x6 1.07 1.48-2 86% RH. nat Ineludad 2-Nov BPL 4x6 13.83 3.88-2 88% RH. (IWlftMUfltd '""1 2.Nov BPL 4X6 3s.ee 8.06-2 86% RH. not Incfcjdad Z-Nov 6PL4X8 43.80 6.78-a 66% AH, not InOudvd .
1 1
Bf >L 4x8: Fr
flu- —C>*^
sundlleh Pit
at •mBianj^--
- — - • M ' c
0 8S%RH
(11/83 ) £ m
1
BPL 4x8: t
FraundlleU Pit (11/93) f
•
^ - ^ " " ^ 9 0 ^ 0
- " 86%RH r
r
>L 4x8: Fr
flu- —C>*^
sundlleh Pit
at •mBianj^--
- — - • M ' c
0 8S%RH
(11/83
a
m
1
BPL 4x8: t
FraundlleU Pit (11/93) f
•
^ - ^ " " ^ 9 0 ^ 0
- " 86%RH r
r
>L 4x8: Fr
flu- —C>*^
sundlleh Pit
at •mBianj^--
- — - • M ' c
0 8S%RH
(11/83
a
m
1
BPL 4x8: t
FraundlleU Pit (11/93) f
•
^ - ^ " " ^ 9 0 ^ 0
- " 86%RH r
r
3,54-1
9 .08- t
| 2 .99-1
4
>L 4x8: Fr
flu- —C>*^
sundlleh Pit
at •mBianj^--
- — - • M ' c
0 8S%RH
(11/83
a
m
1
9.06-2
6.06-2
7.06-2
6.08-2
6.06-2
4.08-2
3.04-2 1
2.08.2
1.0a-2
/ amblani «•
/
9*
t FraundlleU Pit (11/93) f
•
^ - ^ " " ^ 9 0 ^ 0
- " 86%RH r
r
3,54-1
9 .08- t
| 2 .99-1
4
>L 4x8: Fr
flu- —C>*^
sundlleh Pit
at •mBianj^--
- — - • M ' c
0 8S%RH
(11/83
a
m
1
9.06-2
6.06-2
7.06-2
6.08-2
6.06-2
4.08-2
3.04-2 1
2.08.2
1.0a-2
/ amblani «•
/
9*
t FraundlleU Pit (11/93) f
•
^ - ^ " " ^ 9 0 ^ 0
- " 86%RH r
r
3,54-1
9 .08- t
| 2 .99-1
4
>L 4x8: Fr
flu- —C>*^
sundlleh Pit
at •mBianj^--
- — - • M ' c
0 8S%RH
(11/83
a
m
1
9.06-2
6.06-2
7.06-2
6.08-2
6.06-2
4.08-2
3.04-2 1
2.08.2
1.0a-2
/ amblani «•
/
9*
t FraundlleU Pit (11/93) f
•
^ - ^ " " ^ 9 0 ^ 0
- " 86%RH r
r
3,54-1
9 .08- t
| 2 .99-1
4
>L 4x8: Fr
flu- —C>*^
sundlleh Pit
at •mBianj^--
- — - • M ' c
0 8S%RH
(11/83
a
m
1
9.06-2
6.06-2
7.06-2
6.08-2
6.06-2
4.08-2
3.04-2 1
2.08.2
1.0a-2
/ amblani «•
/
9*
t FraundlleU Pit (11/93) f
•
^ - ^ " " ^ 9 0 ^ 0
- " 86%RH r
r
3,54-1
9 .08- t
| 2 .99-1
4
>L 4x8: Fr
flu- —C>*^
sundlleh Pit
at •mBianj^--
- — - • M ' c
0 8S%RH
(11/83
a
m
1
9.06-2
6.06-2
7.06-2
6.08-2
6.06-2
4.08-2
3.04-2 1
2.08.2
1.0a-2
/ amblani «•
/
9*
t FraundlleU Pit (11/93) f
•
^ - ^ " " ^ 9 0 ^ 0
- " 86%RH r
r
3,54-1
9 .08- t
| 2 .99-1
4
>L 4x8: Fr
flu- —C>*^
sundlleh Pit
at •mBianj^--
- — - • M ' c
0 8S%RH
(11/83
';_, m
1
9.06-2
6.06-2
7.06-2
6.08-2
6.06-2
4.08-2
3.04-2 1
2.08.2
1.0a-2
/ amblani «•
/
9*
t FraundlleU Pit (11/93) f
•
^ - ^ " " ^ 9 0 ^ 0
- " 86%RH r
r
• 2.08*1 t
O 1 58-1 •) ^ t- y-9"
>L 4x8: Fr
flu- —C>*^
sundlleh Pit
at •mBianj^--
- — - • M ' c
0 8S%RH
(11/83
! 1 ™
9.06-2
6.06-2
7.06-2
6.08-2
6.06-2
4.08-2
3.04-2 1
2.08.2
1.0a-2
/ amblani «•
/
9*
t FraundlleU Pit (11/93) f
•
^ - ^ " " ^ 9 0 ^ 0
- " 86%RH r
r
• 2.08*1 t
O 1 58-1 •) ^ t- y-9"
>L 4x8: Fr
flu- —C>*^
sundlleh Pit
at •mBianj^--
- — - • M ' c
0 8S%RH
(11/83
s
9.06-2
6.06-2
7.06-2
6.08-2
6.06-2
4.08-2
3.04-2 1
2.08.2
1.0a-2
/ amblani «•
/
9*
t FraundlleU Pit (11/93) f
•
^ - ^ " " ^ 9 0 ^ 0
- " 86%RH r
r
• 2.08*1 t
O 1 58-1 •) ^ t- y-9"
>L 4x8: Fr
flu- —C>*^
sundlleh Pit
at •mBianj^--
- — - • M ' c
0 8S%RH
(11/83
s
9.06-2
6.06-2
7.06-2
6.08-2
6.06-2
4.08-2
3.04-2 1
2.08.2
1.0a-2
/ amblani «•
/
9*
t FraundlleU Pit (11/93) f
•
^ - ^ " " ^ 9 0 ^ 0
- " 86%RH r
r
• 2.08*1 t
O 1 58-1 •) ^ t- y-9"
>L 4x8: Fr
flu- —C>*^
sundlleh Pit
at •mBianj^--
- — - • M ' c
0 8S%RH
(11/83
s
9.06-2
6.06-2
7.06-2
6.08-2
6.06-2
4.08-2
3.04-2 1
2.08.2
1.0a-2
/ amblani «•
/
9*
t FraundlleU Pit (11/93) f
•
^ - ^ " " ^ 9 0 ^ 0
- " 86%RH r
r er ai*
>L 4x8: Fr
flu- —C>*^
sundlleh Pit
at •mBianj^--
- — - • M ' c
0 8S%RH
(11/83
s
9.06-2
6.06-2
7.06-2
6.08-2
6.06-2
4.08-2
3.04-2 1
2.08.2
1.0a-2
/ amblani «•
/
9*
t FraundlleU Pit (11/93) f
•
^ - ^ " " ^ 9 0 ^ 0
- " 86%RH r
r S.08-2 * _ S -
>L 4x8: Fr
flu- —C>*^
sundlleh Pit
at •mBianj^--
- — - • M ' c
0 8S%RH
(11/83
s
9.06-2
6.06-2
7.06-2
6.08-2
6.06-2
4.08-2
3.04-2 1
2.08.2
1.0a-2
/ amblani «•
/
9*
t FraundlleU Pit (11/93) f
•
^ - ^ " " ^ 9 0 ^ 0
- " 86%RH r
r S.08-2 * _ S -
>L 4x8: Fr
flu- —C>*^
sundlleh Pit
at •mBianj^--
- — - • M ' c
0 8S%RH
(11/83
s
9.06-2
6.06-2
7.06-2
6.08-2
6.06-2
4.08-2
3.04-2 1
2.08.2
1.0a-2
/ amblani «•
/
9*
t FraundlleU Pit (11/93) f
•
^ - ^ " " ^ 9 0 ^ 0
- " 86%RH r
r
0.0*0 < 0
jXp'*'
>L 4x8: Fr
flu- —C>*^
sundlleh Pit
at •mBianj^--
- — - • M ' c
0 8S%RH
(11/83
0.0
s
0.080 0
/ amblani «•
/
9*
t FraundlleU Pit (11/93) f
•
^ - ^ " " ^ 9 0 ^ 0
- " 86%RH r
r
' 0.0*0 <
0 0 100.0
P T C !
200.(
i (CUM, pptn)
> 3C 0.0
s
0.080 0 0 80.0
P TCB (aim, p\ »«) 100.0 r
t 100.0
P T C !
200.(
i (CUM, pptn)
>
s
80.0
P TCB (aim, p\ »«) 100.0 r
t 100.0
P T C !
200.(
i (CUM, pptn)
>
s
80.0
P TCB (aim, p\ »«) 100.0 r
t I , I
P488 1
m-99 B-5

POLYMERIC ADSORBENT XU 43502 Technical Bulletin 2.03 Dow has developed a new polymeric adsorbent for adsorption of volatile organic compounds (VOC) and hazardous air pollutants (HAP) from air. Designated XU 43502, the new adsorbent is a large, 1.5 mm diameter, spherical bead material, designed to exhibit low pressure drop in typical vapor phase applications, while retaining all other attributes of the smaller particle size adsorbent, XUS 43493. Most other physical and chemical properties of XU 43502, including equilibrium adsorption properties, are identical to those of XUS 43493 adsorbent.
The new adsorbent is available in two forms. A wet form, containing 50 to 609c water is designated XU 43502.00; the dry form is designated XU 43502.01. Table 1 lists typical properties of the dry form of the product.
Figure 1 shows a pressure drop curve for XU 43502.01 as a function of air velocity down-flow through a packed bed. For up-flow applications, XU 43502.01 adsorbent will begin to fluidize at an air velocity of about 80 ft / min.
Figure 2 shows a typical breakthrough curve obtained with XU 43502.01 in a vapor phase application. The steepness of the breakthrough curve attests to the excellent kinetic performance of the product.
Physical and Chemical Properties of XU 43502.01 HI Matrix Structure
Physical Form
Particle Size (mm) Moisture Content BET Surface Area (m2/g) Total Porosity (cc/g) Average Pore Diameter (A) Apparent Density (g/cc) Ash Content (%)
[1] These properties are typical of the product, but should not be confused with or regarded as specifications.
Macroporous Styrenic Polymer Orange to Brown Spheres 1.5 <5?c 1080 0.94 34 0.4 <0.01
Figure 7. Air Pressure Drop Through a Bed ot XU 43502.01
20 40 60 80 100
AIR VELOCITY (tt/mini
Figure 2. Breakthrough Cunr for Trichloroethx/lene Adsorption by XU 43502.01
o o
1 0
0.8
0.6
0.4
0.2
0.0
Feed = 1400 vppm Trichloroethylene
Flow Rate = 80 ft/min
10000 20000
Bed Volumes
30000 40000
NOTICE: The Dow Chemical Company believes mis information to be accurate as of February 1993. However, since me product is developmental: (1) quality specifications may not be fully determined. (2) hazards may not be fully Known and additional caution in handling ana use is required, and (3) Dow reserves the nght to change specifications and/or discontinue its sale Users are cautioned to confirm opinions, findings and data by their own tests and to satisfy themselves as to the suitability ot such product for me purposes intended prior to use. NO WARRANTY EXPRESS OR IMPLIED. INCLUDING WITHOUT LIMITATION. IMPLIED WARRANTIES OF MERCHANTABILITY AND FITNESS FOR A PARTICULAR PURPOSE IS GIVEN Freedom Irom any patent owned Oy Dow or others is not to be inferred Inasmuch as any assistance furnished by Dow witn reference to the proper use and disposal of its products is provided witnout charge. Dow assumes no obligation or liability therefor. Material Safety Data Sheets are available from Dow and should be consulted pnor to use of any Dow product For any information that may have been published subsequent to me above date, consult your nearest Dow sales office
For further information, call 517-636-6880 DOW U.S.A.
Trademark of The Dow Chemical Company 0 R I m-ioo
B-6

INTRODUCTION
Rohm and Haas Company has developed a new generation of corbonoceous adsorbents These materials, trademarked under the name Ambersorb' carbonaceous adsorbents, have unique properties that result in superior performance for a diverse range ot liquid AND vapor phase applications
The Ambersorb adsorbents are patented synthetic adsorbents. The use of our proprietary process technology results in hard, black, spherical beads with exceptional physical integrity and venations in surface area, pore size distribution and surface properties
The starting material tor the Ambersorb carbonaceous adsorbents Is a highly sulfonated styrene/divinylbenzene macroreticular (highly macroporous) ion exchange resin with moderate surface area This resin is pyrolyzed m a patented process.
During pyrolysls. the macroreticular structure remains Intoct while there is a large increase in mlcroporosity (pore diameter < 20 angstroms) and a slight increase in mesoporosity
/fr*\J?&So^£ S&S (20 to 500 angstroms) as measured by nitrogen porosimetry. Two other Important consequences ot pyrolysis are the ability to control the surface properties (degree of hydrophobic s ) and excellent mechanical stability.
PERFORMANCE BENEFITS
The benefits for this unique physical structure are:
• High macro and meso porosity result in last moss transfer to the micropores where adsorption occurs (fast kinetics)
• High microporosity and surface area result in excellent capacity
• Excellent physical Integrity eliminates concern about dusting or attrition
• In tltu regeneration can be easily achieved using steam or other cost-effective regenerants
• The properties of Ambersorb adsorbents are extremely REPRODUCIBLE
NEW GENERATION OF AMBERSORB ADSORBENTS
o The new generation of Ambersorb adsorbents consists of five products which differ In surface areo pore size distribution and surface properties
TABLE I
MS SurfoceArecr m'/O 550 550
Maoporodhr*'«• *'. ml/g ..;«, 023 024
Metoporotlty-
ml/g 014 0 13
MocropoiCTty- i rrXto - -d-*-- **» rte 021
Ash Content, % <005 <005
I • - l , v ' • • ' " -
Buck Density lb»/ff 33 38
PRODUCT DESCRIPTION
34*
Outlined in Table 1 are the typical properties for the new famlty ot Ambersorb adsorbents. These properties are typical and should not be considered as specifications
' . . . . • ' ! * . ^
Arntoertoiti \ 1109" I
S7S
750 800
032 032'
012 020
oi3.-': * 020 '••
<005 <005
aofoso - aofoioo .•; ,SDk>so-
35 34
g/CC , / • / ".>;, 053 . OoO -.'' OS6 ' ' ; . " 6£f Surface oiea Single Point Miaomemics 2303 * \ tfogon ooroumetry Mtciomwlo 2400
ass
S72
1100
041
019
<005
XtoSO
049
1100
049
014
024 •:, / f 0 3 2 * •"
<005
SO to 100
27 0M... I
APPUCATION AREAS PHYSICAL PROPERTIES
The unique properties ot the Ambersorb adsorbents result in superior performance characteristics for a diverse range ot liquid ond vapor phase applications Ambersorb adsorbents otfer an attractive alternative to many competitive technologies
Some examples ol end use applications are listed below: • High Value Separations
• Groundwater Remeaiaiion
• Spill Cleanup • Waste Water Treatment
• Vapor Phase Treatment ot Toxic Air Emissions
• Odor Control
• Protective Clothing
• Catolysls/Calalysl Supports
• Ultrapuie Water Applications
Pressure Drop Characteristics
The pressure drop characteristics ol the Ambersorb adsorbents as a function ol water temperature and flow rate are given in Figure I Pressure drop data lor vapor phase applications are given in Figure 2.
FIG. 2 TYPICAL PRESSURE DROP CHARACTERISTICS FOR AIR AT AMBIENT CONDITIONS
Pressure drop (In. H,0/ft. bed depth)
0 20 40 60 80 100 Superficial gas velocity (fl/min)
FIG. I AMBERSORB ADSORBENTS PRESSURE DROP VS LINEAR FLOW RATE
Pressure Drop (psl/lt bed depth)
Unear Flow Rote (apm/IP)


Appendix C
Data on Granular Activated Carbon
This appendix provides data used on Calgon granular activated carbon (GAC). A chart presenting data on the adsorption capacity of liquid phase GAC is also provided.
Evaluation of Organic Sponges for CVOC Abatement C-l
in-103

Loading (mg/g)
CONCENTRATION VERSUS LOADING Fil trasorb 300 Carbon
1000 F
100
10
0.1 E
0.01
~:'r^n:r - ^ r - r r r v : ' T .. .-.-•.-.r.--:::-: :.——.— .-.—rn.~:;--;rr-rrrr •:::---:-r.--=-r=n-.--' ~ _ - •• :i. I • - - r t - r t - i...^...i...,jr :— •: - ; ; ; = : : . : : . . .
1 ; — J . i...^...i...,jr .' • • • • : - . • • • ; • • ! - • •
1 = = =,= ! M = = ' 1 : : ; M * 1. —' - - ; ; : •; •••? \
• } " . : • . i = !";" ! " • • : • T ; \*-rt " " ! ! n,i.\r. • !' . M ; ! l- MM ! MM! i ! Mil -"" t i i i i t.- : trani i n Mi
• • • — : ^ -
. z r n n ;—r r—a r*~ """• ' ^ : : • ' -f ' T ' •""•' , , • : ' . ' • : - - • ; • ' •
• ; > * • • i | . . . ^ j . ~ ' L V ^ ; r 1 : ; : ' • M ; ; .- : : . : ' i = ^^ rTn - ^ - " r - : 5 = .' ^ . - -. : . - • • : - ; M • .-M • M i il *-oV>"? i ^>^ rui i i J ^ J J - " h I y < M ! 1
MM a • U - 1 ^ M""nf [ ^ 1 j
• > - i : I : : M ! ! !
—.^srf\— — , — j ^
.— 1 -. l " * ' . • : = • * . fS^' : —t^^rrr » — • * - * - * - ^ | X" -• * : • : . : , — , , j , i j .
= ^ > r ^ : • : • - •jf '•
• i ! i ! -1 i ^H-H •^S* > " •:• r :• i . : >= ! ' : ; : ; : = , i • i ! i - . J r ^ M i h , r ^ - ^ i i i ; • ! / M ii - n i l ' : i i i i i ! i !
; i : = : : - ,.]
...... „^w . . . , i in •X MM i! 1 iil j s i i • - .
— • • * - — G f \ ° - — ^ ni4.— :: z:~- i 1—iJ-r-z-r-:::-• - . — • • * - — G f \ ° - — ^ ni4.— 1—iJ-r-z-r-:::-
" " ; '[ ! ! ; ! I ; ; ! !' ! 1 ! ..jy^^xi • ' • • • • ; ; i t • i ; i 1: • ; ; M ; 1: . . . . . . . . . . • - ; • - • • • • ; ! ' ; ; ; ; p^• •r~ ; ..U.U;. : ; 1 ' !=: i 1 ! i . I i!
; • -: ' : : ' : i i ; >T:iI X i • i ! = = i I " T ; = ! \ ' • • • • •: ' • i i - i ; • ! • • - : •
: ; : . = : ^ ! • • = : • • ;
i : MM; : i l ! i ! : • • ' . • : ' :
: • ; : : i ; ;
_ ....... . - — o z r x ^ r r - i •• r-~rrz r— • - , • • •
' ! ••: : I | ; • : ' ; ;'r
- \— - £ = _ z •- T ... _ _ i r T ; • • :
- \— - £ = _ z •- T ... _ _ i r T : : = • = • • : • • • :
i i l i l i i i * ^ - r •• rTTITT
— iiiiiii i i i M i l l
i 1 r r Ht i M I I I I ••rrnrir
i i M I I I
= i M M ; ; i • • : — r - - r • : = : : s
1 1 1 I II ! i i i i i i ; 0.001 0.01 0.1 1 10
Concentration (ppm)
100 1000
d Lln«» • Isotherm Extrapolations Estimated from snotfiar oowpound
in-104 C-2

TYPE BPL GRANULAR CARBON
MESH SIZES: 4 x 6 and 4 x 8
B o
Type BPL Activated Carbon is designed for use in vapor phase applications, and is available in several mesh sizes to suit specific design requirements. It is made from selected grades of bituminous coal combined with suitable binders. These binders impart the superior hardness that is necessary for the long life expected in such applications. Produced under rigidly controlled conditions by high icmp;r*iure steam activation, BPL Carbon provides high surface area, fine pore structure, high densitv. high volume activity and ease of regeneration.
~ . • BPL Carbon is used in all types of vapor phase adsorption. A typical use is solvent recovery where BPL is used for the adsorption and recovery of -alcohols, chlorinated hydrocarbons, esters, ketones, ethers, hydrocarbons, and aromatics.
Type BPL is used almost universally as the catalyst support in the acetylene process for the production of vinyl chloride and vinyl acetate monomers. Here, high conversion rates and ex-
' ceedingly long life mark its performance. It is also used as a direct catalyst in the production of phosgene and olhc. similar reactions.
In fixed-bed adsorbers. Type BPL is used for the separation of hydrocarbon gas streams, such as the recovery of C. and C. cuts from natural gas. Similarly, organic sulfur, COS, and high molecular weight hydrocarbons arc stripped from methane and hydrogen for catalytic conversion processes.
SPECIFICATIONS Iodine Number, Minimum Carbon Tetrachloride Adsorption,
Minimum. Weight ?• Ash, Maximum, °7» Moisture (as packed). Maximum, rt Hardness Number, Minimum
Other applications include purification of carbon dioxide for beverage use and dry ice; removal of chlorine, chlorinated organics and aromatics from anhydrous hydrogen chloride; purification of acetylene, hydrogen, compressed air. etc.
Air sterilization for aerobic fermentation can be accomplished with deep beds of BPL. It is widely used in air conditioning systems and for abatement of air pollution where plant air exhausts ate odorous or harmful.
SCREEN SIZE SPECIFICATIONS. U.S. SIEVE SERIES TYPE BPL STANDARD MESH SIZES
Sieve No .
4 x 6 " j Retained
IS MAX - 7 3 MAX
Sieve No . • 4
4 x 8 <"o Retained
10 MAX
6 x 3 30-50 - 8 5 MAX
4 X 6 4 X 1 1000 1000
60 60 10 10 > 2
95 95
n
PORE STRUCTURE The micropore structure of Type BPL carbon is illustrated at the right where the cumulative pore volume is plotted against pore diameter. The pore Si7e distribution data are obtained from the water dcsorption isotherm.' Examination of the curve indicates that a large portion of this micropore volume is in pores of 15 to 20 Angstrom units in diameter. These small pores are accessible to all common gases and vapors, and therefore provide :he maximum surface area for adsorption. The structure of the pores provides good retention of the adsorbed molecules while at the same lime allowing high working capacities in systems providing for regeneration of the carbon.
In addition to the micropore structure. Type BPL is permeated by a system of macropore* (pores larger than 1000 Angstroms in diameter) which serve as avenues for the rapid diffusion of gases to and from the micropore surfaces. This enhances both adsorption and reactivation characteristics. I ,'uho a inn W M | Am Owm $ « U 1049 t t W l
PRESSURE DROP CHARACTERISTICS Pressure drop, in inches of water per foot of bed depth, measured in air at 70'F. is presented for the ;wo mesh sizes of BPL Carbon. These data were obtained with a dense packing arrangement (30 lbs./ft. ') and should be used for design purposes.
Loose packed beds (26 lbs. / f t . 1 ) give a pressure drop approximately one-half of a dense bed. Pressure drop for other gases can be obtained from your C.'algon Carbon representative.
pftessime DRO» VS VELOCITY on. 411 MSSH
lU»far>C,4i VflOClT'_#*'M.M
pnisiuRi DRO> v» veioarr W i l l MESH
<U»t*"CUl VflOClt*-'f""«
•one size DisMisuiioN • m t«4
t • 1 I i '1 ' K tCOt l f«M *ft40« «|I0*44» «0M4O4
•ONI 0UM*4!IRMN0|f4O»b I 0 0 4CMI
Tvpieal Physical Properties: Total Surface Area
(N„ BET Method), m'/g IOS0-I ISO Apparent Density (Bulk Density.
dense packing), Tvpical, g/cc 0.48 "*" lb/ft 1 J O . 0 ^
Particle Density (Hg Displacement), g/cc 0.S0 Real Density (He Displacement), g/cc 2.1 Pore VolumcfWithin Particle), cc/g 0.8 Voids in Dense Packed Column, "o 39 Specific Heat at 100'C 0.25
COMMERCIAL INFORMATION Shipping Points: Pittsburgh, Pennsylvania; Catlcttsburg. Kentucky. Mesh Sizes: 4 x 6 and 4 x 8 U. S. Sieve Series. Packaging: Packed in 55 gallon Leverpak drums, :00 lb. net. 217 lb. gross weight.
For additional information, contact tht Cotton Carbon Coroarallnn


Appendix D
Envirex Estimate
This appendix provides preliminary cost estimates provided by Envirex Ltd. for biodegradation of TCE contaminated water when treated by their fluidized bed GAC reactor.
Evaluation of Organic Sponges for CVOC Abatement D-l
m-i07

:V: ::V:': : ::Y:- :^^^^^
FAX TO: COMPANY: PAX NO:
Habib Amin
Bechtel
415-768-3580 PHONEt 41b-768-3118 DATE: December 8, 1993 FROM: Jeff Devine 414-521-8208
Sr. Process Engineer Page: 1 of 15 pages Subject: Fluid Bed Treatment of T C K
Contaminated Wastewater ::;:;::::x p;'; iir :: S i s a g ^ S ^ • you..: . •' |j
Habib, Included with this fax are the computer print-outs of three additional scenarios for fluid bed treatment of the TCE contaminated wastewater. Also included is an example of our Work Scope for supply of an FBR. The work Scope is for our Model 370 skid unit.
The Options 5 and 6 are for a flow of 5.2 qpm and 1100 ppm TCE. Option 7 is a full-scale design of an 18-ft diameter reactor to treat 600 gpm of 55 mg/1 TCE. This would not be a skid mounted system.
Please let me know if you require additional input from Envirex for this work.
Regards,
ni-108 D-2

ENVIREXLTD. GAT-FLUID HED
* AVE. CONDITIONS *
INF. CHARACTERISTICS:
FLOW (GPM) BTEX <mg/l)
BENZENE TOLUENE T-XYLENES ETH BENZENE OTHER AROMATICS
AMMONIA-N (mg/l) TPH'S (mg/l) CHLORINATED (mg/l) PHENOL (mg/l) IRON (mg/l) TEMP DEG F
PROJECT: DATE:
BSChtel 12/8/93
—TCE
OPTION 5
5.2 FLOW (MGD)
OPTION
0.01 0.0 BTEX (#/D)
OPTION
o.o 0.0 BTX-COD(mg/l)
BTX-OD(mg/l)
BTX-OD (#/D) NH3 OD <#/D) TPH COD (#/D) CL ORG OD (#/D) TOTAL COD (mg/l) TOTAL COD (#/D) T02 DEMAND (#/D)
OPTION
0.0 0.0
BTX-COD(mg/l) BTX-OD(mg/l)
BTX-OD (#/D) NH3 OD <#/D) TPH COD (#/D) CL ORG OD (#/D) TOTAL COD (mg/l) TOTAL COD (#/D) T02 DEMAND (#/D)
OPTION
0.0 0.0
BTX-COD(mg/l) BTX-OD(mg/l)
BTX-OD (#/D) NH3 OD <#/D) TPH COD (#/D) CL ORG OD (#/D) TOTAL COD (mg/l) TOTAL COD (#/D) T02 DEMAND (#/D)
OPTION
0.0
BTX-COD(mg/l) BTX-OD(mg/l)
BTX-OD (#/D) NH3 OD <#/D) TPH COD (#/D) CL ORG OD (#/D) TOTAL COD (mg/l) TOTAL COD (#/D) T02 DEMAND (#/D)
OPTION
0.0
BTX-COD(mg/l) BTX-OD(mg/l)
BTX-OD (#/D) NH3 OD <#/D) TPH COD (#/D) CL ORG OD (#/D) TOTAL COD (mg/l) TOTAL COD (#/D) T02 DEMAND (#/D)
OPTION
0.0 0.0
BTX-COD(mg/l) BTX-OD(mg/l)
BTX-OD (#/D) NH3 OD <#/D) TPH COD (#/D) CL ORG OD (#/D) TOTAL COD (mg/l) TOTAL COD (#/D) T02 DEMAND (#/D)
OPTION
0.0 0.0
BTX-COD(mg/l) BTX-OD(mg/l)
BTX-OD (#/D) NH3 OD <#/D) TPH COD (#/D) CL ORG OD (#/D) TOTAL COD (mg/l) TOTAL COD (#/D) T02 DEMAND (#/D)
OPTION
0.0 1100.0 1100.0
BTX-COD(mg/l) BTX-OD(mg/l)
BTX-OD (#/D) NH3 OD <#/D) TPH COD (#/D) CL ORG OD (#/D) TOTAL COD (mg/l) TOTAL COD (#/D) T02 DEMAND (#/D)
OPTION
26.1 !025.0
0.0
BTX-COD(mg/l) BTX-OD(mg/l)
BTX-OD (#/D) NH3 OD <#/D) TPH COD (#/D) CL ORG OD (#/D) TOTAL COD (mg/l) TOTAL COD (#/D) T02 DEMAND (#/D)
OPTION
188.3 65.0
BTX-COD(mg/l) BTX-OD(mg/l)
BTX-OD (#/D) NH3 OD <#/D) TPH COD (#/D) CL ORG OD (#/D) TOTAL COD (mg/l) TOTAL COD (#/D) T02 DEMAND (#/D)
OPTION
160.4
ACTUAL DESIGNS REACTOR DIAM NO. REACTORS BED DEPTH (FT) FLUX (GPM/FT2) TCOD LOAD (#/OTCCF)
| BTXCOD LP (#/DKCF)
8.0
14 13
268 0
BED VOL (FT3) R+Q FLOW (GPM) R/Q RATIO HRT (MIN) CARBON {# ea) CARBON TOTAL
#/D 02 USED EFF 02 (mg/l) REACTOR INF 02 TSS OUT (mg/l)
1 6 0 . 6 2 . 0
2 2 . 5 5 1 4 . 3
PSA SIZE (SCFH)
TSS (#/DAY)
117
3 2 . 1
IH-109 D-3
•^*;s^'^:?:.-*s*s&.&v; •

ESTIMATED OPERATING COSTS
Hefiht:e.l—TCE
ELECT COST (S/KWhr)
FLUID PUMP BHP ea: PBC PUMP BHP ea: CR CONTROL HP
NO. UNITS DlAMETKR
OXXGKN PSA (#/D)
STD NUTR (GAL/D)
CAUSTIC SODA (#/D)
ATTRITION (#/D)
$0.06
7.9 7.8 1.5
1 8.0
161
3.3
63.1
3
PUMP EFF % MOTOR EFF %
PUMP $/D PUMP $/D PUMP S/D
TOTAL PUMP $/D
02 $/D
NUTK §/D
CAUSTIC $/D
CARBON ($/D)
TOTAL DAILY
TOTAL ANNUAL.
78 94
$8.46 S8.37 SI.61
$18.44
$4.34
$4.28
$16.42
$3.30
$46.77
$17,070.86
9ASIS: Complete skid package
inciudss installation assistance
end s tar t up. Concrete pad
required
I.MCLUDCS: engineering, all equipment
r.r jntrnis/ir istnim«ntntion. carbon.
02 generator, s t c r t - u p , training
MAIL tfASIS: SO A ss reactor, gclv.
structural skid, NCM.A 4-X ss panel
(JVC piping/valves, modulated DO control
BUDGETARY CAPITAL COST
CAPITAL.. $ 4 5 0 , 0 0 0
in-iio D-4

* AVE. CONDITIONS *
INF. CHARACTERISTICS:
FLOW (GPM) BTEX (mg/l)
BENZENE TOLUENE T-XYLENES ETH BENZENE OTHER AROMA' 'ICS
AMMONIA-N ( m g / l ) TPH'S ( m g / l ) CHLORINATED (mg/l) PHENOL (mg/l) IRON (mg/l) TEMP DEG F
ENV1REX LTD. GAr.-FlUE) BED
PROJECT: DATE:
D e c h t e l 3 2 / 8 / 9 3
—TCE
OPTION 6
| 5 - 2 FLOW (MGD)
OPTION
0 . 0 1 0 . 0 BTEX < # / D )
OPTION
0 . 0 0 . 0 B T X - C O D ( m g / l )
B T X - O D ( m g / l )
BTX-OD ( # / D ) NH3 OD ( # / D ) TPH COD ( # / D ) CL ORG OD ( # / D ) TOTAL COD ( m g / l ) TOTAL COD ( # / D ) T02 DEMAND ( # / D )
OPTION
0 . 0 o.o"
B T X - C O D ( m g / l ) B T X - O D ( m g / l )
BTX-OD ( # / D ) NH3 OD ( # / D ) TPH COD ( # / D ) CL ORG OD ( # / D ) TOTAL COD ( m g / l ) TOTAL COD ( # / D ) T02 DEMAND ( # / D )
OPTION
0 . 0 o.u
B T X - C O D ( m g / l ) B T X - O D ( m g / l )
BTX-OD ( # / D ) NH3 OD ( # / D ) TPH COD ( # / D ) CL ORG OD ( # / D ) TOTAL COD ( m g / l ) TOTAL COD ( # / D ) T02 DEMAND ( # / D )
OPTION
0 . 0
B T X - C O D ( m g / l ) B T X - O D ( m g / l )
BTX-OD ( # / D ) NH3 OD ( # / D ) TPH COD ( # / D ) CL ORG OD ( # / D ) TOTAL COD ( m g / l ) TOTAL COD ( # / D ) T02 DEMAND ( # / D )
OPTION
0 . 0
B T X - C O D ( m g / l ) B T X - O D ( m g / l )
BTX-OD ( # / D ) NH3 OD ( # / D ) TPH COD ( # / D ) CL ORG OD ( # / D ) TOTAL COD ( m g / l ) TOTAL COD ( # / D ) T02 DEMAND ( # / D )
OPTION
0 . 0 , 0 . 0
B T X - C O D ( m g / l ) B T X - O D ( m g / l )
BTX-OD ( # / D ) NH3 OD ( # / D ) TPH COD ( # / D ) CL ORG OD ( # / D ) TOTAL COD ( m g / l ) TOTAL COD ( # / D ) T02 DEMAND ( # / D )
OPTION
0 . 0 0 . 0
B T X - C O D ( m g / l ) B T X - O D ( m g / l )
BTX-OD ( # / D ) NH3 OD ( # / D ) TPH COD ( # / D ) CL ORG OD ( # / D ) TOTAL COD ( m g / l ) TOTAL COD ( # / D ) T02 DEMAND ( # / D )
OPTION
0 . 0 1 1 0 0 . 0
B T X - C O D ( m g / l ) B T X - O D ( m g / l )
BTX-OD ( # / D ) NH3 OD ( # / D ) TPH COD ( # / D ) CL ORG OD ( # / D ) TOTAL COD ( m g / l ) TOTAL COD ( # / D ) T02 DEMAND ( # / D )
OPTION
2 6 . 1 1 1 0 0 . 0
B T X - C O D ( m g / l ) B T X - O D ( m g / l )
BTX-OD ( # / D ) NH3 OD ( # / D ) TPH COD ( # / D ) CL ORG OD ( # / D ) TOTAL COD ( m g / l ) TOTAL COD ( # / D ) T02 DEMAND ( # / D )
OPTION
$ 0 2 5 , 0 0 . 0
B T X - C O D ( m g / l ) B T X - O D ( m g / l )
BTX-OD ( # / D ) NH3 OD ( # / D ) TPH COD ( # / D ) CL ORG OD ( # / D ) TOTAL COD ( m g / l ) TOTAL COD ( # / D ) T02 DEMAND ( # / D )
OPTION
1 8 8 . 8 6 5 . 0
B T X - C O D ( m g / l ) B T X - O D ( m g / l )
BTX-OD ( # / D ) NH3 OD ( # / D ) TPH COD ( # / D ) CL ORG OD ( # / D ) TOTAL COD ( m g / l ) TOTAL COD ( # / D ) T02 DEMAND ( # / D )
OPTION
1 6 0 . 4
ACTUAL DESIGNS REACTOR DIAM NO. REACTORS BED DEPTH (FT) FLUX (GPM/FT2)
6 . 0 REACTOR DIAM NO. REACTORS BED DEPTH (FT) FLUX (GPM/FT2)
2 REACTOR DIAM NO. REACTORS BED DEPTH (FT) FLUX (GPM/FT2)
1 1
REACTOR DIAM NO. REACTORS BED DEPTH (FT) FLUX (GPM/FT2) 13 TCOD LOAD (§/DKCF) BTXCOD LD (# /DKCF)
3 0 3 0
BED VOL (FT3) R+O FLOW (GPM) R/Q RATIO HRT (MIN) CARBON (# ea] CARBON TOTAL
311 368
140.4 895
4665 9331
#/D 02 USED EFF 02 (mg/1) REACTOR INF 02 TSS OUT (mg/l)
1 6 0 . 6 2 . 0
2 0 - 2 5 1 4 . 3
PSA SIZE! (SCFH)
TSS (#/DAY)
117
3 2 . 1
m-iii D-5

ELECT COST (S/KWhr)
FLUID PUMP BHP ea: PBC PUMP BHP ea: GR CONTROL HP
NO. UNITS DIAMETER
OXYGEN PSA <*/D)
STD NUTR (GAL/D)
CAUSTIC SODA (#/D)
ATTRITION (#/D)
ESTIMATED Bechte ••I—TCE OPERATING COSTS OPTlOKi fe
$0.06 PUMP EFF % 70 MOTOR EFF % 94
10.0 PUMP $/D $10. /4 0.0 PUMP $/D $0.00 0.5 PUMP $/D $0.54
2 TOTAL PUMP $/D $22.55 6.0
161 02 $/D $4.34
3.3 NUTR $/D $4.28
G3.1 CAUSTIC $/D $16.42
3 CARBON ($/D)
TOTAL DAILY
$2.91 CARBON ($/D)
TOTAL DAILY $50.50
TOTAL ANNUAL $18 ,432.69
BUDGETARY CAPITAL COST
BASiS: Complete skid pot;kuge includes installation assistance and start up. Concrete pad required.
INCLUDES: engineering, all equipment controls/instrumentation, carbon, 02 generator, start-up, training
MATL BASIS: 30-1 ss reactor, galv. structural skid, NEMA CX ss panel PVC piping/valves, modulated DO control
CAPITAL. $ 5 5 0 , 0 0 0
ffl-112 D-6
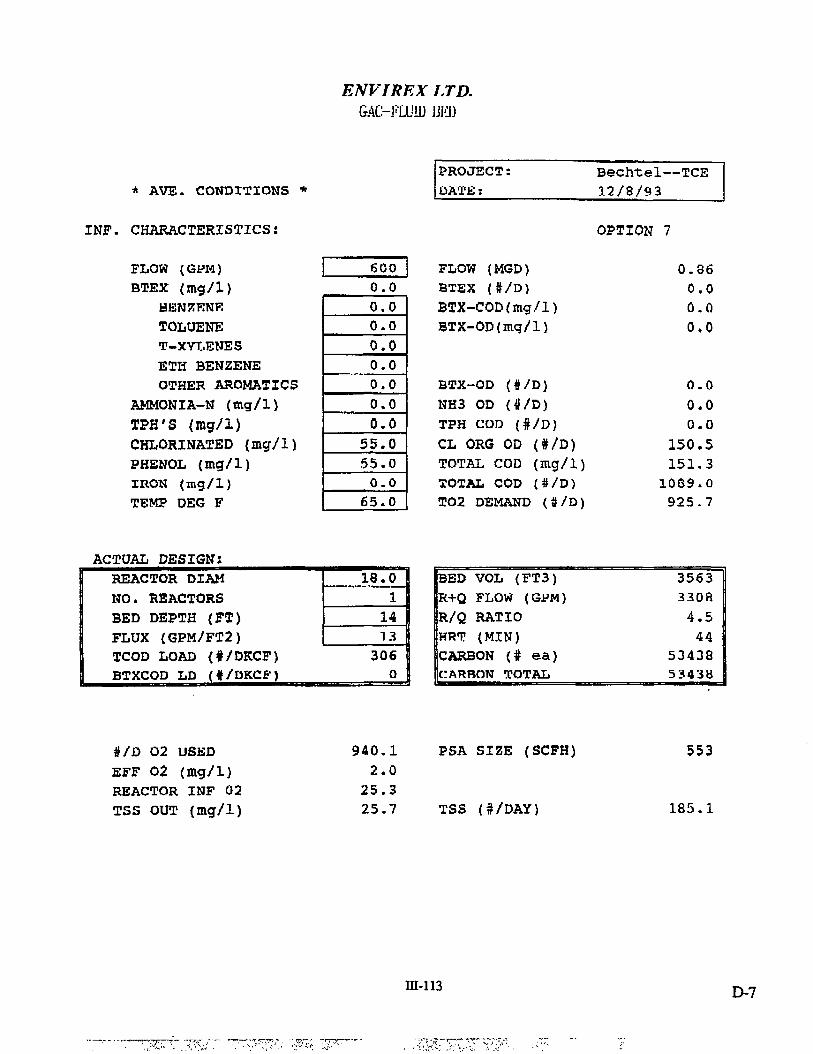
ENVIXKX LTD. GAC-i'LUiU JJEI)
* AVE. CONDITIONS *
INF. CHARACTERISTICS:
FLOW (Gen) BTEX (mg/1)
HENZENK TOLUENE T-XYLENES ETH BENZENE OTHER AROHATICS
AMMONIA-N (mg/1) TPH'S (mg/1) CHLORINATED (mg/1) PHENOL (mg/1) IRON (mg/1) TEMP DEG F
PROJECT: DATE:
Bechtel 12/8/93
— T C E
OPTION 7
600 FLOW (MGD)
OPTION
0.86 0.0 BTEX (#/D)
OPTION
0.0 0,0 BTX-COD(mg/l)
BTX-OD(mg/l)
BTX-OD (#/D) NH3 OD <#/D) TPH COD (#/D) CL ORG OD (#/D) TOTAL COD (mg/1) TOTAL COD (#/D) T02 DEMAND (#/D)
OPTION
0.0 0.0
BTX-COD(mg/l) BTX-OD(mg/l)
BTX-OD (#/D) NH3 OD <#/D) TPH COD (#/D) CL ORG OD (#/D) TOTAL COD (mg/1) TOTAL COD (#/D) T02 DEMAND (#/D)
OPTION
0.0 0.0
BTX-COD(mg/l) BTX-OD(mg/l)
BTX-OD (#/D) NH3 OD <#/D) TPH COD (#/D) CL ORG OD (#/D) TOTAL COD (mg/1) TOTAL COD (#/D) T02 DEMAND (#/D)
OPTION
0.0
BTX-COD(mg/l) BTX-OD(mg/l)
BTX-OD (#/D) NH3 OD <#/D) TPH COD (#/D) CL ORG OD (#/D) TOTAL COD (mg/1) TOTAL COD (#/D) T02 DEMAND (#/D)
OPTION
0.0
BTX-COD(mg/l) BTX-OD(mg/l)
BTX-OD (#/D) NH3 OD <#/D) TPH COD (#/D) CL ORG OD (#/D) TOTAL COD (mg/1) TOTAL COD (#/D) T02 DEMAND (#/D)
OPTION
0.0 0.0
BTX-COD(mg/l) BTX-OD(mg/l)
BTX-OD (#/D) NH3 OD <#/D) TPH COD (#/D) CL ORG OD (#/D) TOTAL COD (mg/1) TOTAL COD (#/D) T02 DEMAND (#/D)
OPTION
0.0 0.0
BTX-COD(mg/l) BTX-OD(mg/l)
BTX-OD (#/D) NH3 OD <#/D) TPH COD (#/D) CL ORG OD (#/D) TOTAL COD (mg/1) TOTAL COD (#/D) T02 DEMAND (#/D)
OPTION
0.0 55.0
BTX-COD(mg/l) BTX-OD(mg/l)
BTX-OD (#/D) NH3 OD <#/D) TPH COD (#/D) CL ORG OD (#/D) TOTAL COD (mg/1) TOTAL COD (#/D) T02 DEMAND (#/D)
OPTION
150.5 55.0
BTX-COD(mg/l) BTX-OD(mg/l)
BTX-OD (#/D) NH3 OD <#/D) TPH COD (#/D) CL ORG OD (#/D) TOTAL COD (mg/1) TOTAL COD (#/D) T02 DEMAND (#/D)
OPTION
151.3 0.0
BTX-COD(mg/l) BTX-OD(mg/l)
BTX-OD (#/D) NH3 OD <#/D) TPH COD (#/D) CL ORG OD (#/D) TOTAL COD (mg/1) TOTAL COD (#/D) T02 DEMAND (#/D)
OPTION
1089.0 65.0
BTX-COD(mg/l) BTX-OD(mg/l)
BTX-OD (#/D) NH3 OD <#/D) TPH COD (#/D) CL ORG OD (#/D) TOTAL COD (mg/1) TOTAL COD (#/D) T02 DEMAND (#/D)
OPTION
925.7
ACTUAL DESIGN: REACTOR DIAM NO. REACTORS BED DEPTH (FT) FLUX (GPM/FT2) TCOD LOAD <#/DKCF) BTXCOD LD (•/DKCF)
18.0 BED VOL (FT3) 3563 R+Q FLOW (GfM) 3308 R/Q RATIO 4.5 HRT (MIN) 44 CARBON (# ea) 53438 CARBON TOTAL 53438
#/D 02 USED EFF 02 (mg/1) REACTOR INF 02 TSS OUT (mg/1)
9 4 0 . 1 2 . 0
2 5 . 3 2 5 . 7
PSA SIZE (SCFH)
TSS (#/DA7)
553
1 8 5 . 1
m-113 D-7

ELECT COST ($/KWhr)
FLUID PUMP BHP ea: PBC PUMP BHP ea: GR CONTROL HP
NO. UNITS DIAMETER
OXYGEN PSA (#/D)
STD NUTR («AL/D)
CAUSTIC SODA <#/D)
ATTRITION <#/D)
ESTIMATED aecritel—TC:E OPERATING COSTS OPTIC **» "7
$0.06 PUMP EFF % 78 MOTOR EFP % 94
39.9 PUMP S/D $42.80 39.5 PUMP S/D $42.38 3.0 PUMP $/D $3.22
1 TOTAL PUMP $/D $88.40 18.0
940 02 $/D $25.38
19.2 NUTR $/D $24.71
364.3 CAUSTIC S/D $94.72
18 CARBON ($/D)
TOTAL DAILY
$16.69 CARBON ($/D)
TOTAL DAILY $249.90
TOTAL ANNUAL... $91,213.88
BUDGETARY CAPITAL COST
BASIS: Reactors only installed on eustomir's concrete non-union site, does not include interconnecting pipe, mcc, building, finish paint/insul
INCLUDES: engineering, all equipment controls/instrumentation, cur bon, 02 generator, pbc, start-up, training
MATL BASIS: API 650 tanWs/Plnsite IV)"? int ANSI 31.3 steel pipe, ductile pumps, ductile valves/ss trim CAPITAL, $ 1 , 2 5 0 , 0 0 0
I J J - 1 1 4 tyU.S. GOVERNMENT PRINTING OFFICE: 1995-650-190/20002
Copyright © 2022 FDOKUMEN