Ground-motion prediction equations for the intermediate depth Vrancea (Romania) earthquakes
22
Bull Earthquake Eng (2008) 6:367–388 DOI 10.1007/s10518-008-9065-6 ORIGINAL RESEARCH PAPER Ground-motion prediction equations for the intermediate depth Vrancea (Romania) earthquakes Vladimir Sokolov · Klaus-Peter Bonjer · Friedemann Wenzel · Bogdan Grecu · Mircea Radulian Received: 10 November 2007 / Accepted: 8 March 2008 / Published online: 27 March 2008 © Springer Science+Business Media B.V. 2008 Abstract We present the regional ground-motion prediction equations for peak ground acceleration (PGA), peak ground velocity (PGV), pseudo-spectral acceleration (PSA), and seismic intensity (MSK scale) for the Vrancea intermediate depth earthquakes (SE-Carpathians) and territory of Romania. The prediction equations were constructed using the stochastic technique on the basis of the regional Fourier amplitude spectrum (FAS) source scaling and attenuation models and the generalised site amplification functions. Values of considered ground motion parameters are given as the functions of earthquake magnitude, depth and epicentral distance. The developed ground-motion models were tested and cal- ibrated using the available data from the large Vrancea earthquakes. We suggest to use the presented equations for the rapid estimation of seismic effect after strong earthquakes (Shakemap generation) and seismic hazard assessment, both deterministic and probabilistic approaches. Keywords Vrancea region · Strong ground motion · Prediction equations V. Sokolov (B ) · K.-P. Bonjer · F. Wenzel Geophysical Institute, Karlsruhe University, Hertzstr.16, Karlsruhe, Germany e-mail: [email protected] K.-P. Bonjer e-mail: [email protected] F. Wenzel e-mail: [email protected] B. Grecu · M. Radulian National Institute for Earth Physics, PO Box MG-2, Bucharest-Magurele, Romania e-mail: [email protected] M. Radulian e-mail: [email protected] 123
-
Upload
independent -
Category
Documents
-
view
1 -
download
0
Transcript of Ground-motion prediction equations for the intermediate depth Vrancea (Romania) earthquakes
Bull Earthquake Eng (2008) 6:367–388DOI 10.1007/s10518-008-9065-6
ORIGINAL RESEARCH PAPER
Ground-motion prediction equations for the intermediatedepth Vrancea (Romania) earthquakes
Vladimir Sokolov · Klaus-Peter Bonjer ·Friedemann Wenzel · Bogdan Grecu ·Mircea Radulian
Received: 10 November 2007 / Accepted: 8 March 2008 / Published online: 27 March 2008© Springer Science+Business Media B.V. 2008
Abstract We present the regional ground-motion prediction equations for peak groundacceleration (PGA), peak ground velocity (PGV), pseudo-spectral acceleration (PSA), andseismic intensity (MSK scale) for the Vrancea intermediate depth earthquakes(SE-Carpathians) and territory of Romania. The prediction equations were constructed usingthe stochastic technique on the basis of the regional Fourier amplitude spectrum (FAS) sourcescaling and attenuation models and the generalised site amplification functions. Values ofconsidered ground motion parameters are given as the functions of earthquake magnitude,depth and epicentral distance. The developed ground-motion models were tested and cal-ibrated using the available data from the large Vrancea earthquakes. We suggest to usethe presented equations for the rapid estimation of seismic effect after strong earthquakes(Shakemap generation) and seismic hazard assessment, both deterministic and probabilisticapproaches.
Keywords Vrancea region · Strong ground motion · Prediction equations
V. Sokolov (B) · K.-P. Bonjer · F. WenzelGeophysical Institute, Karlsruhe University, Hertzstr.16, Karlsruhe, Germanye-mail: [email protected]
K.-P. Bonjere-mail: [email protected]
F. Wenzele-mail: [email protected]
B. Grecu · M. RadulianNational Institute for Earth Physics, PO Box MG-2, Bucharest-Magurele, Romaniae-mail: [email protected]
M. Raduliane-mail: [email protected]
123
368 Bull Earthquake Eng (2008) 6:367–388
1 Introduction
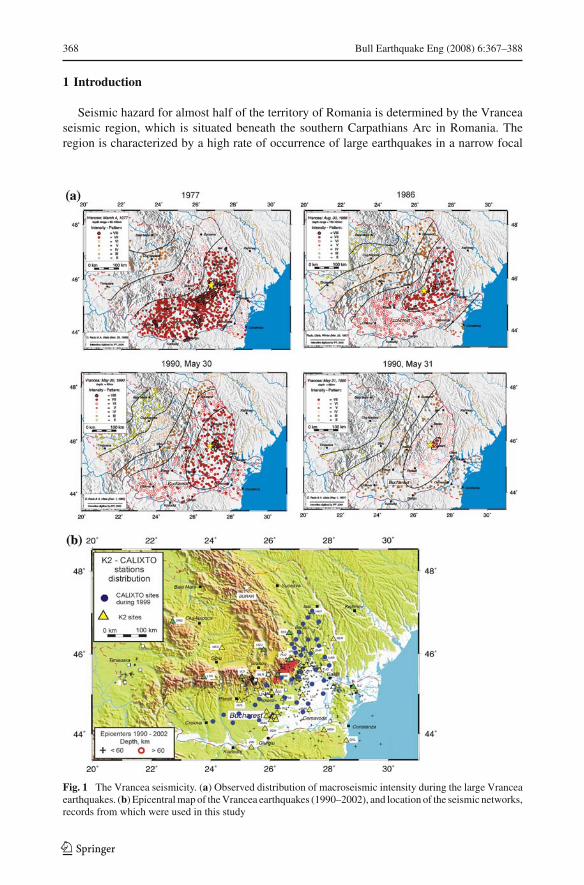
Seismic hazard for almost half of the territory of Romania is determined by the Vranceaseismic region, which is situated beneath the southern Carpathians Arc in Romania. Theregion is characterized by a high rate of occurrence of large earthquakes in a narrow focal
Fig. 1 The Vrancea seismicity. (a) Observed distribution of macroseismic intensity during the large Vranceaearthquakes. (b) Epicentral map of the Vrancea earthquakes (1990–2002), and location of the seismic networks,records from which were used in this study
123
Bull Earthquake Eng (2008) 6:367–388 369
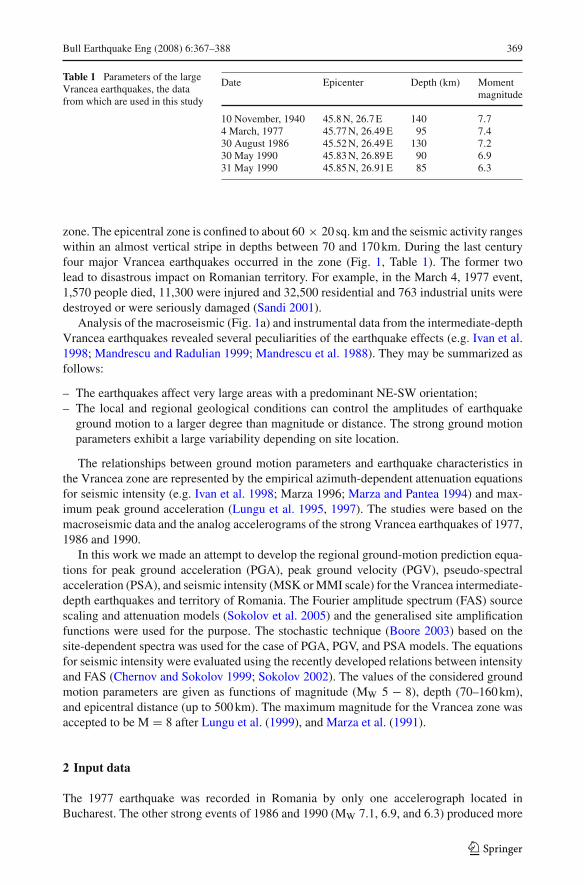
Table 1 Parameters of the largeVrancea earthquakes, the datafrom which are used in this study
Date Epicenter Depth (km) Momentmagnitude
10 November, 1940 45.8 N, 26.7 E 140 7.74 March, 1977 45.77 N, 26.49 E 95 7.430 August 1986 45.52 N, 26.49 E 130 7.230 May 1990 45.83 N, 26.89 E 90 6.931 May 1990 45.85 N, 26.91 E 85 6.3
zone. The epicentral zone is confined to about 60 × 20 sq. km and the seismic activity rangeswithin an almost vertical stripe in depths between 70 and 170 km. During the last centuryfour major Vrancea earthquakes occurred in the zone (Fig. 1, Table 1). The former twolead to disastrous impact on Romanian territory. For example, in the March 4, 1977 event,1,570 people died, 11,300 were injured and 32,500 residential and 763 industrial units weredestroyed or were seriously damaged (Sandi 2001).
Analysis of the macroseismic (Fig. 1a) and instrumental data from the intermediate-depthVrancea earthquakes revealed several peculiarities of the earthquake effects (e.g. Ivan et al.1998; Mandrescu and Radulian 1999; Mandrescu et al. 1988). They may be summarized asfollows:
– The earthquakes affect very large areas with a predominant NE-SW orientation;– The local and regional geological conditions can control the amplitudes of earthquake
ground motion to a larger degree than magnitude or distance. The strong ground motionparameters exhibit a large variability depending on site location.
The relationships between ground motion parameters and earthquake characteristics inthe Vrancea zone are represented by the empirical azimuth-dependent attenuation equationsfor seismic intensity (e.g. Ivan et al. 1998; Marza 1996; Marza and Pantea 1994) and max-imum peak ground acceleration (Lungu et al. 1995, 1997). The studies were based on themacroseismic data and the analog accelerograms of the strong Vrancea earthquakes of 1977,1986 and 1990.
In this work we made an attempt to develop the regional ground-motion prediction equa-tions for peak ground acceleration (PGA), peak ground velocity (PGV), pseudo-spectralacceleration (PSA), and seismic intensity (MSK or MMI scale) for the Vrancea intermediate-depth earthquakes and territory of Romania. The Fourier amplitude spectrum (FAS) sourcescaling and attenuation models (Sokolov et al. 2005) and the generalised site amplificationfunctions were used for the purpose. The stochastic technique (Boore 2003) based on thesite-dependent spectra was used for the case of PGA, PGV, and PSA models. The equationsfor seismic intensity were evaluated using the recently developed relations between intensityand FAS (Chernov and Sokolov 1999; Sokolov 2002). The values of the considered groundmotion parameters are given as functions of magnitude (MW 5 − 8), depth (70–160 km),and epicentral distance (up to 500 km). The maximum magnitude for the Vrancea zone wasaccepted to be M = 8 after Lungu et al. (1999), and Marza et al. (1991).
2 Input data
The 1977 earthquake was recorded in Romania by only one accelerograph located inBucharest. The other strong events of 1986 and 1990 (MW 7.1, 6.9, and 6.3) produced more
123
370 Bull Earthquake Eng (2008) 6:367–388
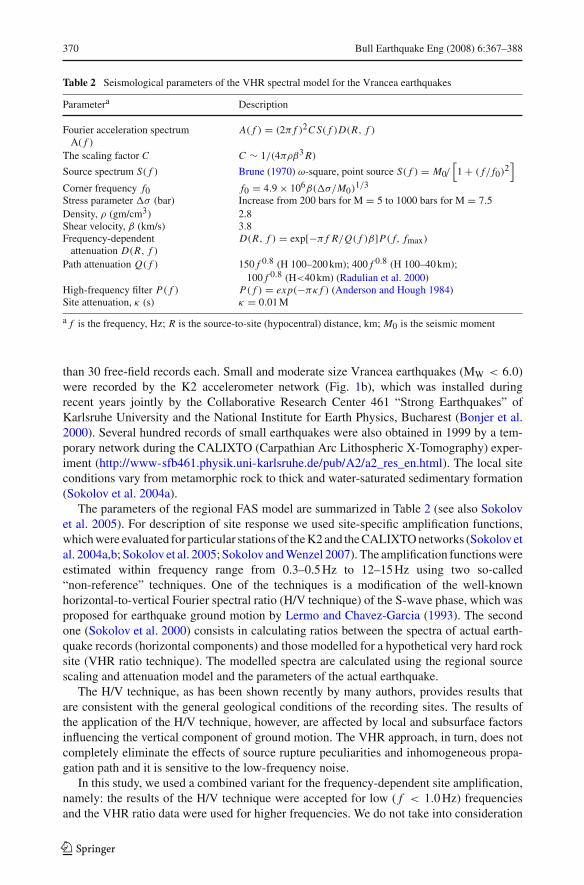
Table 2 Seismological parameters of the VHR spectral model for the Vrancea earthquakes
Parametera Description
Fourier acceleration spectrumA(f )
A(f ) = (2πf )2CS(f )D(R, f )
The scaling factor C C ∼ 1/(4πρβ3R)
Source spectrum S(f ) Brune (1970) ω-square, point source S(f ) = M0/[1 + (f/f0)2
]
Corner frequency f0 f0 = 4.9 × 10⁶β(�σ/M0)1/3
Stress parameter �σ (bar) Increase from 200 bars for M = 5 to 1000 bars for M = 7.5Density, ρ (gm/cm3) 2.8Shear velocity, β (km/s) 3.8Frequency-dependent
attenuation D(R, f )
D(R, f ) = exp[−πf R/Q(f )β]P(f, fmax)
Path attenuation Q(f ) 150f 0.8 (H 100–200 km); 400f 0.8 (H 100–40 km);100f 0.8 (H<40 km) (Radulian et al. 2000)
High-frequency filter P(f ) P (f ) = exp(−πκf ) (Anderson and Hough 1984)Site attenuation, κ (s) κ = 0.01 M
af is the frequency, Hz; R is the source-to-site (hypocentral) distance, km; M0 is the seismic moment
than 30 free-field records each. Small and moderate size Vrancea earthquakes (MW < 6.0)were recorded by the K2 accelerometer network (Fig. 1b), which was installed duringrecent years jointly by the Collaborative Research Center 461 “Strong Earthquakes” ofKarlsruhe University and the National Institute for Earth Physics, Bucharest (Bonjer et al.2000). Several hundred records of small earthquakes were also obtained in 1999 by a tem-porary network during the CALIXTO (Carpathian Arc Lithospheric X-Tomography) exper-iment (http://www-sfb461.physik.uni-karlsruhe.de/pub/A2/a2_res_en.html). The local siteconditions vary from metamorphic rock to thick and water-saturated sedimentary formation(Sokolov et al. 2004a).
The parameters of the regional FAS model are summarized in Table 2 (see also Sokolovet al. 2005). For description of site response we used site-specific amplification functions,which were evaluated for particular stations of the K2 and the CALIXTO networks (Sokolov etal. 2004a,b; Sokolov et al. 2005; Sokolov and Wenzel 2007). The amplification functions wereestimated within frequency range from 0.3–0.5 Hz to 12–15 Hz using two so-called“non-reference” techniques. One of the techniques is a modification of the well-knownhorizontal-to-vertical Fourier spectral ratio (H/V technique) of the S-wave phase, which wasproposed for earthquake ground motion by Lermo and Chavez-Garcia (1993). The secondone (Sokolov et al. 2000) consists in calculating ratios between the spectra of actual earth-quake records (horizontal components) and those modelled for a hypothetical very hard rocksite (VHR ratio technique). The modelled spectra are calculated using the regional sourcescaling and attenuation model and the parameters of the actual earthquake.
The H/V technique, as has been shown recently by many authors, provides results thatare consistent with the general geological conditions of the recording sites. The results ofthe application of the H/V technique, however, are affected by local and subsurface factorsinfluencing the vertical component of ground motion. The VHR approach, in turn, does notcompletely eliminate the effects of source rupture peculiarities and inhomogeneous propa-gation path and it is sensitive to the low-frequency noise.
In this study, we used a combined variant for the frequency-dependent site amplification,namely: the results of the H/V technique were accepted for low (f < 1.0 Hz) frequenciesand the VHR ratio data were used for higher frequencies. We do not take into consideration
123
Bull Earthquake Eng (2008) 6:367–388 371
possible non-linear response of the soil during strong excitation due to a lack of necessaryinformation and data.
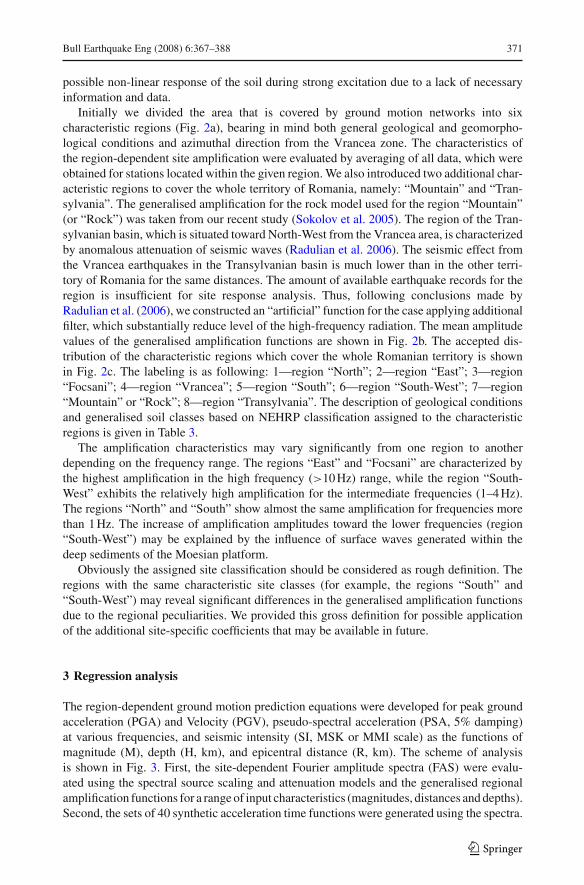
Initially we divided the area that is covered by ground motion networks into sixcharacteristic regions (Fig. 2a), bearing in mind both general geological and geomorpho-logical conditions and azimuthal direction from the Vrancea zone. The characteristics ofthe region-dependent site amplification were evaluated by averaging of all data, which wereobtained for stations located within the given region. We also introduced two additional char-acteristic regions to cover the whole territory of Romania, namely: “Mountain” and “Tran-sylvania”. The generalised amplification for the rock model used for the region “Mountain”(or “Rock”) was taken from our recent study (Sokolov et al. 2005). The region of the Tran-sylvanian basin, which is situated toward North-West from the Vrancea area, is characterizedby anomalous attenuation of seismic waves (Radulian et al. 2006). The seismic effect fromthe Vrancea earthquakes in the Transylvanian basin is much lower than in the other terri-tory of Romania for the same distances. The amount of available earthquake records for theregion is insufficient for site response analysis. Thus, following conclusions made byRadulian et al. (2006), we constructed an “artificial” function for the case applying additionalfilter, which substantially reduce level of the high-frequency radiation. The mean amplitudevalues of the generalised amplification functions are shown in Fig. 2b. The accepted dis-tribution of the characteristic regions which cover the whole Romanian territory is shownin Fig. 2c. The labeling is as following: 1—region “North”; 2—region “East”; 3—region“Focsani”; 4—region “Vrancea”; 5—region “South”; 6—region “South-West”; 7—region“Mountain” or “Rock”; 8—region “Transylvania”. The description of geological conditionsand generalised soil classes based on NEHRP classification assigned to the characteristicregions is given in Table 3.
The amplification characteristics may vary significantly from one region to anotherdepending on the frequency range. The regions “East” and “Focsani” are characterized bythe highest amplification in the high frequency (>10 Hz) range, while the region “South-West” exhibits the relatively high amplification for the intermediate frequencies (1–4 Hz).The regions “North” and “South” show almost the same amplification for frequencies morethan 1 Hz. The increase of amplification amplitudes toward the lower frequencies (region“South-West”) may be explained by the influence of surface waves generated within thedeep sediments of the Moesian platform.
Obviously the assigned site classification should be considered as rough definition. Theregions with the same characteristic site classes (for example, the regions “South” and“South-West”) may reveal significant differences in the generalised amplification functionsdue to the regional peculiarities. We provided this gross definition for possible applicationof the additional site-specific coefficients that may be available in future.
3 Regression analysis
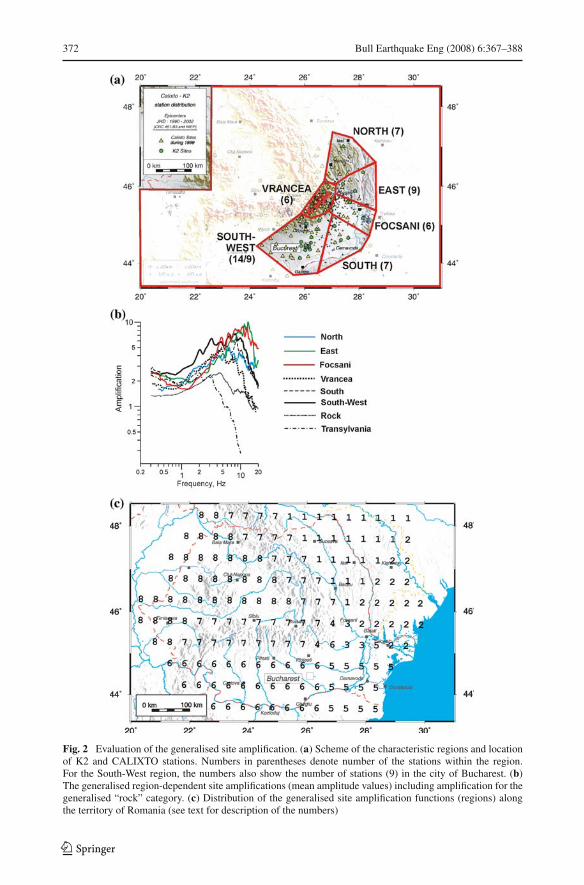
The region-dependent ground motion prediction equations were developed for peak groundacceleration (PGA) and Velocity (PGV), pseudo-spectral acceleration (PSA, 5% damping)at various frequencies, and seismic intensity (SI, MSK or MMI scale) as the functions ofmagnitude (M), depth (H, km), and epicentral distance (R, km). The scheme of analysisis shown in Fig. 3. First, the site-dependent Fourier amplitude spectra (FAS) were evalu-ated using the spectral source scaling and attenuation models and the generalised regionalamplification functions for a range of input characteristics (magnitudes, distances and depths).Second, the sets of 40 synthetic acceleration time functions were generated using the spectra.
123
372 Bull Earthquake Eng (2008) 6:367–388
Fig. 2 Evaluation of the generalised site amplification. (a) Scheme of the characteristic regions and locationof K2 and CALIXTO stations. Numbers in parentheses denote number of the stations within the region.For the South-West region, the numbers also show the number of stations (9) in the city of Bucharest. (b)The generalised region-dependent site amplifications (mean amplitude values) including amplification for thegeneralised “rock” category. (c) Distribution of the generalised site amplification functions (regions) alongthe territory of Romania (see text for description of the numbers)
123
Bull Earthquake Eng (2008) 6:367–388 373
Table 3 Geological description of the characteristic regions
Characteristic region Geological description
“North” Pre-Quaternary (Miocene) stiff rock and stiff soil, NEHRP soil classCD. The narrow river valleys are filled by shallow fluviatile (loessand loess-like) deposits, NEHRP class DE
“East” Pre-Quaternary (Pliocene) and Quaternary (Pleistocene) deposits,NEHRP soil class CD
“Focsani” Thick Pre-Quaternary and Quaternary sediments and recent alluvium(up to 2000 m), NEHRP soil class D
“Vrancea”, “Rock” Precenozoic (cretaceous) and early cenozoic rocks, NEHRPsoil class BC.
“South” Quaternary deposits, thickness 100 m–300 m, NEHRP soil class DE“South-West” Thick Quaternary deposits of Moesian Platform, thickness more than
250–300 m, NEHRP soil class DE“Transylvania” Miocene and Pliocene deposits, NEHRP soil class CD
Fig. 3 Scheme of evaluation of the ground-motion attenuation relationships based on the Fourier amplitudespectra
The duration model, in which it is assumed that most (90%) of the spectral energy is spreadover a duration τ0.9 of the accelerogram, was evaluated using available strong-motion data(Sokolov et al. 2004a). In this study we used a distance-independent duration model, howeverfor rock sites the value of duration was reduced by 20%. Third, the PGA and PSA valueswere obtained as the average values from the acceleration time functions. Peak velocities(PGV) were evaluated from the integrated synthetic accelerograms after high-pass filteringwith the cut-off frequency of 0.2 Hz. Such filtering is a standard procedure when processingthe empirical strong ground motion records. Seismic intensity (MSK scale) estimations wereobtained directly from the FAS (Sokolov 2002).
Peak amplitudes of ground acceleration, as well as pseudo-spectral acceleration, may besensitive to the amplitudes of the particular peaks of frequency-dependent soil amplificationfunction. The procedure of averaging of the site amplification functions leads to smoothing ofthe peaks. The use of the mean-amplitude amplification in predicting of the site-dependentPGA and PSA values may result in underestimation of the parameters. Therefore, whenconsidering the site effects, we used two variants, namely: (1) the mean and (2) the mean + 1
123
374 Bull Earthquake Eng (2008) 6:367–388
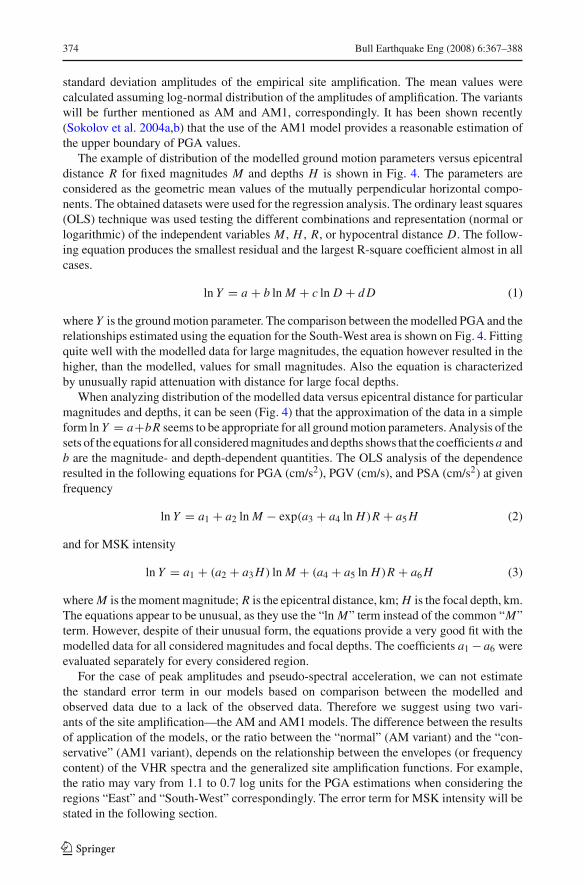
standard deviation amplitudes of the empirical site amplification. The mean values werecalculated assuming log-normal distribution of the amplitudes of amplification. The variantswill be further mentioned as AM and AM1, correspondingly. It has been shown recently(Sokolov et al. 2004a,b) that the use of the AM1 model provides a reasonable estimation ofthe upper boundary of PGA values.
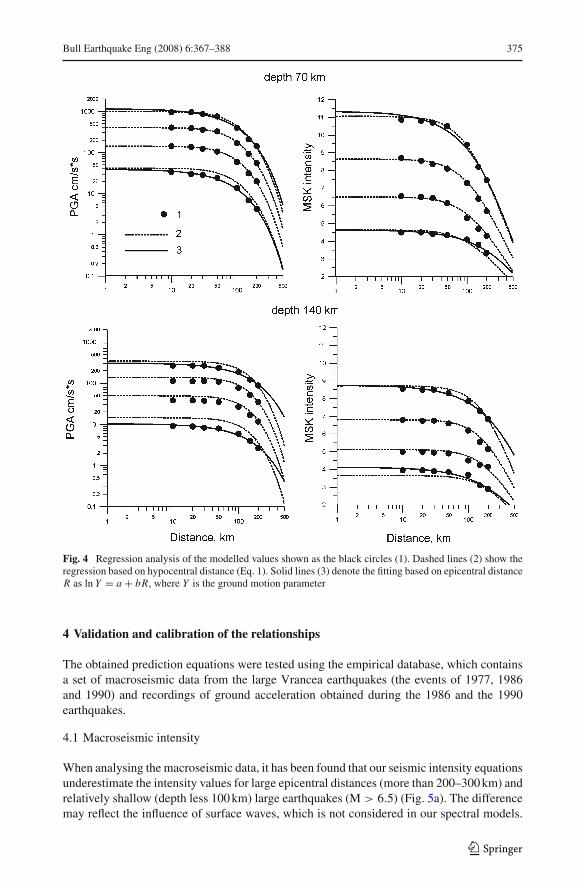
The example of distribution of the modelled ground motion parameters versus epicentraldistance R for fixed magnitudes M and depths H is shown in Fig. 4. The parameters areconsidered as the geometric mean values of the mutually perpendicular horizontal compo-nents. The obtained datasets were used for the regression analysis. The ordinary least squares(OLS) technique was used testing the different combinations and representation (normal orlogarithmic) of the independent variables M , H , R, or hypocentral distance D. The follow-ing equation produces the smallest residual and the largest R-square coefficient almost in allcases.
ln Y = a + b ln M + c ln D + dD (1)
where Y is the ground motion parameter. The comparison between the modelled PGA and therelationships estimated using the equation for the South-West area is shown on Fig. 4. Fittingquite well with the modelled data for large magnitudes, the equation however resulted in thehigher, than the modelled, values for small magnitudes. Also the equation is characterizedby unusually rapid attenuation with distance for large focal depths.
When analyzing distribution of the modelled data versus epicentral distance for particularmagnitudes and depths, it can be seen (Fig. 4) that the approximation of the data in a simpleform ln Y = a+bR seems to be appropriate for all ground motion parameters. Analysis of thesets of the equations for all considered magnitudes and depths shows that the coefficients a andb are the magnitude- and depth-dependent quantities. The OLS analysis of the dependenceresulted in the following equations for PGA (cm/s2), PGV (cm/s), and PSA (cm/s2) at givenfrequency
ln Y = a1 + a2 ln M − exp(a3 + a4 ln H)R + a5H (2)
and for MSK intensity
ln Y = a1 + (a2 + a3H) ln M + (a4 + a5 ln H)R + a6H (3)
where M is the moment magnitude; R is the epicentral distance, km; H is the focal depth, km.The equations appear to be unusual, as they use the “ln M” term instead of the common “M”term. However, despite of their unusual form, the equations provide a very good fit with themodelled data for all considered magnitudes and focal depths. The coefficients a1 − a6 wereevaluated separately for every considered region.
For the case of peak amplitudes and pseudo-spectral acceleration, we can not estimatethe standard error term in our models based on comparison between the modelled andobserved data due to a lack of the observed data. Therefore we suggest using two vari-ants of the site amplification—the AM and AM1 models. The difference between the resultsof application of the models, or the ratio between the “normal” (AM variant) and the “con-servative” (AM1 variant), depends on the relationship between the envelopes (or frequencycontent) of the VHR spectra and the generalized site amplification functions. For example,the ratio may vary from 1.1 to 0.7 log units for the PGA estimations when considering theregions “East” and “South-West” correspondingly. The error term for MSK intensity will bestated in the following section.
123
Bull Earthquake Eng (2008) 6:367–388 375
Fig. 4 Regression analysis of the modelled values shown as the black circles (1). Dashed lines (2) show theregression based on hypocentral distance (Eq. 1). Solid lines (3) denote the fitting based on epicentral distanceR as ln Y = a + bR, where Y is the ground motion parameter
4 Validation and calibration of the relationships
The obtained prediction equations were tested using the empirical database, which containsa set of macroseismic data from the large Vrancea earthquakes (the events of 1977, 1986and 1990) and recordings of ground acceleration obtained during the 1986 and the 1990earthquakes.
4.1 Macroseismic intensity
When analysing the macroseismic data, it has been found that our seismic intensity equationsunderestimate the intensity values for large epicentral distances (more than 200–300 km) andrelatively shallow (depth less 100 km) large earthquakes (M > 6.5) (Fig. 5a). The differencemay reflect the influence of surface waves, which is not considered in our spectral models.
123
376 Bull Earthquake Eng (2008) 6:367–388
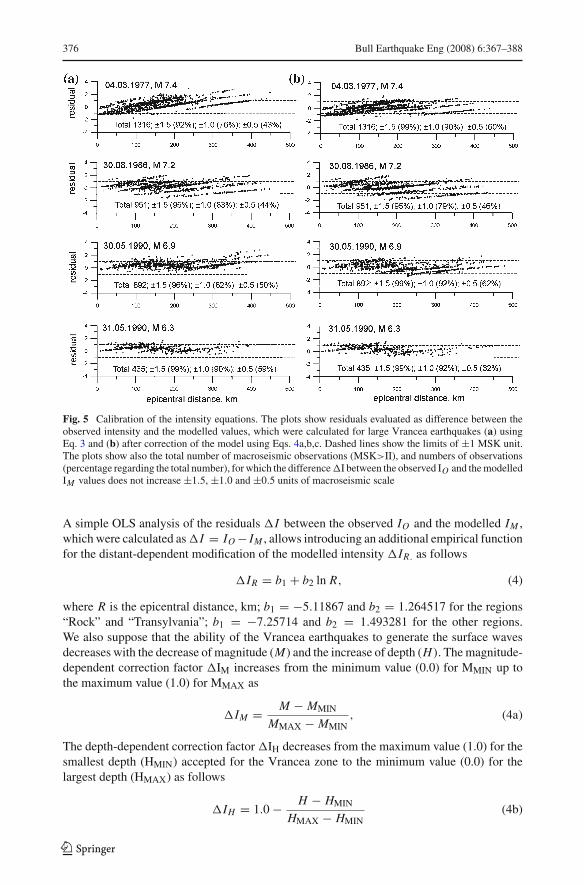
Fig. 5 Calibration of the intensity equations. The plots show residuals evaluated as difference between theobserved intensity and the modelled values, which were calculated for large Vrancea earthquakes (a) usingEq. 3 and (b) after correction of the model using Eqs. 4a,b,c. Dashed lines show the limits of ±1 MSK unit.The plots show also the total number of macroseismic observations (MSK>II), and numbers of observations(percentage regarding the total number), for which the difference �I between the observed IO and the modelledIM values does not increase ±1.5, ±1.0 and ±0.5 units of macroseismic scale
A simple OLS analysis of the residuals �I between the observed IO and the modelled IM ,which were calculated as �I = IO −IM , allows introducing an additional empirical functionfor the distant-dependent modification of the modelled intensity �IR. as follows
�IR = b1 + b2 ln R, (4)
where R is the epicentral distance, km; b1 = −5.11867 and b2 = 1.264517 for the regions“Rock” and “Transylvania”; b1 = −7.25714 and b2 = 1.493281 for the other regions.We also suppose that the ability of the Vrancea earthquakes to generate the surface wavesdecreases with the decrease of magnitude (M) and the increase of depth (H). The magnitude-dependent correction factor �IM increases from the minimum value (0.0) for MMIN up tothe maximum value (1.0) for MMAX as
�IM = M − MMIN
MMAX − MMIN, (4a)
The depth-dependent correction factor �IH decreases from the maximum value (1.0) for thesmallest depth (HMIN) accepted for the Vrancea zone to the minimum value (0.0) for thelargest depth (HMAX) as follows
�IH = 1.0 − H − HMIN
HMAX − HMIN(4b)
123
Bull Earthquake Eng (2008) 6:367–388 377
The final correction is applied as
IC = IM + �I, �I = �IR × �IM × �IH (4c)
where IC is the corrected value of the modelled intensity IM . The correction is applied onlyfor those distances, for which the value �IR is more than zero.
The difference between the observed intensity and the corrected modelled values is shownin Fig. 5b. The following parameters of the correction were used, namely: MMIN = 6.0,MMAX = 8.0, HMIN = 70 km, HMAX = 160 km. The number of the particular macroseismicobservations, for which the difference between the observed and the modelled values (�I)lays outside ±1.5, ±1.0 and ±0.5 MSK units, becomes smaller after the correction. Thecomparison allows estimating the value of standard error in Eq. 3 as 0.5 MSK units.
Note that the apparent linear trends in the residuals after correction are caused by aninherent characteristic of comparison between the modelled and the observed intensities.The observed intensities IO are estimated as integer numbers while the modelled intensitiesIM are given as the decimal estimations. For example, the intensity MSK VII (integer) maycorrespond to the modelled values varying between 6.5 and 7.5 (decimal). Thus, while themodelled values slightly decrease with distance within the limits of 1.0 MSK units, theobserved intensities may remain the same causing the changing (from −0.5 to 0.5) residuals.
The developed equations can predict only the generalised features of distribution of seismicintensity. Every particular earthquake may reveal some peculiarities caused by the process ofthe earthquake source development. The relatively low level of intensity toward the northerndirection from the epicentral area for the 1986 earthquake (distances 200–370 km) may beconsidered as the example of the peculiarities.
4.2 Peak amplitudes of ground acceleration (PGA)
The ground motion database used in this paper contains only one record of the earthquake of1977; thirty one records of the earthquake of 1986; forty three records of the earthquake of1990, May 30; and fourteen records of the earthquake of 1990, May 31. We made an attemptto increase the empirical database using the available relationships between macroseismicintensity and PGA proposed by Enescu (1997) and Bonjer et al. (2001) as follows
log amax = 0.2712I + 0.1814 V < I < IX after Enescu (1997) (5a)
log amax = 0.29I + 0.14 after Bonjer et al. (2001) (5b)
where amax is the maximum value from two horizontal components.Based on these relationships, we created the two-component data for our analysis as
follows. First, the intensity-based amplitude aIN is estimated for every particular intensityobservation that is more than MSK III as the geometric mean of two values calculatedusing the relationships 5a and 5b. Second, the aMAX value was calculated as the randomvariable assuming log-normal distribution of the peak amplitudes with the mean value aIN
and standard deviation of 0.2 log units. Third, the value for the second component wasevaluated as the random variable assuming uniform distribution between aMAX and 0.7aMAX.The peak acceleration recalculated from the observed intensity values is called further as the“empirical” acceleration.
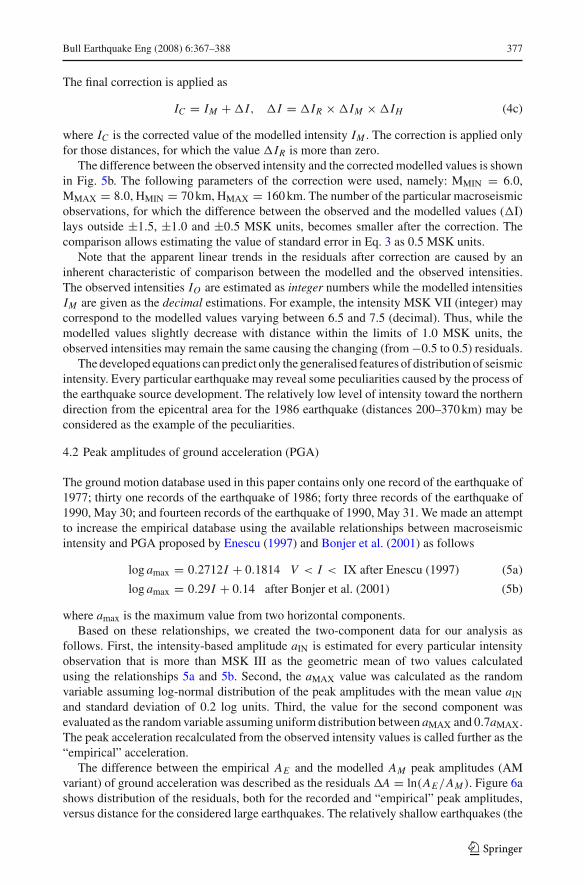
The difference between the empirical AE and the modelled AM peak amplitudes (AMvariant) of ground acceleration was described as the residuals �A = ln(AE/AM). Figure 6ashows distribution of the residuals, both for the recorded and “empirical” peak amplitudes,versus distance for the considered large earthquakes. The relatively shallow earthquakes (the
123
378 Bull Earthquake Eng (2008) 6:367–388
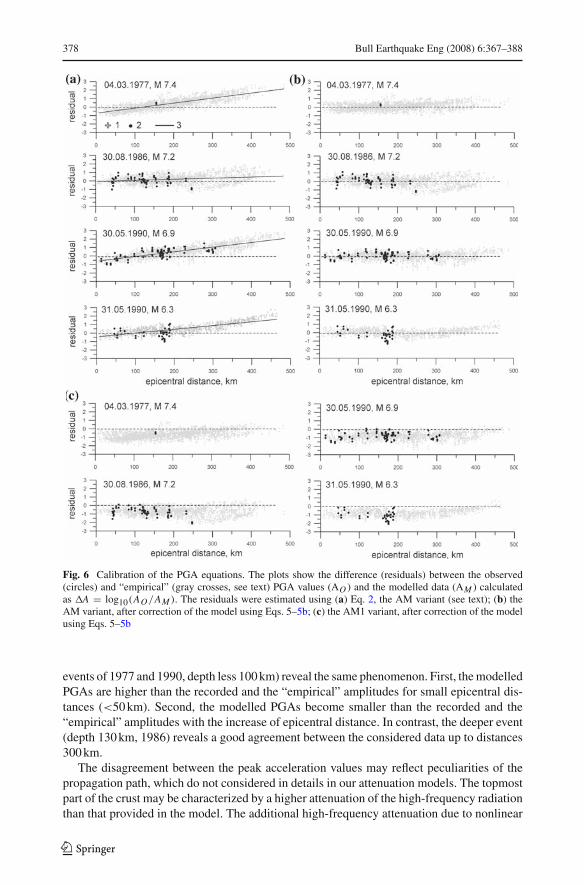
Fig. 6 Calibration of the PGA equations. The plots show the difference (residuals) between the observed(circles) and “empirical” (gray crosses, see text) PGA values (AO ) and the modelled data (AM ) calculatedas �A = log10(AO/AM). The residuals were estimated using (a) Eq. 2, the AM variant (see text); (b) theAM variant, after correction of the model using Eqs. 5–5b; (c) the AM1 variant, after correction of the modelusing Eqs. 5–5b
events of 1977 and 1990, depth less 100 km) reveal the same phenomenon. First, the modelledPGAs are higher than the recorded and the “empirical” amplitudes for small epicentral dis-tances (<50 km). Second, the modelled PGAs become smaller than the recorded and the“empirical” amplitudes with the increase of epicentral distance. In contrast, the deeper event(depth 130 km, 1986) reveals a good agreement between the considered data up to distances300 km.
The disagreement between the peak acceleration values may reflect peculiarities of thepropagation path, which do not considered in details in our attenuation models. The topmostpart of the crust may be characterized by a higher attenuation of the high-frequency radiationthan that provided in the model. The additional high-frequency attenuation due to nonlinear
123
Bull Earthquake Eng (2008) 6:367–388 379
effects, the influence of which depends on earthquake depth and magnitude, should not beneglected. It seems also that the simple model for geometric attenuation (Table 2) leads tounderestimation of the peak amplitudes at large epicentral distances.
A simple correction factor was evaluated from the residuals distribution using the OLStechnique. The correction resulted in a good fit between the peak amplitudes of groundacceleration (Fig. 6b). The amplitudes, which were calculated using Eq. 2 for magnitudesmore than a specified boundary magnitude MBND, are corrected as
AC = AM × exp(�A) (6)
where AC is the corrected acceleration; AM is the modelled acceleration. The correctionfactor �A depends on epicentral distance and depth. The distant-dependent correction iscalculated as
�AR = pR + q; p = 0.0031M − 0.0163; q = −0.3767M + 2.014 (6a)
where M is the earthquake magnitude (M > MBND); R is the epicentral distance, km. Weassume that the correction is a depth-dependent quantity and it gradually decreases from themaximum value (1.0) for the smallest depth (HMIN) accepted for the Vrancea zone to theminimum value (0.0) for the largest depth (HMAX) as follows
�AH = 1.0 − H − HMIN
HMAX − HMIN(6b)
where H is the earthquake depth. We introduced the same correction coefficients for allconsidered characteristic zones. The final correction is applied as �A = �AR × �AH .
We suppose that the correction is a frequency-dependent quantity and we do not suggestapplying these equations for peak ground velocity. The attenuation of the high-frequencyradiation, which leads to the decrease of acceleration amplitudes, should not cause the sameeffect for the case of velocity due to the different frequency ranges that are responsible foracceleration and velocity amplitudes. For pseudo-spectral acceleration we suggest the follow-ing scheme. The correction calculated using Eqs. 6–6b is applied without any transformationfor frequencies more than 10 Hz. For the lower frequencies, the correction gradually decreasesup to a zero value for the minimum considered frequency (0.3 Hz) assuming logarithmic fre-quency dependence.
Obviously, the use of empirical relationships for estimating PGA from intensity mayintroduce additional uncertainty. Also, when considering only the recorded PGA values, itseems that the correction in the predictive model is not necessary for epicentral distancesup to 200 km. We do not insist in using of the correction for peak amplitudes and leavethe decision to the user discretion. However, we note that the correction leads to magnitudesaturation of the acceleration amplitudes at relatively small epicentral distances (see Fig. 7c)that is a well-known phenomenon.
5 Discussion
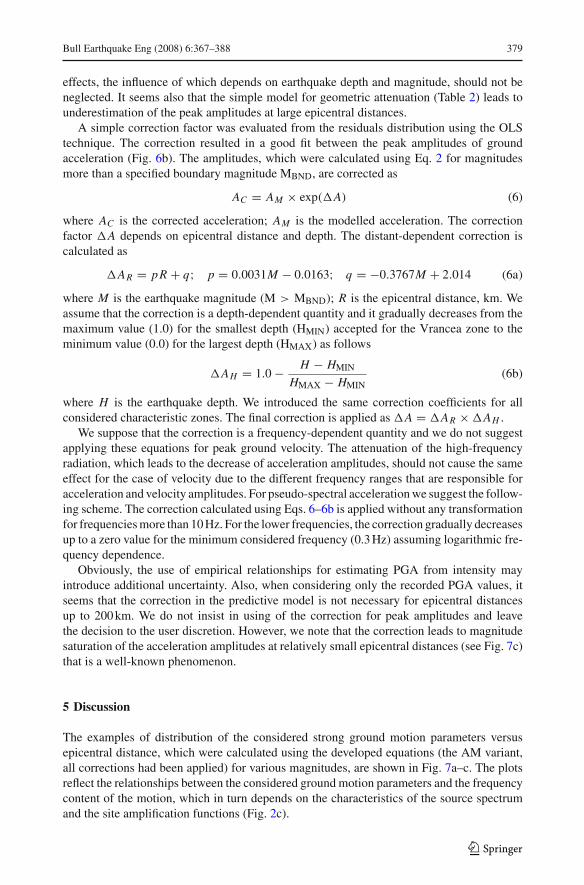
The examples of distribution of the considered strong ground motion parameters versusepicentral distance, which were calculated using the developed equations (the AM variant,all corrections had been applied) for various magnitudes, are shown in Fig. 7a–c. The plotsreflect the relationships between the considered ground motion parameters and the frequencycontent of the motion, which in turn depends on the characteristics of the source spectrumand the site amplification functions (Fig. 2c).
123
380 Bull Earthquake Eng (2008) 6:367–388
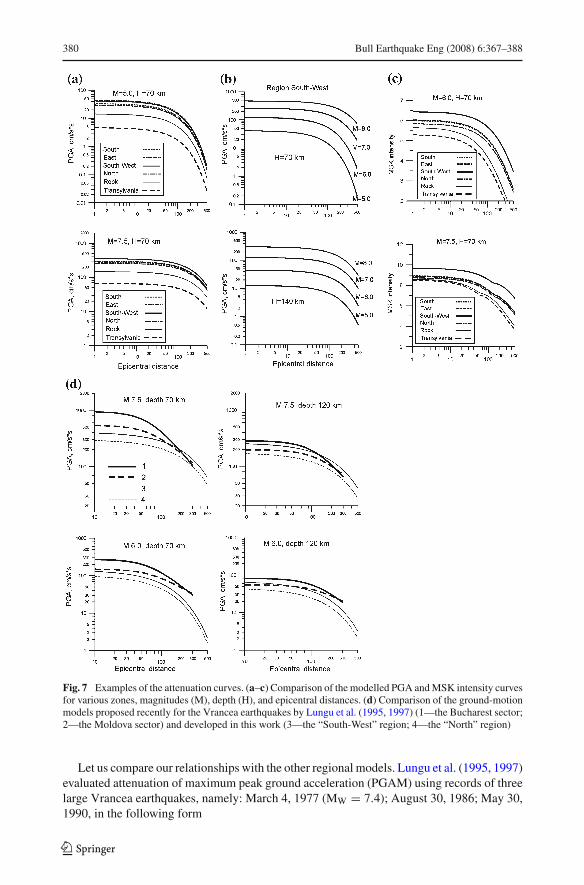
Fig. 7 Examples of the attenuation curves. (a–c) Comparison of the modelled PGA and MSK intensity curvesfor various zones, magnitudes (M), depth (H), and epicentral distances. (d) Comparison of the ground-motionmodels proposed recently for the Vrancea earthquakes by Lungu et al. (1995, 1997) (1—the Bucharest sector;2—the Moldova sector) and developed in this work (3—the “South-West” region; 4—the “North” region)
Let us compare our relationships with the other regional models. Lungu et al. (1995, 1997)evaluated attenuation of maximum peak ground acceleration (PGAM) using records of threelarge Vrancea earthquakes, namely: March 4, 1977 (MW = 7.4); August 30, 1986; May 30,1990, in the following form
123
Bull Earthquake Eng (2008) 6:367–388 381
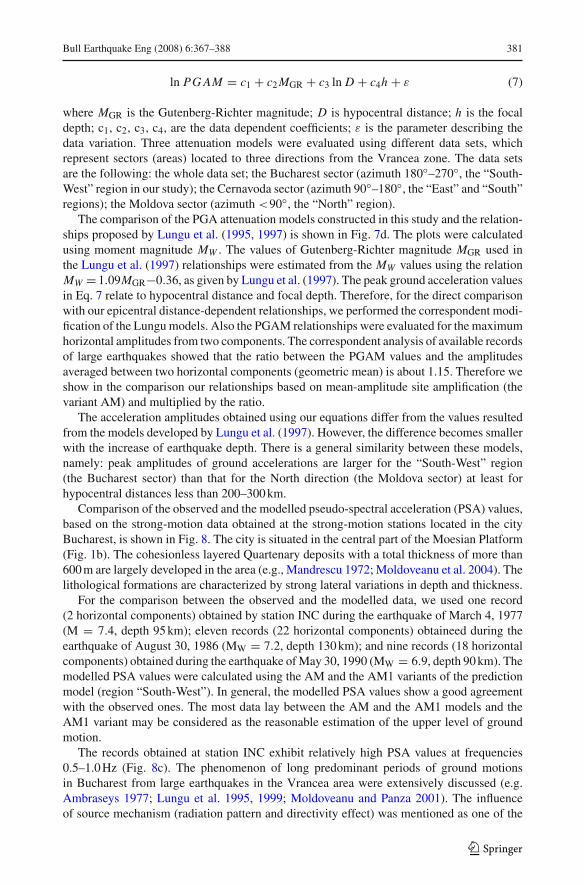
ln PGAM = c1 + c2MGR + c3 ln D + c4h + ε (7)
where MGR is the Gutenberg-Richter magnitude; D is hypocentral distance; h is the focaldepth; c1, c2, c3, c4, are the data dependent coefficients; ε is the parameter describing thedata variation. Three attenuation models were evaluated using different data sets, whichrepresent sectors (areas) located to three directions from the Vrancea zone. The data setsare the following: the whole data set; the Bucharest sector (azimuth 180◦–270◦, the “South-West” region in our study); the Cernavoda sector (azimuth 90◦–180◦, the “East” and “South”regions); the Moldova sector (azimuth <90◦, the “North” region).
The comparison of the PGA attenuation models constructed in this study and the relation-ships proposed by Lungu et al. (1995, 1997) is shown in Fig. 7d. The plots were calculatedusing moment magnitude MW . The values of Gutenberg-Richter magnitude MGR used inthe Lungu et al. (1997) relationships were estimated from the MW values using the relationMW = 1.09MGR−0.36, as given by Lungu et al. (1997). The peak ground acceleration valuesin Eq. 7 relate to hypocentral distance and focal depth. Therefore, for the direct comparisonwith our epicentral distance-dependent relationships, we performed the correspondent modi-fication of the Lungu models. Also the PGAM relationships were evaluated for the maximumhorizontal amplitudes from two components. The correspondent analysis of available recordsof large earthquakes showed that the ratio between the PGAM values and the amplitudesaveraged between two horizontal components (geometric mean) is about 1.15. Therefore weshow in the comparison our relationships based on mean-amplitude site amplification (thevariant AM) and multiplied by the ratio.
The acceleration amplitudes obtained using our equations differ from the values resultedfrom the models developed by Lungu et al. (1997). However, the difference becomes smallerwith the increase of earthquake depth. There is a general similarity between these models,namely: peak amplitudes of ground accelerations are larger for the “South-West” region(the Bucharest sector) than that for the North direction (the Moldova sector) at least forhypocentral distances less than 200–300 km.
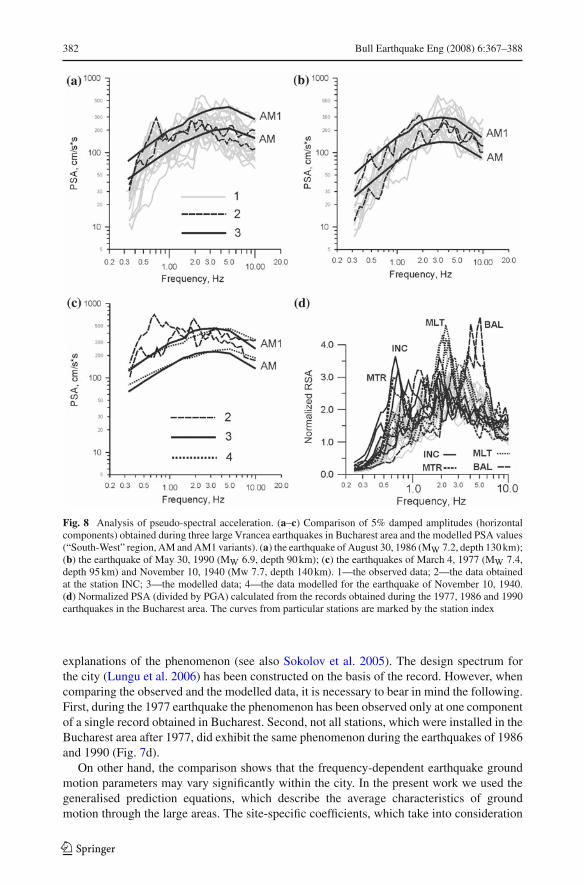
Comparison of the observed and the modelled pseudo-spectral acceleration (PSA) values,based on the strong-motion data obtained at the strong-motion stations located in the cityBucharest, is shown in Fig. 8. The city is situated in the central part of the Moesian Platform(Fig. 1b). The cohesionless layered Quartenary deposits with a total thickness of more than600 m are largely developed in the area (e.g., Mandrescu 1972; Moldoveanu et al. 2004). Thelithological formations are characterized by strong lateral variations in depth and thickness.
For the comparison between the observed and the modelled data, we used one record(2 horizontal components) obtained by station INC during the earthquake of March 4, 1977(M = 7.4, depth 95 km); eleven records (22 horizontal components) obtaineed during theearthquake of August 30, 1986 (MW = 7.2, depth 130 km); and nine records (18 horizontalcomponents) obtained during the earthquake of May 30, 1990 (MW = 6.9, depth 90 km). Themodelled PSA values were calculated using the AM and the AM1 variants of the predictionmodel (region “South-West”). In general, the modelled PSA values show a good agreementwith the observed ones. The most data lay between the AM and the AM1 models and theAM1 variant may be considered as the reasonable estimation of the upper level of groundmotion.
The records obtained at station INC exhibit relatively high PSA values at frequencies0.5–1.0 Hz (Fig. 8c). The phenomenon of long predominant periods of ground motionsin Bucharest from large earthquakes in the Vrancea area were extensively discussed (e.g.Ambraseys 1977; Lungu et al. 1995, 1999; Moldoveanu and Panza 2001). The influenceof source mechanism (radiation pattern and directivity effect) was mentioned as one of the
123
382 Bull Earthquake Eng (2008) 6:367–388
Fig. 8 Analysis of pseudo-spectral acceleration. (a–c) Comparison of 5% damped amplitudes (horizontalcomponents) obtained during three large Vrancea earthquakes in Bucharest area and the modelled PSA values(“South-West” region, AM and AM1 variants). (a) the earthquake of August 30, 1986 (MW 7.2, depth 130 km);(b) the earthquake of May 30, 1990 (MW 6.9, depth 90 km); (c) the earthquakes of March 4, 1977 (MW 7.4,depth 95 km) and November 10, 1940 (Mw 7.7, depth 140 km). 1—the observed data; 2—the data obtainedat the station INC; 3—the modelled data; 4—the data modelled for the earthquake of November 10, 1940.(d) Normalized PSA (divided by PGA) calculated from the records obtained during the 1977, 1986 and 1990earthquakes in the Bucharest area. The curves from particular stations are marked by the station index
explanations of the phenomenon (see also Sokolov et al. 2005). The design spectrum forthe city (Lungu et al. 2006) has been constructed on the basis of the record. However, whencomparing the observed and the modelled data, it is necessary to bear in mind the following.First, during the 1977 earthquake the phenomenon has been observed only at one componentof a single record obtained in Bucharest. Second, not all stations, which were installed in theBucharest area after 1977, did exhibit the same phenomenon during the earthquakes of 1986and 1990 (Fig. 7d).
On other hand, the comparison shows that the frequency-dependent earthquake groundmotion parameters may vary significantly within the city. In the present work we used thegeneralised prediction equations, which describe the average characteristics of groundmotion through the large areas. The site-specific coefficients, which take into consideration
123
Bull Earthquake Eng (2008) 6:367–388 383
geological features, should be introduced in addition to the generalised “regional-dependent”relationships. However, Mandrescu et al. (2007) concluded that at present state of knowledgeit is impossible to determine certain zones within the city of Bucharest with different responseto strong Vrancea earthquakes.
Note, that together with the modelled pseudo-spectral acceleration for the earthquake ofMarch 4, 1977, we also show the modelled amplitudes for the earthquake of November 10,1940 (Mw 7.7). The earthquake occurred at depth about 140 km. Even if the magnitude ofthe event was larger than that of the 1977 event, the severity of shaking in Bucharest duringthe earthquake was not stronger as compared with the 1977 earthquake (see also Bune et al.1986).
Let us check the applicability of the developed strong-motion prediction equations forprediction of ground motion parameters along the territory of Romania. For this purpose weapplied the following scheme. The territory was covered by a grid with 0.20◦ × 0.20◦spacingand the index of correspondent characteristic region was assigned to every node of the grid(see Fig. 2c). The boundaries of the regions are considered as the “soft” borders, i.e. thenodes located near the boundary may belong simultaneously for two, or even three, regions.The node-to-boundary distance in this case should be less than 50 km. The correspondentweights are assigned to the nodes and the weights depend on the distance between the nodesand the region borders. The smaller the distance to the border, the larger the weight of theneighbouring region. Initially, the ground motion parameters for the particular earthquakeare calculated for the nodes. For the sites located between the nodes, a simple interpolationscheme based on the distances between the site and four neighbouring nodes is used.
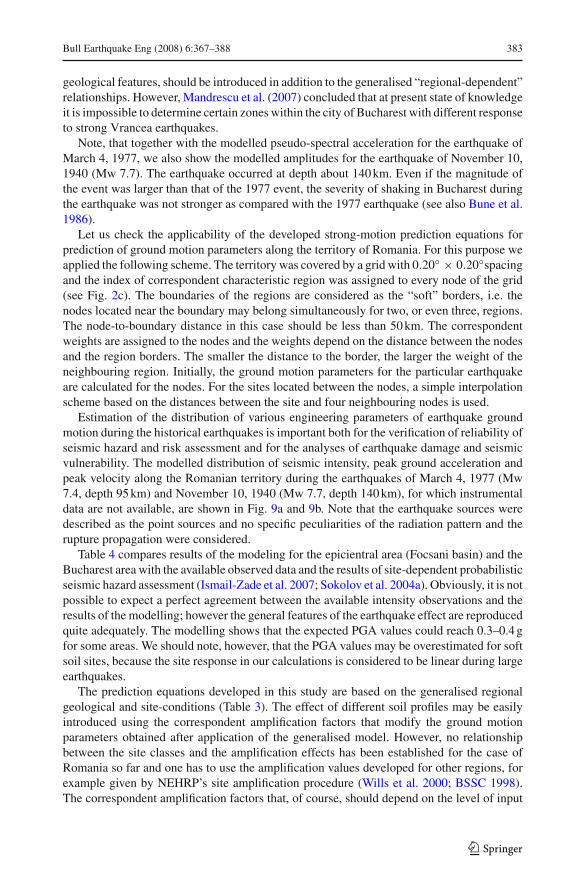
Estimation of the distribution of various engineering parameters of earthquake groundmotion during the historical earthquakes is important both for the verification of reliability ofseismic hazard and risk assessment and for the analyses of earthquake damage and seismicvulnerability. The modelled distribution of seismic intensity, peak ground acceleration andpeak velocity along the Romanian territory during the earthquakes of March 4, 1977 (Mw7.4, depth 95 km) and November 10, 1940 (Mw 7.7, depth 140 km), for which instrumentaldata are not available, are shown in Fig. 9a and 9b. Note that the earthquake sources weredescribed as the point sources and no specific peculiarities of the radiation pattern and therupture propagation were considered.
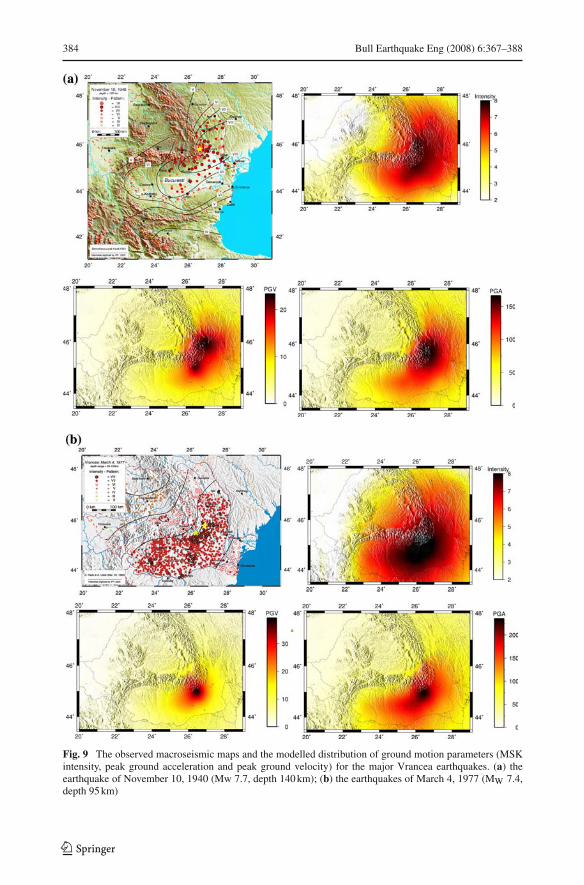
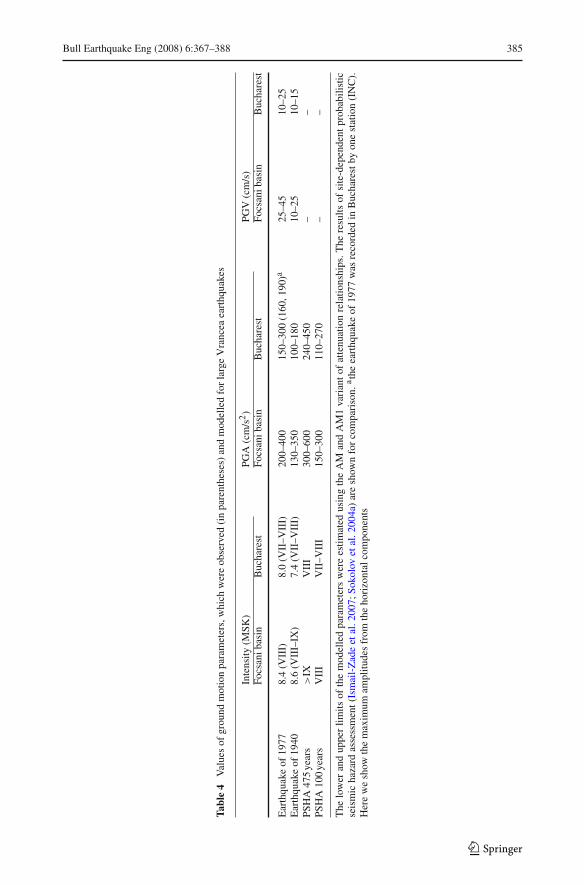
Table 4 compares results of the modeling for the epicientral area (Focsani basin) and theBucharest area with the available observed data and the results of site-dependent probabilisticseismic hazard assessment (Ismail-Zade et al. 2007; Sokolov et al. 2004a). Obviously, it is notpossible to expect a perfect agreement between the available intensity observations and theresults of the modelling; however the general features of the earthquake effect are reproducedquite adequately. The modelling shows that the expected PGA values could reach 0.3–0.4 gfor some areas. We should note, however, that the PGA values may be overestimated for softsoil sites, because the site response in our calculations is considered to be linear during largeearthquakes.
The prediction equations developed in this study are based on the generalised regionalgeological and site-conditions (Table 3). The effect of different soil profiles may be easilyintroduced using the correspondent amplification factors that modify the ground motionparameters obtained after application of the generalised model. However, no relationshipbetween the site classes and the amplification effects has been established for the case ofRomania so far and one has to use the amplification values developed for other regions, forexample given by NEHRP’s site amplification procedure (Wills et al. 2000; BSSC 1998).The correspondent amplification factors that, of course, should depend on the level of input
123
384 Bull Earthquake Eng (2008) 6:367–388
Fig. 9 The observed macroseismic maps and the modelled distribution of ground motion parameters (MSKintensity, peak ground acceleration and peak ground velocity) for the major Vrancea earthquakes. (a) theearthquake of November 10, 1940 (Mw 7.7, depth 140 km); (b) the earthquakes of March 4, 1977 (MW 7.4,depth 95 km)
123
Bull Earthquake Eng (2008) 6:367–388 385
Tabl
e4
Val
ues
ofgr
ound
mot
ion
para
met
ers,
whi
chw
ere
obse
rved
(in
pare
nthe
ses)
and
mod
elle
dfo
rla
rge
Vra
ncea
eart
hqua
kes
Inte
nsity
(MSK
)PG
A(c
m/s
2)
PGV
(cm
/s)
Focs
anib
asin
Buc
hare
stFo
csan
ibas
inB
ucha
rest
Focs
anib
asin
Buc
hare
st
Ear
thqu
ake
of19
778.
4(V
III)
8.0
(VII
–VII
I)20
0–40
015
0–30
0(1
60,1
90)a
25–4
510
–25
Ear
thqu
ake
of19
408.
6(V
III–
IX)
7.4
(VII
–VII
I)13
0–35
010
0–18
010
–25
10–1
5PS
HA
475
year
s>
IXV
III
300–
600
240–
450
––
PSH
A10
0ye
ars
VII
IV
II–V
III
150–
300
110–
270
––
The
low
eran
dup
per
limits
ofth
em
odel
led
para
met
ers
wer
ees
timat
edus
ing
the
AM
and
AM
1va
rian
tof
atte
nuat
ion
rela
tions
hips
.The
resu
ltsof
site
-dep
ende
ntpr
obab
ilist
icse
ism
icha
zard
asse
ssm
ent(
Ism
ail-
Zad
eet
al.2
007;
Soko
lov
etal
.200
4a)
are
show
nfo
rco
mpa
riso
n.a t
heea
rthq
uake
of19
77w
asre
cord
edin
Buc
hare
stby
one
stat
ion
(IN
C).
Her
ew
esh
owth
em
axim
umam
plitu
des
from
the
hori
zont
alco
mpo
nent
s
123
386 Bull Earthquake Eng (2008) 6:367–388
motion are normalized to the reference soil classes assigned to our characteristic regions(Table 3).
6 Conclusion
Results of our recent strong-motion studies in Romania (e.g. Sokolov and Bonjer 2006;Sokolov and Wenzel 2007; Sokolov et al. 2004b; Sokolov et al. 2005) allow constructingthe “azimuth-” or “region-dependent” prediction equations for the territory in terms of var-ious engineering earthquake ground motion parameters and seismic intensity. The Fourieramplitude spectrum (FAS) source scaling and attenuation models and the generalised siteamplification functions were used, as the basis, for evaluation of the ground motion models.The equations, in contrast to the existing empirical ones (e.g. Marza and Pantea 1994; Lunguet al. 1995, 1997), do not require the special procedures of conversion between the variousground motion parameters.
When evaluating the Fourier amplitude spectrum for given earthquake magnitude anddepth, we intentionally used the generalised parameters of the earthquake source (seismicmoment and stress parameter) and the simple models of source scaling and attenuation. Inmany cases, the detailed features of the slip distribution are unknown for both recordedearthquakes and future events. Thus, we analyze conditions, at which the simple models candescribe the real events. The situation is common in the practice of seismic hazard assessment,as well as in the case of Shakemap generation.
The developed prediction equations, despite of their simplicity, reveal a good agreementwith the observed data and clearly reflect the azimuth (or region) dependent distribution ofground motion parameters during the Vrancea earthquakes. We suggest to use the presentedequations for the rapid estimation of seismic effect after strong earthquakes (Shakemap gen-eration) and seismic hazard assessment, both deterministic and probabilistic approaches. Thecoefficients of the equations, as well as a simple FORTRAN code for practical calculations,are available from the correspondent author (V. Sokolov).
However, we should mention several weak points in our results, which are the main topicsof the future research. First, bearing in mind the large variability of ground motion parameters,it seems to be important to introduce the site-specific coefficients that take into considerationgeological, geomorphological, and geotechnical characteristics of the sediments and theirthickness. Second, a special consideration should be given to the problems related to assess-ment of the magnitude- and depth-dependent correction for the case of peak ground velocityand pseudo-spectral acceleration at different frequencies. Third, for the case of large mag-nitude earthquakes, it is necessary to take into account the source dimension and to apply ahybrid technique, which considers the low- and high-frequency ranges separately. A specialstudy should be performed for validation whether the developed equations could be used forneighbouring, with Romania, countries, e.g. Moldova, Bulgaria, and Ukraine.
Acknowledgements The authors would like to thank two anonymous reviewers for their thoughtful com-ments and suggestions, which helped to significantly improve the article. The authors are indebted to thefollowing people: Traian Moldoveanu (GEOTEC Consultant, Bucharest) provided the macroseismic maps ofthe Vrancea events of 1940 and 1990, and Stefan Tataru (Dr. Cornelius Radu Observatory, Vrancioaia) the mapof the 1986 earthquake. Werner Weisbrich (Institute of Remote Sensing and Photogrammetry of KarlsruheUniversity) provided the intensity values in digital formats. This study was carried out in the CollaborativeResearch Center (CRC) 461 “Strong earthquakes: a challenge for geosciences and civil engineering”, which isfunded by the Deutsche Forschungsgemeinschaft (German Research Foundation) and supported by the stateof Baden-Württemberg and the University of Karlsruhe.
123
Bull Earthquake Eng (2008) 6:367–388 387
References
Ambraseys NN (1977) Long-period effects in the Romanian earthquake of March 1977. Nature268(5618):324–325
Anderson J, Hough S (1984) A model for the shape of the Fourier amplitude spectrum of acceleration at highfrequencies. Bull Seismol Soc Am 74:1969–1993
Bonjer KP, Oncescu L, Rizescu M, Enescu D, Driad L, Radulian M, Ionescu M, Moldoveanu T (2000) Source-and site-parameters of the April 28, 1999 intermediate-depth Vrancea earthquake: first results from thenew K2-network in Romania. I: Book of Abstracts and Papers, XXVII General Assembly of the EuropeanSeismological Commission, Lisbon, SSA-2-13-O, p 53
Bonjer KP, Sokolov V, Wirth W, Rizescu M, Driad L, Treml M (2001) The seismogenic potential of the Vranceasubduction zone–quantification of source- and site-effects of great events. Collaborative Research Center(CRC) 461 “Strong Earthquakes: a Challenge for Geosciences and Civil Engineering”, Report of 1999–2001, University of Karlsruhe, pp 259–293 (in German)
Boore DM (2003) Simulation of ground motion using the stochastic method. Pure Appl Geophys 160:635–676Brune JN (1970) Tectonic stress and the spectra of seismic shear waves from earthquakes. J Geophys Res
75:4997–5009Building Seismic Safety Council (BSSC) (1998) 1997 NEHRP recommended provisions for the development
of seismic regulation for new buildings. Federal Emergency Management Agency Washington DC,FEMA 302
Bune VI, Radu K, Polyakova TP (1986) Analysis of isoseismal schemes of the Vrancea earthquakes ofNovember 10, 1940, and March 4, 1977. Problems of Engineering Seismology, vol 27, Nauka PublishingHouse Moscow, pp 126–135 (in Russian)
Chernov Y, Sokolov V (1999) Correlation of seismic intensity with Fourier acceleration spectra. Phys ChemEarth 24(6):522–528
Enescu D (1997) Ground movement acceleration-macroseismic intensity relations for Vrancea earthquakes.Considerations of the macroseismic maps of some of these earthquakes. St Cerc Geol Geogr Geofiz35:15–27
Ismail-Zade A, Sokolov V, Bonjer KP (2007) Tectonic stress, seismicity and seismic hazard in the South-Eastern Carpathians. Nat Hazards 42(3):493–514
Ivan IA, Enescu BD, Pantea A (1998) Input for seismic hazard assessment using Vrancea source region. RomJ Phys 43:619–636
Lermo J, Chavez-Garcia FJ (1993) Site effect evaluation using spectral ratios with only one station. BullSeismol Soc Am 83:1574–1594
Lungu D, Demetriu S, Radu C, Coman O (1995) Uniform hazard response spectra for Vrancea earthquakes inRomania. In: Duma G (ed) Proceedings 10th European Conference on Earthquake Engineering. Balkema,Rotterdam, pp 365–370
Lungu D, Zaicenco A, Cornea T, Van Gelder P (1997) Seismic hazard: recurrence and attenuation of subcrustal(60–170km) earthquakes. Struct Saf 7:1525–1532
Lungu D, Cornea T, Nedelcu C (1999) Hazard assessment and site dependent response for Vrancea earthquakes.In: Wenzel et al (eds) Vrancea earthquakes: tectonics, hazard and risk mitigation. Kluwer AcademicPublishers, Dordrecht, pp 251–267
Lungu D, Demetriu S, Aldea A, Arion C (2006) Probabilistic seismic hazard assessment for Vrancea earth-quakes and seismic action in the new seismic code of Romania. In: Proceedings of first European confer-ence on earthquake engineering and seismology, September 3–8 2006, Geneva Switzerland, CD_ROM,paper 1003
Mandrescu N (1972) Experimental research on seismic microzoning. St Cerc Geol Geogr Geofiz 10(2):103–116 (In Romanian)
Mandrescu N, Radulian M (1999) Macroseismic field of the Romanian intermediate-depth earthquakes. In:Wenzel et al (eds) Vrancea earthquakes: tectonics, hazard and risk mitigation. Kluwer Academic Pub-lishers, Dordrecht, pp 163–174
Mandrescu N, Anghel M, Smalberbergher V (1988) The Vrancea intermediate-depth earthquakes and thepeculiarities of the seismic intensity distribution over the Romanian territory. St Cerc Geol Geogr Geofiz26:51–57
Mandrescu N, Radulian M, Marmureanu Gh (2007) Geological, geophysical and seismological criteria forlocal response evaluation in Bucharest urban area. Soil Dyn Earthquake Eng 27:367–393
Marza VI, Pantea AI (1994) Probabilistic estimation of seismic intensity attenuation for Vrancea(Romania) subcrustal sources. In: Proc. XXIV Gen. Assembly ESC, Athens, Greece, 19–24September 1994, vol. III, pp 1752–1761
123
388 Bull Earthquake Eng (2008) 6:367–388
Marza VI, Kijko A, Mantyniemi P (1991) Estimate of earthquake hazard in the Vrancea (Romania) region.Pure Appl Geophys 136:143–154
Moldoveanu CL, Panza GF (2001) Vrancea source influence on local seismic response in Bucharest. PureApll Geophys 158:2407–2429
Moldoveanu CL, Radulian M, Marmureanu G, Panza GF (2004) Microzonation of Bucharest: state-of-art.Pure Apll Geophys 161:1125–1147
Radulian M, Vaccari F, Mandrescu N, Panza GF, Moldoveanu CL (2000) Seismic hazard of Romania: deter-ministic approach. Pure Appl Geophys 157:221–247
Radulian M, Panza GF, Popa M, Grecu B (2006) Seismic wave attenuation for Vrancea events revisited.J Earthquake Eng 10:411–427
Sandi H (2001) Obstacles to earthquake risk reduction encountered in Romania. In: Lungu D, Saito T (eds)Earthquake hazard and countermeasures for existing fragile buildings, pp 261–266
Sokolov V (2002) Seismic intensity and Fourier acceleration spectra: revised relationship. Earthq Spectra18:161–187
Sokolov V, Bonjer KP (2006) Modelling of distribution of ground motion parameters during strong Vrancea(Romania) earthquakes. In: Proceedings of the first European conference on earthquake engineering andseismology, Geneva Switzerland 3–8 September 2006, CD-ROM, Paper 363
Sokolov V, Wenzel F (2007) Seismic hazard assessment for areas with a lack of empirical strong groundmotion data: a case of Romania. In: Proceedings of 3rd Indian-German Workshop on seismic safety ofstructures, risk assessment and disaster mitigation, Mumbay India 12–14 March 2007, pp 1–10
Sokolov V, Loh CH, Wen KL (2000) Empirical study of sediment-filled basin response: a case of Taipei city.Earthquake Spectra 16:681–707
Sokolov V, Bonjer KP, Wenzel F (2004a) Accounting for site effect in probabilistic assessment of seismichazard for Romania and Bucharest: a case of deep seismicity in Vrancea zone. Soil Dyn Earthq Eng24(12):927–947
Sokolov V, Bonjer KP, Rizescu M (2004b) Assessment of site effect in Romania during intermediate depthVrancea earthquakes using different techniques. In: IUGG special volume earthquake hazard, risk, andstrong ground motion. Seismological Press Beijing, pp 295–322
Sokolov V, Bonjer KP, Oncescu M, Rizescu M (2005) Hard rock spectral models for inermediate-depthVrancea (Romania) earthquakes. Bull Seismol Soc Am 95:1749–1765
Wills CJ, Petersen M, Bryant WA, Reichle M, Saucedo GJ, Tan S, Taylor G, Treiman J (2000) A site conditionsmap for California based on geology and shear-wave velocity. Bull Seismol Soc Am 90:S187–S208
123