SPATIAL ANALYSIS OF EARTHQUAKES IN IRAQ USING ...
15
Iraqi Geological Journal Al-Heety Vol.39 – 49, No.2 (2016) 1 SPATIAL ANALYSIS OF EARTHQUAKES IN IRAQ USING STATISTICAL AND DATA MINING TECHNIQUES Emad A.M. Salih Al-Heety University of Anbar, e-mail: [email protected], Rammadi, Iraq ABSTRACT Statistical and data mining techniques (DMTs) are applied to an earthquakes catalogue of Iraq to study the spatial distribution pattern of earthquakes over the period from 1900 to 2010. The employed techniques are Quadrant Account Analysis (QCA), Tree-clustering, k-means Clustering, Association rules, and Linear Regression. Results of QCA showed that the pattern of earthquake occurrence beneath Iraq was spatially clustered. According to results of application of tree- clustering, earthquakes were grouped into nine clusters depending on degree of similarity between events. Results K-means clustering confirmed results of tree- clustering. Application of association rules failed to generate association rules between the earthquakes parameters (location, depth and magnitude, ...etc.). A weak relationship between depth and magnitude was the result of application of linear regression. Keywords: Earthquake; Data mining; Clustering; Iraq INTRODUCTION Earthquakes are ground motions caused by the sudden release of elastic energy stored in the rocks along period of time. Earthquakes have very complex spatio- temporal distribution (Turcott, 1993; Sornett, 1999; Bak et al., 2002; Vecchio et al., 2008). The spatial, temporal and energy distribution of earthquakes was investigated in last decades in terms of geodynamical characterization of the seismic process and seismic hazard analysis (Main, 1995, and De Rubeis et al., 1997). Three empirical statistical laws represent the basis for earthquakes models development: 1. Omori law; 2. Gutenberg-Richter law; 3. Fractal distribution (Vecchio et al., 2008).
-
Upload
khangminh22 -
Category
Documents
-
view
1 -
download
0
Transcript of SPATIAL ANALYSIS OF EARTHQUAKES IN IRAQ USING ...

Iraqi Geological Journal Al-Heety Vol.39 – 49, No.2 (2016)
1
SPATIAL ANALYSIS OF EARTHQUAKES IN IRAQ USING
STATISTICAL AND DATA MINING TECHNIQUES
Emad A.M. Salih Al-Heety
University of Anbar, e-mail: [email protected], Rammadi, Iraq
ABSTRACT Statistical and data mining techniques (DMTs) are applied to an earthquakes
catalogue of Iraq to study the spatial distribution pattern of earthquakes over the
period from 1900 to 2010. The employed techniques are Quadrant Account Analysis
(QCA), Tree-clustering, k-means Clustering, Association rules, and Linear
Regression. Results of QCA showed that the pattern of earthquake occurrence beneath Iraq was spatially clustered. According to results of application of tree-
clustering, earthquakes were grouped into nine clusters depending on degree of
similarity between events. Results K-means clustering confirmed results of tree-
clustering. Application of association rules failed to generate association rules
between the earthquakes parameters (location, depth and magnitude, ...etc.). A weak
relationship between depth and magnitude was the result of application of linear
regression.
Keywords: Earthquake; Data mining; Clustering; Iraq
INTRODUCTION Earthquakes are ground motions caused by the sudden release of elastic energy
stored in the rocks along period of time. Earthquakes have very complex spatio-
temporal distribution (Turcott, 1993; Sornett, 1999; Bak et al., 2002; Vecchio et al.,
2008). The spatial, temporal and energy distribution of earthquakes was investigated in
last decades in terms of geodynamical characterization of the seismic process and
seismic hazard analysis (Main, 1995, and De Rubeis et al., 1997). Three empirical
statistical laws represent the basis for earthquakes models development: 1. Omori law;
2. Gutenberg-Richter law; 3. Fractal distribution (Vecchio et al., 2008).
Iraqi Geological Journal Al-Heety Vol.39 – 49, No.2 (2016)
2
Data mining includes a set of techniques that can be used to extract valuable
information and knowledge from large database (Otari and Kulkarni, 2012). During the
intervening decades, important innovations in computer systems have led to the introduction of new technologies (Ha et al., 2000), for web-based education.
The basis of data mining includes statistics, artificial intelligence, and information
theory (Somodevilla et al., 2012; Otari and Kulkarni, 2012). Liao et al. (2012) reviewed
in details the data mining techniques and their applications. Data mining techniques
(DMT) can be applied to investigate the spatio-temporal distribution of earthquakes
(e.g. Dzwinel et al., 2005; Telesca, 2011; Sadoviski, 2012; Alhamdi et al., 2013; Kostic
et al., 2014; Raju and Rajesh, 2015; Gan et al., 2015). On the other hand, several
investigators employed data mining techniques to study the earthquake prediction (e.g.
Koutsourelakis, 2010; Srinivasa Murthy et al., 2014).
Many authors investigated the seismicity and seismotectonic of Iraq (e.g. Alsinawi
and Ghalib, 1975; Alsinawi and Issa, 1986; Alsinawi and Al-Qasrani, 2003; Al-Abbasi
and Fahmi, 1985; Fahmi and Al-Abbasi, 1989; Abd Alridha and Jasem, 2013;
Abdulnaby et al., 2013 and 2014, and Al-Heety, 2014).
The aim of this research is to apply a number of data mining techniques to
investigate the spatial patterns in the occurrence of earthquakes in Iraq.
DATA AND METHODS Seismic Data
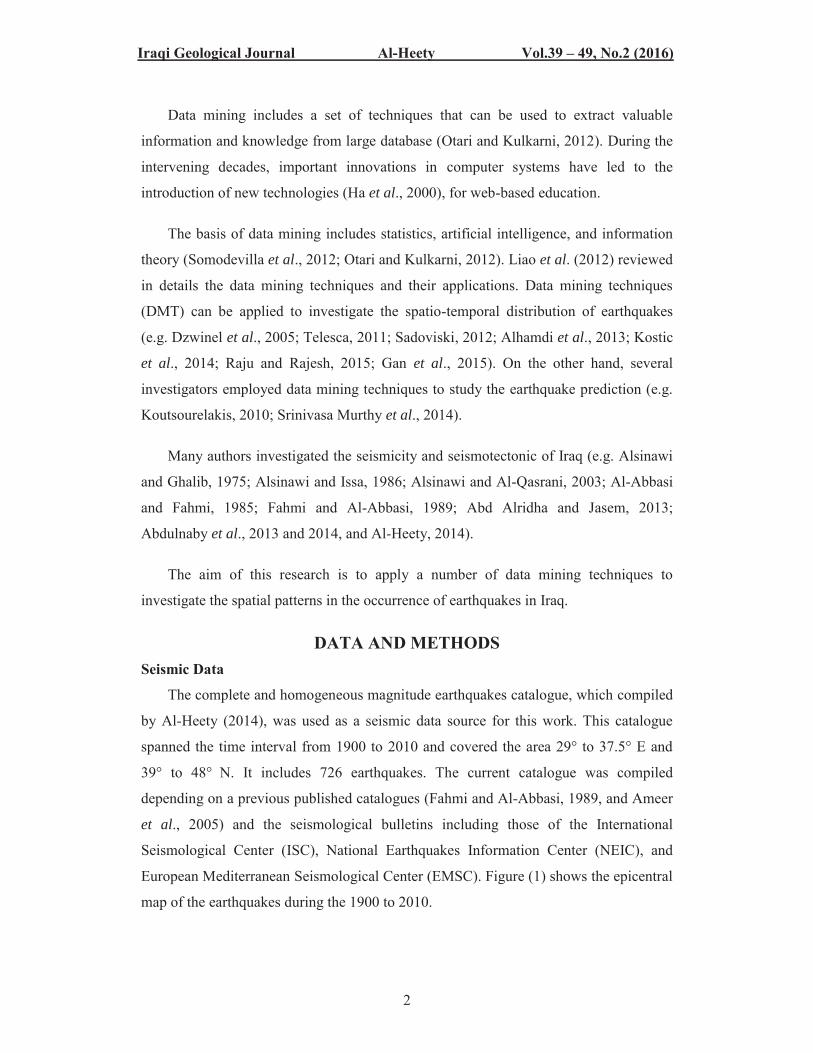
The complete and homogeneous magnitude earthquakes catalogue, which compiled
by Al-Heety (2014), was used as a seismic data source for this work. This catalogue
spanned the time interval from 1900 to 2010 and covered the area 29° to 37.5° E and
39° to 48° N. It includes 726 earthquakes. The current catalogue was compiled
depending on a previous published catalogues (Fahmi and Al-Abbasi, 1989, and Ameer
et al., 2005) and the seismological bulletins including those of the International
Seismological Center (ISC), National Earthquakes Information Center (NEIC), and
European Mediterranean Seismological Center (EMSC). Figure (1) shows the epicentral
map of the earthquakes during the 1900 to 2010.
Iraqi Geological Journal Al-Heety Vol.39 – 49, No.2 (2016)
3
Fig. 1: Earthquakes of Iraq over the period 1900 – 2010 (After Al-Heety, 2014)
Quadrant Count Analysis
The concept, which is employed in this work, is random. If N points are located
randomly in a planar region, then the probability distribution of this random spatial
point pattern follows the Poisson law. An observed frequency distribution, which does
not conform to the expected from a random point process, leads to rejection of the hypothesis of randomness in favor of the alternative – more regular or more clustered,
than the random model.
The method employed to investigate the spatial distribution of earthquakes in
Iraq is called Quadrant Count Analysis (QCA) (Cressie and Wikle, 2010, and Rogers
and Gomar, 2010). The QCA involves dividing the region into a grid with cells of equal
size, called quadrant. The number of points in each cell is counted. The regular point
process generates a large number of quadrants containing only a single point, some
empty quadrants and a very few quadrants with more than one point in them.
Conversely, a clustered point process produces a very large number of empty quadrants,
Iraqi Geological Journal Al-Heety Vol.39 – 49, No.2 (2016)
4
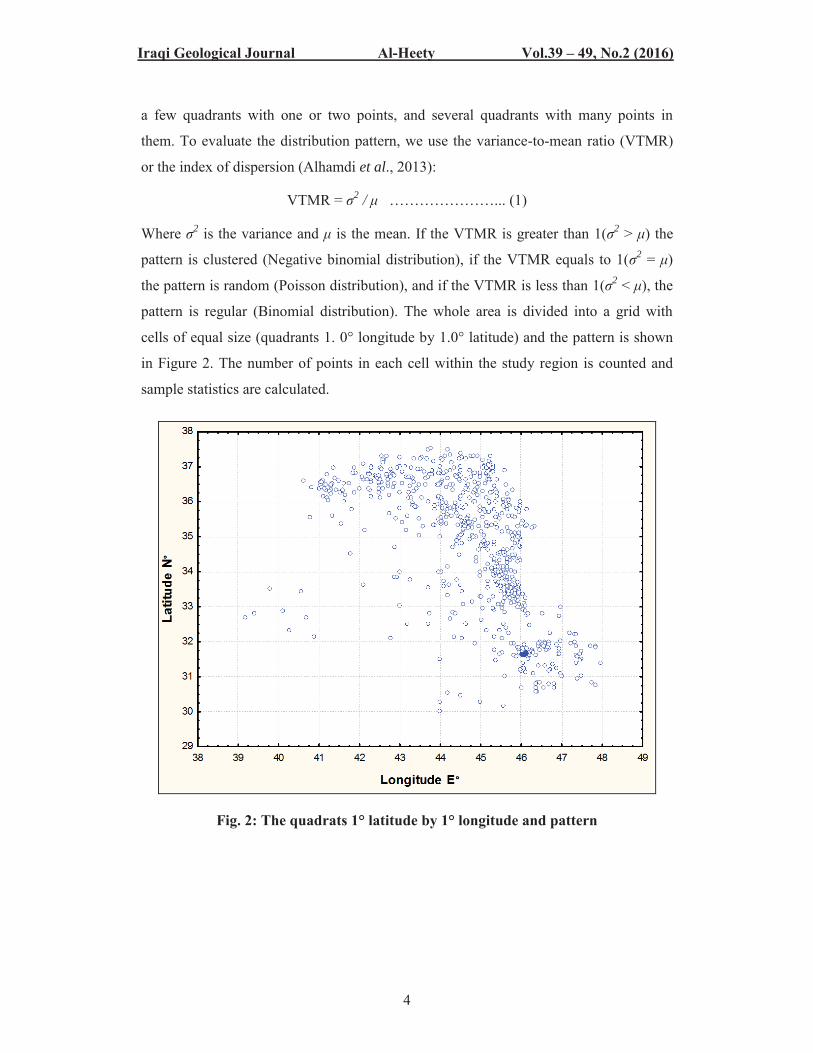
a few quadrants with one or two points, and several quadrants with many points in
them. To evaluate the distribution pattern, we use the variance-to-mean ratio (VTMR)
or the index of dispersion (Alhamdi et al., 2013):
VTMR = σ2 / μ …………………... (1)
Where σ2 is the variance and μ is the mean. If the VTMR is greater than 1(σ2 > μ) the
pattern is clustered (Negative binomial distribution), if the VTMR equals to 1(σ2 = μ)
the pattern is random (Poisson distribution), and if the VTMR is less than 1(σ2 < μ), the
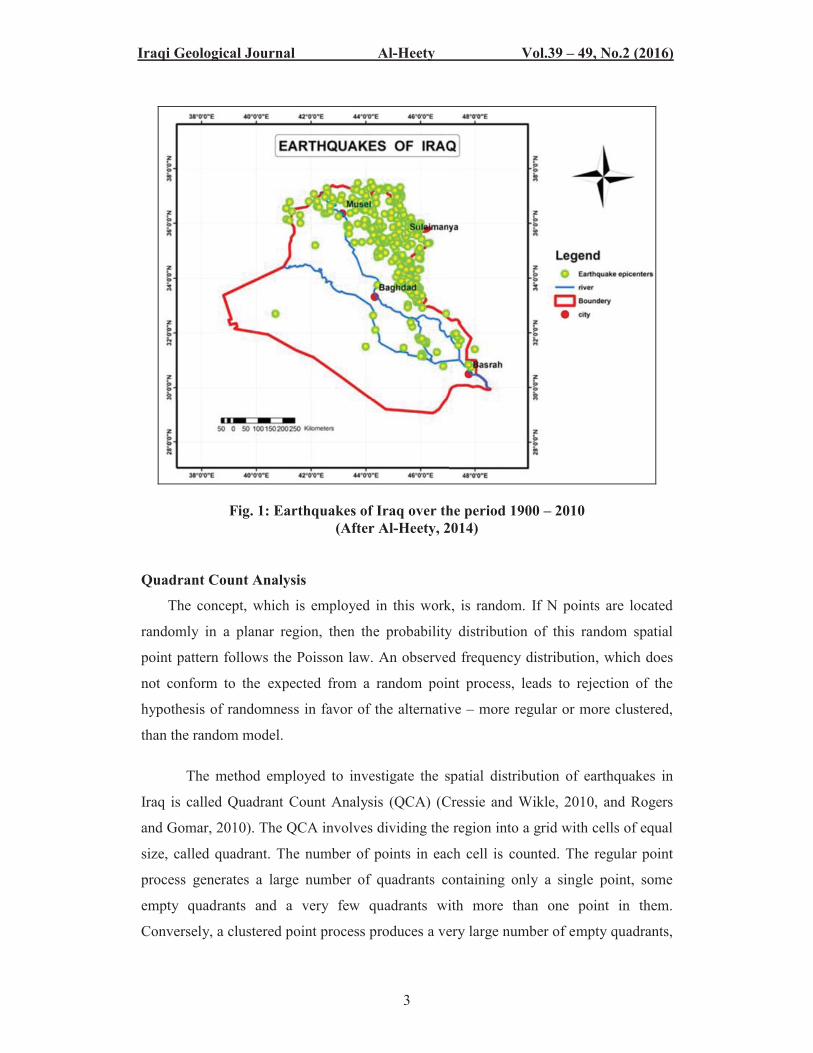
pattern is regular (Binomial distribution). The whole area is divided into a grid with
cells of equal size (quadrants 1. 0° longitude by 1.0° latitude) and the pattern is shown
in Figure 2. The number of points in each cell within the study region is counted and
sample statistics are calculated.
Fig. 2: The quadrats 1° latitude by 1° longitude and pattern
Iraqi Geological Journal Al-Heety Vol.39 – 49, No.2 (2016)
5
DATA MINING TECHNIQUES (DMTS) The following DMTs are employed to investigate the seismicity of Iraq as:
1. Cluster Analysis
The purpose of the cluster analysis is to join together the similar objects into
subgroups (called clusters) so that objects (observations) in the same cluster are similar
in some sense. There are three classes of cluster analysis techniques: Joining (Tree
Clustering), Two-way Joining (Block Clustering), and K-mean Clustering. In this study,
the tree clustering and k-means clustering were employed.
2. Tree Clustering Method
Hierarchical cluster analysis, the most common approach of tree clustering, starts
with each case in a separate cluster and joins clusters together step by step until only
one cluster remains. The subsequent clusters of objects (observations) ought to display
high inner (inside clusters) homogeneity and high outer (between clusters)
heterogeneity (McGarial et al., 2000). The Euclidean distance as a rule gives the
similarity between two observations, and a distance can be explained by the distance
between observed (analytical) values from the samples or observations (Otto, 1998).
The squared Euclidean distance (D2) is computed as follow:
D2 = i (xi - yi)2 …………………. (2)
The results of the application of the tree clustering technique are the best in which it
is described using a dendogram or binary tree. The dendogram gives a visual outline of
the clustering processes, showing a picture of the groups and their vicinity, with an
effective decrease in dimensionality of the premier data (Tabachnick and Fidell, 1996).
3. k-Means Clustering Method
This technique for clustering is altogether different from the Joining (Tree
Clustering). It means to segment n objects (obsevations) into k clusters so that the
subsequent intra-cluster similarity is high but the between cluster similarity is low.
Cluster similarity is measured with respect to the mean value of the object in a cluster,
which can be seen as the cluster's focal point of gravity (Sriniv Asamurthy et al., 2014).
This method begins with k irregular cluster, each of which at first appears a cluster
mean or focus. For each remaining objects, an object is indicated to the cluster in which
Iraqi Geological Journal Al-Heety Vol.39 – 49, No.2 (2016)
6
it is most similar, taking into account the distance between the object and the cluster
mean. It then calculates the new mean for every cluster. The execution of a clustering
calculation might be influenced by the selected value of k. We adopted the technique
proposed by Pham et al. (2005) to select the quantity of k with a specific end goal to
execute the k-mean calculation. Such proposed procedure can recommend numerous
values of k to clients for situations when diverse clustering results could be gotten with
different required levels of point of interest. The legitimacy of the clustering result is
appreciated just visually without applying any formal execution measures. In this work,
we executed the k-mean calculation with various k taken as (3, 5, 7, 9, 10, 15 and 19)
and with number of iterations.
4. Association Rules
The objective of this method which depicted in this section is to recognize
connections or relationship between particular values of definite variables in vast data
sets. Since it was proposed by Agrawal et al. (1993), the task association rules mining
has gotten a lot of consideration. Briefly, an association rules is an expression X Y,
where X and Y are sets of items. The sense of such rule is just conjectural: Given
database D of transactions where every transaction T D is a set of items, X Y
explicit that at whatever point an transaction T contains X than T most likely contains Y
moreover. The probability or rule confidence is defined as "the percentage of
transactions Y in addition to X with regard to the overall number of transactions
containing X" (Hipp et al., 2000). Association rules can provide features that at first
glance may not be visible in a large data set, since its case of understanding and
effective in time to find interesting relationships. Using the association rules technique
on earthquakes data allow us to find significant relationships between earthquakes
parameters such as epicentral location, depth and magnitude.
5. Linear Regression
It is a method that predicts the numerical value for a variable from the known value
of others. The meaning of this method is to some degree like the sorting with the
distinction that in the regression are predictive variables and a numeric class variable
(Somodevilla et al., 2012). The simple linear regression should be distinguished from
multivariate linear regression by the number of dependent variables while in the simple
Iraqi Geological Journal Al-Heety Vol.39 – 49, No.2 (2016)
7
regression there is only one dependent variable, it is employed more than one dependent
variables in the linear regression. This method can be utilized to anticipate earthquake
parameter, for example, seismic tremor profundity from different parameters, area or
extent.
6. Statistical Analysis
The data were statistically analyzed using the STATISTICA software (Stat. Soft.
Inc., 2007). The descriptive statistics, graphs and data mining techniques were carried
out using this software.
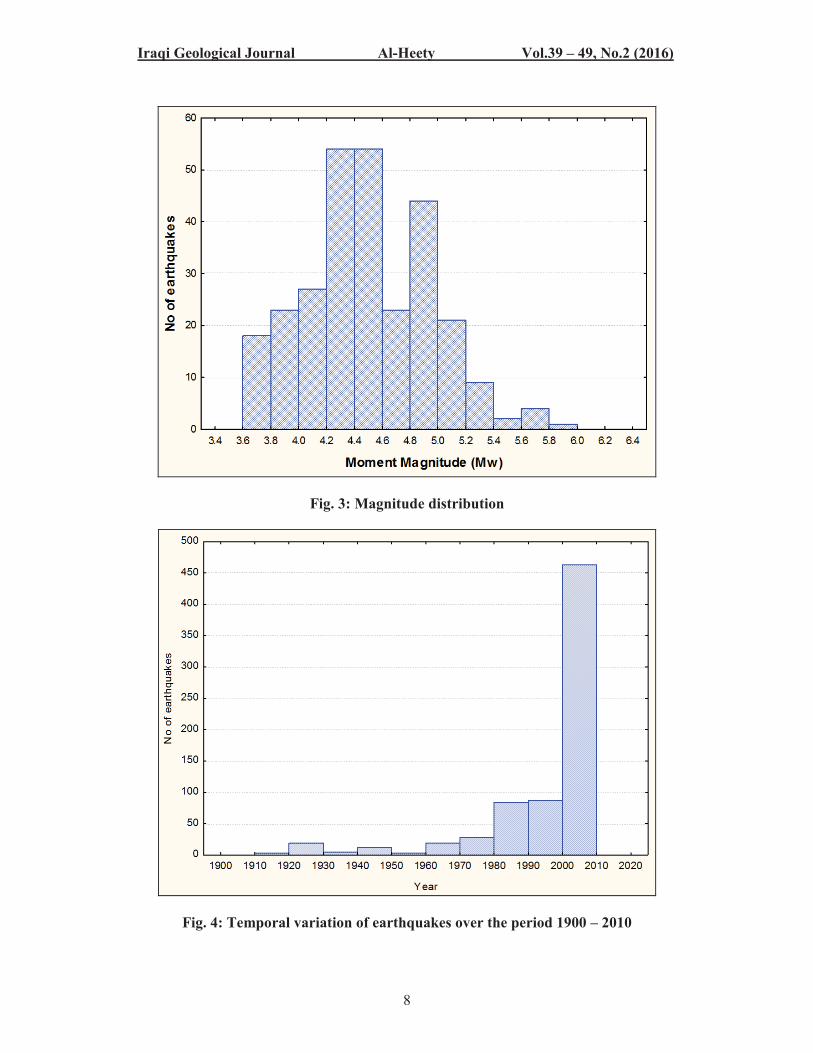
RESULTS AND DISSCUSION The descriptive statistics of earthquake data are summarized in Table (1) and
illustrated in Figures (3, 4 and 5). The reported magnitudes ranged from 3.7 Mw to
6 Mw with mean of 4.6 Mw, indicating that Iraq has moderate seismically activity. The
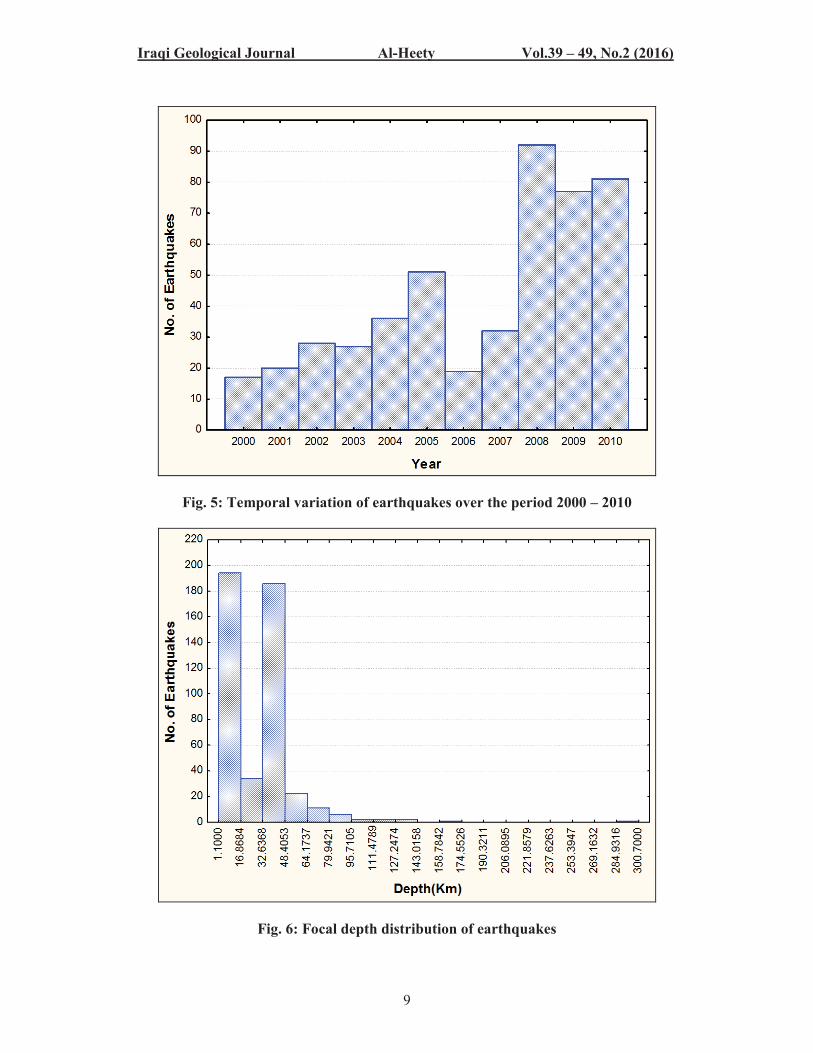
majority of hypocentral depth was less than 50 km and the other events have depth more
than 50 Km. These results imply that seismicity of Iraq is described as shallow seismic
activity region. The results of this work are in a good agreement with those of many
authors (Alsinawi and Ghalib, 1975; Alsinawi and Issa, 1986; Alsinawi and Al-Qasrabi,
2003; Al-Abbasi and Fahmi, 1985; Fahmi and Al-Abbasi, 1989, and Abd Alridha and
Jasem, 2013). Majority of earthquakes in this period was recorded during 2000 to 2010
(Fig. 6). This result can be interpreted in terms of increase of deployment the regional
seismological observatories and rehabilitation of Iraqi Seismic Network and/ or
increasing the seismic activity.
Table 1: Descriptive statistics of earthquakes beneath Iraq
Variable Mean Minimum Maximum Range Standard Deviation
Standard Error
Latitude N° 34.8 30.000 38 8 1.9 0.70
Longitude E° 44.7 39.200 48 9 1.5 0.07
Depth 28.3 1.100 301 300 24.8 0.06
Mw 4.6 3.700 6 2 0.5 1.16
0.03
Iraqi Geological Journal Al-Heety Vol.39 – 49, No.2 (2016)
8
Fig. 3: Magnitude distribution
Fig. 4: Temporal variation of earthquakes over the period 1900 – 2010
Iraqi Geological Journal Al-Heety Vol.39 – 49, No.2 (2016)
9
Fig. 5: Temporal variation of earthquakes over the period 2000 – 2010
Fig. 6: Focal depth distribution of earthquakes
Iraqi Geological Journal Al-Heety Vol.39 – 49, No.2 (2016)
10
1. Quadrant Count Analysis
The results of QCA as spatial statistical technique are listed in Table 2. VTMR was greater than 1 for all earthquake magnitude categories which indicates that the pattern of earthquake occurrence beneath Iraq from 1900 to 2010 was spatially clustered.
Table 2: Quadrant count analysis
Quadrant count analysis Magnitude M Point pattern Variance/
Mean Ratio Variance Mean
Clustered 2.85 2.85 1.00 3.5 ˂ M ≤ 4 Clustered 2.52 3.54 1.40 4 ˂ M ≤ 4.5 Clustered 1.85 1.85 1.00 4.5 ˂ M ≤ 5 Clustered 1.64 1.20 0.73 5 ˂ M ≤ 5.5 Clustered 4.12 1.65 0.40 5.5 ˂ M ≤ 6 Clustered 8.99 43.17 4.80 3.5 ≤ M ≤ 6 (all)
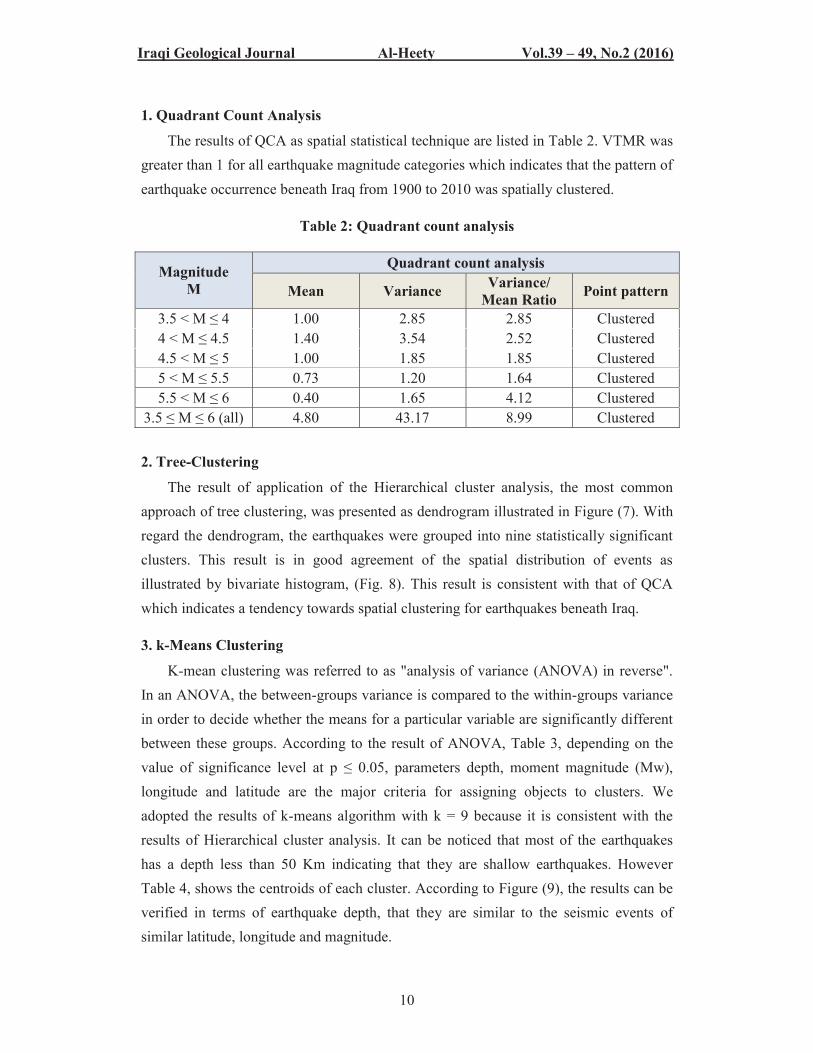
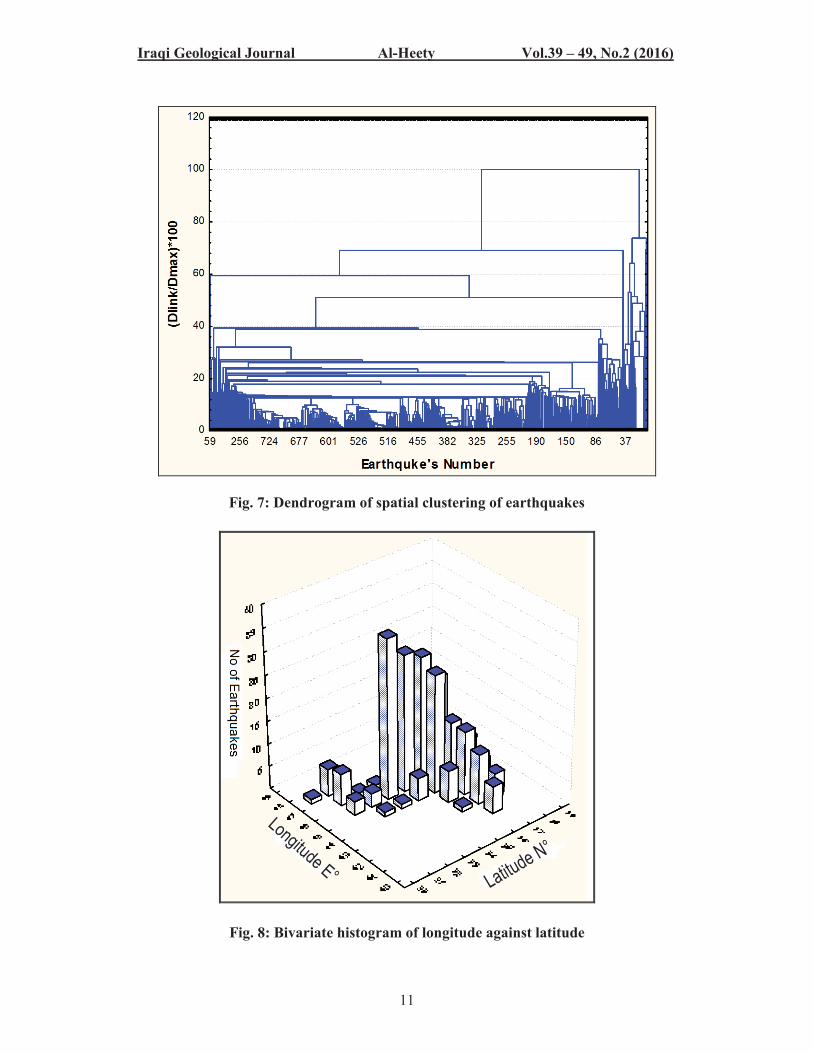
2. Tree-Clustering
The result of application of the Hierarchical cluster analysis, the most common approach of tree clustering, was presented as dendrogram illustrated in Figure (7). With regard the dendrogram, the earthquakes were grouped into nine statistically significant clusters. This result is in good agreement of the spatial distribution of events as illustrated by bivariate histogram, (Fig. 8). This result is consistent with that of QCA which indicates a tendency towards spatial clustering for earthquakes beneath Iraq.
3. k-Means Clustering
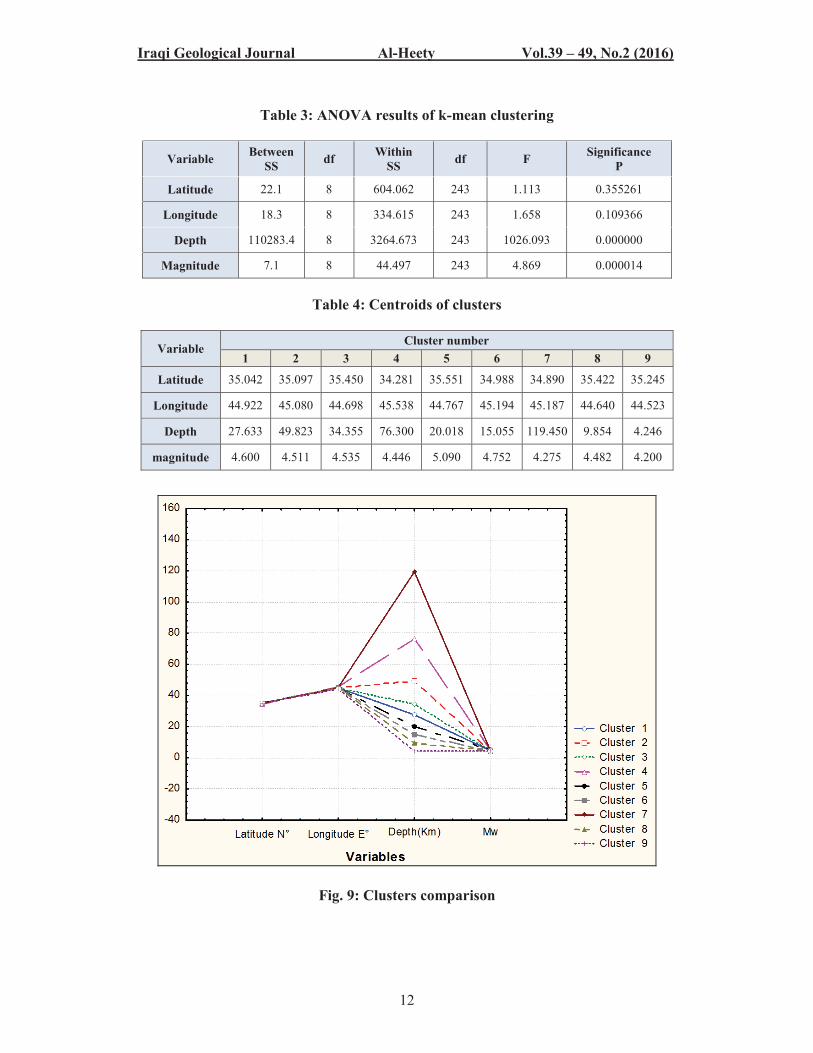
K-mean clustering was referred to as "analysis of variance (ANOVA) in reverse". In an ANOVA, the between-groups variance is compared to the within-groups variance in order to decide whether the means for a particular variable are significantly different between these groups. According to the result of ANOVA, Table 3, depending on the value of significance level at p ≤ 0.05, parameters depth, moment magnitude (Mw), longitude and latitude are the major criteria for assigning objects to clusters. We adopted the results of k-means algorithm with k = 9 because it is consistent with the results of Hierarchical cluster analysis. It can be noticed that most of the earthquakes has a depth less than 50 Km indicating that they are shallow earthquakes. However Table 4, shows the centroids of each cluster. According to Figure (9), the results can be verified in terms of earthquake depth, that they are similar to the seismic events of similar latitude, longitude and magnitude.
Iraqi Geological Journal Al-Heety Vol.39 – 49, No.2 (2016)
11
Fig. 7: Dendrogram of spatial clustering of earthquakes
Fig. 8: Bivariate histogram of longitude against latitude
Iraqi Geological Journal Al-Heety Vol.39 – 49, No.2 (2016)
12
Table 3: ANOVA results of k-mean clustering
Variable Between SS df Within
SS df F Significance P
Latitude 22.1 8 604.062 243 1.113 0.355261
Longitude 18.3 8 334.615 243 1.658 0.109366
Depth 110283.4 8 3264.673 243 1026.093 0.000000
Magnitude 7.1 8 44.497 243 4.869 0.000014
Table 4: Centroids of clusters
Variable Cluster number
1 2 3 4 5 6 7 8 9
Latitude 35.042 35.097 35.450 34.281 35.551 34.988 34.890 35.422 35.245
Longitude 44.922 45.080 44.698 45.538 44.767 45.194 45.187 44.640 44.523
Depth 27.633 49.823 34.355 76.300 20.018 15.055 119.450 9.854 4.246
magnitude 4.600 4.511 4.535 4.446 5.090 4.752 4.275 4.482 4.200
Fig. 9: Clusters comparison
Iraqi Geological Journal Al-Heety Vol.39 – 49, No.2 (2016)
13
4. Association Rules
To illustrate the application of association rules and the interpretation of its results,
only respondent's latitude, longitude, depth and magnitude will be analyzed. The
respondent's latitude and longitude are entered as a categorical variable. Other variables
(magnitude and depth) entered as multiple response variables. Application such data
mining technique did not generate any rules indicating that the data did not contain any
associations between their variables, given the current specifications for the rule-finding
algorithm.
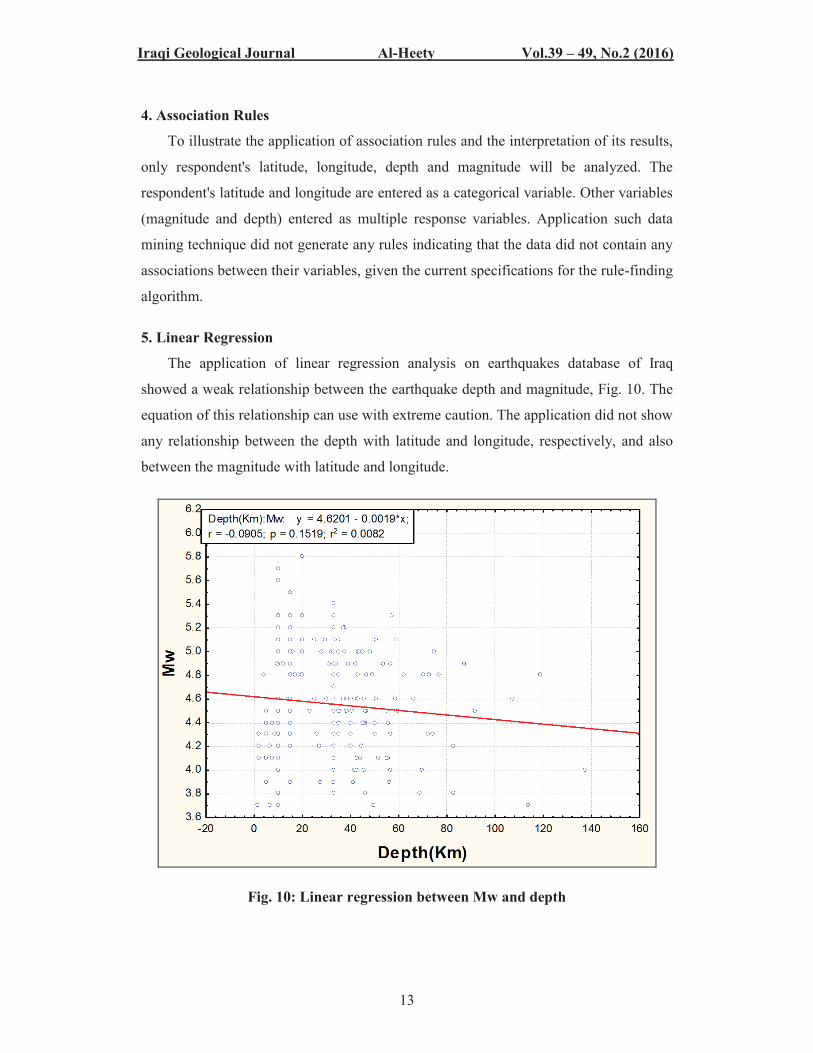
5. Linear Regression
The application of linear regression analysis on earthquakes database of Iraq
showed a weak relationship between the earthquake depth and magnitude, Fig. 10. The
equation of this relationship can use with extreme caution. The application did not show
any relationship between the depth with latitude and longitude, respectively, and also
between the magnitude with latitude and longitude.
Fig. 10: Linear regression between Mw and depth
Iraqi Geological Journal Al-Heety Vol.39 – 49, No.2 (2016)
14
CONCLUSIONS 1. Application of QCA indicates that the pattern of earthquake occurrence beneath Iraq
from 1900 to 2010 was spatially clustered.
2. Application of tree-clustering showed that the earthquakes in Iraq grouped into nine
clusters according to similarity degree between the events.
3. K-means clustering confirmed the results of application of tree-clustering.
4. Results of both methods mentioned above are in a good agreement with results of
QCA.
5. Application of association rules did not generate any rules between the earthquakes
parameters.
6. A weak relationship between the earthquake magnitude and depth was obtained.
RECOMMENDATIONS
It is recommended that the application of other techniques belong to the data
mining methods may provide and give good results in the spatial distribution pattern of
earthquakes.
REFERENCES Abdulnaby, W., Mahdi, H., Numan, N.M.S., and Al-Shukri, H., 2013. Seismotectonics of the Bitlis-
Zagros Fold and Thrust Belt in Northern Iraq and Surrounding Regions from Moment Tensor Analysis, Pure and Applied Geophysics. DOI 10.1007/s00024-013-0688-4.
Abdulnaby, W., Mahdi, H. Al-Shukri, H. and Numan, N.M.S., 2014. Stress Patterns in Northern Iraq and Surrouding Regions from Formal Stress Inversion of Earthquake Focal Mechanism Solutions, Pure and Applied Geophysics. DOI 10.1007/s00024-014-0823-x.
Abd Alridha, N. and Jasem, N.A., 2013. Seismicity evaluation of central and southern Iraq. Iraqi Journal of Science, Vol.54, p. 911 – 919.
Agrawal, A., Imielinski, T. and Swami, A., 1993. Mining association rules between sets of items in large database. In Proc. of the ACM SIGMOD Int,1 Conf. on management of data (ACM SIGMOD '93), Washington, USA.
Al-Abbasi, J. and Fahmi, K., 1985. Estimating maximum magnitude earthquakes in Iraq using extreme value statistics. Geophys J R Astron Soc, Vol.82, p. 535 – 548.
Al-Ahmadi, K., Al-Amri, A. and See, L., 2013. A spatial statistical analysis of the occurrence of earthquakes along the Red Sea floor spreading: clusters of seismicity. Arab J Geosci, DOI 10.1007/s12517-013-0974-6.
Al-Heety, E.A., 2014. A complete and homogeneous magnitude earthquake catalogue of Iraq. Arab J Geosci, Vol.7, p. 4727 – 4732.
Ammer, A., Sharma, M., Wason, H. and Alsinawi, S., 2005. Probabilistic seismic hazard assessment for Iraq using complete catalogue files. Pure Appl Geophys, Vol.162, p. 951 – 966.
Alsinawi, S.A. and Ghalib, H.A., 1975. Historical seismicity of Iraq. Bull. Seismol. Soc. Am., Vol.65, p. 541 – 547.
Alsinawi, S. and Issa., A., 1986. Seismicity and seismotectonic of Iraq. J Geol. Soc. Iraq, Vol.19, p. 39 – 59.
Alsinawi, S. and Al-Qasrani, Z., 2003. Earthquake hazards consideration for Iraq. Fourth International Conference of Earthquake Engineering and Seismology 12–14 May 2003 Tehran, Iran.
Iraqi Geological Journal Al-Heety Vol.39 – 49, No.2 (2016)
15
Bak, P., Christensen, K., Danon, L. and Scanlon, T., 2002. Unified scaling law for earthquakes. Phys. Rev. Lett., 88, 175501,doi: 10.1103/physRevLett.88.178501.
Cressie, N. and Wikle, C., 2011. Statistics for spatio-temporal data. John Wiley and Sons. De Rubeis, V., Tosi, P. and Vinciguerra, S., 1997. Time clustering and earthquake triggering in the
Koyna-Warna region, India. Geophys. Res. Lett., Vol.24, p. 2331 – 2334. Dzwinel, W., Yuen, D.A., Boryczko, K., Ben-Zion, Y., Yoshioka, S. and Ito, T., 2005. Nonlinear
multidimensional scaling and visualization of earthquake clusters over space, time and feature space. Nonlinear Process Geophys., Vol.12, p. 117 – 128.
Fahmi, K. and Al-Abbasi, J., 1989. Seismic intensity zoning and earthquake risk mapping in Iraq. Nat Hazards, Vol.1, p. 331 – 340.
Gan, W., Flohlich, C. and Jin, Z., 2015. Origin and significance of deep earthquake clusters surrounding a pronounced seismic gap in northeast China. Journal of Asian Earth Sciences, Vol.100, p. 91 – 97.
Ha, S., Bae, S. and Park, S., 2000. Web mining for distance education. In IEEE international conference on management of innovation and technology, p. 715 – 719.
Hipp, J., Güntzer, U. and Nakhaeizadeh, G., 2000. Algorithms for association rule mining – A General Survey and Comparison. SIGKDD Explorations, Vol.2, p. 58 – 64.
Kostić, S., Vasović, N. and Perc, M., 2014. Temporal distribution of recorded magnitudes in Sebia earthquake catalog. Applied Mathematics and Computation, Vol.244, p. 917 – 924.
Koutsourelakis, P.S., 2010. Assessing structural vulnerability against earthquakes using multi-dimensional fragility surfaces: A Bayesian framework. Probabilistic Engineering Mechanics, Vol.25, p. 49 – 60.
Liao, S., Chu, P. and Hsiao, P., 2012. Data mining techniques and applications – A decade review from 2000 to 2011. Experts System With Applications, Vol.39, p. 11303 – 11311.
Main, I.G., 1995. Earthquakes as critical phenomena: implications for probabilistic seismic hazard analysis. Bull. Seismol. Soc. Am., Vol.85, p. 1299 – 1309.
McGarial, K., Cushman, S. and Stafford, S., 2000. Multivariate statistics for wildlife and ecology research. Springer, New York.doi:10.1007/978-1-4612-1288-1
Otari, G. V. and Kulkarni, R. V., 2012. A review of application on data mining in earthquake prediction. International Journal of Computer Science and Information Technologies, Vol.3, p. 3570 – 3574.
Otto, M., 1998. Multivariate methods. In: R. Kellner, J.M. Mermet, M. Otto, and H. M. Widmer, Eds. Analytical Chemistry, Wiley-VCH, Weinheim,
Pham, D. T., Dimov, S.S. and Nguyen, C.D., 2005. Selection of K in K-means clustering. Proc. IMechE Vol. 219 Part C: J. Mechanical Engineering Science, DOI: 10.1243/095440605X8298.
Raju, K.S. and Rajesh, K., 2015. Data mining techniques for earthquake frequency-magnitude analysis and seismic zone estimation. International Journal of Computer Trends and Technology (IJCTT), Vol.25, p. 114 – 117.
Rogers, A. and Gomar, N.G., 2010. Statistical inference in quadrat analysis. UC Berkeley, http:// onlinelibrary. Wiley.com/doi/10.1111/j.1538-4632.1969.tb00631.x/pdf.
Sadovski, A.N., 2012. Spatial analysis of earthquakes in Bulgaria and neighboring areas. Екологично инженерство и опазване на околната среда, Vol.2, p. 13 – 21.
Srinivasa Murthy, Y.V., Kumar, M.V., Sandeef, K.V., Manikya, S. and Reddy, E.V., 2014. Earthquake prognostication using datd mining and curve fitting techniques. International Journal of Innovative Technology and Research, Vol.2, p. 1214 – 1218.
Somodevilla, M.J., Priego, A.B., Castillo, E., Pineda, I.H., Vilariño, D. and Nava, A., 2012. Decision support system for seismic risks. JCS & T, Vol.12, p. 71 – 77.
Sornette, D., 1999. Earthquakes: from chemical alteration to mechanical rupture. Physics Report, Vol.313, p. 237 – 299.
Stat. Soft. Inc. 2007. STATISTICA (data analysis software system) version 8 , www.statsoft.com. Tabachnick, B., and Fidell, L., 1996. Using Multivariate Statistics. Harper Collins College Publishers,
New York. Telesac, L., 2011. Investigating the temporal vatiations of the time-clustering behavior of the Koyna-
Warna (India) reservoir-triggered seismicity. Chaos, Solitons & Fractals, Vol.44, p. 108 – 113. Turcotte, D.L., 1993. Fractals and Chaos in Geology and Geophysics, Cambridge University Press,
Cambridge, England. Vecchio, A., Carbone, V., Sorriso-Valvo, L., De Ross, C., Guerra, I. and Harabaglia, P., 2008. Statistical
properties of earthquakes clustering. Nonlin. Processes Geophys., Vol.15, p. 333 – 338.