Geometrical constraints for the configuration of the Vrancea (Romania) intermediate-depth seismicity...
20
J Seismol (2011) 15:579–598 DOI 10.1007/s10950-011-9233-z ORIGINAL ARTICLE Geometrical constraints for the configuration of the Vrancea (Romania) intermediate-depth seismicity nest Octavian F. Carbunar · Mircea Radulian Received: 29 June 2010 / Accepted: 27 January 2011 / Published online: 18 March 2011 © Springer Science+Business Media B.V. 2011 Abstract For a seismogenic area like Vrancea (Romania) with well-defined geometrical features of the seismicity production in space and time, the numerical simulation of the earthquake genera- tion process (e.g. cellular automaton) looks highly attractive. The delimitation, as accurately as pos- sible, of the geometrical features of the seismically active system in the Vrancea subcrustal zone is essential to constrain the simulation modeling. As a first approximation, the seismicity pattern is close to a fault plane NE–SW oriented, ex- tended roughly vertically between 60 and 170 km depth. A characteristic median plane is defined by minimizing the distance of hypocenters. The average distance of the hypocenters to the median plane is around 5 km. However, a more detailed investigation of the geometrical configuration of seismicity indicates a fragmentation of the active body located in the upper mantle in two segments. O. F. Carbunar National Institute for Physics and Nuclear Engineering, Magurele, Ilfov, Romania e-mail: carbunar@ifin.nipne.ro M. Radulian (B ) National Institute for Earth Physics, POB MG-2, Bucharest-Magurele, Ilfov, Romania e-mail: [email protected] The seismicity pattern is well approximated by a planar distribution in each segment. In the transi- tion zone, between the upper and lower segment, the hypocenter distribution is more dispersed and shows a disruption among the two planar seg- ments, measured by about 9 km apart laterally one relative to the other. The two segments hosted the major Vrancea events recorded in the last two centuries (for which we have available location of acceptable accuracy). The narrow transition zone at about 100 km depth is interpreted as a weaker segment, possibly caused by a dehydra- tion process or by an infiltration of asthenosphere material from the back side of the South-Eastern Carpathian arc system. It is still debatable if fragmentation in two seismically active segments reflects the existence of two neighbouring sepa- rate blocks (upper, continental and lower, oceanic block) or a consequence of a breaking process separating a continental block into two parts. The segmentation of the descending lithosphere and the edge effects are apparently stationary, at least for the time interval since 1985 to the present, for which the earthquake catalogue is reliable (homogeneous). Keywords Geometrical constraints · Seismicity patterns · Mantle earthquakes · Earthquake numerical simulation · Vrancea
-
Upload
independent -
Category
Documents
-
view
0 -
download
0
Transcript of Geometrical constraints for the configuration of the Vrancea (Romania) intermediate-depth seismicity...

J Seismol (2011) 15:579–598DOI 10.1007/s10950-011-9233-z
ORIGINAL ARTICLE
Geometrical constraints for the configurationof the Vrancea (Romania) intermediate-depthseismicity nest
Octavian F. Carbunar · Mircea Radulian
Received: 29 June 2010 / Accepted: 27 January 2011 / Published online: 18 March 2011© Springer Science+Business Media B.V. 2011
Abstract For a seismogenic area like Vrancea(Romania) with well-defined geometrical featuresof the seismicity production in space and time, thenumerical simulation of the earthquake genera-tion process (e.g. cellular automaton) looks highlyattractive. The delimitation, as accurately as pos-sible, of the geometrical features of the seismicallyactive system in the Vrancea subcrustal zone isessential to constrain the simulation modeling.As a first approximation, the seismicity patternis close to a fault plane NE–SW oriented, ex-tended roughly vertically between 60 and 170 kmdepth. A characteristic median plane is definedby minimizing the distance of hypocenters. Theaverage distance of the hypocenters to the medianplane is around 5 km. However, a more detailedinvestigation of the geometrical configuration ofseismicity indicates a fragmentation of the activebody located in the upper mantle in two segments.
O. F. CarbunarNational Institute for Physics and NuclearEngineering, Magurele, Ilfov, Romaniae-mail: [email protected]
M. Radulian (B)National Institute for Earth Physics, POB MG-2,Bucharest-Magurele, Ilfov, Romaniae-mail: [email protected]
The seismicity pattern is well approximated by aplanar distribution in each segment. In the transi-tion zone, between the upper and lower segment,the hypocenter distribution is more dispersed andshows a disruption among the two planar seg-ments, measured by about 9 km apart laterallyone relative to the other. The two segments hostedthe major Vrancea events recorded in the last twocenturies (for which we have available locationof acceptable accuracy). The narrow transitionzone at about 100 km depth is interpreted as aweaker segment, possibly caused by a dehydra-tion process or by an infiltration of asthenospherematerial from the back side of the South-EasternCarpathian arc system. It is still debatable iffragmentation in two seismically active segmentsreflects the existence of two neighbouring sepa-rate blocks (upper, continental and lower, oceanicblock) or a consequence of a breaking processseparating a continental block into two parts. Thesegmentation of the descending lithosphere andthe edge effects are apparently stationary, at leastfor the time interval since 1985 to the present,for which the earthquake catalogue is reliable(homogeneous).
Keywords Geometrical constraints ·Seismicity patterns · Mantle earthquakes ·Earthquake numerical simulation ·Vrancea

580 J Seismol (2011) 15:579–598
1 Introduction
The numerical simulations of the earthquakeprocess have gained interest in the seismologicalresearch taking into consideration (1) the difficultyto investigate directly the physical and geochem-ical processes governing the earthquake genera-tion and (2) the development of the computingfacilities.
The particularities of the seismic process in theVrancea zone, located beneath the SE Carpathianbending zone (Fig. 1), make attractive the appli-cation of numerical simulation techniques as com-petent tools to investigate the earthquake processand to explain the seismic cycle evolution andprecursory phenomena. The Vrancea zone is aninteresting test site to investigate and constrainthe process of earthquake generation, from manypoints of view easier than other seismic activeareas in the world, due to the concentration andstability of earthquake generation and the well-defined alignments of seismic activity. At thesame time, the improvement in understanding theearthquake process in this particular region hasimportant impact in mitigating the risk affectingan extended territory in the South-Eastern, Cen-tral and North-Eastern Europe.
Previous studies based on the analysis of back-ground seismicity patterns and of the after-shock distribution (e.g. Trifu and Radulian 1991a,Radulian et al. 1991) showed that the deformationin the Vrancea zone concentrates beneath about60 km depth and tends to be released in twosegments: 70–100 km depth (in the upper partof the subducted lithosphere), 120–170 km depth(in the lower part of the subducted lithosphere).The major shocks produced in the last hundredyears were generated in the upper and lower seg-ments alternatively: October 6, 1908 (Mw = 7.1,h = 90 km), November 10, 1940 (Mw = 7.7, h =150 km), March 4, 1977 (Mw = 7.4, h = 89 km),August 30, 1986 (Mw = 7.1, h = 131 km), May 30,1990 (Mw = 6.9, h = 90 km).
The seismicity in the overlaying crust is morediffuse, and the energy release is significantlylower than in the mantle. It is still debatable howto link the crustal structure features in this regionwith shallow seismicity and how to interpret themin connection with subcrustal tectonic processes
(e.g. Knapp et al. 2005; Bocin et al. 2009). Accord-ing to tomography investigations (Martin et al.2006; Koulakov et al. 2010) and crustal stress fieldanalysis (Müller et al. 2010), the Vrancea slab isweakly coupled to the overlying crust. The currentlack of seismic activity between 40 and 60 kmdepth (the few events recorded here, as shownin Fig. 1, are of low magnitude and usually lessaccurately located) could be interpreted as ev-idence of this decoupling. In the following, wefocus our attention on the seismic activity below60 km depth (black symbols in Fig. 1).
The Vrancea region permanently generatesearthquakes at intermediate depths (60–170 km)in a well-defined seismogenic volume. The geo-metrical configuration of seismicity in this seismicsource shows striking features reflecting specificphysical-rheological-geochemical processes, stillnot elucidated. We can assume that some criti-cal parameters explain the contrast between theseismic and aseismic regimes, such as on depth, atthe lower boundary (170 km) and at all the lateralboundaries of the seismic active body. The under-standing of these processes provides key elementsto understand the seismic cycle evolution in theVrancea region.
Certainly, the seismic faulting is possible sincea high-velocity lithospheric body penetrates be-neath the Vrancea area down to at least 200 kmdepth. This high-velocity body is emphasized onthe tomography images (Fan et al. 1998; Worteland Spakman 2000; Martin et al. 2006; Koulakovet al. 2010) like a narrow, almost vertical, slice,elongated on NE-SW direction.
The inspection of the historical data over a700 years catalogue suggests seismic cycles of aboutfour shocks with magnitude above seven per cen-tury in the Vrancea subcrustal slab (Oncescu et al.1999). However, despite the concentration of fociin space (the hypocenter distribution concentratesin a narrow volume, NE–SW oriented and closeto the vertical), the persistence of earthquakeproduction in time (a relatively constant rate of15–20 events/month with magnitude Mw > 2.5)and of the seismicity clustering properties (e.g.Radulian et al. 2008), the process of triggering thestrongest shocks has a chaotic character whichmakes difficult any medium- and short-termprediction.

J Seismol (2011) 15:579–598 581
-80 -60 -40 -20 0 20 40 60 80 100 120
0
20
40
60
80
100
120
140
160
180
200
-80 -60 -40 -20 0 20 40 60 80 100 120
0
20
40
60
80
100
120
140
160
180
200
-80 -60 -40 -20 0 20 40 60 80 100 120
0
20
40
60
80
100
120
140
160
180
200
-80 -60 -40 -20 0 20 40 60 80 100 120
0
20
40
60
80
100
120
140
160
180
200
A – A’ B – B’
Fig. 1 Top Epicentral map of the earthquakes on theRomania territory and the Vrancea seismic source loca-tion. The crustal events (h < 60 km) are plotted in red;the subcrustal events (h ≥ 60 km) are plotted in black.
Bottom two vertical cross sections (A–A′ and B–B′) acrossVrancea region are represented for the earthquake loca-tions in the ROMPLUS routine catalog (Oncescu et al.1999, updated) from 1990 until 31 March 2010
The improvement of resolution in earthquakelocation, by increasing the number of stations af-ter 1977 earthquake, their spatial coverage, ap-plication of the Joint Hypocentre Determinationtechniques and Double-Difference (DD) loca-
tions, makes it possible now the delineation ofsignificant features in the seismogenic processevolution. Thus, a couple of studies showed thatthe generation of strong earthquakes is closelyrelated to the production of small events and

582 J Seismol (2011) 15:579–598
the development of background seismicity followssome specific configurations which are supposedto determine where and how the future moder-ate and major events will be triggered (Radulianet al. 1991, 2008; Carbunar and Radulian 2007;Carbunar et al. 2008). Certainly, all these as-pects play an important role in the seismic cyclemodeling.
Taking into consideration the elongation of theVrancea seismicity distribution (smaller extensionalong B–B′ profile in Fig. 1), numerical simu-lation techniques were proposed for a 2-D grid(on a plane along A–A′ profile) with a discretestructure for earthquake generation, both at thescale of background earthquakes and moderateearthquakes. According to Trifu (1990) and Trifuand Radulian (1989, 1991a), there is a charac-teristic dimension for the area generating typicalbackground events and for the area generatingtypical asperity-like events. Consequently, theypostulated an elementary cell for the area overwhich the stress is released during a small event(background activity) and an elementary area ofresistance (asperity cell), which are of the sameorder.
The small earthquakes release stress on theelementary area by a crack-like mechanism, whilethe moderate earthquakes release stress by anasperity-like mechanism. Both create stress-freesurface developing into the grid. The major eventis triggered when a cluster of linked asperities isbroken, and this is possible only when a sufficientlarge stress-free surface develops around.
The continuous generation of stress-free cells,randomly over the active seismic area, leads aftera time interval to a percolation cluster of stress-free cells affecting the entire area. Starting fromthis moment, the major event can be triggeredsooner or later in the ongoing seismic cycle. Natu-rally, in this kind of simulation, the process evolu-tion is entirely controlled by the rate of generationand distribution in space of background activityand the geometry of the active zone. Typically, sim-ulation with percolation implies a deficit of events(as compared with a linear Gutenberg–Richterfrequency magnitude relationship) at intermedi-ate magnitudes (6 to 7), which is commonly ob-served in the case of Vrancea earthquakes (e.g.Trifu and Radulian 1991b).
At the beginning of a major cycle, the gridcontains only weak unruptured areas and asperitycells. To initiate the process, elementary earth-quakes are inserted randomly on the grid at a con-stant rate in time and in space patterns similar tothat observed in the real catalog. The continuousbackground seismicity progressively transfers thetectonic stress on the resistance nuclei (asperities).A resistance cell or cluster of cells fails when acritical area of weakness, linked to the resistancenucleus is developed around. The system evolvesinevitably to a critical state (percolation) whichallows the triggering of the major event that endsthe cycle. Once the major shock is produced, thesystem comes back to a new initial blocked stateand a new seismic cycle starts.
The system capability to initiate major shocks,the time interval length necessary to get readythe system, the magnitude of the future shock,etc., are crucially depending on the geometricalconfiguration of the seismic active area, on oneside, and on the mechanisms of strength failureand healing over the active area, on the other side.
The purpose of the present paper focuses onthe first aspect: the delimitation, as accuratelyas possible, of the geometry configuration of theseismic active system in the Vrancea subcrustalzone.
2 VRICAT catalogue
A new catalogue (Vrancea Intermediate-DepthCatalogue (VRICAT)) has been built up for thepresent analysis and for the simulation prog-ramme (Carbunar 1994; Carbunar et al. 2008). Thecatalogue contains only Vrancea intermediate-depth events (h ≥ 60 km) and is based essentiallyon revising the routine catalogue of the Na-tional Institute for Earth Physics of Bucharest(ROMPLUS catalogue, Oncescu et al. 1999, up-dated) and the catalogue version extended tosmaller events (MICAT catalogue, Trifu andRadulian 1991b, updated).
We considered the MICAT catalogue speciallydesigned to extend the data completeness tosmaller magnitudes for the Vrancea subcrustalearthquakes. The authors of this catalogue pro-posed a specific calibration method to include

J Seismol (2011) 15:579–598 583
events that can be detected as intermediate-depthevents in Vrancea, although they can not becompletely located by standard methods (becausethere are no minimum three stations with well-recorded seismograms or the configuration of theavailable stations is bad). The focal depth is al-ways constrained with acceptable accuracy (within10 km) using the proposed calibration.
The new version of the catalogue for Vranceasubcrustal earthquakes combines ROMPLUS andMICAT catalogues. First, we simply compared thetwo catalogues: the events which differ by lessthan 20 s in the occurrence time are consideredto be identical events. If the difference in focaldepth is greater than 10 km, that event is re-moved from the catalogue as improperly located.Certainly, these cases refer mostly to small earth-quakes. However, if they occur for larger events,we analyze all the other catalog data available todecide if the corresponding event is finally kept orremoved.
As it will be shown later, the distribution ofhypocenters in the Vrancea subcrustal domaincan be approximated by a plane. To improve thecatalogue quality, we introduced the hypothesis ofseismicity clustering around this plane and con-sidered the events located too far from this plane(specifically, at distance greater than 25 km) asquestionable.
To analyze the statistical significance of thishypothesis, we took into account the earthquakes(M > 1.5) that occurred in 1974–2009 time inter-val and located within 45–46.5◦ N latitude, 26–27◦E longitude and 60–170 km depth interval. Theevents situated at more than 25 km distance fromthe median plane are less than 1.3% of the totalevents and are exclusively of small magnitude.Therefore, we can assume that these events arepoorly located, and consequently, we decided toeliminate them.
The quality of data significantly increased after1980s, when a new seismic network was installed
Fig. 2 Comparison between routine locations (left) withhypo-DD locations (right). To facilitate the visual inspec-tion, we ascribed to each event the minimum sphere symbol(as if they have equally minimum magnitude). The origin ofaxes is 45◦ N latitude, 26◦ E longitude and zero depth. Thex-, y- and z-axis ranges automatically scale in correlation
with the extent of the real data to be plotted (in kilome-tres). The different colors mark evolution in time (follow-ing conventionally the white light spectral decomposition,so that red is for the most recent events, while violet is foroldest events)

584 J Seismol (2011) 15:579–598
around the Vrancea region. Digitally continuousrecordings are available after 1990s. The catalogueis continuously updated and corrected wheneverpossible by using double differences and wave-form cross correlations techniques (Carbunaret al. 2008).
The hypocenters of the earthquakes recordedbetween 1982 and 2008 located with HYPOPLUSlocation programme (Oncescu et al. 1996) arecompared with the corresponding HYPO-DD lo-cations (Fig. 2). Slightly more clustering is ob-tained when HYPO-DD location is applied.
In the final form, the catalogue selected forthis paper contains 7,237 events with magnitudesbetween 1.5 and 7.1 that occurred between Jan-
uary 1974 and July 2009. They are located usingthe routine HYPOPLUS location programme andDD location procedure. The location precision isbelow 10 km only for events that occurred after1995. The catalogue is permanently updated andimproved through periodical group relocations.
3 Graphical user interface
A graphical user interface (GUI) was designed incooperation with Matevz Tadel, utilizing ROOT(an object-oriented framework for large-scaleanalysis) elaborated at CERN-Geneva and Open
1986
1977
1990
Fig. 3 Example of GUI working window showing thesetting of the graphical representation parameters for 3-Ddistribution foci: the earthquakes of Vrancea that occurredbetween 3 March 1977 00:00 and 1 June 1990 00:00 (an in-terval of 13 years and 93 days) are selected. Depth interval60 to 169 km. Magnitude interval 3.0 to 7.7. The origin ofaxes is set to the selected reference point (45◦ lat., 26◦ lon.,0 km depth): x-axis (red) is oriented toward East, y-axis(green) is oriented toward North, z-axis (blue) is the depth.The axes scale automatically sticking to the observationpoints’ extension. In this particular case, the x-axis spans6–79 km interval, y-axis 23–111 km interval and z-axis −54
to −169 km interval. The size of the sphere is propor-tional to earthquake magnitude, while the colour marks thetime interval. Conventionally, we adopted the sequence ofcolours as in the white light spectral decomposition, so thatthe red is for the latest events and violet for the earliestevents. In our example, the largest spheres correspond tothe event of 1977 (M 7.4, depth 94 km)—violet sphere, theevent of 1990 (M 6.9, depth 90 km)—red sphere, and theevent of 1986 (M 7.1, depth 131 km)—green sphere (the lastone is covered to great extend by other overlappingevents). The lighting and point of view are set in anothermenu window. The figure can be rotated 3-D using mouse

J Seismol (2011) 15:579–598 585
GL to graphically investigate the seismic activezone.
The graphical interface is a powerful tool whichallows a 3-D representation of the hypocenters,with the possibility to select 3-D space and timewindows. The magnitude can be visualized by theradius of the sphere centered in hypocenter andthe phase in the time flow by different colors(following conventionally the white light spectraldecomposition, so that red is for the most recentevents, while violet is for oldest events). Trans-parency is introduced as well in order to avoid themasking (cover up) of the events, and it is possibleto modulate the color intensity and to mark andidentify events.
The plotting using this graphical interface au-tomatically scales the x-, y- and z-axis ranges incorrelation with the extent of the real data to beplotted. Everywhere in the paper we shall use,for 3-D representation, coordinates in kilometersrelative to the reference point of 45◦ N latitude,26◦ E longitude and zero depth. An example of aGUI working window is given in Fig. 3.
4 Analysis of the geometrical features
Since the geometrical constraint is essential fornumerical simulation algorithms, the main goal ofthe present paper is to refine potential geometri-cal configurations characteristic for the Vranceaearthquakes on the basis of a catalogue with in-creased location resolution (Carbunar et al. 2008).
The depth boundaries are set at 60 km depth inthe upper side, as a conventional level of transi-tion from crustal to subcrustal seismicities and at170 km at the bottom side, as suggested directly bythe observed seismicity pattern (Fig. 1). A relativediminution in seismicity in the transition zone tothe crust (40–60 km depth) is possibly, but notnecessarily, related to a decoupling process of thesubducting lithosphere from the overlying crust,as proposed initially by Fuchs et al. (1979) andlater by others (e.g. Martin et al. 2006; Mülleret al. 2010). Below 170 km depth, only a fewearthquakes are reported, with a single isolatedevent below 200 km depth that occurred in May16, 1982 (Mw = 4.1, h = 208 km). Therefore, in
all the graphical representations, we prefer to limitourselves to a lower boundary at 170 km depth.
The volume containing the hypocenters as lo-cated in the catalogue is developed on vertical;the projection on the horizontal plane is an ellipseelongated on a NE–SW direction (top of Fig. 1).The location errors are generally within 10 km,so that the spread of foci perpendicularly to theNE–SW direction, over a width of about 25 kmreflects a real 3-D effect. This can be explainedpartly by some lateral distortions suffered by thehigh-velocity lithospheric body as it penetrates inthe mantle (e.g. Martin et al. 2006). However,to a first approximation, it is preferable for nu-merical simulation purposes to perform 2-D com-putations. Certainly, a simpler geometry of theproblem makes easier the application of the simu-lation algorithm.
The simplest case is to consider an approxima-tion of the seismicity pattern by a single planealong the entire depth range of the slab. There-fore, we define a median plane, which minimizesthe hypocenter relative distance and contains thecentre of mass of the hypocenter distribution.Then, we project all the hypocenters on this planeand investigate their space–time distribution inthis 2-D configuration.
The median plane is defined as the one forwhich the sum of relative distances from thehypocenters is minimized. Since the solution isnot unique, we developed an original algorithm inorder to optimize the search of several minima.
The median plane is obtained by an inversionprocedure which minimizes the sum of distancesof foci positions relative to the plane. The threecoefficients defining the plane in an orthogonalsystem of axes,
ax + b y + cz + 1 = 0 (1)
are successively adjusted to minimize the distance.By circular permutation, each parameter is con-sidered, in an iterative procedure, to reach a min-imum distance. Thus, we start for example withcoefficient a and an increment δ. Keeping fixedthe other coefficients, the a value is continuouslymodified so that the distances’ sum monotoni-cally decreases until a minimum is reached. Then,we proceed in the same way with coefficient b ,

586 J Seismol (2011) 15:579–598
keeping fixed the other coefficients. At the endof this step, the sum value reported to a is notmore at minimum. After the first evaluation of theentire set of coefficients (first step), the procedureis repeated iteratively using a circular permuta-tion, until the minimum is obtained concomitantfor an entire iteration (concurrent for all threecoefficients). Then, the process is repeated halvingthe increment (δ/2) until the desired accuracy isreached. The result depends on the position of thestarting plane, the starting coefficient, the direc-tion of the (sequence of coefficients) permutation,and the value of the first increment.
To define the starting plane, we selected the co-ordinates of three well-located events, sufficientlyspaced out one from the other, selected with theGUI graphics mentioned above, thus determin-ing a well-defined median plane. By applying thealgorithm for searching the minimum distance,
Fig. 4 Distribution of hypocenters for the events thatoccurred between 1985 and 2009. View along the medianplane. The dotted line at surface mimics the part of theCarpathians Arc (the bend of the arc in the Vrancea region,see Fig. 1) and is plotted as reference. The hypocenterssituated below 0.75 km distance to the median plane arehighlighted to outline the approximating plane. The axesorientation and scaling and color convention are describedin Fig. 2 caption
the average distance to the plane obtained frominversion is considerably smaller than that to thestarting plane. The centre of mass of the hypocen-ters is always located in the median plane.
If we consider a single plane characteristic forthe entire depth interval, for the 2,692 earth-quakes with magnitude greater than 2.8 and gen-erated between 45◦ and 46◦ N latitude and 26◦and 27◦E longitude (Fig. 4), the parameters of themedian plane are as follows:
0.4193x − 0.3321y + 0.0507z + 1.00 = 0 (2)
where x is the Cartesian coordinate for longitude,y for latitude and z for depth. The average distanceof hypocenters to the median plane is, in this case,daverage = 5.0 km.
However, a more careful investigation suggestsa possible change of the foci distribution around100 km depth (Fig. 5). This particular depth oftransition around 100 km is suggested also bythe relative decay in seismicity, change in focal
Fig. 5 The same distribution as in Fig. 4, but with two me-dian planes along two separate depth domains, one above100 km depth, other below 100 km depth. The medianplane direction is marked by larger spheres, representingthe hypocenters situated at less than 1 km from the plane

J Seismol (2011) 15:579–598 587
mechanism (Oncescu and Trifu 1987), tomogra-phy inversion (Koulakov et al. 2010) as well asby seismotectonics considerations (Trifu andRadulian 1991a; Radulian et al. 2007). To test ifthis geometrical change is statistically significant,we investigate in detail the seismicity clusteringon depth. First, we considered depth intervals ofincreasing length both from the upper edge (h =60 km) and the bottom edge (h = 170 km) of theactive area and determine the best-fitting planesin each case. These planes show a discontinuity inthe depth interval from 85 to 120 km.
To identify the depth where the upward anddownward alignments are perturbed, a trial-and-error procedure is applied, for different depthintervals within 85–120 km interval. The minimumaverage distance to the upper and lower best-fitting planes is obtained for the location of thediscontinuity zone at 100 km depth. At the sametime, for the same depth, the separation betweenthe upper and lower planes is the largest.
As a consequence of our refined analysis,we conclude that a significant variation in thehypocenter distribution is detectable. Thus, if weconsider two separate depth domains, one in theupper lithosphere (60–100 km), the other in thelower lithosphere (100–170 km) and approximatethe seismicity pattern by two separate medianplanes instead of a single one, the average distance
from foci to these planes decreases significantly ascompared with the distance to the single plane.
Thus, the approximation with a single medianplane (Fig. 4) leads to an average distance to theplane of 5.06 km. If we consider two groups ofhypocenters in the upper and lower lithosphere,separated at 100 km depth, the approximationby two separate median planes (Fig. 5) leads toaverage distances to the two median planes byalmost 0.5 km lower than for the global medianplane, namely 4.55 km in the upper zone and4.59 km in the lower zone, respectively (Table 1).The events situated at more than 20 km distancefrom the median plane are less than 2% of thetotal events, and are exclusively of small mag-nitude (we summarize in Table 1 the results ofthe statistical analysis). However, if we eliminatethem, a significant decrease in the average dis-tance is obtained (more than 500 m). Thus, morethan 90% of the hypocenters (90.3% = 100–9.7%)are located within 10 km distance from the bestfitting planes, and we conclude that in the limitof standard location errors, a 2-D simulation isjustified.
Note that the two median planes are roughlyparallel, at a distance of ∼9 km one from theother, with a plunge of about 75◦. For the regionbetween them, there is no well-defined configu-ration of the hypocenters.
Table 1 Statistical analysis of the clustering degree of Vrancea earthquakes around two approximating planes in the upperzone (UZ), and lower zone (LZ), respectively
Zone d (km) < D> (km) N Nout < δD>
% Weighted average (%) % Weighted average (km)
UZ Large 4.547 459 0 0 0 0LZ 4.587 2233 0 0
UZ 10 3.286 405 11.98 9.7 27.73 1.316LZ 3.260 2026 9.27 28.93
UZ 15 3.994 446 2.83 4.01 12.16 0.803LZ 3.732 2138 4.25 18.64
UZ 20 4.253 455 0.87 1.93 6.47 0.523LZ 4.017 2185 2.15 12.43
UZ 25 4.253 455 0.87 1.26 6.47 0.388LZ 4.171 2203 9.27 9.07
d test distance, <D> average distance of the hypocenters to the approximating plane, N number of events located at distancebelow d, Nout number of events located at distance greater than d (in percentage and weighted value), < δD> reduction inaverage distance (in percentage and weighted value)

588 J Seismol (2011) 15:579–598
Fig. 6 Definition of thegeometry of segmentationon depth of the Vranceaseismogenic volume. Twomedian planes areconsidered for 60–95 and105–170 km depthintervals, for theearthquakes thatoccurred in the time1985–2009. To have abetter 3-D visualization,six different views areplotted: a, bback-face/along themedian plane; c, d fromabove, along A directionas indicated in the left-topslide; e, f from SE to NW,along B direction asindicated in the left-topslide. In (b, d, f) diagrams,the events withmagnitude greater than 5are represented by largerspheres. Again, the arcplotted as pointed line atsurface schematicallystands for the CarpathianArc position. Thehyperbolic line a–a′ inslide (e) is approximatingthe distribution at thebottom side of the activezone. The rotations fromposition (a) to (c) andfrom position (b) to (d)are visualized athttp://proiecte.nipne.ro/pn2/acsics/index_en.php
(a) (b)
(c) (d)
(e) (f)

J Seismol (2011) 15:579–598 589
5 Slab segmentation
The investigation of the geometry of seismicitycarried out in the previous section suggested thepossibility to have a significant change in thestructure of the descending lithosphere beneathVrancea region around 100 km depth. This geom-etry is better constrained by two separate medianplanes.
The fragmentation of the seismically activebody beneath Vrancea was noticed in a few previ-ous studies as well. The segment situated around100 km depth was considered to act like a barrierfor the earthquake rupture, and two alternativehypotheses were put forward to explain its nature:(1) the barrier consists of a weaker material un-able to generate significant ruptures (Trifu andRadulian 1991a) or (2) by contrary, it is more re-sistant than the rest of the downgoing lithosphere(Oncescu and Bonjer 1997), being thus able togenerate a devastating event. Certainly, the em-bracing of one or the other of hypotheses is crucialfor the seismic hazard evaluation since the depthlocation and magnitude of the next major eventdiffer significantly from one case to the other.
For the moment, we shall consider this zone as atransition zone between the two active segments,without worrying about its nature. The variationof the median plane azimuth on depth showsan inflection from the upper plane to the lowerplane. To better exemplify the configuration ofthe segments, we plot in Fig. 6 the geometry ofsegmentation using three points of view.
The distribution of seismicity in a plane isstrongly perturbed in the transition zone (around100 km depth) between the upper and lowersegment. Well-constrained planes can be definedin the upper part of the slab (60–95 km) andthe lower part of the slab (105–170 km), whilethe hypocenter distribution is completely changedaround 100 km depth. The dispersion of the focidistribution is significantly larger here, with aslight tendency to align along the direction of theshift between the upper and lower planes.
The earthquakes at the upper limit of the lowersegment tend to be generated along a hyper-bolic parabola (see Fig. 6e, f). This form suggeststhat a strong pulling down force is acting on thelower segment. The largest events seem to betriggered at the outer boundaries of the segments:
(a) (b) (c)
Fig. 7 Best fitting plane configurations for the time intervals 1974–1984 (a), 1985–1997 (b) and 1998–2009 (c). For thisrepresentation, we used data from the extended version of the catalogue

590 J Seismol (2011) 15:579–598
∼90 km depth in the upper segment (March 4,1977 and May 30, 1990); ∼130 km depth on theNW face (August 30, 1986) and 150 km depth onthe NE edge (November 10, 1940) in the lowersegment.
It is also worth to mention the tendency ofthe earthquakes of moderate and large magnitude(M > 5) to be located on the northwestern sideof the slab (towards Transylvanian Basin), fromwhere the active force is pushing, more evidentlyin the lower segment (see Fig. 6b and d).
We tested the stability of the three medianplanes configuration for different time and depthintervals. An example is given in Fig. 7 for threecompletely independent time intervals, 1974–1984(a), 1985–1997 (b) and 1998–2009 (c). Apart from
the catalogue data adopted for the present study(1985–2010), we added 1974–1984 interval, al-though the location accuracy in this case is sig-nificantly lower. The median plane characterizingthe seismicity distribution in the lower segmentis remarkably stable. The seismicity distributionin the transition zone is less stable, as expected.Even though, the seismicity in the transition zonehas a tendency to rotate on a perpendicular di-rection relative the other two fitting planes in theupper and lower segments. The variations fromone interval to the other are partly explained bydifferences in the location accuracy which hasbeen continuously improved in time.
The equations of the three best fitting planes inthe upper and lower segments and in the transition
Fig. 8 The hypocentersprojected on the wholeslab median plane,rotated with α = 67.5◦, tofit into a rectangle. xr adzr are the rotatedcoordinates on themedian plane

J Seismol (2011) 15:579–598 591
90 100 110 120 130 140 150 160Xr (km)
0
20
40
60
80
100
120
140
160
180
200
N
Fig. 9 The distribution of the earthquakes located in thedepth interval between the two red lines in Fig. 8 for movingwindows of 5 km along the xr axis (90 < xr < 160 km)
zone evaluated for the 1985–2009 time intervalare:
Upperzone (60 − 95km) :0.229671x − 0.19646y + 0.072626z + 1. = 0
Transition (95−105km) :0.00006543x+0.001323y + 0.01983z − 1. = 0
Lowerzone (105 − 170km) :0.06126x − 0.055y + 0.02459z − 1. = 0 (3)
According to the relations given in Appendix 2,the plunges for the best fitting planes in the up-per and lower segments are of 76.49◦ and 73.38◦,respectively. They are descending roughly paralleltoward NW (back-arc side of the Carpathians). Incase of a single plane approximating the entireseismogenic zone, the plunge is higher (84.58◦).The strikes of the planes (measured from North)are: 40.54◦ for the upper side, 41.92◦ for the lower
-80-70-60-50-40-30-20-10010203040
Zr (km)
0
50
100
150
200
250
300
N
Fig. 10 The distribution of earthquakes along the zr axis
side and 38.16◦ in case of a single plane for theentire zone.
6 Slab edge effects
An aspect evidenced by our refined seismicityinvestigation is the tendency of the foci to begenerated at the boundaries of the active body(both on lateral sides in plane and on bottomedges). This effect is better emphasized for thelarger earthquakes, which obviously are betterlocated.
To better visualize this effect, we plot in Fig. 8the distribution of hypocenters projected on themedian plane of the whole slab (that representedin Fig. 4), rotated with α = 67.5◦, to fit into arectangle. xr and zr are the rotated coordinates onthe median plane, with zr interval correspondingto the vertical depth z in the range 60–170 km.The definition of rotated axes is presented in
Table 2 The hypocenters distribution in the region limited by −45 km < zr < −20 km, counted for xr intervals of 5 km,beginning with xr = 90 km
xr(km) 90 95 100 105 110 115 120 125 130 135 140 145 150 155 160N 20 26 57 129 185 115 76 61 80 110 94 41 9 3 0

592 J Seismol (2011) 15:579–598
Table 3 The distribution of hypocenters along the depth interval for which Vrancea intermediate-depth earthquakes aregenerated
zr (km) −40 −35 −30 −25 −20 −15 −10 −5 0 5 10 15 20N 7 32 55 87 138 178 290 132 110 124 105 128 182
zr(km) 25 30 35 40 45 50 55 60 65 70 75 80N 221 264 264 289 262 291 259 139 70 29 5 0
zr axis limits in Fig. 8. Depth step is of 5 km
Appendix 1 (the origin at the intersection of me-dian plane with y-axis in 3-D representation).Note first the enhancement of the foci densityat the upper and lower edges of the active fault.There is also a tendency of foci polarization lat-erally, especially in the lower segment. The rec-tangle in Fig. 8 (between red lines) was selectedas test area, where the lateral inhomogeneousstructure of seismicity is highlighted.
The lateral distribution of the foci numberin the selected depth interval is represented inFig. 9 (the corresponding values are given inTable 2). The earthquakes are counted for lateralxr slices of 5 km width. Two maxima are locatedat a distance of ∼25 km along xr axis. Increasinglocation accuracy would presumably will makethe observed maxima sharper and the dispersionlower.
As can be noticed from the Fig. 9, the foci den-sity decreases rapidly (by a factor of about 2 overa lateral distance of 5 km) when going outwardthe seismic active body. The minimum densityinside the body (decrease roughly by a factor of3) proves the preference of the earthquakes to betriggered on the lateral sides of the slab (evidently,for a uniform distribution of foci density insidethe seismic active body, the maximum would havebeen recorded in the middle part).
The distribution on depth of the number ofevents is represented in Fig. 10 (the correspondingvalues are given in Table 3). The hypocenters areprojected on the single median plane along theentire depth domain, defined by (1).
It is interesting to note that in this repre-sentation of the seismicity in the seismic activelithospheric body descending beneath the South-Eastern Carpathians arc bend (Vrancea), we canseparate two different regimes, relatively welldefined: high level of activities in the upper partand lower part of the body, separated by a regionof lower activity (around 100 km depth). The
maximum rate of seismicity per depth interval inthe two active segments is practically the same(∼290 events/5 km). The seismicity level is closeto three times lower in the segment between (105events/5 km).
The highest density of foci at the bottom partof the slab (lower value of zr in Fig. 10) reflectsthe highest stresses acting here due to the gravita-tional sliding process.
7 Conclusions
The main goal of this paper is to define thepeculiarities of the geometrical configuration ofseismicity based on a refined and updated catalogof Vrancea intermediate-depth earthquakes thatoccurred between 1985 and 2009. We focused ourattention on more recent data obtained from sig-nificantly improved seismic networks. Our testsshow that the main features obtained for this timeinterval are reproduced as well for earlier data(Fig. 7).
First, we approximate the 3-D distribution ofseismicity by a 2-D one over the entire seismo-genic zone. This approximation is justified by thefact that the seismicity pattern in the descend-ing high-velocity lithospheric body is narrow in adirection perpendicular to the Carpathians Arc.The extension of hypocenters in this direction(∼20 km) is two to three times the value of lo-cating precision. Therefore, we define a fittingplane which minimizes the distance to hypocen-ters. The average distance of the hypocenters tothe median plane is 5.0 km. However, a morethorough investigation of the seismicity patternsshows a significant change in the hypocenter dis-tribution at about 100 km depth that makes usto introduce two separate fitting planes. The ap-proximation which minimizes the distance to theplanes is obtained for two roughly parallel median

J Seismol (2011) 15:579–598 593
planes, one characterizing the upper segment (60to 100 km depth), the other the lower segment(100 to 170 km), as shown in the Fig. 7. Theaverage distance of the hypocenters to the twofitting planes is decreased this way to 4.58 km.
The azimuth (41◦ and 42◦, respectively) andplunge angles (76◦ and 74◦, respectively) for theupper and lower best fitting planes, as obtainedby our geometrical investigation, are close to theparameters of the rupture plane, as obtained fromthe fault plane solutions for the Vrancea majorevents (azimuth in the interval 40–55◦ and plungein the interval 63–70◦, see for example Radulianet al. 2002).
The two fitting planes are shifted horizontallyby about 9 km on a NW–SE direction one fromthe other. The zone of transition between the twoactive segments is very narrow (less than 20 kmon depth) and apparently cannot generate largeevents. Possibly, it is related to the place where thedehydration reaction is triggered (Dobson et al.2002), explaining this way the increase of the duc-tile behavior here. On the other hand, the upriseof asthenosphere in the back-arc region (locatedtoward NW, in the Transylvanian Basin), gener-ating the volcanic activity and leading to a sharpincrease of the seismic wave attenuation (Popaet al. 2005; Russo et al. 2005; Ivan 2007; Russo andMocanu 2009) can create an overpressure on thelower segment pushing it toward SE.
The presumable presence of fluids in the tran-sition zone, due either to dehydration reactionsor to an infiltration of hot asthenospheric mate-rial from the back-arc side, would facilitate largeamount of aseismic slip of the lower segment rel-ative to the upper segment. The relative displace-ment (∼9 km) follows the alignment specifiedby the best fitting plane computed for the tran-sition zone (Fig. 6) which is almost perpendic-ular to the alignments characterizing the upperand lower segments. Certainly, until a systematicmodeling will be ready, such assertions are mostlyspeculative.
Our results suppose significant break-off anddelamination processes in the Vrancea seismo-genic zone, in agreement with many previ-ous investigations of this area. Such processesshould explain the segmentation of the descendinglithosphere and the differences in the seismicity
regime. In our opinion, the forces that resultedfrom the particular flows of asthenospheric ma-terial developed around the sinking high-velocitybody should play an important role in configuringthe seismicity patterns. Thus, the rise of as-thenosphere in the back-arc region that gener-ates volcanism in the South Harghita Mountainsand Persani Mountains (e.g. Seghedi et al. 2010)and explains the high attenuation of the wavespropagating toward Transylvanian Basin can actas an extra lateral pushing force upon the Vrancealower segment (below 100 km depth). Also, it cancontribute to a significant infiltration of fluids inthe transition zone (around 100 km depth).
The model proposed by Tondi et al. (2009),based on tomography inversion of travel timesand gravity data, suggests a possible transitionfrom a continental structure to an oceanic struc-ture inside the downgoing slab in Vrancea. Thedistribution of VP/VS ratio, showing a change fromVP/VS > 1.65 (typical for continental lithosphere)to VP/VS < 1.65 (typical for oceanic lithosphere),is in favor of this modeling. The change is locatedroughly in the same place as in our case (seeFigure 14 of the Tondi et al. paper). Lower VP/VS
values indicate colder and denser material whichmay be attributed to the oceanic nature of thelower segment. A similar distribution is empha-sized by seismic tomography using local earth-quake data (Koulakov et al. 2010).
The segmentation revealed by our analysisagrees well with the segmentation proposed formodeling the evolution of the Vrancea seismiccycles (e.g. Trifu and Radulian 1991a; Radulianet al. 2008) or for application of the numericalsimulation techniques (Radulian et al. 1991, 2008;Carbunar 1994). This configuration assumes a bi-modal generation of the major shocks (Mw > 7) intwo segments, separated by a weaker zone whereno large events were reported since we have avail-able instrumental data.
Combining all these results in order to ex-plain the particular geometrical configurationemphasized in the present study, we summarizea few hypothetic elements that can be taken intoaccount in a delamination scenario:
– A change in the structure of the downgoinglithospheric body at about 100 km depth that
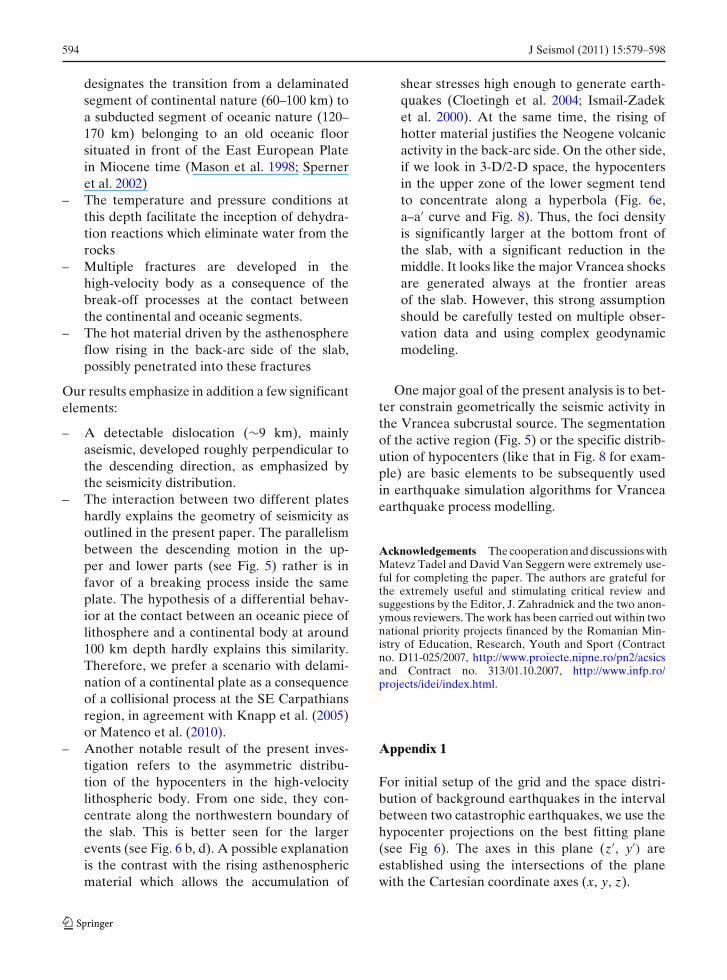
594 J Seismol (2011) 15:579–598
designates the transition from a delaminatedsegment of continental nature (60–100 km) toa subducted segment of oceanic nature (120–170 km) belonging to an old oceanic floorsituated in front of the East European Platein Miocene time (Mason et al. 1998; Sperneret al. 2002)
– The temperature and pressure conditions atthis depth facilitate the inception of dehydra-tion reactions which eliminate water from therocks
– Multiple fractures are developed in thehigh-velocity body as a consequence of thebreak-off processes at the contact betweenthe continental and oceanic segments.
– The hot material driven by the asthenosphereflow rising in the back-arc side of the slab,possibly penetrated into these fractures
Our results emphasize in addition a few significantelements:
– A detectable dislocation (∼9 km), mainlyaseismic, developed roughly perpendicular tothe descending direction, as emphasized bythe seismicity distribution.
– The interaction between two different plateshardly explains the geometry of seismicity asoutlined in the present paper. The parallelismbetween the descending motion in the up-per and lower parts (see Fig. 5) rather is infavor of a breaking process inside the sameplate. The hypothesis of a differential behav-ior at the contact between an oceanic piece oflithosphere and a continental body at around100 km depth hardly explains this similarity.Therefore, we prefer a scenario with delami-nation of a continental plate as a consequenceof a collisional process at the SE Carpathiansregion, in agreement with Knapp et al. (2005)or Matenco et al. (2010).
– Another notable result of the present inves-tigation refers to the asymmetric distribu-tion of the hypocenters in the high-velocitylithospheric body. From one side, they con-centrate along the northwestern boundary ofthe slab. This is better seen for the largerevents (see Fig. 6 b, d). A possible explanationis the contrast with the rising asthenosphericmaterial which allows the accumulation of
shear stresses high enough to generate earth-quakes (Cloetingh et al. 2004; Ismail-Zadeket al. 2000). At the same time, the rising ofhotter material justifies the Neogene volcanicactivity in the back-arc side. On the other side,if we look in 3-D/2-D space, the hypocentersin the upper zone of the lower segment tendto concentrate along a hyperbola (Fig. 6e,a–a′ curve and Fig. 8). Thus, the foci densityis significantly larger at the bottom front ofthe slab, with a significant reduction in themiddle. It looks like the major Vrancea shocksare generated always at the frontier areasof the slab. However, this strong assumptionshould be carefully tested on multiple obser-vation data and using complex geodynamicmodeling.
One major goal of the present analysis is to bet-ter constrain geometrically the seismic activity inthe Vrancea subcrustal source. The segmentationof the active region (Fig. 5) or the specific distrib-ution of hypocenters (like that in Fig. 8 for exam-ple) are basic elements to be subsequently usedin earthquake simulation algorithms for Vranceaearthquake process modelling.
Acknowledgements The cooperation and discussions withMatevz Tadel and David Van Seggern were extremely use-ful for completing the paper. The authors are grateful forthe extremely useful and stimulating critical review andsuggestions by the Editor, J. Zahradnick and the two anon-ymous reviewers. The work has been carried out within twonational priority projects financed by the Romanian Min-istry of Education, Research, Youth and Sport (Contractno. D11-025/2007, http://www.proiecte.nipne.ro/pn2/acsicsand Contract no. 313/01.10.2007, http://www.infp.ro/projects/idei/index.html.
Appendix 1
For initial setup of the grid and the space distri-bution of background earthquakes in the intervalbetween two catastrophic earthquakes, we use thehypocenter projections on the best fitting plane(see Fig 6). The axes in this plane (z′, y′) areestablished using the intersections of the planewith the Cartesian coordinate axes (x, y, z).

J Seismol (2011) 15:579–598 595
Computation of point Ms (xs, ys, zs) projectionson the best f itting plane (�), using the notations inFig. 11:
The plane equation in 3-D space (�):
ax + b y + cz + d = 0 (4)
The equation of the perpendicular from Ms (xs, ys,zs) to plane is:
x − xs
a= y − ys
b= z − zs
c= t (5)
So
x = xs + at
y = ys + bt
z = zs + ct (6)
From (4) and (6): the value of t that makes Mp tobe in (�)
a(xs + at) + b(ys + bt) + c(zs + ct) + d = 0 (7)
The projections of Ms on the plane (�), using (6)and (7):
xp = xs − aaxs + b ys + czs + d
a2 + b 2 + c2= xs − aC
yp = ys − baxs + b ys + czs + d
a2 + b 2 + c2= ys − bC
zp = zs − caxs + b ys + czs + d
a2 + b 2 + c2= zs − cC (8)
where we noted
C = axs + b ys + czs + da2 + b 2 + c2
(9)
The distance from Ms to the plane (�):
D =√
(xp − xs)2 + (yp − ys)2 + (zp − zs)2
= C√
a2 + b 2 + c2 = C√
P (10)
where
P = a2 + b 2 + c2
The hypocenter projections expressed in 2-D me-dian plane coordinates (xn, zn); the origin is theintersection of median plane with y-axis (y0).
From (4):
x0 = −da
y0 = − db
z0 = −dc
(11)
From Figs. 11 and 12:
NMp2 = x2p + z2
p + (y0 − yp)2 = p2 (12)
MpP2 = y2p + z2
p + (x0 − xp)2 = n2 (13)
Fig. 11 The hypocenterprojections on the bestfitting plane
N
Ms(xs,ys,zs)
My
xn
Mp(xp,yp,zp)
x
x’
z0
z’
y
Mxy
y0
x0
N
P
Mx0y0
zn

596 J Seismol (2011) 15:579–598
Fig. 12 Computinghypocenter projections in2-D coordinates of bestfitting plane (xn, zn)
n
x’
x’
p
Mx0y0
xn xn
zn zn
mm
p
(y0)N Mx0y0 (x0) P (x0)P (y0)N
Mp Mp
z’z’
n
N P2 = x20 + y2
0 = m2 (14)
If we note
angle N =< MpN P (15)
From Fig. 12
NMp2 = p2 = (p. cos N)2 + z2n (16)
MpP2 = n2 = z2n + (m − p. cos N)2 (17)
By substracting (16) from (17)
n2 − p2 = m2 − 2.m.p. cos N (18)
From where
cos N = n2 − p2 − m2
2.m.p(19)
zr
xnz
xnx
α
xr
znr
xnr
x’
z’
M
xn
n
α
Fig. 13 The rotation with α in the best fitting plane
and
xn = p. cos N = n2 − p2 − m2
2.m(20)
zn =√
p2 − x2n (21)
If
(zn < 0) zn = −zn (22)
Rotation with α in the best f itting plane (x′, z′)(Fig. 13)
xnr = (xnr − xnx) + xnx = zn. sin α + xn. cos α
znr = −xnz + (xnz − znr) = zn cos α − xn sin α
(23)
Appendix 2
Azimuth and plunge of the best f itting plane
The azimuth is given by tg(α) = x00/y00 (Fig. 14)
Fig. 14 Computation of azimuth and plunge angles

J Seismol (2011) 15:579–598 597
The projection of the axis origin (O) on the bestfitting plane (M) has the coordinates:
xM = xO − a × (ax0 + b y0 + cz0 + d) /delta
yM = yO − b × (ax0 + b y0 + cz0 + d)/delta
zM = zO − c × (ax0 + b y0 + cz0 + d)/delta (24)
where
delta = a2 + b 2 + c2,
and a, b , c are the coefficients of the best fittingplane (Eq. 4).
The distance from origin O(0,0,0) to theplane is:
OM =√
x2M + y2
M + z2M (25)
From Fig. 14:
xM = a × d/delta,
yM = b × d/delta,
zM = c × d/delta (26)
The angle made by plane with the vertical axisis given by
sin (γ ) = OM/AO = OM/z00, (27)
where
z00 = −d/c
and plunge = 90◦− γ
References
Bocin A, Stephenson R, Mocanu V, Matenco L (2009)Architecture of the south-eastern Carpathians nappesand Focsani Basin (Romania) from 2-D ray trac-ing of densely-spaced refraction data. Tectonophysics476:512–527
Carbunar FO (1994) An algorithm for percolation processwith constraints. Rom J Phys 39(3–4):319–342
Carbunar FO, Radulian M (2007) Numerical simulationmethod applied for Vrancea (Romania) intermediate-depth earthquakes. EGU General Assembly, Vienna15–20 April 2007, Abstracts, EGU2007-A-05522
Carbunar FO, Radulian M, Van Seggern D, Ivan M(2008) Space-time seismicity patterns identificationin Vrancea (Romania) seismic region using high-
resolution revised catalog data, AGU Fall Meeting,San Francisco. Abstracts
Cloetingh SAPL, Burov E, Matenco L, Toussaint G, BertottiG, Andriessen PAM (2004) Thermo-mechanicalcontrols on the mode of continental collision in theSE Carpathians (Romania). Earth Planet Sci Lett218:57–76
Dobson D, Meredith P, Boon S (2002) Simulation of sub-duction zone seismicity by dehydration of serpentine.Science 298:1407–1409
Fan G, Wallace TC, Dapeng Z (1998) Tomographic imag-ing of deep velocity structure beneath the East-ern and Southern Carpathians, Romania: implicationfor continental collision. J Geophys Res 103:2705–2724
Fuchs K, Bonjer KP, Bock G, Fucks K, Cornea I, RaduC (1979) The Romanian earthquake of March 4,1977. II. Aftershocks and migration of seismic activity.Tectonophysics 53:225–247
Ismail-Zadek A, Panza GF, Naimark BM (2000) Stress inthe descending relic slab beneath the Vrancea region,Romania. Pure Appl Geophys 157:111–130
Ivan M (2007) Attenuation of P and pP waves in Vranceaarea – Romania. J Seismol 11:73–85
Knapp JH, Knapp CC, Raileanu V, Matenco L, MocanuV, Dinu C (2005) Crustal constraints on the origin ofmantle seismicity in the Vrancea Zone, Romania: thecase for active continental lithospheric delamination.Tectonophysics 410:311–323
Koulakov I, Zaharia B, Enescu B, Radulian M, PopaM, Parolai S (2010) Delamination or slab detach-ment beneath Vrancea? New arguments from localearthquake tomography. Geochem Geophys Geosyst11(3):Q03002. doi:10.1029/2009GC002811
Martin M, Wenzel F, the CALIXTO working group (2006)High-resolution teleseismic body wave tomographybeneath SE-Romania – II. Imaging of a slab detach-ment scenario. Geophys J Int 164:579–595
Mason PRD, Seghedi I, Szakacs A, Downes H (1998)Magmatic constraints on geodynamic models of sub-duction in the East Carpathians, Romania. Tectono-physics 297:157–176
Matenco L, Krezsek C, Merten S, Schmid S, Cloetingh S,Andriessen PAM (2010) Characteristics of collisionalorogens with low topographic build-up: an examplefrom the Carpathians. Terra Nova 22:155–165
Müller B, Heidbach O, Negut M, Sperner B, BuchmannT (2010) Attached or not attached—evidence fromcrustal stress observations for a weak coupling of theVrancea slab in Romania. Tectonophysics 482:139–149
Oncescu MC, Bonjer KP (1997) A note on the depth recur-rence and strain release of large intermediate Vranceaearthquakes. Tectonophysics 272:291–302
Oncescu MC, Rizescu M, Bonjer KP (1996) SAPS—a com-pletely automated and networked seismological ac-quisition and processing system. Comput Geosci 22:89–97
Oncescu MC, Trifu C-I (1987) Depth variation of the mo-ment tensor principal axes in Vrancea (Romania) Seis-mic Region. Ann Geophys 5B:149–154

598 J Seismol (2011) 15:579–598
Oncescu MC, Mârza VI, Rizescu M, Popa M (1999) TheRomanian earthquake catalogue between 984–1997.In: Wenzel F, Lungu D, Novak O (Eds) Vranceaearthquakes: tectonics, hazard and risk mitigation.Kluwer, Dordrecht, pp 43–47
Popa M, Radulian M, Grecu B, Popescu E, Placinta AO(2005) Attenuation in Southeastern Carpathians area:result of upper mantle inhomogeneity. Tectonophysics410:235–249
Radulian M, Trifu C-I, Carbunar FO (1991) Numericalsimulation of the earthquake generation process. PureAppl Geophys 136(4):449–514
Radulian M, Popescu E, Bala A, Utale A (2002) Catalog offault plane solutions for the earthquakes occurred onthe Romanian territory. Rom J Phys 47:663–685
Radulian M, Bonjer K-P, Popa M, Popescu E (2007)Seismicity patterns in SE Carpathians at crustal andsubcrustal domains: tectonic and geodynamic impli-cations. In: Proc. CRC-461 International Symposiumon Strong Vrancea Earthquakes and Risk Mitigation.MATRIX ROM, Bucharest, pp 93–102
Radulian M, Popa M, Carbunar FO, Rogozea M (2008)Seismicity patterns in Vrancea and predictive features.Acta Geod Geophys Hung 43(2–3):163–173
Russo RM, Mocanu VI (2009) Source-side shear wavesplitting and upper mantle flow in the RomanianCarpathians and surroundings. Earth Planet Sci Lett28:205–216. doi:10.1016/j.epsl.2009.08.028
Russo RM, Mocanu V, Radulian M, Popa M, Bonjer K-P (2005) Seismic attenuation in the Carpathian bend
zone and surroundings. Earth Planet Sci Lett 237:695–709
Seghedi I, Matenco L, Downes H, Mason P, RD, SzakacsA, Pecskay Z (2010) Tectonic significance of changesin postsubduction Pliocene-Quaternary magmatism inthe south east part of the Carpathian-Pannonian Re-gion. Tectonophysics. doi:10.1016/j.tecto.2009.12.003
Sperner B, Ratschbacher L, Nemcok M (2002) Inter-play between subduction retreat and lateral extrusion:tectonics of the Western Carpathians. Tectonics 21:11–15
Tondi R, Achauer U, Landes M, Daví R, Besutiu L (2009)Unveiling seismic and density structure beneath theVrancea seismogenic zone, Romania. J Geophys Res114(B11):B11307. doi:10.1029/2008JB005992
Trifu IC (1990) Detailed configuration of intermediateseismicity in Vrancea region. Rev Geof 46:33–40
Trifu CI, Radulian M (1989) Asperity distribution and per-colation as fundamentals of earthquake cycle. PhysEarth Planet Interior 58:277–288
Trifu CI, Radulian M (1991a) Frequency–magnitude dis-tribution of earthquakes in Vrancea: relevance for adiscrete model. J Geophys Res 96:4301–4311
Trifu CI, Radulian M (1991b) A depth-magnitude cata-logue of Vrancea intermediate depth microearth-quakes (1974–1991). Rev Roum Geol Geophys Geogr,Ser Geophys 35:31–45
Wortel MJR, Spakman W (2000) Subduction and slabdetachment in the Mediterranean-Carpathian region.Science 290:1910–1917