Study on Corrective Abrasive Finishing for Workpiece Surface ...
Upload
khangminh22Category
view
0download
0
JOURNAL OF MECHANICAL ENGINEERING AND SCIENCES (JMES) ISSN: 2289-4659 e-ISSN: 2231-8380 VOL. 15, ISSUE 4, 8529 – 8539 DOI: https://doi.org/10.15282/jmes.15.4.2021.06.0672
*CORRESPONDING AUTHOR | Nur Farah Bazilah Wakhi Anuar | [email protected] 8529 © The Authors 2021. Published by Penerbit UMP. This is an open access article under the CC BY license.
ORIGINAL ARTICLE
Green strength properties of waterjet abrasive waste as potential composition in green mould by Taguchi and ANOVA approach
N.F.B.W. Anuar1, M.L. Mohd Khusairi1 , R.M. Saad2, S.A. Hassan1, Z. Marjom1, and A.H. Abdul Rasib1
1 Fakulti Teknologi Kejuruteraan Mekanikal dan Pembuatan, Universiti Teknikal Malaysia Melaka, 76100 Durian Tunggal, Melaka, Malaysia Phone: +6062701000; Fax: +6062701022 2 Fakulti Teknologi Kejuruteraan Elektrik dan Elektronik, Universiti Teknikal Malaysia Melaka, 76100 Durian Tunggal, Melaka, Malaysia.
ARTICLE HISTORY Received: 21st Apr. 2020 Revised: 24th Mar 2021 Accepted: 16th June 2021
KEYWORDS Sand casting; waterjet abrasive waste; Taguchi method; green strength.
INTRODUCTION
Sand casting is versatile in the metal casting industry and is frequently used in manufacturing. The sand casting
process's essential composition is silica sand, coal dust, clay powder, while water plays an important role in reducing and
controlling casting defects [1]. The main advantage of sand use in manufacturing applications is that it is practical and
economical [2]. Silica sand, or also known as silica dioxide, is the most plentiful mineral on the Earth’s layer surface [3].
However, the practice of silica sand mining and the process of transporting silica sand to foundries leads to harming the
ecosystem, rendering this metal casting process ecologically unsustainable and having long-term negative environmental
implications [4]. As a consequence of this practice, the supply of silica sand is steadily diminishing due to the high
production rate of sand casting products leading to a rise in the cost of manufacturing sand casting products [5]. In this
regard, many researchers have to work to find new ways to reduce the environmental impact by recycling the silica sand
waste [2,6-9] . Since most work in literature is on the recycling of silica sand in concrete applications, there is a lack of
research on the use of abrasive recycling in green sand moulding to minimise the use of silica sand. For example,
Srinavasan et al. [4] proposed the used biomass ash to replace silica sand. Nevertheless, the results showed that the
increase in the proportion of biomass ash diminished the compactness of the mould sand and this destructive way did not
change the microstructure of the material. Consequently, silica sand is still required in the sand casting process for
moulding sand. Furthermore, a review from Bhardwaj and Kumar [10] stated that population growth and technology
upgrades have led to the increase in laboratories and production wastes. Rajan et al. [11] used a granite mixing powder
to optimise the properties of green mould sand using the Taguchi method, but the strength of mould decreases as the
quantity of the granite powder used increases. As a result, granite powder does not affect the silica sand moulding and is
less conducive to the production of quality casting.
Abrasive water jet machining, one of the arising technology, is experiencing growth, but abrasive waste disposal also
impacted nearly 75% of the total operating and performing costs, Therefore, recycling the abrasive waste is required to
make the process more cost-effective and environmentally beneficial [9]. Waterjet industries generate several million
tons of by-product worldwide, and the waterjet abrasive sand waste is the major by-product. A few studies have recently
been carried out on abrasive sand waste from waterjet cutting as an alternative to being used. According to the Federal
Classification Catalog of Waste 2017, abrasive waste from waterjet cutting of ferrous and non-ferrous metals is virtually
unhazardous [12]. The economic use of the waste is the most effective waste elimination method to minimize hazards
[12-14]. Thus, by adding abrasive waste from waterjet cutting into the sand casting composition, the expenditure on sand
casting raw material can be reduced which is economically and efficiently advantageous while still maintaining the casting
quality [15]. In addition, the use of wastewater jet abrasive in green sand with a promising quality is encouraged for long-
ABSTRACT – The sand casting process still continues today due to the cost-effectiveness of materials and processes. There is a wide variety of castings related to composition and size, but silica sand is widely available from coastal line mining and has a negative impact on the environment. Moreover, waste from waterjet cutting of non-ferrous and ferrous metals is practically unhazardous and may potentially be used in sand casting mould. The aim of this paper is to optimize the proportion of coal dust, water and bentonite added to the silica sand mixture and the waterjet cutting abrasive waste as a new way of handling waste with the potential to be used in sand casting manufacturing. The method used was L9 orthogonal array optimization and the composition was qualitatively measured using a green compression strength test and a green shear strength test. Factors were evaluated using the analysis of variance (ANOVA) to find the the critical factors while confirmation test was conducted for the optimal material proportion. The study concluded that the ideal ratio for silica sand mixture with waterjet abrasive waste is bentonite-12%, coal dust-5%, and water-7% for green compression strength while bentonite-12%, coal dust-6%, water-7% for green shear strength. With proper selection, the incorporation of waterjet abrasive waste into the green sand mixture is promising to potentially be used in green sand mould casting without undermine the quality of mould.

Nur Farah Bazilah Wakhi Anuar et al. │ Journal of Mechanical Engineering and Sciences │ Vol. 15, Issue 4 (2021)
8530 journal.ump.edu.my/jmes ◄
term cost savings. However, if the composition of the waterjet abrasive and sand waste with bentonite, coal dust, and
water is not appropriately managed, the results can lead to poor quality and defects. This is due to the waterjet abrasive’s
brittleness characteristics, which is a crucial factor influencing its cracking and failure behaviors [16]. Hence, in order to
resolve the issue of composition, optimization of the parameters should be carried out.
Studies have been carried out over several decades using the Taguchi method to assess the excellent factor or
parameter setting in the optimum proportion of sand casting materials [15]. The Taguchi method aims to create and build
specification settings that, in an inevitable external noise variations, contribute to robust product quality. [14,17-19] are
examples of studies that were carried out on numerous manufacturing processes using Taguchi statistical method. In
Taguchi, the Signal-to-noise (S/N) ratio is used to evaluate the effect of variations with a selection of quality
characteristics depending on the applicable circumstances such as “Lower is better”, “Nominal is the best” and “Larger
is better” to minimize the abnormality of quality characteristics due to unmanageable parameters [15]. In this study, the
composition of bentonite, coal dust and water was used to investigate the optimized parameter in silica sand and waterjet
abrasive waste as a potential usage in casting. The Taguchi L9 orthogonal array was used to get the optimum proportion
levels of bentonite, coal dust, and water and analysis of variance (ANOVA) was used to determine the significant
parameters. The following section describes the comprehensive methodology used for this study.
METHODS AND MATERIALS
Ishikawa diagram (cause and effect of sand moulding) shown in Figure 1 was used to classify the setting mechanism.
The levels and composition parameters with silica sand and waterjet abrasive cutting waste were decided based on the
available literature. It is tabulated as shown in Table 1 using Taguchi L9 orthogonal array. The “Larger is better”
characteristic was used for the green compression test (kN/m2) and the green shear strength (kN/m2), respectively.
Figure 1. Cause and effect diagram for the quality attribute of using waterjet abrasive waste in sand castings
Table 1. Composition parameter (factor) and levels.
Composition Parameter Level
1 2 3
A: Clay (Bentonite) 6% 9% 12%
B: Coal Dust 4% 5% 6%
C: Water 5% 6% 7%
The moulding composition comprised of silica sand and waterjet abrasive waste mixture consisted of three
components; bentonite (clay dust), coal dust and water. The waterjet abrasive waste was retrieved from the waterjet
laboratory, while silica sand with mesh 80, bentonite (clay dust), and coal dust was acquired from the university's foundry
laboratory. Proportional quantities for bentonite (clay dust), coal dust and water were mixed and poured into the silica
sand and waterjet sand waste in a muller at foundry laboratory corresponding to the L-9 orthogonal array. Each mixed
composition was fixed in the specimen tube after prearrangement with a weight range of approximately 145g to 170g.
The specimen must be rammed three times in order to obtain a specimen height 50mm ± 1mm and tested directly in a
universal test machine until the specimen break to prevent it from drying and causing a decrease in strength. Each factor
was evaluated with ANOVA to find the significant and critical factor while validating the experiment's optimal outcome
using the confirmation test. The six–steps used for planning and organizing the experiments are explained as follows:

Nur Farah Bazilah Wakhi Anuar et al. │ Journal of Mechanical Engineering and Sciences │ Vol. 15, Issue 4 (2021)
8531 journal.ump.edu.my/jmes ◄
Objective Setting
This study aims to find the optimum proportions of bentonite (clay dust), coal dust, and water in silica sand with
waterjet abrasive waste as a potential recycling waste in the green sand mould.
Evolve the Range Including the Upper and the Lower Limit of the Mixture
The proportion range for bentonite, coal dust and water was set at 6%-12%, 4%-6% and 5%-7%, respectively. The
parameters and their proportional ranges in Table 1 were selected from the foundry experience inputs and information
from the literature [19-22]. Clay binder is an added material that allows the sand moulding to be coherent and is used as
an essential aggregate of crystalline in flake-shaped form. Bentonite is a type of clay used as a binder or bonding agent
for the preparation of green sand moulding. Bentonite clay mineral, the most widely used in the industry is characterized
as montmorillonite (more than 85%) with two layers of silicone-oxygen tetrahedron structured in three sheets and one
central tetrahedral aluminum hydroxyl layer. Although other clays like kaolinite, fire clays, and illite clays are also
applicable to be used, they have a structure of two layers; an aluminum octahedral layer and a silica tetrahedral layer,
which are not suitable in the modern foundry process. Hence, bentonite is used as the main bonding agent in today's
current sand moulding process [21]. However, without water, the moulding's strength will not be achieved, as the mixture
sand and clay will become two separate dry materials. With adequate water content, water becomes a primary source of
strength and flexibility for the sand moulding. Furthermore, water is the only material that can be reasonably held by clay
and is effective in forming strength. Coal dust is also one of the composition elements in sand moulding and is a key
element in improving the casting surface finish and reducing the occurrence of scab defects [1]. Coal dust is commonly
available in a powder form to acquire a volume of combustibles for sand expansion defects compared to liquid coal. On
the contrary, petroleum carbonaceous substitute-liquid form based product that reduces bentonite swelling characteristics,
and this minor variation in diffusion causes major fluctuations in casting quality.
Developing the Matrix Design Experiments Based on Orthogonal Array of Taguchi
Similarly, Taguchi method is used to efficiently identify each element's contribution and factor to the target purpose,
especially in engineering applications [23]. In this study, the experimental design was accomplished using an orthogonal
array with Taguchi method. The combination of a level framework and an equal number of times was inclusive in an
independent variable and supported all the full information of the factors' quality characteristic. For factors and levels;
Bentonite clay (3 levels; 6%, 9%, and 12%), coal dust (3 levels; 4%, 5%, and 6%) and water (3 levels; 5%, 6% and 7%)
were selected. Time and cost are two important aspects to consider if the full factorial experimental plan is embedded in
the experiment design, where it can be attributed to negative consequences. As a result, the diff[26erent factors and factor
levels of the orthogonal experiment strategy of the Taguchi method are implemented with fewer experiments [24,25]. In
this study, 3 factors by 3 levels were selected and used as an input to Minitab software and corresponding to these factors
and levels numbers. L9 (3^3) orthogonal array was developed as shown in Table 2, and referring to this table, 9
experiments were performed with 3 repetitions with a random order.
Table 2. Experimental L9 orthogonal array data
Experiment Bentonite (clay dust) Coal dust Water
Level Wt. % Level Wt. % Level Wt. %
1 1 6 1 4 1 5
2 1 6 2 5 2 6
3 1 6 3 6 3 7
4 2 9 1 4 2 6
5 2 9 2 5 3 7
6 2 9 3 6 1 5
7 3 12 1 4 3 7
8 3 12 2 5 1 5
9 3 12 3 6 2 6
Collecting Experiment Data from Conducting Design Experiment as Per Matrix Design
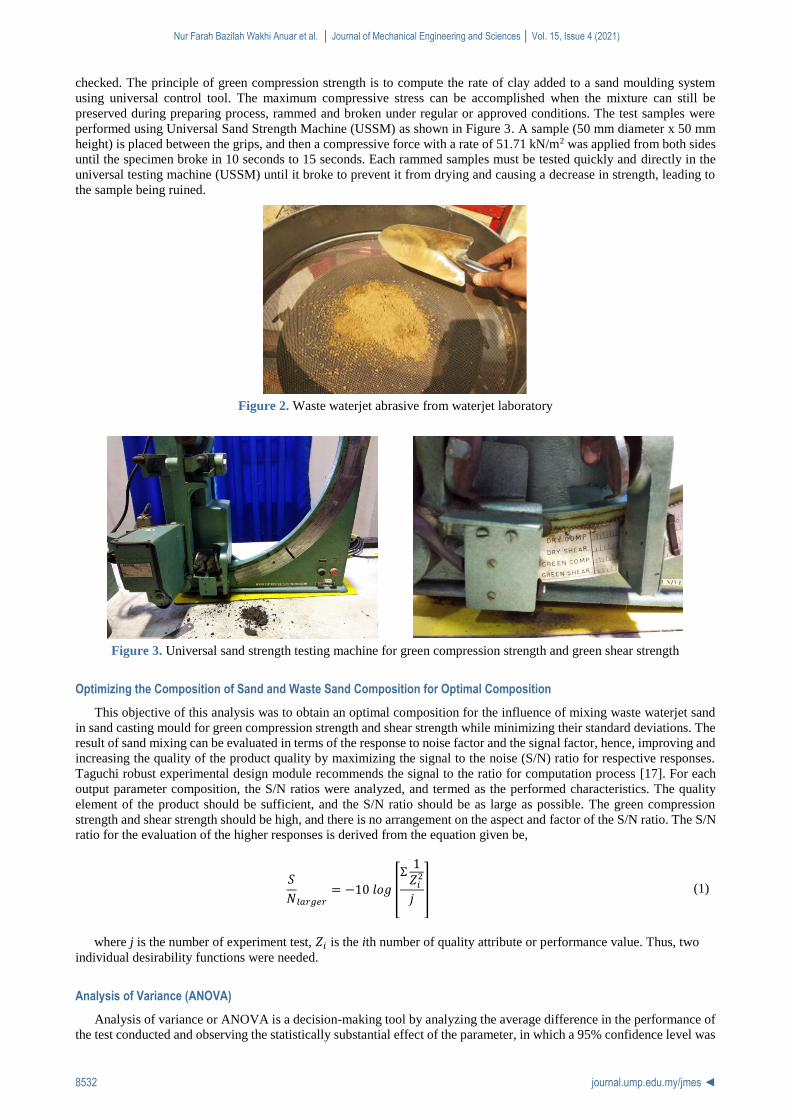
Waste waterjet abrasive was collected from university waterjet laboratory using a container for drying and sieving
process to remove debris from abrasives waste so it can be reused as shown in Figure 2. Moulding sand was prepared in
a muller in which the mixing wheel for silica sand, waste abrasive waterjet, clay (bentonite), coal dust and water were
thoroughly mixed. After the mixing process was completed, the blended sand was removed through a cylindrical vessel
discharge opening. Further, a standard sand test weighed from 145g to 170g and was prepared in a hollow specimen
cylindrical tube with an inner diameter of 50mm. In order to achieve a height of 50mm ± 1mm, each 9 running sample
experiments must be rammed three times by impact attached to the rammer 62.3 N force with their compression strength
Nur Farah Bazilah Wakhi Anuar et al. │ Journal of Mechanical Engineering and Sciences │ Vol. 15, Issue 4 (2021)
8532 journal.ump.edu.my/jmes ◄
checked. The principle of green compression strength is to compute the rate of clay added to a sand moulding system
using universal control tool. The maximum compressive stress can be accomplished when the mixture can still be
preserved during preparing process, rammed and broken under regular or approved conditions. The test samples were
performed using Universal Sand Strength Machine (USSM) as shown in Figure 3. A sample (50 mm diameter x 50 mm
height) is placed between the grips, and then a compressive force with a rate of 51.71 kN/m2 was applied from both sides
until the specimen broke in 10 seconds to 15 seconds. Each rammed samples must be tested quickly and directly in the
universal testing machine (USSM) until it broke to prevent it from drying and causing a decrease in strength, leading to
the sample being ruined.
Figure 2. Waste waterjet abrasive from waterjet laboratory
Figure 3. Universal sand strength testing machine for green compression strength and green shear strength
Optimizing the Composition of Sand and Waste Sand Composition for Optimal Composition
This objective of this analysis was to obtain an optimal composition for the influence of mixing waste waterjet sand
in sand casting mould for green compression strength and shear strength while minimizing their standard deviations. The
result of sand mixing can be evaluated in terms of the response to noise factor and the signal factor, hence, improving and
increasing the quality of the product quality by maximizing the signal to the noise (S/N) ratio for respective responses.
Taguchi robust experimental design module recommends the signal to the ratio for computation process [17]. For each
output parameter composition, the S/N ratios were analyzed, and termed as the performed characteristics. The quality
element of the product should be sufficient, and the S/N ratio should be as large as possible. The green compression
strength and shear strength should be high, and there is no arrangement on the aspect and factor of the S/N ratio. The S/N
ratio for the evaluation of the higher responses is derived from the equation given be,
𝑆
𝑁𝑙𝑎𝑟𝑔𝑒𝑟= −10 𝑙𝑜𝑔 [
Σ1
𝑍𝑖2
𝑗] (1)
where j is the number of experiment test, 𝑍𝑖 is the ith number of quality attribute or performance value. Thus, two
individual desirability functions were needed.
Analysis of Variance (ANOVA)
Analysis of variance or ANOVA is a decision-making tool by analyzing the average difference in the performance of
the test conducted and observing the statistically substantial effect of the parameter, in which a 95% confidence level was

Nur Farah Bazilah Wakhi Anuar et al. │ Journal of Mechanical Engineering and Sciences │ Vol. 15, Issue 4 (2021)
8533 journal.ump.edu.my/jmes ◄
used in all analysis of data (confidence interval, α = 0.05) [26]. Suppose a parameter and factors are consequential and
imply that this parameter and factors act as a decisive role in determining the optimal and excellent solution of the present
design problem [17]. Confirmation experiments were carried out on the selected optimal parameter levels.
RESULTS AND DISCUSSION
Optimal Parameters
The quality of the composition’s mixture was identified and characterized in terms of green compression strength and
green shear strength. The nine experimental conditions for these elements were measured using the Taguchi method as
reported in Table 2 and Table 3. Initially, all different response variables were intended to be analyzed by ANOVA to
determine and verify the optimized condition of the process parameter for silica sand and waterjet abrasive waste samples.
Figure 4(a) and Figure 4(b) show the response of the S/N ratio, the changes in factors and their levels affecting the green
compression strength and the green shear strength, respectively, using Taguchi method. The optimum composition level
in terms of green compression strength with bentonite-12%, coal dust-5%, and water-7% is “A3-B2-C3” with a predicted
green compression strength of 84.778 kN/m2. The optimum level for the mould composition in green shear strength is the
amount of bentonite-12%, coal dust-6% and water-7% is “A3-B3-C3” with a predicted green shear strength of 66.22
kN/m2. Combining the two optimal factorial levels (A3-B2-C3 and A3-B3-C3) was not one of the nine combinations
tested in the set of experiments. These results were expected due to challenges in the small number of experiments
conducted based on the experimental design.
From the experimental study results, the green compression strength increased as the amount of bentonite increased.
Still, it decreased as moisture content decreased. This result was consistent with the previous study’s experimental result
[1,12], where bentonite increased the value of green compression strength with the sand mould's traditional composition.
A similar trend was detected in the shear strength as shown in Figure 4(b). The phenomena can be explained in the
bonding of the bentonite with the mixture of silica and waste waterjet sand mould. The mixing process allowed a thin
layer coating of binders coated on individual sand particles when the binding was applied during the mixing of the silica
and waterjet sand waste. The process resin bridge was developed using the surface coating of the sand particles with two
binders coming in close proximity until they intermixed with each other. However, the recycled abrasive waste required
the addition of bentonite as a binder to create a higher strength to endure the heat of molten metal. Further, increasing the
bentonite content also improve the value of the compression and shear strength for the mould contain silica and waterjet
abrasive waste mixture.
Moreover, the result also showed that increasing the water content and the clay content influenced the compression
and shear strength value, while the inaccurate proportion of water decreased the strength value. Water and clay is a
moisture system in which a binder must be balanced to create a higher and better green strength. In comparison, the trends
in Table 3, Figure 4(a) and Figure 4(b) show that excessively low moisture content while rising the bentonite level gave
a low binding strength value. On the other hand, reducing the mixture of silica sand and abrasive waste allowed for
acceptable plasticity and strength for the mould.
Table 3. Mould properties of silica sand and waterjet abrasive waste from experiments
Experiment
Parameters (%) Average
Green
Compression
Strength
(kN/m2)
S/N Ratio of
Green
Compression
Strength
Average
Green Shear
Strength
(kN/m2)
S/N Ratio
of Green
Shear
Strength Bentonite Coal Dust Water
1 6 4 5 50.33 33.84 40.00 31.81
2 6 5 6 59.00 35.39 46.00 33.24
3 6 6 7 60.33 35.60 47.33 33.48
4 9 4 6 63.00 35.94 49.67 33.87
5 9 5 7 71.00 37.02 53.33 34.49
6 9 6 5 59.67 35.50 47.00 33.43
7 12 4 7 83.00 38.38 65.00 36.27
8 12 5 5 72.67 37.18 57.67 35.20
9 12 6 6 83.00 38.37 65.00 36.25

Nur Farah Bazilah Wakhi Anuar et al. │ Journal of Mechanical Engineering and Sciences │ Vol. 15, Issue 4 (2021)
8534 journal.ump.edu.my/jmes ◄
Figure 4. S/N ratio values of factor levels for: (a) green compression strength, and (b) green shear strength
Analysis of Variance
Several studies agree that each parameter has a dominant variability and differentiates between significant and
insignificant parameters. ANOVA is conducted in experimental results to demonstrate the relative percentage
contribution of each parameter [20]. The variability of the decreasing parameters can be controlled by generating an
ANOVA table. Valuable terms including the degree of freedom, the sum of squares, the F-value, and the P-value in the
derived table are obtained using the following equations:
𝑑𝑓𝑟𝑒𝑠 = 𝑑𝑓𝑡𝑜𝑡𝑎𝑙 − 𝑑𝑓𝑡𝑟𝑒𝑎𝑡𝑚𝑒𝑛𝑡 (2)
where df is degrees of freedom
Streat (Sum of squares between treatment groups) = ∑Ât2 (3)
Where Ât are the difference between the “estimated treatment mean” and the “estimated overall mean” = Meant – μ.
SSres (Sum of squares within treatment groups)= ji (yij – yi)2 (4)
SStot (Total sum of squares) = ji , (yij –μ)2= SStreat + SSres (5)
The F-value can be remembering by equation F-value =𝑀𝑆𝑡𝑟𝑒𝑎𝑡
𝑀𝑆𝑟𝑒𝑠 where each mean square can defined by:
MStreat= 𝑆𝑆𝑡𝑟𝑒𝑎𝑡
𝑑𝑓𝑡𝑟𝑒𝑎𝑡 and MSres=
𝑆𝑆𝑟𝑒𝑠
𝑑𝑓𝑟𝑒𝑠 (6)
The green compression strength and green shear strength represent the significance of the mixture silica sand and
waterjet abrasive waste mould. All the significant of each factor contribute to each response are shown in Table 4 and
Table 5. The information on the parameter helps distinguish between the important and insignificant parameters that
control the response function. Changes in the predictor variable rely on the response property changes and can be revealed
by the regression model. The equations were developed with the least square fitting, suitable for fitting data to a linear
model [27]. The data collected from the experiments in Table 3 were used in the Minitab software to generate the
regression equations and the following equation.
Response = constant + (coefficient I x predictor I) + (coefficient II x predictor II) +... + (coefficient i x
predictor i) (7)
b) a)

Nur Farah Bazilah Wakhi Anuar et al. │ Journal of Mechanical Engineering and Sciences │ Vol. 15, Issue 4 (2021)
8535 journal.ump.edu.my/jmes ◄
Table 4. ANOVA for green compression strength according to taguchi method
Source DF Seq SS Adj SS Adj MS F-value P-value
Regression 3 968.04 968.037 322.679 33.6384 0.000970
Clay (Bentonite) 1 793.50 793.500 793.500 82.7201 0.000269
Coal Dust 1 7.41 7.407 7.407 0.7722 0.419756
Water 1 167.13 167.130 167.130 17.4228 0.008705
Error 5 47.96 47.963 9.593
Total 8 1016.00
The empirical relationship between the green compression strength of the silica sand and waterjet abrasive waste mould,
based on bentonite, coal dust and water was achieved as follows:
GCS = -4.83333 + 3.83333 B + 1.11111 C + 5.27778 W (8)
Where GCS is the green compression strength response variable whereas B, C and W are the bentonite (%), coal dust
(%) and water (%), respectively, act as variables predictors. The sequential sum of square was used to analyze the
predictive model. To determine whether quadratic terms, two-factor interactions would be added to the predictive model
of green compression strength. The results found that linear terms were adequate for the green compression strength
model P-value < 0.05 as performed in Table 4. The sequential F-value as illustrated in Table 4 describes the linear
mixture's contribution to the analysis of variance (ANOVA) as statistically consequential, and in general, the diagnostic
data is sufficient. The coefficient (R2) determination revealed the total variance of the response variable from the
predictive model and was applied to monitor the goodness of model fit [12,13,15] . The variation around the mean in the
model experiment was measured using the adjusted coefficient of determination (adjusted R2). The green compression
strength values were adjusted with the confidence level of 95%, and the selected significant level, α = 5% (0.05). The P-
value was less than 0.05 for the bentonite and water parameters as shown in Table 4, indicating that bentonite and water
were highly statistically significant. Simultaneously, for coal dust with P-value>0.05, the composition was not statistically
significant for the composition.
From ANOVA analysis, the value of the determination coefficient, R2 is 95.28% suggesting that the model did not
explain the 4.72% of the total variation. In comparison, the adjusted determination of coefficient (adjusted R2 = 92.45%)
was also high and showed that the model parameters were a good fit and highly significant. As a result, the predictive
model of green compression strength compromised only the linear terms as shown in Equation 8 where bentonite (B) and
water (W) demonstrated high coefficients for the main effects, whereas the coal dust (C) provided the least amount of
benefit to the green compression strength for silica sand and waterjet abrasive waste mixture. The available methods for
validating the model are the normal probability plot of residuals and the scatter plot of residuals versus fitted value [17]
and these methods were employed to justify and explain the response using the design composition parameters related to
the experiment. Figure 5(a) shows that the point closely resembles and lies approximately a straight line and it slops
upward to the right, meaning that the errors were normally distributed. This support the scatter plot in Figure 5(b)
suggesting the free pattern as a random scatter and stipulating the model was adequate for this data since there were no
apparent patterns in the residual plot. The green compression strength showed the control factor for the ability of sand
moulding mixture to maintain its shape and surface roughness.
Figure 5. Residual plot of green compression strength for: (a) normal probability, and (b) residual versus fit
(a) (b)

Nur Farah Bazilah Wakhi Anuar et al. │ Journal of Mechanical Engineering and Sciences │ Vol. 15, Issue 4 (2021)
8536 journal.ump.edu.my/jmes ◄
Table 5. ANOVA for green shear strength according to taguchi method
Source DF Seq SS Adj SS Adj MS F-value P-value
Regression 3 569.148 569.148 189.716 27.9298 0.001502
Clay (Bentonite) 1 462.019 492.019 492.019 72.4346 0.000368
Coal Dust 1 3.630 3.630 3.630 0.5344 0.497585
Water 1 73.500 73.500 73.500 10.8206 0.021726
Error 5 33.963 33.963 6.793
Total 8 603.111
The empirical relationship between the green shear strength of the silica sand and waterjet abrasive waste mould
mixture, based on bentonite, coal dust and water was achieved as follows:
GSS = 0.277778+ 3.01852 B + 0.777778 C + 3.5 W (9)
Where GSS is the green shear strength response for predictor variables whereas B, C and W are the bentonite (%),
coal dust (%) and water (%), respectively. The linear terms were adequate for the green shear strength model which is P-
value < 0.05. The amount of variation around the mean in model experiment was measured by the adjusted coefficient of
determination (adjusted R2). The number of terms of green compression strength was adjusted where the confidence level
was 95% and significant level, α = 5% (0.05) was selected. From the ANOVA as demonstrated in Table 5, the value of
the coefficient of determination, R2 is 94.37% indicating that the model did not explain 5.63% of the total variation while
the adjusted determination coefficient (adjusted R2 = 90.99%) also high and it shows the model parameters is a good fit
and highly significance. It also shows that the P-value was less than 0.05 for the bentonite and water parameters,
suggesting that bentonite and water were statistically highly significant while the coal dust (P-value>0.05) was not
statistically significant for the composition. Therefore, the predictive model of green shear strength compromised only
on the linear terms as shown in Equation 9, bentonite (B) and water (W) also demonstrated a high coefficient for the main
effects. In contrast, the coal dust (C) provided the slightest contribution input to the green shear strength for silica sand
and waterjet abrasive waste mixture.
Figure 6. Residual plot of green shear strength for: (a) normal probability, and (b) residual versus fit
The available methods for validating the model are the normal probability plot of residuals and the scatter plot of
residuals versus fitted value [1]. These methods were employed to justify and explain the response using design
composition parameters related to the experiment. Figure 6(a) shows that the remaining points closely resembled and lied
approximately on the straight line with the exception for two points. It is sloping upward to the right, meaning that the
errors were normally distributed. The scatter plot in Figure 6(b) also shows the free of any patterns as a random scatter
and indicating the model is adequate for this data since there is no apparent pattern in the residual plot.
Figure 7 and Figure 8 show the interaction between bentonite, water and coal dust based on the green compression
strength and green shear strength. However, there is a strong interaction between coal dust and water, but coal dust offers
less contribution to this green silica sand and waterjet abrasive waste mixture. Furthermore, it can be observed that
increasing bentonite in the moulding requires a certain amount of water due to the absorption of bentonite clay to form a
bridge between silica sand and waterjet abrasive waste during the muller's mixing process. The granular bentonite
particles are instantly attracted to the wet sand and abrasive grain surfaces. The compressive forces expended by the
mulling wheels causes the sliding of silica sand and waterjet abrasive waste mixture which in turn causes shearing,
spreading and coating of the silica sand and abrasive grains by the bentonite adhesive. In this muller mixing process, coal
dust is added in the bentonite for additional coating. In order to avoid irrelevant moisture in the moulding mixture, the
determination of the proper percentage composition for silica sand and waterjet abrasive waste is critical.
(b) (a)

Nur Farah Bazilah Wakhi Anuar et al. │ Journal of Mechanical Engineering and Sciences │ Vol. 15, Issue 4 (2021)
8537 journal.ump.edu.my/jmes ◄
Figure 7. Interaction plot for green compression strength
Figure 8. Interaction plot for green shear strength
The green strength is a tool for measuring the rate or ratio of bentonite addition to a moulding system, thus controlling
the hydrogen content, which depends on the percentage of water in the silica sand and waterjet abrasive waste. The
increasing hydrogen content leads to a decrease in the amount of oxygen in the mould. The high moisture content allows
gases to be trapped within the molten casting due to a low pouring temperature of entering metal. Hence, it is insufficient
to perform adequate gas to eliminate the original atmosphere. On the other hand, the adhesive film of lustrous carbon is
activated in coal dust (C) when exposed to hot metal only, not when wetted by molten metal. Obviously, this phenomenon
relies on the volatile matter when heated to present a soft constituent around the silica sand and waste abrasive grains
from metal penetration, especially with the mould containing less silica sand.
Additionally, the formation of volatile matter in coal dust must progress until the casting has formed a solid skin,
resulting in the casting's better surface finish. This is to support that bentonite (B) and water (W) demonstrate a high
coefficients for the main effects in the green strength of silica sand and waterjet abrasive waste mixture compared to coal
dust (C). The results of the study demonstrate that with the right amount bentonite, water and coal dust in silica sand and
the presence of waterjet abrasive waste, the composition can possibly be used in the foundry without compromising the
casting quality.
Confirmation Testing
The prediction for the optimized parameter is necessary in the confirmation test or experimental trial. The optimal
parameter or optimized condition is not from the design experiment as suggested by the Taguchi method. In this case, it
is “A3-B2-C3” and “A3-B3-C3”, for green compression strength and green shear strength, respectively, which is
corresponding to highest S/N ratio from Figure 4(a) and Figure 4(b). Level combination of “A3-B2-C3” and “A3-B3-

Nur Farah Bazilah Wakhi Anuar et al. │ Journal of Mechanical Engineering and Sciences │ Vol. 15, Issue 4 (2021)
8538 journal.ump.edu.my/jmes ◄
C3” are not one of the experiment design for L9 orthogonal array as shown in Table 2. The confirmatory experiment was
conducted for both strength testing by using the set of the optimum value of parameters to validate the optimized
condition. The comparison of the predicted optimum, confirmation experimental and response regression model in
Equation (7) and Equation (8) for both strengths are shown in Table 6.
Table 6. Comparison conditions of green strength
Optimum controlled conditions
Predicted Experimental Regression Model
Level A3-B2-C3 A3-B2-C3 A3-B2-C3
Green Compression Strength 84.778 kN/m2 84.4 kN/m2 83.667 kN/m2
Level A3-B3-C3 A3-B3-C3 A3-B3-C3
Green Shear Strength 66.222 kN/m2 65.5 kN/m2 65.667 kN/m2
CONCLUSIONS
In this study, the effect and optimal of different bentonite, coal dust and water ratio parameters in silica sand and
waterjet abrasive waste mixture on green compression strength and green shear strength was investigated using Taguchi
experiment design method as the potential application of waterjet abrasive waste in sand casting foundry. The green
compression strength and green shear strength were analyzed using the Taguchi experiment design method. The data
obtained and the analysis results were scrutinized; green strength performance was effectively promoted by the different
ratio of bentonite and moisture content. However, the more analysis of waterjet abrasive waste requires more attention in
the future due to its purity and can be used productively in green sand mould. In general, the results obtained are as
follows;
1) Choosing the optimum factor levels in the Taguchi method and endorsing the ANOVA approach is important in
maximizing the green compression strength and the green shear strength in silica and waterjet sand waste
mixture.
2) The optimum result for green compression strength was obtained at 12% of bentonite, 5% of coal dust and 7%
of water at 84.281 kN/m2 for average.
3) The optimum value of green shear strength was demonstrated at 12% of bentonite, 6% of coal dust and 7% of
water at 65.796 kN/m2 for average.
4) Waterjet abrasive waste is categorized as non-hazardous waste (reactive or toxic) and has shown to be durable.
The results in addition of waterjet abrasive waste in mould sand casting is reducing the sand contents without
undermining the performance and quality. Thus, it provides a positive opportunity for a sand casting raw
materials that are economically feasible and minimize the environmental degradation due to mining activities.
5) Increasing the bentonite in a mixture of silica sand and waterjet abrasive waste with a proper amount of moisture
increases the amount of green compression strength and green shear strength. The optimum strength within the
typical range of green strength is between 30-100 kN/m2.
Overall, mixing the waterjet abrasive waste with the silica sand has the potential of producing a more eco-friendly
green sand mould with advantages that include greater utilization of waste, scale down the silica sand content and maintain
the strength of the mould for a better casting product.
ACKNOWLEDGMENTS
The authors would like to thank with gratitude for Centre of Excellence for Centre of Smart System and Innovative
Design (CoSSID), Universiti Teknikal Malaysia Melaka and Universiti Tun Hussein Onn Malaysia for supporting and
providing the facilities.
REFERENCES
[1] R. M. Said, M. R. M. Kamal, and N. H. Miswan and S. J. Ng, “Optimization of moulding composition for quality improvement
of sand casting,” J. Adv. Manuf. Technol., vol. 12, no. 1, pp. 301–310, 2018.
[2] S. Shahria, “Optimization of molding sand composition for casting Al Alloy,” Int. J. Mech. Eng. Appl., vol. 5, no. 3, p. 155,
2017, doi: 10.11648/j.ijmea.20170503.13.
[3] L. B. Q. Brito, G. de F. Brito, and C. R. da S. Morais, “Alternative for fine pure silica in kiln-casting glass molds,” Mater. Lett.,
vol. 252, pp. 19–22, 2019, doi: 10.1016/j.matlet.2019.05.048.

Nur Farah Bazilah Wakhi Anuar et al. │ Journal of Mechanical Engineering and Sciences │ Vol. 15, Issue 4 (2021)
8539 journal.ump.edu.my/jmes ◄
[4] K. Srinivasan, C. S. K. Siddharth, L. V. A. Kaarthic, and M. Thenarasu, “Evaluation of mechanical properties, economic and
environmental benefits of partially replacing silica sand with biomass ash for aluminium casting,” Mater. Today Proc., vol. 5,
no. 5, pp. 12984–12992, 2018, doi: 10.1016/j.matpr.2018.02.283.
[5] J. Sadarang, R. K. Nayak, and I. Panigrahi, “Effect of binder and moisture content on compactibility and shear strength of river
bed green sand mould,” Mater. Today Proc., vol. 46, pp. 5286–5290, 2021, doi: 10.1016/j.matpr.2020.08.640.
[6] A. Srivastava and S. K. Singh, “Utilization of alternative sand for preparation of sustainable mortar: A review,” J. Clean. Prod.,
vol. 253, p. 119706, 2020, doi: 10.1016/j.jclepro.2019.119706.
[7] J. J. Chen, B. H. Li, P. L. Ng, and A. K. H. Kwan, “Adding granite polishing waste to reduce sand and cement contents and
improve performance of mortar,” J. Clean. Prod., vol. 279, p. 123653, 2021, doi: 10.1016/j.jclepro.2020.123653.
[8] A. Kumar, S. Pratheba, R. Rajendran, K. Perumal, N. Lingeshwaran, and S. Sambaraju, “An experimental study on the
mechanical properties of concrete replacing sand with quarry dust and waste foundry sand,” Mater. Today Proc., vol. 33, pp.
828–832, 2020, doi: 10.1016/j.matpr.2020.06.271.
[9] M. Kantha Babu and O. V. Krishnaiah Chetty, “A study on recycling of abrasives in abrasive water jet machining,” Wear, vol.
254, no. 7–8, pp. 763–773, 2003, doi: 10.1016/S0043-1648(03)00256-4.
[10] B. Bhardwaj and P. Kumar, “Waste foundry sand in concrete: A review,” Constr. Build. Mater., vol. 156, pp. 661–674, 2017,
doi: 10.1016/j.conbuildmat.2017.09.010.
[11] A. J. Rajan, C. Kailasanathan, B. Stalin, P. R. Rajkumar, T. Gangadharan, and A. Perumal, “Optimization of mould sand
properties by mixing of granite powder using Taguchi method,” Mater. Today Proc., vol. 45, pp. 2254–2259, 2021, doi:
10.1016/j.matpr.2020.10.231.
[12] N. Skanavi and T. Dovydenko, “Effects of waterjet cutting waste addition on properties of building ceramics,” in MATEC Web
of Conferences, 2018, vol. 196, p. 04057, doi: 10.1051/matecconf/201819604057.
[13] I. Izdebska-Szanda, M. Angrecki, and A. Palma, “Recycling of waste moulding sands with new binders,” Arch. Foundry Eng.,
vol. 13, no. 2, pp. 43–48, 2013, doi: 10.2478/afe-2013-0034.
[14] V. D. Prasad, E. L. Prakash, M. Abishek, K. Ushanth Dev, and C. K. Sanjay Kiran, “Study on concrete containing waste
foundry sand, fly ash and polypropylene fibre using Taguchi Method,” Mater. Today Proc., vol. 5, no. 11, pp. 23964–23973,
2018, doi: 10.1016/j.matpr.2018.10.189.
[15] C. Saikaew and S. Wiengwiset, “Optimization of molding sand composition for quality improvement of iron castings,” Appl.
Clay Sci., vol. 67–68, pp. 26–31, 2012, doi: 10.1016/j.clay.2012.07.005.
[16] H. Qu et al., “Effect of shale mineralogy characteristics on the perforation performance and particle fragmentation of abrasive
waterjet,” Powder Technol., vol. 367, pp. 427–442, 2020, doi: 10.1016/j.powtec.2020.03.068.
[17] K. C. APPARAO and A. K. BIRRU, “QFD-Taguchi based hybrid approach in die casting process optimization,” Trans.
Nonferrous Met. Soc. China, vol. 27, no. 11, pp. 2345–2356, 2017, doi: 10.1016/S1003-6326(17)60260-7.
[18] B. A. M. PASHA and K. MOHAMED, “Taguchi approach to influence of processing parameters on erosive wear behaviour
of Al7034-T6 composites,” Trans. Nonferrous Met. Soc. China, vol. 27, no. 10, pp. 2163–2171, 2017, doi: 10.1016/S1003-
6326(17)60242-5.
[19] M. Viquar Mohiuddin, A. Krishnaiah, S. Ferhathullah Hussainy, and P. Laxminarayana, “Influence of process parameters on
quality of Al7SiMg alloy casting using statistical techniques,” Mater. Today Proc., vol. 3, no. 10, pp. 3726–3733, 2016, doi:
10.1016/j.matpr.2016.11.020.
[20] S. N. Bansode, V. M. Phalle, and S. S. Mantha, “Optimization of process parameters to improve dimensional accuracy of
investment casting using Taguchi approach,” Adv. Mech. Eng., vol. 11, no. 4, p. 168781401984146, 2019, doi:
10.1177/1687814019841460.
[21] S. V. Rao and N. L. Prasad, “Parametric optimization of green sand moulding process based on wet tensile strength – A full
factorial experimental approach,” Int. J. Eng. Res. Technol., vol. 2, no. 12, pp. 2544–2548, 2013.
[22] D. Patel, V. Deshpande, E. Jha, V. Patel, S. Desai, and J. Patel, “Study of sand composition on mould properties and selection
of Taguchi orthogonal array for design of experiments,” Int. J. Curr. Eng. Sci. Res., vol. 2, no. 3, pp. 31–34, 2015.
[23] X. Sun, Y. Mo, J. Li, Y. Chu, L. Liu, and S. Liao, “Study on the energy charging process of a plate-type latent heat thermal
energy storage unit and optimization using Taguchi method,” Appl. Therm. Eng., vol. 164, p. 114528, 2020, doi:
10.1016/j.applthermaleng.2019.114528.
[24] V. Ayhan et al., “Optimization of the factors affecting performance and emissions in a diesel engine using biodiesel and EGR
with Taguchi method,” Fuel, vol. 261, p. 116371, 2020, doi: 10.1016/j.fuel.2019.116371.
[25] M. V. Mohiuddin, A. Krishnaiah, and S. F. Hussainy, “Effect of composition of sand mold on mechanical properties and
density of Al-Alloy casting using Taguchi design approach,” Int. J. Eng. Res. Appl., vol. 5, no. 3, pp. 37–41, 2015.
[26] A. Balaram Naik and A. Chennakeshava Reddy, “Optimization of tensile strength in TIG welding using the Taguchi method
and analysis of variance (ANOVA),” Therm. Sci. Eng. Prog., vol. 8, pp. 327–339, 2018, doi: 10.1016/j.tsep.2018.08.005.
[27] H. Khandelwal and B. Ravi, “Effect of molding parameters on chemically bonded sand mold properties,” J. Manuf. Process.,
vol. 22, pp. 127–133, 2016, doi: 10.1016/j.jmapro.2016.03.007.
Copyright © 2022 FDOKUMEN