Role of abrasive material on micro-abrasion wear tests - CORE
8
Role of abrasive material on micro-abrasion wear tests F.J.G. Silva, R.B. Casais, R.P. Martinho, A.P.M. Baptista ABSTRACT Micro-abrasion wear tests with ball-cratering configuration are widely used. Sources of variability are already studied by different authors and conditions for testing are parameterized by BS EN 1071-6: 2007 standard which refers silicon carbide as abrasive. However, the use of other abrasives is possible and allowed. In this work, ball-cratering wear tests were performed using four different abrasive particles of three dissimilar materials: diamond, alumina and silicon carbide. Tests were carried out under the same conditions on a steel plate provided with TiB2 hard coating. For each abrasive, five different test durations were used allowing understanding the initial wear phenomena. Composition and shape of abrasive parti- cles were investigated by SEM and EDS. Scar areas were observed by optical and electronic microscopy in order to understand the wear effects caused by each of them. Scar geometry and grooves were analyzed and compared. Wear coefficient was calculated for each situation. It was observed that diamond parti- cles produce well-defined and circular wear scars. Different silicon carbide particles presented dissimilar results as consequence of distinct particle shape and size distribution. Keywords Micro-abrasion, Ball-cratering, TiB2 hard coating, Abrasive particles, Wear tests, Abrasive materials 1. Introduction In the last decade, micro-abrasion wear tests using ball crater- ing configuration has been widely used in order to characterize wear behavior of thin hard coatings. Initially, this configuration was used only for film thickness measurement but it was adapted to wear studies. This wear test takes advantage over others because coating thickness constrains the volume or depth of material that can be removed before the coating is perforated [1]. Furthermore, this test is quick, convenient, can be performed on small samples and uses relatively inexpensive equipment [2]. Otherwise, reliabil- ity and reproducible measurements [3] ensure that this wear test configuration meets the requirements sought by investigators, if test conditions used are the same. However, wear rates and wear mechanisms can differ significantly when test conditions change, as normal load or sliding speed [4,5]. Authors refer [3] that two wear modes can be achieved during micro-abrasion wear tests: ‘three-body’ abrasion and ‘two-body’ abrasion. The wear mode can be changed adjusting the load or selecting other abrasive parti- cles [6], the abrasive content in the slurry [7] and the ball surface condition [8]. Concerning the ball surface condition, Stachowiak et al. [9] referred that soft materials were more affected by ball sur- face roughness than harder materials. Adachi and Hutchings [10] proposed critical conditions for the transition from ‘three-body’ to ‘two-body’, allowing predicting the wear mode in practical tests. Many efforts has been done in order to establish the best wear test parameters and study its influence in the results [2,10–14], which subsequently gave rise to BS-EN 1071-6: 2007 standard. Before this, many devoted authors have compiled a great number of testing results in order to validate the micro-abrasion wear test [15]. This standard recommends SiC F1200 as abrasive particles, but does not restrict the use of other abrasives or grain sizes, since less than 5 μm. Before the standard publication, other author made some studies in order to investigate the influence of grain size in micro-abrasion wear tests [9,16]. Some authors [9,10,12,16,17] recognize that particles shape strongly influences the particle motion in the contact. However, abrasive particles material also plays an important role in the micro-abrasion process. Furthermore, due to coating hardness, some works could not use silicon carbide or alumina [18,19]. Schiffmann et al. tested different slurries in free ball-cratering configuration, referring that the solution of Al2O3 in glycerin is more suitable for non-perforating tests [14]. It should be taken into account that, if hardness of abrasive particles is to much higher than the coating to be tested, crater depth increases substantially, facili- tating abrasive particles entrainment, contributing to non-linearity brought to you by CORE View metadata, citation and similar papers at core.ac.uk provided by Scientific Repository of the Polytechnic Institute of Porto
-
Upload
khangminh22 -
Category
Documents
-
view
2 -
download
0
Transcript of Role of abrasive material on micro-abrasion wear tests - CORE
Role of abrasive material on micro-abrasion wear tests
F.J.G. Silva, R.B. Casais, R.P. Martinho, A.P.M. Baptista
ABSTRACT
Micro-abrasion wear tests with ball-cratering configuration are widely used. Sources of variability are already studied by different authors and
conditions for testing are parameterized by BS EN 1071-6: 2007 standard which refers silicon carbide as abrasive. However, the use of other abrasives is
possible and allowed. In this work, ball-cratering wear tests were performed using four different abrasive particles of three dissimilar materials:
diamond, alumina and silicon carbide. Tests were carried out under the same conditions on a steel plate provided with TiB2 hard coating. For each
abrasive, five different test durations were used allowing understanding the initial wear phenomena. Composition and shape of abrasive parti- cles were
investigated by SEM and EDS. Scar areas were observed by optical and electronic microscopy in order to understand the wear effects caused by each of
them. Scar geometry and grooves were analyzed and compared. Wear coefficient was calculated for each situation. It was observed that diamond parti-
cles produce well-defined and circular wear scars. Different silicon carbide particles presented dissimilar results as consequence of distinct particle shape
and size distribution.
Keywords Micro-abrasion, Ball-cratering, TiB2 hard coating, Abrasive particles, Wear tests, Abrasive materials
1. Introduction
In the last decade, micro-abrasion wear tests using ball crater-
ing configuration has been widely used in order to characterize
wear behavior of thin hard coatings. Initially, this configuration was
used only for film thickness measurement but it was adapted to
wear studies. This wear test takes advantage over others because
coating thickness constrains the volume or depth of material that
can be removed before the coating is perforated [1]. Furthermore,
this test is quick, convenient, can be performed on small samples
and uses relatively inexpensive equipment [2]. Otherwise, reliabil-
ity and reproducible measurements [3] ensure that this wear test
configuration meets the requirements sought by investigators, if
test conditions used are the same. However, wear rates and wear
mechanisms can differ significantly when test conditions change,
as normal load or sliding speed [4,5]. Authors refer [3] that two
wear modes can be achieved during micro-abrasion wear tests:
‘three-body’ abrasion and ‘two-body’ abrasion. The wear mode can
be changed adjusting the load or selecting other abrasive parti-
cles [6], the abrasive content in the slurry [7] and the ball surface
condition [8]. Concerning the ball surface condition, Stachowiak
et al. [9] referred that soft materials were more affected by ball sur-
face roughness than harder materials. Adachi and Hutchings [10]
proposed critical conditions for the transition from ‘three-body’ to
‘two-body’, allowing predicting the wear mode in practical tests.
Many efforts has been done in order to establish the best wear
test parameters and study its influence in the results [2,10–14],
which subsequently gave rise to BS-EN 1071-6: 2007 standard.
Before this, many devoted authors have compiled a great number
of testing results in order to validate the micro-abrasion wear test
[15]. This standard recommends SiC F1200 as abrasive particles,
but does not restrict the use of other abrasives or grain sizes, since
less than 5 µm. Before the standard publication, other author made
some studies in order to investigate the influence of grain size in
micro-abrasion wear tests [9,16].
Some authors [9,10,12,16,17] recognize that particles shape
strongly influences the particle motion in the contact. However,
abrasive particles material also plays an important role in the
micro-abrasion process. Furthermore, due to coating hardness,
some works could not use silicon carbide or alumina [18,19].
Schiffmann et al. tested different slurries in free ball-cratering
configuration, referring that the solution of Al2O3 in glycerin is
more suitable for non-perforating tests [14]. It should be taken into
account that, if hardness of abrasive particles is to much higher than
the coating to be tested, crater depth increases substantially, facili-
tating abrasive particles entrainment, contributing to non-linearity
brought to you by COREView metadata, citation and similar papers at core.ac.uk
provided by Scientific Repository of the Polytechnic Institute of Porto
× ×
×
×
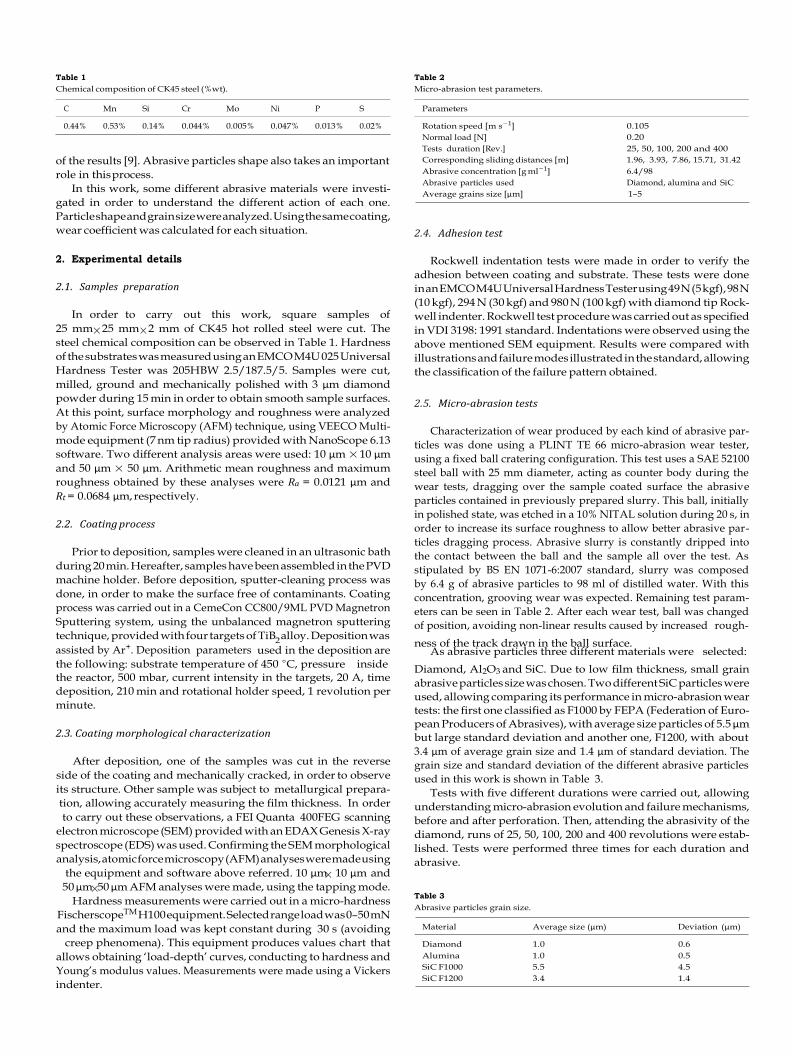
Table 1
Chemical composition of CK45 steel (%wt).
Table 2
Micro-abrasion test parameters.
C Mn Si Cr Mo Ni P S Parameters 0.44% 0.53% 0.14% 0.044% 0.005% 0.047% 0.013% 0.02% Rotation speed [m s−1] 0.105
Normal load [N]
Tests duration [Rev.]
0.20
25, 50, 100, 200 and 400
of the results [9]. Abrasive particles shape also takes an important
role in this process.
In this work, some different abrasive materials were investi-
gated in order to understand the different action of each one.
Particle shape and grain size were analyzed. Using the same coating,
wear coefficient was calculated for each situation.
2. Experimental details
2.1. Samples preparation
In order to carry out this work, square samples of
25 mm 25 mm 2 mm of CK45 hot rolled steel were cut. The
steel chemical composition can be observed in Table 1. Hardness
of the substrates was measured using an EMCO M4U 025 Universal
Hardness Tester was 205HBW 2.5/187.5/5. Samples were cut,
milled, ground and mechanically polished with 3 µm diamond
powder during 15 min in order to obtain smooth sample surfaces.
At this point, surface morphology and roughness were analyzed
by Atomic Force Microscopy (AFM) technique, using VEECO Multi-
mode equipment (7 nm tip radius) provided with NanoScope 6.13
software. Two different analysis areas were used: 10 µm × 10 µm
and 50 µm × 50 µm. Arithmetic mean roughness and maximum
roughness obtained by these analyses were Ra = 0.0121 µm and
Rt = 0.0684 µm, respectively.
2.2. Coating process
Prior to deposition, samples were cleaned in an ultrasonic bath
during 20 min. Hereafter, samples have been assembled in the PVD
machine holder. Before deposition, sputter-cleaning process was
done, in order to make the surface free of contaminants. Coating
process was carried out in a CemeCon CC800/9ML PVD Magnetron
Sputtering system, using the unbalanced magnetron sputtering
technique, provided with four targets of TiB alloy. Deposition was
Corresponding sliding distances [m] 1.96, 3.93, 7.86, 15.71, 31.42
Abrasive concentration [g ml−1] 6.4/98
Abrasive particles used Diamond, alumina and SiC
Average grains size [µm] 1–5
2.4. Adhesion test
Rockwell indentation tests were made in order to verify the
adhesion between coating and substrate. These tests were done
in an EMCO M4U Universal Hardness Tester using 49 N (5 kgf), 98 N
(10 kgf), 294 N (30 kgf) and 980 N (100 kgf) with diamond tip Rock-
well indenter. Rockwell test procedure was carried out as specified
in VDI 3198: 1991 standard. Indentations were observed using the
above mentioned SEM equipment. Results were compared with
illustrations and failure modes illustrated in the standard, allowing
the classification of the failure pattern obtained.
2.5. Micro-abrasion tests
Characterization of wear produced by each kind of abrasive par-
ticles was done using a PLINT TE 66 micro-abrasion wear tester,
using a fixed ball cratering configuration. This test uses a SAE 52100
steel ball with 25 mm diameter, acting as counter body during the
wear tests, dragging over the sample coated surface the abrasive
particles contained in previously prepared slurry. This ball, initially
in polished state, was etched in a 10% NITAL solution during 20 s, in
order to increase its surface roughness to allow better abrasive par-
ticles dragging process. Abrasive slurry is constantly dripped into
the contact between the ball and the sample all over the test. As
stipulated by BS EN 1071-6:2007 standard, slurry was composed
by 6.4 g of abrasive particles to 98 ml of distilled water. With this
concentration, grooving wear was expected. Remaining test param-
eters can be seen in Table 2. After each wear test, ball was changed
of position, avoiding non-linear results caused by increased rough-
assisted by Ar+. Deposition parameters 2
used in the deposition are ness of the track drawn in the ball surface.
As abrasive particles three different materials were selected: the following: substrate temperature of 450 ◦C, pressure inside the reactor, 500 mbar, current intensity in the targets, 20 A, time
deposition, 210 min and rotational holder speed, 1 revolution per
minute.
2.3. Coating morphological characterization
After deposition, one of the samples was cut in the reverse
side of the coating and mechanically cracked, in order to observe
its structure. Other sample was subject to metallurgical prepara-
tion, allowing accurately measuring the film thickness. In order
to carry out these observations, a FEI Quanta 400FEG scanning
electron microscope (SEM) provided with an EDAX Genesis X-ray
spectroscope (EDS) was used. Confirming the SEM morphological
analysis, atomic force microscopy (AFM) analyses were made using
the equipment and software above referred. 10 µm 10 µm and
50 µm 50 µm AFM analyses were made, using the tapping mode.
Hardness measurements were carried out in a micro-hardness
FischerscopeTM H100 equipment. Selected range load was 0–50 mN
and the maximum load was kept constant during 30 s (avoiding
creep phenomena). This equipment produces values chart that
allows obtaining ‘load-depth’ curves, conducting to hardness and
Young’s modulus values. Measurements were made using a Vickers
indenter.
Diamond, Al2O3 and SiC. Due to low film thickness, small grain
abrasive particles size was chosen. Two different SiC particles were
used, allowing comparing its performance in micro-abrasion wear
tests: the first one classified as F1000 by FEPA (Federation of Euro-
pean Producers of Abrasives), with average size particles of 5.5 µm
but large standard deviation and another one, F1200, with about
3.4 µm of average grain size and 1.4 µm of standard deviation. The
grain size and standard deviation of the different abrasive particles
used in this work is shown in Table 3.
Tests with five different durations were carried out, allowing
understanding micro-abrasion evolution and failure mechanisms,
before and after perforation. Then, attending the abrasivity of the
diamond, runs of 25, 50, 100, 200 and 400 revolutions were estab-
lished. Tests were performed three times for each duration and
abrasive.
Table 3
Abrasive particles grain size.
Material Average size (µm) Deviation (µm)
Diamond 1.0 0.6
Alumina 1.0 0.5
SiC F1000 5.5 4.5
SiC F1200 3.4 1.4
×
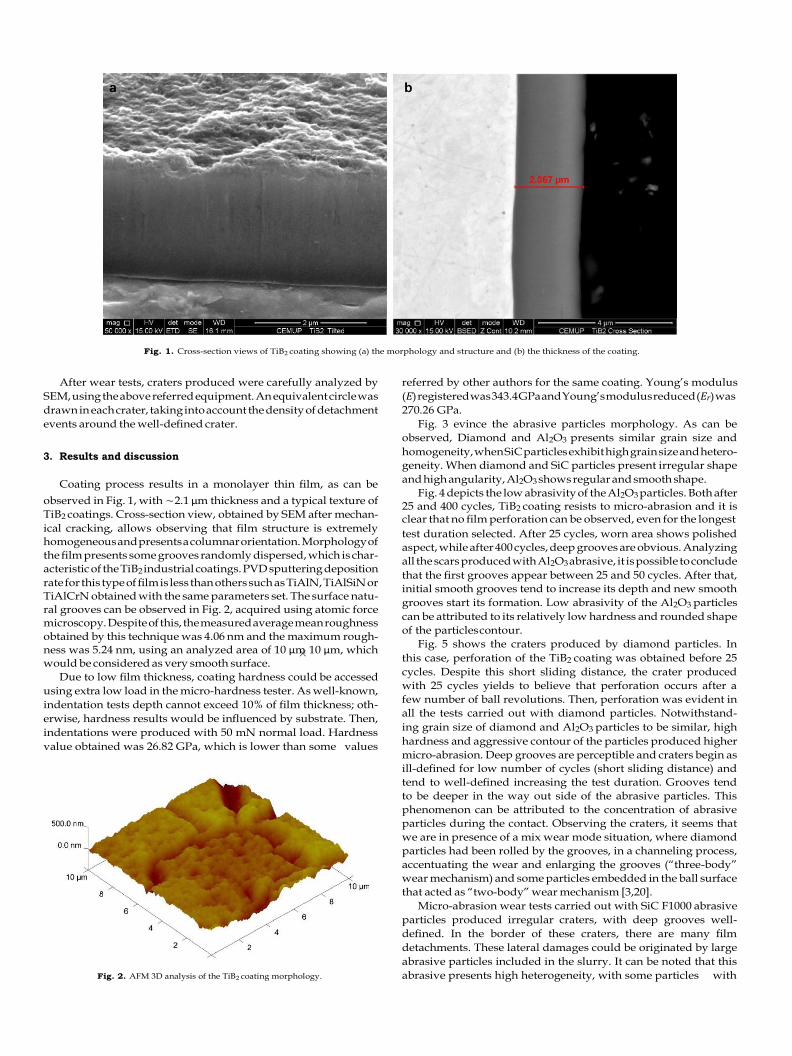
Fig. 1. Cross-section views of TiB2 coating showing (a) the morphology and structure and (b) the thickness of the coating.
After wear tests, craters produced were carefully analyzed by
SEM, using the above referred equipment. An equivalent circle was
drawn in each crater, taking into account the density of detachment
events around the well-defined crater.
3. Results and discussion
Coating process results in a monolayer thin film, as can be
observed in Fig. 1, with ∼2.1 µm thickness and a typical texture of
TiB2 coatings. Cross-section view, obtained by SEM after mechan-
ical cracking, allows observing that film structure is extremely homogeneous and presents a columnar orientation. Morphology of
the film presents some grooves randomly dispersed, which is char-
acteristic of the TiB2 industrial coatings. PVD sputtering deposition
rate for this type of film is less than others such as TiAlN, TiAlSiN or TiAlCrN obtained with the same parameters set. The surface natu- ral grooves can be observed in Fig. 2, acquired using atomic force microscopy. Despite of this, the measured average mean roughness
obtained by this technique was 4.06 nm and the maximum rough- ness was 5.24 nm, using an analyzed area of 10 µm 10 µm, which would be considered as very smooth surface.
Due to low film thickness, coating hardness could be accessed
using extra low load in the micro-hardness tester. As well-known,
indentation tests depth cannot exceed 10% of film thickness; oth-
erwise, hardness results would be influenced by substrate. Then,
indentations were produced with 50 mN normal load. Hardness
value obtained was 26.82 GPa, which is lower than some values
Fig. 2. AFM 3D analysis of the TiB2 coating morphology.
referred by other authors for the same coating. Young’s modulus
(E) registered was 343.4 GPa and Young’s modulus reduced (Er) was
270.26 GPa.
Fig. 3 evince the abrasive particles morphology. As can be
observed, Diamond and Al2O3 presents similar grain size and
homogeneity, when SiC particles exhibit high grain size and hetero-
geneity. When diamond and SiC particles present irregular shape
and high angularity, Al2O3 shows regular and smooth shape.
Fig. 4 depicts the low abrasivity of the Al2O3 particles. Both after 25 and 400 cycles, TiB2 coating resists to micro-abrasion and it is clear that no film perforation can be observed, even for the longest
test duration selected. After 25 cycles, worn area shows polished
aspect, while after 400 cycles, deep grooves are obvious. Analyzing
all the scars produced with Al2O3 abrasive, it is possible to conclude
that the first grooves appear between 25 and 50 cycles. After that,
initial smooth grooves tend to increase its depth and new smooth
grooves start its formation. Low abrasivity of the Al2O3 particles
can be attributed to its relatively low hardness and rounded shape
of the particles contour.
Fig. 5 shows the craters produced by diamond particles. In
this case, perforation of the TiB2 coating was obtained before 25
cycles. Despite this short sliding distance, the crater produced
with 25 cycles yields to believe that perforation occurs after a
few number of ball revolutions. Then, perforation was evident in
all the tests carried out with diamond particles. Notwithstand-
ing grain size of diamond and Al2O3 particles to be similar, high
hardness and aggressive contour of the particles produced higher
micro-abrasion. Deep grooves are perceptible and craters begin as
ill-defined for low number of cycles (short sliding distance) and
tend to well-defined increasing the test duration. Grooves tend
to be deeper in the way out side of the abrasive particles. This
phenomenon can be attributed to the concentration of abrasive
particles during the contact. Observing the craters, it seems that
we are in presence of a mix wear mode situation, where diamond
particles had been rolled by the grooves, in a channeling process,
accentuating the wear and enlarging the grooves (“three-body”
wear mechanism) and some particles embedded in the ball surface
that acted as “two-body” wear mechanism [3,20].
Micro-abrasion wear tests carried out with SiC F1000 abrasive
particles produced irregular craters, with deep grooves well-
defined. In the border of these craters, there are many film
detachments. These lateral damages could be originated by large
abrasive particles included in the slurry. It can be noted that this
abrasive presents high heterogeneity, with some particles with

Fig. 3. Abrasive particles morphology: (a) diamond, (b) alumina, (c) SiC F1000 and (d) SiC F1200 shown with the same magnification (5000×).
Table 4
Data corresponding to micro-abrasion wear tests.
Thickness [µm] Cycles SN Vc Vc Vs Vc + Vs SN/Vc Vs/Vc
2,1 [mm3] [mm3] [mm3] [mm3] [N m mm−3] AI2O3 25 0.49 5.39E−06
AI2O3 50 0.98 2.02E−05 AI2O3 100 1.96 3.31 E−05 AI2O3 200 3.93 4.44E−05 AI2O3 400 7.85 1.16E−04
Diamond 25 0.49 2.85E−04 2.71 E−04 1.39E−05 2.85E−04 1.81 E+03 5.11E−02
Diamond 50 0.98 4.02E−04 3.68E−04 5.47E-05 4.22E−04 2.67E+03 1.49E−01
Diamond 100 1.96 6.24E−04 5.94E−04 2.55E−04 8.49E−04 3.31 E+03 4.30E−01
Diamond 200 3.93 8.33E−04 8.48E−04 6.58E−04 1.51 E−03 4.63E+03 7.76E−01
Diamond 400 7.85 1.43E−03 1.44E−03 2.32E−03 3.76E−03 5.45E+03 1.61E+00
SiCF1200 25 0.49 5.82E−04 2.42E−04 8.24E−04 8.43E+02 4.15E−01
SiCF1200 50 0.98 6.74E−04 3.62E−04 1.04E−03 1.46E+03 5.38E−01
SiCF1200 100 1.96 9.41 E−04 8.52E−04 1.79E−03 2.09E+03 9.05E−01
SiCF1200 200 3.93 1.24E−03 1.63E−03 2.86E−03 3.18E+03 1.32E+00
SiCF1200 400 7.85 1.62E−03 3.02E−03 4.64E−03 4.85E+03 1.87E+00
SiCFIOOO 25 0.49 1.10E−03 1.23E−03 2.33E−03 4.47E+02 1.12E+00
SiCFIOOO 50 0.98 1.22E−03 1.58E−03 2.80E−03 8.05E+02 1.30E+00
SiCFIOOO 100 1.96 1.35E−03 2.01 E−03 3.37E−03 1.45E+03 1.49E+00
SiCFIOOO 200 3.93 1.84E−03 4.03E−03 5.87E−03 2.13E+03 2.19E+00
SiCFIOOO 400 7.85 2.32E−03 6.66E−03 8.98E−03 3.38E+03 2.87E+00
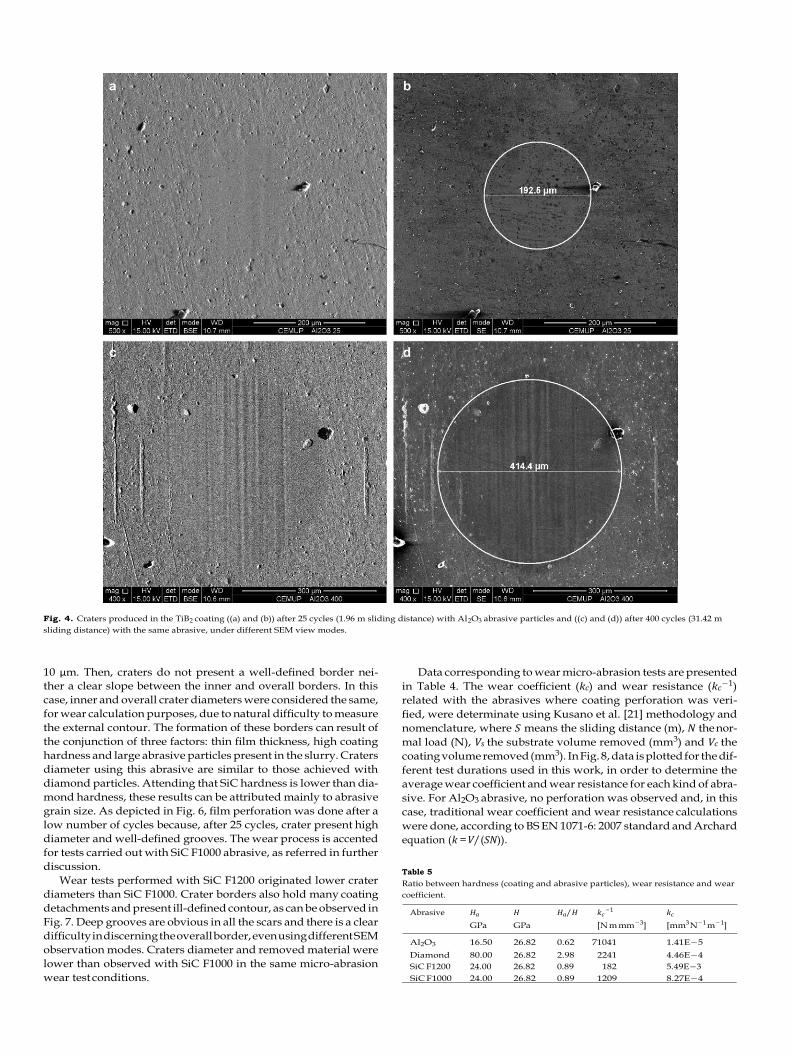
Fig. 4. Craters produced in the TiB2 coating ((a) and (b)) after 25 cycles (1.96 m sliding distance) with Al2O3 abrasive particles and ((c) and (d)) after 400 cycles (31.42 m
sliding distance) with the same abrasive, under different SEM view modes.
10 µm. Then, craters do not present a well-defined border nei-
ther a clear slope between the inner and overall borders. In this
case, inner and overall crater diameters were considered the same,
for wear calculation purposes, due to natural difficulty to measure
the external contour. The formation of these borders can result of
the conjunction of three factors: thin film thickness, high coating
hardness and large abrasive particles present in the slurry. Craters
diameter using this abrasive are similar to those achieved with
diamond particles. Attending that SiC hardness is lower than dia-
mond hardness, these results can be attributed mainly to abrasive
grain size. As depicted in Fig. 6, film perforation was done after a
low number of cycles because, after 25 cycles, crater present high
diameter and well-defined grooves. The wear process is accented
for tests carried out with SiC F1000 abrasive, as referred in further
discussion.
Wear tests performed with SiC F1200 originated lower crater
diameters than SiC F1000. Crater borders also hold many coating
detachments and present ill-defined contour, as can be observed in
Fig. 7. Deep grooves are obvious in all the scars and there is a clear
difficulty in discerning the overall border, even using different SEM
observation modes. Craters diameter and removed material were
lower than observed with SiC F1000 in the same micro-abrasion
wear test conditions.
Data corresponding to wear micro-abrasion tests are presented
in Table 4. The wear coefficient (kc) and wear resistance (kc−1)
related with the abrasives where coating perforation was veri-
fied, were determinate using Kusano et al. [21] methodology and
nomenclature, where S means the sliding distance (m), N the nor-
mal load (N), Vs the substrate volume removed (mm3) and Vc the
coating volume removed (mm3). In Fig. 8, data is plotted for the dif-
ferent test durations used in this work, in order to determine the
average wear coefficient and wear resistance for each kind of abra-
sive. For Al2O3 abrasive, no perforation was observed and, in this
case, traditional wear coefficient and wear resistance calculations
were done, according to BS EN 1071-6: 2007 standard and Archard
equation (k = V/(SN)).
Table 5
Ratio between hardness (coating and abrasive particles), wear resistance and wear
coefficient.
Abrasive Ha H Ha/H kc −1 kc
GPa GPa [N m mm−3] [mm3 N−1 m−1]
Al2O3 16.50 26.82 0.62 71041 1.41E−5
Diamond 80.00 26.82 2.98 2241 4.46E−4
SiC F1200 24.00 26.82 0.89 182 5.49E−3
SiC F1000 24.00 26.82 0.89 1209 8.27E−4

Fig. 5. Craters produced in the TiB2 coating ((a) and (b)) after 25 cycles (1.96 m sliding distance) with Diamond abrasive particles and ((c) and (d)) after 400 cycles (31.42 m
sliding distance) with the same abrasive, under different SEM view modes.
Fig. 6. Craters produced in the TiB2 coating (a) after 25 cycles (1.96 m sliding distance) with SiC F1000 abrasive particles and (b) after 400 cycles (31.42 m sliding distance)
with the same abrasive.

Fig. 7. Craters produced in the TiB2 coating (a) after 25 cycles (1.96 m sliding distance) with SiC F1200 abrasive particles and (b) after 400 cycles (31.42 m sliding distance)
with the same abrasive.
6000
5000
4000
3000
2000
1000
0
0,0 0,5 1,0 1,5 2,0
4000
3500
3000
2500
2000
1500
1000
500
0
y = 1591,5x - 1208,7 R² = 0, 9769
0,0 1,0 2,0 3,0 4,0
7000
6000
5000
4000
3000
2000
1000
0
y = 2207 ,4x + 2241,1
R² = 0,8961
0,0 0,5 1,0 1,5 2,0
SiC F1200 Vs/Vc SiC F1000 Vs/Vc Diamond Vs/Vc
Fig. 8. Wear coefficient for SiC F1000, SiC F1200 and Diamond abrasive particles.
Regarding Table 5, and relating abrasives similar grain size
(Al2O3 and Diamond), it can be observed that wear coefficient is
directly proportional to the “Ha/H” ratio, relating the abrasive har-
ness (Ha) with the coating hardness (H). These results are in line
with Hutchings work [22] but disagree with the conclusions drawn
by Shipway and Hogg [17] under different conditions. Then, and
attending that the same film is used for all the tests, it can be
referred that the hardness is the main factor acting in the micro-
abrasion wear system. Furthermore, the rounded shape of the
alumina abrasive particles contributes, surely, to lower abrasive
action than diamond particles.
When SiC abrasive particles are studied, presenting the same
“Ha/H” ratio, TiB2 coating presents lower wear resistance with SiC
F1200 than SiC F1000. These results show that lower dimension
of the SiC F1200 abrasive particles allows that a large number of
particles take part effectively in the contact zone, increasing the
micro-abrasion wear process. Large particles tend to turn around
the ball, rolling sometimes between the sample surface and the ball,
producing some damages in the overall border, but not participate
effectively in the load carrying process. This effect can be observed
regarding the crater borders produced with SiC particles, as referred
and showed above. Then, the wear resistance of the TiB2 coating is
six times higher for the SiC F1000 abrasive than SiC F1200.
4. Conclusions
After this work, some conclusion can be drawn, as following:
• Al2O3 abrasive particles shown low abrasivity, when
compared with remaining abrasives tested. This can be attributed to its relatively low hardness and particles rounded contour.
• Micro-abrasion wear tests performed with diamond particles presented well-defined craters. Diamond shown high abra-
sivity. However, craters produced by SiC particles F1000 as
well as F1200, are bigger than those formed by diamond
particles; • Heterogeneity of SiC particles used in this work, particu-
larly SiC F1000, revealed to be harmful to micro-abrasion
wear tests, resulting in ill-defined craters and lateral film
detachments; • The diameter of micro-abrasion wear craters and, consequently,
the volume of material removed, allows to conclude that
the hardness of the abrasive is very important but, there is
not the only factor to contribute to severe micro-abrasion
wear: when abrasive particles size increase, micro-abrasion
wear is higher, not depending absolutely of the abrasive
hardness; • More accurate results can be achieved in micro-abrasion tests
using, simultaneously, abrasives with high hardness and low
grain size.
Acknowledgments
Authors would like to thank INEGI, Instituto de Engenharia
Mecânica e Gestão Industrial (FE-UP). Authors also wish to thank
y = 2642x -
181,88
R² = 0,9 907
SN/V
c
SN/V
c
SN/V
c

Prof. Albano Cavaleiro and Dr. Manuel Evaristo (Ph.D.) of FCTUC for
microindentation facilities availability.
References
[1] M.G. Gee, A. Gant, I. Hutchings, R. Bethke, K. Schiffman, K. van Aker, S. Poulat, Y.
Gachon, J. von Stebut, Progress towards standardization of ball cratering, Wear
255 (2003) 1–13.
[2] M.G. Gee, M.J. Wicks, Ball crater testing for the measurement of the unlubri-
cated sliding wear of wear-resistant coatings, Surf. Coat. Technol. 133–134
(2000) 376–382.
[3] K. Adachi, I.M. Hutchings, Sensivity of wear rates in the micro-scale abra-
sion test to test conditions and material hardness, Wear 258 (2005) 318–
321.
[4] K. Adachi, K. Kato, N. Chen, Wear map of ceramics, Wear 203–204 (1997)
291–301.
[5] K. Kato, K. Adachi, Wear of advanced ceramics, Wear 253 (2002) 1097–
1104.
[6] R.I. Trezona, D.N. Allsopp, I.M. Hutchings, Transitions between two-body and
three-body abrasive wear: influence of test conditions in the microscale abra-
sive wear test, Wear 225–229 (1999) 205–214.
[7] R.I. Trezona, I.M. Hutchings, Three-body abrasive wear testing of soft materials,
Wear 233–235 (1999) 209–221.
[8] D.N. Allsopp, R.I. Trezona, I.M. Hutchings, The effects of ball surface condition
in the micro-scale abrasive wear test, Tribol. Lett. 5 (1998) 259–264.
[9] G.B. Stachowiak, G.W. Stachowiak, J.M. Brandt, Ball-cratering abrasion tests
with large abrasive particles, Tribol. Int. 39 (2006) 1–11.
[10] K. Adachi, I.M. Hutchings, Wear-mode mapping for the micro-scale abrasion
test, Wear 255 (2003) 23–29.
[11] K.L. Rutherford, I.M. Hutchings, A micro-abrasive wear test, with particular
application to coated systems, Surf. Coat. Technol. 79 (1996) 231–239.
[12] P.H Shipway, A mechanical model for particle motion in the micro-scale abra-
sion wear test, Wear 257 (2004) 984–991.
[13] C. Leroy, K.I. Schiffmann, K. van Acker, J. von Stebut, Ball cratering an effi-
cient tool for 3 body micro-abrasion of coated systems, Surf. Coat. Technol.
200 (2005) 153–156.
[14] K.I. Schiffmann, R. Bethke, N. Kristen, Analysis of perforating and non-
perforating micro-scale abrasion tests on coated samples, Surf. Coat. Technol.
200 (2005) 2348–2357.
[15] M.G. Gee, A.J. Gant, I.M. Hutchings, Y. Kusano, K. Sciffmann, K. van Acker, S.
Poulat, Y. Gachon, J. von Stebut, P. Hatto, G. Plint, Results from an interlab-
oratory exercise to validate the micro-scale abrasion test, Wear 259 (2005) 27–
35.
[16] M.F.C. Andrade, R.P.M. Martinho, F.J.G. Silva, R.J.D. Alexandre, A.P.M. Baptista,
Influence of the abrasive particles size in the micro-abrasion of TiAlSiN thin
coatings, Wear 267 (2009) 12–18.
[17] P.H. Shipway, J.J. Hogg, Wear of bulk ceramics in micro-scale abrasion––the role
of abrasive shape and hardness and its relevance to testing of ceramic coatings,
Wear 263 (2007) 887–895.
[18] F.J.G. Silva, A.J.S. Fernandes, F.M. Costa, V. Teixeira, A.P.M. Baptista, E. Pereira,
Tribological behaviour of CVD diamond films on steel substrates, Wear 255
(2003) 846–853.
[19] F.G. Silva, M.A. Neto, A.J.S. Fernandes, F.M. Costa, F.J. Oliveira, R.F. Silva, Adhe- sion and wear behaviour of NCD coatings on Si3N4 by micro-abrasion tests, J.
Nanosci. Nanotechnol. 9 (2009) 3938–3943.
[20] A.H. Jones, Micro-scale abrasive wear of silicon nitride, sialon–TiB2 com-
posites and D2 tool steel using a multiple load method, Wear 258 (2005) 942–
952.
[21] Y Kusano, K. van Acker, I.M. Hutchings, Methods of data analysis for the
micro-scale abrasion test on coated substrates, Surf. Coat. Technol. 183 (2004)
312–327.
[22] I.M. Hutchings, Tribology – Friction and Wear of Engineering Materials, Edward
Arnold, London, 1992.