Abrasion resistant concrete mix design for cold climates
113
Scholars' Mine Scholars' Mine Masters Theses Student Theses and Dissertations Fall 2019 Abrasion resistant concrete mix design for cold climates Abrasion resistant concrete mix design for cold climates Diane Mariah Murph Follow this and additional works at: https://scholarsmine.mst.edu/masters_theses Part of the Civil Engineering Commons Department: Department: Recommended Citation Recommended Citation Murph, Diane Mariah, "Abrasion resistant concrete mix design for cold climates" (2019). Masters Theses. 8005. https://scholarsmine.mst.edu/masters_theses/8005 This thesis is brought to you by Scholars' Mine, a service of the Missouri S&T Library and Learning Resources. This work is protected by U. S. Copyright Law. Unauthorized use including reproduction for redistribution requires the permission of the copyright holder. For more information, please contact [email protected].
-
Upload
khangminh22 -
Category
Documents
-
view
1 -
download
0
Transcript of Abrasion resistant concrete mix design for cold climates
Scholars' Mine Scholars' Mine
Masters Theses Student Theses and Dissertations
Fall 2019
Abrasion resistant concrete mix design for cold climates Abrasion resistant concrete mix design for cold climates
Diane Mariah Murph
Follow this and additional works at: https://scholarsmine.mst.edu/masters_theses
Part of the Civil Engineering Commons
Department: Department:
Recommended Citation Recommended Citation Murph, Diane Mariah, "Abrasion resistant concrete mix design for cold climates" (2019). Masters Theses. 8005. https://scholarsmine.mst.edu/masters_theses/8005
This thesis is brought to you by Scholars' Mine, a service of the Missouri S&T Library and Learning Resources. This work is protected by U. S. Copyright Law. Unauthorized use including reproduction for redistribution requires the permission of the copyright holder. For more information, please contact [email protected].

ABRASION RESISTANT CONCRETE MIX DESIGN FOR COLD CLIMATES
by
DIANE MARIAH MURPH
A THESIS
Presented to the Graduate Faculty of the
MISSOURI UNIVERSITY OF SCIENCE AND TECHNOLOGY
In Partial Fulfillment of the Requirements for the Degree
MASTER OF SCIENCE IN CIVIL ENGINEERING
2019
Approved by:
Jenny Liu, Advisor
Hongyan Ma
Billy Connor

2019
Diane Mariah Murph
All Rights Reserved

iii
ABSTRACT
Studded tire usage in Alaska contributes to rutting damage on pavements resulting
in high maintenance costs and safety issues. In this study, binary, ternary, and quaternary
highly-abrasion resistant concrete mix designs using supplementary cementitious
materials (SCMs) were developed. The properties of fresh concrete and mechanical, and
durability properties of hardened concrete for these mix designs were then tested to
determine an optimum highly-abrasion resistant concrete mixture which could be placed
in cold climates to reduce rutting damage. SCMs used included silica fume, ground
granulated blast furnace slag, and type F fly ash. Tests including workability, air content,
drying shrinkage, compressive strength, flexural strength, and chloride ion permeability
were conducted. Resistances to abrasion, freeze-thaw cycles, and scaling due to deicer
exposure were also measured followed by a preliminary cost analysis to compare
different concrete mix designs. Within the scope of this study a quaternary mix design,
containing primarily silica fume and slag, provided the overall best performance in terms
of strength, durability, abrasion resistance, and cost.

iv
ACKNOWLEDGEMENTS
First I would like to extend a special thank you to my advisor, Dr. Jenny Liu, for
her support, advice, and sharing her knowledge with me throughout my academic studies,
beginning in Fairbanks when I took her Properties of Materials course and lasting
throughout my graduate studies here in Rolla. She was very encouraging and helpful
whenever I needed guidance with research or course work. I would also like to thank Dr.
Hongyan Ma and Mr. Billy Connor for serving on my committee and providing timely
feedback and support throughout my study.
A special shout-out to the students and staff at University of Alaska Fairbanks
(UAF) and Missouri University of Science and Technology (S&T) who helped me in the
lab, especially Jason Cox, John Bullock, Alejandro Chavez, and Tristan Sayer. Thank
you also to Xavier Schlee and Heidi Schaefer for their patience, advice, and help with
securing research materials. I would also like to acknowledge Alaska Department of
Transportation and Public Facilities (DOT&PF) and the Center for Environmentally
Sustainable Transportation in Cold Climates who provided financial assistance. Lastly, I
would like to thank my family and friends throughout the United States and beyond.

v
TABLE OF CONTENTS
Page
ABSTRACT….. ................................................................................................................. iii
ACKNOWLEDGEMENTS ............................................................................................... iv
LIST OF ILLUSTRATIONS ............................................................................................. ix
LIST OF TABLES ............................................................................................................. xi
SECTION
1. INTRODUCTION ...................................................................................................... 1
1.1. PROBLEM STATEMENT ................................................................................ 1
1.2. OBJECTIVE ....................................................................................................... 2
1.3. RESEARCH METHODOLOGY ....................................................................... 2
1.3.1. Literature Review and Survey.. .................................................................. 2
1.3.2. Laboratory Testing and Optimization of Mix Design. ............................... 2
1.3.3. Preliminary Cost Analysis.. ........................................................................ 4
1.3.4. Final Report and Recommendations.. ......................................................... 4
2. LITERATURE REVIEW AND SURVEY ................................................................ 5
2.1. LITERATURE REVIEW ................................................................................... 5
2.1.1. Studded Tire Wear.. .................................................................................... 5
2.1.2. Concrete Properties.. ................................................................................... 6
2.1.2.1. Abrasion-resistance.. ............................................................................6
2.1.2.2. Deicers……. ....................................................................................... 8
2.1.2.3. Chloride ion penetration ....................................................................10

vi
2.1.2.4. Freeze-thaw resistance……………………………………………...11
2.1.2.5. High strength concrete.. .....................................................................14
2.1.3. Supplementary Cementitious Materials.. .................................................. 15
2.1.3.1. Silica fume ......................................................................................16
2.1.3.2. Fly ash…….. ......................................................................................18
2.1.3.3. Slag……….. ......................................................................................20
2.1.3.4. Ternary mixtures.. ..............................................................................21
2.1.3.5. Quaternary mixtures. ........................................................................ 23
2.2. SURVEY .......................................................................................................... 26
2.2.1. Concrete Pavements in Alaska.. ............................................................... 26
2.2.2. Potential Benefits and Drawbacks Regarding Concrete Pavements......... 30
3. SCREENING TESTS AND ANALYSIS ................................................................ 33
3.1. MATERIALS AND SPECIMEN PREPARATION ........................................ 33
3.1.1. Materials.. ................................................................................................. 33
3.1.2. Mixtures. ................................................................................................... 33
3.1.3. Mixing....................................................................................................... 35
3.1.4. Specimen Fabrications.. ............................................................................ 36
3.2. TESTING PROCEDURES .............................................................................. 37
3.2.1. Workability and Air Content.. .................................................................. 37
3.2.2. Compressive and Flexural Testing.. ......................................................... 38
3.3. RESULTS ......................................................................................................... 38
3.3.1. Workability. .............................................................................................. 38
3.3.2. Air Content. .............................................................................................. 40
vii
3.3.3. Compressive Strength. .............................................................................. 41
3.3.4. Flexural Strength. ..................................................................................... 44
3.4. DETERMINING THE OPTIMUM MIXTURE .............................................. 46
3.4.1. Minitab Method. ....................................................................................... 46
3.4.2. Excel Method.. .......................................................................................... 49
3.4.3. Results....................................................................................................... 52
4. PERFORMANCE TESTS AND RESULTS ............................................................ 55
4.1. MATERIALS AND SPECIMEN PREPARATION ........................................ 55
4.1.1. Materials.. ................................................................................................. 55
4.1.2. Mixtures.. .................................................................................................. 55
4.1.3. Mixing and Specimen Fabrication. .......................................................... 55
4.2. TESTING PROCEDURES .............................................................................. 57
4.2.1. Workability and Air Content. .................................................................. 57
4.2.2. Compressive Strength and Shrinkage. ..................................................... 58
4.2.3. Durability. ................................................................................................. 60
4.2.3.1. Abrasion resistance. ...........................................................................60
4.2.3.2. Freeze-thaw resistance. ......................................................................62
4.2.3.3. Scaling resistance of samples exposed to deicing chemicals.............63
4.2.3.4. Chloride ion penetration resistance. ...................................................64
4.3. RESULTS ......................................................................................................... 65
4.3.1. Workability and Air Content. .................................................................. 65
4.3.2. Mechanical Properties.. ............................................................................ 67
4.3.2.1. Compressive strength. ........................................................................67

viii
4.3.2.2. Drying shrinkage.. ..............................................................................68
4.3.3. Durability of Hardened Concrete.............................................................. 69
4.3.3.1. Abrasion resistance. ...........................................................................69
4.3.3.2. Scaling resistance after exposure to deicing chemicals. ................... 73
4.3.3.3. Freeze-thaw resistance. ......................................................................76
4.3.3.4. Chloride ion penetration resistance. ...................................................77
5. PRELIMINARY COST ANALYSIS....................................................................... 79
6. CONCLUSION ........................................................................................................ 83
APPENDIX…... ................................................................................................................ 87
BIBLIOGRAPHY ............................................................................................................. 89
VITA .............................................................................................................................. 100
ix
LIST OF ILLUSTRATIONS
Figure Page
2.1 Alaska DOT&PF three regions ................................................................................... 27
2.2 Atigun River No. 2 Bridge .......................................................................................... 29
2.3 Cracks on silica fume deck at Troublesome Creek Bridge ......................................... 31
3.1 Alaska fine aggregate gradation chart......................................................................... 34
3.2 Alaska intermediate aggregate gradation chart ........................................................... 34
3.3 Mixing and testing concrete ........................................................................................ 36
3.4 Preparing samples ....................................................................................................... 37
3.5 Compressive and flexural strength testing .................................................................. 39
3.6 Workability of each screening mixture ....................................................................... 40
3.7 Air content of each screening mixture ........................................................................ 41
3.8 Compressive strength (ksi) vs. time (days) at 4% and 8% silica fume ....................... 42
3.9 Compressive strength (ksi) of mixtures with 4% silica fume vs. time (days) ............ 43
3.10 Compressive strength (ksi) of mixtures with 8% silica fume vs. time (days) .......... 43
3.11 Average flexural strength of mixtures and their silica fume contents ...................... 45
3.12 Flexural strength (psi) of mixtures with 4% silica fume vs. time (days) .................. 45
3.13 Flexural strength (psi) of mixtures with 8% silica fume vs. time (days) .................. 46
3.14 Optimum mixture as determined by Response Optimizer for Mixture on Minitab .. 51
4.1 Missouri fine aggregate gradation chart ..................................................................... 56
4.2 Missouri intermediate aggregate gradation chart ........................................................ 56
4.3 Sample preparation ..................................................................................................... 58

x
4.4 Air meter ..................................................................................................................... 59
4.5 Measuring shrinkage ................................................................................................... 59
4.6 Testing abrasion by mass loss ..................................................................................... 60
4.7 Nordic Prall Test ......................................................................................................... 61
4.8 Freeze-thaw testing ..................................................................................................... 63
4.9 Preparing and testing deicing samples ........................................................................ 64
4.10 Testing chloride ion penetration .............................................................................. .66
4.11 Time (days) vs. length change (%) ........................................................................... 69
4.12 Mass loss of mixtures due to abrasion testing .......................................................... 70
4.13 Prall samples after testing ......................................................................................... 71

xi
LIST OF TABLES
Table Page
3.1 Base mix design .......................................................................................................... 35
3.2 Total cementitious material percent composition for each screening test mixture ..... 35
3.3 Constraints used (% cementitious material) ............................................................... 48
3.4 Models fit for each response ....................................................................................... 49
3.5 Response limits and importance ................................................................................. 50
3.6 Special cubic model coefficients for each response ................................................... 51
3.7 Excel versus Minitab optimum mixture ...................................................................... 52
3.8 Predicted value and desirability for each response in the optimum mixture .............. 52
3.9 Mixtures determined for performance testing............................................................. 53
4.1 Cementitious material percent composition for the optimal and control mixtures ..... 57
4.2 Prall results interpretation ........................................................................................... 62
4.3 ASTM C672 sample degradation ratings .................................................................... 65
4.4 Chloride ion penetrability based on charge passed ..................................................... 67
4.5 Workability and air content of optimum and control mixtures................................... 67
4.6 Compressive strength of optimum mixtures ............................................................... 68
4.7 28-day shrinkage per mixture ..................................................................................... 69
4.8 Prall test results ........................................................................................................... 72
4.9 Visual rating at 50 days............................................................................................... 74
4.10 Deicer scaling samples before and after 50 cycles ................................................... 75
4.11 Durability factor of each mix .................................................................................... 76

xii
4.12 Chloride permeability results .................................................................................... 77
5.1 Cost of materials in Anchorage, AK in June 2019 ..................................................... 79
5.2 Assumed construction cost for 2-lane rigid pavement using Control SL8 Mix ......... 81
5.3 Estimated cost of each alternative............................................................................... 82
1
1. INTRODUCTION
1.1. PROBLEM STATEMENT
Wearing course rutting that causes progressive loss of surface material is a typical
pavement distress occurring in the Central Region of Alaska and other northern states
such as Washington and Oregon (Zubeck et al., 2004). This type of pavement damage is
mainly due to the use of studded tires, which are thought to improve traction on compact
snow and ice, but also tend to wear away the pavement surface in the wheel path and
create safety issues such as depressions (Cotter and Muench, 2010). Millions of dollars in
road maintenance is expended annually to address surface course wear and deformation
of existing pavements (Malik, 2000; Zubeck et al., 2004). Using the best possible
materials and construction practices is essential to optimizing pavement service. This has
led to extensive research into developing numerous experimental features deployed
nationwide to evaluate various innovative concrete materials, and construction practices
for concrete that may yield better performance than traditional asphalt mixture, especially
for pavements that are more resistant to studded tire wear.
In Alaska, concrete has been used in heavy traffic areas such as some
intersections, portions of roads, and weigh-in-motion slabs on high-volume highways.
Currently there are new mix design technologies proposed to reduce rutting due to
studded tire wear, such as adding crumb rubber and steel fiber to concrete mixtures. In
the meantime, concrete with commonly used additives is already in production and
appears to be more durable and cost-effective. The key is to identify the optimum
concrete mix design, and produce and implement cost-effective, abrasion-resistant, and
2
durable concrete for cold region highway applications which are competitive with
flexible pavement in terms of performance.
1.2. OBJECTIVE
The objective of this research was to identify and select an abrasion-resistant
concrete mix design with good workability, mechanical properties, and durability which
could provide the longest service life.
1.3. RESEARCH METHODOLOGY
To meet the objective of this study, the following major tasks were completed:
• Literature review and survey
• Laboratory testing and optimization of mix design
• Preliminary cost analysis
• Final report and recommendations
1.3.1. Literature Review and Survey. A comprehensive literature search of
published materials (nationally and internationally) and on-going research projects on
relevant materials practice and construction techniques for improving abrasion resistance
and durability of concrete pavements was completed. In addition, interviews with
Alaskan materials suppliers, public works directors, contractors and Alaska DOT&PF
engineers was completed. A critical analysis of the practices and information collected
from these interviews was used in the development of the mix designs used in this study.
1.3.2. Laboratory Testing and Optimization of Mix Design. The key for
successfully using ternary mixtures is that a number of concrete mixes need to be

3
formulated and tested to ensure their performance; the proportions of various ingredients
should be tested to demonstrate that all the required concrete properties for a specific
project meet the requirements (Schlorholtz, 2004). Hence, optimizing and finalizing a
concrete mix design was completed by refining existing mix designs provided to Alaska
DOT&PF (the silica fume mix designs developed by Anchorage Sand & Gravel served as
a reference). This was achieved by producing different mixes with varying combination
and contents of SCMs (i.e. silica fume, fly ash and slag) currently used in ready-mix
applications. The experimental matrix was finalized upon discussions between the
research team and professionals from Alaska DOT&PF and the Alaska concrete industry.
Using primarily American Society for Testing and Materials (ASTM) standards, a series
of lab tests for fundamental engineering properties and durability performance of
concrete were conducted. These tests included:
• Workability (slump test for fresh concrete mixes, ASTM C143)
• Air content (ASTM C231 for Standard Air Meter and American Association of State
Highway and Transportation Officials (AASHTO) TP118 for Super Air Meter)
• Mechanical properties related tests
o compressive strength (ASTM C39)
o flexural strength (ASTM C78)
o shrinkage potential (ASTM C157)
• Durability tests
o wear resistance (ASTM C944 and Abrasion by Studs, Method A: Prall
Method)
o freeze-thaw cycling resistance (ASTM C666)

4
o resistivity – concrete’s ability to resist chloride ion penetration (ASTM C1202)
o frost scaling resistance after freezing-thawing cycle (ASTM C672)
All mechanical properties were tested at 7, 14, and 28 days. In addition, as a basic
performance indicator, compressive strength was tested at one and three days as well to
capture the early age characteristics of the material and to compare results at standard test
ages, such as the 28 day test age. The effects of design parameters on mechanical
properties were investigated to narrow the selection of parameters and determine the
optimum mix designs.
Durability tests were conducted at 28 days except freeze-thaw (F-T) cycling
resistance which was tested at 14 days as per ASTM C666. The air content of the
screening test mixtures was measured using a Super Air Meter following AASHTO
TP118. The air content of the performance test mixtures were measured using an Air
Meter and ASTM C231.
1.3.3. Preliminary Cost Analysis. A preliminary cost analysis was used to
estimate and compare the costs of constructing a concrete pavement in Alaska using the
optimum mix designs.
1.3.4. Final Report and Recommendations. A final report was completed upon
the completion of the previous tasks. The report included a summary of literature review
and survey responses, descriptions of procedures and results from the laboratory testing,
the optimization process for determining the optimum mixture designs and a preliminary
cost analysis comparing the optimum concrete mixtures determined through the analysis.
The project’s findings were also outlined and future areas of research were
recommended.

5
2. LITERATURE REVIEW AND SURVEY
2.1. LITERATURE REVIEW
A literature was completed which reviewed studded tire wear rates in Alaska and
their effects on pavement. The properties of concrete relating to abrasion-resistance and
strength, as well as the effects on concrete from deicer exposure, chloride ion penetration,
and F-T cycles, were reviewed. A summary on supplementary cementitious materials
(SCMs), including fly ash, slag and silica fume, was also completed.
2.1.1. Studded Tire Wear. Studded tires degrade pavements, cause rutting and
depressions (Zubeck et al., 2004), and contribute to dust emissions (Kupiainen and
Pirjola, 2011). Studded tires also help improve driving safety on snow and ice and have
been found to have a positive impact on Alaska’s economy (Zubeck et al., 2004).
Without studded tires crash rates have been found to increase. One Norwegian study
found that a 25% decrease in studded tire usage correlated with a 5% increase in crashes
(Elvik et al., 2013). If 25-50% of vehicles use studs, safety is improved for both studded
and non-studded vehicle by limiting ice buildup and road polishing (Do et al., 2007).
Estimates in Washington State put studded tire wear rates on concrete pavements at 0.01
per million studded tire vehicle passes (Cotter and Muench, 2010).
Studded tire use, by Alaska State Law, is allowed only from September through
either May or April, depending on location (Alaska Statutes, 2018). Despite seasonally
limits on studded tire usage, pavement rutting due to studded tire wear is still a problem.
1992-1993 Anchorage investigations on rutting rates found that 67-78% more rutting
occurred during the winter than the summer (Frith et al., 2004). Frith et al. (2004)

6
estimated that if studded tire wear rates were minimized, pavement longevity in
Anchorage and Juneau could be extended by 40% and 90%, respectively, which could
potentially result in substantial construction and maintenance cost savings.
Recent measurements by Abaza et al. (2019) in Anchorage found studded tire
usage to be 35%, suggesting usage rates have dropped since the earlier 53% rate
determined by Zubeck et al. (2004). These decreases are partially due to technological
advances and increased usage of studless tires and all-season tires. The costs associated
with studded tire damage in Alaska is estimated to be $13.7 million, over 40 times the
State of Alaska’s revenue from studded tire sales and installations (Abaza et al., 2019).
2.1.2. Concrete Properties. There are numerable factors which can affect a
concrete’s resistance to abrasion, deicer scaling, chloride penetration, and F-T cycles.
Some of the research regarding these factors is summarized below.
2.1.2.1. Abrasion-resistance. Numerous environmental and design factors can
affect a concrete pavement’s performance in the field. One important parameter for
concrete pavements is their ability to resist abrasion from studded tires especially in
Alaska where ruts can sometimes exceed 25 mm (Zubeck et al., 2004). In general it has
been found that rigid pavements have lower wear rates, as shown by research in Oregon
which found that asphalt pavements had wear rates over four times those of concrete
pavements (Brunette and Lundy, 1996). Other research by Lundström et al. (2009)
measured rutting on 19 test sections of rigid, semi-rigid and flexible pavements on a
Swedish road. Similar to Alaska, Sweden allows studded tires only during certain times
of the year. After seven years, rutting from abrasion averaged 1.7 mm on rigid
pavements, 3.4 mm on semi-rigid and 3.1 mm on flexible pavements.

7
One factor which affects abrasion resistance is the water to cementitious material
(w/c) content. Liu (1981) found that reducing the w/c ratio from 0.72 to 0.40 improves
72-hour abrasion resistance by 43% and recommends both hard aggregates and a low w/c
ratio be used for good abrasion resistance. Compressive strength should also be
considered. Liu (1981) also found a positive correlation between 72-hour compressive
strength and abrasion resistance.
A substantial amount of research has been done on measuring the abrasion
resistance of concrete mixtures containing SCMs. When looking into the effects of
adding slag, Fernandez and Malhotra (1990) tested the abrasion resistance of air-
entrained concrete mixes containing slag at 25% and 50% replacement levels at w/c
ratios of 0.45, 0.55, and 0.70. The slag mixes, no matter their w/c ratio or slag content,
had lower abrasion resistance than the control. This lower resistance was assumed to be
partially due to the low compressive strength of the slag mixtures.
Researchers have also investigated the effect of adding fly ash to concrete and its
effect on abrasion resistance. Harwalkar and Awanti (2014) tested the abrasion resistance
and compressive strength of 60% class F fly ash samples with a 0.3 w/c ratio versus two
all-cement mixes with w/c ratios of 0.3 and 0.35. Following the Australian MA20 test
method, which is similar to ASTM C779, 28 day abrasion resistance was measured. The
fly ash mixes were found to have 90% the abrasion resistance of the control mixes.
Naik et al. (1995) found that as the air content of mixtures containing fly ash
increased, compressive strength decreased, but that compressive strength played a larger
role in abrasion resistance rendering the impact of air content insignificant. When testing
abrasion resistance at 28, 91, and 365 days, resistance was found to decrease with age.
8
Similarly Yen et al. (2007) also found that by reducing w/c ratio and increasing
compressive strength, the abrasion resistance of class F fly ash mixes increased. After
testing mixtures containing 15, 20, 25, and 30% fly ash, the 15% fly ash mix had similar
abrasion resistance to the control while the mixtures with fly ash contents over 15% had
lower abrasion resistance than the control.
Atiş (2002) tested the abrasion resistance of mixtures containing higher
replacement levels of fly ash at 50% and 70% and found the fly ash mixtures had higher
abrasion resistance than the control. A positive correlation was also found between
compressive strength and abrasion resistance. The effects of using a superplasticizer on
the mixtures was also investigated and was found to not significantly impact results.
Rashad et al. (2014) tested the abrasion resistance of eight binary, ternary and
quaternary high-volume fly ash mixtures over 180 days. For each mix the 70% fly ash
content was partially replaced with either slag or silica fume or equal parts both.
Although the all-cement control mix had the highest abrasion resistance, the quaternary
mix of fly ash, slag, and silica fume, as well as the ternary mixture of fly ash and silica
fume, did have improved abrasion resistance over the binary fly ash mix. The ternary
mixtures of slag and fly ash had the lowest compressive and abrasive resistance. Similar
to Liu (1981) a strong correlation was found between compressive strength and abrasion
resistance (R2=0.93, using a polynomic equation). To improve both the compressive
strength and abrasion resistance in high volume fly ash mixtures, the authors suggest
adding silica fume with or without slag, but not just slag due to its poor performance.
2.1.2.2. Deicers. F-T cycles deteriorate concrete due to the exposure of deicing
salts on the surface of the concrete, which results in scaling and internal cracking (Pigeon
9
et al., 1996). Deicers degrade concrete pavements by interfering with cement-aggregate
interactions, resulting in chemical reactions between the cement and deicers (Shi et al.,
2009). Having entrained air in concrete reduces deterioration due to F-T cycles and
improves salt scaling resistance. This is possible by allowing water within the concrete to
move into pores and expand, reducing potential stress. Each concrete slab has a critical
air void spacing factor at which internal cracking can be mitigated. This spacing is the
distance between particles in the paste and the nearest air void. Shon et al. (2018)
investigated this spacing in binary and ternary mixes of fly ash and silica fume and found
the critical air-void spacing to be 200 and 300 microns for binary and ternary mixtures,
respectively. Although the air void spacing within a concrete system is important, Jin et
al. (2013) found that the air void size-distribution has a larger effect on F-T resistance.
Research has found the addition of some SCMs, such as metakaolin, silica fume and slag,
also contribute to a more reasonable air void size-distribution (Duan et al., 2013).
Nehdi et al. (2004) testing the scaling resistance of binary, ternary and quaternary
self-compacting concrete (SCC) mixes with and without viscosity modifying admixtures
(VMA). SCMs investigated included fly ash, slag, silica fume, and rice husk ash. The
control performed the best, followed by the ternary mix with a VMA. The other ternary
and quaternary mixes also performed well. The binary fly ash mix without a VMA
performed the worst, with six times the average cumulative mass loss of the other mixes.
Whiting (1989) used ASTM C672 to investigate the effects of scaling due to
deicer salt exposure when replacing cement with 0, 25, and 50% fly ash. Fly ash samples
were found to have higher levels of scaling over the all-cement control. A lower w/c ratio
was also found to improve scaling resistance. Pigeon et al. (1996) corroborated this,
10
noting that in general fly ash tends to decrease concrete’s resistance to salt scaling,
whereas when slag is added, researchers have mixed results.
2.1.2.3. Chloride ion penetration. Concrete is exposed to chlorides in various
ways including from exposure to deicing salts or marine environments. When chlorides
ingress into concrete this can reduce durability by corroding the reinforcing steel. To
investigate a concrete’s resistance to chloride permeability, lab tests are used to predict
field performance. Tempest et al. (2017) investigated the chloride permeability of
mixtures prepared in the lab and in the field and found good correlation between the two.
Chung et al. (2010) investigated binary mixtures containing either 10% silica
fume or 20% fly ash. The effects of varying air content to 2, 4 or 6%, as well as varying
w/c ratios of 0.4, 0.5, or 0.6 were investigated as well. Duplicate samples were made of
which half were exposed to 300 F-T cycles before testing their chloride penetration.
Afterwards both the F-T samples, and samples which hadn’t been tested, were placed in
salt solutions and their chloride ion penetration was measured. As the air content and w/c
of samples increased, the chloride penetration increased as well. Samples which had been
exposed to F-T cycles were also found to have higher permeability than samples which
had not. As the age of the samples increased, the chloride ion penetration was reduced.
The addition of fly ash was found in all but one case to reduce the chloride penetration
while the addition of silica fume reduced permeability even further.
Investigations into the effects of air entrainment on the chloride permeability of
concrete mixtures exposed to F-T cycles found that irrespective of air entraining
admixture (AEA) content, the permeability of all-cement concrete mixes varied widely as
samples were exposed to over 600 F-T cycles (Saito et al., 1994). Conversely, when AEA

11
was added to mixtures containing fly ash or slag to obtain minimum air contents of 5.3%
and 3.4%, respectively, changes in permeability after exposure to F-T cycles was
minimal, but substantial increases in permeability, of two to four times the initial
permeability, were seen in SCM mixtures without an AEA.
Nehdi et al. (2004) studied SCC binary, ternary and quaternary mixes containing
various SCMs. Chloride ion penetration was measured at 28 and 91 days. At 28 days all
the SCM mixtures had low to moderate penetration of 1,000-4,000 Coulombs while the
control had a high penetration of over 4,000 Coulombs. By 91 days the penetration rates
decreased and the SCM mixtures had very low penetration (less than 1,000 Coulombs)
while the control mix had moderate penetration (2,000-4,000 Coulombs).
Yang et al. (2017) tested binary mixtures containing either 40% slag or fly ash
with 0.42 and 0.50 w/c ratios. They also investigated different wet curing times by wet
curing samples for two, five and eight days before dry curing. Chloride permeability was
tested at 28 and 360 days. The lowest permeability was seen in samples wet cured for
eight days, followed by those cured for five and two days. Regarding the effects of
SCMs, overall the slag mixtures had the lowest permeability, followed by the fly ash
mixtures, and lastly the control.
2.1.2.4. Freeze-thaw resistance. To minimize the effects of frost action and F-T
cycles on concrete AEAs are usually added to the paste during mixing. Naturally
occurring entrapped air voids are too large and spaced too far apart to provide such
benefits (Bassuoni and Nehdi, 2005). Unfortunately the addition of an AEA usually
results in reduced strength, and although AEAs decreases the number of large pores, their
addition does not decrease total porosity (ACI, 2012).

12
Air entrained (AE) concrete is used in cold regions to help mitigate the effects
internal cracking and pressure due to entrapped water. When microscopic air bubbles are
formed inside the concrete, water can move to these areas, which allow them to freeze
and expand, and subsequently reduce the pore pressure of the pores within the concrete.
This reduced potential pressure then contributes towards mitigating cracking and other
durability issues. The chemical mechanisms which occur when adding AEAs to fresh
concrete to improve the F-T durability are complex, and innumerable factors including
the materials used, mixing procedure, and type of AEA used effect the final air content
(Du and Folliard, 2005). The two main processes necessary for entrainment include the
formation of the air bubbles and subsequently their stability as the concrete hardens. A
minimum air content of 6% was found to provide adequate air entrainment (Wang et al.
2009).
The downside to adding an AEA to increase air content is reduced compressive
strength. For example, Zhang et al. (2018) found that when adding AEAs to normal
concrete to obtain up to a 5% air content, compressive strength was not affected, but once
the air content surpassed 7%, compressive strength was reduced significantly. They also
found that the compressive strength of the fly ash mixtures investigated were even more
severely affected by high air contents. Additional AEA has been found to be necessary
for mixtures containing fly ash compared to that of an all-cement mix, but if too much
AEA is added this may result in air voids combining to form bigger voids which reduce
permeability and durability. Therefore care should be taken when determining proper
dosage of an AEA especially in mixtures containing SCMs. In addition, for every 1%
AEA added, a 5% decrease in strength can be expected (Korhonen, 2002).
13
To investigate the effects of SCMs on the F-T resistance of concrete, Bleszynski
et al. (2002) placed concrete slabs consisting of binary and ternary mixes of slag and
silica fume on a road in Ontario which heavy trucks used. The slabs were exposed to both
deicer salts and annual F-T cycles. Overall the ternary blends had improved durability
over both the plain portland cement concrete (PCC) and binary mixes.
The ASTM 666 testing method measures the F-T durability of samples. Shon et
al. (2018) tested 14 mixtures including binary mixtures containing 5% silica fume and up
to 45% class F fly ash, as well as ternary mixtures containing both. Two duplicates of
each ternary mixture were made, one with an AEA and one without. At 14 days, the
compressive strength of the binary silica fume mixture had the highest strength, followed
by the binary fly ash mixtures, and then the ternary mixtures. Non-air-entrained (Non-
AE) mixtures had higher compressive strength than those with. As fly ash content
increased, compressive strength decreased. Concerning the durability factor, which is
determined based on the RDME value and the cycles passed, the ternary AE mixtures
performed the best while the non-AE ternary mixtures generally had the lowest durability
factors. The durability factor ranges from 0-100% and is indicative of the concrete’s
durability. A higher durability factor is indicative of a high resistance to F-T cycles
whereas a lower durability factor suggests a resistance to F-T cycles.
Toutanji et al. (2004) investigated the F-T resistance of 14-day cured SCM mixes.
16 mixes were tested including binary mixes of 8-15% silica fume, 60-80% slag, or 20-
30% fly ash, as well as ternary mixes of fly ash and slag, and quaternary mixes
containing all three SCMs. Of the 13 mixes, the control had the highest durability factor
(which was 89.7%), followed by the 8% silica fume (34.9%), 70% slag (26.5%), and the

14
quaternary mixes. Binary fly ash mixes performed the worst, with binary slag mixtures
performing slightly better. Despite the high durability of the 8% silica fume mix, the 15%
silica fume mix had the second-lowest durability factor. Overall the quaternary mixes
performed better than the binary mixes with the authors concluding that the combination
of SCMs may have resulted in a more stabilized mix with better F-T resistance.
Chung et al. (2010) tested binary mixes of 10% silica fume or 20% fly ash with
w/c ratios of 0.4, 0.5, or 0.6 and 2, 4, or 6% air content. After ASTM 666 F-T testing all
mixes had durability factors over 95%. Nonetheless the silica fume mixes performed
slightly better than the fly ash mixes, potentially due to the early pozzolanic reactions of
silica fume, which contribute to early age strength. The varying air content did not seem
to affect the durability factor. Another study found that using steel-fiber reinforced crumb
rubber could be a solution to combat pavement deterioration in high-traffic areas due to
F-T action (Abaza and Aboueid, 2018). The steel-fiber reinforced rubber concrete
developed was found to have improved frost-resistance over the standard PCC tested.
Although researchers use F-T testing to predict how concrete will perform, Mehta
(1991) argues that laboratory F-T tests are more extreme than what would occur in the
field. F-T tests expose the concrete too early to freezing, and don’t always predict the
concretes field performance, especially for samples which test poorly.
2.1.2.5. High strength concrete. High strength concrete, which usually have
strengths exceeding 6000 pounds per square inch (psi), typically has a w/c ratio less than
0.4 (Mehta, 1999). To achieve workability at these lower w/c ratios, a water reducer is
used. A lower w/c ratio results in lower permeability, which is the key to durability
against aggressive environments. Good workability is also important and allows for better
15
pumping and filling of forms. This can then save constructions costs, especially on large
projects and those with tight reinforcing spacing. A high cement content can also cause
thermal cracking, but by using mineral admixtures this effect can be lessened. High
strength concrete can also be made from using high volumes of fly ash with a low w/c
ratio. For example, one mixture containing almost 60% fly ash and a w/c of 0.288 had
low early strength of 1200 psi at one day but 12000 psi at 28 days (Malhotra et al., 1994).
2.1.3. Supplementary Cementitious Materials. To minimize rutting and
pavement degradation, SCMs can be added. For structural applications, the Alaska
DOT&PF Highway Construction manual (2017) requires limiting the combination of two
or more SCMs to a combined 40% replacement level. Individual replacement levels are
limited to 35% fly ash, 40% slag, and 10% silica fume. For concrete pavement highway
construction in Alaska, no standards exist, but for airport concrete pavement, construction
standards do exist. In rigid airport pavement, fly ash content is limited to a 20%, and
concrete is required to be designed to meet a 28-day 735 psi flexural strength.
Many SCMs, including fly ash, silica fume and slag, are pozzolanic and contain
high amounts of amorphous silica and alumina. When added to hydrating cement the
silica and alumina in pozzolans react with calcium hydroxide (CH) products to product
additional strength-contributing products such as calcium silicate hydroxides. If properly
proportioned and cured, these products help improve ultimate strength and durability,
reduce shrinkage and improve resistance to chemical shrinkage and ASR (Shi and Day,
2001). As the reactivity of an admixture increases, so does the early age strength of the
concrete (Li and Zhao, 2003). Silica fume’s pozzolanic reactivity is 1.29, fly ash’s is
0.875, and ground granulated blast furnace slag’s (GGBFS) is 0.040 (Khan et al. 2014).

16
This pozzolanic reactivity was determined through the Chapelle test, which measures the
pozzolanic activity based on the CH consumed after being placed in a diluted slurry of
the pozzolan. Swamy (1997) emphasizes the importance of moist curing for concrete
mixtures containing either fly ash or slag. Without proper curing samples usually don’t
achieve their target 28-day strength.
2.1.3.1. Silica fume. Due in part to their high amorphous silica content and small
size, silica fume particles act as pozzolans, helping to improve long term strength and
durability. Size varies, but a rough estimate puts the diameter of a silica fume particle at a
tenth of a micron (Aïtcin, 2016). Because of their small size, with a 15% cement
replacement level, there are approximately two million silica fume particles for each
cement particle (Cohen et al., 1990). Although the addition of silica fume helps improve
strength through increased packing density and pozzolanic reactions, its limitation would
be its price point of roughly 10 times the cost of cement (Ženíšek et al., 2016).
At lower w/c ratios, silica fume has been found to help mitigate chemical attacks
due to decreased permeability and reduced CH content (ACI, 2012). Silica fume also
improves resistance to alkali-silica reaction (ASR), and electrical resistivity. Higher
electrical resistivity potentially reduces corrosion of reinforcing steel placed in concrete
with silica fume (ACI, 2012). Mehta (1985) exposed concrete samples containing 15%
silica fume to six different acids and sulfates. Of the six, concrete containing silica fume
had improved chemical resistance over the control for all solutions except ammonium
sulfate. Similar results were found in the field when measuring the chlorine penetration
on the IL 4 bridge in Illinois. The deck overlay containing 10% silica fume had higher
resistance to chloride penetration than the control (Detwiler et al., 1997).

17
Adding silica fume typically increases water demand and particle packing due to
its high surface area of 15,000-25,000 m2/kg, which is over triple that of cement particles
(King, 2012). To maintain a low w/c ratio, water reducers can be added. When using
silica fume, a low w/c ratio is “the single most important factor” (Jahren, 1983).
When mixing, silica fume should be mixed in as soon as possible to ensure
dispersion throughout the mix and for particles to wet (Jahren, 1983). Because the
addition of silica fume results in a sticky paste, slump should also be increased 20 to 30
millimeters in order to maintain a similar workability to all-cement mixtures (Jahren,
1983). When using silica fume, the AEA demand increases 125% to 150% (ACI, 2012).
Because of the fineness of silica fume particles, the heat of hydration is increased
(ACI, 2012). At higher w/c ratios (such as 0.50), silica fume accelerates cement hydration
while at lower w/c ratios (such as 0.35) the addition of silica fume retards both the start of
hydration and the acceleration period (Langan et al., 2002).
As silica fume content increases, bleeding decreases (ACI, 2012). This is in part
due to the increase in fines which increases cohesiveness, and the high surface area of the
silica fume particles which get coated in water (Panjehpour et al., 2011). Although
bleeding is reduced, shrinkage cracking may increase since the water may evaporates
faster than the concrete bleeds, leaving behind a drier surface (ACI, 2012). Due to
concerns over increasing shrinkage and cracking at early stages, it is important to ensure
proper curing during early stages, since the addition of silica fume has been found to
contribute to autogenous shrinkage (Jensen and Hansen, 1996).
When simulating a concrete culvert wall, Kanstad et al. (2001) found that silica
fume mixtures had only marginally lower risks of cracking over the control. Whiting et

18
al. (2000) also found little difference in long term cracking between mixtures with and
without silica fume, with slightly higher cracking observed during the early ages of the
silica fume mixtures. They recommend a 6-8% silica fume content and also recommend
moist curing bridge decks for at least seven days to mitigate cracking. The curing method
is also important. Jahren (1983) found that when silica fume mixtures were wet cured this
resulted in higher tensile and compressive strengths over those dry cured.
The primary purpose of silica fume is to increase durability which is achieved by
reducing permeability (ACI, 2012). Silica fume improves compressive strength,
particularly at 28 days (Siddique, 2011). The addition of silica fume has been found to
decrease abrasion resistance but the use of coarse aggregates and the w/c ratio has been
found to have a larger effect (Laplante et al., 1991). Regarding the dosage, Toutanji et al.
(2004) determined the optimum dosage for silica fume to be 8% after investigating the
compressive strength and F-T resistance of binary, ternary and quaternary mixtures
containing 8-15% silica fume with fly ash and slag.
2.1.3.2. Fly ash. Fly ash is a byproduct of coal combustion. When coal is burned
various byproducts are produced including fly ash, which is carried into the air during
combustion and collected. There are two types of fly ash: Class C and F. Their class is
determined by the sum of their SiO2, Al2O3, and Fe2O3 oxides. For class C the sum of
these oxides should be at least 50% of their chemical composition. For class F, a
minimum of 70% content is required (ASTM, 2019). The optimum fly ash content for 28-
day and 180-day compressive strength was determined to be 40%, which Oner et al.
(2005) determined after testing class F fly ash samples at various w/c ratios of 0.50-0.94
and at replacement levels of 15-58%.
19
Harwalkar and Awanti (2014) tested the abrasion resistance and strength of
samples with 60% class F fly ash and a 0.3 w/c versus two all-cement mixtures with w/c
ratios of 0.3 and 0.35. The fly ash mixture had lower compressive and flexural strengths
at seven, 28, and 90 days. Substantial strength gains occurred after seven days, due to the
slow pozzolanic reaction. By 90 days the fly ash mixture’s strength was almost identical
to the 0.3 w/c all-cement mix.
When testing mixtures containing 40-50% class F fly ash at 28 days, the
compressive, splitting tensile, flexural strength and abrasion resistance of the mixtures
containing fly ash were all lower than the all-cement control (Siddique, 2004). The fly
ash mixtures later age strength, which was measured over one year, did increase due to
the late age pozzolanic reactions, but even after a year the strength of the fly ash mixture
samples did not surpass the control. Due in part to their late age strength gains, using high
volumes of fly ash in concrete can produce strong, durable concrete for use.
The calcium content of a fly ash best predicts its performance in concrete
especially in respect to the heat of hydration and mitigating ASR and sulfate attack
(Thomas et al., 2007). With each 10% fly ash cement replacement, water demand is
reduced roughly 3% (Thomas et al., 2007). Due to the reduced water demand, bleeding is
reduced. If water is not reduced when fly ash is added, bleeding will increase. If properly
proportioned, drying shrinkage is reduced due to the lower w/c.
The addition of fly ash retards the initial and final set times of fresh concrete,
which could be detrimental in cold climates. The use of fly ash also reduces the heat of
hydration, and improves the long term flexural and tensile strength due to the pozzolanic
reactions. If cured properly, the addition of fly ash helps reduce permeability. If fly ash

20
mixes are exposed to F-T cycles and deicers, its replacement levels should be limited
(Thomas et al., 2007).
2.1.3.3. Slag. Using slag as an SCM helps improve durability, increases
resistance to chlorides and sulfates, and reduces ASR (Hooton, 2000). Slag replacement
levels usually do not exceed 50%, but one study which used 78% slag content with a 0.28
w/c ratio found the strength to be only 1900 after one day, but 13000 psi at 28 days, with
high resistance to salt scaling and F-T cycles (Lang and Geisler, 1996). When using up to
60% slag replacement, initial and final setting times are increased (Özbay et al., 2016). In
addition to later set times, the use of slag has been shown to increase the amount and rate
of bleeding, which is primarily due to delays in the hydration and formation of hydration
products. Researchers have also found that using GGBFS may lead to increased thermal
expansion and autogenous shrinking, higher flexural strengths after seven days, and
reduced permeability due to the reactions with CH and alkalis (Özbay et al., 2016).
Fernandez and Malhotra (1990) tested the abrasion resistance of AE samples
containing 0, 25 and 50% slag at w/c ratios of 0.45, 0.55, and 0.70. Mixtures containing
slag had lower seven-day compressive strengths due to slag’s slow rate of hydration. By
28 and 91 days mixtures containing 25% slag had similar compressive strengths to the
control, but when replacing cement with 50% slag the compressive strength dropped
lower than the control. When testing abrasion resistance, the slag mixtures, no matter
their w/c ratio or slag content, had lower abrasion resistance than the control mixtures,
which the authors attributed to the low compressive strength of the slag mixtures. When
testing chloride ion penetration it was found that at higher slag contents, permeability was
reduced substantially, irrespective of the w/c ratio. This was attributed to the smaller
21
pores in the slag concrete versus the all-cement control. The optimum replacement level
for using slag in cement for maximum compressive strength was determined to be 55%
(Oner et al., 2005). This being said, slag is usually added at 25-50% replacement levels to
mitigate ASR expansion (Bleszynski et al., 2002).
2.1.3.4. Ternary mixtures. In part due to the small size of fly ash and silica
fume particles, using these SCMs together can reduce concrete permeability by filling in
open pores between cement particles (Shon et al., 2018). Mehta and Gjørv (1982) found
that when replaced 30% of cement volume with fly ash, compressive strength was lower
than the control at three, seven, and 28 days, but was similar at 90 days. When using a
30% silica fume replacement, and changing the aggregate proportions to improve
workability, the compressive strength of the silica fume mixes were higher than the
control at all ages. When replacing cement with both 15% silica fume and 15% fly ash,
the early age compressive strength at three and seven days was similar to the control, but
by 28 and 90 days, the compressive strength of the ternary mixture had exceeded the
control’s strength. Mehta and Gjørv (1982) concluded that using a ternary mixture of
both fly ash and silica fume may provide superior results over a binary fly ash mix.
Shehata and Thomas (2002) tested various mixtures containing high and low
alkali cements, silica fume, and different types of fly ash with varying amounts of
calcium. Twenty mixes, all with a 0.5 w/c ratio, were tested including five all-cement
control mixes, eight 15-60% binary fly ash mixtures, a binary 5% silica fume mix, and
six ternary mixtures containing 10-30% fly ash with 5% silica fume. Expansion was
measured over two years. The control mixtures had the highest expansion while the
addition of 5% silica fume alone did not mitigate expansion. The addition of fly ash or

22
both fly ash and silica fume did reduce expansion. For fly ash samples, irrespective of the
silica fume content, two-year expansion decreased as fly ash content increased.
Langan et al. (2002) investigated the cement hydration of binary silica fume or fly
ash mixtures, as well as a ternary mixture of 10% silica fume and 20% fly ash. They
found the addition of silica fume alone at high w/c ratios increased hydration, but at
lower w/c ratios, hydration was retarded. The addition of silica fume increased the
dormant period, reduced the acceleration period, and increased the deceleration period.
As the w/c ratio increased, silica fume reactivity accelerated. In the binary fly ash
mixtures as the w/c ratio increased, the retardation effect increased, whereas in the
ternary mixtures hydration was found to be significantly retarded.
Khan (2003) investigated the permeability of binary and ternary mixtures
containing up to 40% fly ash and up to 15% silica fume. Understanding this relationship
is important for as a concrete’s permeability increases, durability decreases. The addition
of silica fume was found to decrease permeability at all ages up to 180 days regardless of
fly ash content. Optimum silica fume content was determined to be 8-12%. The addition
of fly ash minimally reduced permeability and porosity, while the addition of silica fume
greatly reduced these characteristics. The largest effects were seen in silica fume
replacement levels up to 10% after which effects leveled off. When considering strength
and porosity, ternary mixtures containing both silica fume and fly ash performed better
than either alone. These results corroborated with the ACI 234-06 Report (2012), which
noted that using both silica fume and fly ash together works better than either alone.
When silica fume is combined with slag it has been found to have higher
resistance to sulfate attack, and lower permeability and chloride diffusivity (ACI, 2012).

23
Scholz and Keshari (2010) looked into developing an abrasion-resistant concrete mix for
the Oregon Department of Transportation using silica fume, fly ash, and slag. They found
that a slag and silica fume combination had better durability, compressive strength and
abrasion resistance over a fly ash and silica fume combination.
To investigate the effects of combining slag and fly ash in a ternary mix, Hale et
al. (2008) tested 12 mixes using three different cements. For each cement type an all-
cement control, binary mixes containing 15% fly ash or 25% slag, and a ternary mix of
both 15% fly ash and 25% slag were tested. They found the fly ash mixtures had
improved workability, higher air contents, and later set times over those containing slag.
The slag mixes overall had improved compressive strength, modulus of rupture, and
modulus of elasticity values over the fly ash mixes. The authors concluded the addition of
slag had overall positive effects while the addition of fly ash had mixed effects.
2.1.3.5. Quaternary mixtures. Gesoğlu and Özbay (2007) tested 22 binary,
ternary and quaternary SCC mixtures containing slag, fly ash, and silica fume at a 0.32
w/c ratio. Fly ash and slag was added at 20, 40, and 60% replacement levels while silica
fume was dosed at 5, 10, and 15% replacement levels. The addition of SCMs were found
to improve fresh properties by reducing slump flow time. Binary mixtures of fly ash or
slag were found to have retarded set times while binary silica fume mixtures had earlier
set times. Fly ash mixtures also had lower compressive strength while ternary slag and
silica fume mixtures had strengths exceeding those of the control. The addition of SCMs
also generally improved electrical resistance.
Gesoğlu et al. (2009) later studied the same 22 mixtures this time with a 0.32 w/c
ratio. For 90-day compressive strength, mixtures containing fly ash generally had lower

24
compressive strengths, while the binary and ternary mixes containing silica fume, slag, or
both had higher compressive strengths similar to the control. The addition of silica fume
was found to increase the superplasticizer demand which then increased viscosity. For
both chloride and water permeability it appeared that the addition of SCMs reduced
permeability. An optimum mix based on the experimental results was determined.
Parameters required a low chloride permeability, electrical resistivity, sorptivity, water
permeability, and shrinkage. This mix was determined to contain (by cementitious mass)
approximately 1.2% fly ash, 43% slag, 14% silica fume, and 1.4% superplasticizer.
Li and Zhao (2003) tested an all cement-mix, a binary 40% fly ash mix, and a
ternary 25% fly ash and 15% slag mix. At 28 days the binary fly ash mix had the lowest
compressive strength, but after one year its compressive strength had exceeded both the
ternary and all-cement mixtures with the binary fly ash mix having a one year strength of
107 MPa, the all-cement measuring 96 MPa, and the ternary mix measuring 99 MPa.
When comparing the early-age hydration of the mixes at seven days, the ternary mixture
had increased early age hydration and no un-hydrated particles visible, whereas for the
binary fly ash mix, hydration was retarded and many un-hydrated particles were visible.
After immersing samples in H2SO4 and measuring their compressive strength, the ternary
mix performed the best, with higher relative strength over the all-cement control and
binary fly ash mixtures.
Nehdi et al. (2004) investigated the durability properties of seven SCC mixtures
including binary mixtures of 50% class F fly ash or 50% slag, ternary mixtures of 25%
slag and 25% fly ash, and quaternary mixtures containing 20% slag, 24% fly, and either
6% silica fume or rice husk ash. Rice husk ash is a pozzolan formed from burning rice

25
husks. The ternary slag and fly ash mixture had the highest compressive strength at 28
and 91 days at over 45 MPa, but lower early age strength than the control. The 50% fly
ash mixture and the quaternary silica fume mixtures had the lowest 91 day compressive
strength values of less than 30 MPa. When chloride ion penetration was measured at 28
days all of the mixtures had low to moderate penetration except the control which had a
high penetration rating. By 91 days the control had moderate penetration while the SCM
mixtures had very low penetration. Testing on the effect of deicing salt scaling after F-T
cycles found that the binary fly ash mixture which didn’t contain a VMA performed the
worst, while adding the VMA greatly improved its resistance. The visual rating of the
scaling was the best for the all-cement mix and the ternary mixture containing a VMA.
Expansion over nine months when submerged in a sulfate solution found the control had
the highest expansion (0.13%) followed by the ternary mixtures (0.05%), with the
quaternary mixtures the lowest (0.01%). The researchers concluded that replacing high
volumes of cement caused decreased early age strength, but ternary and quaternary
mixtures result in much lower chloride ion penetrability.
Kim et al. (2016) tested binary, ternary, and quaternary mixtures containing slag,
fly ash, and silica fume with contents ranging from 25-65%, 15-30%, and 5%,
respectively. Of all the samples, the binary mixture containing 5% silica fume had the
highest compressive strength, splitting tensile strength, modulus of elasticity, and
Poisson’s ratio. The authors attribute this to silica fume’s small particle size which can
fill the voids between the larger cement, fly ash, and slag particles.
Rashad et al. (2014) tested binary mixtures with 70% fly ash, ternary mixtures
with 50-60% fly ash and either 10-20% silica fume or slag, and quaternary mixtures with

26
fly ash, silica fume, and slag. Supplementing concrete with 70% fly ash reduced
compressive strength by 66% at 28 days and 38% at 180 days. At all ages, from seven to
180 days, the control mixture had the highest 180-day compressive strength at over 60
MPa. Following this, binary fly ash mixtures, and quaternary and ternary mixtures
containing silica fume all had similar strength at 180 days of 35 to 40 MPa. Samples
containing 10-20% slag had the lowest compressive strength at 180 days.
2.2. SURVEY
Alaska DOT&PF material engineers and lab technicians, a bridge engineer,
researchers, private contractors, concrete suppliers, and public work directors in Alaska
were surveyed about their experience regarding concrete pavements in Alaska and efforts
made to combat abrasion resistance in concrete pavements. Because there are few
concrete pavements in Alaska, to gain perspective from a state which regularly installs
concrete pavements, two Wisconsin Department of Transportation (WisDOT) pavement
engineers were also surveyed.
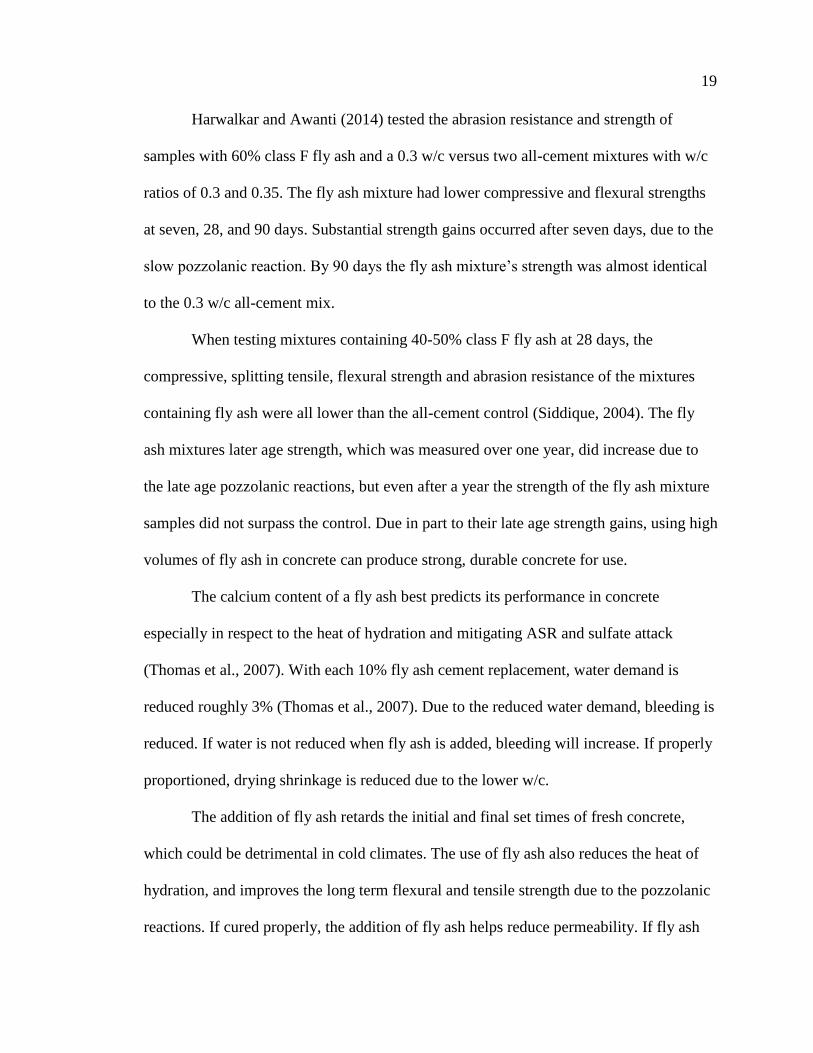
2.2.1. Concrete Pavements in Alaska. There are few concrete pavements in
Alaska. In Alaska’s central region (Figure 2.1), there are some concrete intersections in
Anchorage including the high-traffic intersections at 5th street and E street, and 6th street
and F street (Johnson, 2019), as well as some low traffic intersections in residential areas
(Schlee, 2019). The Anchorage International Airport, at one point had concrete
pavement, but is being repaved with asphalt, but there are some concrete hardstands at
the Anchorage airport where planes park (San Angelo, 2019). In the northern region of
Alaska the only places where concrete and vehicle tire wheels intersect is on bridge decks
27
and some weigh in motion slabs (Currey, 2018). There are some concrete pavements at
both the Ft. Wainwright Airport (Mappa, Inc., 2018), and at the Fairbanks International
Airport, where there are also concrete hardstands for planes (San Angelo, 2019). The
Eielson Airport was also concrete but has been paved over (Connor, 2019).
In southcoast Alaska there are concrete pavements in communities including
Petersburg, Wrangell and Ketchikan (Harai, 2019; San Angelo, 2019). Ketchikan had
concrete roads as early as the 1960s (Connor, 2019), and although some remain, many
have been paved over with asphalt (Hilson, 2019). In Wrangell there are around a half
Figure 2.1 Alaska DOT&PF three regions (Alaska DOT&PF website
dozen streets paved with concrete with all but the main street around 20 years old
(Howell, 2019). The only concrete road Wrangell has redone is the main street in 2011,
which now contains fiberglass fibers and was redone after 37 years of service.
Magnesium chloride deicers are applied each winter to the pavements there with no
reported durability issues (Howell, 2019).

28
One concrete pavement many respondents mentioned is the 1600 foot long main
street in Petersburg. The public works director during its construction, Hagerman (2019),
cited longevity and cost as the reason concrete was chosen. Asphalt is expensive in
Petersburg because there is no local hot mix asphalt (HMA) plant. In addition when the
pavement needs patching, concrete can be drawn from a local concrete plant. The main
street of Petersburg has been paved with concrete since the 1960s, and was first replaced
in 1985 and later in 2012. The 2012 design consisted of a six inch class A-A concrete
with a two day required compressive strength of 2500 psi and a 1½ pounds per cubic yard
dosage of synthetic fiber reinforcement. A class A-A concrete is a “concrete where
improved strength and durability is required” (Alaska DOT&PF, 2017). Sand was
provided the first winter to mitigate use of deicers, but deicers have been used since with
no major deterioration (Hagerman, 2019).
Although they are not highway pavements, there are eight weigh-in-motion
(WIM) slabs located throughout Alaska near Anchorage, Fairbanks, Tok, and Soldotna.
Many of the WIM slabs have a concrete surface. Gartin and Saboundjian (2005)
measured the rut depth of two PCC WIM slabs in Anchorage and compared their rutting
to nearby asphalt pavements of the same age and traffic. The PCC surfaces of WIM sites
at Tudor Road and Minnesota Road had 29% and 38% less rut depth, respectively, than
the nearby asphalt pavements measured. The mix designs of the WIMs was unavailable,
but a 2010 mix design of the WIM slab near Tok found it to be a class A 6.5-sack mix
with a 4500 psi design strength and a 0.36 w/c ratio (Mack, 2010). Rutting rates also vary
by region, with minimal reported rutting problems in the northern region of Alaska
(Currey, 2018).

29
Most concrete bridges in Alaska are paved with asphalt to protect the concrete
(Marx, 2019). There are some bare concrete bridge decks including those on the Dalton
Highway and in some low-traffic rural areas (Marx, 2019). One example of a bare deck
would be the Atigun River No. 2 Bridge on the Dalton Highway which was built in 2000.
Almost 20 years later tine marks are still visible (Figure 2.2). Many of the bridges built in
the 1940s also have bare concrete decks. Typically though bridges are overlaid with
asphalt so once the asphalt is damaged, decks can easily be repaired (Marx, 2019).
Alaska is one of eight states which have no reported concrete arterial or collector
roads (FHWA, 2018). Therefore to better understand other state DOT’s experiences with
concrete pavements, pavement engineers at WisDOT were surveyed. In Wisconsin 11%
of public arterial or collector roads are concrete (FHWA, 2018). At WisDOT when
Figure 2.2 Atigun River No. 2 Bridge (Alaska DOT&PF Bridge Section, 2018)
determining the appropriate pavement surface for a site, a 50-year LCCA is first
performed (Harings, 2019). The lowest cost alternative is used, unless the results are
within 5% at which point the engineer decides. Overall concrete typically has a higher

30
initial cost, but at a certain depth of HMA, costs tend to equalize. In general in larger
cities, where the AADT exceeds around 8,000, concrete is used (Harings, 2019), since
concrete pavements also tend to have higher structural capacity (Kemp, 2019).
Although a project may initially use concrete pavement, by around the third
rehabilitation the concrete is overlaid with asphalt typically due to joint failure (Harings,
2019). Wisconsin has not allowed studded tires since the 1970s (Kemp, 2019), except for
postal, buses, out-of-state and emergency vehicles in the winter (Wisconsin State
Legislature, 2017). WisDOT Pavement Engineer Harings noted he had never heard of
rutting with concrete but longitudinal cracking does occur around the wheel path. There
is also typically no premature rutting in their HMA. WisDOT concrete mix designs
usually consist of a 6-sack concrete mix supplemented with fly ash, although silica fume
and slag are allowed. Fly ash is usually added to decrease costs, with the added benefit of
improved curing. The biggest problem reported regarding concrete pavements is the
joints, which tend to deteriorate first. To limit panel cracking WisDOT has been reducing
panel lengths from 18-22 feet to 15 feet. Overall Kemp noted they’ve had “pretty good
success with concrete pavements.”
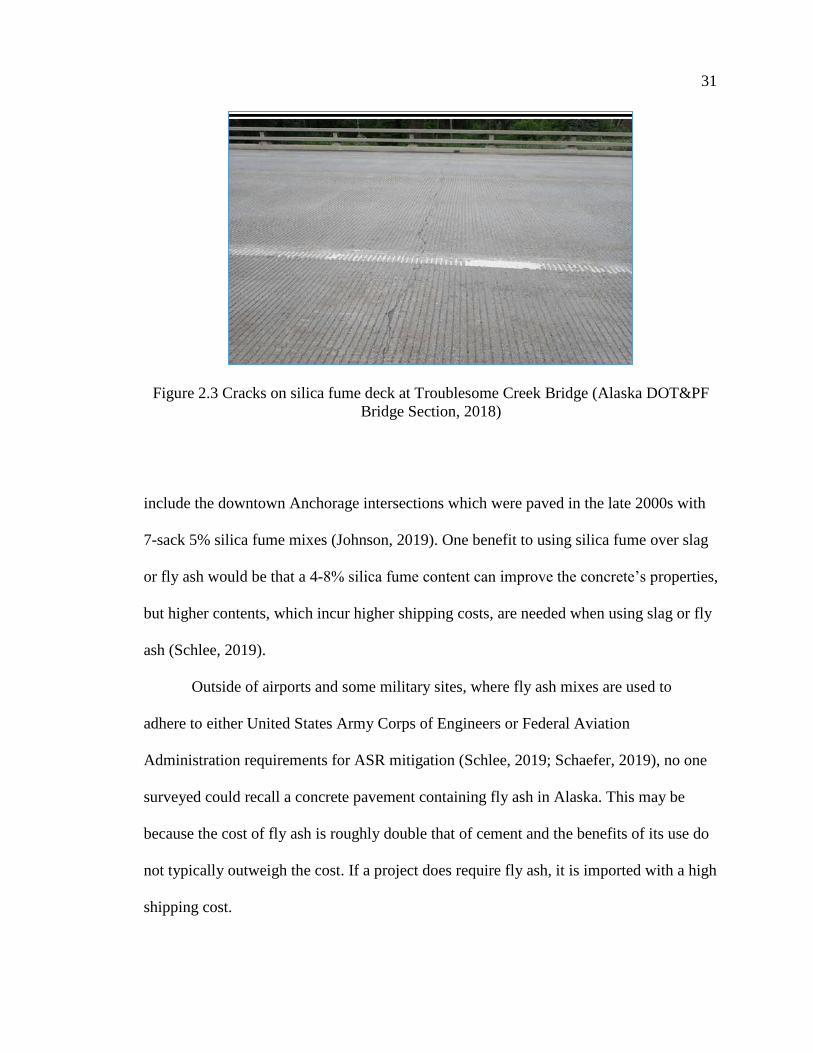
2.2.2. Potential Benefits and Drawbacks Regarding Concrete Pavements.
Most concrete mixes in Alaska do not contain silica fume, slag, or fly ash. However
there are some cases where silica fume was used. A silica fume concrete mix used to be
used on bridges decks, but this practice has been abandoned because the silica fume
mixes were expensive, heavy, and tended to crack (Figure 2.3). Within the last decade
this practice has been replaced by using polyester synthetic concretes, which do not
shrink or crack (Marx, 2019). Other projects which used silica fume in their mixes
31
Figure 2.3 Cracks on silica fume deck at Troublesome Creek Bridge (Alaska DOT&PF
Bridge Section, 2018)
include the downtown Anchorage intersections which were paved in the late 2000s with
7-sack 5% silica fume mixes (Johnson, 2019). One benefit to using silica fume over slag
or fly ash would be that a 4-8% silica fume content can improve the concrete’s properties,
but higher contents, which incur higher shipping costs, are needed when using slag or fly
ash (Schlee, 2019).
Outside of airports and some military sites, where fly ash mixes are used to
adhere to either United States Army Corps of Engineers or Federal Aviation
Administration requirements for ASR mitigation (Schlee, 2019; Schaefer, 2019), no one
surveyed could recall a concrete pavement containing fly ash in Alaska. This may be
because the cost of fly ash is roughly double that of cement and the benefits of its use do
not typically outweigh the cost. If a project does require fly ash, it is imported with a high
shipping cost.
32
There is one operating surface coal mine in Alaska, the Usibelli Coal mine, which
supplies six coal plants ("Statewide Socioeconomic Impacts of Usibelli Coal Mine, Inc.",
2015) and produce fly ash as a byproduct. Unfortunately the fly ash produced at these
plants cannot be used in concrete due to its high unburnt carbon content (Sonafrank,
2010). Marx (2019) noted there may be one coal-burning facility which could produce fly
ash clean enough for use in concrete, but using it is likely not feasible. Although fly ash
could be burned again for concrete use, doing so is likely not economical given the
limited quantity of cement used in Alaska.
Similar challenges were cited when asked if slag was used. Because of shipping
costs, slag is usually not used even if it is free (San Angelo, 2019). Schlee did note that
slag typically costs less than fly ash, but is still more expensive than cement. For both fly
ash and slag he said that when slag was used, it was used to mitigate ASR, and not to
improve durability. The only reported location of a slag cement being used was at Fort
Wainwright, which is near Fairbanks. These 5.5-sack mixes, used for airport paving, had
a 0.40 w/c ratio and a 40% slag content. A recent 2018 visual inspection on four of these,
aged 2-10 years, found no durability issues related to F-T cycles (Mappa Inc., 2018).

33
3. SCREENING TESTS AND ANALYSIS
Initial screening tests to determine the fresh properties, compressive strength, and
flexural strength of 10 mixes were conducted. Based on the results, four optimal mixtures
were determined. These mixtures were then used for further performance testing.
3.1. MATERIALS AND SPECIMEN PREPARATION
Screening test mixes included binary silica fume mixes and ternary silica fume
mixes with slag or fly ash. Specimens were mixed and fabricated using ASTM standards.
3.1.1. Materials. Cementitious materials included type I/II cement, class F fly
ash, GGBFS, and BASF MasterLife SF100 silica fume. The AEA used was BASF
microair AE200, and the high range water reducer (HRWR) used was BASF Glenium
1466. Aggregate consisted of fine and intermediate-sized particles. Following ASTM
C136, multiple sieve analyses were performed (Figures 3.1 and 3.2). The fineness moduli
of the intermediate and fine aggregates were 6.0 and 3.0, respectively. Intermediate
aggregate was cleaned with a #200 sieve and oven dried. The moisture content of the fine
aggregate was measured regularly to maintain a consistent w/c ratio.
3.1.2. Mixtures. Using the initial mix design (Table 3.1) the w/c ratio, AEA
dosage, and aggregate ratios remained constant, but the SCMs and their replacement
levels were changed. The HRWR dosage was also altered depending on the batch to
maintain workability. All mixes had a cement factor of 7.0 with a 0.331 w/c ratio. The
original mix design was used in the field on the 2012 King Salmon Main Runway
Rehabilitation project by Anchorage Sand and Gravel in King Salmon, Alaska. In total 10

34
Figure 3.1 Alaska fine aggregate gradation chart
Figure 3.2 Alaska intermediate aggregate gradation chart
mixes were tested (Table 3.2). For silica fume, the equivalent dosage of either a full or
half 50-lb bag of silica fume per cubic yard concrete was used, equivalent to 3.8% or
0
20
40
60
80
100
0.1 1 10 100
per
cent
pas
sing (
%)
sieve opening (mm)
0
20
40
60
80
100
0.01 0.1 1 10 100
per
cent
pas
sing (
%)
sieve opening (mm)

35
7.6% mass of cementitious material. The remaining cementitious material consisted of
either 25% or 40% fly ash or GGBFS. These SCM replacement levels are commonly
used and were recommended by professionals in the Alaska concrete industry.
Table 3.1 Base mix design
Constituent Quantity Unit Cementitious Material (% mass)
Type I Cement 611 lb 92
Silica fume 50 lb 8
Intermediate aggregate 1826 lb
Fine aggregate 1248 lb
Water 252.5 lb
AEA 14.8 mL
HRWR 1956 mL
AEA = air entraining admixture. HRWR = High range water reducer admixture.
Table 3.2 Total cementitious material percent composition for each screening test mixture
Mix
(No.) Cement
(%) Silica fume (SF)
(%) Slag (SL)
(%) Class F fly ash (FA)
(%)
1. SF8 (base) 92 8 0 0
2. SF4 96 4 0 0
3. SF4 SL38 58 4 38 0
4. SF4 FA24 72 4 0 24
5. SF8 SL37 55 8 37 0
6. SF4 SL24 72 4 24 0
7. SF4 FA38 58 4 0 38
8. SF8 FA37 55 8 0 37
9. SF8 SL23 69 8 23 0
10. SF8 FA23 69 8 0 23
3.1.3. Mixing. The same mixing procedure was used for each batch. First
aggregate was mixed with 75% of the water for five minutes. Then silica fume was added

36
and mixed for five minutes, followed by the remaining cementitious material. The
HRWR was then added and mixed for two minutes, followed by the AEA for two
minutes. Workability (slump) was then measured (Figure 3.3a). If workability was poor,
additional HRWR was added to improve it. Batches, with the exception of a few smaller
ones, were all made in the same mixer (Figure 3.3b). Once an appropriate slump was
achieved, air content was measured (Figure 3.3c).
(a) Slump (b) Drum mixer (c) Super air meter
Figure 3.3 Mixing and testing concrete
3.1.4. Specimen Fabrications. After mixing and testing fresh properties of
mixes, molds were filled per ASTM C192. Four by eight inch cylindrical molds were
filled in two equal layers, rodded 25 times, and hit with an open palm 10-15 times after
each layer. Excess cement was struck off. The concrete surface was then smoothed over
and covered. To fill the molds for measuring flexural strength, six by six by 21 inch beam

37
molds were filled in two equal layers. After each layer the concrete was rodded 60 times,
and each side tapped 15 times with a mallet. After filling, excess concrete was struck off
and the surface was smoothed over (Figure 3.4a). Samples were then covered. The
following day samples were removed from their molds (Figure 3.4b), labeled, and cured
in lime saturated water (Figure 3.4c).
(a) Finishing samples (b) Covering samples (c) Samples curing
Figure 3.4 Preparing samples
3.2. TESTING PROCEDURES
The testing procedures used for measuring the workability, air content,
compressive strength, and flexural strength are summarized below.
3.2.1. Workability and Air Content. To measure workability, ASTM C143 was
followed. The mold was filled in three equal layers. After each layer the mold was
tamped 25 times. Excess cement was struck off, the mold removed, and slump was
measured.

38
To measure the air voids of the fresh cement, AASHTO method TP 118-17
(2017) was followed using a Super Air Meter (Figure 3.3c). The mold and instruments
were wetted beforehand. Cement was then added in three equal layers. After each layer
the chamber was rodded 25 times and tapped 10-15 times with a mallet. Excess cement
was then struck off, the lid secured, and water was added through the petcocks. The
pressure was then increased to 14.5, 30, and 45 psi before releasing the pressure and
repeating. Afterwards concrete was disposed of.
3.2.2. Compressive and Flexural Testing. To measure compressive strength
ASTM C39 was followed. Cylinders were loaded at 35 psi per second until failure
(Figure 3.5a). For the flexural test a modified version of ASTM C78 was used. The 14
day and 28 day beams for the control mix (SF8) were broken using a force method of
1800 pounds per minute. Due to safety concerns the remaining beams were broken using
a displacement method with a rate of 0.0002 inches per second (Figure 3.5b).
3.3. RESULTS
The results of workability, air content, compressive strength, and flexural strength
for all ten mixtures were collected.
3.3.1. Workability. Despite adding additional HRWR to some mixes to maintain
workability, workability still varied. As shown in Figure 3.6, workability decreased as the
silica fume content increased. This is not surprising given the high surface area of silica
fume particles which in turn increases water demand (ACI, 2012). Al-Amoudi et al.
(2011) also found the addition of silica fume, when compared to an all-cement mix,
required an increase in water to maintain similar workability, while Mazloom et al.
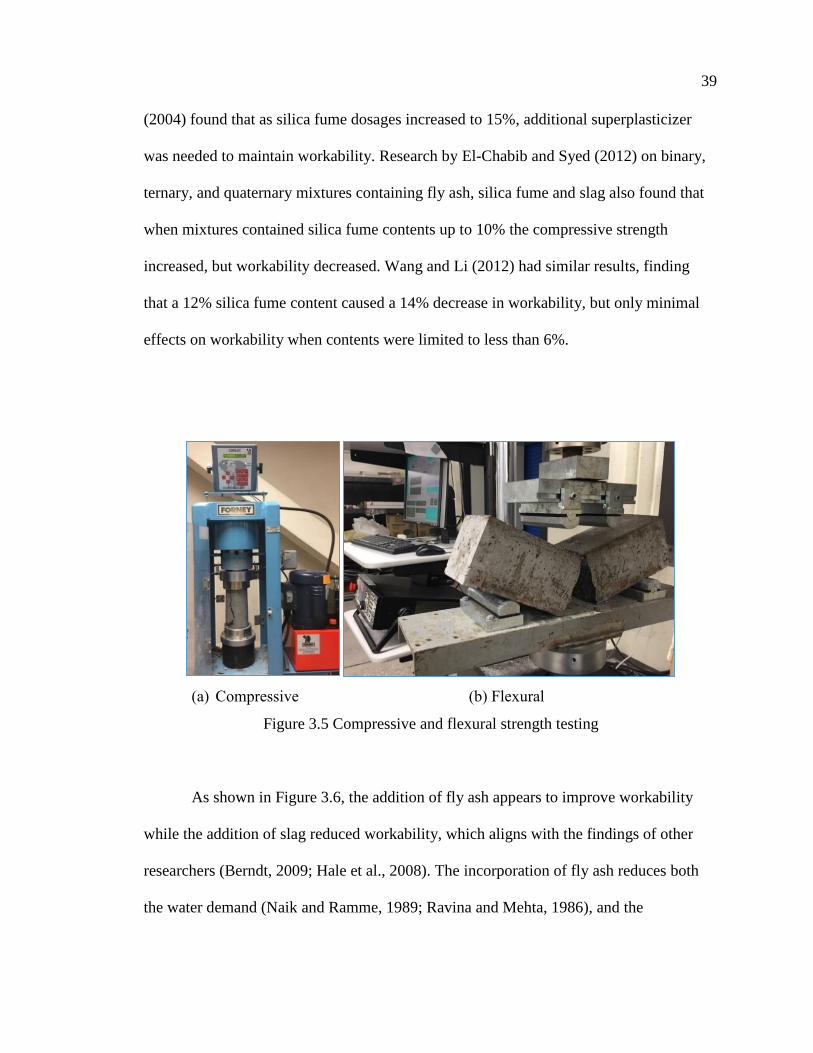
39
(2004) found that as silica fume dosages increased to 15%, additional superplasticizer
was needed to maintain workability. Research by El-Chabib and Syed (2012) on binary,
ternary, and quaternary mixtures containing fly ash, silica fume and slag also found that
when mixtures contained silica fume contents up to 10% the compressive strength
increased, but workability decreased. Wang and Li (2012) had similar results, finding
that a 12% silica fume content caused a 14% decrease in workability, but only minimal
effects on workability when contents were limited to less than 6%.
(a) Compressive (b) Flexural
Figure 3.5 Compressive and flexural strength testing
As shown in Figure 3.6, the addition of fly ash appears to improve workability
while the addition of slag reduced workability, which aligns with the findings of other
researchers (Berndt, 2009; Hale et al., 2008). The incorporation of fly ash reduces both
the water demand (Naik and Ramme, 1989; Ravina and Mehta, 1986), and the

40
Figure 3.6 Workability of each screening mixture
workability due to the spherical shape of fly ash particles (ACAA, 2003). Since the w/c
ratio was consistent between mixes, despite fly ash mixes having a lower water demand,
this equivalent w/c ratio between mixes contributed to a higher workability in fly ash
mixes. This may partially explain why the fly ash mixes would have a higher workability
than the control. Regarding slag, Sivasundaram and Malhotra (1992) found slag cement
had reduced workability when compared to plain cement, while other researchers found
slag improved workability (Meusel and Rose, 1983; Oner et al., 2005). The low
workability of slag mixes in this study can be partially attributed to the angular shape of
their particles which results in a higher surface area to volume ratio, which subsequently
requires additional water to coat each particle’s surface (Kashani et al., 2014).
3.3.2. Air Content. Overall fly ash mixtures had the highest air content, while
the slag mixes had the lowest air contents (Figure 3.7), which was consistent with the
8 SF
4 SF
8 SF
23 SL
8 SF
37 SL
4 SF
24 SL4 SF
38 SL
8 SF
23 FA
8 SF
37 FA
4 SF 4 SF
38 FA
0
1
2
3
4
5
6
7
8
8 SF 4 SF 8 SF 23 SL 8 SF 37 SL 4 SF 24 SL 4 SF 38 SL 8 SF 23 FA 8 SF 37 FA 4 SF 24 FA 4 SF 38 FA
work
abil
ity (
in.)
mixture
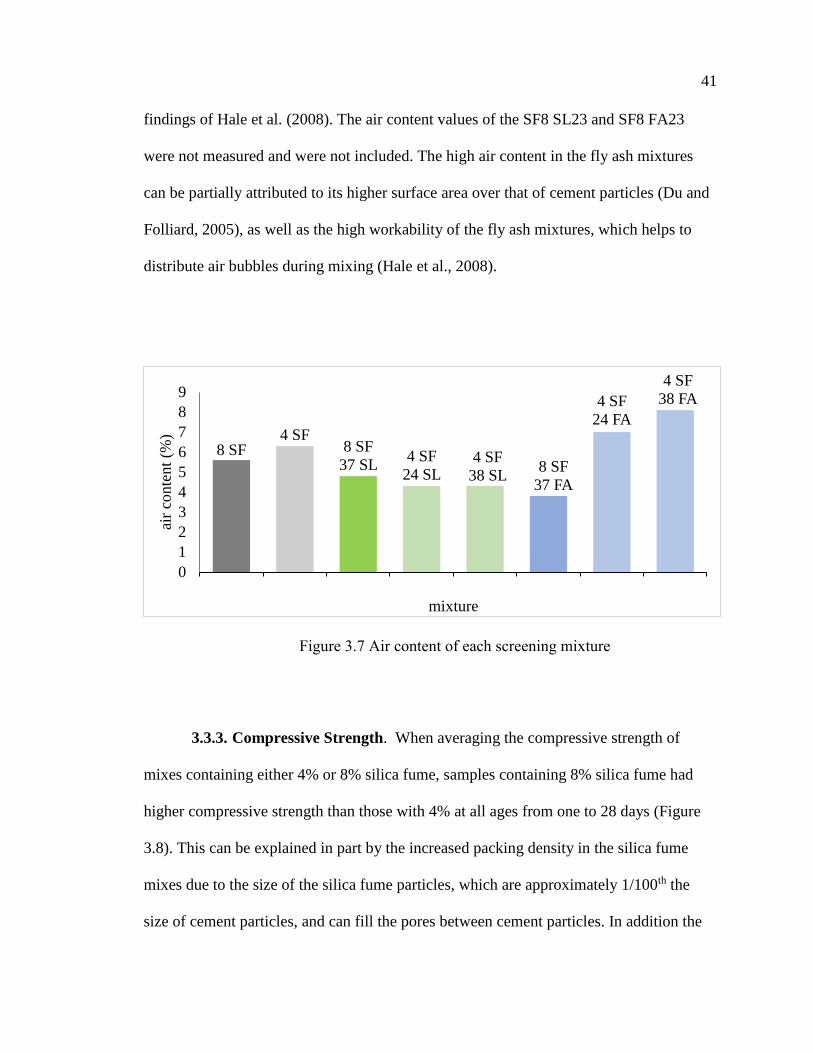
41
findings of Hale et al. (2008). The air content values of the SF8 SL23 and SF8 FA23
were not measured and were not included. The high air content in the fly ash mixtures
can be partially attributed to its higher surface area over that of cement particles (Du and
Folliard, 2005), as well as the high workability of the fly ash mixtures, which helps to
distribute air bubbles during mixing (Hale et al., 2008).
Figure 3.7 Air content of each screening mixture
3.3.3. Compressive Strength. When averaging the compressive strength of
mixes containing either 4% or 8% silica fume, samples containing 8% silica fume had
higher compressive strength than those with 4% at all ages from one to 28 days (Figure
3.8). This can be explained in part by the increased packing density in the silica fume
mixes due to the size of the silica fume particles, which are approximately 1/100th the
size of cement particles, and can fill the pores between cement particles. In addition the
8 SF4 SF
8 SF
37 SL4 SF
24 SL4 SF
38 SL8 SF
37 FA
4 SF
24 FA
4 SF
38 FA
0
1
2
3
4
5
6
7
8
9
air
conte
nt
(%)
mixture
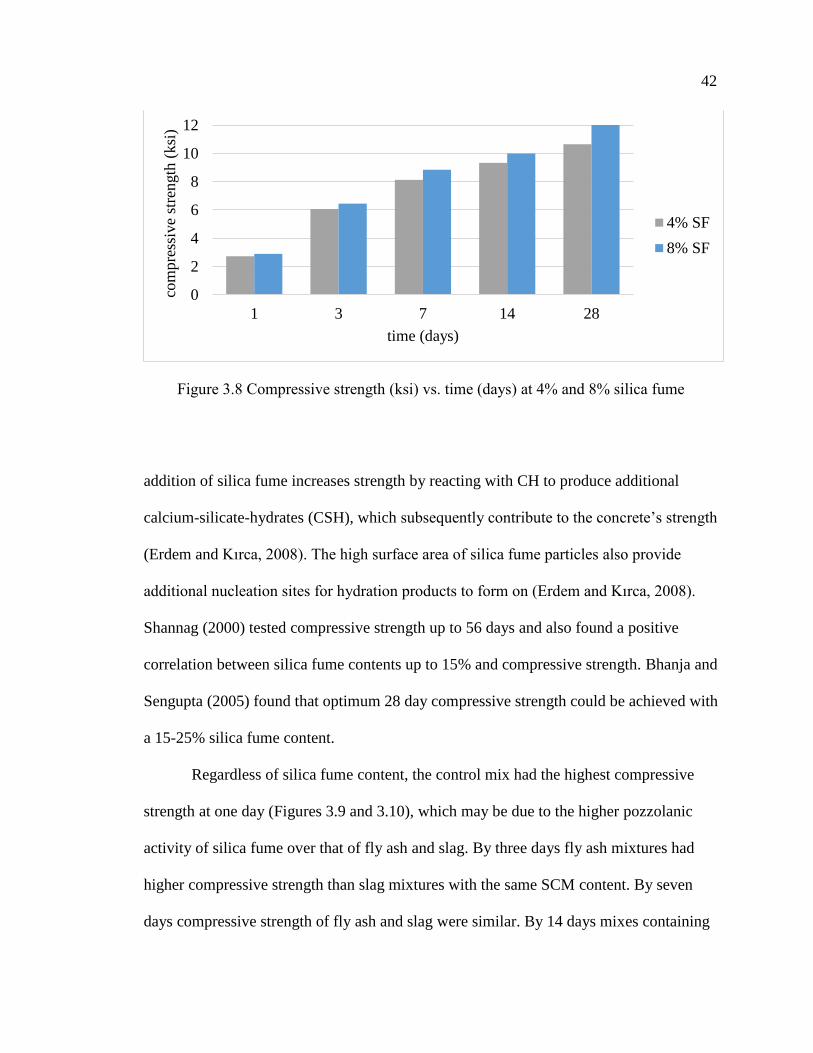
42
Figure 3.8 Compressive strength (ksi) vs. time (days) at 4% and 8% silica fume
addition of silica fume increases strength by reacting with CH to produce additional
calcium-silicate-hydrates (CSH), which subsequently contribute to the concrete’s strength
(Erdem and Kırca, 2008). The high surface area of silica fume particles also provide
additional nucleation sites for hydration products to form on (Erdem and Kırca, 2008).
Shannag (2000) tested compressive strength up to 56 days and also found a positive
correlation between silica fume contents up to 15% and compressive strength. Bhanja and
Sengupta (2005) found that optimum 28 day compressive strength could be achieved with
a 15-25% silica fume content.
Regardless of silica fume content, the control mix had the highest compressive
strength at one day (Figures 3.9 and 3.10), which may be due to the higher pozzolanic
activity of silica fume over that of fly ash and slag. By three days fly ash mixtures had
higher compressive strength than slag mixtures with the same SCM content. By seven
days compressive strength of fly ash and slag were similar. By 14 days mixes containing
0
2
4
6
8
10
12
1 3 7 14 28
com
pre
ssiv
e st
rength
(ksi
)
time (days)
4% SF
8% SF
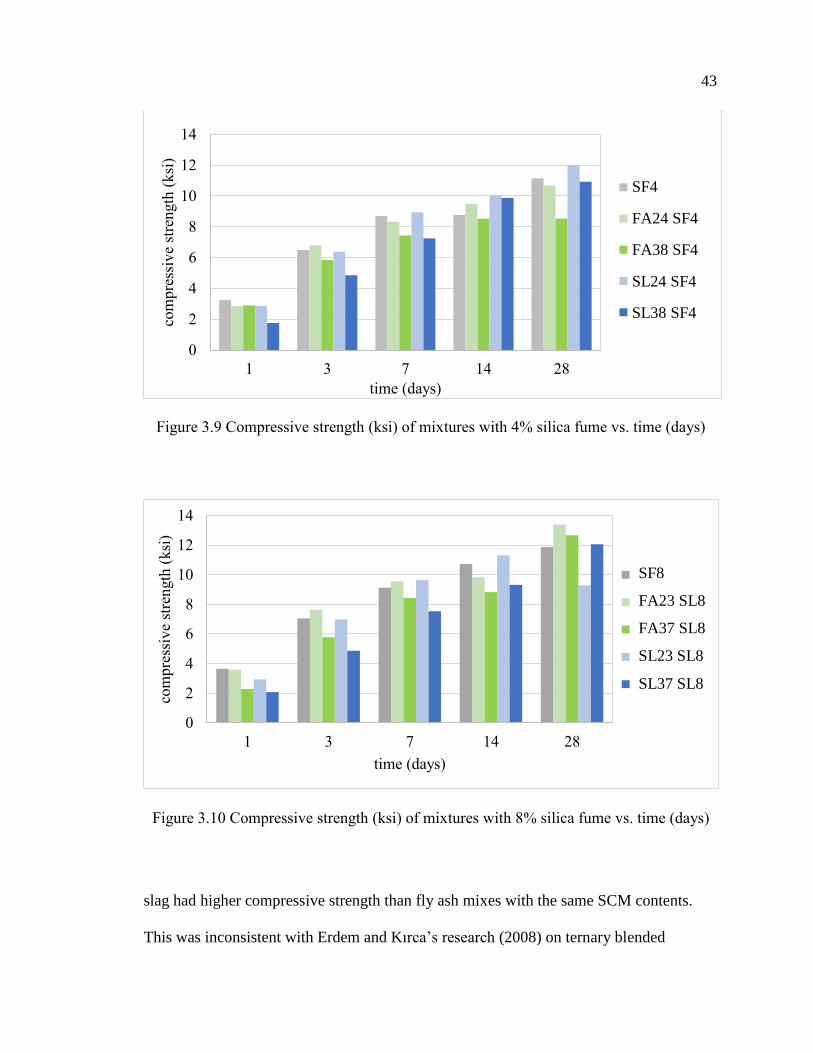
43
Figure 3.9 Compressive strength (ksi) of mixtures with 4% silica fume vs. time (days)
Figure 3.10 Compressive strength (ksi) of mixtures with 8% silica fume vs. time (days)
slag had higher compressive strength than fly ash mixes with the same SCM contents.
This was inconsistent with Erdem and Kırca’s research (2008) on ternary blended
0
2
4
6
8
10
12
14
1 3 7 14 28
com
pre
ssiv
e st
rength
(ksi
)
time (days)
control
FA 24
FA 38
S 24
S 38
SF4
FA24 SF4
FA38 SF4
SL24 SF4
SL38 SF4
0
2
4
6
8
10
12
14
1 3 7 14 28
com
pre
ssiv
e st
rength
(ksi
)
time (days)
control
FA 23
FA 37
S 23
S 37
SF8
FA23 SL8
FA37 SL8
SL23 SL8
SL37 SL8

44
concretes with silica fume and either class F fly ash, class C fly ash, or slag which found
that for compressive strength from three to 28 days, class C fly ash performed the best,
followed by slag, and class F fly ash. One day strength was not investigated.
Research by Gesoğlu (2009) on SCC measured the 28 day compressive strength
of binary silica fume mixes and ternary silica fume mixes containing fly ash or slag. They
found that mixes containing fly ash generally had lower compressive strength. Hale et al.
(2008) investigated the compressive strength of four mixes: a PCC cement, a 25% slag
mix, a 15% type C fly ash mix, and a 25% slag with 15% fly ash mix, and found the slag
mix had the highest compressive strength at all ages from three to 90 days.
Additionally in this study for almost all SCM mixtures at ages up to 28 days, the
mixture containing the lower dosage of fly ash or slag had higher compressive strengths
than those containing higher replacement levels. This does not align with Oner et al.
(2005) which found that 28 day compressive strength increased as fly ash content
increased up to 40%, but their mixtures did not contain silica fume. On the other hand,
Yen et al. (2007) tested fly ash mixes with a 0.33 w/c ratio and found that samples
containing 15% fly ash had higher compressive strength at all ages from 28-364 days
over those containing 0, 20, 25, and 30% fly ash.
3.3.4. Flexural Strength. Regarding the effect of silica fume content on flexural
strength at seven, 14, and 28 days, there were no obvious trends (Figure 3.11), which is
surprising given that generally as compressive strength increases, flexural strength
increases, and the mixtures containing higher dosages of silica fume had higher
compressive strength so mixtures with higher silica fume contents would likely have
higher flexural strength. This is corroborated by other researchers (e.g. Bhanja and
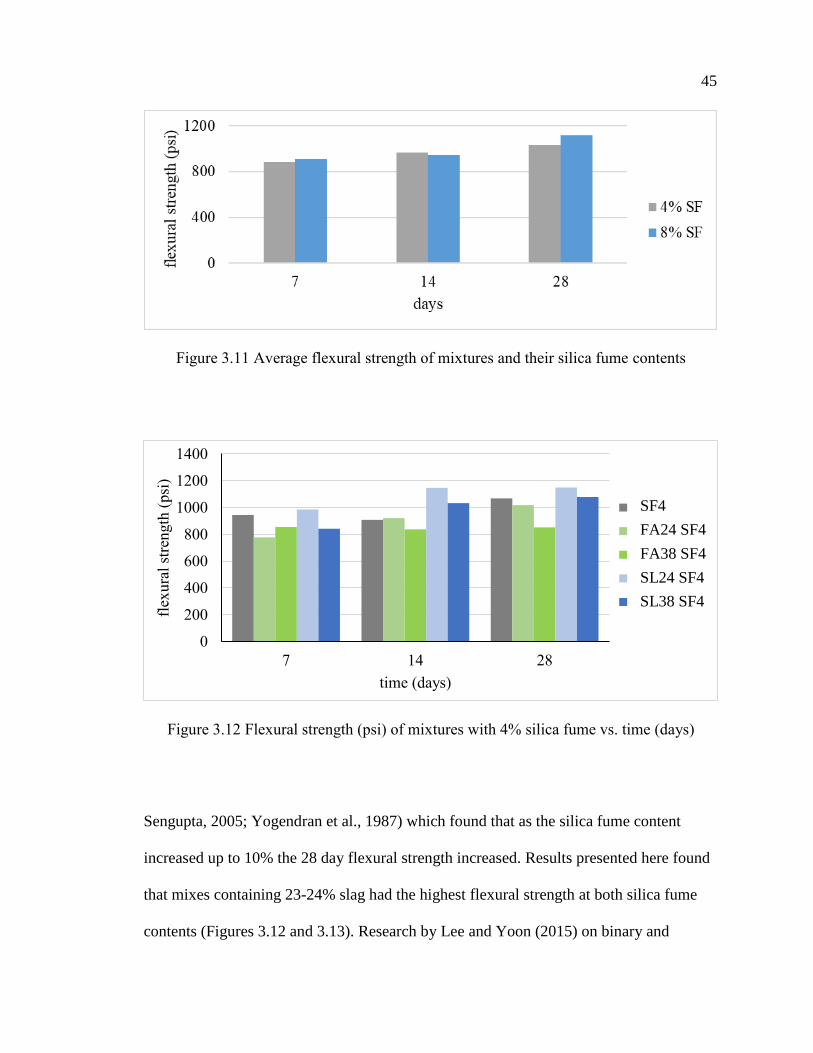
45
Figure 3.11 Average flexural strength of mixtures and their silica fume contents
Figure 3.12 Flexural strength (psi) of mixtures with 4% silica fume vs. time (days)
Sengupta, 2005; Yogendran et al., 1987) which found that as the silica fume content
increased up to 10% the 28 day flexural strength increased. Results presented here found
that mixes containing 23-24% slag had the highest flexural strength at both silica fume
contents (Figures 3.12 and 3.13). Research by Lee and Yoon (2015) on binary and
0
200
400
600
800
1000
1200
1400
7 14 28
flex
ura
l st
rength
(psi
)
time (days)
control
FA 24
FA 38
S 24
S 38
SF4
FA24 SF4
FA38 SF4
SL24 SF4
SL38 SF4

46
Figure 3.13 Flexural strength (psi) of mixtures with 8% silica fume vs. time (days)
ternary fly ash and slag mixes had different results, concluding that the SCM type had no
significant effect on flexural strength. Bharatkumar et al. (2001) also found the addition
of fly ash or slag did not significantly affect flexural strength.
3.4. DETERMINING THE OPTIMUM MIXTURE
Using the results obtained, an optimum mix for each parameter (e.g. 1 day
compressive strength, 3 day compressive strength, etc.) was determined. This was first
done using Minitab® Statistical Software Response Optimization tool (Minitab 2019),
and later verified in Excel using special cubic models and desirability functions. Minitab
is a statistical analysis program which has a function available to optimize mixtures.
3.4.1. Minitab Method. Using Minitab response optimization, slag, fly ash, silica
fume, and cement contents were limited to the maximum and minimum contents tested
0
200
400
600
800
1000
1200
1400
7 14 28
flex
ura
l st
rength
(psi
)
time (days)
control
FA 23
FA 37
S 23
S 37
SF8
FA23 SL8
FA37 SL8
SL23 SL8
SL37 SL8

47
(Table 3.3). Then responses were modeled. Responses included workability; 1, 3, 7, 14,
and 28 day compressive strength; and 7, 14, and 28 day flexural strength. Three models
were investigated including linear (Eq. 1), quadratic (Eq. 2) and special cubic models
(Eq. 3). Linear models describe how each individual component affects the response,
response = A(cem) + B(sf) + C(fa) + D(sl) (1)
response = A(cem) + B(sf) + C(fa) + D(sl) + E(cem)(sf)+ F(cem)(sl) + G(cem)(fa) + H(sf)(sl)
(2)
response = A(cem) + B(sf) + C(fa) + D(sl) + E(cem)(sf)+ F(cem)(sl) + G(cem)(fa) + H(sf)(sl)+ I(cem)(sf)(sl) + J(cem)(sf)(fa)
(3)
cem = cement, sf = silica fume, fa = fly ash, sl = slag
quadratic models describe how two different components affect each other and the
response, and special cubic models describes how the combination of three components
affect each other and the response. Other models were not investigated in part due to
redundancy (e.g. cement × cement). In addition, of the models investigated some
relationships were not included. These include silica fume × fly ash, slag × fly ash,
cement × slag × fly ash, and silica fume × slag × fly ash. In the first case, silica fume ×
fly ash, this is due to multicollinearity. In the case of the latter three, the combination of
slag and fly ash were not tested, and therefore a coefficient for representing their
relationship could not be determined. The sum of squares (S), r-squared value (R2) and
probability value (P) for each model and response are summarized in Table 3.4. Overall it
appears using the special cubic models results in the highest R2 values. The association
between the estimated and actual data was significant at the 0.05 level for all responses

48
except 28 day flexural strength (P=0.06), which was marginally statistically significant.
Therefore special cubic models were used to model the data.
Table 3.3 Constraints used (% cementitious material)
Constituent Cement
(%) Silica fume
(%) GGBFS
(%) Fly ash
(%)
lower limit 55 3.8 0 0
upper limit 96 7.6 3.8 3.8
After determining the appropriate model, targets were used to maximize each
response. Targets were set at 10% higher than the highest average mix measurement. For
example the SF8 mix had the highest average one day compressive strength so 110% of
its compressive strength was used as the target. A target of 10% higher than the average
was used to improve reliability to better represent the highest value measured in the lab.
The lower limit was the lowest average measurement. Each response, except workability,
was set to maximize at these targets. Workability was set at six inches. The upper limit
(target), lower limit, weight, and importance for each response is summarized in Table
3.5. All responses were weighed at 1.0, but the importance factor, k, varied. Workability,
flexural strength and compressive strength were considered of equal importance at 3.33.
Therefore, for each compressive strength response (1 day, 3 day, etc.) the importance
factor was 0.67, and for each flexural strength response the importance factor was 1.11.
Using all these inputs and limits, Minitab determined the optimum mix design to contain
12% slag, 4% silica fume and 1% fly ash (Figure 3.13).
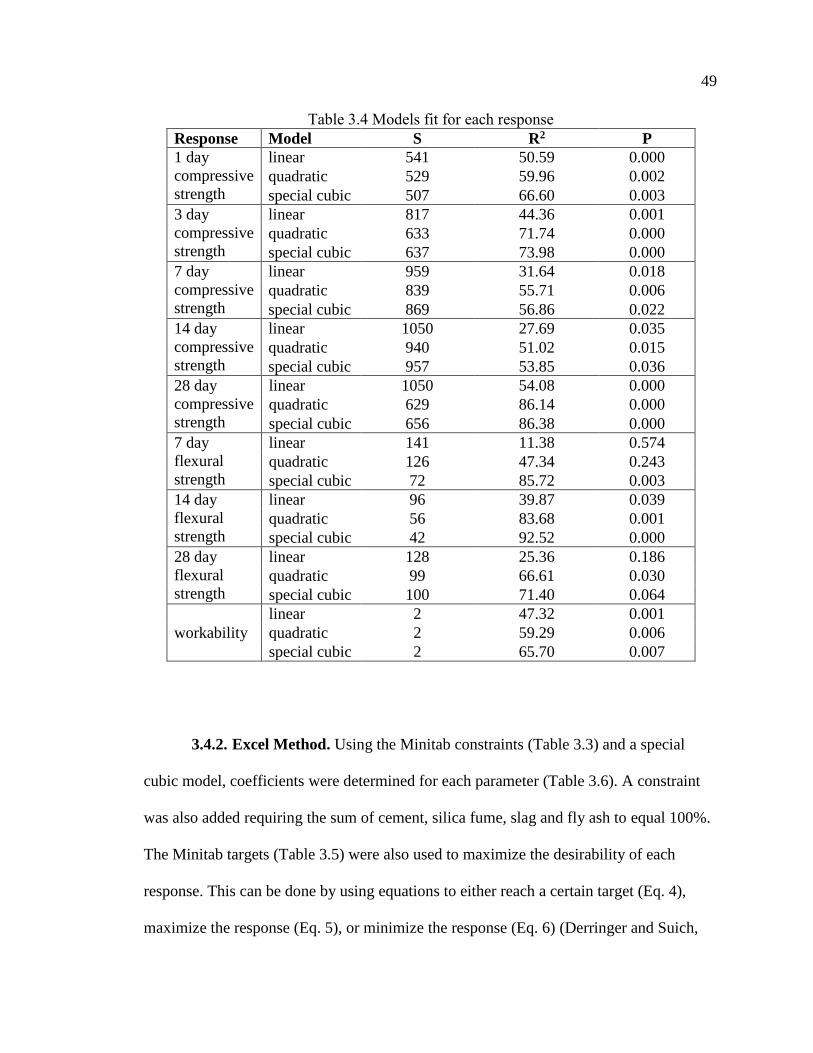
49
Table 3.4 Models fit for each response
Response Model S R2 P
1 day
compressive
strength
linear 541 50.59 0.000
quadratic 529 59.96 0.002
special cubic 507 66.60 0.003
3 day
compressive
strength
linear 817 44.36 0.001
quadratic 633 71.74 0.000
special cubic 637 73.98 0.000
7 day
compressive
strength
linear 959 31.64 0.018
quadratic 839 55.71 0.006
special cubic 869 56.86 0.022
14 day
compressive
strength
linear 1050 27.69 0.035
quadratic 940 51.02 0.015
special cubic 957 53.85 0.036
28 day
compressive
strength
linear 1050 54.08 0.000
quadratic 629 86.14 0.000
special cubic 656 86.38 0.000
7 day
flexural
strength
linear 141 11.38 0.574
quadratic 126 47.34 0.243
special cubic 72 85.72 0.003
14 day
flexural
strength
linear 96 39.87 0.039
quadratic 56 83.68 0.001
special cubic 42 92.52 0.000
28 day
flexural
strength
linear 128 25.36 0.186
quadratic 99 66.61 0.030
special cubic 100 71.40 0.064
workability
linear 2 47.32 0.001
quadratic 2 59.29 0.006
special cubic 2 65.70 0.007
3.4.2. Excel Method. Using the Minitab constraints (Table 3.3) and a special
cubic model, coefficients were determined for each parameter (Table 3.6). A constraint
was also added requiring the sum of cement, silica fume, slag and fly ash to equal 100%.
The Minitab targets (Table 3.5) were also used to maximize the desirability of each
response. This can be done by using equations to either reach a certain target (Eq. 4),
maximize the response (Eq. 5), or minimize the response (Eq. 6) (Derringer and Suich,
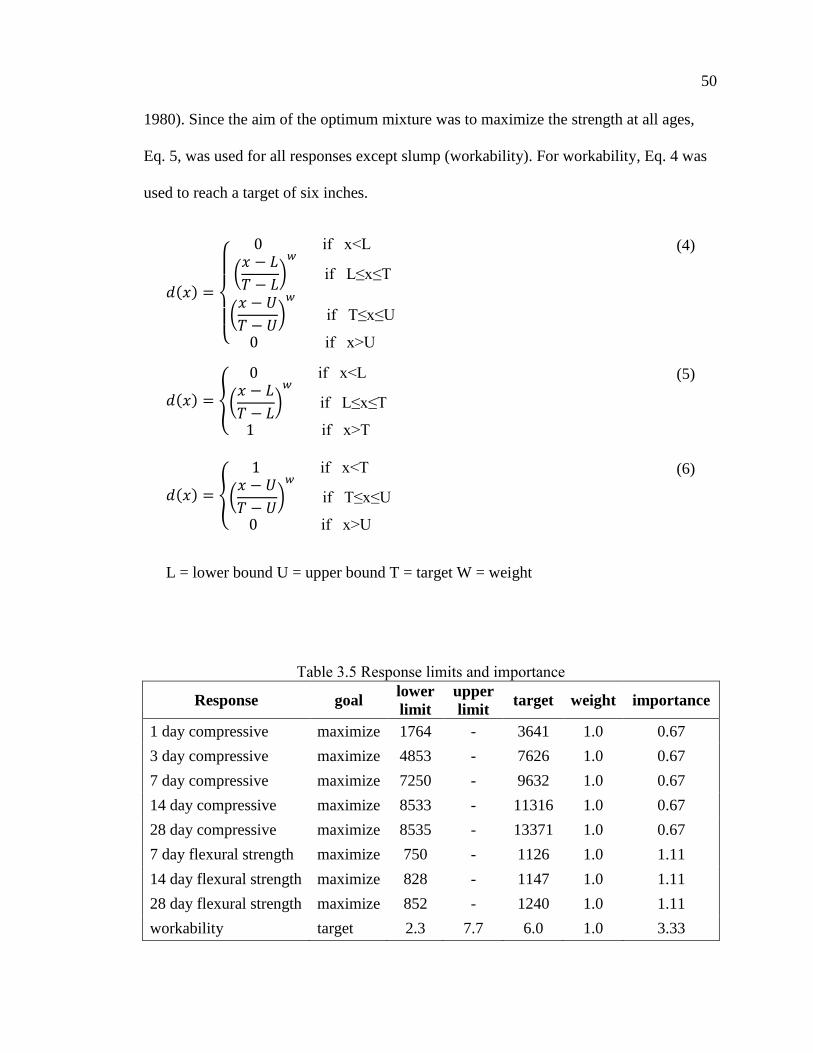
50
1980). Since the aim of the optimum mixture was to maximize the strength at all ages,
Eq. 5, was used for all responses except slump (workability). For workability, Eq. 4 was
used to reach a target of six inches.
Table 3.5 Response limits and importance
Response goal lower
limit
upper
limit target weight importance
1 day compressive maximize 1764 - 3641 1.0 0.67
3 day compressive maximize 4853 - 7626 1.0 0.67
7 day compressive maximize 7250 - 9632 1.0 0.67
14 day compressive maximize 8533 - 11316 1.0 0.67
28 day compressive maximize 8535 - 13371 1.0 0.67
7 day flexural strength maximize 750 - 1126 1.0 1.11
14 day flexural strength maximize 828 - 1147 1.0 1.11
28 day flexural strength maximize 852 - 1240 1.0 1.11
workability target 2.3 7.7 6.0 1.0 3.33
𝑑(𝑥) =
{
0 if x<L
(𝑥 − 𝐿
𝑇 − 𝐿)𝑤
if L≤x≤T
(𝑥 − 𝑈
𝑇 − 𝑈)𝑤
if T≤x≤U
0 if x>U
(4)
𝑑(𝑥) = {
0 if x<L
(𝑥 − 𝐿
𝑇 − 𝐿)𝑤
if L≤x≤T
1 if x>T
(5)
𝑑(𝑥) = {
1 if x<T
(𝑥 − 𝑈
𝑇 − 𝑈)𝑤
if T≤x≤U
0 if x>U
(6)
L = lower bound U = upper bound T = target W = weight

51
Figure 3.14 Optimum mixture as determined by Response Optimizer for Mixture on
Minitab
Table 3.6 Special cubic model coefficients for each response
Term Compressive strength (days) Flexural strength (days) Slump
1 3 7 14 28 7 14 28
C 1412 4914 7782 6938 11270 526 1229.4 1429 0.49
SF -432495 -298347 -134331 97290 283651 -164925 81067 68220 1009
SL -15473 -5407 -7835 22839 -1266 2417 -658 1572 -31.9
F 22104 4917 4245 -6534 -25697 9077 -3366 -3549 -39.5
C × SF 501296 358616 172912 -43531 -286215 183452 -91826 -79318 -1161
C × SL 22963 11744 19600 -12725 17182 -4287 3698 -1318 54.9
C × F -33563 -1580 -2946 29747 35454 -15566 6772 5457 101
SF × SL 606619 120262 -21029 -641665 -404447 80667 -103951 -115140 -208
C × SF × SL -192406 379658 360476 776260 297396 192641 24627 91538 -1500
C × SF × F 766740 585718 390542 -273278 -52043 327056 -135994 -79493 -2195
C = cement, SF = silica fume, SL = Slag, Fly ash = F

52
Following this, each response was assigned an importance value and each
response’s desirability was used to determine the overall desirability the mix would
provide (Eq. 7) (Derringer and Suich, 1980; Aksezer, 2008). Excel solver was then used
to maximize the desirability within the limits. The optimum mixture determined using
Excel was almost identical to the mixture determined using Minitab (Tables 3.7 and 3.8).
Table 3.7 Excel versus Minitab optimum mixture
Method Desirability Cement Silica fume GGBFS Class F fly ash
Excel 0.7233 0.8355 0.0378 0.1159 0.0109
Minitab 0.7232 0.8347 0.0378 0.1158 0.0117
3.4.3. Results. This method was repeated in determining three other mixes: (1)
for optimal workability, (2) for optimal one to 28 day compressive strength, and (3) for
D = (d1(x1)k1 × d2(x2)
k2 × …× dn(xn)kn)
1∑ kii
(7)
Table 3.8 Predicted value and desirability for each response in the optimum mixture
Response
Excel Minitab
Predicted Desirability Predicted Desirability
1 day compressive strength 3245 psi 0.79 3242 psi 0.79
3 day compressive strength 6820 psi 0.71 6821 psi 0.71
7 day compressive strength 9255 psi 0.84 9252 psi 0.84
14 day compressive strength 9650 psi 0.40 9652 psi 0.40
28 day compressive strength 11958 psi 0.71 11956 psi 0.71
7 day flexural strength 992 psi 0.64 991 psi 0.64
14 day flexural strength 1086 psi 0.81 1086 psi 0.81
28 day flexural strength 1137 psi 0.73 1136 psi 0.73
workability 5.2 in. 0.78 5.2 in. 0.78

53
seven to 28 day optimal flexural strength. For (1), workability was the only response
used. In (2) all compressive strength responses were used with equivalent importance,
and in (3) all flexural strength responses with equivalent importance were used. These
mixes, along with the overall optimum and control mixes (Table 3.9), were then used for
further testing.
Table 3.9 Mixtures determined for performance testing
Name Silica Fume
(%) Slag
(%) Fly Ash
(%) Cement
(%)
Control (SF8) 8 0 0 92
Optimal flexural strength (SL22 SF8) 8 2 0 70
Optimal workability, flexural strength,
and compressive strength
(SL12 SF4 FA1)
4 2 1 83
Optimal compressive strength
(SL8 SF8 FA3) 8 8 3 81
Optimal workability (FA31 SF4) 4 0 31 65
Other researchers also found that a primarily slag and silica fume mixture would
provide an optimal mix for concrete pavements. For example, Scholz and Keshari (2010)
developed an abrasion-resistant mix using silica fume, fly ash, and slag. They found a
slag and silica fume mix had better durability, compressive strength, and abrasion
resistance over that of a fly ash and silica fume mix. Gesoğlu et al. (2009) tested 22 SCC
binary, ternary, and quaternary mixes containing silica fume, slag and fly ash and
concluded an optimum mix would contain primarily silica fume and slag. The optimum
mix they determined contained 44% slag, 1% fly ash, and 14% silica fume. Although the

54
slag and silica fume ternary mixtures generally improved hardened properties, only the
ternary mixture of fly ash and slag satisfied the V-funnel flow time requirements, which
may explain the additional 1% fly ash contribution.
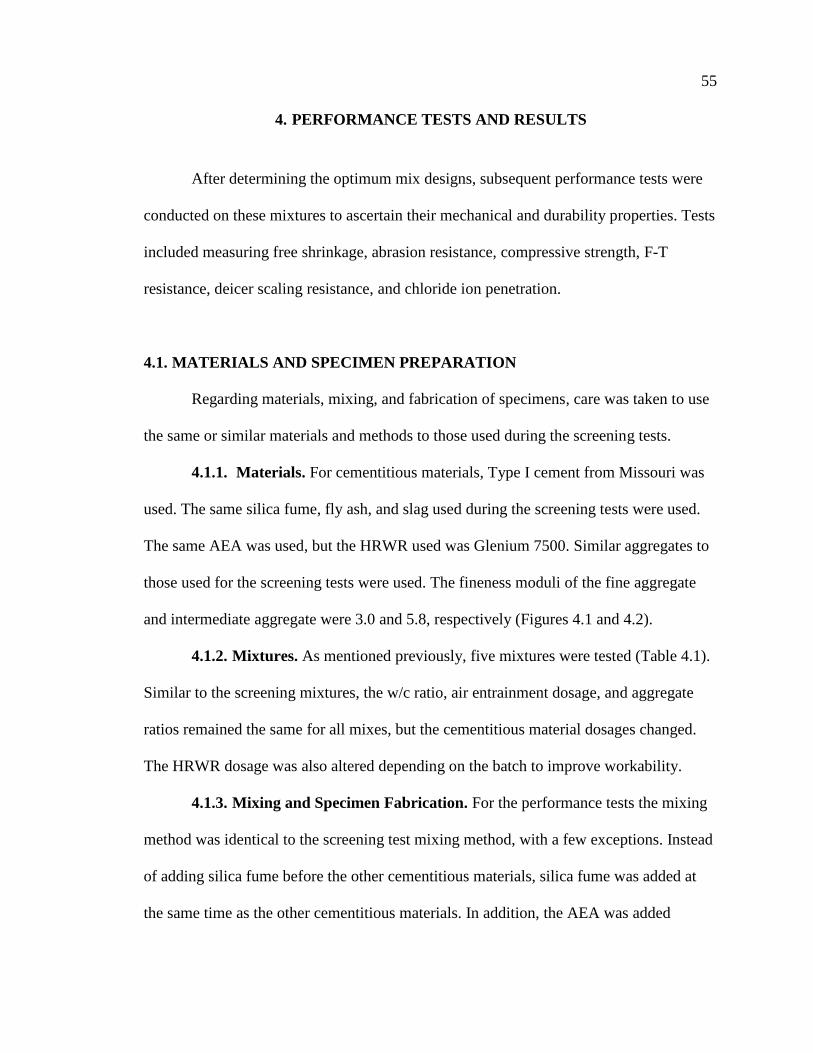
55
4. PERFORMANCE TESTS AND RESULTS
After determining the optimum mix designs, subsequent performance tests were
conducted on these mixtures to ascertain their mechanical and durability properties. Tests
included measuring free shrinkage, abrasion resistance, compressive strength, F-T
resistance, deicer scaling resistance, and chloride ion penetration.
4.1. MATERIALS AND SPECIMEN PREPARATION
Regarding materials, mixing, and fabrication of specimens, care was taken to use
the same or similar materials and methods to those used during the screening tests.
4.1.1. Materials. For cementitious materials, Type I cement from Missouri was
used. The same silica fume, fly ash, and slag used during the screening tests were used.
The same AEA was used, but the HRWR used was Glenium 7500. Similar aggregates to
those used for the screening tests were used. The fineness moduli of the fine aggregate
and intermediate aggregate were 3.0 and 5.8, respectively (Figures 4.1 and 4.2).
4.1.2. Mixtures. As mentioned previously, five mixtures were tested (Table 4.1).
Similar to the screening mixtures, the w/c ratio, air entrainment dosage, and aggregate
ratios remained the same for all mixes, but the cementitious material dosages changed.
The HRWR dosage was also altered depending on the batch to improve workability.
4.1.3. Mixing and Specimen Fabrication. For the performance tests the mixing
method was identical to the screening test mixing method, with a few exceptions. Instead
of adding silica fume before the other cementitious materials, silica fume was added at
the same time as the other cementitious materials. In addition, the AEA was added

56
Figure 4.1 Missouri fine aggregate gradation chart
Figure 4.2 Missouri intermediate aggregate gradation chart
at the same time as the water and aggregate at the beginning of mixing, instead of adding
the AEA near the end of mixing. Similar to the screening test specimen fabrications, after
the fresh concrete was prepared the air content and workability were measured (Figure
4.3). Subsequently, molds were filled in two layers and vibrated. After filling, molds
0
20
40
60
80
100
0.1 1 10 100
per
cent
pas
sing (
%)
sieve opening (mm)
0
20
40
60
80
100
0.1 1 10 100
per
cent
pas
sing (
%)
sieve opening (mm)
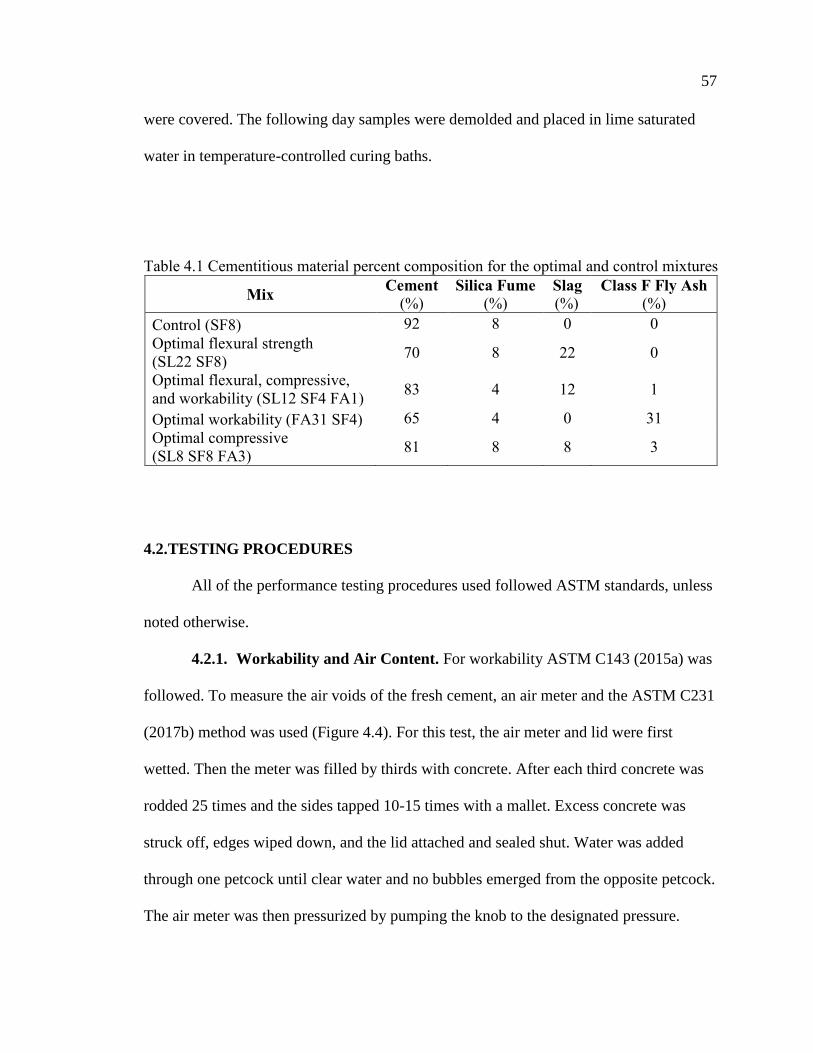
57
were covered. The following day samples were demolded and placed in lime saturated
water in temperature-controlled curing baths.
Table 4.1 Cementitious material percent composition for the optimal and control mixtures
Mix Cement
(%) Silica Fume
(%) Slag
(%) Class F Fly Ash
(%)
Control (SF8) 92 8 0 0
Optimal flexural strength
(SL22 SF8) 70 8 22 0
Optimal flexural, compressive,
and workability (SL12 SF4 FA1) 83 4 12 1
Optimal workability (FA31 SF4) 65 4 0 31
Optimal compressive
(SL8 SF8 FA3) 81 8 8 3
4.2. TESTING PROCEDURES
All of the performance testing procedures used followed ASTM standards, unless
noted otherwise.
4.2.1. Workability and Air Content. For workability ASTM C143 (2015a) was
followed. To measure the air voids of the fresh cement, an air meter and the ASTM C231
(2017b) method was used (Figure 4.4). For this test, the air meter and lid were first
wetted. Then the meter was filled by thirds with concrete. After each third concrete was
rodded 25 times and the sides tapped 10-15 times with a mallet. Excess concrete was
struck off, edges wiped down, and the lid attached and sealed shut. Water was added
through one petcock until clear water and no bubbles emerged from the opposite petcock.
The air meter was then pressurized by pumping the knob to the designated pressure.
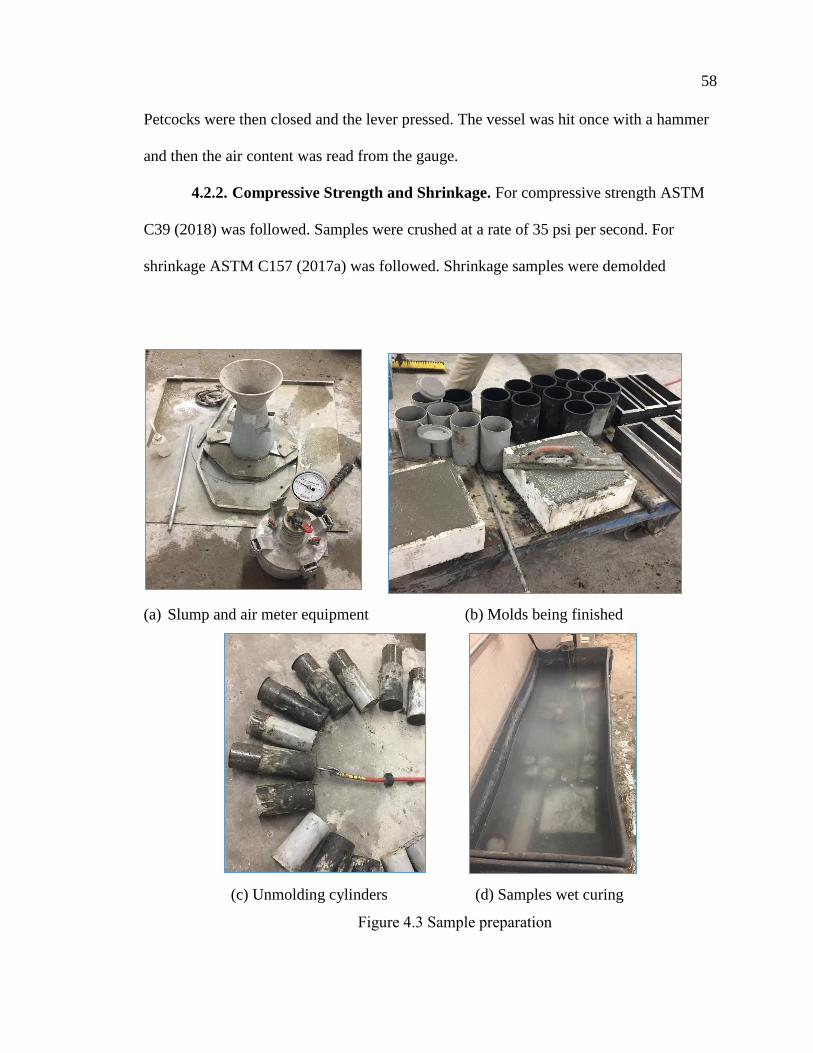
58
Petcocks were then closed and the lever pressed. The vessel was hit once with a hammer
and then the air content was read from the gauge.
4.2.2. Compressive Strength and Shrinkage. For compressive strength ASTM
C39 (2018) was followed. Samples were crushed at a rate of 35 psi per second. For
shrinkage ASTM C157 (2017a) was followed. Shrinkage samples were demolded
(a) Slump and air meter equipment (b) Molds being finished
(c) Unmolding cylinders (d) Samples wet curing
Figure 4.3 Sample preparation

59
Figure 4.4 Air meter
24 hours after mixing, measured, and then cured for 28 days in a temperature-controlled
water bath. After 28 days samples were measured again and left at 50% humidity at 23C
and measured daily for 28 days (Figure 4.5).
(a) Shrinkage molds (b) Measuring sample (c) Samples
Figure 4.5 Measuring shrinkage

60
4.2.3. Durability. The durability properties investigated included chloride ion
penetration, F-T resistance, abrasion resistance, and scaling resistance from deicing salts.
4.2.3.1. Abrasion resistance. Two methods were used to measure abrasion
resistance. The first, ASTM C944, measured abrasion resistance through mass loss while
the second, the Prall Method, measured abrasion resistance through volume loss.
ASTM C944 Test: For measuring abrasion resistance by mass loss, a modified
ASTM C944 method (2012b) was followed. ASTM C944 requires the rotating-cutter drill
press to spin at a rate of 200 revolutions per minute (rpms), but the press used only could
rotate at 150 or 300 rpms, so 150 rpms was used. A 22 pound force was applied for two
minutes in four sections of the samples (Figure 4.6a). Mass loss was measured after each
two minute period (Figure 4.6b).
Abrasion by Studs, Method A: Prall Method: Abrasion resistance was also
measured through volume loss using the Nordic Prall testing apparatus (Figure 4.7) and
(a) Applying force to sample (b) Measuring mass loss
Figure 4.6 Testing abrasion by mass loss

61
the Abrasion by Studs, Method A: Prall Method standard (CEN WG1 Bituminous
Materials, 1997). To prepare samples for this test, four by eight inch cylindrical concrete
samples were cured for 28 days and sent to the Alaska DOT&PF Southcoast Materials
Lab. Upon arrival samples were cut into 100 mm diameter by 30 mm long disks and
brought to a temperature of 5°C. Samples were then weighed and placed in the Prall
machine. In the machine samples were exposed to cooling water at a rate of two liters per
minute, and worn for 15 minutes by 40 steel spheres at a rate of 950 rpms. The loss in
(a) Prall test setup (b) Temperature controls
(c) Setting asphalt sample in chamber (d) Adding steel spheres
Figure 4.7 Nordic Prall Test

62
volume before and after testing, referred to as the abrasion value, was measured. Two
samples were tested for each mixture. The volume loss per sample was then used to
determine the wear resistance (Table 4.2).
Table 4.2 Prall results interpretation
Volume loss (cm3) Wear resistance
<20 Very good
20-29 Good
30-39 Satisfactory
40-50 Less satisfactory
>50 Poor
4.2.3.2. Freeze-thaw resistance. To measure the F-T resistance of samples,
ASTM C666 (2015b) was followed. After wet curing samples for 14 days each sample’s
length and mass was measured, as well as the ultrasonic pulse velocity. This velocity was
measured using a PROCEQ ultrasound with a frequency of 54 Hz (Figure 4.8b). Samples
were kept in a temperature-controlled cabinet (Figure 4.8a) which exposed samples to
freezing temperatures for four hours, followed by two hours of thawing. After every 18
cycles each sample’s mass, length and ultrasonic pulse velocity was measured again.
Originally it was planned to expose the samples to 300 cycles, but due to time constraints
samples were only exposed to 180 cycles. To calculate the relative dynamic modulus of
elasticity (RDME), Eq. 8 was used.
𝑅𝐷𝑀𝐸 (%) = 𝑣02
𝑣𝑛2 (8)

63
(a) Freeze-thaw cabinet (b) Measuring frequency
Figure 4.8 Freeze-thaw testing
In this, 𝑣0 is the initial ultrasonic pulse velocity and 𝑣𝑛 is the ultrasonic pulse velocity at
n cycles. The durability factor (DF) for each mixture was also determined using Eq. 9.
In this equation 𝑛𝑓 is the cycles the 𝑅𝐷𝑀𝐸𝑓 represents while 𝑛𝑡 is the cycles at which all
testing was terminated, which in this case was 180 cycles. The 𝑅𝐷𝑀𝐸𝑓 represents either
the RDME once it reaches 60% or lower, or the RDME after 180 cycles, whichever
occurs sooner. The durability factor ranges from 0% to 100%. A higher durability factor
suggests the sample has high resistance to F-T cycles. A lower durability factor suggests
the sample’s durability is low, and degraded quickly after many F-T cycles.
4.2.3.3. Scaling resistance of samples exposed to deicing chemicals. To
measure the effect deicer salts have on the scaling resistance of samples, ASTM C672
𝐷𝐹 = 𝑅𝐷𝑀𝐸𝑓 × 𝑛𝑓/𝑛𝑡 (9)
64
(2012a) was followed. Samples were cured in a water bath for 14 days and then in air for
14 days. Then the top edges were taped and caulked using waterproof silicone to provide
a waterproof boundary (Figure 4.9a). A 4% calcium chloride (CaCl2) solution was then
applied to the sample’s surface at a ¼ inch depth (Figure 4.9b) and samples were placed
(a) Preparing samples (b) Replacing salt solution on samples
Figure 4.9 Preparing and testing deicing samples
in the deicing chambers. The chamber was calibrated to expose samples to freezing
temperatures for 16 hours and then 23°C for eight hours daily. Every five days the
solution was replaced, samples were photographed, and the condition of their surface was
rated 0-5 as per ASTM C672 ratings (Table 4.3).
4.2.3.4. Chloride ion penetration resistance. For chloride ion penetration
ASTM C1202 (2019) was used. First four by eight inch cylindrical samples were wet

65
cured for 28 days. Following this samples were cut into 50 mm disks using a water saw
(Figure 4.10a), grinded smooth, and placed in a desiccator for three hours at a 50 mm Hg
pressure (Figure 4.10b). With the vacuum pump still on water was added through a
stopcock until samples were covered. Samples were then left submerged under
pressure for an hour. Following this the pump was turned off and samples were soaked
for 18 hours. Samples were then placed in the testing chamber (Figure 4.10c) and each
side was filled with either a 3.0% NaCl or 0.3 N NaOH solution. A 60 Volt electrical
current was then applied for six hours (Figure 4.10d). The current versus time was then
plotted and a curve drawn. The area under the curve was then integrated to determine
coulombs passed. Based on this, the penetrability was determined (Table 4.4).
Table 4.3 ASTM C672 sample degradation ratings
Rating Condition of Surface
0 No scaling
1 Very slight scaling (3 mm [1/8 in.] depth, max, no coarse aggregate visible)
2 Slight to moderate scaling
3 Moderate scaling (some coarse aggregate visible)
4 Moderate to severe scaling
5 Severe scaling (coarse aggregate visible over entire surface)
4.3. RESULTS
Data was collected on each mixture’s workability, air content, compressive
strength, drying shrinkage, and resistance to deicing salts, abrasion, and F-T cycles.
4.3.1. Workability and Air Content. As shown below in Table 4.5, workability
varied widely from 1½ to 9¾ inches while the air content varied between 3-5%. As

66
(a) Cutting samples (b) Samples in dessicator
(c) Sample in chamber (d) Testing sample
Figure 4.10 Testing chloride ion penetration
predicted, the optimum workability mixture, which contained 31% fly ash, had the
highest workability and air content of the mixes. As mentioned earlier the high
workability of the fly ash mixtures can be partially attributed to the spherical shape of the
fly ash particles. These results corroborate with research by Hale et al. (2008) which

67
found that mixtures containing fly ash had higher slump and air content than those
containing slag cement.
Table 4.4 Chloride ion penetrability based on charge passed (ASTM 1202, 2019)
Table 4.5 Workability and air content of optimum and control mixtures
Mix Workability (in.) Air content (%)
Control (SF8) 8.00 5.5
Optimal flexural strength (SL22 SF8) 9.50 3.4
Optimal all (SL12 SF4 FA1) 1.50 4.5
Optimal compressive (SL8 SF8 FA3) 3.00 5.3
Optimal workability (FA31 SF4) 9.75 5.6
4.3.2. Mechanical Properties. Mechanical properties measured include
compressive strength and drying shrinkage.
4.3.2.1. Compressive strength. By 28 days the compressive strength of the
control was the highest, followed by the SL8 SF8 FA3, the SL22 SF8, the FA31 SF4 and
the SL12 SF4 FA1 mixes (Table 4.6). Nonetheless, all had strengths higher than 6,000 psi
by 28 days, which ACI defines as high-strength concrete (ACI, 1992; Mehta, 1999).
Therefore any of them could potentially be used for high-strength concrete applications.
Charge passed (Coulombs) Chloride Ion Penetrability
>4,000 High
2,000-4,000 Moderate
1,000-2,000 Low
100-1,000 Very Low
<100 Negligible

68
Table 4.6 Compressive strength of optimum mixtures
Mix
Compressive strength (psi)
1 day 3 days 7 days 14 days 28 days
Control (SF8) 3870 5920 6930 7360 7950
Optimal flexural strength
(SL22 SF8) 3280 5960 7980 7300 7270
Optimal all (SL12 SF4 FA1) 4240 6180 6920 6670 6840
Optimal compressive
(SL8 SF8 FA3) 3810 6230 8140 8340 7640
Optimal workability
(FA31 SF4) 3700 5520 6370 6930 7210
4.3.2.2. Drying shrinkage. As shown below in Figure 4.11, the FA31 SF4
mixture had almost no change in length, expanding 0.006% instead of shrinking. The
other mixtures had shrinkage rates ranging from 0.02% to 0.03% (Table 4.7). The ability
of fly ash to reduce shrinkage in concrete is well-known (Chindaprasirt et al., 2004) and
is also demonstrated here with minimal change in the FA31 SF4 mixture shrinkage
compared to the other mixtures. Research into the effects of adding silica fume to
concrete on drying shrinkage found similar shrinkage rates to that of all-cement control
concrete (Carette and Malhotra, 1983), while other research found the addition of 5% and
15% silica fume reduced drying shrinkage by 29% and 35% (Güneyisi et al., 2012). Hale
et al. (2008) measured shrinkage over 90 days and found the addition of slag reduced
shrinkage while fly ash mixtures had similar shrinkage to the all-cement control mixture.
Similarly, Mokarem et al. (2005) tested binary mixtures and found fly ash mixtures had
higher drying shrinkage over those of silica fume or slag. They suggested the 28 day
length change for concrete mixtures containing SCMs should be limited to 0.04%, which
all the mixtures presented here adhere to (Table 4.7)

69
Figure 4.11 Time (days) vs. length change (%)
Table 4.7 28-day shrinkage per mixture
Mixture 28-day length change (%)
Control (SF8) -0.020
Flexural (SL22 SF8) -.0.024
Optimal all (SL12 SF4 FA1) -0.031
Compressive (SL8 SF8 FA3) -0.023
Workability (FA31 SF4) 0.006
4.3.3. Durability of Hardened Concrete. Durability parameters measured
include abrasion resistance, F-T resistance, scaling resistance from deicer exposure, and
chloride ion penetration.
4.3.3.1. Abrasion resistance. Abrasion resistance was measured through both the
Nordic Prall and the ASTM C944 mass loss test.
ASTM C944 Test: For abrasion resistance, generally as the SCM content
increased, the mass loss decreased (Figure 4.12). In particular, the SF4 mixture (4%
-0.04
-0.03
-0.02
-0.01
0.00
0.01
0.02
0 10 20 30
length
chan
ge
(%)
time (days)
Flexural (SL22 SF4)
Optimal all (SL12 SF4 FA1)
Compressive SL8 SF8 FA3)
Workability (FA31 SF4)
Control (SF8)

70
Figure 4.12 Mass loss of mixtures due to abrasion testing
SCMs) had the highest mass loss while the SL22 SF8 and FA31 SF4 mixtures (30% and
35% SCMs, respectively) had the lowest mass loss. Each mixture’s mass loss can also be
partially attributed to the higher packing density in mixtures containing SCMs as well as
the late-age strength-contributing pozzolanic reactions between the silica in the SCMs
and the available CH. Langan et al. (1990); Rashad et al. (2014); and Atiş (2002) all
found that generally when adding SCMs to mixes, as the compressive strength increased,
abrasion resistance increased. Rashad et al. (2014) measured abrasion resistance in wear
loss and found that as fly ash content increased to 70% in samples aged 28 to 180 days,
abrasion resistance was reduced. On the converse in the data presented here, the fly ash
mix had the lowest mass loss. The data presented here does align with the findings of
Atiş (2002). Atiş (2002) replaced cement with 50% and 70% fly ash and measured
3.01
1.26
1.86
2.51
1.24
0.0
0.5
1.0
1.5
2.0
2.5
3.0
3.5
Control Optimal flexural strengthOptimal flexural, compressive, and workabilityOptimal compressiveOptimal workability
aver
age
mas
s lo
ss (
‰)
Control
(SF8)
Flexural
(SL22 SF8)
Optimal all
(SL12 SF4 FA1)
Compressive
(SL8 SF8 FA3)
Workability
(FA31 SF4)

71
abrasion resistance in samples aged three days to three months and found that fly ash
mixtures had improved abrasion resistance over the all-cement mixtures.
Regarding slag, Fernandez and Malhotra (1990) measured the wear depth at 120
days of mixes containing up to 50% slag and found the addition of slag reduced abrasion
resistance, which does not align with the findings here. One challenge would be the
minimal mass loss compared to the sample size. Each sample weighed 40-43 pounds and
lost only 0.001 pounds (approximately one gram) after each application of the drill press.
Langan et al. (1990) also found their SCM-containing samples had minimal mass losses.
Abrasion by Studs, Method A: Prall Method: Of the five mixes, only the
quaternary SL12 SF4 FA1 and SL8 SF8 FA3 mixes performed satisfactory, according to
the Nordic Classification (Table 4.2). The other three mixes performed less satisfactorily
(Table 4.8 and Figure 4.13). These classifications are dependent on the volume lost, so if
there is a high Prall value of over 40 or 50 cm3, then the sample will be designated as less
satisfactory or poor, respectively. Although none of the samples had Prall values which
were good or very good, one contributing factor may have been the aggregate hardness,
which has found to be a large contributor to pavement performance (Frith et al., 2004).
SF8 SL22 SF8 SL12 SF4 FA1 SL8 SF8 FA3 FA31 SF4
Figure 4.13 Prall samples after testing (Bowthorpe, 2019)

72
Table 4.8 Prall test results
Mixture Prall-loss (cm3) Nordic Classification
SL8 45.3 Less satisfactory
SL22 SF8 43.2 Less satisfactory
SL12 SF4 FA1 37.3 Satisfactory
SL8 SF8 FA3 39.4 Satisfactory
FA31 SF4 49.5 Less satisfactory
Data was not collected in this study regarding the aggregate hardness, although
care was taken to use consistent aggregate during the screening and performance tests.
Research by Snilsberg et al. (2016) investigated the effect of aggregate size on the
abrasion resistance of asphalt pavements using the Prall test and a road simulator and
found the coarse aggregate content in asphalt concrete was an important contributing
factor to abrasion resistance, with smaller aggregate resulting in lower abrasion
resistance. The concrete in this study contained no coarse aggregates, which likely
contributed to the low Prall results as well. The materials technicians who performed the
Prall tests for this study also noted the small aggregate size, noting that although a skid
resistant calcined bauxite aggregate was used, the aggregate was very small which
resulted in a high paste surface area, which eroded, released the aggregate particles, and
may have contributed to the low test results (Bowthorpe, 2019).
Gartin and Saboundjian (2005) correlated four Alaskan asphalt pavement rutting
rates in inches per million traffic passes and their respective Prall values and found an R2
value of 0.933, suggesting a Prall test value is indicative of field performance. As
mentioned previously, they also measured the rut depth of two PCC WIM slabs in
Anchorage and compared their rutting to nearby asphalt pavements of the same age and

73
experiencing the same traffic. The PCC surfaces of WIM sites at Tudor Road and
Minnesota Road had 29% and 38% less rut depth, respectively, than those of the nearby
asphalt pavements measured.
Limited research was found on the Prall test results of other concrete pavements,
but Scholz and Keshari (2010) did conduct Prall tests on high strength concrete mixes.
Their results varied from 18.0 (very good) for a mixture with a 13,600 psi 28 day
compressive strength to 49.1 (less satisfactory) for their control mix which had a 7,900
psi 28 day compressive strength. In this study mixes had 28 day compressive strengths of
6,000 to 8,000 psi, which if 28 day compressive strength is indicative of abrasion
resistance, is reasonable given that some of the mixtures’ resistances were also classified
as less satisfactory, similar to Scholz and Keshari’s (2010) control mix. Although the
samples had results which varied from satisfactory to less satisfactory, according to their
Nordic Classification, it is important to keep in mind that this test is usually used in
Alaska to analyze the performance of flexible pavements, and therefore may not be as
predicative of concrete pavement’s field performance as it is for asphalt pavement.
4.3.3.2. Scaling resistance after exposure to deicing chemicals. Overall all the
mixtures performed poorly with visual ratings of four to five after 50 days of exposure to
a CaCl2 solution and daily F-T cycles. These visual ratings were based on the ASTM
C672 standard (Table 4.3). The SF4 and SL12 SF4 FA1 mixes performed the worst with
severe surface scaling and a visual rating of five at 50 days. The remaining mixes
performed marginally better with moderate to severe scaling at 50 days with visual
ratings of four (Tables 4.9 and 4.10).

74
Taylor et al. (2004) tested the scaling resistance of samples containing either all
cement, 50% slag, or 25% fly ash, and compared different finishing techniques. They
found that for samples which were finished soon after molds were filled, as was done in
this study, by 50 days the all-cement samples had an average rating of five, the 50% slag
mixtures had a rating of three, and the 25% fly ash samples had a 0.5 rating. Interestingly,
Bouzoubaâ et al. (2008) had different findings. In their study seven mixes were
investigated including an all-cement control, binary fly ash and slag mixtures, and ternary
mixtures of silica fume with either slag or fly ash. Their 25-35% fly ash mixes had a 50
day rating of five, while their 25-35% slag mixes having a rating of 3-4, and their all-
cement control mixture had a rating of zero. Similar to this study, after 50 days all mixes,
excluding the control, had ratings ranging from three to five. Sidewalks placed in Canada,
which were cast from the same mixes studied, found that after four winters, all mixes, but
the ternary fly ash silica fume mixture, had visual ratings of zero to three. The fly ash and
silica fume mix had a rating exceeding four. The authors concluded ASTM C672 may be
too severe since most of the mixes which perform poorly during the ASTM C672 tests
performed well in the field. Therefore although the mixes in this study had visual scaling
ratings of 4-5 at 50 days, this does necessarily mean they will perform poorly in the field.
Table 4.9 Visual rating at 50 days
Mixture Visual rating at 50 days
Control (SF8) 5
Flexural (SL22 SF8) 4
Optimal all (SL12 SF4 FA1) 5
Compressive (SL8 SF8 FA3) 4
Workability (FA31 SF4) 4
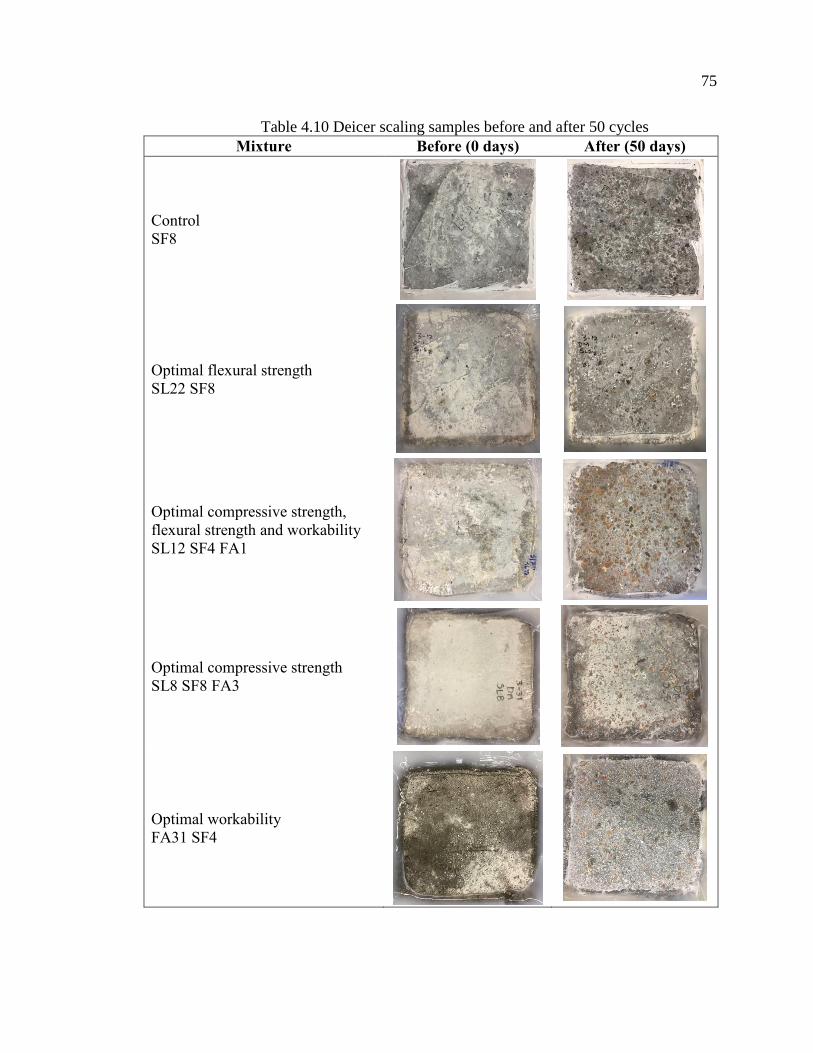
75
Table 4.10 Deicer scaling samples before and after 50 cycles
Mixture Before (0 days) After (50 days)
Control
SF8
Optimal flexural strength
SL22 SF8
Optimal compressive strength,
flexural strength and workability
SL12 SF4 FA1
Optimal compressive strength
SL8 SF8 FA3
Optimal workability
FA31 SF4
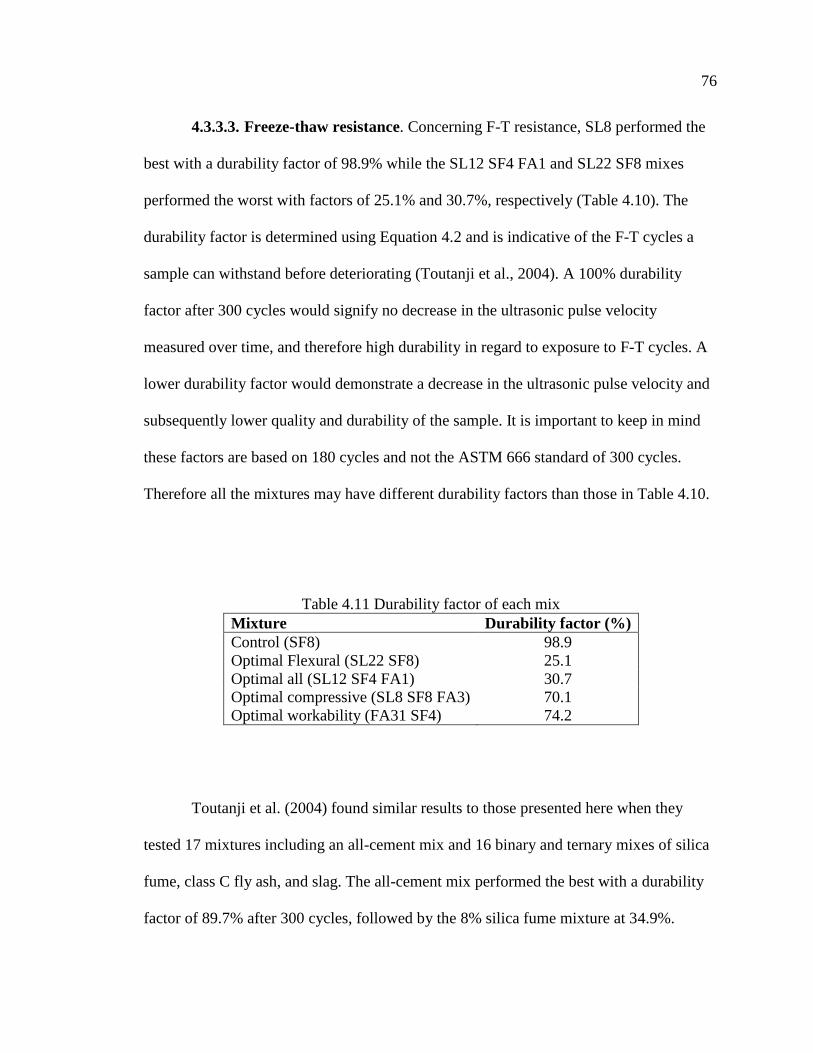
76
4.3.3.3. Freeze-thaw resistance. Concerning F-T resistance, SL8 performed the
best with a durability factor of 98.9% while the SL12 SF4 FA1 and SL22 SF8 mixes
performed the worst with factors of 25.1% and 30.7%, respectively (Table 4.10). The
durability factor is determined using Equation 4.2 and is indicative of the F-T cycles a
sample can withstand before deteriorating (Toutanji et al., 2004). A 100% durability
factor after 300 cycles would signify no decrease in the ultrasonic pulse velocity
measured over time, and therefore high durability in regard to exposure to F-T cycles. A
lower durability factor would demonstrate a decrease in the ultrasonic pulse velocity and
subsequently lower quality and durability of the sample. It is important to keep in mind
these factors are based on 180 cycles and not the ASTM 666 standard of 300 cycles.
Therefore all the mixtures may have different durability factors than those in Table 4.10.
Table 4.11 Durability factor of each mix
Mixture Durability factor (%)
Control (SF8) 98.9
Optimal Flexural (SL22 SF8) 25.1
Optimal all (SL12 SF4 FA1) 30.7
Optimal compressive (SL8 SF8 FA3) 70.1
Optimal workability (FA31 SF4) 74.2
Toutanji et al. (2004) found similar results to those presented here when they
tested 17 mixtures including an all-cement mix and 16 binary and ternary mixes of silica
fume, class C fly ash, and slag. The all-cement mix performed the best with a durability
factor of 89.7% after 300 cycles, followed by the 8% silica fume mixture at 34.9%.

77
Overall the binary fly ash mixtures performed poorly during F-T testing while the ternary
fly ash and slag mixtures and the binary slag mixtures had better resistance. Other
research by Chung et al. (2010) on all-cement, binary 10% silica fume and binary 20%
fly ash mixtures on varying w/c ratios and air contents found all mixtures to have
durability factors over 95%. It is important to keep in mind that F-T laboratory cycles are
more extreme than what would normally occur in the field and samples which perform
poorly in the lab may not always perform poorly in the field (Mehta, 1991).
4.3.3.4. Chloride ion penetration resistance. All mixtures had chloride ion
permeability ratings of low (<2000 coulombs) or very low (<1000 coulombs) with the
SL12 SF4 FA1 mixture having the highest charge passed and the fly ash mixture having
the lowest (Table 4.12). Since a low chloride ion penetration is indicative of low porosity,
which in turn is related to improved durability, all the mixtures would likely have good
durability performance in the field.
Table 4.12 Chloride permeability results
Mixture Coulombs Rating
Control (SF8) 429 Very low
Optimal Flexural (SL22 SF8) 619 Very low
Optimal all (SL12 SF4 FA1) 1038 Low
Optimal compressive (SL8 SF8 FA3) 378 Very low
Optimal workability (FA31 SF4) 250 Very low
Other researchers also found the addition of SCMs reduces permeability. In a
similar study, Gesoğlu et al. (2009) tested the chloride permeability of binary, ternary and

78
quaternary mixtures containing slag, fly ash and silica fume. While the all-cement
mixture had a moderate permeability rating, all the SCM mixtures had chloride
permeability ratings of either low or very low. They also tested binary and ternary
mixtures similar to those tested in this study. Their data ranged from 410-800 coulombs
with very low ratings, similar to the findings presented here. Nehdi et al. (2004) also
investigated the chloride permeability of SCM mixtures including binary mixtures
containing 50% fly ash or 50% slag, ternary mixtures of 25% fly ash and 25% slag, and a
mixture containing 20% slag, 24% fly ash and 6% silica fume. The control had a high
chloride ion permeability rating, the binary mixtures had moderate ratings and the ternary
and quaternary mixtures had low permeability ratings. Yang et al. (2017) also measured
the chloride permeability of all-cement mixtures as well as those containing either 40%
fly ash or slag. After wet curing for five days, samples were dry cured for 360 days. The
permeability ratings of the all-cement mixture was moderate, the fly ash mixture was low
and the slag mixture was very low. Although an all-cement mixture was not tested in this
study, all the SCM mixtures had low or very low chloride permeability ratings,
suggesting a high resistance to chloride ion penetration and subsequently good durability.
The lower chloride permeability of SCM mixtures can be partially due to the increased
particle packing of the concretes due to the typically smaller size of SCM particles in
comparison to cement particles.

79
5. PRELIMINARY COST ANALYSIS
A preliminary construction cost analysis for a hypothetical mile-long two-lane
high-traffic stretch of highway in Anchorage, Alaska was conducted to compare the
different concrete mixtures proposed. This analysis was conducted to evaluate the
economic efficiency of the fix mix designs investigated. Based on material costs from
Alaska Basic Industries in Anchorage from June 2019 (Schlee, 2019), the following raw
material costs were assumed (Table 5.1). The cost of ground granulated blast furnace slag
(GGBFS) in Fairbanks was assumed to be the same in Anchorage. These costs depend on
availability and the market, and that if constructing a pavement on a large scale, these
costs would likely be reduced due to purchasing materials in bulk.
Table 5.1 Cost of materials in Anchorage, AK in June 2019
Material Cost per unit
silica fume $30 / 25-lb
fly ash $295 / ton
cement $165 /ton
GGBFS (slag) $250 /ton (in Fairbanks)
Using construction cost data obtained from the RS Means Heavy Construction
Costs book (2019), the remaining construction costs were calculated. All costs were
based on an assumed 2-lane 24-feet wide pavement with a 24-inch-thick subbase.
Communications with Schaefer (2019) at Alaska DOT&PF found that a high traffic
(approximately 40,000 AADT) pavement in Central Alaska would generally have an 18-
80
36 inch deep subbase, depending on whether permafrost was present. Therefore a 24-inch
thick subbase was assumed. The concrete pavement was assumed to be six inches thick
with 18 pounds per square yard of reinforcing steel. In addition, transverse joint dowels
were assumed to be spaced at one foot with contraction joints spaced at 12 feet. All costs
obtained from RS means were increased by the Anchorage, Alaska rate of 115.8% the
national average. In addition, following the WSDOT (2018) example calculations, cost
increases of 5, 15, and 10% were added to represent the mobilization, engineering, and
contingencies costs, respectively (Table 5.2). The combined costs sourced from Alaska
prices of cementitious materials and RS cost estimations resulted in the following
assumed cost per two-lane one-mile stretch of pavement for each mix design (Table 5.3).
These values were calculated using the assumed quantities and costs summarized in
Table 5.2, but the SL8 cementitious value was changed to represent each mixture’s
respective cementitious materials cost, which are also summarized in Table 5.3 as the
cost per 6-inch-thick square-yard of pavement ($/6”-thick/yd2).
Based on the results the SL12 SF4 FA1 mix proves to be the most cost-effective
mix design at around $1.6 million dollars. This being said, the cost between the five
options varies only by about 2% with a standard deviation of $30,000. With such a
minimal difference between the construction cost of using any of the different concrete
mix designs in a pavement, any of the mixtures would likely be a good choice.
Since there are only a few concrete roads built and maintained by Alaska
DOT&PF it is challenging to estimate and verify these costs using historical data. The
cost of paving varies widely depending on the location, design, and traffic load, but for
comparison, Sullivan and Moss (2014), in their report for the Portland Cement

81
Association, estimated paving an urban 2-lane mile with concrete to cost $770,000.
Another estimate by the Arkansas Department of Transportation (ArDOT, 2016)
estimates the total costs for a mile-long concrete lane in Arkansas to be $1.1 million, or
around $2.2 per 2-lane mile. Although there appears to be a wide variance in these costs,
construction costs in Alaska are likely even higher due to the geographical location and
short construction season in Alaska.
Table 5.2 Assumed construction cost for 2-lane rigid pavement using Control SL8 Mix
Item Unit Cost
/unit
Quantity
/24'-wide road
mile
Total
($1000)
non-cementitious
materials
6"
pavement/yd2 15.09 14080 212
SL8 cementitious
materials*
6"
pavement/yd2 18.31 14080 258
placement labor and
equipment
6"
pavement/yd2 4.63 14080 65
18 lb./ yd2 reinforcing
steel yd2 15.86 14080 223
transverse joint dowels
every 12' ea. 13.32 10560 141
transverse contraction
joints every 12' l.f. 5.96 10560 63
24" deep subbase
course yd2 31.27 14080 440
subtotal 1,403
mobilization (5% materials) 45,205 1,448
engineering and contingencies (15% mobilization
and materials) 142,395 1,590
preliminary engineering (10% total) 109,169 1,699
total 1,699
*Cost/unit varies depending on mix. Cost is adjusted for Anchorage, AK prices
from RS Means national average.

82
Table 5.3 Estimated cost of each alternative
Alternative Cementitious Materials Total Cost
(no.) ($/6”-thick/yd2) ($/yd3) ($/2-lane mile)
1. SF8 18.31 110 1,699,000
2. SL22 SF4 19.26 116 1,713,000
3. SL12 SF4 FA1 14.31 86 1,643,000
4. SL8 SF8 FA3 18.86 113 1,707,000
5. FA31 SF4 15.84 95 1,665,000

83
6. CONCLUSION
The objective of this study was to identify and select concrete mix designs which
would provide excellent abrasion resistance and durability. Following this a literature
review of past and present studies regarding these topics was performed, as well as a
survey of Alaskan engineers and Alaska DOT&PF material and pavement engineers to
determine current practices and methods regarding concrete pavements in Alaska.
Preliminary screening tests of ternary mixtures containing silica fume with either GGBFS
or class F fly ash were conducted. Tests included workability, air content, compressive
strength and flexural strength. Following this four optimal mixtures were determined
using the statistical software Minitab. Results obtained were verified using special cubic
models and desirability functions. These four mixtures, as well as the control binary
mixture, were then subjected to further durability and mechanical testing. These mixtures
included an 8% silica fume control mixture (SF8), a 22% slag with 8% silica fume
mixture (SL22 SF8), 12% slag with 4% silica fume and 1% fly ash mixture (SL12 SF4
FA1), 8% slag with 8% silica fume and 3% fly ash mixture (SL8 SF8 FA3) and a mixture
containing 31% fly ash with 4% silica fume (FA31 SF4). Testing included drying
shrinkage, abrasion resistance, scaling resistance to deicer salts, F-T resistance and
chloride ion penetration resistance. Regarding each test the following results were found:
Regarding compressive strength and shrinkage, by 28 days the SF8 had the highest
compressive strength while the FA31 SF4 mixture had the lowest drying shrinkage at
0.01% expansion. However, all mixtures have 28-day compressive strength greater
than 6,000 psi, which fulfills the minimum strength requirement of 6,000 psi to be

84
considered high-strength concrete (ACI, 1992). All mixtures are also within the SCM
drying shrinkage limits of 0.04% suggested by Mokarem et al. (2005).
For abrasion resistance the FA31 SF4 mixture had the highest resistance by mass loss
and the SL12 SF4 FA1 mix had the lowest volumetric mass loss by Prall abrasion
testing. Regarding the mass loss, an average of only one gram of material was lost
after each application of the drill press, so overall there was almost negligible mass
loss equivalent to 0.01-0.03% per sample, indicative of likely a high abrasion
resistance to studded tires. For Prall abrasion testing, two mixtures had Nordic
Classifications of satisfactory while the remaining three were classified as less
satisfactory. Although the classification ratings are not all satisfactory, it is important
to keep in mind this test is usually used for asphalt pavements, and other researchers
(i.e. Scholz and Keshari, 2010) which used Prall testing to test their 8,000 psi
concrete found their ratings to be classified as less satisfactory as well, similar to
these findings.
The SL22 SF8, SL8 SF8 FA3 and FA31 SF4 mixes had similar 50 day visual ratings
of four, equivalent to moderate to severe scaling, when measuring their respective
deicer salt scaling resistance. The SL8 SF8 FA3 and SL12 SF4 FA1 mixes performed
worse with visual ratings of five, equivalent to severe scaling. Although these ratings
indicate the samples performed poorly, this may not be indicative of field
performance. For example, Bouzoubaâ et al. (2008) found that SCM mixes which
performed poorly during ASTM C672 did not have as severe scaling in the field.
After testing chloride ion penetration, all mixtures but SL12 SF4 FA1 had very low
ratings of less than 1,000 coulombs. SL12 SF4 FA1 had a low rating of 1,038

85
coulombs. FA31 SF4 had the lowest rating of 250 coulombs. Therefore all the
mixtures likely have low permeability and subsequently high durability.
For F-T resistance after 180 cycles the SF8 mixture performed the best with a
durability factor of 99% while the SL22 SF8 and SL12 SF4 FA1 mixtures performed
the worst with durability factors of 25% and 31%, respectively. The other two had
factors of 70% and 74%. A durability factor below 60% is considered failure, at
which point testing can end, and by 180 cycles two of the five mixtures had failed. A
preliminary cost analysis comparing the construction costs in Alaska associated with
each of the five performance testing mixtures found that the SL12 SF4 FA1 mixture
would have the lowest construction cost of $1.6 million per 2-lane highway. The
variance in cost though was minimal with the construction costs of the five mixtures
ranging from $1.6 to $1.7 million.
In terms of the properties evaluated within this study (i.e. strength, shrinkage,
chloride ion penetration, F-T resistance, deicer scaling resistance, and abrasion
resistance), the five mixtures, including the four optimal mixtures and control, all
provided overall good performance. Therefore of the five mixtures, the quaternary SL12
SF4 FA1 provided the overall best performance due to its good strength and abrasion
resistance, favorable fresh and durability properties, and low construction cost.
Subsequently, within the scope of this study, a quaternary mix design, containing
primarily silica fume and slag, appears to provide the overall best performance in terms
of strength, durability, abrasion resistance, and cost.
The next recommended step in this research would be constructing and
monitoring test sections in the field using the optimal mixtures determined to verify and

86
validate results generated from the laboratory tests. Long-term performance data could be
collected and analyzed for an in-depth life cycle cost analysis. In addition, this study
focused on silica fume, slag, and fly ash, but further research could investigate other
types and dosages of SCMs using additional tests and more extensive F-T testing.
Additionally, these tests primarily focused on properties measured over 28 days and
longer term strength and durability properties were not investigated. Further research into
the long term durability characteristics of abrasion resistant concrete pavements would
also be beneficial.

87
APPENDIX
Table A-1 Alaska fine aggregate gradation
Sieve No. % Total % Passing
1/2" 0.02 99.98
3/8" 0.01 99.97
#4 0.88 99.09
#8 8.23 90.86
#16 19.63 71.23
#30 43.71 27.52
#50 19.25 8.26
#100 6.53 1.73
Table A-2 Alaska intermediate aggregate gradation
Sieve No. % Total % Passing
1/2" 0.03 99.97
3/8" 1.74 98.23
#4 94.09 4.14
#8 3.81 0.33
#16 0.27 0.06
#30 0.01 0.05
#50 0.02 0.03
#100 0.00 0.03
Table A-3 Missouri fine aggregate gradation
Sieve No. % Total % Passing
3/4" 0.00 100.00
3/8" 0.06 100.00
#4 -0.01 100.00
#8 19.48 80.52
#16 11.53 68.99
#30 29.82 39.16
#50 29.52 9.65
#100 9.59 0.05

88
Table A-4 Missouri intermediate aggregate gradation
Sieve No. % Total % Passing
3/4" 0.00 100.00
3/8" 1.56 98.44
#4 82.67 15.77
#8 14.91 0.86
#16 0.56 0.29
#30 0.15 0.15
#50 0.15 0.00
#100 0.00 0.00
Table A-5 Prall test results
DEPARTMENT OF TRANSPORTATION
SOUTHEAST MATERIALS LAB
PRALL WORKSHEET
PROJECT: Diane Murph/Jenny Liu Research
project SAMPLE DATE: 6/7/2019
TECH: TB
Sample
Number
Mass
in Air
(A)
Weight
in Water
(B)
Mass
SSD
(C )
Bulk
Specific
Gravity
A/(C-B)
Mass
Cold
before
Abrasion
SSD
Mass
after
Abrasion
SSD
Abrasion
Value
1a 599.0 349.0 600.5 2.382 582.8 475.6 45.0
1b 571.8 333.9 573.0 2.391 574.6 465.7 45.5
Average 45.3
2a 585.1 343.8 586.5 2.411 587.7 471.9 48.0
2b 604.8 352.9 606.4 2.386 583.8 492.5 38.3
Average 43.2
3a 550.6 313.8 552.8 2.304 555.7 460.6 41.3
3b 569.1 322.9 571.5 2.289 545.0 468.9 33.2
Average 37.3
4a 557.3 315.9 559.9 2.284 532.7 449.3 36.5
4b 545.2 311.1 548.0 2.301 551.1 453.6 42.4
Average 39.4
5a 517.3 288.9 520.1 2.237 524.6 419.5 47.0
5b 569.3 321.0 572.4 2.265 551.5 433.7 52.0
Average 49.5

89
BIBLIOGRAPHY
"Abrasion by Studs, Method A: Prall Method." CEN WG1 Bituminous Materials,
European Standard Working Draft, Testing Bituminous Materials, TG2,
Reference No.: 1.14, TC 227, Work Item 00227122, Second Draft, March 1997.
"Alaska DOT&PF Regions." (n.d.). Alaska Department of Transportation and Public
Facilities. Retrieved from http://dot.alaska.gov/regions-portal.shtml.
"ArcGIS 2017 Average Annual Daily Traffic Counts." (2017). Retrieved from Alaska
DOT&PF
https://akdot.maps.arcgis.com/home/webmap/viewer.html?webmap=7c1e1029fdb
64d7a86449d55ef05e21c
"Statewide Socioeconomic Impacts of Usibelli Coal Mine, Inc." (2015). McDowell
Group. Prepared for Usibelli Coal Mine, Inc. Retrieved from
http://www.usibelli.com/pdf/McDowell-Report-Statewide-Socioeconomic-
Impacts-of-UCM-2015l.pdf
AASHTO (2017). TP 118-17 “Standard Method of Test for Characterization of the Air-
Void System of Freshly Mixed Concrete by the Sequential Pressure Method.”
Washington, D.C.: AASHTO.
Abaza, O. A. and M. A. Aboueid (2018). "Use of Steel Fiber–Reinforced Rubberized
Concrete for Roadway Intersections in Cold Regions: Alaska." Journal of
Transportation Engineering, Part B: Pavements 144(4): 04018048.
Abaza, O., Arafat, M., & Uddin, M. S. (2019). “Survey and Economic Analysis of
Pavement Impacts from Studded Tire Use in Alaska (No. FHWA-AK-RD-4000
(175)).”
ACAA. (2003). “Fly ash facts for highway engineers.” American Coal Ash Association.
US Department of Transportation, Federal Highway Administration.
ACI. (2012). "234R-06: Guide for the Use of Silica Fume in Concrete." Technical
Documents. American Concrete Institute. Farmington Hills, MI.
ACI. (1992). “363R-92 State-of-the-Art Report on High Strength Concrete.” American
Concrete Institute. Detroit, MI.
Aïtcin, P.-C. (2016). "Supplementary cementitious materials and blended cements."
Science and Technology of Concrete Admixtures, Elsevier: 53-73.

90
Aksezer, C. S. (2008). "On the sensitivity of desirability functions for multiresponse
optimization." Journal of Industrial and Management Optimization, 4(4), 685-
696.
Alaska DOT&PF (2017). "Standard Specifications for Highway Construction." Alaska
Department of Transportation and Public Facilities. Juneau, AK.
Alaska DOT&PF (2018). "Atigun River No. 2 Bridge on Dalton Highway." Alaska
Department of Transportation and Public Facilities Bridge Section.
Alaska DOT&PF (2018). "Troublesome Creek Bridge Deck." Department of
Transportation and Public Facilities Bridge Section.
Alaska DOT&PF (2018). “Standard Specifications for Airport Construction.” Alaska
Department of Transportation and Public Facilities. Juneau, AK.
Alaska Statutes (2018). “28.35.155 Operation of vehicle with certain tires prohibited.”
Retrieved from http://www.akleg.gov/basis/statutes.asp#28.35.140
ArDOT (2016). “Estimated Costs per Mile.” Retrieved from
https://www.arkansashighways.com/roadway_design_division/Cost%20per%20M
ile%20(JULY%202016).pdf
ASTM. (2018). “ASTM C38/C39M-18 Standard Test Method for Compressive Strength
of Cylindrical Concrete Specimens.” West Conshohocken, PA. Conshohocken,
PA.
ASTM. (2019). “ASTM C618-19 Standard Specification for Coal Fly Ash and Raw or
Calcined Natural Pozzolan for Use in Concrete.” West Conshohocken, PA: West
Conshohocken, PA.
ASTM. (2012a). "ASTM C672/C672M-12 Standard Test Method for Scaling Resistance
of Concrete Surfaces Exposed to Deicing Chemicals." West Conshohocken, PA:
ASTM International.
ASTM. (2012b). "ASTM C944/C944M-12 Standard Test Method for Abrasion
Resistance of Concrete or Mortar Surfaces by the Rotating-Cutter Method." West
Conshohocken, PA: ASTM International.
ASTM. (2015a). “ASTM C143/C143M-15a Standard Test Method for Slump of
Hydraulic-Cement Concrete.” West Conshohocken, PA: ASTM International.
ASTM. (2015b). "ASTM C666/C666M-15 Standard Test Method for Resistance of
Concrete to Rapid Freezing and Thawing." West Conshohocken, PA: ASTM
International.

91
ASTM. (2017a). "ASTM C157/C157M-17 Standard Test Method for Length Change of
Hardened Hydraulic-Cement Mortar and Concrete." West Conshohocken, PA:
ASTM International.
ASTM. (2017b). "ASTM C231/C231M-17a Standard Test Method for Air Content of
Freshly Mixed Concrete by the Pressure Method." West Conshohocken, PA: West
Conshohocken, PA.
ASTM. (2019). "ASTM C1202-19 Standard Test Method for Electrical Indication of
Concrete’s Ability to Resist Chloride Ion Penetration." West Conshohocken, PA:
ASTM International.
Atiş, C. D. (2002). "High volume fly ash abrasion resistant concrete." Journal of
Materials in Civil Engineering, 14(3), 274-277.
Bassuoni, M. and M. Nehdi (2005). "The case for air-entrainment in high-performance
concrete." Proceedings of the Institution of Civil Engineers-Structures and
Buildings 158(5): 311-319.
Berndt, M. (2009). "Properties of sustainable concrete containing fly ash, slag and
recycled concrete aggregate." Construction and Building Materials, 23(7), 2606-
2613.
Bhanja, S., & Sengupta, B. (2005). "Influence of silica fume on the tensile strength of
concrete." Cement and Concrete Research, 35(4), 743-747.
Bharatkumar, B., Narayanan, R., Raghuprasad, B., & Ramachandramurthy, D. (2001).
"Mix proportioning of high performance concrete." Cement and Concrete
Composites, 23(1), 71-80.
Bleszynski, R., Hooton, R. D., Thomas, M. D., & Rogers, C. A. (2002). "Durability of
ternary blend concrete with silica fume and blast-furnace slag: laboratory and
outdoor exposure site studies." Materials Journal, 99(5), 499-508.
Bouzoubaâ, N., Bilodeau, A., Fournier, B., Hooton, R., Gagné, R., & Jolin, M. (2008).
"Deicing salt scaling resistance of concrete incorporating supplementary
cementing materials: laboratory and field test data." Canadian Journal of Civil
Engineering, 35(11), 1261-1275.
Bowthorpe, T., Southcoast Region Materials Lab, Alaska DOT&PF (2019). Personal
communication.
Brunette, B. and J. Lundy (1996). "Use and effects of studded tires on Oregon
pavements." Transportation Research Record: Journal of the Transportation
Research Board(1536): 64-72.

92
Brunette, B., Retired Materials Engineer, Alaska DOT&PF (2019). Personal
communication.
Chindaprasirt, P., Homwuttiwong, S., & Sirivivatnanon, V. (2004). “Influence of fly ash
fineness on strength, drying shrinkage and sulfate resistance of blended cement
mortar.” Cement and Concrete Research, 34(7), 1087-1092.
Chung, C.-W., C.-S. Shon and Y.-S. Kim (2010). "Chloride ion diffusivity of fly ash and
silica fume concretes exposed to freeze–thaw cycles." Construction and Building
Materials 24(9): 1739-1745.
Cohen, M. D., J. Olek and W. L. Dolch (1990). "Mechanism of plastic shrinkage
cracking in portland cement and portland cement-silica fume paste and mortar."
Cement and Concrete Research 20(1): 103-119.
Connor, B., Alaska University Transportation Center Director, University of Alaska
Fairbanks (2019). Personal communication.
Cotter, A., & Muench, S. T. (2010). "Studded tire wear on Portland cement concrete
pavement in the Washington State Department of Transportation route
network." (No. WA-RD 744.3). Washington State Department of Transportation.
Office of Research and Library Services.
Currey, J., Northern Regions Materials Engineer, Alaska DOT&PF (2018). Personal
interview with X. Schlee.
Derringer, G., & Suich, R. (1980). "Simultaneous optimization of several response
variables." Journal of quality technology, 12(4), 214-219.
Detwiler, R. J., T. Kojundic and P. Fidjestol (1997). "Evaluation of bridge deck
overlays." Concrete International - Detroit - 19: 43-46.
Do, M.-T., Z. Tang, M. Kane and F. De Larrard (2007). "Pavement polishing—
Development of a dedicated laboratory test and its correlation with road results."
Wear 263(1-6): 36-42.
Du, L., & Folliard, K. J. (2005). “Mechanisms of air entrainment in concrete.” Cement
and concrete research, 35(8), 1463-1471.
Duan, P., Shui, Z., Chen, W., and Shen, C. (2013). "Effects of metakaolin, silica fume
and slag on pore structure, interfacial transition zone and compressive strength of
concrete." Construction and Building Materials, 44, 1-6.
El-Chabib, H., & Syed, A. (2012). "Properties of self-consolidating concrete made with
high volumes of supplementary cementitious materials." Journal of Materials in
Civil Engineering, 25(11), 1579-1586.

93
Elvik, R., L. Fridstrøm, J. Kaminska and S. F. Meyer (2013). "Effects on accidents of
changes in the use of studded tyres in major cities in Norway: a long-term
investigation." Accident Analysis and Prevention 54: 15-25.
Erdem, T. K., & Kırca, Ö. (2008). "Use of binary and ternary blends in high strength
concrete." Construction and Building Materials, 22(7), 1477-1483.
Fernandez, L. and V. M. Malhotra (1990). "Mechanical properties, abrasion resistance,
and chloride permeability of concrete incorporating granulated blast-furnace
slag." Cement, Concrete and Aggregates 12(2): 87-100.
FHWA (2018). Functional System Length - 2017. Miles by type of surface-rural. Federal
Highway Association.
Frith, D., D. Morian, S. Stoffels and S. Saboundjian (2004). "Hard aggregate resistance to
studded tires: Alaskan experience." Transportation Research Record: Journal of
the Transportation Research Board(1874): 19-28.
Gartin, R. S., & Saboundjian, S. (2005). "Development and Validation of Urban Alaskan
Pavement Rutting Models." (No. FHWA-AK-RD-04-02).
Gesoğlu, M. and E. Özbay (2007). "Effects of mineral admixtures on fresh and hardened
properties of self-compacting concretes: binary, ternary and quaternary systems."
Materials and Structures 40(9): 923-937.
Gesoğlu, M., E. Güneyisi and E. Özbay (2009). "Properties of self-compacting concretes
made with binary, ternary, and quaternary cementitious blends of fly ash, blast
furnace slag, and silica fume." Construction and building materials 23(5): 1847-
1854.
Güneyisi, E., Gesoğlu, M., Karaoğlu, S., & Mermerdaş, K. (2012). "Strength,
permeability and shrinkage cracking of silica fume and metakaolin concretes."
Construction and Building Materials, 34, 120-130.
Hagerman, K., Former Public Works Director, Borough of Petersburg, Alaska (2019).
Personal communication.
Hale, W. M., Freyne, S. F., Bush Jr, T. D., & Russell, B. W. (2008). "Properties of
concrete mixtures containing slag cement and fly ash for use in transportation
structures." Construction and Building Materials, 22(9), 1990-2000.
Harai, S., Senior Engineer, Harai & Associates, Inc. (2019). Personal communication.
Harings, D., Northwest Region Pavement Engineer, Wisconsin DOT (2019). Personal
communication.

94
Harwalkar, A. B. and S. Awanti (2014). "Laboratory and field investigations on high-
volume fly ash concrete for rigid pavement." Transportation Research Record
2441(1): 121-127.
Hilson, M., Public Works Director, Ketchikan, Alaska (2019). Personal communication.
Hooton, R. D. (2000). "Canadian use of ground granulated blast-furnace slag as a
supplementary cementing material for enhanced performance of concrete."
Canadian Journal of Civil Engineering, 27(4), 754-760.
Howell, R., Public Works Director, Wrangell, Alaska (2019). Personal communication.
Jahren, P. (1983). "Use of silica fume in concrete." Special Publication 79: 625-642.
Jensen, M. and P. F. Hansen (1996). "Autogenous deformation and change of the relative
humidity in silica fume-modified cement paste." Materials Journal 93(6): 539-
543.
Jin, S., Zhang, J., and Huang, B. (2013). "Fractal analysis of effect of air void on freeze–
thaw resistance of concrete." Construction and Building Materials, 47, 126-130.
Johnson, D. Anchorage Sand & Gravel. (2019) Personal communication.
Kanstad, T., Ø. Bjøntegaard, E. Sellevold, T. Hammer and P. Fidjestøl (2001). "Effects of
silica fume on crack sensitivity." Concrete International 23(12): 53-59.
Kemp, P., Pavement Unit Supervisor, Wisconsin DOT (2019). Personal communication.
Khan, M. (2003). "Permeation of high performance concrete." Journal of Materials in
Civil Engineering 15(1): 84-92.
Khan, S. U., M. F. Nuruddin, T. Ayub and N. Shafiq (2014). "Effects of different mineral
admixtures on the properties of fresh concrete." The Scientific World Journal
2014.
Kim, J.-E., W.-S. Park, Y.-I. Jang, S.-W. Kim, S.-W. Kim, Y.-H. Nam, D.-G. Kim and K.
Rokugo (2016). "Mechanical Properties of Energy Efficient Concretes Made with
Binary, Ternary, and Quaternary Cementitious Blends of Fly Ash, Blast Furnace
Slag, and Silica Fume." International Journal of Concrete Structures and Materials
10(3): 97-108.
King, D. (2012). “The effect of silica fume on the properties of concrete as defined in
concrete society report 74, cementitious materials.” In 37th Conference on our
world in concrete and structures, Singapore (pp. 29-31).

95
Korhonen, C. (2002). “Effect of high doses of chemical admixtures on the freeze-thaw
durability of portland cement concrete (No. ERDC/CRREL-TR-02-5).” Engineer
Research and Development Center. Hanover, NH. Cold Regions Research and
Engineering Lab.
Kupiainen, K. J. and L. Pirjola (2011). "Vehicle non-exhaust emissions from the tyre–
road interface–effect of stud properties, traction sanding and resuspension."
Atmospheric environment 45(25): 4141-4146.
Lang, E. and J. Geisler (1996). "Use of Blast Furnace Slag Cement With High Slag
Content for High-Performance Concrete." Concrete in the Service of Mankind—
Radical Concrete Technology: 67-76.
Langan, B., Joshi, R., & Ward, M. (1990). "Strength and durability of concretes
containing 50% Portland cement replacement by fly ash and other materials."
Canadian Journal of Civil Engineering, 17(1), 19-27.
Langan, B., K. Weng and M. Ward (2002). "Effect of silica fume and fly ash on heat of
hydration of Portland cement." Cement and Concrete research 32(7): 1045-1051.
Laplante, P., P.-C. Aitcin and D. Vezina (1991). "Abrasion resistance of concrete."
Journal of Materials in Civil Engineering 3(1): 19-28.
Lee, J.-H., & Yoon, Y.-S. (2015). "The effects of cementitious materials on the
mechanical and durability performance of high-strength concrete." KSCE Journal
of Civil Engineering, 19(5), 1396-1404.
Li, G. and X. Zhao (2003). "Properties of concrete incorporating fly ash and ground
granulated blast-furnace slag." Cement and Concrete Composites 25(3): 293-299.
Liu, T. C. (1981). “Abrasion resistance of concrete.” In Journal Proceedings (Vol. 78,
No. 5, pp. 341-350).
Lundström, R., R. Karlsson and L. G. Wiman (2009). "Influence of Pavement Materials
on Field Performance: Evaluation of Rutting on Flexible Semi-rigid and Rigid
Test Sections after 7 Years of Service." Road Materials and Pavement Design
10(4): 689-713.
Mack, S. (2010). "H.C. Redi Mix 65341 for Tok Weigh Station Report for AK DOT
Northern Region." Mappa Inc.
Malik, M. G. (2000). "Studded Tires in Oregon: Analysis of Pavement Wear and Cost of
Mitigation." Financial and Economic Analysis Unit, Financial Services, Central
Services Division, Oregon Department of Transportation.
Mappa, Inc. (2018). "Aggregate Service Record Twin Rich Pit, North Pole, AK Report
for University Redi Mix Concrete Products."

96
Marx, E., Senior Bridge Engineer, Alaska DOT&PF (2019). Personal communication.
Mazloom, M., Ramezanianpour, A., & Brooks, J. (2004). "Effect of silica fume on
mechanical properties of high-strength concrete." Cement and Concrete
Composites, 26(4), 347-357.
Mehta, P. (1985). "Studies on chemical resistance of low water/cement ratio concretes."
Cement and Concrete Research 15(6): 969-978.
Mehta, P. and O. Gjørv (1982). "Properties of portland cement concrete containing fly
ash and condensed silica-fume." Cement and Concrete research 12(5): 587-595.
Mehta, P. K. (1991). "Durability of concrete--fifty years of progress?" Special
Publication 126: 1-32.
Mehta, P. K. (1999). "Advancements in concrete technology." Concrete International
21(6): 69-76.
Meusel, J., & Rose, J. (1983). "Production of granulated blast furnace slag at sparrows
point, and the workability and strength potential of concrete incorporating the
slag." Special Publication, 79, 867-890.
Minitab 19 Statistical Software (2019). [Computer software]. State College, PA: Minitab,
Inc. (www.minitab.com)
Mokarem, D. W., Weyers, R. E., & Lane, D. S. (2005). "Development of a shrinkage
performance specifications and prediction model analysis for supplemental
cementitious material concrete mixtures." Cement and Concrete Research, 35(5),
918-925.
Naik, T. R., & Ramme, B. W. (1989). "High early strength concrete containing large
quantities of fly ash." ACI materials journal, 86(2), 111-116.
Naik, T. R., S. S. Singh and M. M. Hossain (1995). "Abrasion resistance of high-strength
concrete made with class C fly ash." Materials Journal 92(6): 649-659.
Nehdi, M., M. Pardhan and S. Koshowski (2004). "Durability of self-consolidating
concrete incorporating high-volume replacement composite cements." Cement
and Concrete Research 34(11): 2103-2112.
Oner, A., Akyuz, S., & Yildiz, R. (2005). "An experimental study on strength
development of concrete containing fly ash and optimum usage of fly ash in
concrete." Cement and Concrete Research, 35(6), 1165-1171.
Özbay, E., M. Erdemir and H. İ. Durmuş (2016). "Utilization and efficiency of ground
granulated blast furnace slag on concrete properties–A review." Construction and
Building Materials 105: 423-434.
97
Panjehpour, M., A. A. A. Ali and R. Demirboga (2011). "A review for characterization of
silica fume and its effects on concrete properties." International Journal of
Sustainable Construction Engineering and Technology 2(2).
Pigeon, M., J. Marchand and R. Pleau (1996). "Frost resistant concrete." Construction
and Building Materials 10(5): 339-348.
Sullivan, E and Moss, A (2014). Paving Cost Comparisons: Warm-Mix Asphalt Versus
Concrete. Portland Cement Association Market Intelligence.
Rashad, A. M., H. E.-D. H. Seleem and A. F. Shaheen (2014). "Effect of silica fume and
slag on compressive strength and abrasion resistance of HVFA concrete."
International Journal of Concrete Structures and Materials 8(1): 69-81.
Ravina, D., & Mehta, P. K. (1986). "Properties of fresh concrete containing large
amounts of fly ash." Cement and Concrete Research, 16(2), 227-238.
RSMeans (2019). "Heavy construction costs with RSMeans data 2019." Norwell, MA:
RSMeans.
Saito, M., Ohta, M., & Ishimori, H. (1994). “Chloride permeability of concrete subjected
to freeze-thaw damage.” Cement and Concrete Composites, 16(4), 233-239.
San Angelo, M., Statewide Materials Engineer, Alaska DOT&PF (2019). Personal
Communication.
Schaefer, H., Northern Regions Materials Lab Supervisor, Alaska DOT&PF (2019).
Personal communication.
Schlee, X., Alaska Concrete Alliance Co-Chair, Alaska Basic Industries Technical Sales
(2019). Personal communications.
Schlorholtz, S. (2004). “Development of performance of ternary mixes: Scoping study.”
Rep. No. DTFH61-01-X-00042 (Project 13), Center for Portland Cement
Concrete Pavement Technology, Ames, IA.
Scholz, T. V., & Keshari, S. (2010). "Abrasion-resistant concrete mix designs for precast
bridge deck panels (No. FHWA-OR-RD-11-04)." Kiewit Center for Infrastructure
and Transportation.
Shannag, M. (2000). "High strength concrete containing natural pozzolan and silica
fume." Cement and Concrete Composites, 22(6), 399-406.
Shehata, M. H. and M. D. Thomas (2002). "Use of ternary blends containing silica fume
and fly ash to suppress expansion due to alkali–silica reaction in concrete."
Cement and Concrete Research 32(3): 341-349.

98
Shi, C. and R. L. Day (2001). "Comparison of different methods for enhancing reactivity
of pozzolans." Cement and Concrete Research 31(5): 813-818.
Shi, X., M. Akin, T. Pan, L. Fay, Y. Liu and Z. Yang (2009). "Deicer impacts on
pavement materials: Introduction and recent developments." Open Civil
Engineering Journal 3: 16-27.
Shon, C.-S., A. Abdigaliyev, S. Bagitova, C.-W. Chung and D. Kim (2018).
"Determination of air-void system and modified frost resistance number for
freeze-thaw resistance evaluation of ternary blended concrete made of ordinary
Portland cement/silica fume/class F fly ash." Cold Regions Science and
Technology 155: 127-136.
Siddique, R. (2004). "Performance characteristics of high-volume Class F fly ash
concrete." Cement and Concrete Research 34(3): 487-493.
Siddique, R. (2011). "Utilization of silica fume in concrete: Review of hardened
properties." Resources, Conservation and Recycling 55(11): 923-932.
Sivasundaram, V., & Malhotra, V. (1992). "Properties of concrete incorporating low
quantity of cement and high volumes of ground granulated slag." Materials
Journal, 89(6), 554-563.
Snilsberg, B., Saba, R. G., & Uthus, N. (2016). “Asphalt pavement wear by studded
tires—Effects of aggregate grading and amount of coarse aggregate.” In Proc., 6th
Eurasphalt and Eurobitume Congress. Prague, Czech Republic: Czech Technical
Univ. in Prague.
Sonafrank, C. (2010). "Investigating 21st century cement production in interior Alaska
using Alaskan resources." Cold Climate Housing Research Center, Report, 12409.
Swamy, R. (1997). "Design for durability and strength through the use of fly ash and slag
in concrete." Special Publication 171: 1-72.
Tempest, B., T. Cavalline and J. Gergely (2017). "Predicting Corrosion-Related Bridge
Durability with Laboratory-Measured Permeability Results." Journal of
Performance of Constructed Facilities 31(5): 04017069.
Thomas, M., D. S. Hopkins, M. Perreault and K. Cail (2007). "Ternary cement in
Canada." Concrete international 29(7): 59-64.
Toutanji, H., Delatte, N., Aggoun, S., Duval, R., & Danson, A. (2004). "Effect of
supplementary cementitious materials on the compressive strength and durability
of short-term cured concrete." Cement and Concrete Research, 34(2), 311-319.

99
Wang, F. H., & Li, S. (2012). "Effect of silica fume on workability and water
impermeability of concrete." Paper presented at the Applied Mechanics and
Materials.
Wang, K., Lomboy, G., & Steffes, R. (2009). “Investigation into freezing-thawing
durability of low-permeability concrete with and without air entraining agent.”
Final Report.
Whiting, D. (1989). "Deicer scaling resistance of lean concretes containing fly ash."
Special Publication 114: 349-372.
Whiting, D. A., R. J. Detwiler and E. S. Lagergren (2000). "Cracking tendency and
drying shrinkage of silica fume concrete for bridge deck applications." Materials
Journal 97(1): 71-77.
Wisconsin State Legislature. (2017). "Chapter 347.45 Tire equipment." Retrieved from
https://docs.legis.wisconsin.gov/statutes/statutes/347/III/45.
WSDOT (2018). "Pavement Policy." Washington State Department of Transportation.
Multimodal Development and Delivery. Pavement Office. Olympia, WA.
Yang, J., Q. Wang and Y. Zhou (2017). "Influence of curing time on the drying shrinkage
of concretes with different binders and water-to-binder ratios." Advances in
Materials Science and Engineering 2017.
Yen, T., Hsu, T.-H., Liu, Y.-W., & Chen, S.-H. (2007). "Influence of class F fly ash on
the abrasion–erosion resistance of high-strength concrete." Construction and
Building Materials, 21(2), 458-463.
Yogendran, V., Langan, B., Haque, M., & Ward, M. (1987). "Silica fume in high-strength
concrete." Materials Journal, 84(2), 124-129.
Ženíšek, M., Vlach, T., and Laiblová, L. (2016). “Dosage of silica fume in high
performance concrete.” In Key Engineering Materials (Vol. 677, pp. 98-102).
Trans Tech Publications.
Zhang, P., D. Li, Y. Qiao, S. Zhang, C. Sun and T. Zhao (2018). "Effect of air
entrainment on the mechanical properties, chloride migration, and microstructure
of ordinary concrete and fly ash concrete." Journal of Materials in Civil
Engineering 30(10): 04018265.
Zubeck, H., Aleshire, L., Harvey, S., Porhola, S., & Larson, E. (2004). "Socio-Economic
Effects of Studded Tire Use in Alaska." Final Report. University of Alaska
Anchorage, 156.

100
VITA
Diane Mariah Murph grew up in Petersburg, Alaska. She earned her Bachelor of
Science in Civil Engineering from the University of Alaska Fairbanks in Fairbanks,
Alaska in May 2018. Later, in December 2019, she earned her Master of Science in Civil
Engineering from Missouri University of Science and Technology in Rolla, Missouri.
Following graduation she accepted employment with the Bureau of Reclamation.