Grameenphone Limited - EBL Securities Ltd.
39
Analyst: Mohammad Asrarul Haque [email protected] Phone: +880 1753 509329 Grameenphone Limited Valuation Update (21 June,2021) DSE: GP; BLOOMBERG: GRAM:BD Current Market Price: BDT 343.1 Target Price: BDT 355.0 Rating: Accumulate Outlook: Neutral Sector: Telecommunication Upside Potential:3.5% Exp. Dividend Yield: 3.8% Exp. Total Return: 7.3% Page 1 of 37 This research report is a property of EBL Securities Ltd. | Bangladesh Equities | 21 June 2021 N.B.: Disclaimer of the EBL Securities Ltd, the author(s) certification and rating definition have been provided at the end of the report. Industry Telecommunication Market Cap (BDT mn) 463,287.9 Paid-up Capital (BDT mn) 13,503.0 Rating Validity December 2021 52W High-Low 238.8 - 391.0 Forward PE 13.0 Forward PB 7.6 Current no. of shares (mn) 1,350.3 Free float shares (mn) 135.0 2019A 2020A 2021E 2022E Financial Information (BDT mn): Net Sales 143,656 139,606 140,422 141,558 EBITDA 90,103 87,090 85,986 87,480 EBIT 66,652 63,440 61,075 63,504 Profit After Tax 34,517 37,187 33,874 35,307 Total Assets 148,734 148,184 147,154 147,585 Total Debt & Lease 23,768 21,716 20,476 20,476 Total Equity 38,347 52,108 50,223 51,773 Retained Earnings 16,988 30,750 28,866 30,416 Cash 13,761 2,599 (525) 5,464 Dividend (C/B)% 130% 275% 250% 260% Margin: OPEX to Sales 31.4% 31.3% 33.2% 32.9% EBITDA 62.7% 62.4% 61.2% 61.8% Operating Profit 46.4% 45.4% 43.5% 44.9% Net Profit 24.0% 26.6% 24.1% 24.9% Growth (YoY): Net Sales 8.1% -2.8% 0.6% 0.8% EBITDA 13.6% -3.3% -1.3% 1.7% EBIT 17.4% -4.8% -3.7% 4.0% Net Profit 3.5% 7.7% -8.9% 4.2% Total Asset 7.2% -0.4% -0.7% 0.3% Profitability: ROA 24.0% 25.0% 22.9% 24.0% ROE 91.8% 82.2% 66.2% 69.2% Payout Ratio 50.9% 50.8% 99.7% 99.4% Dividend Yield 4.5% 7.9% 7.0% 7.3% PEG ratio 3.2 1.6 (1.6) 3.2 Leverage: Debt Ratio 16.0% 14.7% 13.9% 13.9% Debt-Equity 62.0% 41.7% 40.8% 39.5% Times Int. Earned 26.4 168.5 28.2 30.2 Altman Z SCORE 4.1 5.0 5.0 5.1 Valuation: EPS (BDT) 25.6 27.5 25.1 26.1 NAVPS (BDT) 28.4 38.6 37.2 38.3 P/E (x) 11.2 12.6 14.2 13.6 P/NAV (x) 10.1 9.0 9.5 9.3 EV/EBITDA (x) 4.4 5.6 5.8 5.7 EV/Sales (x) 2.8 3.5 3.6 3.5 Price/Sales (x) 2.7 3.4 3.4 3.4 Price/OCF (x) 6.7 14.0 8.3 8.1 *SOURCE; COMPANY DISCLOSURES & EBLSL RESEARCH; ** KEY TERMINOLOGIES ARE PRESENTED AT THE END OF THE REPORT Grameenphone Limited (GP) is the largest telecommunication service provider in Bangladesh. The immediate parent of GP is Telenor Mobile Communications AS and the ultimate parent is Telenor ASA; both the companies were incorporated in Norway. Key Catalyst Efficiency in managing solid growth in subscriber acquisition, revenue and net profit with controlled OPEX even in challenging business environment. Strong brand image and active subscriber base have positioned the company ahead of its rivals. GP recently acquired 10.4 MHz new spectrum at a cost of $391.15 million and currently holds a total of 47.4 MHz spectrum, highest in the industry. Growing contribution from data indicates growth potential. Contribution of data revenue increased to 24.4% in 2020 from only 8.1% in 2015. Handsome dividend payout policy (nearly 100% each year). Risk Factor Higher OTT platform use and high voice call rates causing decline in voice call services usage and revenue (6.6%YoY revenue drop in 2020). Growing use of ISP/PSTN broadband internet services may negatively affect long term cellular data consumption. Failure to successfully diversify business in new and innovative segments may lead to long-term business downsizing. Regulatory pressures and ongoing tussles between the operator and the regulator reducing the market value of GP. Any unfavorable outcome of ongoing dispute may lead to massive financial burden for the company and can cause significant value erosion. Tougher business restrictions from the regulator may emerge anytime on the ground of being an operator with significant market power (SMP). Grameenphone experienced remarkable regulatory challenges in the history of Bangladesh telecommunication industry over the last couple of years that are yet to fully settle. The year 2020 started with the continuation of the tussle between GP and BTRC (telecom regulator) concerning BDT125 bn system audit claim. However, GP managed to mitigate the dispute since the second quarter after deposit of BDT 20.0 billion against the audit dispute, as instructed by the honorable Supreme Court. Besides, the regulator also implemented initial SMP restrictions during the year. Meanwhile, GP’s earnings during the year were in line with our expectations. As this point of time, we view GP’s stock as fairly valued with its current market prices and our estimated intrinsic value based on our assessment of the operator’s future business potential while keeping in mind significant uncertainties and contingencies. We have updated our valuation model based on recent disclosures, our assessment of recent company performance and expectation of future outlook, macro-economic and industry outlook etc. We are assigning ‘Accumulate’ rating on GP stock with a December 2021 estimated intrinsic value of BDT 355.0 per share and 130% expected interim dividend. Our intrinsic price can yield a total 7.3% on holding GP stock till December 2021.
-
Upload
khangminh22 -
Category
Documents
-
view
2 -
download
0
Transcript of Grameenphone Limited - EBL Securities Ltd.

Analyst: Mohammad Asrarul Haque
[email protected] Phone: +880 1753 509329
Grameenphone Limited
Valuation Update (21 June,2021) DSE: GP; BLOOMBERG: GRAM:BD
Current Market Price: BDT 343.1 Target Price: BDT 355.0 Rating: Accumulate Outlook: Neutral
Sector: Telecommunication Upside Potential:3.5%
Exp. Dividend Yield: 3.8%
Exp. Total Return: 7.3%
Page 1 of 37 This research report is a property of EBL Securities Ltd. | Bangladesh Equities | 21 June 2021
N.B.: Disclaimer of the EBL Securities Ltd, the author(s) certification and rating definition have been provided at the end of the report.
Industry Telecommunication Market Cap (BDT mn) 463,287.9 Paid-up Capital (BDT mn) 13,503.0 Rating Validity December 2021 52W High-Low 238.8 - 391.0 Forward PE 13.0 Forward PB 7.6 Current no. of shares (mn) 1,350.3 Free float shares (mn) 135.0
2019A 2020A 2021E 2022E
Financial Information (BDT mn):
Net Sales 143,656 139,606 140,422 141,558
EBITDA 90,103 87,090 85,986 87,480
EBIT 66,652 63,440 61,075 63,504
Profit After Tax 34,517 37,187 33,874 35,307
Total Assets 148,734 148,184 147,154 147,585
Total Debt & Lease 23,768 21,716 20,476 20,476
Total Equity 38,347 52,108 50,223 51,773
Retained Earnings 16,988 30,750 28,866 30,416
Cash 13,761 2,599 (525) 5,464
Dividend (C/B)% 130% 275% 250% 260%
Margin:
OPEX to Sales 31.4% 31.3% 33.2% 32.9%
EBITDA 62.7% 62.4% 61.2% 61.8%
Operating Profit 46.4% 45.4% 43.5% 44.9%
Net Profit 24.0% 26.6% 24.1% 24.9%
Growth (YoY):
Net Sales 8.1% -2.8% 0.6% 0.8%
EBITDA 13.6% -3.3% -1.3% 1.7%
EBIT 17.4% -4.8% -3.7% 4.0%
Net Profit 3.5% 7.7% -8.9% 4.2%
Total Asset 7.2% -0.4% -0.7% 0.3%
Profitability:
ROA 24.0% 25.0% 22.9% 24.0%
ROE 91.8% 82.2% 66.2% 69.2%
Payout Ratio 50.9% 50.8% 99.7% 99.4%
Dividend Yield 4.5% 7.9% 7.0% 7.3%
PEG ratio 3.2 1.6 (1.6) 3.2
Leverage:
Debt Ratio 16.0% 14.7% 13.9% 13.9%
Debt-Equity 62.0% 41.7% 40.8% 39.5%
Times Int. Earned 26.4 168.5 28.2 30.2
Altman Z SCORE 4.1 5.0 5.0 5.1
Valuation:
EPS (BDT) 25.6 27.5 25.1 26.1
NAVPS (BDT) 28.4 38.6 37.2 38.3
P/E (x) 11.2 12.6 14.2 13.6
P/NAV (x) 10.1 9.0 9.5 9.3
EV/EBITDA (x) 4.4 5.6 5.8 5.7
EV/Sales (x) 2.8 3.5 3.6 3.5
Price/Sales (x) 2.7 3.4 3.4 3.4
Price/OCF (x) 6.7 14.0 8.3 8.1
*SOURCE; COMPANY DISCLOSURES & EBLSL RESEARCH; ** KEY TERMINOLOGIES ARE PRESENTED AT THE END OF THE
REPORT
Grameenphone Limited (GP) is the largest telecommunication service provider in Bangladesh. The immediate parent of GP is Telenor Mobile Communications AS and the ultimate parent is Telenor ASA; both the companies were incorporated in Norway.
Key Catalyst
Efficiency in managing solid growth in subscriber acquisition, revenue and net profit with controlled OPEX even in challenging business environment.
Strong brand image and active subscriber base have positioned the company ahead of its rivals.
GP recently acquired 10.4 MHz new spectrum at a cost of $391.15 million and currently holds a total of 47.4 MHz spectrum, highest in the industry.
Growing contribution from data indicates growth potential. Contribution of data revenue increased to 24.4% in 2020 from only 8.1% in 2015.
Handsome dividend payout policy (nearly 100% each year).
Risk Factor
Higher OTT platform use and high voice call rates causing decline in voice call services usage and revenue (6.6%YoY revenue drop in 2020).
Growing use of ISP/PSTN broadband internet services may negatively affect long term cellular data consumption.
Failure to successfully diversify business in new and innovative segments may lead to long-term business downsizing.
Regulatory pressures and ongoing tussles between the operator and the regulator reducing the market value of GP.
Any unfavorable outcome of ongoing dispute may lead to massive financial burden for the company and can cause significant value erosion.
Tougher business restrictions from the regulator may emerge anytime on the ground of being an operator with significant market power (SMP).
Grameenphone experienced remarkable regulatory challenges in the history of Bangladesh telecommunication industry over the last couple of years that are yet to fully settle. The year 2020 started with the continuation of the tussle between GP and BTRC (telecom regulator) concerning BDT125 bn system audit claim. However, GP managed to mitigate the dispute since the second quarter after deposit of BDT 20.0 billion against the audit dispute, as instructed by the honorable Supreme Court. Besides, the regulator also implemented initial SMP restrictions during
the year.
Meanwhile, GP’s earnings during the year were in line with our expectations. As this point of time, we view GP’s stock as fairly valued with its current market prices and our estimated intrinsic value based on our assessment of the operator’s future business potential while keeping in mind significant uncertainties and
contingencies.
We have updated our valuation model based on recent disclosures, our assessment of recent company performance and expectation of future outlook, macro-economic and industry outlook etc. We are assigning ‘Accumulate’ rating on GP stock with a December 2021 estimated intrinsic value of BDT 355.0 per share and 130% expected interim dividend. Our intrinsic price can yield a total 7.3% on holding GP stock till December
2021.
EQUITY RESEARCH Grameenphone Ltd. (DSE: GP; BLOOMBERG: GRAM:BD)
Page 2 of 37 This research report is a property of EBL Securities Ltd. | Bangladesh Equities | June 21, 2021
N.B.: Disclaimer of the EBL Securities Ltd, the author(s) certification and rating definition have been provided at the end of the report.
Statement of Comprehensive Income
Revenue (BDT mn)
Common Size (% of Sales)
Revenue (BDT mn)
Common Size (% of Sales)
2019 2020 Growth (YoY)
2019 2020 Q1,2020 Q1,2021 Growth (YoY)
Q1,2020 Q1,2021
Revenue 143,656 139,606 -2.8% 100.0% 100.0% 36,169 34,813 -3.7% 100.0% 100.0% Voice Traffic 104,863 97,962 -6.6% 73.0% 70.2% 25,575 24,770 -3.1% 70.7% 71.2% Data 29,830 34,000 14.0% 20.8% 24.4% 8,500 8,200 -3.5% 23.5% 23.6% VAS,SMS,MMS & Others 230 241 5.0% 0.2% 0.2% 63 63 -0.9% 0.2% 0.2% Interconnection 6,624 5,557 -16.1% 4.6% 4.0% 1,578 1,301 -17.5% 4.4% 3.7% Customer equipment 185 131 -29.4% 0.1% 0.1% 32 47 46.3% 0.1% 0.1% Lease revenues 1,538 1,570 2.0% 1.1% 1.1% 384 407 6.1% 1.1% 1.2% Other Revenue 386 145 -62.4% 0.3% 0.1% 37 25 -33.3% 0.1% 0.1% Cost of operation 31,916 32,463 1.7% 22.2% 23.3% 8,056 7,817 -3.0% 22.3% 22.5% Traffic charges 7,254 7,489 3.2% 5.0% 5.4% 1,902 1,889 -0.7% 5.3% 5.4% Cost of material and services 1,212 1,324 9.3% 0.8% 0.9% 283 472 67.1% 0.8% 1.4% Depreciation and amortization 23,451 23,650 0.8% 16.3% 16.9% 5,872 5,456 -7.1% 16.2% 15.7% Operating expenses 45,088 43,704 -3.1% 31.4% 31.3% 11,074 10,798 -2.5% 30.6% 31.0% Salaries and personnel cost 9,438 10,027 6.2% 6.6% 7.2% 2,333 2,430 4.2% 6.5% 7.0% Operation and maintenance 5,899 4,985 -15.5% 4.1% 3.6% 1,423 1,377 -3.2% 3.9% 4.0% Sales, marketing and commissions 13,480 11,771 -12.7% 9.4% 8.4% 3,229 3,076 -4.7% 8.9% 8.8% Revenue sharing & others 10,107 10,478 3.7% 7.0% 7.5% 2,586 2,435 -5.9% 7.2% 7.0% Other operating (expenses)/ income, net
6,164 6,442 4.5% 4.3% 4.6% 1,503 1,480 -1.5% 4.2% 4.3%
Profit From Operations 66,652 63,440 -4.8% 46.4% 45.4% 17,039 16,198 -4.9% 47.1% 46.5% Net Financial Expenses 2,523 376 -85.1% 1.8% 0.3% 606 534 -11.9% 1.7% 1.5% Profit Before Tax 63,899 62,801 -1.7% 44.5% 45.0% 17,234 15,668 -9.1% 47.7% 45.0% Profit After Tax For The Year 34,517 37,187 7.7% 24.0% 26.6% 10,690 8,906 -16.7% 29.6% 25.6%
Key Financial Statement Data (Amount in BDT mn)
Year 2012
Year 2013
Year 2014
Year 2015
Year 2016
Year 2017
Year 2018
Year 2019
Year 2020
Revenue 91,920 96,624 102,663 104,754 114,862 128,436 132,832 143,656 139,606 EBITDA 48,852 48,538 54,553 55,971 62,564 73,291 79,316 90,103 87,090 NPAT 17,505 14,702 19,976 19,707 22,526 27,423 33,363 34,517 37,187 Total Asset 118,029 135,283 130,981 132,450 130,500 134,391 138,713 148,734 148,184 Current Asset 14,005 16,993 14,865 11,928 10,941 19,799 13,369 20,999 9,931 Non-Current Asset 104,024 118,290 116,116 120,522 119,558 114,592 125,345 127,735 138,253 Cash & Cash Equivalent
3,709 4,624 4,760 4,153 2,912 12,415 5,932 13,761 2,599
Equity 35,458 31,141 31,365 30,625 33,572 34,066 36,836 38,347 52,108 Retained Earnings 11,959 9,781 10,005 9,266 12,213 12,707 15,477 16,988 30,750 Current Liability 63,424 78,643 61,710 67,625 68,507 78,274 82,963 90,426 76,656 Non-Current Liability 19,148 25,500 37,906 34,199 28,420 22,051 18,914 19,961 19,420 Total Liabilities 82,571 104,143 99,616 101,824 96,927 100,325 101,877 110,387 96,077 EPS (BDT) 13.0 10.9 14.8 14.6 16.7 20.3 24.7 25.6 27.5 NAVPS (BDT) 26.3 23.1 23.2 22.7 24.9 25.2 27.3 28.4 38.6
Key Quarterly Financials
Q1,2019 Q2,2019 Q3,2019 Q4,2019 Q1,2020 Q2,2020 Q3,2020 Q4, 2020 Q1, 2021
Gross Revenue (BDT mn) 34,862 36,037 36,593 36,164 36,169 33,069 35,559 34,810 34,813
Growth (YoY) 11.4% 10.6% 6.7% 4.4% 3.7% -8.2% -2.8% -3.7% -3.7%
Voice Revenue (BDT mn) 25,833 26,679 26,353 25,997 25,575 22,745 24,991 24,650 24,770
Growth (YoY) 13.0% 12.2% 3.7% 2.2% -1.0% -14.7% -5.2% -5.2% -3.1%
% of Sales 74.1% 74.0% 72.0% 71.9% 70.7% 68.8% 70.3% 70.8% 71.2%
Data Revenue (BDT mn) 6900 7200 7800 7930 8500 8400 8700 8400 8200
Growth (YoY) 19.0% 18.0% 18.2% 13.3% 23.2% 16.7% 11.5% 5.9% -3.5%
% of Sales 19.8% 20.0% 21.3% 21.9% 23.5% 25.4% 24.5% 24.1% 23.6%
EBITDA (BDT mn) 21,289 22,902 23,530 22,382 22,911 20,044 22,429 21,705 21,653
Growth (YoY) 18.0% 16.8% 12.5% 7.8% 7.6% -12.5% -4.7% -3.0% -5.5%
EBITDA margin 61.1% 63.6% 64.3% 61.9% 63.3% 60.6% 63.1% 62.4% 62.2%
Net profit (BDT mn) 8,772 9,552 7,269 8,924 10,690 7,266 8,899 10,333 8,906
Growth (YoY) 36.1% -8.1% -13.8% 10.3% 21.9% -23.9% 22.4% 15.8% -16.7%
Net profit margin 25.2% 26.5% 19.9% 24.7% 29.6% 22.0% 25.0% 29.7% 25.6%
EPS (BDT) 6.5 7.1 5.4 6.6 7.9 5.4 6.6 7.65 6.6

EQUITY RESEARCH Grameenphone Ltd. (DSE: GP; BLOOMBERG: GRAM:BD)
Page 3 of 37 This research report is a property of EBL Securities Ltd. | Bangladesh Equities | June 21, 2021
N.B.: Disclaimer of the EBL Securities Ltd, the author(s) certification and rating definition have been provided at the end of the report.
SYNOPSIS
Grameenphone Ltd. leads the telecommunication sector in Bangladesh with 46.5% subscriber market share. It has been leading the industry in almost every aspects such as subscription, revenue, cost leadership, profitability and innovation. The service portfolio of the operator mainly concentrated on voice and data segment only with almost 95% of total revenue contribution. The journey of Grameenphone as a telecom brand in Bangladesh started on 26th
March 1997 with an aim to empower the rural population of Bangladesh with network connectivity. It was the first telecom operator to launce pre-paid services in the country and the first telecom company to become listed with the capital market and has been maintaining highest market capitalization in DSE since its listing. Currently, Telenor Mobile Communications AS, Norway owns 55.8% ownership while Grameen Telecom, Bangladesh holds 34.2% ownership of the company.
The company grew at a rate of 5.9% over the last 5 years while its bottom-line also witnessed 13.5% CAGR during the same period. GP’s unique ability to control operating costs with higher efficiency led to significant improvement in profit margins that ultimately resulted into noticeable improvement in net profit margins. OPEX to sales reduced
to 31.3% in 2020 against 36.4% in 2015 and CAGR in net revenue during the same period was 13.5%. Efficiency in management of operating cost has been acting as the key catalyst for sound improvement in bottom-line over the years. Though ARPU experienced downtrend, stability in APPM and robust data consumption growth contributing towards improvement in EBITDA margin (53.4% in 2015 to 62.4% in 2020). GP’s unstoppable business growth is mostly supported by seasoned management expertise, brand loyalty, innovation in product and service offerings and growing reliance on technological solution in designing business strategy.
The company’s growing contribution from data indicates steady growth potential in near future. Contribution of data revenue increased to 24.4% in 2020 from only 8.1% in 2015 with 32% CAGR in data revenue against 5.9% CAGR in
total revenue. Data revenue growth in 2020 was driven by only 8% YoY growth in average data revenue per user per month (data ARPU) as a result of 52% data volume growth and 50% growth in Average Data usage per user per Months (AMBPU) despite 28% reduction in data prices (APPMB). Besides, accelerated drive on the expansion of 4G network capacity, along with the continued focus on 4G conversion also contributing towards higher data consumption. However, with higher use of over the top (OTT) calls in an environment of high voice call charges, revenue from voice calls may continue to decline, however, higher data revenue will partially offset the losses. GP recently acquired 10.4 MHz new spectrum at a cost of $391.15 million and currently holds a total of 47.4 MHz spectrum. GP is currently in a better position to offer better services with its highest spectrum holding in the industry and has recently converted all of its BTS (Base Transceiver Station) in to 4G.
Dispute on system audit claims by BTRC remains a concern but after initial deposit of BDT20.0 bn, the company’s relation with regulator and government has improved. Meanwhile, GP has been declared as an operator with Significant Market Power (SMP) and as per the SMP act, the regulator may time to time impose some business restrictions to restrict the operator from grabbing more market share.
As the local telecom industry is heading towards its maturity stage, with its conventional service offerings, GP is not also an exception. GP’s historical growth engine with steady operating performance is being challenged by slow-down
in average minutes of usages by consumers and lower revenue per user per months triggered by higher OTT platform dependency and significant decline in data prices. At present scenario, ignoring the regulatory tussles & pandemic impact, GP’s growth in next few years will be mostly driven by growth in data usage (AMBPU). However, as data price (APPMB) likely to decline further, data revenue growth will slow down. Currently, the country’s total internet penetration rate is 59.5% and internet penetration rate of GP is only 24%. So, we think that there is still room for growth in data subscription as well along with increase in average data consumption per user for the next few years. However, global telecom industry is taking a shift towards innovative product offerings, IOT and cloud based services, video streaming etc. if the company fails to diversify its business landscape with the changing trend in the industry, its future growth potential will become restricted. Meanwhile, the global pandemic, COVID-19 and its spread in Bangladesh and resultant country-wide shut-down/ lock-down also hampered the operational performance of the company and likely to affect the performance in 2021 as well due to persisting virus spread and future uncertainty.

EQUITY RESEARCH Grameenphone Ltd. (DSE: GP; BLOOMBERG: GRAM:BD)
Page 4 of 37 This research report is a property of EBL Securities Ltd. | Bangladesh Equities | June 21, 2021
N.B.: Disclaimer of the EBL Securities Ltd, the author(s) certification and rating definition have been provided at the end of the report.
Table of Contents
CONTENTS
SYNOPSIS............................................................................................................................................... 3
1.0 Investment Thesis .............................................................................................................................. 5
1.1 Valuation/ Determination of Intrinsic Value .......................................................................................... 5
1.2 Discounted Cash Flow Valuation: ....................................................................................................... 6
1.3 Relative Valuation ............................................................................................................................ 8
1.4 Peer Comparison ............................................................................................................................. 9
2.0 Business Description .......................................................................................................................... 13
2.1 Product & Services Offering .............................................................................................................. 13
3.0 Industry Review ................................................................................................................................ 14
3.1 The Industry in Focus ...................................................................................................................... 14
3.2 Market Competition Scenario ............................................................................................................ 15
3.3 Cellular Data Market Highlights ......................................................................................................... 17
3.4 Regulatory Landscape ...................................................................................................................... 18
3.4 Recent Developments in the Industry ................................................................................................. 18
3.5 Industry Outlook and Possible Future Developments ............................................................................ 19
4.0 Corporate Profile ............................................................................................................................... 21
Shareholding Pattern ............................................................................................................................ 21
5.0 Assessment of Corporate Governance ................................................................................................... 22
6.0 Core strengths, Challenges & Business Outlook of Grameenphone ............................................................ 23
7.0 Telecom Regulatory Environment for Grameenphone .............................................................................. 25
8.0 Analysis on Financial Performance ........................................................................................................ 27
9.0 Analysis on the Recent Financial and Operational Performance ................................................................. 31
9.1 Latest Q1,2021 Performance Review ................................................................................................. 31
Key Terminologies ................................................................................................................................... 34
Formulas Used ....................................................................................................................................... 34
Statement of Comprehensive Income......................................................................................................... 35
Statement of Financial Position ................................................................................................................. 36
Key Financial Indicators ........................................................................................................................... 37

EQUITY RESEARCH Grameenphone Ltd. (DSE: GP; BLOOMBERG: GRAM:BD)
Page 5 of 37 This research report is a property of EBL Securities Ltd. | Bangladesh Equities | June 21, 2021
N.B.: Disclaimer of the EBL Securities Ltd, the author(s) certification and rating definition have been provided at the end of the report.
1.0 INVESTMENT THESIS
1.1 Valuation/ Determination of Intrinsic Value
Fairly valued with moderate upside based on both DCF and
Relative Valuation Matrices
At the current market price of BDT 343.1 per share, GP’s shares have a P/E multiple of 13.0 for its Q1, 2021 annualized earnings as on 21 June 2021. Taking into consideration of a number of valuation multiples/ methods, intrinsic value for GP stands at BDT 355.0 per share, based on our estimate.
Grameenphone Ltd. appears to be fairly-valued at current market price based on absolute valuation based on projected cash flows and dividends and relative valuation methodologies calculated over 2012 to 2020 audited financial results and historical valuation multiples.
Determination of Fair Value Per Share
Valuation Methods Estimated Value Weights
Absolute Stock Valuation:
Terminal Cash Flow Method 339.2
50% Terminal EV/EBITDA Method 321.0
Dividend Discount Model 317.3
Residual Income Model 308.3
Average 321.5
Relative Valuation
Hist. Price to net revenue 347.3
50%
Hist. Price to cash flows 356.5
Hist. Price to earnings 427.2
Hist. Price to book value 414.9
Hist. EV/EBIT 392.1
Hist. EV/EBITDA 395.2
Average 388.9
Estimated Intrinsic Value 355.2
Current Price 343.1
Target Price 355.0
Expected Capital Gain 3.5%
Target Holding Period December 2021
Expected Dividend Yield 3.8%
Total Six Month's Return 7.3%

EQUITY RESEARCH Grameenphone Ltd. (DSE: GP; BLOOMBERG: GRAM:BD)
Page 6 of 37 This research report is a property of EBL Securities Ltd. | Bangladesh Equities | June 21, 2021
N.B.: Disclaimer of the EBL Securities Ltd, the author(s) certification and rating definition have been provided at the end of the report.
1.2 Discounted Cash Flow Valuation:
We have updated our DCF based valuation of Grameenphone Limited by forecasting Free Cash Flows up to 2030. To derive the intrinsic value, we estimated terminal value at the end of 2030 using- 1. Constant Growth Cash flow Method
2. EV/ EBITDA Exit Multiple Method Our DCF analysis with a discount rate of 11.14% & terminal growth rate of 3.5% and terminal EV/ EBITDA multiple of 6.5(x) gives us Enterprise Value of BDT 470.1 billion using the constant FCFF growth model and BDT 445.5 billion using Exit Multiple Method. The DCF based fair value using Constant Growth Cash Flow method stands at BDT 339.2 per share for the company and BDT 321.0 per share using Exit Multiple Method considering 1,350.3 million number of shares outstanding.
(Figures in BDT million) 2021 2022 2023 2024 2025 2026 2027 2028 2029 2030 DCF Valuation Based on Terminal Cash Flows Profit for the Year 33,874 35,307 36,691 37,410 37,113 37,966 38,171 37,650 37,054 36,646 Add: After Tax Interest Expenses 1,244 1,207 1,056 930 847 736 587 472 399 130 Add: Depreciation & Amortization 24,910 23,977 22,938 22,013 21,239 19,544 18,027 16,800 15,835 15,081 Less: Investment in NWC -1,383 1,216 18 429 1,040 557 942 1,271 1,159 1,035 Less: Capital Expenditures 26,809 17,553 17,553 17,553 17,553 12,000 12,000 12,000 12,000 12,000 Free Cash Flow to the Firm 34,603 41,721 43,114 42,371 40,605 45,689 43,843 41,651 40,129 38,822 Terminal value of FCF 525,872 Discount Factor 1.0000 0.8998 0.8096 0.7284 0.6554 0.5897 0.5306 0.4774 0.4296 0.3865 Present Value Adjusted Free Cash flow to the Firm
266,855
PV of Terminal value of FCF 203,245 Enterprise Value 470,100 Plus: Cash & cash equivalent 7,530 Less: Interest Debt 19,577 Equity Value 458,053 No. of Share Outstanding 1,350
Value per Share (BDT) 339.2
DCF Valuation Based on using Exit Multiple Method Terminal Value with assumed EV/ EBITDA 513,752 Free Cash Flow to the Firm 34,603 41,721 43,114 42,371 40,605 45,689 43,843 41,651 40,129 38,822 Discount Factor 1.0000 0.8997 0.8095 0.7284 0.6553 0.5896 0.5305 0.4773 0.4294 0.3864 Present Value of Explicit FCFF 266,855 Present Value of Terminal Value 178,657 Total Enterprise Value 445,512 Less: Debt 19,577 Add: Cash 7,530 Equity Value 433,465
Value per Share (BDT) 321.0
Residual Income Model
(Figures in BDT million) 2021 2022 2023 2024 2025 2026 2027 2028 2029 2030 Equity Charge 5,516 5,686 5,712 5,668 5,592 5,609 5,649 5,631 5,549 5,495 Residual Income 28,358 29,621 30,979 31,742 31,522 32,357 32,522 32,018 31,505 31,151 Terminal value of Residual Income
421,969
Beginning Book Value of Equity 52,107 Present Value of Residual Income
201,066
Present Value of Terminal Residual Income
163,088
Equity Value 416,120 Value Per Share 308.3
EQUITY RESEARCH Grameenphone Ltd. (DSE: GP; BLOOMBERG: GRAM:BD)
Page 7 of 37 This research report is a property of EBL Securities Ltd. | Bangladesh Equities | June 21, 2021
N.B.: Disclaimer of the EBL Securities Ltd, the author(s) certification and rating definition have been provided at the end of the report.
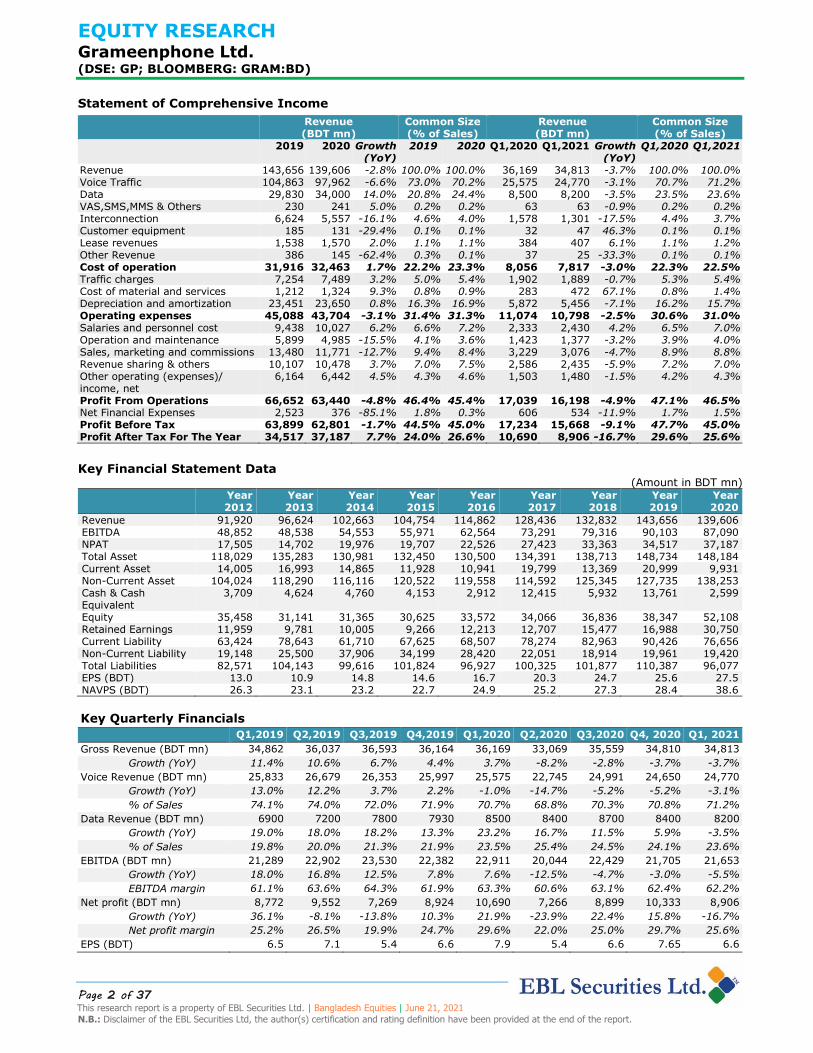
Dividend Discount Model
(Figures in BDT million) 2021 2022 2023 2024 2025 2026 2027 2028 2029 2030
Projected EPS 25.1 26.1 27.2 27.7 27.5 28.1 28.3 27.9 27.4 27.1 Projected Payout Ratio 99.7% 99.4% 99.4% 101.1% 101.9% 99.6% 99.1% 100.4% 100.2% 99.5% Dividend per share (DPS) 25.0 26.0 27.0 28.0 28.0 28.0 28.0 28.0 27.5 27.0 Terminal value of DPS 365.7 Dividend Growth Rate 78.6% 4.0% 3.8% 3.7% 0.0% 0.0% 0.0% 0.0% -1.8% -1.8% Present Value of projected DPS 176.0 PV of terminal value of DPS 141.2 Price per share 317.2
Weighted Average Cost of Capital and Terminal Growth Rate: We also ran a sensitivity analysis to check the effect of changes to our WACC and terminal growth
assumptions. We have checked the sensitivity analysis of DCF value per share on various discount rates and terminal growth rates and terminal EV/EBITDA multiple.
Sensitivity Analysis- Constant Growth Model
Discount Rates
Term
inal FC
F
Gro
wth
10.0% 10.5% 11.0% 11.2% 11.5% 12.0% 12.5% 13.0%
3.00% 375.9 353.8 334.3 327.2 317.1 301.8 288.1 275.6
3.25% 383.0 359.7 339.4 331.9 321.4 305.5 291.2 278.4
3.50% 390.7 366.1 344.7 337.0 326.0 309.4 294.6 281.3
3.75% 398.9 372.9 350.5 342.3 330.8 313.5 298.2 284.4
4.00% 407.9 380.3 356.6 348.0 336.0 317.9 301.9 287.7
4.50% 428.2 396.9 370.3 360.8 347.5 327.6 310.2 294.7
Sensitivity Analysis-Exit Multiple Method
Term
inal
EV
/E
BITD
A 10.0% 10.5% 11.0% 11.2% 11.5% 12.0% 12.5% 13.0%
4.00 286.8 279.3 272.1 269.3 265.2 258.6 252.2 246.0
6.00 331.9 322.4 313.3 309.8 304.6 296.2 288.2 280.5
6.50 343.2 333.2 323.6 319.9 314.5 305.7 297.2 289.1
7.00 354.5 344.0 333.9 330.0 324.3 315.1 306.2 297.8
8.00 377.1 365.6 354.6 350.3 344.0 333.9 324.3 315.0
9.00 399.6 387.1 375.2 370.5 363.7 352.8 342.3 332.3
BTRC Audit Dispute: Our valuation of Grameenphone Ltd. based on DCF using
Terminal Cash Flows model stands at BDT 339.0 per share. GP’s BDT 125.8 bn dispute have significant potential impact on the valuation. Of the amount, BDT 84.94 Bn (Principle 22.99 Bn + Interest 61.94 Bn) was claimed by BTRC and BDT 40.86 Bn was claimed on behalf of NBR. Meanwhile, GP has already deposited BDT 20.0 billion to BTRC as per the court order. So, there will be no further impact on cash flows from GP for the said amount, even though GP classified the amount as a current asset item (even if GP needs to report the cost as an expenses in its income statement in future period, the amount can be added back as a non-cash expenses for FCF calculation). However, if the final verdict goes in favor of GP, positive impact on GP’s cash flow is expected. Following impact on stock prices may happen if GP has to pay either full or partial payment on the audit dispute (after deducting BDT
20.0 billion already paid amount).
Fair valuation of GP Remaining Outlay
% of Payment 0% 10% 20% 30% 40% 50% 60% 70% 80% 90% 100%
On total amount 105.8 bn 339.2 331.4 323.6 315.7 307.9 300.0 292.2 284.4 276.5 268.7 260.9
On BTRC part (principal+ int) 64.9 bn 339.2 334.4 329.6 324.8 320.0 315.2 310.4 305.6 300.7 295.9 291.1
On principal+ NBR portion 43.9 bn 339.2 336.0 332.7 329.5 326.2 323.0 319.7 316.5 313.2 310.0 306.7
On principal amount only 3.0 bn 339.2 339.0 338.8 338.6 338.3 338.1 337.9 337.7 337.5 337.2 337.0
If GP wins the battle -20.0bn 354.0

EQUITY RESEARCH Grameenphone Ltd. (DSE: GP; BLOOMBERG: GRAM:BD)
Page 8 of 37 This research report is a property of EBL Securities Ltd. | Bangladesh Equities | June 21, 2021
N.B.: Disclaimer of the EBL Securities Ltd, the author(s) certification and rating definition have been provided at the end of the report.
1.3 Relative Valuation
We tried to compare the performance of Grameenphone Limited based on its
historical earnings multiple.
Earnings Based Valuation Comparable (Time Series Analysis):
(In BDT million*) 2012 2013 2014 2015 2016 2017 2018 2019 2020 CAGR 8 Years
A. Total assets 118,029 135,283 130,981 132,450 130,500 134,391 138,713 148,734 148,184 Asset growth 14.60% -3.20% 1.10% -1.50% 3.00% 3.20% 7.20% -0.40% 2.90% B. Net revenue 91,920 96,624 102,663 104,754 114,862 128,436 132,832 143,656 139,606 Net revenue growth 5.10% 6.30% 2.00% 9.60% 11.80% 3.40% 8.10% -2.80% 5.40% C. EBITDA 48,852 48,538 54,553 55,971 62,564 73,291 79,316 90,103 87,090 EBITDA growth -0.60% 12.40% 2.60% 11.80% 17.10% 8.20% 13.60% -3.30% 7.50% D. EBIT 33,675 33,199 36,896 36,964 41,566 49,954 56,777 66,652 63,440 EBIT growth -1.40% 11.10% 0.20% 12.50% 20.20% 13.70% 17.40% -4.80% 8.20% E. Net profit after tax 17,505 14,702 19,976 19,707 22,526 27,423 33,363 34,517 37,187 NPAT Growth -16.00% 35.90% -1.30% 14.30% 21.70% 21.70% 3.50% 7.70% 9.90% F. Net cash flow from operating activities
29,936 37,081 31,255 38,791 46,152 57,783 60,413 57,393 33,572
Cash flow growth 23.90% -15.70% 24.10% 19.00% 25.20% 4.60% -5.00% -41.50% 1.40%
G. Book value of equity 35,458 31,141 31,365 30,625 33,572 34,066 36,836 38,347 52,108 H. Enterprise value (EV) 245,952 291,406 517,343 371,620 407,458 642,456 503,395 395,923 487,806 I. No of shares outstanding 1,350 1,350 1,350 1,350 1,350 1,350 1,350 1,350 1,350 J. Price per share 175 200.9 361.9 253 284.1 470.8 367.3 285.8 347.1
Valuation Ratios
Median Price to net revenue 2.6 2.8 4.8 3.3 3.3 4.9 3.7 2.7 3.4 3.3 Price to cash flows 7.9 7.3 15.6 8.8 8.3 11.0 8.2 6.7 14.0 8.3 Price- earnings 13.5 18.5 24.5 17.3 17.0 23.2 14.9 11.2 12.6 17.0 Price- book value 6.7 8.7 15.6 11.2 11.4 18.7 13.5 10.1 9.0 11.2 EV/ EBIT 7.3 8.8 14.0 10.1 9.8 12.9 8.9 5.9 7.7 8.9 EV/ EBITDA 5.0 6.0 9.5 6.6 6.5 8.8 6.3 4.4 5.6 6.3
* All values are in BDT million except no of shares, growth rates & valuation multiples
Earnings & Book Value Based Valuation:
A. Historical Average Multiples(x) B. Exp. Values 2021 (BDT mn) C. Per share values
D. Price Per Share (A x C)
Price to net revenue 3.3 Net revenue 140,422 104.0 347.3 Price to cash flows 8.3 Cash Flows 57,905 42.9 356.5 Price to earnings 17.0 NPAT 33,874 25.1 427.2 Price to book value 11.2 Book Value 50,223 37.2 414.9
Average Value Per Share 386.5
Valuation based on Enterprise Value of the company
Based on Historical Enterprise Value Multiple EV/EBIT EV/ EBITDA Target Multiple 8.9 6.3 Bases (EBIT or EBITDA)- Est. 2021 61,075 85,986 Enterprise Value 541,506 545,724 Plus: Cash & cash equivalent 7,530 7,530 Less: Interest Debt 19,577 19,577 Equity Value 529,459 533,677 Value Per Share 392.1 395.2 Average Value per share 393.7

EQUITY RESEARCH Grameenphone Ltd. (DSE: GP; BLOOMBERG: GRAM:BD)
Page 9 of 37 This research report is a property of EBL Securities Ltd. | Bangladesh Equities | June 21, 2021
N.B.: Disclaimer of the EBL Securities Ltd, the author(s) certification and rating definition have been provided at the end of the report.
1.4 Peer Comparison Robi Axiata Limited (Robi) has recently been enlisted with Dhaka Stock Exchange and Chittagong Stock Exchange on 24 December, 2020. Key financial comparisons between the two companies are provided below.
ROBI Grameenphone Comparison
Key Fundamentals (As on 21 Jun 2021)
Market Cap (BDT mn) 230,993 463,288 2.0x
Enterprise Value (EV) (BDT mn) 279,914 482,405 1.7x
Stocks Price (BDT) 44.1 343.1 7.8x
Number of Shares Outstanding (mn) 5,238 1,350 0.3x
Annualized EPS (BDT) 0.28 26.38 94.2x
Last Audited EPS (BDT) 0.33 27.54 83.5x
Latest NAVPS (BDT) 12.7 45.19 3.6x
Year 2020 Year 2020
Balance Sheet Items (BDT mn) ROBI Grameenphone Comparison
Total Assets 199,465 148,184 0.7x
Current Assets 19,537 9,931 0.5x
Non-current Assets 179,928 138,253 0.8x
Total Equity 65,956 52,108 0.8x
Paid Up Capital 52,379 13,503 0.3x
Retained Earnings 6,914 30,750 4.4x
Cash & Cash Equivalent 9,833 2,599 0.3x
Total Debt (Excl. Lease) 24,337 1,240 0.1x
Total Lease 34,417 20,476 0.6x
Current Liabilities 73,800 76,656 1.0x
Non-current Liabilities 59,708 19,420 0.3x
Income Statement Items (BDT mn) ROBI Grameenphone Comparison
Revenue 75,643 139,606 1.8x
Cost of Operation 47,358 32,463 0.7x
Operating Cost 17,758 43,704 2.5x
EBITDA 31,917 87,090 2.7x
Operating Profit 10,526 63,440 6.0x
Finance Expenses 4,889 376 0.1x
Profit before tax 5,509 62,801 11.4x
Provision for tax 3,955 25,614 6.5x
Net Profit 1,553 37,187 23.9x
Ratios ROBI Grameenphone
ROA 0.8% 25.0%
ROE 2.4% 82.2%
Debt-Equity 89.1% 41.7%
Debt-Assets 29.5% 14.7%
EBITDA Margin 42.2% 62.4%
NPAT Margins 2.1% 26.6%
Pricing Based on Relative Valuation:
Particulars of GP Benchmark Multiple Exp. Value per share(BDT)
Peer Forward P/E An. EPS 2021: 26.38 156.43 4,127.1
Peer Forward P/NAVPS Latest NAPVPS: 45.19 3.46 156.3
Peer EV/EBIT EBIT: 63,440 mn 26.77 1,248.8
Peer EV/EBITDA EBITDA: 87,090 mn 8.72 553.5
Peer Price to Sales Sales per share:103.39 3.03 313.6
Peer Price to Cash Flow Cash Flow per share:24.86 9.01 224.1
Based on the above comparison, with most of the popular valuation methods, it appears that Grameenphone Limited
is currently undervalued compared to the valuation of Robi Axiata Ltd. However, in terms of the absolute valuation methodologies and relative valuation of Grameenphone based on its own historical multiples, we found that Grameenphone Limited is currently fairly priced with limited upside potential.

EQUITY RESEARCH Grameenphone Ltd. (DSE: GP; BLOOMBERG: GRAM:BD)
Page 10 of 37 This research report is a property of EBL Securities Ltd. | Bangladesh Equities | June 21, 2021
N.B.: Disclaimer of the EBL Securities Ltd, the author(s) certification and rating definition have been provided at the end of the report.
1.2 Key Valuation Assumptions/ Inputs
Based on prevailing industry perspective and our own assessment & expectation of
company performance, we have initiated some changes to our earlier projections. However, future projection is subject to enormous regulatory unpredictability. We tried to make the best possible forecast of GP’s financials based on available historical data, present industry insights and our own market observation.
Revenue: Grameenphone Ltd. achieved moderate 5.9% CAGR in its topline during the preceding five years (2015 to 2020). The growth in the recent period was mainly driven by increased contribution of data revenue. Even though Voice remained the core component of GP’s revenue pie, its contribution is on the decline. Contribution
from data revenue in 2020 stood at 24.4% against 20.8% in 2019.
Historical Projected
Particulars 2015 2016 2017 2018 2019 2020 2021 2022 2023 2024 2025 2026 2027 2028 2029 2030
Voice ARPU 129.8 125.8 126.1 127.0 124.5 111.0 104.0 96.2 88.4 80.6 72.8 67.6 62.4 57.2 52.0 46.8
AMPU 244 258 256 234 217 210 200 185 170 155 140 130 120 110 100 90
APPM (Inc. Interconnect) 0.53 0.49 0.49 0.54 0.57 0.53 0.52 0.52 0.52 0.52 0.52 0.52 0.52 0.52 0.52 0.52
APPM (Voice Only) 0.46 0.44 0.45 0.50 0.54 0.50 0.49 0.49 0.49 0.49 0.49 0.49 0.49 0.49 0.49 0.49
Data ARPU+ 53 60 63 62 64 69 73 74 71 67 63 59 56 53 52 51
AMBPU 284 488 651 1059 1653 2472 3461 4499 5399 6209 6985 7683 8452 9297 10226 11249 APPGB 192.4 125.3 99.2 60.2 39.7 28.7 21.5 16.8 13.4 11.0 9.2 7.9 6.8 5.9 5.2 4.6
Blended ARPU 155 162 167 157 157 150 143 139 135 129 122 116 110 103 96 90
Blended APPM 0.64 0.63 0.65 0.67 0.72 0.71 0.72 0.75 0.79 0.83 0.87 0.90 0.92 0.93 0.96 1.00
Total BD Population (mn) 158.9 160.8 162.7 164.6 166.5 168.4 170.4 172.3 174.3 176.3 178.3 180.4 182.4 184.5 186.7 188.8
Total GP Subscriber (mn) 56.7 58.0 65.3 72.7 76.5 79.0 82.2 85.5 88.9 92.5 96.2 100.0 104.0 108.2 112.5 117.0
Industry Sub. Penetration 84.2% 78.6% 89.2% 95.4% 99.4% 101.0% 103.0% 105.0% 107.5% 110.0% 112.5% 115.0% 117.5% 120.0% 122.5% 125.0%
Growth in GP Subscriber 10.0% 2.2% 12.7% 11.3% 5.1% 3.4% 4.0% 4.0% 4.0% 4.0% 4.0% 4.0% 4.0% 4.0% 4.0% 4.0%
GP Market Penetration 35.7% 36.0% 40.2% 44.2% 45.9% 46.9% 48.3% 49.6% 51.0% 52.4% 53.9% 55.4% 57.0% 58.6% 60.3% 62.0% GP Market Share 42.4% 45.9% 45.0% 46.3% 46.2% 46.5% 46.8% 47.2% 47.5% 47.7% 47.9% 48.2% 48.5% 48.8% 49.2% 49.6%
Mobile data Users (mn) 15.7 24.5 31.2 37.1 40.6 41.3 45.2 51.3 62.2 69.3 76.9 85.0 88.4 91.9 95.6 99.4
Net Addition (Data Subs. mn) 4.9 8.8 6.7 5.9 3.5 0.7 3.9 6.1 10.9 7.1 7.6 8.1 3.4 3.5 3.7 3.8
Growth in Data Subscription 45.4% 56.1% 27.3% 18.8% 9.5% 1.8% 9.5% 13.5% 21.3% 11.4% 10.9% 10.5% 4.0% 4.0% 4.0% 4.0%
Data Volume (Total) Growth 227.7% 168.1% 69.9% 93.2% 70.9% 52.2% 53.3% 47.5% 45.6% 28.1% 24.8% 21.6% 14.4% 14.4% 14.4% 14.4%
Data subscriber as
% of Total Users 27.7% 42.3% 47.8% 51.0% 53.1% 52.3% 55.0% 60.0% 70.0% 75.0% 80.0% 85.0% 85.0% 85.0% 85.0% 85.0% GP Data market penetration 9.9% 15.2% 19.2% 22.5% 24.4% 24.5% 26.5% 29.8% 35.7% 39.3% 43.1% 47.1% 48.5% 49.8% 51.2% 52.7%
Data Sources: Grameenphone Ltd, The World Factbook, CIA and EBLSL Own Estimate.
*Historical data as reported by the operator.
The key variables for voice revenue forecast are projected subscriber base and average voice revenue per user (ARPU). The subscriber base forecast is further
dependent on projected population of the country and expected industry subscriber penetration and expectation of GP’s market share within the industry. Meanwhile, projected average voice revenue per user (ARPU) also depends on expected average minutes of usage per subscriber (AMPU) and average price per minutes of voice calls (APPM). Likewise, our projection of future data revenue is also dependent on a number of variables including data market penetration, average data price (APPMB), data volume consumption (AMBPU) etc.
We have used following function to forecast the revenue of GP during our forecasted
horizon:
𝑅1 = 𝑆�� ∗ (𝑀 ∗ ��𝑚) + 𝑆𝐷 ∗ (𝑀𝐵 ∗ ��𝑚𝑏) + 𝑅𝑂
0 ∗ (1 + 𝑔𝑅𝑜)
Where,
𝑅1 = 𝑁𝑒𝑥𝑡 𝑝𝑒𝑟𝑖𝑜𝑑 𝑝𝑟𝑜𝑗𝑒𝑐𝑡𝑒𝑑 𝑟𝑒𝑣𝑒𝑛𝑢𝑒 𝑆�� = 𝐴𝑣𝑒𝑟𝑎𝑔𝑒 𝑛𝑢𝑚𝑏𝑒𝑟 𝑜𝑓 𝑣𝑜𝑖𝑐𝑒 𝑠𝑢𝑏𝑠𝑐𝑟𝑖𝑝𝑡𝑖𝑜𝑛 𝑀 = 𝐴𝑣𝑒𝑟𝑎𝑔𝑒 𝑚𝑖𝑛𝑢𝑡𝑒𝑠 𝑜𝑓 𝑢𝑠𝑎𝑔𝑒 ��𝑚 = 𝐴𝑣𝑒𝑟𝑎𝑔𝑒 𝑝𝑟𝑖𝑐𝑒 𝑝𝑒𝑟 𝑚𝑖𝑛𝑢𝑡𝑒𝑠 𝑀 ∗ ��𝑚 = 𝐴𝑣𝑒𝑟𝑎𝑔𝑒 𝑣𝑜𝑖𝑐𝑒 𝑟𝑒𝑣𝑒𝑛𝑢𝑒 𝑝𝑒𝑟 𝑢𝑠𝑒𝑟, 𝑖𝑛𝑐𝑙𝑢𝑑𝑖𝑛𝑔 𝑖𝑛𝑡𝑒𝑟𝑐𝑜𝑛𝑛𝑒𝑐𝑡𝑖𝑜𝑛 (𝐴𝑅𝑃𝑈) 𝑆𝐷 = 𝐴𝑣𝑒𝑟𝑎𝑔𝑒 𝑛𝑢𝑚𝑏𝑒𝑟 𝑜𝑓 𝑑𝑎𝑡𝑎 𝑠𝑢𝑏𝑠𝑐𝑟𝑖𝑝𝑡𝑖𝑜𝑛 𝑀𝐵 = 𝐴𝑣𝑒𝑟𝑎𝑔𝑒 𝑀𝑒𝑔𝑎𝐵𝑦𝑡𝑒 𝑜𝑓 𝑢𝑠𝑎𝑔𝑒 ��𝑚𝑏 = 𝐴𝑣𝑒𝑟𝑎𝑔𝑒 𝑝𝑟𝑖𝑐𝑒 𝑝𝑒𝑟 𝑀𝑒𝑔𝑎𝐵𝑦𝑡𝑒 𝑀 ∗ ��𝑚 = 𝐴𝑣𝑒𝑟𝑎𝑔𝑒 𝑑𝑎𝑡𝑎 𝑟𝑒𝑣𝑒𝑛𝑢𝑒 𝑝𝑒𝑟 𝑢𝑠𝑒𝑟 (𝐴𝑅𝑃𝑈) 𝑅𝑂
0 = 𝑙𝑎𝑠𝑡 𝑝𝑒𝑟𝑖𝑜𝑑 𝑟𝑒𝑣𝑒𝑛𝑢𝑒 𝑓𝑟𝑜𝑚 𝑜𝑡ℎ𝑒𝑟 𝑠𝑜𝑢𝑟𝑐𝑒𝑠 (𝐶𝑢𝑠𝑡𝑜𝑚𝑒𝑟 𝑒𝑞𝑢𝑖𝑝𝑚𝑒𝑛𝑡, 𝑉𝐴𝑆, 𝑆𝑀𝑆, 𝑀𝑀𝑆 & 𝑜𝑡ℎ𝑒𝑟𝑠) 𝑔𝑅𝑜
= 𝐺𝑟𝑜𝑤𝑡ℎ 𝑟𝑎𝑡𝑒 𝑜𝑓 𝑟𝑒𝑣𝑒𝑛𝑢𝑒 𝑓𝑟𝑜𝑚 𝑜𝑡ℎ𝑒𝑟 𝑠𝑜𝑢𝑟𝑐𝑒𝑠
Our long term business forecast of Grameenphone is based on the continuation of existing service portfolio of the operator. However, if the operator can successfully position itself in any new business segment with notable revenue contribution, we will revise our projections and valuation accordingly.

EQUITY RESEARCH Grameenphone Ltd. (DSE: GP; BLOOMBERG: GRAM:BD)
Page 11 of 37 This research report is a property of EBL Securities Ltd. | Bangladesh Equities | June 21, 2021
N.B.: Disclaimer of the EBL Securities Ltd, the author(s) certification and rating definition have been provided at the end of the report.
Voice AMPU experienced steady decline over the past years and declined to 210 minutes per user per month in 2020 from 258 minutes of usage in 2016. We expect the usage of voice calls will continue to decline in future along with higher OTT (Over the top) service adoption. The downside of average voice call price per minute is protected by the regulation (minimum floor prices in the industry) and that may increase further for GP, if regulator imposes price specific SMP instructions in future.
Average Data Consumption Per User (AMBPU) Growth
Average Data Price (APPMB) Growth
Source: EBLSL Research & Estimates
We expect that revenue from voice traffic will be declining while data revenue will be growing. However, data revenue will be growing at a decreasing rate as the period of faster data penetration is almost over and with continued price reduction and faster ISP/PSTN broadband penetration, mobile data consumption will become less attractive in the long run. Furthermore, even though data consumption is forecasted to grow steadily, in line with industry competition and regulatory
pressure, data prices will experience a declining trend in future, hurting the data revenue of the operator. Despite, the forecasted decline in voice revenue, it will remain as a key revenue contributor to the company’s earnings.
Revenue Contribution of Grameenphone Ltd.
Historical Projected
Particulars 2015 2016 2017 2018 2019 2020 2021 2022 2023 2024 2025 2026 2027 2028 2029 2030
Voice Traffic 70.3% 67.3% 65.9% 73.4% 73.0% 70.2% 68.1% 65.0% 61.6% 58.5% 56.0% 54.3% 52.8% 51.6% 49.8% 47.5%
Data 8.1% 12.5% 16.4% 19.2% 20.8% 24.4% 26.9% 30.1% 33.7% 36.9% 39.5% 41.2% 42.4% 43.3% 44.7% 46.6%
VAS,SMS,MMS & Others 7.3% 7.6% 7.3% 0.1% 0.2% 0.2% 0.2% 0.2% 0.2% 0.2% 0.2% 0.2% 0.2% 0.2% 0.2% 0.2%
Interconnection 10.2% 8.0% 6.7% 5.8% 4.6% 4.0% 3.6% 3.4% 3.2% 3.0% 2.9% 2.9% 3.0% 3.1% 3.1% 3.2%
Customer equipment 2.0% 2.4% 1.9% 0.1% 0.1% 0.1% 0.1% 0.1% 0.1% 0.1% 0.1% 0.1% 0.1% 0.1% 0.1% 0.1%
Lease revenues 0.0% 0.0% 0.0% 1.2% 1.1% 1.1% 1.1% 1.1% 1.1% 1.1% 1.1% 1.1% 1.2% 1.2% 1.2% 1.3%
Other revenue 2.2% 2.1% 1.7% 0.2% 0.3% 0.1% 0.1% 0.1% 0.1% 0.2% 0.2% 0.3% 0.4% 0.5% 0.8% 1.2%
Operating performance: Controlled cost of operation and operating expenditures
policy has resulted into increased operating profit margin. Higher revenue and operating efficiency contributing towards healthy EBITDA. GP has always focused in controlling its OPEX with efficient control measures, which resulted into growth in EBITDA as well as increased EBITDA margin over the years. EBITDA margin increased from 50.2% in 2013 to 62.4% in 2020. Analyzing the recent financials and observing the market scenario, we can expect that GP will continue to optimize its operating performance in line with revenue generation.
Following significant assumptions were applied to our projection of GP’s future financial performance. GP also shares 5.5% of its revenue as ‘revenue sharing’ and 1.0% of its revenue as ‘contribution to social obligation fund’ with BTRC as per licensing conditions. Licensing conditions also require the operator to pay annual fees and spectrum charges.
40.0
%
125.
4%
71.8
%
33.4
%
62.7
%
56.1
%
49.5
%
40.0
%
30.0
%
20.0
%
15.0
%
12.5
%
10.0
%
10.0
%
10.0
%
10.0
%
10.0
%-20.0%
0.0 %
20. 0%
40. 0%
60. 0%
80. 0%
100 .0%
120 .0%
140 .0%
201
4
201
5
201
6
201
7
201
8
201
9
202
0
202
1E
2022
E
202
3E
202
4E
202
5E
202
6E
202
7E
202
8E
2029
E
203
0E
Growth in AMBPU Linear (Growth in AMBPU)
-31.
2%
-57.
2%
-34.
9%
-20.
8%
-39.
3%
-34.
1% -27.
7%
-25.
0%
-22.
0%
-20.
0%
-18.
0%
-16.
0%
-15.
0%
-14.
0%
-13.
0%
-12.
0%
-11.
0%
-70.0%
-60.0%
-50.0%
-40.0%
-30.0%
-20.0%
-10.0%
0.0 %
2014
2015
2016
2017
2018
2019
2020
2021
E
2022
E
2023
E
2024
E
2025
E
2026
E
2027
E
2028
E
2029
E
2030
E
Growth in APPMB Linear (Growth in APPMB )
GP has most effective cost control mechanism in the industry

EQUITY RESEARCH Grameenphone Ltd. (DSE: GP; BLOOMBERG: GRAM:BD)
Page 12 of 37 This research report is a property of EBL Securities Ltd. | Bangladesh Equities | June 21, 2021
N.B.: Disclaimer of the EBL Securities Ltd, the author(s) certification and rating definition have been provided at the end of the report.
Cost Item Sources of Cost Historical Rates Forecast
2016 2017 2018 2019 2020 2021 to 2030
Traffic charges %of revenue from voice traffic & interconnection
6.62% 6.00% 5.75% 6.51% 7.23% 6.50%
Cost of material and services % of revenue from material and traffic charges
35.42% 33.54% 59.99% 51.80% 63.45% 61.00%
Salaries and personnel cost % of net sales 7.21% 6.87% 6.45% 6.57% 7.18% 7.20%
Operation and maintenance % of net sales 3.27% 3.12% 4.20% 4.11% 3.57% 4.00%
Sales, marketing and commissions % of net sales 10.88% 8.76% 10.60% 9.38% 8.43% 9.50%
Revenue sharing, spectrum charges, licence fees, & Contribution to Social Obligation Fund
% of net sales 7.75% 7.64% 7.21% 7.04% 7.51% 7.50%
Other operating income (expenses), net
% of net sales 7.14% 8.50% 6.32% 4.29% 4.61% 5.00%
Dividend history and projections: Like most other MNC’s, GP has a good track record of handsome cash dividend disbursements in the form of both interim and final payment. We expect that GP will continue to follow the same
payout policy, unless there arises any unforeseeable needs for retaining income.
Historical Dividend Payout 2012 2013 2014 2015 2016 2017 2018 2019 2020 Interim 90% 90% 95% 80% 85% 105% 125% 90% 130% Final 50% 50% 65% 60% 90% 100% 155% 40% 145% Total 140% 140% 160% 140% 175% 205% 280% 130% 275% DPS 14.0 14.0 16.0 14.0 17.5 20.5 28.0 13.0 27.5 EPS 13.0 10.9 14.8 14.6 16.7 20.3 24.7 25.6 27.5 Payout Ratio 108.0% 128.6% 108.2% 95.9% 104.9% 100.9% 113.3% 50.9% 99.9% Source: GP Annual Reports and EBLSL Research
Forecasted Dividend Payout
2021 2022 2023 2024 2025 2026 2027 2028 2029 2030 Interim 130% 130% 140% 150% 150% 150% 150% 150% 150% 150% Final 120% 130% 130% 130% 130% 130% 130% 130% 125% 120% Total 250% 260% 270% 280% 280% 280% 280% 280% 275% 270% DPS 25.0 26.0 27.0 28.0 28.0 28.0 28.0 28.0 27.5 27.0 EPS 25.1 26.1 27.2 27.7 27.5 28.1 28.3 27.9 27.4 27.1 Payout Ratio 99.7% 99.4% 99.4% 101.1% 101.9% 99.6% 99.1% 100.4% 100.2% 99.5% Source: EBLSL Research Estimates
Potential Litigation Risk: Grameenphone experienced significant disruption in its operation in last couple of years caused by the regulatory tussles with BTRC, notably for BDT125.8 Bn information system audit claim from the operator. Of the amount, BDT 84.94 Bn (Principle 22.99 Bn + Interest 61.94 Bn) was claimed by BTRC and BDT 40.86 Bn was claimed on behalf of NBR. In 2011, BTRC conducted its first audit on Grameenphone Ltd. but the operator then disputed the audit process. Again another fresh audit was conducted in 2015 for the period of 1997 to 2014 but GP continued to deny the claim by questioning the validity and process of the audit.
Meanwhile, NOC’s for various services were also halted by the regulator to pile up pressure on the operator that has hampered the operating activities of the company significantly during the year 2019 and early 2020. The government was also preparing to appoint administrator at Grameenphone Ltd. However, as per the order of the Appellate Division of Supreme the court, GP has deposited BDT 20 billion to BTRC in first half of 2020. After the said deposit, GP’s relation with the regulator eased and several restrictions were withdrawn. The matter is now under the jurisdiction of the Court. Significant uncertainty still prevails there regarding the final settlement of the dispute. Any unfavorable verdict may cause large one time cash outlay from the operator’s book.
BTRC Audit dispute for BDT125.8 Bn
yet remain unresolved

EQUITY RESEARCH Grameenphone Ltd. (DSE: GP; BLOOMBERG: GRAM:BD)
Page 13 of 37 This research report is a property of EBL Securities Ltd. | Bangladesh Equities | June 21, 2021
N.B.: Disclaimer of the EBL Securities Ltd, the author(s) certification and rating definition have been provided at the end of the report.
2.0 BUSINESS DESCRIPTION
Grameenphone Ltd. operates a digital mobile telecommunications network based on the GSM standard in the 900 MHz, 1800 MHz and 2100 Mhz frequency bands, under the license granted by the Bangladesh Telecommunication Regulatory Commission (BTRC). The company was awarded with license of 4G/LTE cellular mobile phone services on 19 February 2018. Over the last decade, Grameenphone
has added 13,443 users per day on average.
In addition to existing 37 MHz spectrum, GP has acquired fresh 10.4 MHz spectrum in March 2021 at a combined cost of $378.75 million plus 15% VAT. Total spectrum holding of the company as on date stands at 47.4 MHz.
Mobile spectrum licenses held by Grameenphone Ltd. Spectrum Bandwidth (MHz) Expiry 900 MHz 2×7.4 2026
1800 MHz 2×7.2 + 2×7.4 2026 2x5 2033 2x0.4 2036
2100 MHz 2×10 2028 2x 10 2036
Grameenphone LTD: Key Statistics No of Subscribers 80.75 mn* Pre-paid user % of total 98.0% Mobile data Users 41.7 mn*
4G Subscriber 21.5 mn # of 4G sites 15,590 Geographic Coverage 96.3% Population Coverage 99.6% 4G Population Coverage 95.8% Smartphone Users having GP connection 28.4 mn *As on March 2021; in April No of Subscribers declined to 80.50 mn
2.1 Product & Services Offering
Until now 70% of the company’s revenue are generated for voice traffic service. Data service revenue is continuously increasing its share of pie while contribution from voice traffic service is declining due to robust growth in data revenue. Grameenphone is continuously diversifying its product offerings to retain its growing momentum in the digital marketplace. The operator has been focusing on simplification of its voice call offerings and in line with this, several of the Voice Call packages has been discontinued over the years. GP’s 98% of subscribers are prepaid package subscribers. Currently, in pre-paid segments only 4 packages are available.
Grameenphone Pre-paid Packages
Nishchinto (Attractive Flat Rate for All)
Bondhu (Highest F&F Numbers)
Djuice (Exclusive Community Rate)
Smile
Call Rate: 24 poisha/ 10 second FNF: N/A SMS: 50 poisha / SMS and 25 Poisha/ Bangla SMS Pulse: 10 second
Call Rate: 27.5 poisha/10 second FNF: 1 Super FnF (7.5 poisha/10 second) & 17 FnF (12 poisha/10 second) SMS: 50 poisha / SMS and 25 Poisha/ Bangla SMS Pulse: 10 second
Call Rate: 26 poisha/ 10 second FNF: 10 FnF (12 poisha/ 10 second) & 5 Super FnF (7.5 poisha/ 10 second) SMS: 50 poisha/SMS and 25 Poisha/ Bangla SMS Pulse: 10 second
Call Rate: 28 poisha/ 10 second FNF: 3 FnF (12 paisa/10 second) SMS: 50 poisha / SMS and 25 Poisha/ Bangla SMS Pulse: 10 second
Source: Grameenphone website & EBLSL Research; As on 09 May 2021.
Along with those voice packages, Grameenphone offers customer with more simplified & user-friendly services through customized bundle packs and flexi plans (where customers can make their chosen voice and data bundle with chosen duration of validity). GP has multiple data offerings ranging from 1 day to 30 days
GP provides all kinds of
telecommunication related services
available in the country with its largest network coverage
Voice traffic is the main service offering
of the company with 98% of the pre-
paid user base.

EQUITY RESEARCH Grameenphone Ltd. (DSE: GP; BLOOMBERG: GRAM:BD)
Page 14 of 37 This research report is a property of EBL Securities Ltd. | Bangladesh Equities | June 21, 2021
N.B.: Disclaimer of the EBL Securities Ltd, the author(s) certification and rating definition have been provided at the end of the report.
of validity and very small to large volume packs. Data price has been reduced over time in line with the market competition. Despite the reduction in data prices, the company has been able to achieve robust data service revenue growth due to large addition to data subscriber base and increased data usage per subscriber.
Besides voice traffic and data service offerings, the operator has also diversified its businesses in different VAS, GP online shop for selling mobile communication devices to end customers, financial services like GPAY and MobiCash along with several IoT & cloud based services including MyGP, WowBox and GP Music etc. app based digital services. Innovation in these digital services has the potential to reshape the business model of the operator in future even though nothing such services could have visible impact on the financials of the operator yet.
3.0 INDUSTRY REVIEW
Two major telecom service offerings in Bangladesh are “Voice Calls” and “Internet Data” services. Revenue from voice calls still dominate the industry while contribution from data revenue is growing exponentially since the launching of 3G
in Bangladesh. Meanwhile, introduction of 4G in 2018 has further uplifted the data service revenue even though the country is yet to reap the full potential of 4G.
However, voice revenue is expected to remain key revenue drivers over the next few years despite the declining trend over the last few years against increased data usage growth and increasing trend in OTT (Over the Top) usage.
The surge in Covid-19 pandemic in Bangladesh since the early 2020 has increased the adoption of digital lifestyle and working
culture has also become more digitalized and relevant regulatory barriers have been removed. Mobile telephone services has become a key players in today’s economic activities and other essential services. However, COVID-19 has triggered deepest recession globally since the last year and ultimate outcome is yet unknown. The pandemic is expected to trigger major contraction across countries and also could have lasting impact on the productivity and potential output. Likewise, the economy of Bangladesh also comprise of large number of daily wage earners and salaried persons, who lost their jobs all on a sudden. While the economic recovery from the slowdown will depend on multitude of factors, most of the
Asian countries including Bangladesh has shown faster recovery than expected.
3.1 The Industry in Focus:
Favorable macro-economic dynamics helping the industry growth: The growing MAC population, large number of young age population, increased
urbanization, and consistent GDP growth, digitalization of public and private services along with increased access to data connectivity are the key growth drivers for the industry. Young and middle-aged people are the major users of mobile communication devices and around 60% of the entire country belongs to these two groups. The country has a large population base with steadily increasing disposable income along with comparatively low penetration of internet connectivity. The country is now undergoing a transformation period towards getting more digital that will have a major contribution from
telecommunication industry and the industry is also expected to enjoy sound growth along with this transformation journey.
A multi-SIM market with growing subscriber base: The telecom sector is Bangladesh is expected to witness modest growth in terms of subscriber acquisition as unique subscriber penetration is lower and favorable macro-economic dynamics are expected to make positive contribution towards
Key Product/Service Portfolio
Source: Company disclosure
Bangladesh Telecom Industry Subscriptions (In Mn)
Source: BTRC data and EBLSL Projections; F=EBLSL forecast.
Bangladesh Age Distribution Structure
Source: CIA (US Central Intelligence Agency) World Fact Book 2020 est.
Voice Trafic, 70.2%
Data, 24.4%
Interconnection, 4.0%
Other Revenue, 1.5%
-
25.0
50.0
75.0
100.0
125.0
150.0
175.0
200.0
225.0
250.0
201
5
201
6
201
7
201
8
201
9
202
0
202
1F
202
2F
202
3F
202
4F
202
5F
202
6F
202
7F
202
8F
202
9F
203
0F
26.48%
18.56%
40.72%
7.41% 6.82%
0.0 0%
5.0 0%
10. 00%
15. 00%
20. 00%
25. 00%
30. 00%
35. 00%
40. 00%
45. 00%
0-14 years: 15-24years:
25-54years:
55-64years:
>65 years:
Revenue from voice calls dominate the industry

EQUITY RESEARCH Grameenphone Ltd. (DSE: GP; BLOOMBERG: GRAM:BD)
Page 15 of 37 This research report is a property of EBL Securities Ltd. | Bangladesh Equities | June 21, 2021
N.B.: Disclaimer of the EBL Securities Ltd, the author(s) certification and rating definition have been provided at the end of the report.
increased digitalization and higher adoption of telecom services. With current smartphone penetration of 38.76% of mobile users and 59.76% real SIM penetration in the country population, there remains significant room for growth.
The ‘Digital Bangladesh’ vision has accelerated the industry growth: The Digital Bangladesh Journey is gaining momentum with the increased collaboration between government and the telecom industry. The government of Bangladesh, through its 7th five year plan had reinforced its goals and objectives for digital Bangladesh with adoption of IT practices and tools on a wider scale to enable economic, cultural and social development and particular attention has also been given to greater adoption of e-Governance and e-Services solutions. The government is working towards digitalizing 90% of its services by 2021 and currently serving more than 60 million people through
6790 digital centers, setting up 39 IT parks and has already digitalized 600 public services and currently in the process of digitalizing 2800 more public services.
3.2 Market Competition Scenario
Due to increased competitiveness among few players, the industry has witnessed some major events in the past few years: With two mobile phone operators having been merged and another shutting down, a six-player market has turned out to be a four-player one. Robi (Axiata) got merged with Airtel (Bharti Airtel) to attain operational efficiency in 2016, which made them the second largest operator by number of connections. Meanwhile, Citycell, the country’s first telco left the battle after a long period of struggle to survive in the industry. BTRC has suspended its operating license due to nonpayment of dues in Q4, 2016. Banglalink, another leading operator in the industry has been operating with steady growth in the number of subscribers but its market share is continually on the wane. Teletalk, the only state-owned operator, failed to
attract users despite having significant government support in various issues. The only operator that has been continually outperforming the industry in terms of both subscriber acquisition as well as profitability is ‘Grameenphone’, a concern of Norway based ‘Telenor’.
Highly competitive market with major focus on value driven growth strategy: The competitive landscape in the local telecom industry can be identified based on price and value offerings. An estimated 70% of consumers
puts high value on the quality, coverage, service, security, differentiation and innovation while rest 30% of the consumers looks for mostly low price. Among the local market players, leading operator Grameenphone has successfully positioned itself as a premium brand with best network coverage and higher price. Meanwhile, Robi has been strategically executing dual brand (Robi & Airtel) proposition targeting specific user segments and value proposition for each segment.
VEON’s subsidiary Banglalink has positioned itself in low price and low network coverage segment for Value for Money user base. State-owned telecom brand Teletalk operates with poor
network coverage and mostly offers services at significantly lower prices.
The operators are also implementing their service upgradation in line with respective user segmentation. For example, while Robi pursued to gain 4G
leadership in the market after launch of 4G in the local market, actual service quality was compromised. GP expanded 4G coverage on a slow and steady basis
Telecom Market Positioning: Brand Perceptions
46%
30%
21%
3%
Telecom Industry Market Share
GP Robi Banglalink Teletalk
Top three players hold 97% of the
market share with leading position
seized by GP

EQUITY RESEARCH Grameenphone Ltd. (DSE: GP; BLOOMBERG: GRAM:BD)
Page 16 of 37 This research report is a property of EBL Securities Ltd. | Bangladesh Equities | June 21, 2021
N.B.: Disclaimer of the EBL Securities Ltd, the author(s) certification and rating definition have been provided at the end of the report.
with optimal utilization of their 2G and 3G networks based on geographical preferences and brought whole country under 4G coverage and achieved 4G leadership by 2021. GP always strived to maintain better quality data speed and uninterrupted service in their respective bandwidths.
Competitive Landscape
Operator Name Brand Name Major Shareholders Market Share Technology
Grameenphone Ltd. Grameenphone Telenor Norway, Grameen Telecom Trust
46.5% GSM
Robi Axiata Ltd. Robi/ Airtel Axiata Group Berhad 29.9% GSM
Banglalink Digital Communications Limited
Banglalink Veon Group Netherlands 20.7% GSM
Teletalk Bangladesh Ltd. Teletalk Govt. of Bangladesh 2.9% GSM
Source: BRTC & EBL Securities Ltd. Research
Grameenphone dominates the oligopoly market: The telecommunication
sector in Bangladesh is oligopolistic in nature where only few operators serving the market while nearly half of the industry subscribers belong to only a single operator. GP dominates the telecom industry with 46.5% of the total market share in terms of active mobile user as on March 2021. Banglalink was in the
second leading position before the merger of Robi with Airtel. However, 8.2 million subscribers from Airtel have been added to Robi’s subscriber base through this merger and that uplifted the operator (Robi) into the second-leading position.
Potential New Entry
Buyer Power
Supplier Power
Substitutes
Competitive Rivalry Intense completion among theexisting players in terms of price,market campaigns, bundle offers,subscriber acquisition etc.
Very Low potential of new entry due tohuge capital investment requirement,saturated industry, restricted entry intothe industry by the regulator
Easy to switch between operators, MultiSIM market, MNP facility etc enableshigh bargain power of buyers in theindustry. Buyers can go for the bestprices bundles and network availability.Allocation of Spectrum Frequency is
controlled by the government andpower of the government as supplieris very high IP telephony services, OTT platforms
are the cheapest availablesubstitutes for voice and messagingservices. Increased penetration ofISP/PSTN broadband services andWIFI connectivity are the low costalternatives with unlimited volume.
PORTER'S FIVE FORCES
Source: EBL Securities ltd. Research

EQUITY RESEARCH Grameenphone Ltd. (DSE: GP; BLOOMBERG: GRAM:BD)
Page 17 of 37 This research report is a property of EBL Securities Ltd. | Bangladesh Equities | June 21, 2021
N.B.: Disclaimer of the EBL Securities Ltd, the author(s) certification and rating definition have been provided at the end of the report.
High market competition posits downward pressure on ARPU: ARPU in telecom sector has been witnessing a downward trend owing to increased price competition mainly in terms of data service revenue. Even though prices of voice traffic services are protected from market competition with the introduction of floor price system in the industry, data usage getting momentum in the country and
correspondingly voice services experiencing down-trend in terms of volume of usage. More pricing power generated by Robi-Airtel merger: Even though Robi has become the second-largest market player in the industry with highest spectrum holding, it could not pose any significant threat to GP. Rather, the threat of a price war by Airtel has eroded due to reduced market competition and GP has successfully capitalized the opportunity with increase in the prices of its voice calls.
3.3 Cellular Data Market Highlights
Market for mobile internet is enjoying hefty growth driven by subscriber addition and increased penetration: Bangladesh has advanced significantly in terms of internet connectivity. Last 5 years CAGR in total number of internet subscribers in Bangladesh was 13.4% and that of mobile internet
was 12.6%. Contribution of data revenue to total revenue of the country’s leading mobile operator GP increased to 24.4% as on 2020 compared to meagre 3.4% in the year 2013, reflecting the overall industry scenario.
The total number of Internet Subscribers has reached 116.14 million at the end of March 2021. Of the total connections, 91.6% are through the mobile network snd 8.4% through the internet service providers (ISP & PSTN). Even though WiMAX services were getting popularity in the past, since the launching of 3G,
WiMAX service providers were experiencing de-growth in subscription and has lost the market completely in mid-2020. Qubee, Banglalion Communications and Ollo had been providing WiMAX connection in Bangladesh.
As of March 2021, there are around 106.33 million mobile internet connections in Bangladesh i.e., 60.9% of mobile users are now using internet with cellular phones. The country’s data penetration is still far below than other countries in the region. Mobile data subscription penetration in Bangladesh is around 62.5%, however, estimated unique data user penetration (headcount) is still at
around 35-40%. This significant deviation between mobile data connection penetration and mobile data user penetration is due to having multiple number of connections by the same users.
Industry Mobile Data Subscription Trend Bangladesh Mobile Internet Penetration
Source: BTRC & EBLSL Research
0.0%5.0%10.0%15.0%20.0%25.0%30.0%35.0%40.0%45.0%50.0%55.0%60.0%65.0%
-
10.0
20.0
30.0
40.0
50.0
60.0
70.0
80.0
90.0
100.0
110.0
2013 2014 2015 2016 2017 2018 2019 2020
Mobile Data User (mn)% of Industry sub. base
0.0%
22.1%26.9%
32.4%39.0%
46.1%52.0%
56.3%60.8%
0.0 %
10. 0%
20. 0%
30. 0%
40. 0%
50. 0%
60. 0%
70. 0%
2012 2013 2014 2015 2016 2017 2018 2019 2020
Mobile Internet Panetration
Linear (Mobile Internet Panetration)
012345
Competition inthe industry
Potential of newentrants into the
industry
Power ofsuppliers
Power ofcustomers
Threat ofsubstituteproducts
Porter's five forces analysis
Nil=0; Very Low=1; Low=2; Moderate=3; High=4; Very High=5
Contribution of data revenue to total revenue
of the mobile operators growing gradually

EQUITY RESEARCH Grameenphone Ltd. (DSE: GP; BLOOMBERG: GRAM:BD)
Page 18 of 37 This research report is a property of EBL Securities Ltd. | Bangladesh Equities | June 21, 2021
N.B.: Disclaimer of the EBL Securities Ltd, the author(s) certification and rating definition have been provided at the end of the report.
Increased broadband penetration to challenge cellular data growth: Last 5 years CAGR in ISP+PSTN connections were 25.0% against 12.6% CAGR in mobile internet subscription. This clearly indicates that even though contribution of broadband internet is still insignificant, it is getting momentum in Bangladesh. Currently 91.6% of the total internet connection is supported by mobile internet while rest of the connections are provided by ISP+PSTN operators.
3.4 Regulatory Landscape
The sector experiences rigid regulatory environment and high taxation: The telecom industry is highly regulated and highly taxed sector in Bangladesh.
Publicly traded/ listed corporations are imposed with a 40% income tax while unlisted telecom operators are exposed to a 45% income tax, a much higher rate compared to any other industry. Besides, 5.5% of the revenue sharing will remain unchanged up to 2032 as per the decision taken in a telecom operators’ meeting with Prime Minister’s ICT Affairs Adviser in 2017.
Besides, the Companies under telecom sector undergo very strict and unpredictable regulatory
environment which put its earnings into vulnerable position. Several unresolved and long pending regulatory issues remained a key concern for the company. The operators have various unresolved issues with Bangladesh Telecommunication Regulatory Commission (BTRC) and National
Board of Revenue (NBR) in the ground of illegal broadband internet services, audit, tax on replacement SIM, VAT rebate etc. which is currently on trial of
court.
The telecom service prices are controlled by the regulator: For regular voice calls, there is currently a BDT 2 ceiling and a floor price of BDT 0.25 for each minute, which the regulator fixed in 2008 after a cost modelling analysis
supported by the International Telecommunication Union (ITU). After a few years, the BTRC set the ceiling at BDT 0.50 for each local SMS and BDT 2 for international SMS. There is no lower price limit in this segment. At present, the data service prices are set by the operators, with the regulator having no benchmark to check the rationality of the pricing.
3.4 Recent Developments in the Industry
Robi, the second leading mobile operator of the country, became listed
in the capital market: The long-waited debut of the country’s second leading mobile operator, Robi Axiata has finally taken place in December 2020. The operator offloaded 10% of the shares (including ESPP) to raise about BDT5,237.9 million for network expansion at face value of BDT 10.0 each (at par). Of the total 523.8 million IPO shares, 387.8 million has been offered to the public and institutional investors in Bangladesh, while the remaining 136.1 million was set aside for employees and directors of Robi under the employee share purchase plan (ESPP). The operator formally launched its operation in Bangladesh with the brand name of Aktel in 1997 as Telekom Malaysia International (Bangladesh). After acquisition of its share by Axiata Group Berhad, a Malaysian telecommunications conglomerate, it was rebranded as Robi and changed its name to Robi Axiata Limited. Later got merged with Airtel
Bangladesh, the merged company, in November 2016.
Fresh development in regulatory landscape might bring changes in existing business operations of telecom operators: The government of Bangladesh and telecom regulatory body, BTRC is working to bring various new regulatory developments.
VAT, TAX and other Regulatory Charges for Telecom Industry Gross Revenue Sharing 5.5% of annual audited gross revenue Social Obligation Fund 1% of annual audited gross revenue SD on sale of new and replacement SIM 35% Supplementary duty (SD) 15% VAT inclusive of SD 5% on Mobile Internet
15% on Voice & other telecom services Surcharge 1% Income Tax 40% (For publicly traded companies)
45% (For non-listed companies) SIM Tax BDT 200 each Source: EBLSL Research
Broadband internet (ISP/PSTN) is gaining popularity in Bangladesh
Approved voice call charge ceiling & limit is BDT0.25 to BDT2.0 per minute
Robi offloaded 10% of its shares in the stock market in December 2020.

EQUITY RESEARCH Grameenphone Ltd. (DSE: GP; BLOOMBERG: GRAM:BD)
Page 19 of 37 This research report is a property of EBL Securities Ltd. | Bangladesh Equities | June 21, 2021
N.B.: Disclaimer of the EBL Securities Ltd, the author(s) certification and rating definition have been provided at the end of the report.
3.5 Industry Outlook and Possible Future Developments
Bangladesh remains one of the attractive markets for telecom industry with enormous potential as cellular network is the primary means of voice and data connectivity for the people of the country. With the progressive support from the government for digitalization of services the sector is expected to witness better days ahead. Meanwhile, with the governments incentive in locally assembling of mobile phone will make smartphones more affordable and penetration of mobile internet is also expected to grow in line with higher smartphone adoption over the next few years. However, the future of the telecom sector in Bangladesh will depend on successful implementation of emerging new digital services, convergence of
technologies/IoT, entertainment & video streaming platforms and increased digital financial inclusion etc.
Rigid and uncertain regulatory environment remains a key concern for the operators as strict regulation, high taxation and several pending disputes between mobile operators, BTRC (the regulator) and NBR are yet to be resolved. Fresh development in regulatory landscape might bring changes in existing business operations of telecom operators. The government of Bangladesh and telecom regulatory body, BTRC is working to bring various new regulatory developments.
Teledensity is expected to go up further: According to GSMA Intelligence, the number of unique mobile subscribers is projected to reach to 107 million with 60% real penetration rate by 2025 from prevailing 100 million penetration. Besides total SIM connection is expected to be 190 million with 102%
penetration rate by 2025 from prevailing 174.63million (as on March 2021). Meanwhile, unique mobile internet subscription is also expected to grow at a CAGR of 10% and will reach 73 million by 2025 with 41% penetration rate from around 65 million presently1. Over the next decade, increasing consumers’ affordability, falling prices of smartphones, technology advancement (4G/LTE/5G) and wider network coverage etc. are key factors that will drive the growth. Considering the 60% unique mobile phone penetration in the country, the telecom sector has another 40% room to grow.
Increased data consumtion, driven by 5G, will result in heafty revenue from data: Introduction of 4G in early 2018 helping to amplify data service
growth as service quality has increased and resulted in additional data subscribers across the country. Data consumption will uplift further with the introduction of 5G in local telecom industry.
Telecom operators are eying towards operating cost optimization to
retain profit growth as the industry heading towards its mature stage: Given the intensifying market competition and ever increasing regulatory barriers, transformation of the company from traditional telco to a digital one and simplification of the cost structure has become an ever more vital issue. It has become apparent over the years that in today’s highly competitive industry landscape, survival of a telco depends highly on having an efficient cost structure.
With a view to reducing operating cost, Voluntary Separation Scheme (VSS), also known as Voluntary Retirement Scheme (VRS), has become a common practice in the industry that was first floated by Banglalink that was even followed by the market leader. Grameenphone reduced the number of its permanent employees to one fifth under voluntary retirement schemes (VRS) over the last few years. With a view to reducing cost in a competitive business context, Robi Axiata has also moved to cut jobs by offering voluntary separation scheme (VSS) for its employees for the first time in 2019. Along with VRS/VSS, operators are eyeing towards other point of cost cutting and increasing efficiency by using sophisticated technology and digitalization.
1 EBL Securities ltd. own estimate
The industry steel has 40% space for growth, in terms of unique mobile
users
The future of the telecom sector in
Bangladesh will depend on successful
implementation of emerging new
digital services and technology.
With saturated industry scenario,
short-term profitability will come from
cost leadership strategy
EQUITY RESEARCH Grameenphone Ltd. (DSE: GP; BLOOMBERG: GRAM:BD)
Page 20 of 37 This research report is a property of EBL Securities Ltd. | Bangladesh Equities | June 21, 2021
N.B.: Disclaimer of the EBL Securities Ltd, the author(s) certification and rating definition have been provided at the end of the report.
Further regulatory intervention can be expected to improve the industry competitiveness: Looking forward, the potential for further merger/ consolidation in the industry cannot be overlooked if present state of industry competitiveness prevails, even though the regulator will attempt to protect competition in the industry. Top three players are in a battle to acquire new subscribers with aggressive marketing strategy. The government has already
introduced Significant Market Power (SMP) regulation to protect the industry from becoming monopolistic by any single operator.
BTRC already declared Grameenphone as an SMP operator in terms of its revenue and market share and imposed some restrictions on its operations. GP’s competitors are lobbying to the regulator for more stringent restrictions on the market leader to protect themselves from the competition. Implementation of unified floor pricing and MNP service were also made in an attempt to hold GP’s unstoppable business growth and market share acquisition
but nothing such could have noticeable impact on GP’s operating performance. Enforcement of SMP regulation may bring GP under more3 tighter regulatory supervision in the future.
Revenue from voice traffic might witness declining trend due to increased over-the-top (OTT) service as a result of data user growth: Globally, telecom companies have started facing competition from non-traditional players such as over-the-top (OTT) service providers. The pace of technological advancements and the magnitude of user benefits derived from OTT services will make them the default choice of customers. Voice ARPU may decline in the long run due to increased OTT (Over-The-Top) calls and price competition in the industry but data ARPU is expected to grow further in the
years to come due to increased data consumption and new data subscriber addition.
The telecom sector has been experiencing a rapid change around the world. The average revenue per user (ARPU), a long-standing metric for measuring financial performance, has been steadily declining over the last decade. Worldwide, telecom companies are now experiencing big challenge of shifting their focus to non-voice services to continue growing. As the industry is maturing while industry experiencing tremendous competition, especially in the area of voice call segment, MNOs (Mobile Network Operators) are eying towards redesigning their business models by introducing more customer friendly products as well as trying to reap the
benefit of country’s digital growth by offering cloud based services and business diversification. However, in the near future, growth will be driven by data and the internet services, customer analytics services and new technology-led capabilities.
Frequent regulatory intervention is expected to prevail
Industry outlook for voice call business
is shaky
Industry ARPU will continue to decline
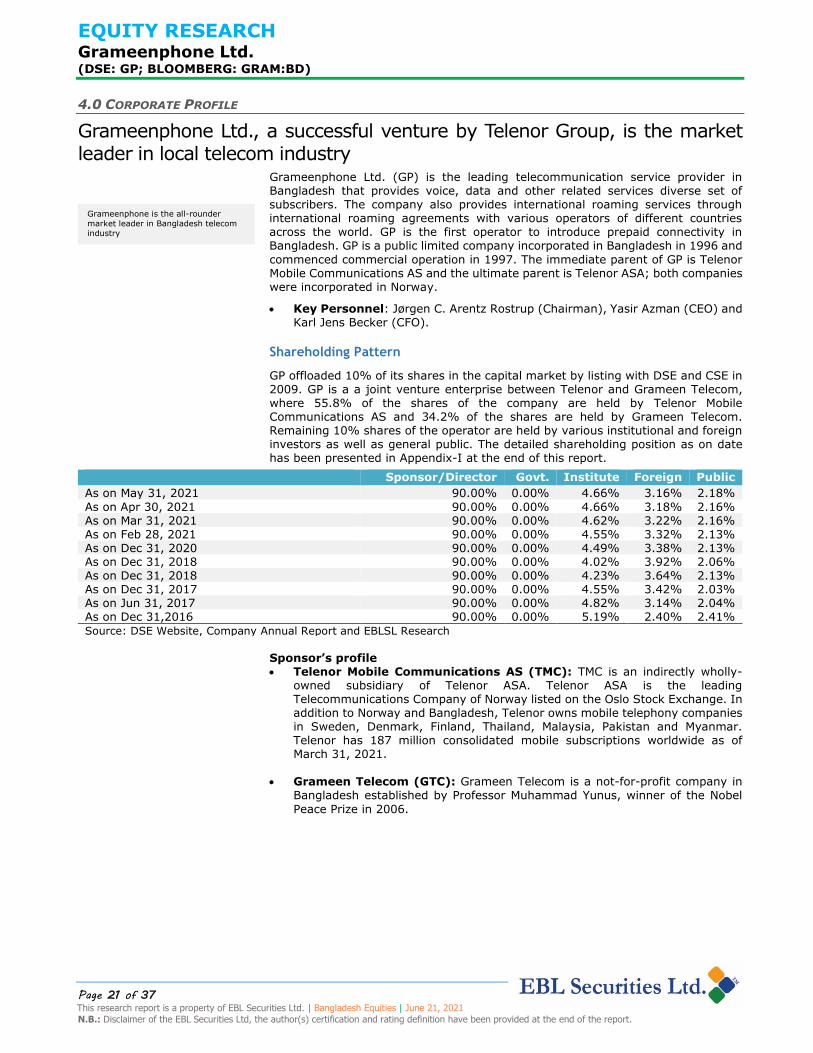
EQUITY RESEARCH Grameenphone Ltd. (DSE: GP; BLOOMBERG: GRAM:BD)
Page 21 of 37 This research report is a property of EBL Securities Ltd. | Bangladesh Equities | June 21, 2021
N.B.: Disclaimer of the EBL Securities Ltd, the author(s) certification and rating definition have been provided at the end of the report.
4.0 CORPORATE PROFILE
Grameenphone Ltd., a successful venture by Telenor Group, is the market leader in local telecom industry
Grameenphone Ltd. (GP) is the leading telecommunication service provider in Bangladesh that provides voice, data and other related services diverse set of subscribers. The company also provides international roaming services through international roaming agreements with various operators of different countries across the world. GP is the first operator to introduce prepaid connectivity in Bangladesh. GP is a public limited company incorporated in Bangladesh in 1996 and
commenced commercial operation in 1997. The immediate parent of GP is Telenor Mobile Communications AS and the ultimate parent is Telenor ASA; both companies were incorporated in Norway.
Key Personnel: Jørgen C. Arentz Rostrup (Chairman), Yasir Azman (CEO) and Karl Jens Becker (CFO).
Shareholding Pattern
GP offloaded 10% of its shares in the capital market by listing with DSE and CSE in 2009. GP is a a joint venture enterprise between Telenor and Grameen Telecom, where 55.8% of the shares of the company are held by Telenor Mobile Communications AS and 34.2% of the shares are held by Grameen Telecom. Remaining 10% shares of the operator are held by various institutional and foreign investors as well as general public. The detailed shareholding position as on date has been presented in Appendix-I at the end of this report.
Sponsor/Director Govt. Institute Foreign Public
As on May 31, 2021 90.00% 0.00% 4.66% 3.16% 2.18%
As on Apr 30, 2021 90.00% 0.00% 4.66% 3.18% 2.16% As on Mar 31, 2021 90.00% 0.00% 4.62% 3.22% 2.16% As on Feb 28, 2021 90.00% 0.00% 4.55% 3.32% 2.13% As on Dec 31, 2020 90.00% 0.00% 4.49% 3.38% 2.13% As on Dec 31, 2018 90.00% 0.00% 4.02% 3.92% 2.06% As on Dec 31, 2018 90.00% 0.00% 4.23% 3.64% 2.13% As on Dec 31, 2017 90.00% 0.00% 4.55% 3.42% 2.03% As on Jun 31, 2017 90.00% 0.00% 4.82% 3.14% 2.04% As on Dec 31,2016 90.00% 0.00% 5.19% 2.40% 2.41%
Source: DSE Website, Company Annual Report and EBLSL Research Sponsor’s profile Telenor Mobile Communications AS (TMC): TMC is an indirectly wholly-
owned subsidiary of Telenor ASA. Telenor ASA is the leading Telecommunications Company of Norway listed on the Oslo Stock Exchange. In addition to Norway and Bangladesh, Telenor owns mobile telephony companies in Sweden, Denmark, Finland, Thailand, Malaysia, Pakistan and Myanmar. Telenor has 187 million consolidated mobile subscriptions worldwide as of March 31, 2021.
Grameen Telecom (GTC): Grameen Telecom is a not-for-profit company in Bangladesh established by Professor Muhammad Yunus, winner of the Nobel
Peace Prize in 2006.
Grameenphone is the all-rounder
market leader in Bangladesh telecom
industry

EQUITY RESEARCH Grameenphone Ltd. (DSE: GP; BLOOMBERG: GRAM:BD)
Page 22 of 37 This research report is a property of EBL Securities Ltd. | Bangladesh Equities | June 21, 2021
N.B.: Disclaimer of the EBL Securities Ltd, the author(s) certification and rating definition have been provided at the end of the report.
5.0 ASSESSMENT OF CORPORATE GOVERNANCE
Grameenphone Limited has sound corporate governance practices among the listed companies in Bangladesh Capital Market
Grameenphone has one of the best corporate governance practices in place and maintains good relations with all of its stakeholders including shareholders, subscribers and employees. The operator possess experienced management team guided by board of directors having diversified background and backed by Telenor’s global operational experience. Overall the quality of financial reporting appears to
be transparent & fair enough.
The company has the policy towards developing its human resources by providing adequate training and enabling the key management to gain global experiences by working in different parts of the Telenor’s global operation. In conjunction with its global experiences and local expertise, its management team can choose the right strategic direction in right time in such a highly regulated and competitive local market. The company’s strategic leadership has been proven by successfully handling various challenges like BTRC audit claims and SMP regulations.
The overall corporate governance practices of the company can be summarized as;
Seasoned professionals in board consist of diversified professional
background. Have 3 independent directors along with seven non-executive directors and
two female directors in the board, meeting the standard governance criteria
Regular attendance in the board meetings and other committee meetings by the board members.
None of the independent directors possess any shares of the company as on date.
Non-executive directors do not take part in any day-to-day business
operation of the company. Policy to recruit highly talented graduates and proving high quality training
both at home and abroad so that they can serve the company in line with the company’s strategic vision and achieve organizational goal.
Have reasonable and necessary disclosure of material facts and figures in its annual reports as well as quarterly disclosure.
Has the best investor’s relation practice in the Bangladesh capital market and key management personnel regularly holds earnings calls, press conferences along with AGM to talk with analysts, journalist and investors. GP is the trendsetter in offering superior investor relation services and pioneer in introducing earnings calls and press conference for each quarterly earnings disclosures.
Have sound internal audit, control and risk management policy Possess unique ability to differentiate service offerings to meet diverse
consumers’ needs and successfully achieved superior brand loyalty and positioned itself as a premium brand in the local telecom industry.
Regularly disburses handsome cash dividend from its earnings to the shareholders

EQUITY RESEARCH Grameenphone Ltd. (DSE: GP; BLOOMBERG: GRAM:BD)
Page 23 of 37 This research report is a property of EBL Securities Ltd. | Bangladesh Equities | June 21, 2021
N.B.: Disclaimer of the EBL Securities Ltd, the author(s) certification and rating definition have been provided at the end of the report.
6.0 CORE STRENGTHS, CHALLENGES & BUSINESS OUTLOOK OF GRAMEENPHONE
1
COMPANY NAME
SWOT ANALYSIS OF GRAMEENPHONE LTD.
• Market leader in local telecom industry
• Backed by the Telenor, Norway
• Largest network coverage
• Strong Brand Loyalty
STRENGTHS
• Aggressive market competition in advertising and marketing campaigns
• Unsettled disputes with regulators linked to large financial claims
• Threats of new SMP related restrictions over the operations of Grameenphone.
THREATS
• Occasional unfriendly relation with the government and the regulator
• High tax burden on the industry
• Slow growth in voice traffic
WEAKNESSES
• Increasing data market penetration to retain growth momentum
• Opportunity to offer diversified and innovative products and service bundles among its large subscriber base t expand business and retain market presence.
OPPORTUNITIES
S
W
O
T
Source: EBL Securities Ltd. Grameenphone has been maintaining value driven growth strategy in a highly price competitive market: While the saturated telecom industry has been experiencing high price completion in service bundles and switching telecom operator has become much easier than before due to MNP, Grameenphone has been successfully maintaining its market leadership with value driven growth strategy.
GP has been offering differenced bundles & packages such as flexi plan, personalized packages etc.
With comparatively lower industry penetration compared to regional peers, the industry still offers room for subscription growth: GP managed to
record steady revenue growth over the years that was driven by an increase in number of subscribers, despite intense market competition among the four telecom service providers operating in the country. The telecom market still offer subscriber growth potential as unique mobile subscription is still around 59.8% and total subscription penetration is also lower compared to other markets. In line with increased purchase power and affordability by the population, more subscribers are joining the telecom network.
Superior network coverage, service quality strong spectrum holding and brand loyalty positioned Grameenphone as a preferred brand in local telecom industry: Grameenphone has the strongest & widest network coverage in the country with 99.6% of the country’s population is under the network coverage of the operator. Besides, with better quality and simplified service offerings, consumer friendly packages, superior customer services over the years placed itself a most preferred brand in the industry. While other operators are targeting middle and lower income class consumer segments, GP successfully positioned itself as a premium brand, even though its journey started with an aim to facilitate mainly
rural segment. Meanwhile, Grameenphone also started to rollout and strengthen its fibre network for future 5G technology readiness.
Growing market share placed the operator in the leadership position: GP
has been maintaining leadership position in the telecom industry of Bangladesh for
GP Holds
46.5% of the SIM market in Bangladesh

EQUITY RESEARCH Grameenphone Ltd. (DSE: GP; BLOOMBERG: GRAM:BD)
Page 24 of 37 This research report is a property of EBL Securities Ltd. | Bangladesh Equities | June 21, 2021
N.B.: Disclaimer of the EBL Securities Ltd, the author(s) certification and rating definition have been provided at the end of the report.
the last two decades. Currently GP is the largest telecom operator having 46.5% market share, in terms of industry subscriber. Along with the voice segment, GP is also leading the mobile data market and 52.3% of the total subscribers of the operators are currently availing GP’s mobile internet services, as of December 2020.
The market share of the operator experienced declining trend up to 2012 due to increased competition from other operators in the market. However, inauguration of 3G enabled the operator to further strengthen its position with growing market share. The market share of the operator increased to 46.5% in 2020 from 41.2% in 2012.
However, GP’s market share in last three years remained almost flat as several regulatory constraints and tussles along with COVID-19 pandemic restricted the subscriber acquisition of the company.
Declining voice revenue growth posit challenges for the future potential of the company: Even though almost half of the entire population of the country are yet to get connected with mobile network on the basis of unique mobile phone subscription penetration, the voice traffic segment in Bangladesh has reached
almost saturation point driven by a number of forces. Active mobile subscription penetration has reached to 100%+ and almost every person has access to mobile phone services either directly or indirectly. With increased access to internet services along with high cost of telecom voice call services mostly caused by regulator led minimum floor prices for voice calls and growing security concern on privacy issues leading towards increased use of Over the Top (OTT) platforms such as WhatsApp, Messenger, Viber, Telegram etc. It is expected that use of OTT app based call and services will continue to increase and voice calls over cellular network will be declining further in future in line with greater internet access.
Though data revenue bears attractive short term growth potential, long term growth is questionable due to high price competition and slow consumption growth: Data revenue is expected to be one of the major revenue contributor in future driven by the significant increase in higher data consumption (AMBPU) and increased penetration. Since the implementation of 3G in the country, use of mobile internet increased significantly. GP’s data users increased from
meager 4.6 million at the end of 2013 to 41.7 million by the end of March 2021. Countrywide 3G & 4G network expansion has been driving the high growth in Data Segment in both 3G and 4G. Increased internet penetration, cheaper smartphone devices and the government’s motive towards digitalization of the country has been acting as the key catalyst for huge growth in the data consumption.
Last 5 Years’ CAGR in revenue from data segment was robust 32% and last 3 Year CAGR of data revenue was 17%, which depicts phenomenal performance in data service business by the operator. In 2020 revenue from data sales stood at BDT 34 billion which is 14% higher than the preceding year. However, we expect that hefty price competition in data segment will prevail and data ARPU will start to experience negative growth after next few year, and data revenue will experience meagre growth in the long run.
Fresh investment will improve service quality: GP continues to invest in network, technology and capacity to improve its capability, coverage and service quality. In 2020, the company invested BDT 13.8 billion amidst the pandemic to rollout more 4G sites, expand network coverage and enhance capacity to cater higher data and voice volumes as well as enhancement of IT infrastructure for better product and service offerings. The company acquired further 10.4 MHz spectrum in March 2021 with a combined cost of USD 435.5 million (including VAT), of which, 25% has to be paid as down payment and remaining amount will be paid in five equal installments.
Successful innovation and diversification of service offerings are the key to survival in the future: GP is a pioneer in introducing new products and services in the local telecom market. The operator was the first to introduce GSM technology
4.6
10.8
15.7
24.5
31.2
37.1
40.6
41.3
9.8%
21.0%
27.7%
42.3%47.8%
51.0% 53.1% 52.3%
0.0 %
10. 0%
20. 0%
30. 0%
40. 0%
50. 0%
60. 0%
0.0
5.0
10. 0
15. 0
20. 0
25. 0
30. 0
35. 0
40. 0
45. 0
2013 2014 2015 2016 2017 2018 2019 2020
Active Data Users and % of Sub-base
Mobile data Users (mn)
Data subscriber as % of Total Users
40.0
47.1
51.5
56.7
58.0
65.3
72.7
76.5
75.3
41.2%41.4%42.8%42.4%
45.9%45.0%46.3%46.2%46.5%
0.0
10. 0
20. 0
30. 0
40. 0
50. 0
60. 0
70. 0
80. 0
90. 0
30. 0%
32. 5%
35. 0%
37. 5%
40. 0%
42. 5%
45. 0%
47. 5%
50. 0%
Year2012
Year2013
Year2014
Year2015
Year2016
Year2017
Year2018
Year2019
Year2020
GP Subsrciber and Market Share Total Subscriber (mn)
Market Share

EQUITY RESEARCH Grameenphone Ltd. (DSE: GP; BLOOMBERG: GRAM:BD)
Page 25 of 37 This research report is a property of EBL Securities Ltd. | Bangladesh Equities | June 21, 2021
N.B.: Disclaimer of the EBL Securities Ltd, the author(s) certification and rating definition have been provided at the end of the report.
in Bangladesh, pre-paid SIMs, mobile to mobile telephony and was the first company to cover 99% of the population. It introduced first 24-hour call center, value-added services such as SMS, fax and data transmission services, international roaming service, SMS-based push-pull services, and personal ring-back-tone. It was the first to launch e-commerce venture in Bangladesh (cell-bazar later rebranded as ekhanei.com as a concern of Telenor). The company is now working on IoT &
cloud based services and segments such as entertainment and plans to roll out more digital services. Unfortunately the company could not successfully position itself in most of the non-core business segments and data & voice remain the key revenue drivers of the company.
Grameenphone currently generates 95% of its revenue from voice & data only whereas its closest competitor Robi generates 85% of the revenue from these two sources. Grameenphone has taken initiatives to diversify its business further. It plans to translate from a commodity-based telco to a platform-based digital technology company that will offer exciting opportunities and partnerships in IoT and digital content. Its users can now provision for and enjoy video on demand & communication pack service bundles (i.e. Bioscope, Zee5, Zoom, Google Duo, Teams etc.) on GP data packs as new service bundling capabilities were implemented in 2020. Other digital services such as MyGP 4.0,GPAY, Flexiplan, Retail App, and the Franchisee’s App have been revamped under a new User Interface and design. Grameenphone users can now enjoy voice calls with HD voice quality and reduced (1-2 second) call set up time launched as VoLTE (Voice over
LTE) over the 4G network waslaunched in last year. MyGP capacity has been enhanced; POL (payment orchestration layer) has been introduced and launched with Recharge capability from MyGP, bKash etc. SSC result registration and other hotline services for health have also been provided to customers. However, if the company fails to successfully position itself in innovative solutions such as IoT & video streaming businesses, it will not be able to retain business growth in future.
External forces challenging the company’s operation and performance: A number of external forces also creates disruption to the performance of the company. Heavy rains, floods and other natural disaster damages the infrastructure setup of the company and affect the service quality as well. Meanwhile, external regulatory forces also posits some challenges to the operator. For example, In June 2020, as soon as the lockdown was lifted, the entire telecom industry faced a significantly higher number of fibre cuts in 2020 due to the massive construction projects by the government, which caused great challenges maintaining network availability. Challenging economic and unprecedented dysfunctional environment
created by the pandemic also brought newer challenges to the operator.
7.0 TELECOM REGULATORY ENVIRONMENT FOR GRAMEENPHONE
The regulatory environment for the Grameenphone limited remained challenging in the last few years. The Telecom Regulatory Framework continues to present challenges and the industry has been urging for amendment of Bangladesh Telecommunication Regulatory Act (BTRA) for ensuring predictability and sustainability in the framework. In 2020, the Ministry initiated the consultation process for amendment of BTRA and MNO’s participated and collectively provided their observations under the AMTOB (Association of Mobile Telecom Operators of Bangladesh) banner.
Along with several regulations for the telecom watchdog, new challenges also came from the tax authority in last year too. In the 2020-21 national budget, supplementary duty on mobile usage has been increased from 10% to 15% on top of other applicable taxes. Now, 15% Supplementary Duty, 15% VAT inclusive of SD, and 1% Surcharge are applicable on mobile services.
Besides, at the beginning of 2020, BTRC and the Ministry kicked of consultations regarding 5G launch in 2021, however, this consultation process shall continue further. At the end of 2020, the industry and the regulator (both Ministry and BTRC) also went for consultation with respect to the fibre network regime were happened as the current NTTN regime is facing a challenge to drive the country’s digitalization

EQUITY RESEARCH Grameenphone Ltd. (DSE: GP; BLOOMBERG: GRAM:BD)
Page 26 of 37 This research report is a property of EBL Securities Ltd. | Bangladesh Equities | June 21, 2021
N.B.: Disclaimer of the EBL Securities Ltd, the author(s) certification and rating definition have been provided at the end of the report.
needs. In early 2021, BTRC conducted fresh auction from allocations of spectrum for all mobile operators after Robi renewed several bands for another 10 years.
Tower & Infrastructure Sharing Tower company operation under the new guideline has already started. Grameenphone is now able to start rolling out new sites under the new Tower Co framework and this will enable the operator to expand 4G coverage at faster speed. As demand for network coverage increased with volume growth potential, the Company teamed up with a TowerCo to start building new sites across the country. The regulator has approved agreement between Grameenphone Ltd. and TowerCos on 18th October 2020. Grameenphone has signed an agreement with one of the TowerCos to roll out new towers under the new regime.
Regulation for industry protection: Grameenphone as an operator with Significant Market Power (SMP) SMP regulation is also in effect from 01 July 2020. After 16 months of regulatory declaration as an SMP operator, Bangladesh Telecommunication Regulatory Commission (BTRC) has finally issued three restrictions on Gramenphone ltd.
1. Asymmetric approval process for all campaigns, packages & services:
Grameenphone will have to secure prior approval from the BTRC before rolling out any packages or offers. The carrier would not be able to change or amend any of the conditions of approved packages or offers without consent from the commission.
2. Asymmetric MNP lock-in Period: Subscribers can abandon Grameenphone after 60 days instead of existing 90 days of staying with the carrier under the mobile number portability facility.
3. Asymmetric interconnection charge: BDT 0.7 per minutes for GP against BDT 0.10 per minutes for other operators with effect from 16th July 2020.
Though we expect that further directives will appear in future with some more stringent restrictions on the operator having distinguished impact, some barriers and impact on the financial performance will be there but we do not expect any
significant impact and barriers to be introduced by the regulatory body on the business operation of the operator. However, material impact in Grameenphone’s financial result may result from potential future regulatory directives time to time but no such restrictions and immediate significant financial impact is expected considering present industry landscape.
GP’s growth journey will continue in line with the industry but lower promotional activities under the company discretion as per the new restriction will hinder
faster customer acquisition, though overall impact is likely to be minimal.
Growth will be mostly driven by increased efficiency and normalized industry growth mostly to be supported by the higher data consumption.
MNP service in Bangladesh haven’t get popularity yet and we don’t expect a
major threat to Grameenphone Ltd. in future. Only a small portion of the subscribers availed the service. A market with multi-sim users in Bangladesh have little intention to switch between operators and high cost of switching operator along with high floor prices in the industry for all operator also kept the subscribers unwilling to avail MNP service. So, impact of reduced lock-in period for staying with GP will not have any material impact on the business of GP.

EQUITY RESEARCH Grameenphone Ltd. (DSE: GP; BLOOMBERG: GRAM:BD)
Page 27 of 37 This research report is a property of EBL Securities Ltd. | Bangladesh Equities | June 21, 2021
N.B.: Disclaimer of the EBL Securities Ltd, the author(s) certification and rating definition have been provided at the end of the report.
8.0 ANALYSIS ON FINANCIAL PERFORMANCE
Steady business performance supported by continued subscriber acquisition and rising mobile data market penetration: Grameenphone managed to secure 5.4% CAGR in gross revenue over the last 7 years despite several challenging business circumstances and aggressive market competition. The growth was mostly supported by rising number of loyal subscriber
base along with steady increase in voice call prices (average price per minutes of usage).The success came despite decline in service ARPU to BDT 150 in 2020 from and BDT 176 in 2013. Average minutes of usage per subscriber (AMPU) also declined to 210 minutes in 2020 from 249 minutes in 2013.
ARPU, AMPU & APPM
Source: Grameenphone Ltd.
In 2020, the business of the company was disrupted due to slowed-down in the country’s overall economic activities as a result of country-wide general holidays along with restriction on public movement for more than two months (April-May), with a view to controlling the spread of pandemic. However, the situation started to depict signs of gradual recovery from the end of May and performance of the company during the second half of the year also resounded the same tune with improved business performance. On a full year basis, total revenue experienced
2.8% de-growth on YoY basis with 6.6% de-growth in voice revenue while 14.0% increase in data revenue.
(In BDT million) 2012 2013 2014 2015 2016 2017 2018 2019 2020 CAGR 8 Years
Net revenue 91,920 96,624 102,663 104,754 114,862 128,436 132,832 143,656 139,606 Net revenue growth 5.10% 6.30% 2.00% 9.60% 11.80% 3.40% 8.10% -2.80% 5.40% EBITDA 48,852 48,538 54,553 55,971 62,564 73,291 79,316 90,103 87,090 EBITDA growth -0.60% 12.40% 2.60% 11.80% 17.10% 8.20% 13.60% -3.30% 7.50% EBIT 33,675 33,199 36,896 36,964 41,566 49,954 56,777 66,652 63,440 EBIT growth -1.40% 11.10% 0.20% 12.50% 20.20% 13.70% 17.40% -4.80% 8.20% Net profit after tax 17,505 14,702 19,976 19,707 22,526 27,423 33,363 34,517 37,187 NPAT Growth -16.00% 35.90% -1.30% 14.30% 21.70% 21.70% 3.50% 7.70% 9.90%
GP witnessed de-growth in overall revenue on a year on year basis despite moderate growth in data revenue as the operator is yet to recover fully from the effect of the persisting COVID-19 pandemic and its impact on overall economy. The pandemic led
locked-down has also affected the company’s subscriber acquisition to a great extent and as a result, GP witnessed negative net subscriber addition in first half of the year. However, as the economic activities of the country started to recover while the regulator has withdrawn NOC restrictions (imposed to settle the system audit claims by BTRC), GP managed to secure positive net addition in its subscription base in second half of 2020 which has also contributed positively towards the earnings of the company.
The voice segment witnessed negative growth in 2015 due to intense price competition and voice bundle offers despite 10% growth in subscription and stable uses per subscription during the year. However, the company successfully revived the situation as it managed to retain its subscriber base and enjoy higher growth in later years. Thanks to the mandatory bio-metric reregistration of SIMs during the year 2016 and price hike of voice tariff. To widen the market share, all the mobile
176
165
155
162
167
157
157
150
24
9
24
3
24
4
25
8
25
6
23
4
21
7
21
0
0.71
0.68
0.64 0.63
0.650.67
0.720.71
0
50
100
150
200
250
300
Year 2013 Year 2014 Year 2015 Year 2016 Year 2017 Year 2018 Year 2019 Year 2020
0.5 6
0.5 8
0.6 0
0.6 2
0.6 4
0.6 6
0.6 8
0.7 0
0.7 2
0.7 4
Reported ARPU (BDT) Reported AMPU (Minutes) Reported APPM

EQUITY RESEARCH Grameenphone Ltd. (DSE: GP; BLOOMBERG: GRAM:BD)
Page 28 of 37 This research report is a property of EBL Securities Ltd. | Bangladesh Equities | June 21, 2021
N.B.: Disclaimer of the EBL Securities Ltd, the author(s) certification and rating definition have been provided at the end of the report.
operators including GP had to penetrate in the lower ARPU (Average revenue per user) generating segment. ARPU continued to decline over the years as the operator had to make downward price adjustment to support increased market competition. ARPU increased slightly in 2016 compared to that of 2015 as the operator has increased its voice call rates during the year with simplified product offerings. Overall subscriber base of the company at the end of March 2021 stood at 80.75
million with 7.1% increase on YoY basis.
Saturated voice market along with increased OTT usage causing lower contribution from voice segment
The country’s voice market has reached almost saturation point as its industry
penetration is now almost 103%. Though there still remains some scope for expanding market as unique market penetration is much lower (estimated 100 million unique mobile user penetration) due to multi-sim market nature in Bangladesh, the market for GP is becoming increasingly tougher due to aggressive market competition while there are existing and potential restrictions over GP including restrictions on aggressive market campaigns for subscriber acquisition. During the year 2020, de-growth in GP’s voice revenue was partly offset by double digit growth in data revenue. Besides, even though higher OTT use has been reducing voice calls volume over cellular network significantly, it on the other hand resulting into higher consumption of data.
Growth in Voice Traffic Data Revenue Growth
Cooling-down of regulatory tussle helped in maintaining steady business
operations
The operator has been experiencing long pending tussle with the regulator for a regulatory claim of BDT125.8 billion (including principal & interest) against a system audit conducted by the Bangladesh Telecommunication Regulatory Commission (BTRC). Grameenphone was also barred from rolling out new packages/services, importing network equipment and issuing new number series in Q1,2020 in an attempt to pile up pressure on the operator by the regulatory body to clear unsettled dues of BDT125.8 billion as per audit claims. Suspension of issuance of NOCs
impacted network expansion and created challenges for Grameenphone to ensure its network readiness under the COVID-19 context.
Meanwhile, Grameenphone has deposited BDT 20 billion (BDT 10 billion in February and BDT 10 billion in May) with the Bangladesh Telecommunication Regulatory Commission (BTRC) against the audit claim in line with a Supreme Court order. As per the court order, BTRC started to release NOCs in phases and subsequently BTRC has eased pressure on the company. GP’s relation with the government and regulator has also been soften after payment of BDT 20.0 billion to BTRC as per
court order.
Sizable BDT 125.8 billion dispute is yet to resolve and the original title suit is pending at the district court. In 2020, GP’s legal proceedings for audit claim dispute delayed as there were limited court activity due to the ongoing pandemic situation. Even though GP has deposited BDT 20 billion as per the court order, they have presented it as non-current receivables in their financial reports and has not made any provision against such regulatory claims. GP has disputed the whole audit demand claiming them based on errors in substance, methodology and procedure.
To recover the BTRC’s Audit claim, Post and Telecommunication Division (PTD)
1.4% 2.1% 2.2%
-3.9%
5.1%
9.4%
15.2%
7.6%
-6.6%
-10.0%
-5.0%
0.0%
5.0%
10.0%
15.0%
20.0%
2012 2013 2014 2015 2016 2017 2018 2019 2020
Growth in Voice Traffic
Linear (Growth in Voice Traffic)
0.0%
17.0%
61.1%66.0% 69.7%
46.4%
21.0%17.0% 14.0%
0.0 %
10. 0%
20. 0%
30. 0%
40. 0%
50. 0%
60. 0%
70. 0%
80. 0%
2012 2013 2014 2015 2016 2017 2018 2019 2020
Data revenue growth
Linear (Data revenue growth)

EQUITY RESEARCH Grameenphone Ltd. (DSE: GP; BLOOMBERG: GRAM:BD)
Page 29 of 37 This research report is a property of EBL Securities Ltd. | Bangladesh Equities | June 21, 2021
N.B.: Disclaimer of the EBL Securities Ltd, the author(s) certification and rating definition have been provided at the end of the report.
proposed to form a committee. Through a letter dated 31 December 2020, Grameenphone requested BTRC chairman for a discussion on this issue. A meeting took place on 13 January 2020 chaired by the BTRC Chairman and subsequent discussions may take place on this matter.
However, if the final verdict goes against the operator (either fully or partially), GP will have to report significant amount against the disputed amount. As the operator maintains almost 100% payout, it might have to depend on debt financing for payment of audit claim, if required. This will also result in large finance expenses along with large impact on the bottom line.
Effective cost management leads to quality shareholder returns
Grameenphone has been successfully controlling its operating expenditures despite regular investment in its countrywide network expansion. GP’s OPEX to sales ratio declined from 40.2% in 2013 to 31.3% in 2020. Net profit margin of the company increased from 15.2% in 2013 to 26.6% in 2020, mostly supported by the effective cost control.
Controlled operating expenditures along with increase in revenue have resulted into improvement in profit margins over the year. Efficient market spending, reduction in operation and maintenance expenditures, lower subscriber acquisition cost, IT
cost reduction through application optimization and virtualization and cost savings by workforce reduction etc. enabled the operator to control its operating expenditures.
The operator has been eventually reducing its work force by offering Voluntary Retirement Schemes (VRS) to control staff cost in the long run. Replacing technology against staff cost will help the company to reduce salaries & personnel expenditures for the coming years.
EBITDA Margin Operating Profit Margin
53.1%
50.2%
53.1% 53.4%54.5%
57.1%
59.7%
62.7% 62.4%
45. 0%
47. 0%
49. 0%
51. 0%
53. 0%
55. 0%
57. 0%
59. 0%
61. 0%
63. 0%
65. 0%
2012 2013 2014 2015 2016 2017 2018 2019 2020
EBITDA Margin Expon. (EBITDA Margin)
36.6%
34.4%
35.9%35.3%
36.2%
38.9%
42.7%
46.4%45.4%
30. 0%
32. 0%
34. 0%
36. 0%
38. 0%
40. 0%
42. 0%
44. 0%
46. 0%
48. 0%
2012 2013 2014 2015 2016 2017 2018 2019 2020
Operating Profit Margin
Expon. (Operating Profit Margin)
Cost of Operation to Sales OPEX to Sales Ratio
23.2%
24.6%
26.5%
28.4%27.6%
26.2%
22.5% 22.2%23.3%
20. 0%
21. 0%
22. 0%
23. 0%
24. 0%
25. 0%
26. 0%
27. 0%
28. 0%
29. 0%
2012 2013 2014 2015 2016 2017 2018 2019 2020
Cost of Operation to SalesExpon. (Cost of Operation to Sales)
40.2%41.1%
37.5%36.4% 36.2%
34.9% 34.8%
31.4% 31.3%
30. 0%
32. 0%
34. 0%
36. 0%
38. 0%
40. 0%
42. 0%
2012 2013 2014 2015 2016 2017 2018 2019 2020
OPEX to Sales Expon. (OPEX to Sales)

EQUITY RESEARCH Grameenphone Ltd. (DSE: GP; BLOOMBERG: GRAM:BD)
Page 30 of 37 This research report is a property of EBL Securities Ltd. | Bangladesh Equities | June 21, 2021
N.B.: Disclaimer of the EBL Securities Ltd, the author(s) certification and rating definition have been provided at the end of the report.
To control OPEX further, GP has been optimizing its shifting towards digital media for market spending, digitalizing sales process, increased recharge through digital channels. GP has been working to make digital recharge more convenient and tools and processes have been redesigned to ensure efficiency of digital channels.
Profitability Ratios 2012 2013 2014 2015 2016 2017 2018 2019 2020 Gross Profit Margin (GPM) 76.8% 75.4% 73.5% 71.6% 72.4% 73.8% 77.5% 77.8% 76.7% Operating Profit Margin (OPM) 36.6% 34.4% 35.9% 35.3% 36.2% 38.9% 42.7% 46.4% 45.4% EBITDA Margin 53.1% 50.2% 53.1% 53.4% 54.5% 57.1% 59.7% 62.7% 62.4% Pre Tax Profit Margin 32.8% 34.0% 34.0% 33.3% 33.2% 36.8% 41.3% 44.5% 45.0% Net Profit Margin (NPM) 19.0% 15.2% 19.5% 18.8% 19.6% 21.4% 25.1% 24.0% 26.6% Return on Total Assets (ROA) 15.4% 11.6% 15.0% 15.0% 17.1% 20.7% 24.4% 24.0% 25.0% Return on Equity (ROE) 47.1% 44.1% 63.9% 63.6% 70.2% 81.1% 94.1% 91.8% 82.2% Earnings Per Share 12.96 10.89 14.79 14.59 16.68 20.31 24.71 25.56 27.54
The operator is also working towards simplification & personalization of products and services that will result in reduced cost and digitalizing customer services. Customer hits in online-based self-service platform are increasing while calls in the call center are declining which will ultimately result in better customer service at reduced cost. The operator’s efficiency in cost control with innovation and business model restructuring will continue to yield better profitability.
In line with historical trend and management declaration to give more focus in controlling the operating expenditures, we expect that OPEX to sales ratio will remain stable and likewise EBITDA margin is also expected to remain stable.
High price competition forced GP to reduce its prices. However, driving on the growth of data sales and increased 3G and 4G coverage with controlled operating expenditures the company managed to maintain a healthy margin during the last few years.
As the market has become less competitive with the elimination of two operators, GP has the opportunity to charge higher prices on its services with wider network coverage that will have a positive impact on the margin. Besides, as the operator will no longer need to invest heavily for providing 4G services, the margin for GP is expected to remain stable in the coming years.
Maintained sound business health with low dependency on debt based
financing to meet working capital and capex needs for business expansion
Though in the past GP opted for low cost foreign loan for its capital investment,
overall dependency on debt is insignificant. In the last 4 years it didn’t have any new borrowing at the year-end though some short-time borrowings were made to payout interim loans that were paid within the respective years.
Though, over the long term, both current ratios and quick ratios of the company
remained stable. GP retains lower amounts of cash and cash equivalent after paying out dividends to its shareholders and meeting ongoing working capital as well as capital expenditures. As per the latest Q1, 2021 financial result the company doesn’t have short-term or long term bank borrowing but have lease
outstanding and pays charges on lease servicing, which is in line with the industry.

EQUITY RESEARCH Grameenphone Ltd. (DSE: GP; BLOOMBERG: GRAM:BD)
Page 31 of 37 This research report is a property of EBL Securities Ltd. | Bangladesh Equities | June 21, 2021
N.B.: Disclaimer of the EBL Securities Ltd, the author(s) certification and rating definition have been provided at the end of the report.
9.0 ANALYSIS ON THE RECENT FINANCIAL AND OPERATIONAL PERFORMANCE
9.1 Latest Q1,2021 Performance Review
Increased market campaigns in the form of lower service prices along with the
reduction in local call termination rate amidst pandemic led economic uncertainty
resulted into the de-growth in earnings
Industry continued to suffer due to persisting COVID-19 pandemic
The country’s telecom industry was severely affected due to global COVID-19 pandemic since March 2020. On a YoY basis, revenue of the company experienced 3.7% decline in Q1,2021. The pandemic has slowed down the economic activities
of the country that also impacted the use
of the telecom services to a great extent. With the stressed economic reality as a result of pandemic and reduced disposable income, people have reduced their expenses on telecom services as well. So, change in the consumers behavior led to lower earnings of the company during the quarter compared to the corresponding quarter in last year.
Increase in supplementary duty has further affected the revenue from voice
segment
The government has increased the supplementary duty (SD) on telecom services from 10% to 15% with effect from 11th June 2020. The said increase in SD has resulted in reduction of overall voice calls throughout the industry as users are now moving towards more OTT platforms. Average minutes of voice calls declined to 207
against 215 in corresponding quarter of the last year due to increase in cost of usage.
High price competition caused downward pressure on data revenue despite higher volume consumption
GP’s revenue from data segment experienced decline for the first time in its history with 3.5%YoY de-growth. De-growth in data revenue was a result of increased market campaigns owing to higher market competition and large reduction in data prices. Data subscription increased by 400,000 during January-March 2021. However, on YoY basis the number of data subscribers increased by 3.2% to 41.7 million.
Even though data usage volume has seen 35.5% YoY growth while Average Data
usage per user per Months (AMBPU) also achieved almost 31.3%YoY growth, 29.2%YoY reduction in APPMB led to 5.9% YoY de-growth in average data revenue per user per month (data ARPU). Growth in AMBPU was mainly driven by 4G conversion. In the latest quarter (Q1), average price per megabytes (APPMB) witnessed 29.2% decline due to increased market competition. Meanwhile, Grameenphone added only 0.4 million data users in Q1, 2021 even though the industry witnessed 3.98 million net addition during the quarter.
Particulars Revenue (BDT mn) Growth YoY
Rev. Contribution Q1,2020 Q1,2021 Q1,2020 Q1,2021
Voice Traffic 25,574.8 24,770.1 -3.1% 70.7% 71.2% Data 8,500.0 8,200.0 -3.5% 23.5% 23.6% VAS,SMS,MMS & Others 63.4 62.9 -0.9% 0.2% 0.2% Interconnection 1,577.6 1,301.0 -17.5% 4.4% 3.7% Customer Equipment 31.8 46.5 46.3% 0.1% 0.1% Lease Revenues 383.5 407.1 6.1% 1.1% 1.2% Other Revenue 37.3 24.9 -33.3% 0.1% 0.1% Total Revenue 36168.5 34,812.6 -3.7% 0.0% 0.0%

EQUITY RESEARCH Grameenphone Ltd. (DSE: GP; BLOOMBERG: GRAM:BD)
Page 32 of 37 This research report is a property of EBL Securities Ltd. | Bangladesh Equities | June 21, 2021
N.B.: Disclaimer of the EBL Securities Ltd, the author(s) certification and rating definition have been provided at the end of the report.
Decline in voice and interconnection have contributed largely in the
reduction in ARPU
The service ARPU declined by 8.5%YoY in Q1,2021. Reduction in ARPU was mainly triggered by reduction in voice, data and interconnection revenue. Lower voice calls along with reduced call termination rate further contributed to the decline in revenue. Total revenue of the company was also impacted by reduction in local and international call termination rate. As a part of SMP restriction, asymmetric interconnection charge was imposed at a rate of BDT 0.7 per minutes for GP against BDT 0.10 per minutes for other operators (30% reduction in local call termination rate) with effect from 16th July 2020.
Amidst the pandemic, GP’s recovery for total revenue was further impacted by such reduction in local call termination rate and contributed to 17.5% YoY decline on interconnection revenue during the quarter. Though revenue from interconnection revenue is insignificant, it has marginally affected overall revenue and contribution of interconnect revenue declined to 3.7% in Q1, 2021 from that of 4.4% in Q1, 2020.
Controlled OPEX led to margin stability despite unfavorable business context
caused by the pandemic
In spite of 4.2% overall increase in salaries & personnel cost, operating expenses of the company reduced by 2.5% in Q1,2021 mainly driven by 4.7% reduction in sales, marketing and commissions expenses and 3.2% decline in operation and maintenance cost. However, despite 8.1% increase in cost of material and traffic charges, GP’s cost of operation in Q1,2021 declined by 3.0%YoY from the last year due to 7.1% lower depreciation expenses.
GP outperforms industry peers in terms of cost efficiency and has been continually improving its efficiency with cost control and efficiency driven margin improvement. Meanwhile, there has been a significant shift in the adoption of digital recharge during this pandemic, digital recharge volume increased compared to the same period last year, according to the operator, which helped in reduction of sales, marketing and commissions expenses. Moreover, this will create the way for future cost reduction for the company by reducing dependency on agent based recharge channel.
Grameenphone experienced 5.5% YoY de-growth in EBITDA in Q1,2021 mainly driven by the lower revenue along with slightly higher salaries & personnel cost and cost of material & traffic charges during the quarter. With 3.2% lower subscriber and traffic revenue compared to the same period of the previous year along with higher cost of operation and increase in effective tax rate (from 38.0% in Q1,2020 to 43.2% in Q1,2021), net profit of the company witnessed 16.7% de-growth on YoY basis even though profit before tax has seen only 9.1% YoY de-growth.
41.1
%
37.5
%
36.4
%
36.2
%
34.9
%
34.8
%
31.4
%
31.3
%
28.00%
30.00%
32.00%
34.00%
36.00%
38.00%
40.00%
42.00%
20
13
20
14
20
15
20
16
20
17
20
18
20
19
20
20
OPEX to Sales Ratio
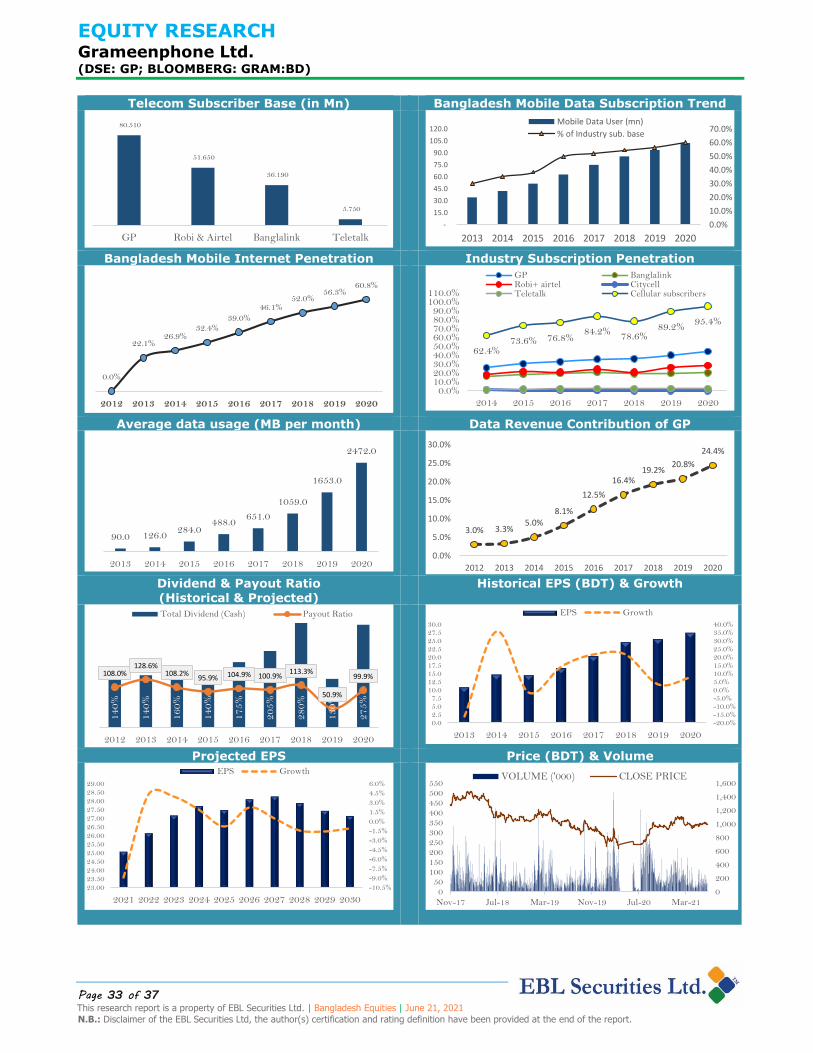
EQUITY RESEARCH Grameenphone Ltd. (DSE: GP; BLOOMBERG: GRAM:BD)
Page 33 of 37 This research report is a property of EBL Securities Ltd. | Bangladesh Equities | June 21, 2021
N.B.: Disclaimer of the EBL Securities Ltd, the author(s) certification and rating definition have been provided at the end of the report.
Telecom Subscriber Base (in Mn) Bangladesh Mobile Data Subscription Trend
Bangladesh Mobile Internet Penetration Industry Subscription Penetration
Average data usage (MB per month) Data Revenue Contribution of GP
Dividend & Payout Ratio (Historical & Projected)
Historical EPS (BDT) & Growth
Projected EPS Price (BDT) & Volume
80.510
51.650
36.190
5.750
-
10.0 00
20.0 00
30.0 00
40.0 00
50.0 00
60.0 00
70.0 00
80.0 00
90.0 00
GP Robi & Airtel Banglalink Teletalk
0.0%
10.0%
20.0%
30.0%
40.0%
50.0%
60.0%
70.0%
-
15.0
30.0
45.0
60.0
75.0
90.0
105.0
120.0
2013 2014 2015 2016 2017 2018 2019 2020
Mobile Data User (mn)
% of Industry sub. base
0.0%
22.1%26.9%
32.4%39.0%
46.1%52.0%
56.3%60.8%
0.0 %
10. 0%
20. 0%
30. 0%
40. 0%
50. 0%
60. 0%
70. 0%
2012 2013 2014 2015 2016 2017 2018 2019 2020
62.4%73.6% 76.8%
84.2% 78.6%89.2%
95.4%
0.0%10.0%20.0%30.0%40.0%50.0%60.0%70.0%80.0%90.0%
100.0%110.0%
2014 2015 2016 2017 2018 2019 2020
GP BanglalinkRobi+ airtel CitycellTeletalk Cellular subscribers
90.0 126.0284.0
488.0651.0
1059.0
1653.0
2472.0
0.0
500.0
1000.0
1500.0
2000.0
2500.0
3000.0
2013 2014 2015 2016 2017 2018 2019 2020
3.0% 3.3%5.0%
8.1%
12.5%
16.4%19.2%
20.8%
24.4%
0.0%
5.0%
10.0%
15.0%
20.0%
25.0%
30.0%
2012 2013 2014 2015 2016 2017 2018 2019 2020
14
0%
14
0%
16
0%
14
0%
17
5%
20
5%
28
0%
13
0%
27
5%
108.0%128.6%
108.2%95.9% 104.9% 100.9%
113.3%
50.9%
99.9%
0%
50%
100 %
150 %
200 %
250 %
300 %
2012 2013 2014 2015 2016 2017 2018 2019 2020
Total Dividend (Cash) Payout Ratio
-20.0%-15.0%-10.0%-5.0%0.0%5.0%10.0%15.0%20.0%25.0%30.0%35.0%40.0%
0.02.55.07.5
10.012.515.017.520.022.525.027.530.0
2013 2014 2015 2016 2017 2018 2019 2020
EPS Growth
-10.5%
-9.0%
-7.5%
-6.0%
-4.5%
-3.0%
-1.5%
0.0%
1.5%
3.0%
4.5%
6.0%
23.0023.5024.0024.5025.0025.5026.0026.5027.0027.5028.0028.5029.00
2021 2022 2023 2024 2025 2026 2027 2028 2029 2030
EPS Growth
0
200
400
600
800
1,000
1,200
1,400
1,600
050
100150200250300350400450500550
Nov-17 Jul-18 Mar-19 Nov-19 Jul-20 Mar-21
VOLUME ('000) CLOSE PRICE

EQUITY RESEARCH Grameenphone Ltd. (DSE: GP; BLOOMBERG: GRAM:BD)
Page 34 of 37 This research report is a property of EBL Securities Ltd. | Bangladesh Equities | June 21, 2021
N.B.: Disclaimer of the EBL Securities Ltd, the author(s) certification and rating definition have been provided at the end of the report.
KEY TERMINOLOGIES
1. AMPU: Average Minutes Per User Per Month 2. ARPU: Average Revenue Per User Per Month 3. APPM: Average Price Per Minutes 4. AMBPU: Average Megabytes Per User Per Month 5. APPMB: Average Price Per Megabytes
6. APPGB: Average Price Per Gigabytes 7. DPS: Dividend Per Share 8. EBIT= Earnings before Interest and Tax 9. EBITDA= Earnings before Interest, Tax, Depreciation & Amortization 10. EPS= Earnings per Share. 11. Free Float Share= Total shareholding- Sponsor or directors holding 12. GP: Grameenphone Ltd. 13. LTM: Trailing 12 Months 14. NAVPS= Net Asset Value Per Share 15. NPAT: Net Profit after Tax 16. OPEX= Operating Expenditure 17. PBT: Profit Before Tax
18. ROA= Return on Average Assets 19. ROE= Return on Average Equity 20. SMS: Short Message Service 21. VAS: Value Added Services 22. 2G, 3G & 4G/LTE: Second-Generation, Third Generation, Forth Generation/
Long-Term Evolution Cellular Technology
FORMULAS USED
1. 𝐸𝑃𝑆 = 𝑁𝑒𝑡 𝑃𝑟𝑜𝑓𝑖𝑡 𝐴𝑓𝑡𝑒𝑟 𝑇𝑎𝑥 ÷ 𝑁𝑜. 𝑜𝑓 𝑆ℎ𝑎𝑟𝑒𝑠 𝑂𝑢𝑡𝑠𝑡𝑎𝑛𝑑𝑖𝑛𝑔
2. 𝐸𝐵𝐼𝑇 = 𝑁𝑒𝑡 𝑃𝑟𝑜𝑓𝑖𝑡 + 𝐼𝑛𝑡𝑒𝑟𝑒𝑠𝑡 𝐸𝑥𝑝𝑒𝑛𝑠𝑒𝑠 + 𝑇𝑎𝑥
3. 𝐸𝐵𝐼𝑇𝐷𝐴 = 𝐸𝐵𝐼𝑇 + 𝐷𝑒𝑝𝑟𝑖𝑐𝑖𝑎𝑡𝑖𝑜𝑛 𝐸𝑥𝑝𝑒𝑛𝑠𝑒𝑠 4. 𝐶𝑢𝑟𝑟𝑒𝑛𝑡 𝑟𝑎𝑡𝑖𝑜 = 𝐶𝑢𝑟𝑟𝑒𝑛𝑡 𝐴𝑠𝑠𝑒𝑡𝑠 ÷ 𝐶𝑢𝑟𝑟𝑒𝑛𝑡 𝐿𝑖𝑎𝑏𝑖𝑙𝑖𝑡𝑖𝑒𝑠 5. 𝑄𝑢𝑖𝑐𝑘 𝑅𝑎𝑡𝑖𝑜 = [𝐶𝑢𝑟𝑟𝑒𝑛𝑡 𝐴𝑠𝑠𝑒𝑡𝑠 – 𝐼𝑛𝑣𝑒𝑛𝑡𝑜𝑟𝑦 – 𝑃𝑟𝑒𝑝𝑎𝑖𝑑 𝑒𝑥𝑝𝑒𝑛𝑠𝑒𝑠] / 𝐶𝑢𝑟𝑟𝑒𝑛𝑡 𝐿𝑖𝑎𝑏𝑖𝑙𝑖𝑡𝑖𝑒𝑠 6. 𝑅𝑂𝐴 = 𝑁𝑒𝑡 𝑃𝑟𝑜𝑓𝑖𝑡 ÷ 𝐴𝑣𝑒𝑟𝑎𝑔𝑒 𝑇𝑜𝑡𝑎𝑙 𝐴𝑠𝑠𝑒𝑡𝑠 7. 𝑅𝑂𝐸 = 𝑁𝑒𝑡 𝑃𝑟𝑜𝑓𝑖𝑡 ÷ 𝐴𝑣𝑒𝑟𝑎𝑔𝑒 𝑇𝑜𝑡𝑎𝑙 𝐸𝑞𝑢𝑖𝑡𝑦
8. 𝑇𝑖𝑚𝑒𝑠 𝐼𝑛𝑡𝑒𝑟𝑒𝑠𝑡 𝐸𝑎𝑟𝑛𝑒𝑑 = 𝐸𝐵𝐼𝑇 ÷ 𝐼𝑛𝑡𝑒𝑟𝑒𝑠𝑡 𝐸𝑥𝑝𝑒𝑛𝑠𝑒𝑠 9. 𝑃𝐸𝐺 𝑟𝑎𝑡𝑖𝑜 = 𝑃/𝐸 𝑅𝑎𝑡𝑖𝑜 / 𝐸𝑎𝑟𝑛𝑖𝑛𝑔𝑠 𝐺𝑟𝑜𝑤𝑡ℎ 𝑅𝑎𝑡𝑒
10. 𝑁𝐴𝑉𝑃𝑆 = 𝑆ℎ𝑎𝑟𝑒ℎ𝑜𝑙𝑑𝑒𝑟′𝑠 𝐸𝑞𝑢𝑖𝑡𝑦 ÷ 𝑁𝑜. 𝑜𝑓 𝑆ℎ𝑎𝑟𝑒𝑠 𝑂𝑢𝑡𝑠𝑡𝑎𝑛𝑑𝑖𝑛𝑔
11. 𝐺𝑟𝑜𝑠𝑠 𝑃𝑟𝑜𝑓𝑖𝑡 𝑀𝑎𝑟𝑔𝑖𝑛 = 𝐺𝑟𝑜𝑠𝑠 𝑃𝑟𝑜𝑓𝑖𝑡 ÷ 𝑁𝑒𝑡 𝑆𝑎𝑙𝑒𝑠 12. 𝑂𝑝𝑒𝑟𝑎𝑡𝑖𝑛𝑔 𝑃𝑟𝑜𝑓𝑖𝑡 𝑀𝑎𝑟𝑔𝑖𝑛 = 𝑂𝑝𝑒𝑟𝑎𝑡𝑖𝑛𝑔 𝑃𝑟𝑜𝑓𝑖𝑡 ÷ 𝑁𝑒𝑡 𝑆𝑎𝑙𝑒𝑠 13. 𝐸𝐵𝐼𝑇𝐷𝐴 𝑀𝑎𝑟𝑔𝑖𝑛 = 𝐸𝐵𝐼𝑇𝐷𝐴 ÷ 𝑁𝑒𝑡 𝑆𝑎𝑙𝑒𝑠 14. 𝐸𝑉 = 𝑀𝑎𝑟𝑘𝑒𝑡 𝑐𝑎𝑝𝑖𝑡𝑎𝑙𝑖𝑧𝑎𝑡𝑖𝑜𝑛 + 𝑂𝑢𝑡𝑠𝑡𝑎𝑛𝑑𝑖𝑛𝑔 𝑑𝑒𝑏𝑡 +
𝑀𝑖𝑛𝑜𝑟𝑖𝑡𝑦 𝑖𝑛𝑡𝑒𝑟𝑒𝑠𝑡 – 𝐶𝑎𝑠ℎ 𝑎𝑛𝑑 𝑐𝑎𝑠ℎ 𝑒𝑞𝑢𝑖𝑣𝑎𝑙𝑒𝑛𝑡𝑠
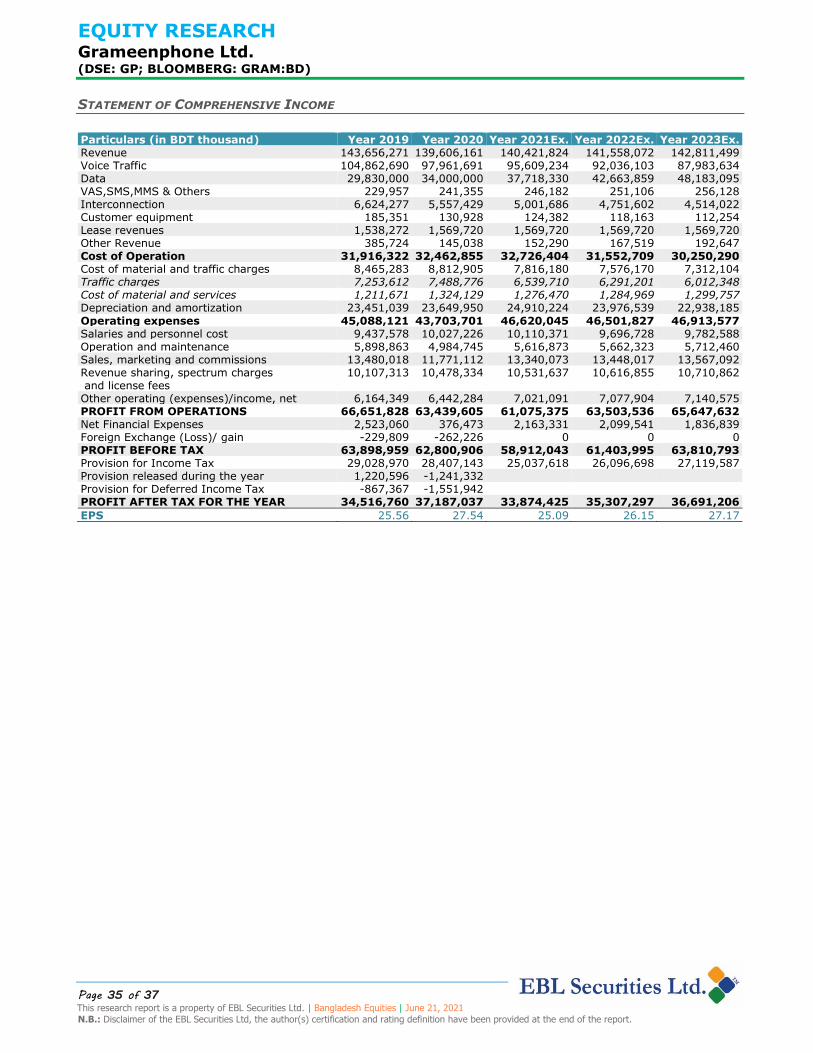
EQUITY RESEARCH Grameenphone Ltd. (DSE: GP; BLOOMBERG: GRAM:BD)
Page 35 of 37 This research report is a property of EBL Securities Ltd. | Bangladesh Equities | June 21, 2021
N.B.: Disclaimer of the EBL Securities Ltd, the author(s) certification and rating definition have been provided at the end of the report.
STATEMENT OF COMPREHENSIVE INCOME
Particulars (in BDT thousand) Year 2019 Year 2020 Year 2021Ex. Year 2022Ex. Year 2023Ex. Revenue 143,656,271 139,606,161 140,421,824 141,558,072 142,811,499 Voice Traffic 104,862,690 97,961,691 95,609,234 92,036,103 87,983,634 Data 29,830,000 34,000,000 37,718,330 42,663,859 48,183,095 VAS,SMS,MMS & Others 229,957 241,355 246,182 251,106 256,128 Interconnection 6,624,277 5,557,429 5,001,686 4,751,602 4,514,022 Customer equipment 185,351 130,928 124,382 118,163 112,254 Lease revenues 1,538,272 1,569,720 1,569,720 1,569,720 1,569,720 Other Revenue 385,724 145,038 152,290 167,519 192,647 Cost of Operation 31,916,322 32,462,855 32,726,404 31,552,709 30,250,290 Cost of material and traffic charges 8,465,283 8,812,905 7,816,180 7,576,170 7,312,104 Traffic charges 7,253,612 7,488,776 6,539,710 6,291,201 6,012,348 Cost of material and services 1,211,671 1,324,129 1,276,470 1,284,969 1,299,757 Depreciation and amortization 23,451,039 23,649,950 24,910,224 23,976,539 22,938,185
Operating expenses 45,088,121 43,703,701 46,620,045 46,501,827 46,913,577 Salaries and personnel cost 9,437,578 10,027,226 10,110,371 9,696,728 9,782,588 Operation and maintenance 5,898,863 4,984,745 5,616,873 5,662,323 5,712,460 Sales, marketing and commissions 13,480,018 11,771,112 13,340,073 13,448,017 13,567,092 Revenue sharing, spectrum charges and license fees
10,107,313 10,478,334 10,531,637 10,616,855 10,710,862
Other operating (expenses)/income, net 6,164,349 6,442,284 7,021,091 7,077,904 7,140,575 PROFIT FROM OPERATIONS 66,651,828 63,439,605 61,075,375 63,503,536 65,647,632 Net Financial Expenses 2,523,060 376,473 2,163,331 2,099,541 1,836,839 Foreign Exchange (Loss)/ gain -229,809 -262,226 0 0 0 PROFIT BEFORE TAX 63,898,959 62,800,906 58,912,043 61,403,995 63,810,793 Provision for Income Tax 29,028,970 28,407,143 25,037,618 26,096,698 27,119,587 Provision released during the year 1,220,596 -1,241,332 Provision for Deferred Income Tax -867,367 -1,551,942 PROFIT AFTER TAX FOR THE YEAR 34,516,760 37,187,037 33,874,425 35,307,297 36,691,206
EPS 25.56 27.54 25.09 26.15 27.17

EQUITY RESEARCH Grameenphone Ltd. (DSE: GP; BLOOMBERG: GRAM:BD)
Page 36 of 37 This research report is a property of EBL Securities Ltd. | Bangladesh Equities | June 21, 2021
N.B.: Disclaimer of the EBL Securities Ltd, the author(s) certification and rating definition have been provided at the end of the report.
STATEMENT OF FINANCIAL POSITION
Particulars (in BDT thousand) Year 2019 Year 2020 Year 2021Ex. Year 2022Ex. Year 2023Ex. Non-Current Assets: 127,735,251 138,253,346 140,376,910 134,759,660 129,297,573 Property, Plant and Equipment- Carrying Value
56,341,823 51,190,221 49,516,962 46,377,114 43,352,436
Intangible Assets, net 1,583,860 1,755,811 2,777,958 3,274,816 3,553,361 Right-of-use assets 58,028,533 53,532,673 52,931,730 49,957,469 47,241,515 Capital Work in Progress 6,745,678 6,271,747 9,647,366 9,647,367 9,647,368 Contract cost 4,480,157 4,934,438 4,934,438 4,934,438 4,934,438 Other Non-Current Assets 555,200 20,568,456 20,568,456 20,568,456 20,568,456 Current Assets: 20,999,171 9,930,971 6,776,843 12,825,164 18,610,174
Inventories 225,441 201,068 280,844 283,116 285,623 Trade Debtors 7,013,053 7,131,165 7,021,091 7,077,904 7,140,575 Cash and Cash Equivalents 13,760,677 2,598,738 -525,091 5,464,144 11,183,976 TOTAL ASSETS 148,734,422 148,184,317 147,153,754 147,584,824 147,907,748 SHAREHOLDERS' EQUITY AND LIABILITIES: Shareholders' Equity: 38,347,405 52,107,614 50,223,387 51,773,184 52,006,290 Share Capital 13,503,000 13,503,000 13,503,000 13,503,000 13,503,000 Share Premium 7,840,226 7,840,226 7,840,226 7,840,226 7,840,226 Share Money Deposit 1,880 0 0 0 0 Capital Reserve 14,446 14,446 14,446 14,446 14,446 Retained Earnings/ Revenue Reserve 16,987,853 30,749,942 28,865,715 30,415,512 30,648,618 Non-Current Liabilities: 19,960,795 19,420,329 18,921,182 18,959,814 19,002,431 Net defined benefit plans 936,703 1,641,383 1,404,218 1,415,581 1,428,115 Obligation under finance lease 13,484,106 14,146,840 14,146,840 14,146,840 14,146,840 Deferred Tax Liability 5,216,029 3,350,834 2,808,436 2,831,161 2,856,230 Other Non-Current Liabilities 323,957 281,272 561,687 566,232 571,246 Current Liabilities: 90,426,222 76,656,374 78,009,185 76,851,825 76,899,027 Current portion of LTD 2,934,284 1,240,000 0 0 0 Lease Liabilities 7,349,549 6,328,697 6,328,697 6,328,697 6,328,697 Trade Creditors (including liability for Capex)
22,676,406 23,988,115 26,448,673 25,480,453 25,706,070
Current Tax Liabilities 28,137,225 24,870,650 24,870,650 24,870,650 24,870,650 Provision for operating expenses 18,839,102 14,402,559 14,042,182 13,801,912 13,567,092 Other Current Liabilities 10,489,656 5,826,353 6,318,982 6,370,113 6,426,517 TOTAL SHAREHOLDERS' EQUITY AND LIABILITIES
148,734,422 148,184,317 147,153,754 147,584,824 147,907,748
Net Asset Value (NAVPS) Per Share 28.40 38.59 37.19 38.34 38.51

EQUITY RESEARCH Grameenphone Ltd. (DSE: GP; BLOOMBERG: GRAM:BD)
Page 37 of 37 This research report is a property of EBL Securities Ltd. | Bangladesh Equities | June 21, 2021
N.B.: Disclaimer of the EBL Securities Ltd, the author(s) certification and rating definition have been provided at the end of the report.
KEY FINANCIAL INDICATORS
RATIO ANALYSIS Year 2019 Year 2020 Year 2021Ex. Year 2022Ex. Year 2023Ex. Liquidity Ratios: Current Ratio 0.2 0.1 0.1 0.2 0.2 Quick Ratio 0.2 0.1 0.1 0.2 0.2 Profitability Ratios OPEX to sales ratio 31.4% 31.3% 33.2% 32.9% 32.9% Gross Profit margin 77.8% 76.7% 76.7% 77.7% 78.8% Operating Profit Margin (OPM) 46.4% 45.4% 43.5% 44.9% 46.0% EBITDA Margin 62.7% 62.4% 61.2% 61.8% 62.0% Pre Tax Profit Margin 44.5% 45.0% 42.0% 43.4% 44.7% Net Profit Margin (NPM) 24.0% 26.6% 24.1% 24.9% 25.7% Return on Total Assets (ROAA) 24.0% 25.0% 22.9% 24.0% 24.8% Return on Equity (ROE) 91.8% 82.2% 66.2% 69.2% 70.7% Leverage Ratios
Total Debt to Equity 62.0% 41.7% 40.8% 39.5% 39.4% Debt to Total Assets 16.0% 14.7% 13.9% 13.9% 13.8% Coverage Ratios Times Interest Earned (TIE) 26.4 168.5 28.2 30.2 35.7 Cash Coverage Ratio 27.2 178.9 33.1 33.6 38.0 Valuation Ratios P/B (price to book) Ratio 10.1 9.0 9.5 9.3 9.2 Book Value Per Share 28.4 38.6 37.2 38.3 38.5 EPS 25.6 27.5 25.1 26.1 27.2 OCF per share 42.5 24.9 42.9 43.6 43.8 Dividend per Share 13.0 14.0 25.0 26.0 27.0 Dividend Payout Ratio 50.9% 50.8% 99.7% 99.4% 99.4% Dividend Yield Ratio 4.5% 4.0% 7.0% 7.3% 7.6% Retention Rate 49.1% 49.2% 0.3% 0.6% 0.6% P/E Ratio 11.2 12.6 14.2 13.6 13.1 EV/EBITDA 4.4 5.6 5.8 5.7 5.5 EV/Sales 2.8 3.5 3.6 3.5 3.4 Price/Sales 2.7 3.4 3.4 3.4 3.4 Sales/ Share 106.4 103.4 104.0 104.8 105.8 P/OCF 6.7 14.0 8.3 8.1 8.1 Growth Rates EPS Growth Rate 3.5% 7.7% -8.9% 4.2% 3.9% Dividend Growth Rate -53.6% 7.7% 78.6% 4.0% 3.8% Sales Growth Rate 8.1% -2.8% 0.6% 0.8% 0.9% Operating Profit Growth Rate 17.4% -4.8% -3.7% 4.0% 3.4% Net Income Growth Rate 3.5% 7.7% -8.9% 4.2% 3.9% Dividend Payout Ratio -55.1% 0.0% 96.0% -0.2% -0.1% Total Asset Growth Rate 7.2% -0.4% -0.7% 0.3% 0.2% EBITDA 13.6% -3.3% -1.3% 1.7% 1.3% DUPONT ANALYSIS Net Profit AT/Sales 24.0% 26.6% 24.1% 24.9% 25.7% Sales/Total Assets 100.0% 94.0% 95.1% 96.1% 96.7% ROA 24.0% 25.0% 22.9% 24.0% 24.8% Net Profit AT/Total Assets 24.0% 25.0% 22.9% 24.0% 24.8% Total Assets/Stockholders. Equity 3.8 3.3 2.9 2.9 2.8 ROE 91.8% 82.2% 66.2% 69.2% 70.7% Extended DUPONT ANALYSIS Net Profit/Pretax Profit 54.0% 59.2% 57.5% 57.5% 57.5% Pretax Profit/EBIT 95.9% 99.0% 96.5% 96.7% 97.2% EBIT/Sales 46.4% 45.4% 43.5% 44.9% 46.0% Sales/Assets 100.0% 94.0% 95.1% 96.1% 96.7% Assets/Equity 3.8 3.3 2.9 2.9 2.8 ROE 91.8% 82.2% 66.2% 69.2% 70.7%

EBLSL RESEARCH
© 2021 EBL Securities Ltd.
This research report is a property of EBL Securities Ltd. | Bangladesh Equities | N.B.: Disclaimer of the EBL Securities Ltd, the author(s) certification and rating definition have been provided at the end of the report.
IMPORTANT DISCLOSURES
Disclaimer: This document has been prepared by EBL Securities Limited (“EBLSL”) for information purpose only of its clients residing both in Bangladesh and abroad, on the basis of the publicly available information in the market and own research. This document does not solicit any action based on the material contained herein and should not be taken as an offer or solicitation to buy or sell or subscribe to any security. Neither EBLSL nor any of its directors, shareholders, member of the management or employee represents or warrants expressly or impliedly that the information or data or the sources used in the documents are genuine, accurate, complete, authentic and correct.
However all reasonable care has been taken to ensure the accuracy of the contents of this document. Being a broker, EBLSL may have a business relationship with the public companies from time to time. EBLSL and its affiliates, directors, management personnel and employees may have positions in, and buy or sell the securities, if any, referred to in this document. EBLSL disclaims liability for any direct, indirect, punitive, special, consequential, or incidental damages related to the report or the use of the report.
This document is distributed by EBL Securities Ltd. and its authorized distribution partners on a global basis. This document is not directed to, or intended for distribution to or use by, any person or entity that is citizen or resident of or located in any locality, state, country, or other jurisdiction where such distribution, publication, availability or use would be contrary to law or regulation. The information and data presented herein are the exclusive property of EBLSL and any unauthorized reproduction or redistribution of the same is strictly prohibited.
Analyst Certification: The person or persons named as the author(s) of this report hereby certify that the
recommendations and opinions expressed in the research report accurately reflect their personal views about the subject matter(s) discussed. The views of the author(s) do not necessarily reflect the views of the EBL Securities Limited (EBLSL) and/or any of its salespeople, traders and other professionals and are subject to change without any prior notice. All reasonable care has been taken to ensure the accuracy of the contents of this document and the author(s) will not take any responsibility for any decision made by investors based on the information herein.
Compensation of Analyst(s): The compensation of research analyst(s) is intended to reflect the value of the services they provide to the clients of EBLSL. The compensation of the analysts is impacted by the overall profitability of the firm. However, EBLSL and its analyst(s) confirms that no part of the analyst’s compensation was, is, or will be, directly or indirectly, related to the specific recommendations, opinions or views expressed in the research reports.
General Risk Factors: The information provided in the report may be impacted by market data system outages or errors, both internal and external, and affected by frequent movement of market events. The report may contain
some forward looking statements, projections, estimates and forecasts which are based on assumptions made and information available to us that we believe to be reasonable and are subject to certain risks and uncertainties. There may be many uncontrollable or unknown factors and uncertainties which may cause actual results to materially differ from the results, performance or expectations expressed or implied by such forward-looking statements. EBLSL cautions all investors that such forward-looking statements in this report are not guarantees of future performance. Investors should exercise good judgment and perform adequate due-diligence prior to making any investment. All opinions and estimates contained in this report are subject to change without any notice due to changed circumstances and without legal liability. Other than certain industry reports published on a periodic basis, the large majority of reports are published at irregular intervals as appropriate in the analyst’s judgment. However, EBLSL disclaims any obligation to update or revise any such forward looking statements to reflect new information, events or circumstances after the publication of this report to reflect the occurrences and results of unanticipated events.
For U.S. persons only: This research report is a product of EBL Securities Ltd., which is the employer of the
research analyst(s) who has prepared the research report. The research analyst(s) preparing the research report is/are resident outside the United States (U.S.) and are not associated persons of any U.S. regulated broker-dealer and therefore the analyst(s) is/are not subject to supervision by a U.S. broker-dealer, and is/are not required to satisfy the regulatory licensing requirements of FINRA or required to otherwise comply with U.S. rules or regulations regarding, among other things, communications with a subject company, public appearances and trading securities held by a research analyst account.
This report is intended for distribution by EBL Securities Ltd. only to "Major Institutional Investors" as defined by Rule 15a-6(b)(4) of the U.S. Securities and Exchange Act, 1934 (the Exchange Act) and interpretations thereof by U.S. Securities and Exchange Commission (SEC) in reliance on Rule 15a 6(a)(2). If the recipient of this report is not a Major Institutional Investor as specified above, then it should not act upon this report and return the same to the sender. Further, this report may not be copied, duplicated and/or transmitted onward to any U.S. person, which is
not the Major Institutional Investor.
EBLSL Rating Interpretation
Overweight : Stock is expected to provide positive returns at a rate greater than its required rate of return Accumulate : Stock is expected to provide positive inflation adjusted returns at a rate less than its required
rate of return Market
weight
: Current market price of the stock reasonably reflect its fundamental value
Underweight : Stock expected to fall by more than 10% in one year Not Rated : Currently the analyst does not have adequate conviction about the stock's expected total return
No part of this material may be (i) copied, photocopied or duplicated in any form by any means (ii) used in any other report or publication or anything of that sort without appropriate credit given or (iii) redistributed without the prior written consent of The EBL Securities Ltd. This disclaimer applies to the report irrespective of being used in whole or in part.

EBLSL RESEARCH
© 2021 EBL Securities Ltd.
This research report is a property of EBL Securities Ltd. | Bangladesh Equities | N.B.: Disclaimer of the EBL Securities Ltd, the author(s) certification and rating definition have been provided at the end of the report.
About EBL Securities Ltd.: EBL Securities Ltd. (EBLSL) is one of the fastest growing full-service brokerage companies in Bangladesh and a fully owned subsidiary of Eastern Bank Limited. EBLSL is also one of the leading stock brokerage houses of the country. EBL Securities Limited is the TREC-holder of both exchanges of the country; DSE (TREC# 026) and CSE (TREC# 021). EBLSL takes pride in its strong commitment towards excellent client services and the development of the Bangladesh capital markets. EBLSL has developed a disciplined approach towards providing capital market services, including securities trading, margin loan facilities, depository services,
foreign trading facilities, Bloomberg Terminal, online trading facilities, research services, panel brokerage services, trading through NITA for foreign investors & NRBs etc.
EBLSL Key Management
Md. Sayadur Rahman Managing Director [email protected] M. Shahryar Faiz Chief Operating Officer [email protected] Md. Asaduzzaman Chief Financial Officer [email protected]
EBLSL Research Team
Mohammad Asrarul Haque Research Analyst [email protected]
Mohammad Rehan Kabir Senior Research Associate [email protected] Arif Abdullah Research Associate [email protected] Md Rashadur Rahman Ratul Research Associate [email protected]
EBLSL Institutional & Foreign Trade Team
Asif Islam Associate Manager [email protected]
For any queries regarding this report: [email protected]
EBLSL Research Reports are also available on www.eblsecurities.com > Research
Our Global Research Distribution Partners
To access EBLSL research through Bloomberg use <EBLS>
Our Locations
Head Office:
Jiban Bima Bhaban,
10 Dilkusha C/A, 1st Floor, Dhaka-1000
+8802 9553247, 9556845;+8802 47111935
FAX: +8802 47112944 [email protected]
HO Extension:
Bangladesh Sipping Corporation (BSC) Tower 2-3, Rajuk Avenue (4th floor), Motijheel, Dhaka-1000 +880257160801-4
Chattogram Branch:
Suraiya Mansion (6th Floor); 30, Agrabad C/A Chattogram-4100 +031 2522041-43
Dhanmondi Branch:
Sima Blossom, House # 390 (Old), 3 (New), Road # 27 (Old), 16 (New), Dhanmondi R/A, Dhaka-1209. +8802-9130268, +8802-9130294