CABLES & WIRES - Yes Securities
41
CABLES & WIRES Connecting India’s Growth
-
Upload
khangminh22 -
Category
Documents
-
view
0 -
download
0
Transcript of CABLES & WIRES - Yes Securities
CABLES & WIRES
Connecting India’s Growth
Research Analyst: Tarang Bhanushali [email protected] | Rahul Jain [email protected] Head of Research: Amar Ambani [email protected] (For important information about YES SECURITIES (INDIA) LTD. and other disclosures, refer to the end of this material.)
Cables & Wires Connecting India’s Growth
SECTOR REPORT
April 09, 2019
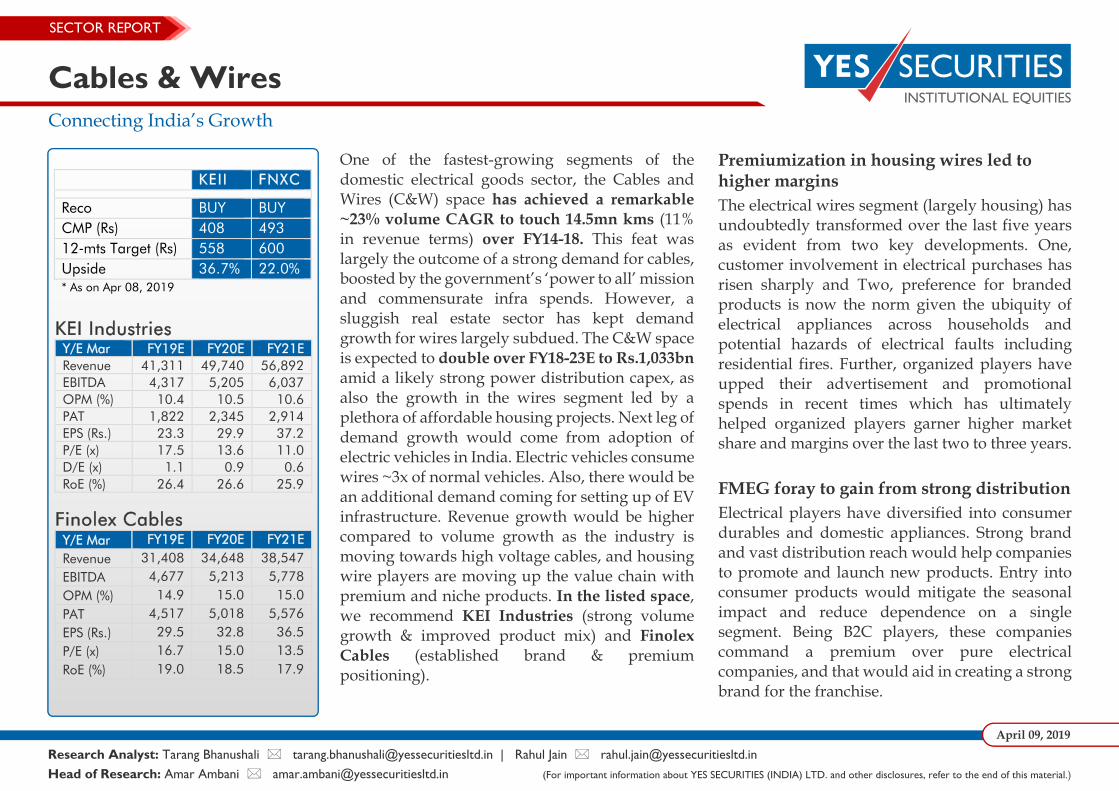
KEII FNXC
Reco BUY BUY CMP (Rs) 408 493 12‐mts Target (Rs) 558 600 Upside 36.7% 22.0% * As on Apr 08, 2019
KEI Industries Y/E Mar FY19E FY20E FY21E Revenue 41,311 49,740 56,892 EBITDA 4,317 5,205 6,037 OPM (%) 10.4 10.5 10.6 PAT 1,822 2,345 2,914 EPS (Rs.) 23.3 29.9 37.2 P/E (x) 17.5 13.6 11.0 D/E (x) 1.1 0.9 0.6 RoE (%) 26.4 26.6 25.9
Finolex Cables Y/E Mar FY19E FY20E FY21E Revenue 31,408 34,648 38,547 EBITDA 4,677 5,213 5,778 OPM (%) 14.9 15.0 15.0 PAT 4,517 5,018 5,576 EPS (Rs.) 29.5 32.8 36.5 P/E (x) 16.7 15.0 13.5 RoE (%) 19.0 18.5 17.9
One of the fastest-growing segments of the domestic electrical goods sector, the Cables and Wires (C&W) space has achieved a remarkable ~23% volume CAGR to touch 14.5mn kms (11% in revenue terms) over FY14-18. This feat was largely the outcome of a strong demand for cables, boosted by the government’s ‘power to all’ mission and commensurate infra spends. However, a sluggish real estate sector has kept demand growth for wires largely subdued. The C&W space is expected to double over FY18-23E to Rs.1,033bn amid a likely strong power distribution capex, as also the growth in the wires segment led by a plethora of affordable housing projects. Next leg of demand growth would come from adoption of electric vehicles in India. Electric vehicles consume wires ~3x of normal vehicles. Also, there would be an additional demand coming for setting up of EV infrastructure. Revenue growth would be higher compared to volume growth as the industry is moving towards high voltage cables, and housing wire players are moving up the value chain with premium and niche products. In the listed space, we recommend KEI Industries (strong volume growth & improved product mix) and Finolex Cables (established brand & premium positioning).
Premiumization in housing wires led to higher margins The electrical wires segment (largely housing) has undoubtedly transformed over the last five years as evident from two key developments. One, customer involvement in electrical purchases has risen sharply and Two, preference for branded products is now the norm given the ubiquity of electrical appliances across households and potential hazards of electrical faults including residential fires. Further, organized players have upped their advertisement and promotional spends in recent times which has ultimately helped organized players garner higher market share and margins over the last two to three years. FMEG foray to gain from strong distribution Electrical players have diversified into consumer durables and domestic appliances. Strong brand and vast distribution reach would help companies to promote and launch new products. Entry into consumer products would mitigate the seasonal impact and reduce dependence on a single segment. Being B2C players, these companies command a premium over pure electrical companies, and that would aid in creating a strong brand for the franchise.

Cables & Wires
2
KEI Industries: Retail penetration to drive growth KEI has emerged as the fastest growing cables and wires company in the listed space over the past five years. Strong demand from the power distribution sector and increasing share of housing wires has propelled KEI’s growth. Increasing domestic market reach and improved brand visibility through media spends has helped doubling of revenues through dealer network over FY14-18, at Rs.9.8bn (28.2% of revenue). The company has also doubled its institutional sales on the back of strong demand from infra & power distribution sectors and KEI’s comprehensive range in its cables portfolio. On the back of capacity expansion, EHV & EPC order execution, and strong demand from power distribution sector, we expect KEI to witness a 18% revenue CAGR over FY18-21. Increase in share of higher margin segments (470bps) should bring about an 83bps expansion in operating margins over FY18-21. We believe the company would witness some rerating given a likely 26.4% PAT CAGR over FY18-21, RoE of +25% and D/E trending lower to 0.6x. We initiate with a Buy rating for a target price of Rs.558 (15x FY21E P/E). Exhibit 1: Consumer Electricals sector valuation snapshot
Finolex cables: A Pure Premium play Finolex Cables is a leading player in the domestic cables and wires industry. It has a vast distribution network across India and commands a notable premium over its peers. The company has ramped up its communication cables business and has diversified into higher margin consumer electric products. Remarkably enough, Finolex has maintained its premium brand image despite the weak growth in electrical C&W segment, with no compromise whatsoever on margins and working capital cycle even during this tough phase. With green shoots visible in 9M FY19, we believe growth over the next two years would be led by new product introduction, strong demand for optic fibre and growing FMEG contribution. Increased promotional expenses coupled with expansion of dealer network should help FMEG product revenues double over FY18-21. We expect a revenue CAGR of 11% over FY18-21E with OPM of ~15%, and we believe that the valuation gap between Finolex and its peers in the electrical industry will narrow as it continues to deliver superior margins and increase the share of FMEG products. We value the company at 20x standalone FY21E P/E (higher than its 3-yr average of 19x) and initiate coverage with a Buy rating for a target price of Rs.600.
Company Mcap CAGR (FY18-
21E) (%) EBITDA margin (%) RoE (%) RoCE (%) P/E (x)
Rs. mn Rev PAT FY18 FY19E FY20E FY21E FY18 FY19E FY20E FY21E FY18 FY19E FY20E FY21E FY18 FY19E FY20E FY21E Finolex Cabl 75,404 11.0 19.1 15.7 14.9 15.0 15.0 14.4 17.2 16.6 16.0 20.9 19.0 18.5 17.9 22.8 16.7 15.0 13.5 KEI Ind. 31,971 18.0 26.4 9.8 10.4 10.5 10.6 27.1 26.4 26.6 25.9 23.8 26.1 27.9 28.9 22.2 17.5 13.6 11.0 Havells 474,451 15.4 19.0 13.9 13.5 14.3 14.9 20.0 20.9 22.5 23.0 26.9 28.3 30.5 31.4 66.6 56.8 46.4 39.6 Vguard 94,074 13.4 23.5 8.2 8.1 9.5 10.2 19.5 18.7 22.1 23.4 26.1 25.1 29.4 31.1 69.7 62.5 45.9 37.0 Crompton 141,657 11.6 18.1 13.0 13.0 13.6 14.2 49.5 40.8 39.0 37.1 42.9 40.2 44.8 50.6 43.7 38.6 31.8 26.6 Symphony 94,922 17.9 11.7 27.5 21.8 23.0 24.0 35.8 26.2 27.0 25.4 46.8 35.4 36.6 34.8 49.3 52.9 41.3 35.4 Orient Elect 33,313 13.9 26.7 8.5 9.0 9.4 9.5 40.3 29.6 29.5 27.4 46.9 35.5 36.9 36.1 52.0 37.6 29.8 25.6
Source: Company, Bloomberg, YES Sec – Research, * As on Apr 08, 2019
Cables & Wires
3
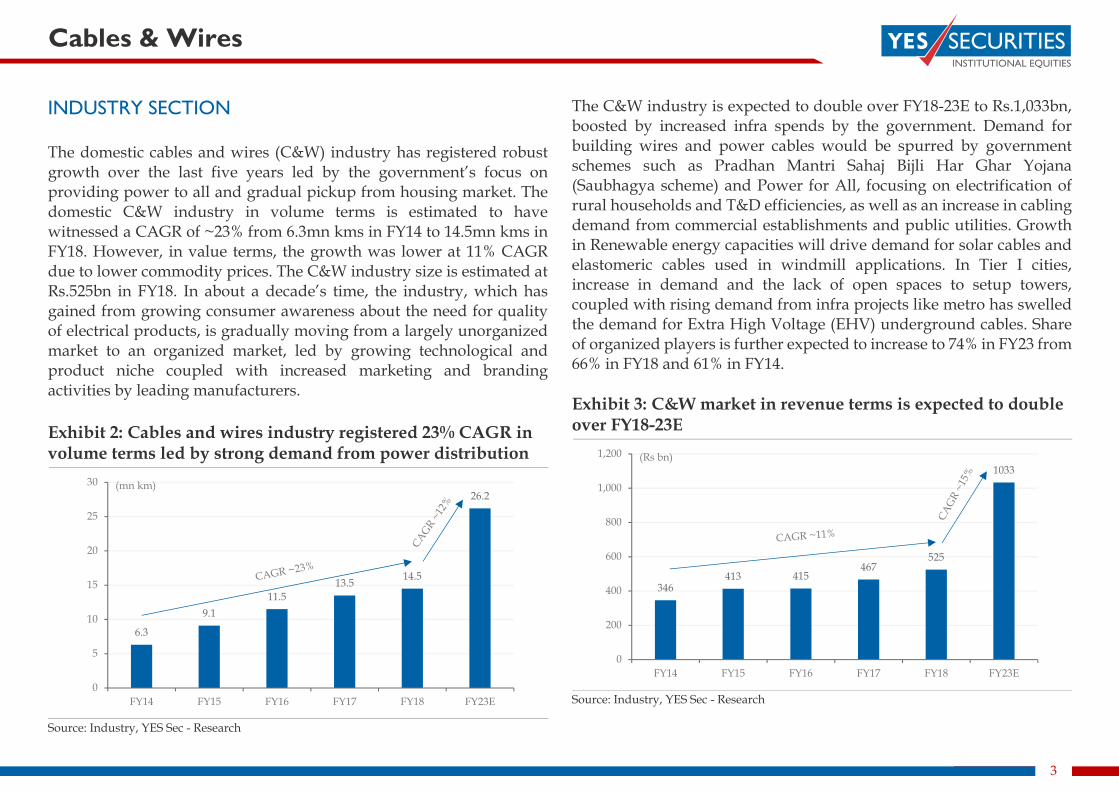
INDUSTRY SECTION The domestic cables and wires (C&W) industry has registered robust growth over the last five years led by the government’s focus on providing power to all and gradual pickup from housing market. The domestic C&W industry in volume terms is estimated to have witnessed a CAGR of ~23% from 6.3mn kms in FY14 to 14.5mn kms in FY18. However, in value terms, the growth was lower at 11% CAGR due to lower commodity prices. The C&W industry size is estimated at Rs.525bn in FY18. In about a decade’s time, the industry, which has gained from growing consumer awareness about the need for quality of electrical products, is gradually moving from a largely unorganized market to an organized market, led by growing technological and product niche coupled with increased marketing and branding activities by leading manufacturers. Exhibit 2: Cables and wires industry registered 23% CAGR in volume terms led by strong demand from power distribution
Source: Industry, YES Sec - Research
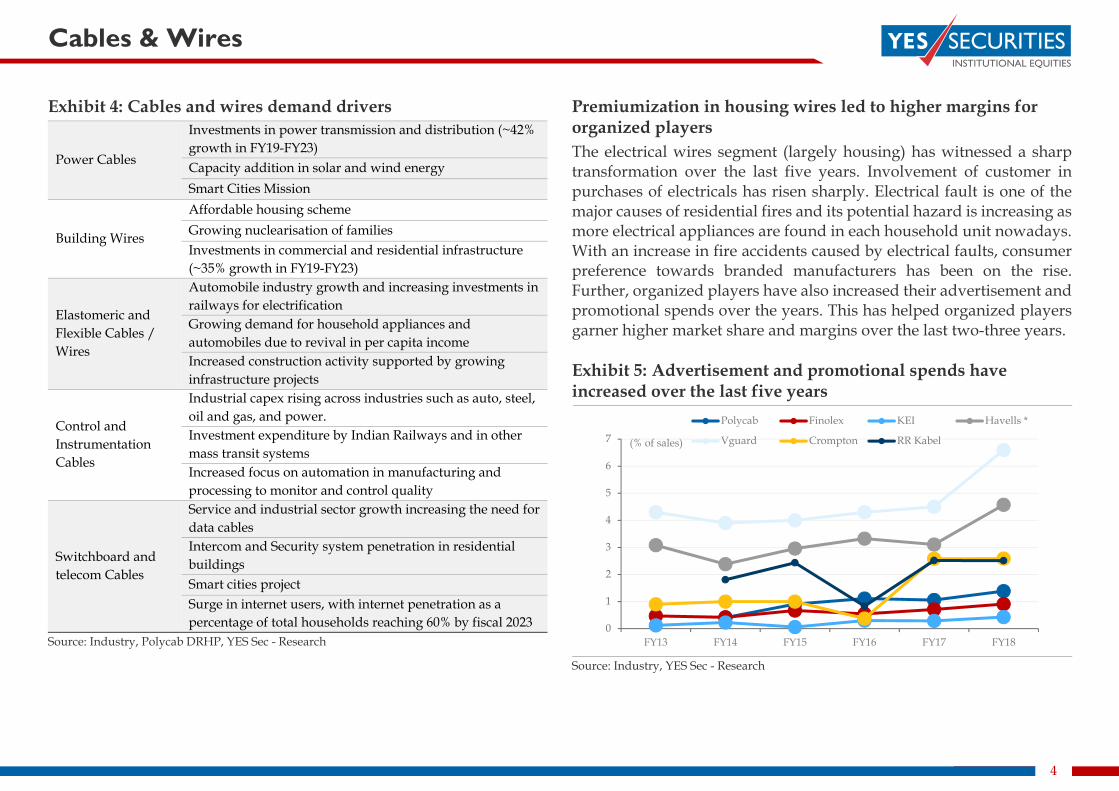
The C&W industry is expected to double over FY18-23E to Rs.1,033bn, boosted by increased infra spends by the government. Demand for building wires and power cables would be spurred by government schemes such as Pradhan Mantri Sahaj Bijli Har Ghar Yojana (Saubhagya scheme) and Power for All, focusing on electrification of rural households and T&D efficiencies, as well as an increase in cabling demand from commercial establishments and public utilities. Growth in Renewable energy capacities will drive demand for solar cables and elastomeric cables used in windmill applications. In Tier I cities, increase in demand and the lack of open spaces to setup towers, coupled with rising demand from infra projects like metro has swelled the demand for Extra High Voltage (EHV) underground cables. Share of organized players is further expected to increase to 74% in FY23 from 66% in FY18 and 61% in FY14. Exhibit 3: C&W market in revenue terms is expected to double over FY18-23E
Source: Industry, YES Sec - Research
6.3
9.111.5
13.5 14.5
26.2
0
5
10
15
20
25
30
FY14 FY15 FY16 FY17 FY18 FY23E
(mn km)
346413 415
467525
1033
0
200
400
600
800
1,000
1,200
FY14 FY15 FY16 FY17 FY18 FY23E
(Rs bn)
Cables & Wires
4
Exhibit 4: Cables and wires demand drivers
Power Cables
Investments in power transmission and distribution (~42% growth in FY19-FY23) Capacity addition in solar and wind energy Smart Cities Mission
Building Wires
Affordable housing scheme Growing nuclearisation of families Investments in commercial and residential infrastructure (~35% growth in FY19-FY23)
Elastomeric and Flexible Cables / Wires
Automobile industry growth and increasing investments in railways for electrification Growing demand for household appliances and automobiles due to revival in per capita income Increased construction activity supported by growing infrastructure projects
Control and Instrumentation Cables
Industrial capex rising across industries such as auto, steel, oil and gas, and power. Investment expenditure by Indian Railways and in other mass transit systems Increased focus on automation in manufacturing and processing to monitor and control quality
Switchboard and telecom Cables
Service and industrial sector growth increasing the need for data cables Intercom and Security system penetration in residential buildings Smart cities project Surge in internet users, with internet penetration as a percentage of total households reaching 60% by fiscal 2023
Source: Industry, Polycab DRHP, YES Sec - Research
Premiumization in housing wires led to higher margins for organized players The electrical wires segment (largely housing) has witnessed a sharp transformation over the last five years. Involvement of customer in purchases of electricals has risen sharply. Electrical fault is one of the major causes of residential fires and its potential hazard is increasing as more electrical appliances are found in each household unit nowadays. With an increase in fire accidents caused by electrical faults, consumer preference towards branded manufacturers has been on the rise. Further, organized players have also increased their advertisement and promotional spends over the years. This has helped organized players garner higher market share and margins over the last two-three years. Exhibit 5: Advertisement and promotional spends have increased over the last five years
Source: Industry, YES Sec - Research
0
1
2
3
4
5
6
7
FY13 FY14 FY15 FY16 FY17 FY18
(% of sales)
Polycab Finolex KEI Havells *
Vguard Crompton RR Kabel
Cables & Wires
5
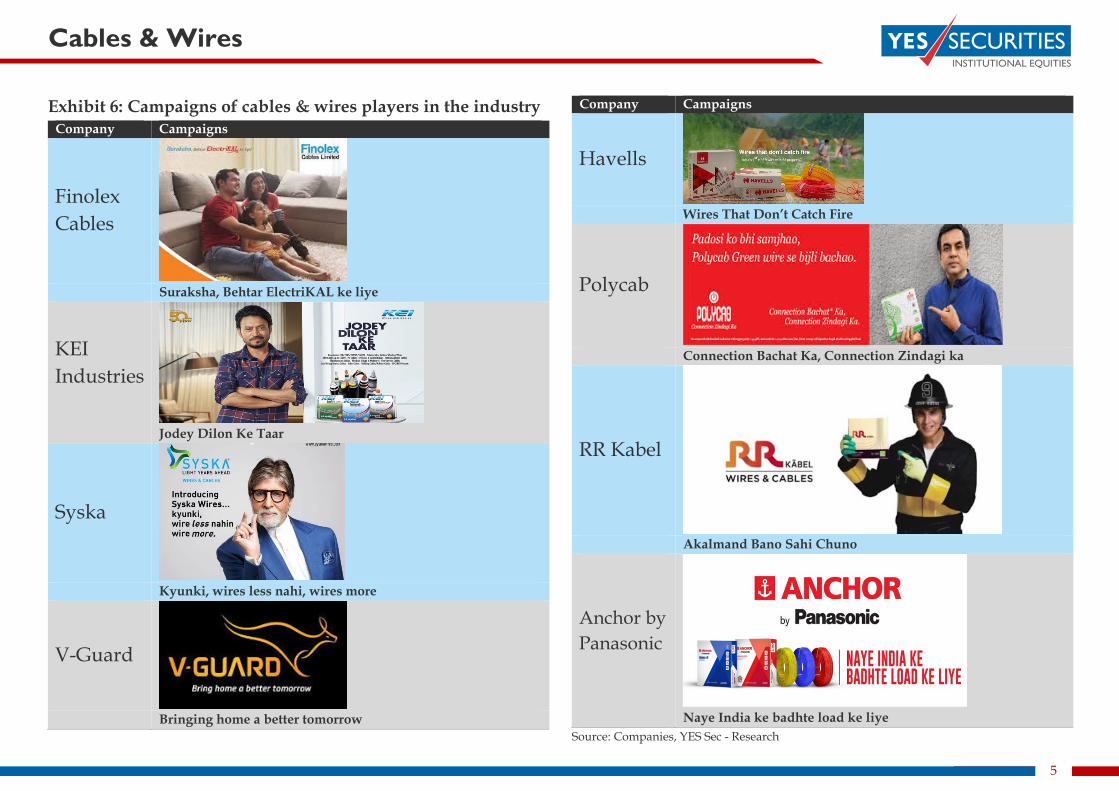
Exhibit 6: Campaigns of cables & wires players in the industry Company Campaigns
Finolex Cables
Suraksha, Behtar ElectriKAL ke liye
KEI Industries
Jodey Dilon Ke Taar
Syska
Kyunki, wires less nahi, wires more
V-Guard
Bringing home a better tomorrow
Company Campaigns
Havells
Wires That Don’t Catch Fire
Polycab
Connection Bachat Ka, Connection Zindagi ka
RR Kabel
Akalmand Bano Sahi Chuno
Anchor by Panasonic
Naye India ke badhte load ke liye
Source: Companies, YES Sec - Research
Cables & Wires
6
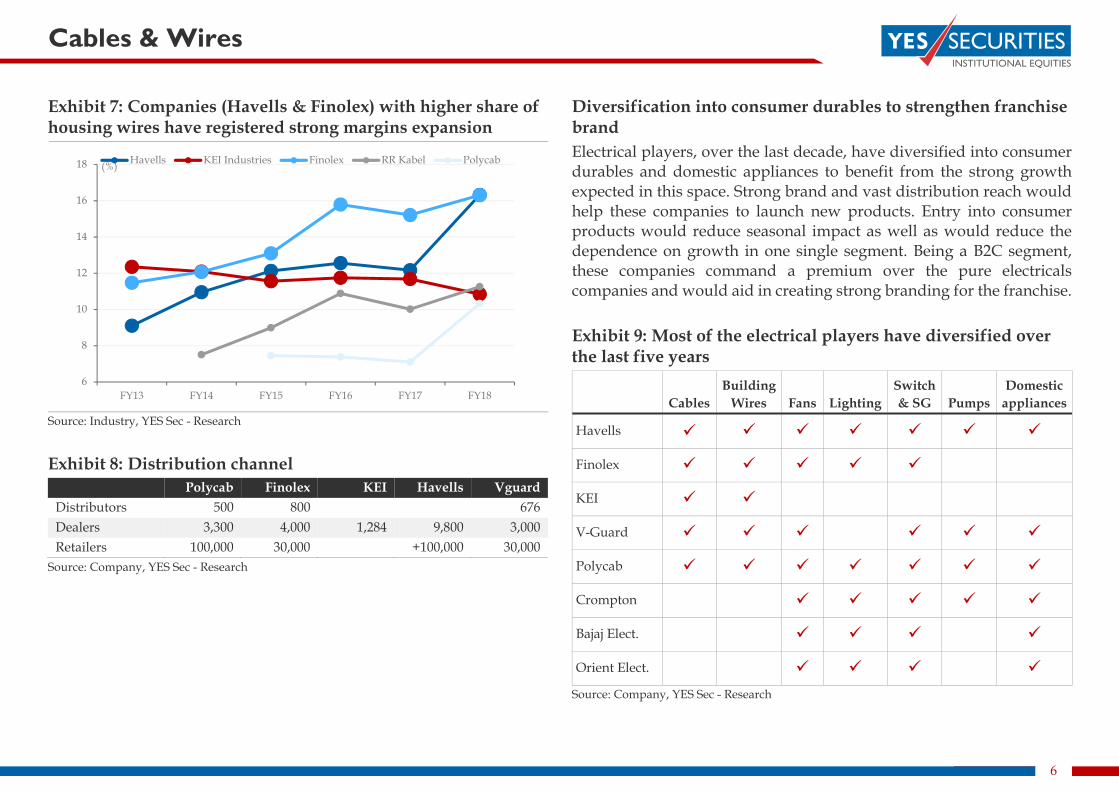
Exhibit 7: Companies (Havells & Finolex) with higher share of housing wires have registered strong margins expansion
Source: Industry, YES Sec - Research Exhibit 8: Distribution channel
Polycab Finolex KEI Havells Vguard Distributors 500 800 676 Dealers 3,300 4,000 1,284 9,800 3,000 Retailers 100,000 30,000 +100,000 30,000
Source: Company, YES Sec - Research
Diversification into consumer durables to strengthen franchise brand Electrical players, over the last decade, have diversified into consumer durables and domestic appliances to benefit from the strong growth expected in this space. Strong brand and vast distribution reach would help these companies to launch new products. Entry into consumer products would reduce seasonal impact as well as would reduce the dependence on growth in one single segment. Being a B2C segment, these companies command a premium over the pure electricals companies and would aid in creating strong branding for the franchise. Exhibit 9: Most of the electrical players have diversified over the last five years
Cables Building
Wires Fans Lighting Switch & SG Pumps
Domestic appliances
Havells
Finolex
KEI
V-Guard
Polycab
Crompton
Bajaj Elect.
Orient Elect.
Source: Company, YES Sec - Research
6
8
10
12
14
16
18
FY13 FY14 FY15 FY16 FY17 FY18
(%) Havells KEI Industries Finolex RR Kabel Polycab
Cables & Wires
7
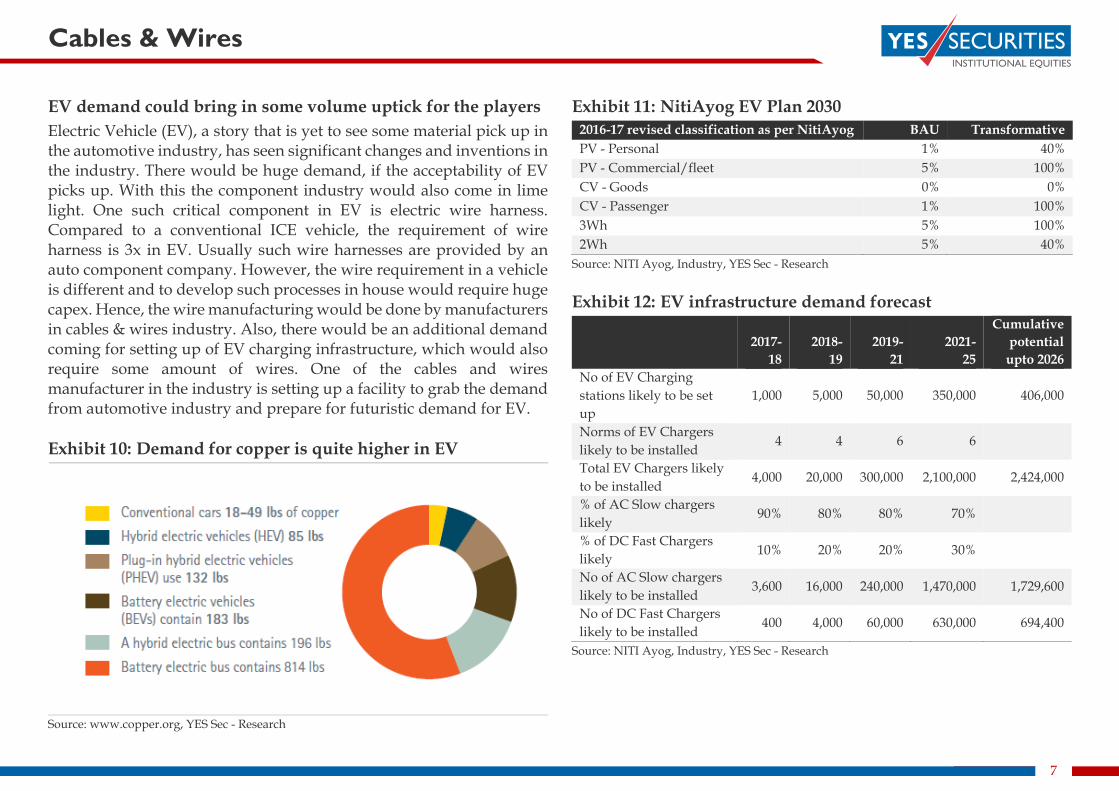
EV demand could bring in some volume uptick for the players Electric Vehicle (EV), a story that is yet to see some material pick up in the automotive industry, has seen significant changes and inventions in the industry. There would be huge demand, if the acceptability of EV picks up. With this the component industry would also come in lime light. One such critical component in EV is electric wire harness. Compared to a conventional ICE vehicle, the requirement of wire harness is 3x in EV. Usually such wire harnesses are provided by an auto component company. However, the wire requirement in a vehicle is different and to develop such processes in house would require huge capex. Hence, the wire manufacturing would be done by manufacturers in cables & wires industry. Also, there would be an additional demand coming for setting up of EV charging infrastructure, which would also require some amount of wires. One of the cables and wires manufacturer in the industry is setting up a facility to grab the demand from automotive industry and prepare for futuristic demand for EV. Exhibit 10: Demand for copper is quite higher in EV
Source: www.copper.org, YES Sec - Research
Exhibit 11: NitiAyog EV Plan 2030 2016-17 revised classification as per NitiAyog BAU Transformative PV - Personal 1% 40% PV - Commercial/fleet 5% 100% CV - Goods 0% 0% CV - Passenger 1% 100% 3Wh 5% 100% 2Wh 5% 40%
Source: NITI Ayog, Industry, YES Sec - Research Exhibit 12: EV infrastructure demand forecast
2017-18
2018- 19
2019- 21
2021- 25
Cumulative potential
upto 2026 No of EV Charging stations likely to be set up
1,000 5,000 50,000 350,000 406,000
Norms of EV Chargers likely to be installed
4 4 6 6
Total EV Chargers likely to be installed
4,000 20,000 300,000 2,100,000 2,424,000
% of AC Slow chargers likely
90% 80% 80% 70%
% of DC Fast Chargers likely
10% 20% 20% 30%
No of AC Slow chargers likely to be installed
3,600 16,000 240,000 1,470,000 1,729,600
No of DC Fast Chargers likely to be installed
400 4,000 60,000 630,000 694,400
Source: NITI Ayog, Industry, YES Sec - Research
Cables & Wires
8
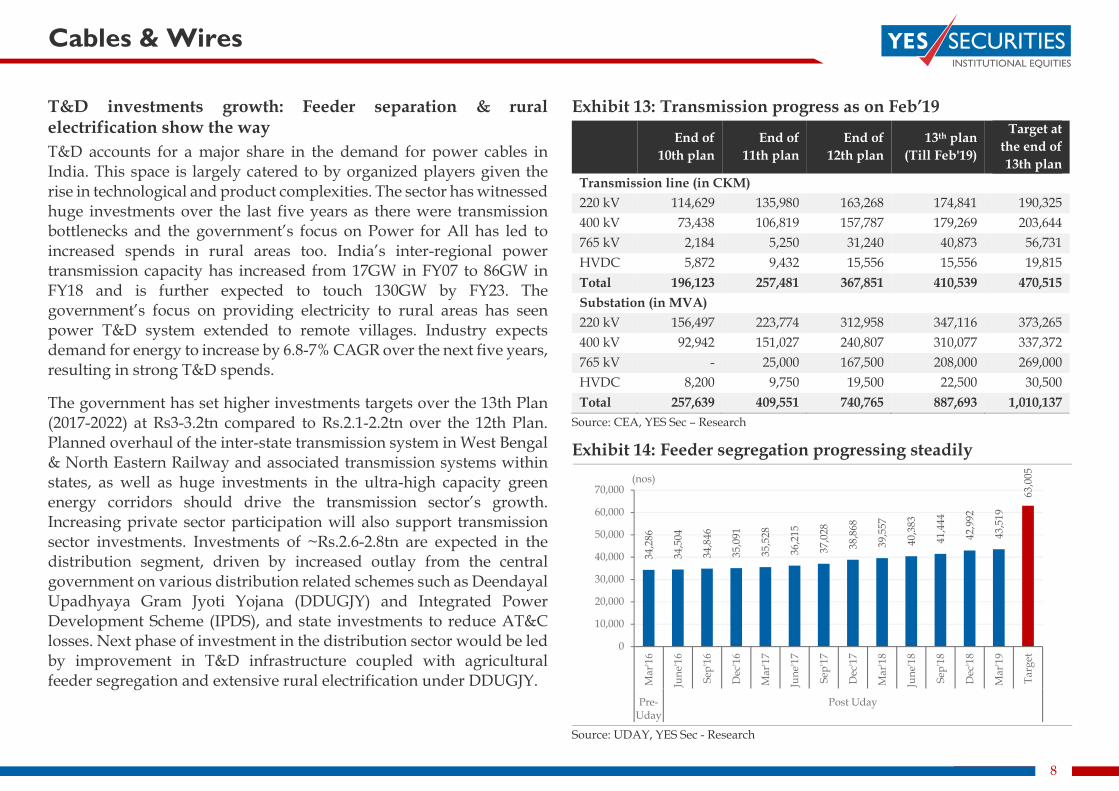
T&D investments growth: Feeder separation & rural electrification show the way T&D accounts for a major share in the demand for power cables in India. This space is largely catered to by organized players given the rise in technological and product complexities. The sector has witnessed huge investments over the last five years as there were transmission bottlenecks and the government’s focus on Power for All has led to increased spends in rural areas too. India’s inter-regional power transmission capacity has increased from 17GW in FY07 to 86GW in FY18 and is further expected to touch 130GW by FY23. The government’s focus on providing electricity to rural areas has seen power T&D system extended to remote villages. Industry expects demand for energy to increase by 6.8-7% CAGR over the next five years, resulting in strong T&D spends.
The government has set higher investments targets over the 13th Plan (2017-2022) at Rs3-3.2tn compared to Rs.2.1-2.2tn over the 12th Plan. Planned overhaul of the inter-state transmission system in West Bengal & North Eastern Railway and associated transmission systems within states, as well as huge investments in the ultra-high capacity green energy corridors should drive the transmission sector’s growth. Increasing private sector participation will also support transmission sector investments. Investments of ~Rs.2.6-2.8tn are expected in the distribution segment, driven by increased outlay from the central government on various distribution related schemes such as Deendayal Upadhyaya Gram Jyoti Yojana (DDUGJY) and Integrated Power Development Scheme (IPDS), and state investments to reduce AT&C losses. Next phase of investment in the distribution sector would be led by improvement in T&D infrastructure coupled with agricultural feeder segregation and extensive rural electrification under DDUGJY.
Exhibit 13: Transmission progress as on Feb’19
End of 10th plan
End of 11th plan
End of 12th plan
13th plan (Till Feb'19)
Target at the end of 13th plan
Transmission line (in CKM) 220 kV 114,629 135,980 163,268 174,841 190,325 400 kV 73,438 106,819 157,787 179,269 203,644 765 kV 2,184 5,250 31,240 40,873 56,731 HVDC 5,872 9,432 15,556 15,556 19,815 Total 196,123 257,481 367,851 410,539 470,515 Substation (in MVA) 220 kV 156,497 223,774 312,958 347,116 373,265 400 kV 92,942 151,027 240,807 310,077 337,372 765 kV - 25,000 167,500 208,000 269,000 HVDC 8,200 9,750 19,500 22,500 30,500 Total 257,639 409,551 740,765 887,693 1,010,137
Source: CEA, YES Sec – Research
Exhibit 14: Feeder segregation progressing steadily
Source: UDAY, YES Sec - Research
34,2
86
34,5
04
34,8
46
35,0
91
35,5
28
36,2
15
37,0
28
38,8
68
39,5
57
40,3
83
41,4
44
42,9
92
43,5
19
63,0
05
0
10,000
20,000
30,000
40,000
50,000
60,000
70,000
Mar
'16
June
'16
Sep'
16
Dec
'16
Mar
'17
June
'17
Sep'
17
Dec
'17
Mar
'18
June
'18
Sep'
18
Dec
'18
Mar
'19
Targ
et
Pre-Uday
Post Uday
(nos)
Cables & Wires
9
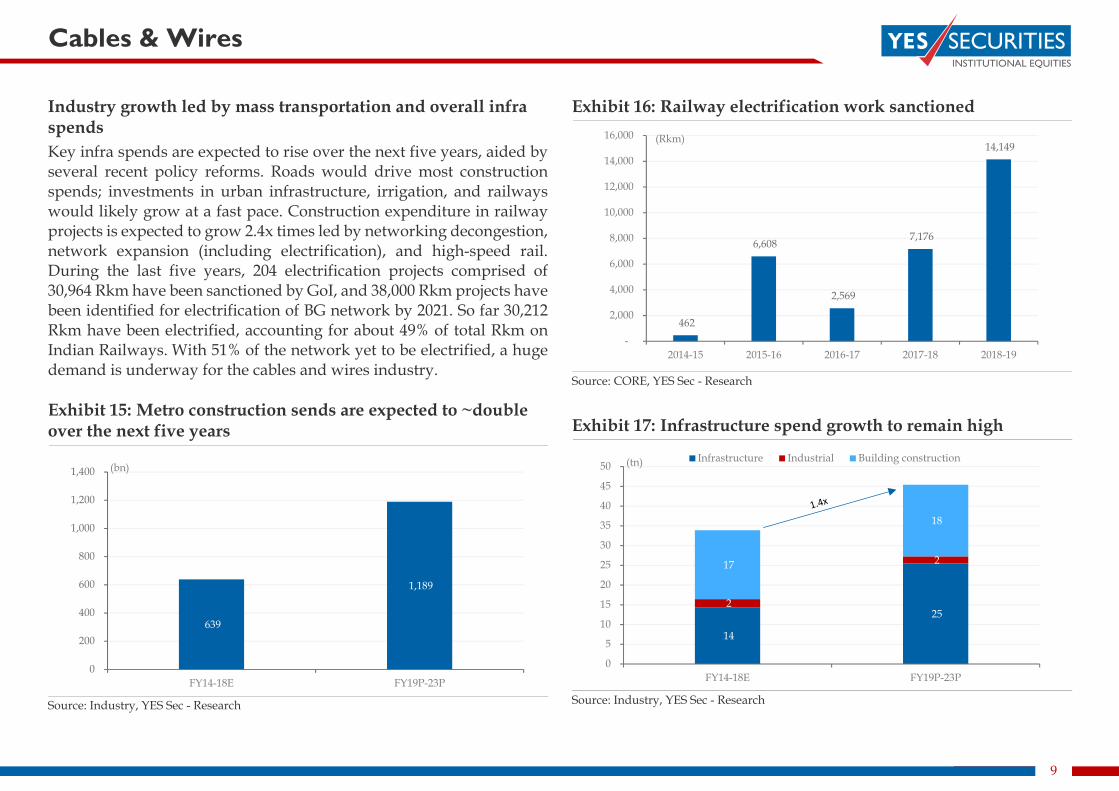
Industry growth led by mass transportation and overall infra spends Key infra spends are expected to rise over the next five years, aided by several recent policy reforms. Roads would drive most construction spends; investments in urban infrastructure, irrigation, and railways would likely grow at a fast pace. Construction expenditure in railway projects is expected to grow 2.4x times led by networking decongestion, network expansion (including electrification), and high-speed rail. During the last five years, 204 electrification projects comprised of 30,964 Rkm have been sanctioned by GoI, and 38,000 Rkm projects have been identified for electrification of BG network by 2021. So far 30,212 Rkm have been electrified, accounting for about 49% of total Rkm on Indian Railways. With 51% of the network yet to be electrified, a huge demand is underway for the cables and wires industry. Exhibit 15: Metro construction sends are expected to ~double over the next five years
Source: Industry, YES Sec - Research
Exhibit 16: Railway electrification work sanctioned
Source: CORE, YES Sec - Research
Exhibit 17: Infrastructure spend growth to remain high
Source: Industry, YES Sec - Research
639
1,189
0
200
400
600
800
1,000
1,200
1,400
FY14-18E FY19P-23P
(bn)
462
6,608
2,569
7,176
14,149
-
2,000
4,000
6,000
8,000
10,000
12,000
14,000
16,000
2014-15 2015-16 2016-17 2017-18 2018-19
(Rkm)
14
25 2
2 17
18
0
5
10
15
20
25
30
35
40
45
50
FY14-18E FY19P-23P
(tn) Infrastructure Industrial Building construction
Cables & Wires
10
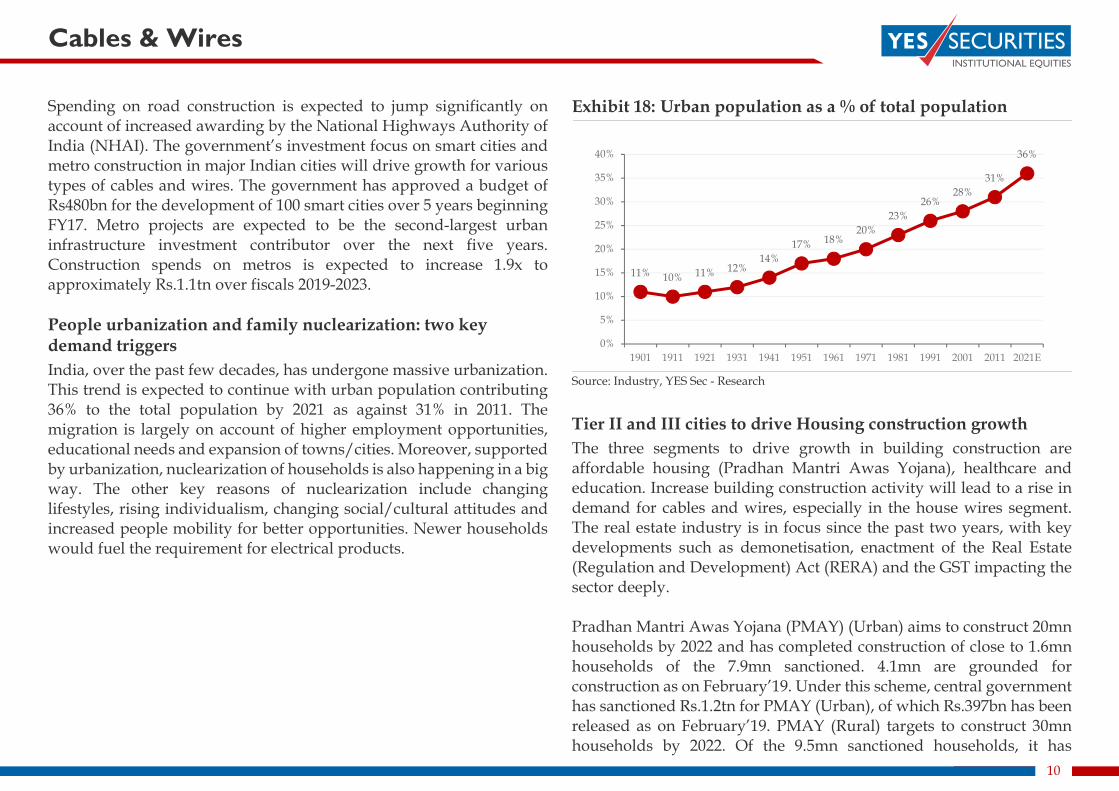
Spending on road construction is expected to jump significantly on account of increased awarding by the National Highways Authority of India (NHAI). The government’s investment focus on smart cities and metro construction in major Indian cities will drive growth for various types of cables and wires. The government has approved a budget of Rs480bn for the development of 100 smart cities over 5 years beginning FY17. Metro projects are expected to be the second-largest urban infrastructure investment contributor over the next five years. Construction spends on metros is expected to increase 1.9x to approximately Rs.1.1tn over fiscals 2019-2023. People urbanization and family nuclearization: two key demand triggers India, over the past few decades, has undergone massive urbanization. This trend is expected to continue with urban population contributing 36% to the total population by 2021 as against 31% in 2011. The migration is largely on account of higher employment opportunities, educational needs and expansion of towns/cities. Moreover, supported by urbanization, nuclearization of households is also happening in a big way. The other key reasons of nuclearization include changing lifestyles, rising individualism, changing social/cultural attitudes and increased people mobility for better opportunities. Newer households would fuel the requirement for electrical products.
Exhibit 18: Urban population as a % of total population
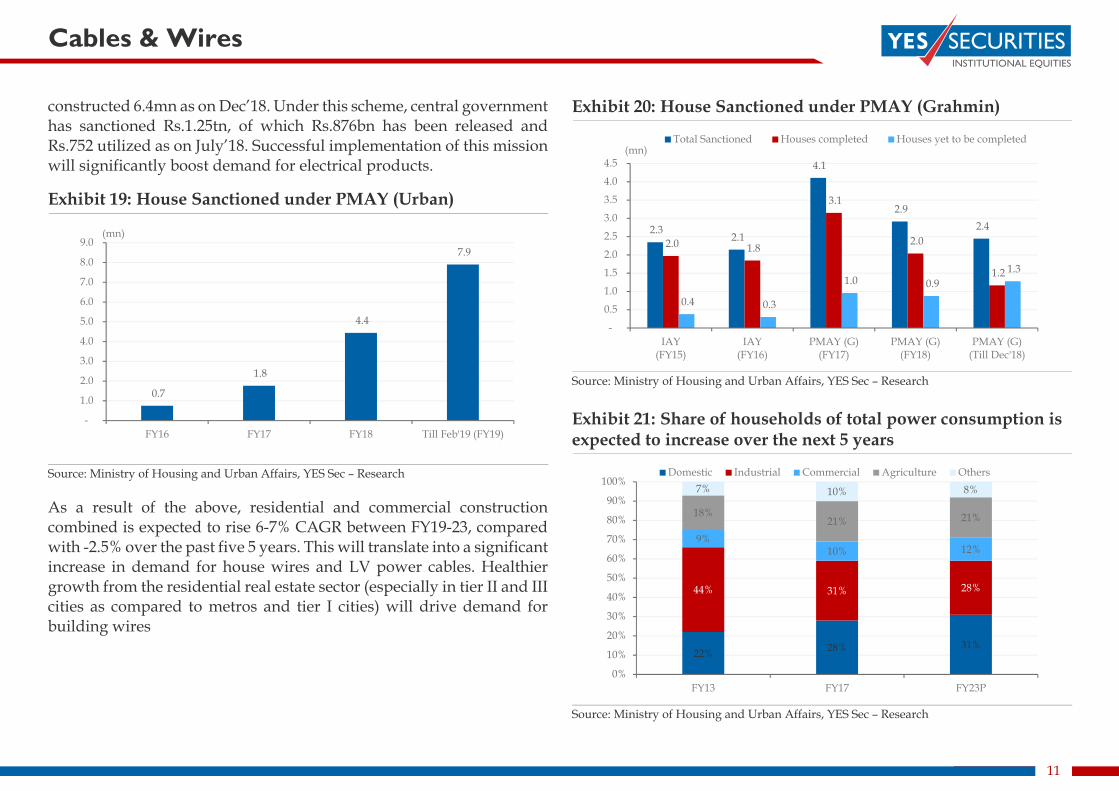
Source: Industry, YES Sec - Research Tier II and III cities to drive Housing construction growth The three segments to drive growth in building construction are affordable housing (Pradhan Mantri Awas Yojana), healthcare and education. Increase building construction activity will lead to a rise in demand for cables and wires, especially in the house wires segment. The real estate industry is in focus since the past two years, with key developments such as demonetisation, enactment of the Real Estate (Regulation and Development) Act (RERA) and the GST impacting the sector deeply. Pradhan Mantri Awas Yojana (PMAY) (Urban) aims to construct 20mn households by 2022 and has completed construction of close to 1.6mn households of the 7.9mn sanctioned. 4.1mn are grounded for construction as on February’19. Under this scheme, central government has sanctioned Rs.1.2tn for PMAY (Urban), of which Rs.397bn has been released as on February’19. PMAY (Rural) targets to construct 30mn households by 2022. Of the 9.5mn sanctioned households, it has
11% 10% 11% 12%14%
17% 18%20%
23%26%
28%31%
36%
0%
5%
10%
15%
20%
25%
30%
35%
40%
1901 1911 1921 1931 1941 1951 1961 1971 1981 1991 2001 2011 2021E
Cables & Wires
11
constructed 6.4mn as on Dec’18. Under this scheme, central government has sanctioned Rs.1.25tn, of which Rs.876bn has been released and Rs.752 utilized as on July’18. Successful implementation of this mission will significantly boost demand for electrical products.
Exhibit 19: House Sanctioned under PMAY (Urban)
Source: Ministry of Housing and Urban Affairs, YES Sec – Research As a result of the above, residential and commercial construction combined is expected to rise 6-7% CAGR between FY19-23, compared with -2.5% over the past five 5 years. This will translate into a significant increase in demand for house wires and LV power cables. Healthier growth from the residential real estate sector (especially in tier II and III cities as compared to metros and tier I cities) will drive demand for building wires
Exhibit 20: House Sanctioned under PMAY (Grahmin)
Source: Ministry of Housing and Urban Affairs, YES Sec – Research Exhibit 21: Share of households of total power consumption is expected to increase over the next 5 years
Source: Ministry of Housing and Urban Affairs, YES Sec – Research
0.7
1.8
4.4
7.9
-
1.0
2.0
3.0
4.0
5.0
6.0
7.0
8.0
9.0
FY16 FY17 FY18 Till Feb'19 (FY19)
(mn) 2.3 2.1
4.1
2.9 2.4
2.0 1.8
3.1
2.0
1.2
0.4 0.3
1.0 0.9 1.3
-
0.5
1.0
1.5
2.0
2.5
3.0
3.5
4.0
4.5
IAY(FY15)
IAY(FY16)
PMAY (G)(FY17)
PMAY (G)(FY18)
PMAY (G)(Till Dec'18)
(mn)Total Sanctioned Houses completed Houses yet to be completed
22% 28% 31%
44% 31% 28%
9%10% 12%
18%21% 21%
7% 10% 8%
0%
10%
20%
30%
40%
50%
60%
70%
80%
90%
100%
FY13 FY17 FY23P
Domestic Industrial Commercial Agriculture Others
Cables & Wires
12
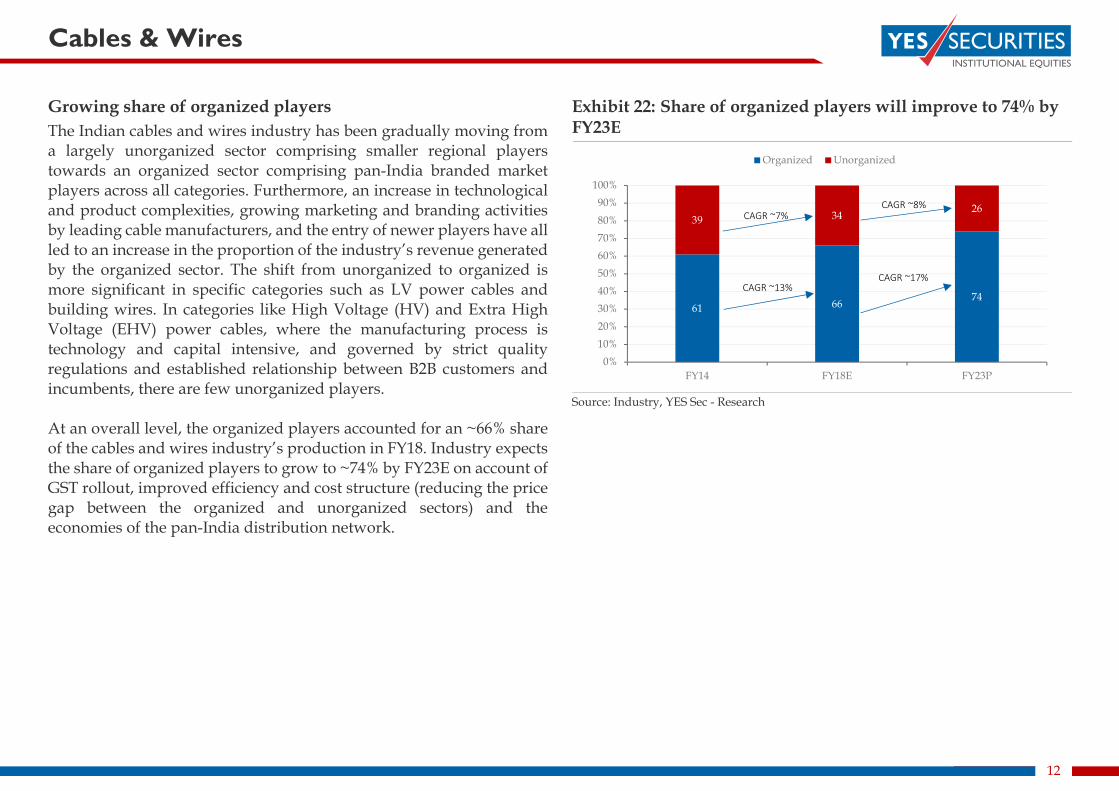
Growing share of organized players The Indian cables and wires industry has been gradually moving from a largely unorganized sector comprising smaller regional players towards an organized sector comprising pan-India branded market players across all categories. Furthermore, an increase in technological and product complexities, growing marketing and branding activities by leading cable manufacturers, and the entry of newer players have all led to an increase in the proportion of the industry’s revenue generated by the organized sector. The shift from unorganized to organized is more significant in specific categories such as LV power cables and building wires. In categories like High Voltage (HV) and Extra High Voltage (EHV) power cables, where the manufacturing process is technology and capital intensive, and governed by strict quality regulations and established relationship between B2B customers and incumbents, there are few unorganized players. At an overall level, the organized players accounted for an ~66% share of the cables and wires industry’s production in FY18. Industry expects the share of organized players to grow to ~74% by FY23E on account of GST rollout, improved efficiency and cost structure (reducing the price gap between the organized and unorganized sectors) and the economies of the pan-India distribution network.
Exhibit 22: Share of organized players will improve to 74% by FY23E
Source: Industry, YES Sec - Research
61 66 74
39 34 26
0%10%20%30%40%50%60%70%80%90%
100%
FY14 FY18E FY23P
Organized Unorganized
CAGR ~13%
CAGR ~7%CAGR ~8%
CAGR ~17%
COMPANY SECTION

Research Analyst: Tarang Bhanushali [email protected] | Rahul Jain [email protected] Head of Research: Amar Ambani [email protected] (For important information about YES SECURITIES (INDIA) LTD. and other disclosures, refer to the end of this material.)
KEI Industries Ltd - BUY Retail penetration to drive growth
COMPANY REPORT
April 09, 2019
CMP (Rs) (As on Apr 08, 2019) 408 Sector: Consumer Electricals
12‐mts Target (Rs) 558 Market cap (Rs mn) 31,971
Upside 36.7% Enterprise value (Rs mn) 39,609
Exhibit 23: Financial summary Y/e 31 Mar (Rs m) FY17 FY18 FY19E FY20E FY21E Revenue 26,281 34,650 41,311 49,740 56,892 yoy growth (%) 11.8 31.8 19.2 20.4 14.4 Operating profit 2,687 3,388 4,317 5,205 6,037 OPM (%) 10.2 9.8 10.4 10.5 10.6 Reported PAT 937 1,443 1,822 2,345 2,914 yoy growth (%) 49.8 54.1 26.3 28.7 24.3 EPS (Rs) 12.0 18.4 23.3 29.9 37.2 P/E (x) 33.9 22.2 17.5 13.6 11.0 EV/EBITDA (x) 14.5 11.7 9.2 7.8 6.6 Debt/Equity (x) 1.6 1.4 1.1 0.9 0.6 RoE (%) 22.6 27.1 26.4 26.6 25.9 RoCE (%) 24.1 23.8 26.1 27.9 28.9
Source: Company, YES Sec - Research
KEI has emerged as the fastest growing cables and wires company inthe listed space over the past five years. Strong demand from thepower distribution sector and increasing share of housing wires haspropelled KEI’s growth. Increasing reach in the domestic market andimproving brand visibility via various media spends, has led to thecompany doubling its revenue through dealer network over FY14-18to Rs.9.8bn (28.2% of revenue). The company has also managed todouble its institutional sales on the back of strong demand frominfrastructure & power distribution sector and KEI’s comprehensiverange in its cables portfolio. On the back of capacity expansion,execution of orders in EHV & EPC and strong demand from powerdistribution sector, we expect KEI to witness 18% revenue CAGRover FY18-21. Increase in share of higher margin segments (470bps)would lead to an expansion of 83bps in operating margin over FY18-21. We believe the company would continue to witness some reratingas it is expected to report 26.4% PAT CAGR over FY18-21, RoE wouldstay +25% and D/E would trend lower to 0.6x. We initiate with a Buyrating for a target price of Rs.558 (15x FY21E P/E).
Housing wires to propel growth In 9M FY19, sales through dealer network grew ~50% on a yoy basisand increased its revenue share to 33.4% from 26% in FY14. Since thissegment is largely B2C, margins are higher by 100-150bps and workingcapital requirement is lower compared to institutional business. OverFY13-19, KEI has more than doubled its dealers to 1,400 and hasincreased its advertisement spends 10x. Higher sales through channelfinancing will reduce working capital requirements. We expect dealerbusiness revenue to more than double over FY18-21 to Rs.20bn led bygrowing reach and focused spends on advertisements.
Re-rating to continue; Initiate with Buy KEI has witnessed valuation re-rating on the back of strong earningsgrowth, while keeping leverage under check and improving RoE sharply from 11% in FY15 to 27.1% in FY18. We believe the companywould continue to witness valuation re-rating as earnings growthremains robust on a large base, D/E declines and RoE would stay +25%levels.
KEI Industries Ltd
14
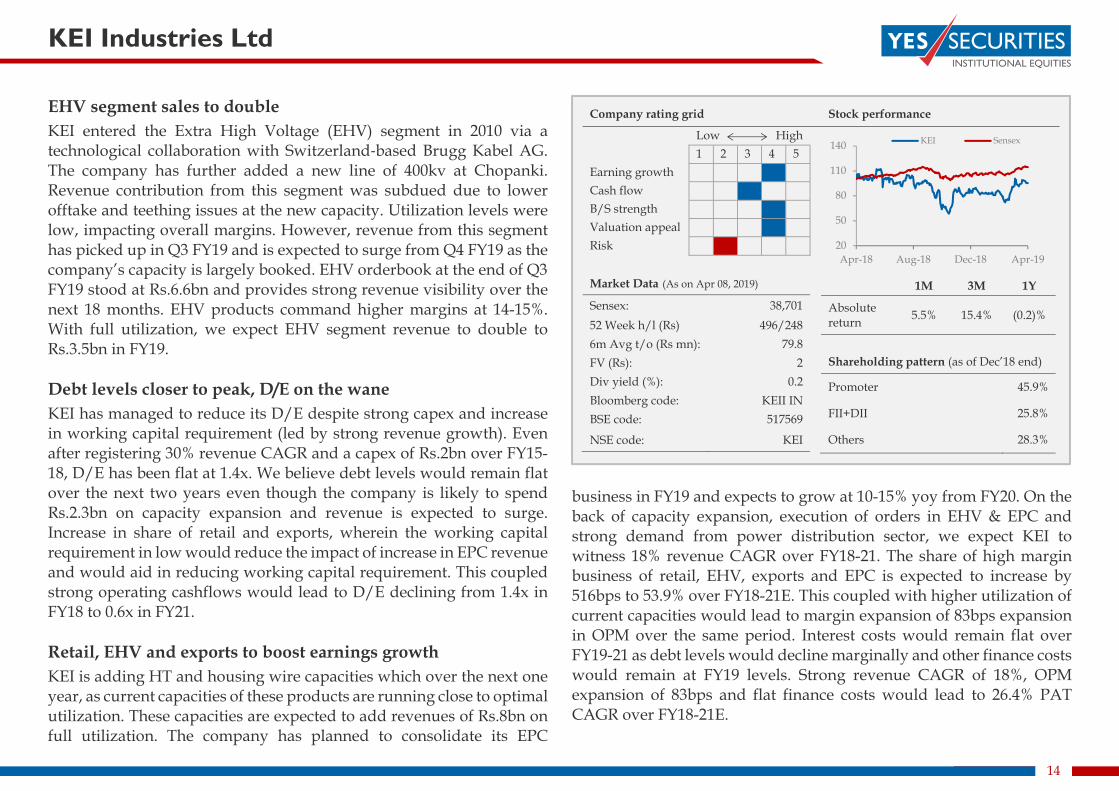
EHV segment sales to double KEI entered the Extra High Voltage (EHV) segment in 2010 via a technological collaboration with Switzerland‐based Brugg Kabel AG. The company has further added a new line of 400kv at Chopanki. Revenue contribution from this segment was subdued due to lower offtake and teething issues at the new capacity. Utilization levels were low, impacting overall margins. However, revenue from this segment has picked up in Q3 FY19 and is expected to surge from Q4 FY19 as the company’s capacity is largely booked. EHV orderbook at the end of Q3 FY19 stood at Rs.6.6bn and provides strong revenue visibility over the next 18 months. EHV products command higher margins at 14-15%. With full utilization, we expect EHV segment revenue to double to Rs.3.5bn in FY19. Debt levels closer to peak, D/E on the wane KEI has managed to reduce its D/E despite strong capex and increase in working capital requirement (led by strong revenue growth). Even after registering 30% revenue CAGR and a capex of Rs.2bn over FY15-18, D/E has been flat at 1.4x. We believe debt levels would remain flat over the next two years even though the company is likely to spend Rs.2.3bn on capacity expansion and revenue is expected to surge. Increase in share of retail and exports, wherein the working capital requirement in low would reduce the impact of increase in EPC revenue and would aid in reducing working capital requirement. This coupled strong operating cashflows would lead to D/E declining from 1.4x in FY18 to 0.6x in FY21. Retail, EHV and exports to boost earnings growth KEI is adding HT and housing wire capacities which over the next one year, as current capacities of these products are running close to optimal utilization. These capacities are expected to add revenues of Rs.8bn on full utilization. The company has planned to consolidate its EPC
business in FY19 and expects to grow at 10-15% yoy from FY20. On the back of capacity expansion, execution of orders in EHV & EPC and strong demand from power distribution sector, we expect KEI to witness 18% revenue CAGR over FY18-21. The share of high margin business of retail, EHV, exports and EPC is expected to increase by 516bps to 53.9% over FY18-21E. This coupled with higher utilization of current capacities would lead to margin expansion of 83bps expansion in OPM over the same period. Interest costs would remain flat over FY19-21 as debt levels would decline marginally and other finance costs would remain at FY19 levels. Strong revenue CAGR of 18%, OPM expansion of 83bps and flat finance costs would lead to 26.4% PAT CAGR over FY18-21E.
Company rating grid Stock performance Low High 1 2 3 4 5 Earning growth Cash flow B/S strength Valuation appeal Risk
Market Data (As on Apr 08, 2019) 1M 3M 1Y
Absolute return 5.5% 15.4% (0.2)%
Shareholding pattern (as of Dec’18 end)
Promoter 45.9%
FII+DII 25.8%
Others 28.3%
Sensex: 38,701 52 Week h/l (Rs) 496/248 6m Avg t/o (Rs mn): 79.8 FV (Rs): 2 Div yield (%): 0.2 Bloomberg code: KEII IN BSE code: 517569 NSE code: KEI
20
50
80
110
140
Apr-18 Aug-18 Dec-18 Apr-19
KEI Sensex
KEI Industries Ltd
15
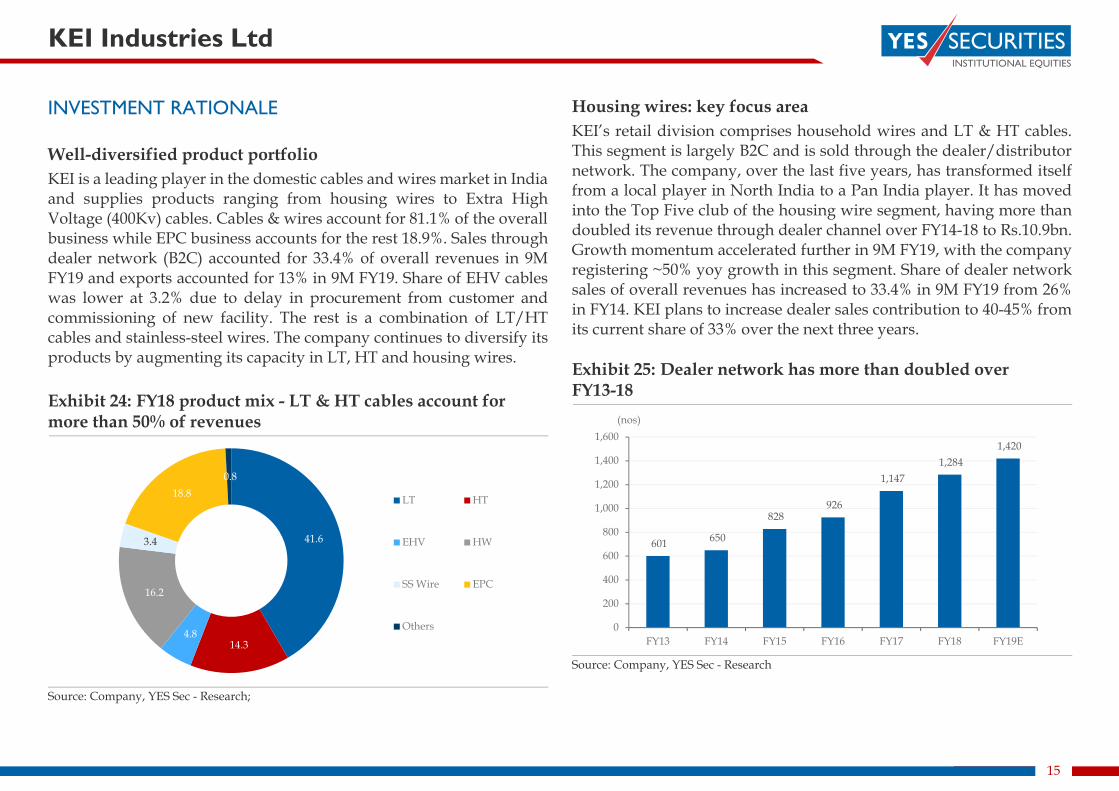
INVESTMENT RATIONALE Well-diversified product portfolio KEI is a leading player in the domestic cables and wires market in India and supplies products ranging from housing wires to Extra High Voltage (400Kv) cables. Cables & wires account for 81.1% of the overall business while EPC business accounts for the rest 18.9%. Sales through dealer network (B2C) accounted for 33.4% of overall revenues in 9M FY19 and exports accounted for 13% in 9M FY19. Share of EHV cables was lower at 3.2% due to delay in procurement from customer and commissioning of new facility. The rest is a combination of LT/HT cables and stainless-steel wires. The company continues to diversify its products by augmenting its capacity in LT, HT and housing wires. Exhibit 24: FY18 product mix - LT & HT cables account for more than 50% of revenues
Source: Company, YES Sec - Research;
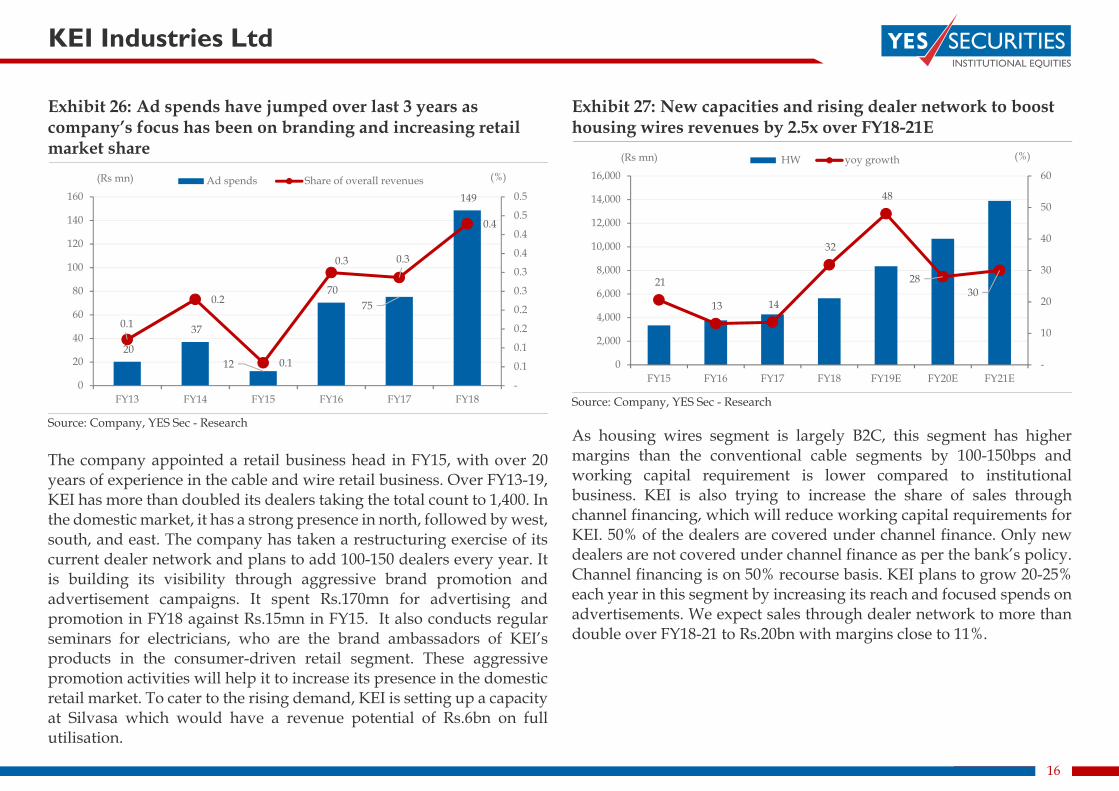
Housing wires: key focus area KEI’s retail division comprises household wires and LT & HT cables. This segment is largely B2C and is sold through the dealer/distributor network. The company, over the last five years, has transformed itself from a local player in North India to a Pan India player. It has moved into the Top Five club of the housing wire segment, having more than doubled its revenue through dealer channel over FY14-18 to Rs.10.9bn. Growth momentum accelerated further in 9M FY19, with the company registering ~50% yoy growth in this segment. Share of dealer network sales of overall revenues has increased to 33.4% in 9M FY19 from 26% in FY14. KEI plans to increase dealer sales contribution to 40-45% from its current share of 33% over the next three years. Exhibit 25: Dealer network has more than doubled over FY13-18
Source: Company, YES Sec - Research
41.6
14.3 4.8
16.2
3.4
18.8 0.8
LT HT
EHV HW
SS Wire EPC
Others
601 650
828 926
1,147 1,284
1,420
0
200
400
600
800
1,000
1,200
1,400
1,600
FY13 FY14 FY15 FY16 FY17 FY18 FY19E
(nos)
KEI Industries Ltd
16
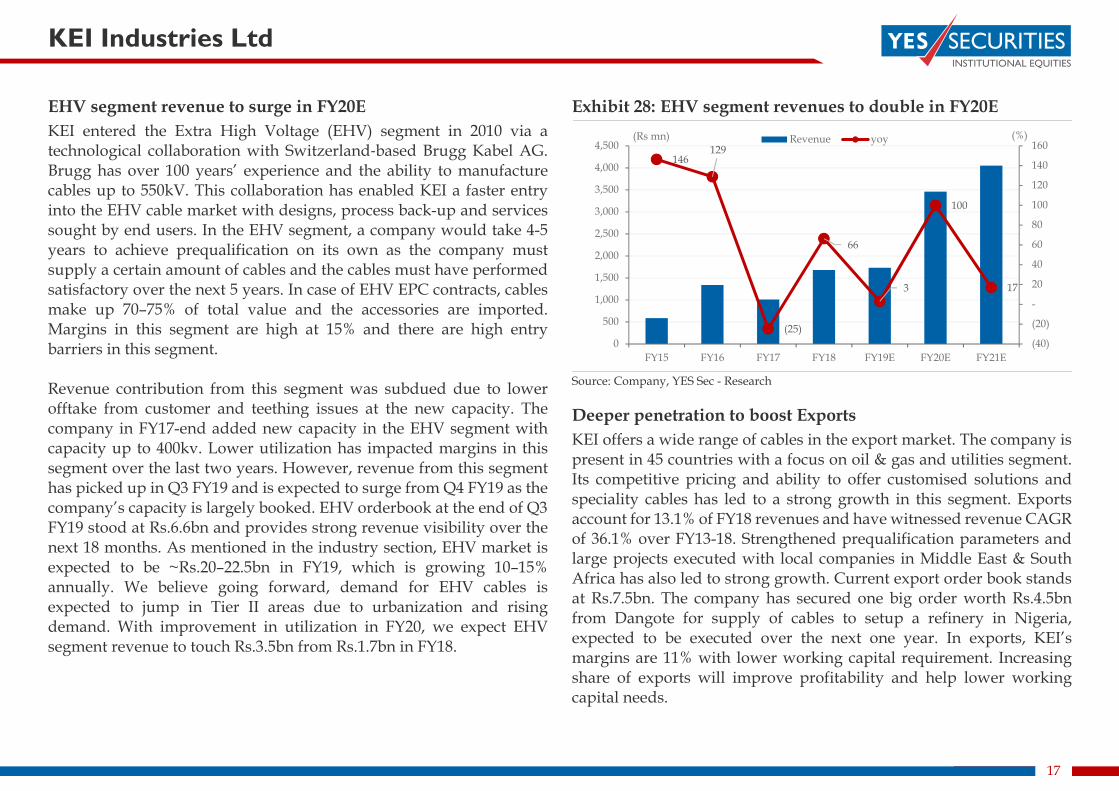
Exhibit 26: Ad spends have jumped over last 3 years as company’s focus has been on branding and increasing retail market share
Source: Company, YES Sec - Research The company appointed a retail business head in FY15, with over 20 years of experience in the cable and wire retail business. Over FY13-19, KEI has more than doubled its dealers taking the total count to 1,400. In the domestic market, it has a strong presence in north, followed by west, south, and east. The company has taken a restructuring exercise of its current dealer network and plans to add 100-150 dealers every year. It is building its visibility through aggressive brand promotion and advertisement campaigns. It spent Rs.170mn for advertising and promotion in FY18 against Rs.15mn in FY15. It also conducts regular seminars for electricians, who are the brand ambassadors of KEI’s products in the consumer-driven retail segment. These aggressive promotion activities will help it to increase its presence in the domestic retail market. To cater to the rising demand, KEI is setting up a capacity at Silvasa which would have a revenue potential of Rs.6bn on full utilisation.
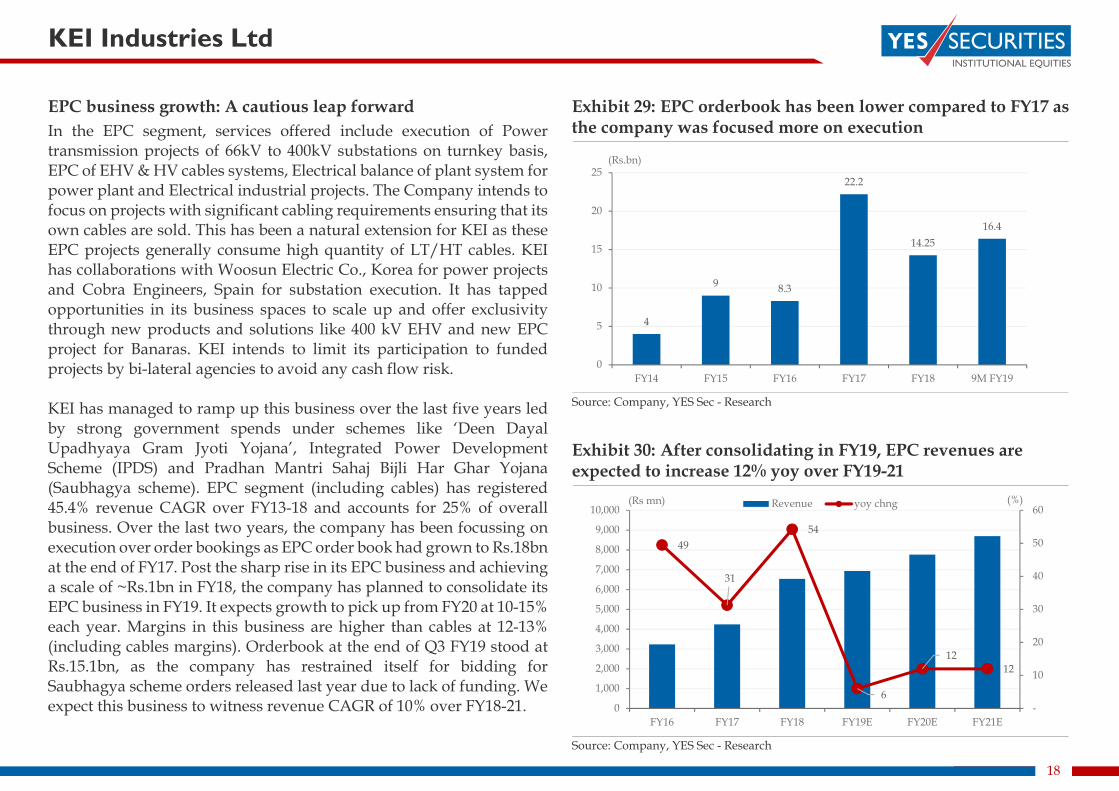
Exhibit 27: New capacities and rising dealer network to boost housing wires revenues by 2.5x over FY18-21E
Source: Company, YES Sec - Research As housing wires segment is largely B2C, this segment has higher margins than the conventional cable segments by 100-150bps and working capital requirement is lower compared to institutional business. KEI is also trying to increase the share of sales through channel financing, which will reduce working capital requirements for KEI. 50% of the dealers are covered under channel finance. Only new dealers are not covered under channel finance as per the bank’s policy. Channel financing is on 50% recourse basis. KEI plans to grow 20-25% each year in this segment by increasing its reach and focused spends on advertisements. We expect sales through dealer network to more than double over FY18-21 to Rs.20bn with margins close to 11%.
20
37
12
70 75
149
0.1
0.2
0.1
0.3 0.3
0.4
-
0.1
0.1
0.2
0.2
0.3
0.3
0.4
0.4
0.5
0.5
0
20
40
60
80
100
120
140
160
FY13 FY14 FY15 FY16 FY17 FY18
(%)(Rs mn) Ad spends Share of overall revenues
21
13 14
32
48
28 30
-
10
20
30
40
50
60
0
2,000
4,000
6,000
8,000
10,000
12,000
14,000
16,000
FY15 FY16 FY17 FY18 FY19E FY20E FY21E
(%)(Rs mn) HW yoy growth
KEI Industries Ltd
17
EHV segment revenue to surge in FY20E KEI entered the Extra High Voltage (EHV) segment in 2010 via a technological collaboration with Switzerland‐based Brugg Kabel AG. Brugg has over 100 years’ experience and the ability to manufacture cables up to 550kV. This collaboration has enabled KEI a faster entry into the EHV cable market with designs, process back-up and services sought by end users. In the EHV segment, a company would take 4-5 years to achieve prequalification on its own as the company must supply a certain amount of cables and the cables must have performed satisfactory over the next 5 years. In case of EHV EPC contracts, cables make up 70–75% of total value and the accessories are imported. Margins in this segment are high at 15% and there are high entry barriers in this segment. Revenue contribution from this segment was subdued due to lower offtake from customer and teething issues at the new capacity. The company in FY17-end added new capacity in the EHV segment with capacity up to 400kv. Lower utilization has impacted margins in this segment over the last two years. However, revenue from this segment has picked up in Q3 FY19 and is expected to surge from Q4 FY19 as the company’s capacity is largely booked. EHV orderbook at the end of Q3 FY19 stood at Rs.6.6bn and provides strong revenue visibility over the next 18 months. As mentioned in the industry section, EHV market is expected to be ~Rs.20–22.5bn in FY19, which is growing 10–15% annually. We believe going forward, demand for EHV cables is expected to jump in Tier II areas due to urbanization and rising demand. With improvement in utilization in FY20, we expect EHV segment revenue to touch Rs.3.5bn from Rs.1.7bn in FY18.
Exhibit 28: EHV segment revenues to double in FY20E
Source: Company, YES Sec - Research Deeper penetration to boost Exports KEI offers a wide range of cables in the export market. The company is present in 45 countries with a focus on oil & gas and utilities segment. Its competitive pricing and ability to offer customised solutions and speciality cables has led to a strong growth in this segment. Exports account for 13.1% of FY18 revenues and have witnessed revenue CAGR of 36.1% over FY13-18. Strengthened prequalification parameters and large projects executed with local companies in Middle East & South Africa has also led to strong growth. Current export order book stands at Rs.7.5bn. The company has secured one big order worth Rs.4.5bn from Dangote for supply of cables to setup a refinery in Nigeria, expected to be executed over the next one year. In exports, KEI’s margins are 11% with lower working capital requirement. Increasing share of exports will improve profitability and help lower working capital needs.
146 129
(25)
66
3
100
17
(40)
(20)
-
20
40
60
80
100
120
140
160
0
500
1,000
1,500
2,000
2,500
3,000
3,500
4,000
4,500
FY15 FY16 FY17 FY18 FY19E FY20E FY21E
(%)(Rs mn) Revenue yoy
KEI Industries Ltd
18
EPC business growth: A cautious leap forward In the EPC segment, services offered include execution of Power transmission projects of 66kV to 400kV substations on turnkey basis, EPC of EHV & HV cables systems, Electrical balance of plant system for power plant and Electrical industrial projects. The Company intends to focus on projects with significant cabling requirements ensuring that its own cables are sold. This has been a natural extension for KEI as these EPC projects generally consume high quantity of LT/HT cables. KEI has collaborations with Woosun Electric Co., Korea for power projects and Cobra Engineers, Spain for substation execution. It has tapped opportunities in its business spaces to scale up and offer exclusivity through new products and solutions like 400 kV EHV and new EPC project for Banaras. KEI intends to limit its participation to funded projects by bi-lateral agencies to avoid any cash flow risk. KEI has managed to ramp up this business over the last five years led by strong government spends under schemes like ‘Deen Dayal Upadhyaya Gram Jyoti Yojana’, Integrated Power Development Scheme (IPDS) and Pradhan Mantri Sahaj Bijli Har Ghar Yojana (Saubhagya scheme). EPC segment (including cables) has registered 45.4% revenue CAGR over FY13-18 and accounts for 25% of overall business. Over the last two years, the company has been focussing on execution over order bookings as EPC order book had grown to Rs.18bn at the end of FY17. Post the sharp rise in its EPC business and achieving a scale of ~Rs.1bn in FY18, the company has planned to consolidate its EPC business in FY19. It expects growth to pick up from FY20 at 10-15% each year. Margins in this business are higher than cables at 12-13% (including cables margins). Orderbook at the end of Q3 FY19 stood at Rs.15.1bn, as the company has restrained itself for bidding for Saubhagya scheme orders released last year due to lack of funding. We expect this business to witness revenue CAGR of 10% over FY18-21.
Exhibit 29: EPC orderbook has been lower compared to FY17 as the company was focused more on execution
Source: Company, YES Sec - Research
Exhibit 30: After consolidating in FY19, EPC revenues are expected to increase 12% yoy over FY19-21
Source: Company, YES Sec - Research
4
9 8.3
22.2
14.2516.4
0
5
10
15
20
25
FY14 FY15 FY16 FY17 FY18 9M FY19
(Rs.bn)
49
31
54
6
12 12
-
10
20
30
40
50
60
0
1,000
2,000
3,000
4,000
5,000
6,000
7,000
8,000
9,000
10,000
FY16 FY17 FY18 FY19E FY20E FY21E
(%)(Rs mn) Revenue yoy chng
KEI Industries Ltd
19
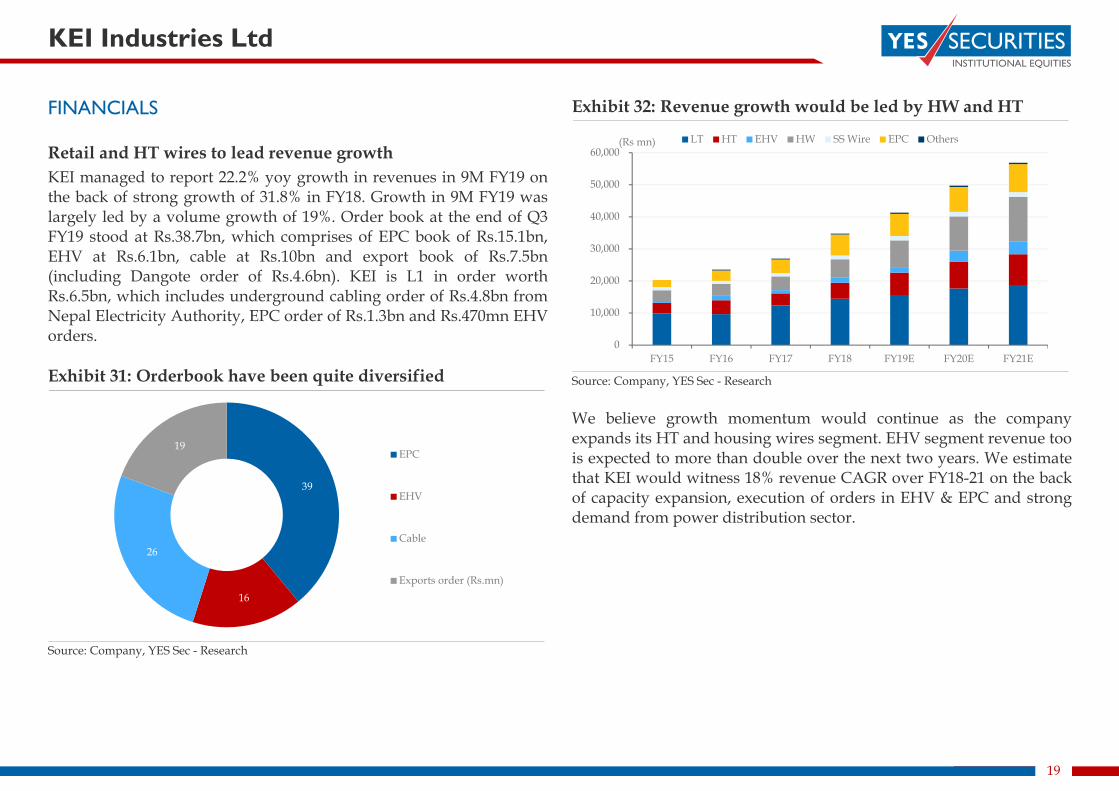
FINANCIALS Retail and HT wires to lead revenue growth KEI managed to report 22.2% yoy growth in revenues in 9M FY19 on the back of strong growth of 31.8% in FY18. Growth in 9M FY19 was largely led by a volume growth of 19%. Order book at the end of Q3 FY19 stood at Rs.38.7bn, which comprises of EPC book of Rs.15.1bn, EHV at Rs.6.1bn, cable at Rs.10bn and export book of Rs.7.5bn (including Dangote order of Rs.4.6bn). KEI is L1 in order worth Rs.6.5bn, which includes underground cabling order of Rs.4.8bn from Nepal Electricity Authority, EPC order of Rs.1.3bn and Rs.470mn EHV orders. Exhibit 31: Orderbook have been quite diversified
Source: Company, YES Sec - Research
Exhibit 32: Revenue growth would be led by HW and HT
Source: Company, YES Sec - Research We believe growth momentum would continue as the company expands its HT and housing wires segment. EHV segment revenue too is expected to more than double over the next two years. We estimate that KEI would witness 18% revenue CAGR over FY18-21 on the back of capacity expansion, execution of orders in EHV & EPC and strong demand from power distribution sector.
39
16
26
19 EPC
EHV
Cable
Exports order (Rs.mn)
0
10,000
20,000
30,000
40,000
50,000
60,000
FY15 FY16 FY17 FY18 FY19E FY20E FY21E
(Rs mn) LT HT EHV HW SS Wire EPC Others
KEI Industries Ltd
20
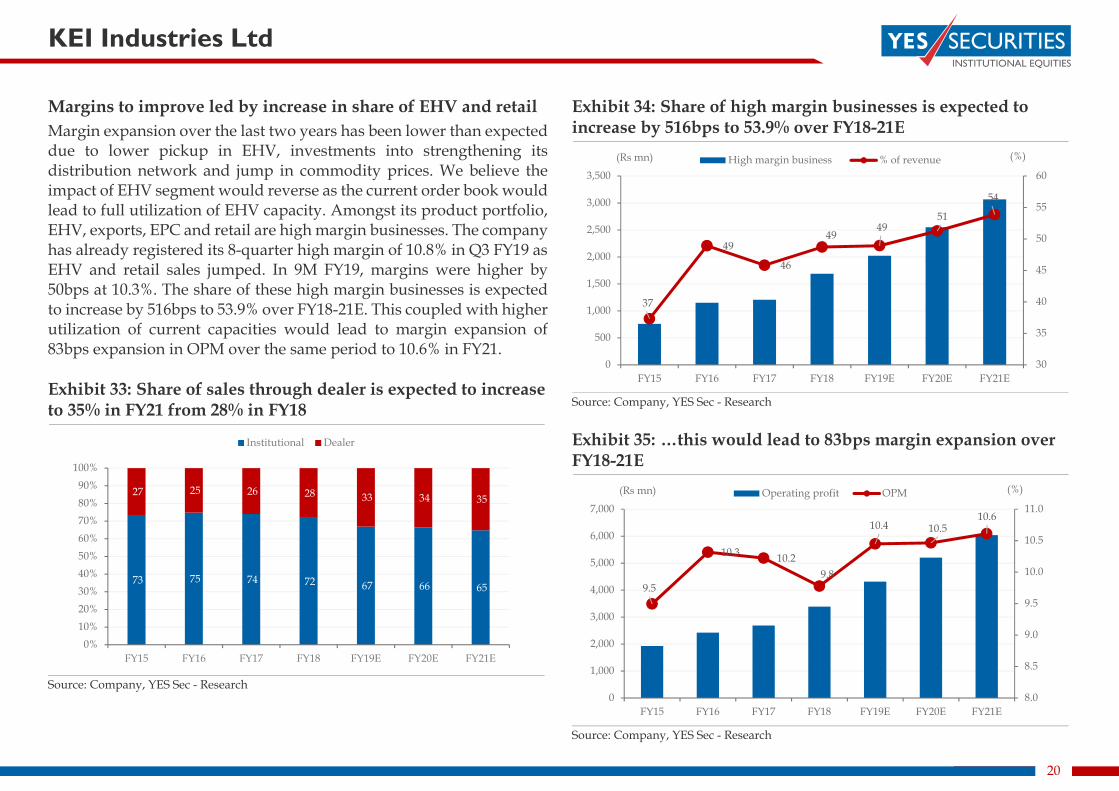
Margins to improve led by increase in share of EHV and retail Margin expansion over the last two years has been lower than expected due to lower pickup in EHV, investments into strengthening its distribution network and jump in commodity prices. We believe the impact of EHV segment would reverse as the current order book would lead to full utilization of EHV capacity. Amongst its product portfolio, EHV, exports, EPC and retail are high margin businesses. The company has already registered its 8-quarter high margin of 10.8% in Q3 FY19 as EHV and retail sales jumped. In 9M FY19, margins were higher by 50bps at 10.3%. The share of these high margin businesses is expected to increase by 516bps to 53.9% over FY18-21E. This coupled with higher utilization of current capacities would lead to margin expansion of 83bps expansion in OPM over the same period to 10.6% in FY21. Exhibit 33: Share of sales through dealer is expected to increase to 35% in FY21 from 28% in FY18
Source: Company, YES Sec - Research
Exhibit 34: Share of high margin businesses is expected to increase by 516bps to 53.9% over FY18-21E
Source: Company, YES Sec - Research Exhibit 35: …this would lead to 83bps margin expansion over FY18-21E
Source: Company, YES Sec - Research
73 75 74 72 67 66 65
27 25 26 28 33 34 35
0%10%20%30%40%50%60%70%80%90%
100%
FY15 FY16 FY17 FY18 FY19E FY20E FY21E
Institutional Dealer
37
49
46
49 49
51
54
30
35
40
45
50
55
60
0
500
1,000
1,500
2,000
2,500
3,000
3,500
FY15 FY16 FY17 FY18 FY19E FY20E FY21E
(%)(Rs mn) High margin business % of revenue
9.5
10.3 10.2 9.8
10.4 10.5 10.6
8.0
8.5
9.0
9.5
10.0
10.5
11.0
0
1,000
2,000
3,000
4,000
5,000
6,000
7,000
FY15 FY16 FY17 FY18 FY19E FY20E FY21E
(%)(Rs mn) Operating profit OPM
KEI Industries Ltd
21
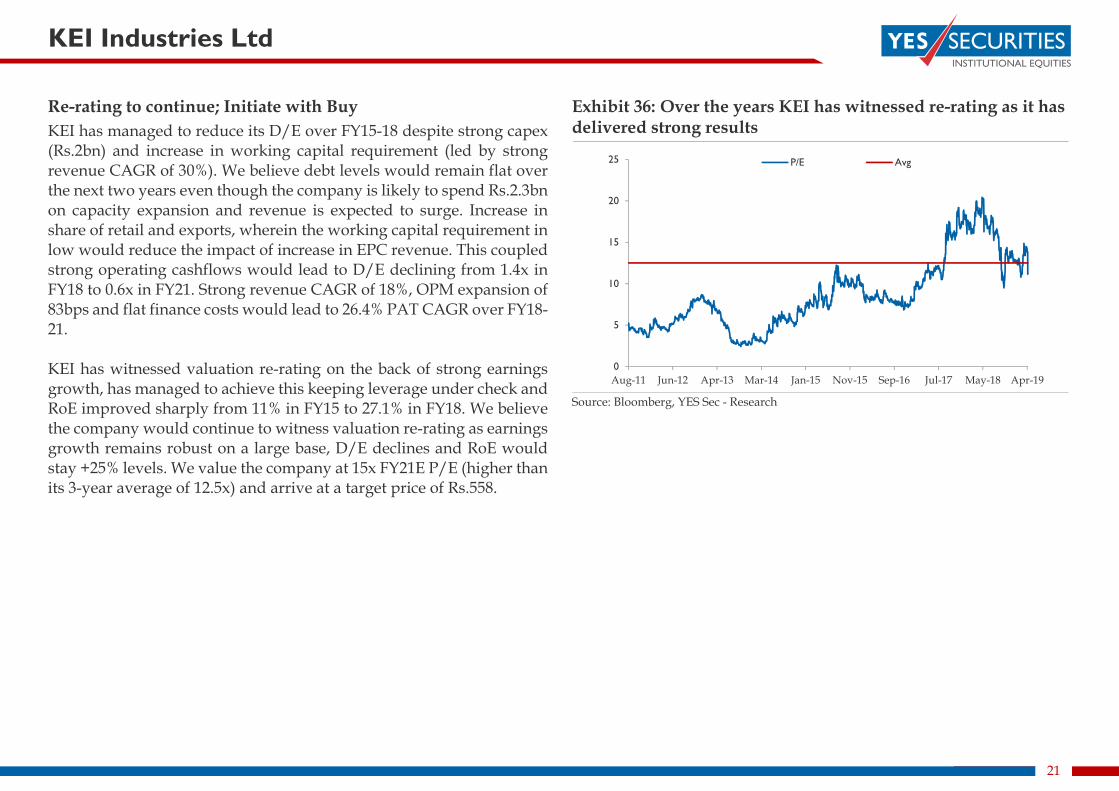
Re-rating to continue; Initiate with Buy KEI has managed to reduce its D/E over FY15-18 despite strong capex (Rs.2bn) and increase in working capital requirement (led by strong revenue CAGR of 30%). We believe debt levels would remain flat over the next two years even though the company is likely to spend Rs.2.3bn on capacity expansion and revenue is expected to surge. Increase in share of retail and exports, wherein the working capital requirement in low would reduce the impact of increase in EPC revenue. This coupled strong operating cashflows would lead to D/E declining from 1.4x in FY18 to 0.6x in FY21. Strong revenue CAGR of 18%, OPM expansion of 83bps and flat finance costs would lead to 26.4% PAT CAGR over FY18-21. KEI has witnessed valuation re-rating on the back of strong earnings growth, has managed to achieve this keeping leverage under check and RoE improved sharply from 11% in FY15 to 27.1% in FY18. We believe the company would continue to witness valuation re-rating as earnings growth remains robust on a large base, D/E declines and RoE would stay +25% levels. We value the company at 15x FY21E P/E (higher than its 3-year average of 12.5x) and arrive at a target price of Rs.558.
Exhibit 36: Over the years KEI has witnessed re-rating as it has delivered strong results
Source: Bloomberg, YES Sec - Research
0
5
10
15
20
25
Aug-11 Jun-12 Apr-13 Mar-14 Jan-15 Nov-15 Sep-16 Jul-17 May-18 Apr-19
P/E Avg
KEI Industries Ltd
22
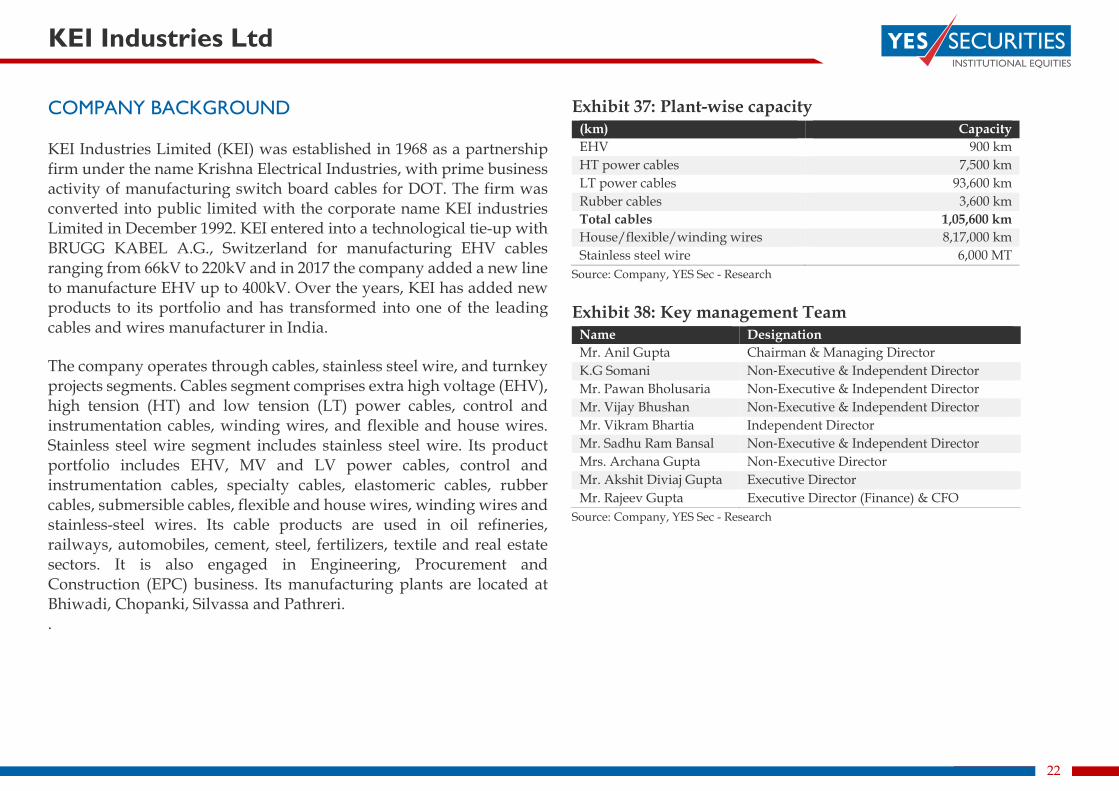
COMPANY BACKGROUND KEI Industries Limited (KEI) was established in 1968 as a partnership firm under the name Krishna Electrical Industries, with prime business activity of manufacturing switch board cables for DOT. The firm was converted into public limited with the corporate name KEI industries Limited in December 1992. KEI entered into a technological tie-up with BRUGG KABEL A.G., Switzerland for manufacturing EHV cables ranging from 66kV to 220kV and in 2017 the company added a new line to manufacture EHV up to 400kV. Over the years, KEI has added new products to its portfolio and has transformed into one of the leading cables and wires manufacturer in India. The company operates through cables, stainless steel wire, and turnkey projects segments. Cables segment comprises extra high voltage (EHV), high tension (HT) and low tension (LT) power cables, control and instrumentation cables, winding wires, and flexible and house wires. Stainless steel wire segment includes stainless steel wire. Its product portfolio includes EHV, MV and LV power cables, control and instrumentation cables, specialty cables, elastomeric cables, rubber cables, submersible cables, flexible and house wires, winding wires and stainless-steel wires. Its cable products are used in oil refineries, railways, automobiles, cement, steel, fertilizers, textile and real estate sectors. It is also engaged in Engineering, Procurement and Construction (EPC) business. Its manufacturing plants are located at Bhiwadi, Chopanki, Silvassa and Pathreri. .
Exhibit 37: Plant-wise capacity (km) Capacity EHV 900 km HT power cables 7,500 km LT power cables 93,600 km Rubber cables 3,600 km Total cables 1,05,600 km House/flexible/winding wires 8,17,000 km Stainless steel wire 6,000 MT
Source: Company, YES Sec - Research Exhibit 38: Key management Team
Name Designation Mr. Anil Gupta Chairman & Managing Director K.G Somani Non‐Executive & Independent Director Mr. Pawan Bholusaria Non‐Executive & Independent Director Mr. Vijay Bhushan Non‐Executive & Independent Director Mr. Vikram Bhartia Independent Director Mr. Sadhu Ram Bansal Non‐Executive & Independent Director Mrs. Archana Gupta Non‐Executive Director Mr. Akshit Diviaj Gupta Executive Director Mr. Rajeev Gupta Executive Director (Finance) & CFO
Source: Company, YES Sec - Research
KEI Industries Ltd
23
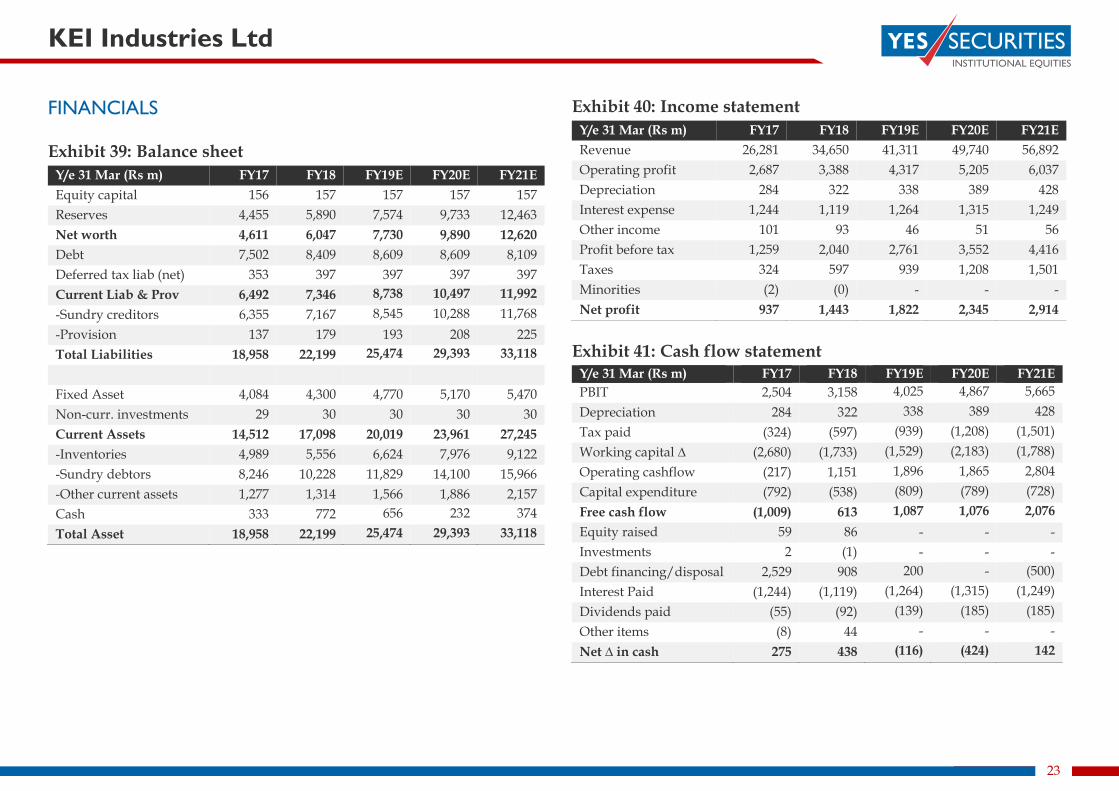
FINANCIALS Exhibit 39: Balance sheet
Y/e 31 Mar (Rs m) FY17 FY18 FY19E FY20E FY21E Equity capital 156 157 157 157 157 Reserves 4,455 5,890 7,574 9,733 12,463 Net worth 4,611 6,047 7,730 9,890 12,620 Debt 7,502 8,409 8,609 8,609 8,109 Deferred tax liab (net) 353 397 397 397 397 Current Liab & Prov 6,492 7,346 8,738 10,497 11,992 -Sundry creditors 6,355 7,167 8,545 10,288 11,768 -Provision 137 179 193 208 225 Total Liabilities 18,958 22,199 25,474 29,393 33,118
Fixed Asset 4,084 4,300 4,770 5,170 5,470 Non-curr. investments 29 30 30 30 30 Current Assets 14,512 17,098 20,019 23,961 27,245 -Inventories 4,989 5,556 6,624 7,976 9,122 -Sundry debtors 8,246 10,228 11,829 14,100 15,966 -Other current assets 1,277 1,314 1,566 1,886 2,157 Cash 333 772 656 232 374 Total Asset 18,958 22,199 25,474 29,393 33,118
Exhibit 40: Income statement Y/e 31 Mar (Rs m) FY17 FY18 FY19E FY20E FY21E Revenue 26,281 34,650 41,311 49,740 56,892 Operating profit 2,687 3,388 4,317 5,205 6,037 Depreciation 284 322 338 389 428 Interest expense 1,244 1,119 1,264 1,315 1,249 Other income 101 93 46 51 56 Profit before tax 1,259 2,040 2,761 3,552 4,416 Taxes 324 597 939 1,208 1,501 Minorities (2) (0) - - - Net profit 937 1,443 1,822 2,345 2,914
Exhibit 41: Cash flow statement
Y/e 31 Mar (Rs m) FY17 FY18 FY19E FY20E FY21E PBIT 2,504 3,158 4,025 4,867 5,665 Depreciation 284 322 338 389 428 Tax paid (324) (597) (939) (1,208) (1,501) Working capital ∆ (2,680) (1,733) (1,529) (2,183) (1,788) Operating cashflow (217) 1,151 1,896 1,865 2,804 Capital expenditure (792) (538) (809) (789) (728) Free cash flow (1,009) 613 1,087 1,076 2,076 Equity raised 59 86 - - - Investments 2 (1) - - - Debt financing/disposal 2,529 908 200 - (500) Interest Paid (1,244) (1,119) (1,264) (1,315) (1,249) Dividends paid (55) (92) (139) (185) (185) Other items (8) 44 - - - Net ∆ in cash 275 438 (116) (424) 142
KEI Industries Ltd
24
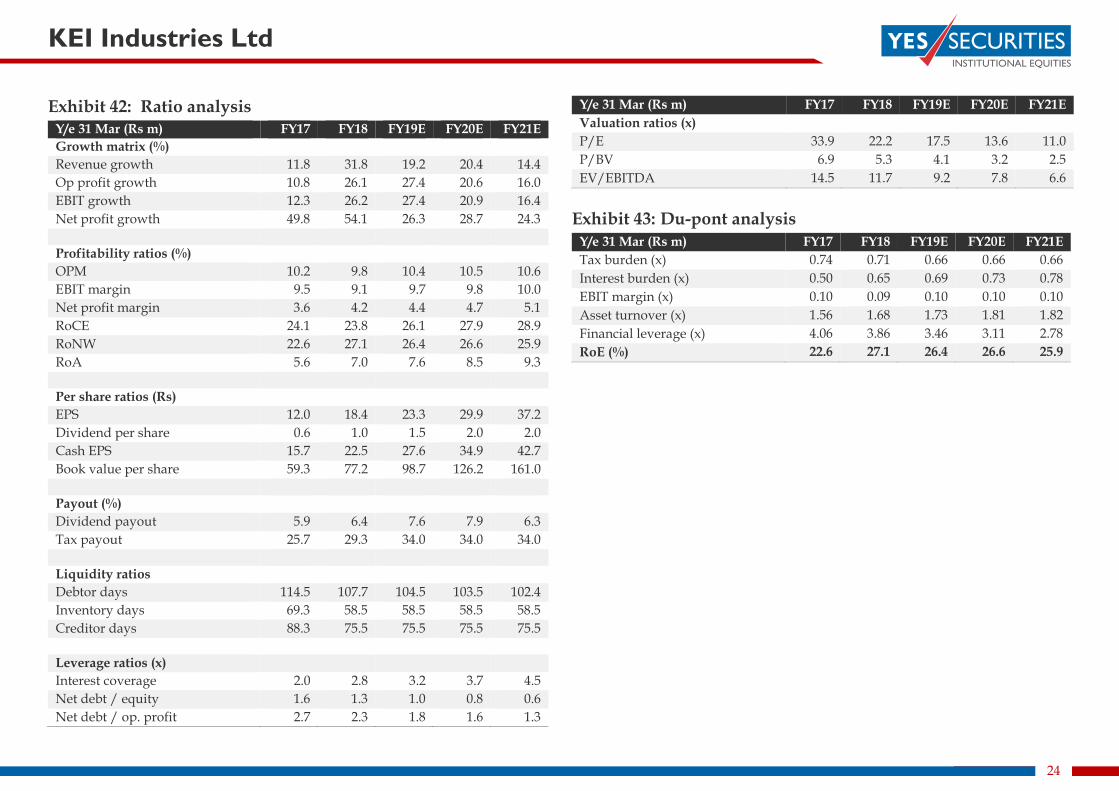
Exhibit 42: Ratio analysis Y/e 31 Mar (Rs m) FY17 FY18 FY19E FY20E FY21E Growth matrix (%) Revenue growth 11.8 31.8 19.2 20.4 14.4 Op profit growth 10.8 26.1 27.4 20.6 16.0 EBIT growth 12.3 26.2 27.4 20.9 16.4 Net profit growth 49.8 54.1 26.3 28.7 24.3 Profitability ratios (%) OPM 10.2 9.8 10.4 10.5 10.6 EBIT margin 9.5 9.1 9.7 9.8 10.0 Net profit margin 3.6 4.2 4.4 4.7 5.1 RoCE 24.1 23.8 26.1 27.9 28.9 RoNW 22.6 27.1 26.4 26.6 25.9 RoA 5.6 7.0 7.6 8.5 9.3 Per share ratios (Rs) EPS 12.0 18.4 23.3 29.9 37.2 Dividend per share 0.6 1.0 1.5 2.0 2.0 Cash EPS 15.7 22.5 27.6 34.9 42.7 Book value per share 59.3 77.2 98.7 126.2 161.0 Payout (%) Dividend payout 5.9 6.4 7.6 7.9 6.3 Tax payout 25.7 29.3 34.0 34.0 34.0 Liquidity ratios Debtor days 114.5 107.7 104.5 103.5 102.4 Inventory days 69.3 58.5 58.5 58.5 58.5 Creditor days 88.3 75.5 75.5 75.5 75.5 Leverage ratios (x) Interest coverage 2.0 2.8 3.2 3.7 4.5 Net debt / equity 1.6 1.3 1.0 0.8 0.6 Net debt / op. profit 2.7 2.3 1.8 1.6 1.3
Y/e 31 Mar (Rs m) FY17 FY18 FY19E FY20E FY21E Valuation ratios (x) P/E 33.9 22.2 17.5 13.6 11.0 P/BV 6.9 5.3 4.1 3.2 2.5 EV/EBITDA 14.5 11.7 9.2 7.8 6.6
Exhibit 43: Du-pont analysis
Y/e 31 Mar (Rs m) FY17 FY18 FY19E FY20E FY21E Tax burden (x) 0.74 0.71 0.66 0.66 0.66 Interest burden (x) 0.50 0.65 0.69 0.73 0.78 EBIT margin (x) 0.10 0.09 0.10 0.10 0.10 Asset turnover (x) 1.56 1.68 1.73 1.81 1.82 Financial leverage (x) 4.06 3.86 3.46 3.11 2.78 RoE (%) 22.6 27.1 26.4 26.6 25.9
Research Analyst: Tarang Bhanushali [email protected] | Rahul Jain [email protected] Head of Research: Amar Ambani [email protected] (For important information about YES SECURITIES (INDIA) LTD. and other disclosures, refer to the end of this material.)
Finolex Cables Ltd - BUY Premium play
COMPANY REPORT
April 09, 2019
CMP (Rs) (As on Apr 08, 2019) 493 Sector: Consumer Electricals
12‐mts Target (Rs) 600 Market cap (Rs mn) 75,404
Upside 22% Enterprise value (Rs mn) 74,378
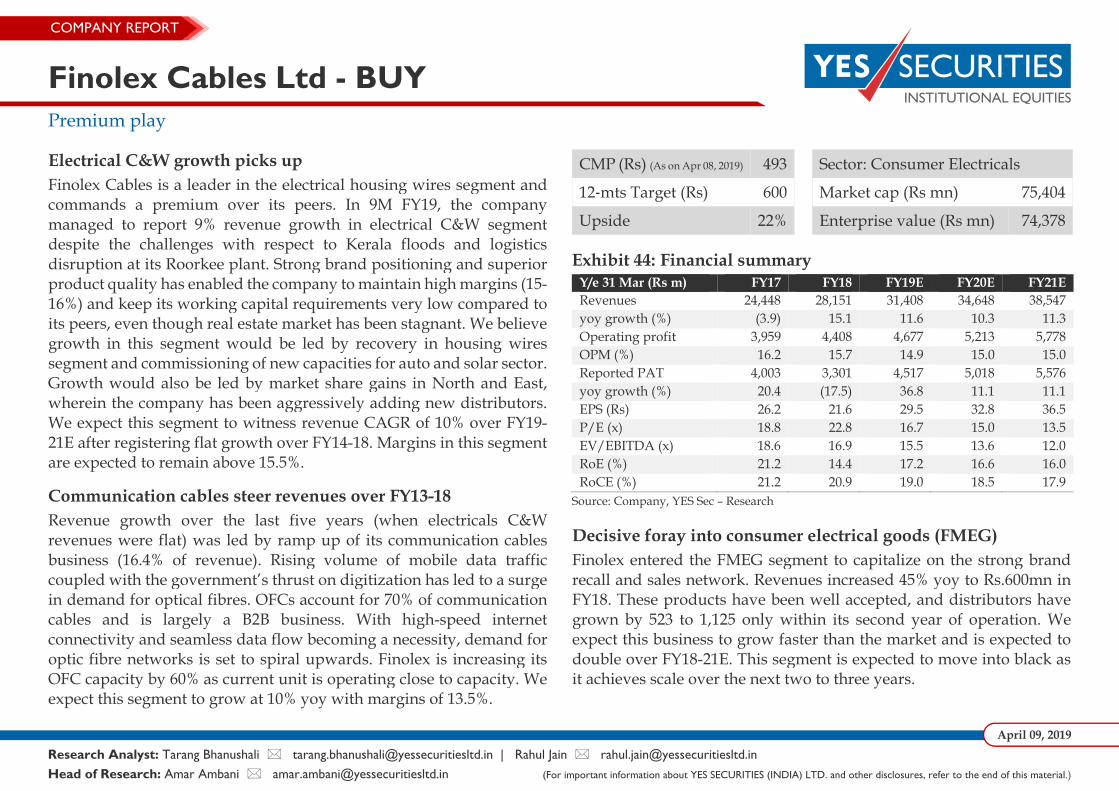
Exhibit 44: Financial summary Y/e 31 Mar (Rs m) FY17 FY18 FY19E FY20E FY21E Revenues 24,448 28,151 31,408 34,648 38,547 yoy growth (%) (3.9) 15.1 11.6 10.3 11.3 Operating profit 3,959 4,408 4,677 5,213 5,778 OPM (%) 16.2 15.7 14.9 15.0 15.0 Reported PAT 4,003 3,301 4,517 5,018 5,576 yoy growth (%) 20.4 (17.5) 36.8 11.1 11.1 EPS (Rs) 26.2 21.6 29.5 32.8 36.5 P/E (x) 18.8 22.8 16.7 15.0 13.5 EV/EBITDA (x) 18.6 16.9 15.5 13.6 12.0 RoE (%) 21.2 14.4 17.2 16.6 16.0 RoCE (%) 21.2 20.9 19.0 18.5 17.9
Source: Company, YES Sec – Research
Electrical C&W growth picks up Finolex Cables is a leader in the electrical housing wires segment andcommands a premium over its peers. In 9M FY19, the companymanaged to report 9% revenue growth in electrical C&W segmentdespite the challenges with respect to Kerala floods and logisticsdisruption at its Roorkee plant. Strong brand positioning and superiorproduct quality has enabled the company to maintain high margins (15-16%) and keep its working capital requirements very low compared toits peers, even though real estate market has been stagnant. We believegrowth in this segment would be led by recovery in housing wiressegment and commissioning of new capacities for auto and solar sector.Growth would also be led by market share gains in North and East,wherein the company has been aggressively adding new distributors.We expect this segment to witness revenue CAGR of 10% over FY19-21E after registering flat growth over FY14-18. Margins in this segmentare expected to remain above 15.5%.
Communication cables steer revenues over FY13-18 Revenue growth over the last five years (when electricals C&Wrevenues were flat) was led by ramp up of its communication cablesbusiness (16.4% of revenue). Rising volume of mobile data trafficcoupled with the government’s thrust on digitization has led to a surgein demand for optical fibres. OFCs account for 70% of communicationcables and is largely a B2B business. With high-speed internetconnectivity and seamless data flow becoming a necessity, demand foroptic fibre networks is set to spiral upwards. Finolex is increasing itsOFC capacity by 60% as current unit is operating close to capacity. Weexpect this segment to grow at 10% yoy with margins of 13.5%.
Decisive foray into consumer electrical goods (FMEG) Finolex entered the FMEG segment to capitalize on the strong brandrecall and sales network. Revenues increased 45% yoy to Rs.600mn inFY18. These products have been well accepted, and distributors have grown by 523 to 1,125 only within its second year of operation. Weexpect this business to grow faster than the market and is expected to double over FY18-21E. This segment is expected to move into black asit achieves scale over the next two to three years.
Finolex Cables Ltd
26
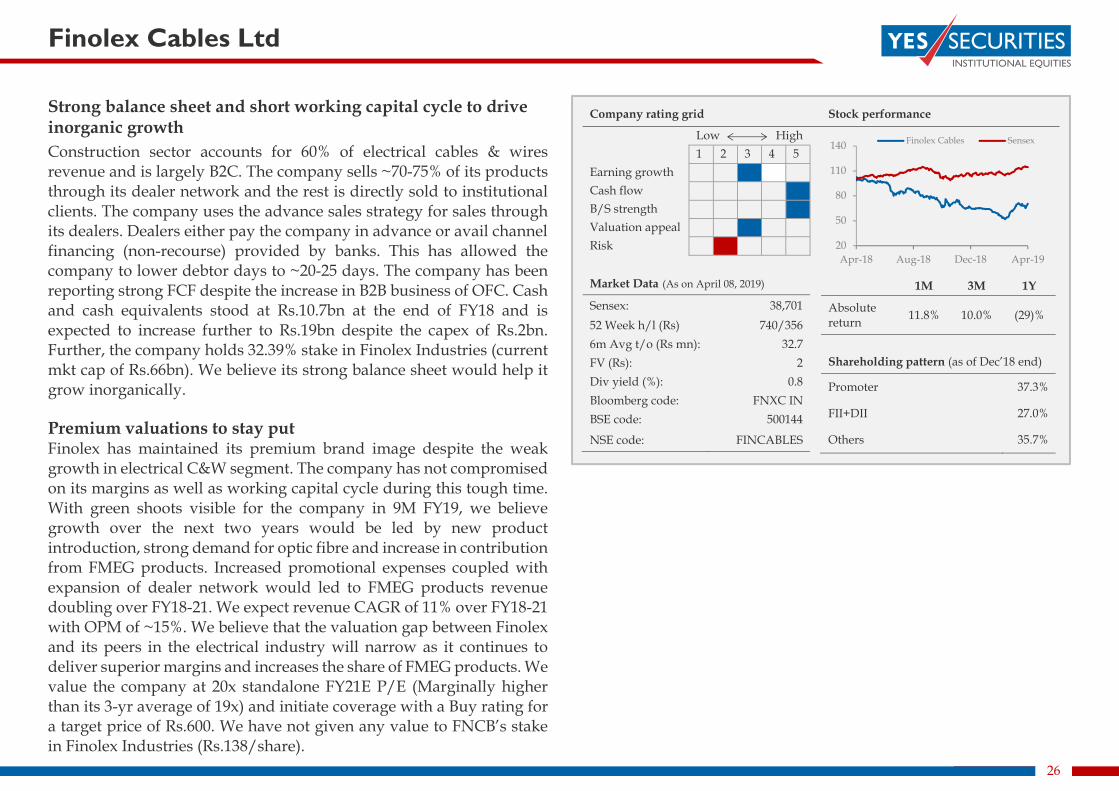
Strong balance sheet and short working capital cycle to drive inorganic growth Construction sector accounts for 60% of electrical cables & wires revenue and is largely B2C. The company sells ~70-75% of its products through its dealer network and the rest is directly sold to institutional clients. The company uses the advance sales strategy for sales through its dealers. Dealers either pay the company in advance or avail channel financing (non-recourse) provided by banks. This has allowed the company to lower debtor days to ~20-25 days. The company has been reporting strong FCF despite the increase in B2B business of OFC. Cash and cash equivalents stood at Rs.10.7bn at the end of FY18 and is expected to increase further to Rs.19bn despite the capex of Rs.2bn. Further, the company holds 32.39% stake in Finolex Industries (current mkt cap of Rs.66bn). We believe its strong balance sheet would help it grow inorganically. Premium valuations to stay put Finolex has maintained its premium brand image despite the weak growth in electrical C&W segment. The company has not compromised on its margins as well as working capital cycle during this tough time. With green shoots visible for the company in 9M FY19, we believe growth over the next two years would be led by new product introduction, strong demand for optic fibre and increase in contribution from FMEG products. Increased promotional expenses coupled with expansion of dealer network would led to FMEG products revenue doubling over FY18-21. We expect revenue CAGR of 11% over FY18-21 with OPM of ~15%. We believe that the valuation gap between Finolex and its peers in the electrical industry will narrow as it continues to deliver superior margins and increases the share of FMEG products. We value the company at 20x standalone FY21E P/E (Marginally higher than its 3-yr average of 19x) and initiate coverage with a Buy rating for a target price of Rs.600. We have not given any value to FNCB’s stake in Finolex Industries (Rs.138/share).
Company rating grid Stock performance Low High 1 2 3 4 5 Earning growth Cash flow B/S strength Valuation appeal Risk
Market Data (As on April 08, 2019) 1M 3M 1Y
Absolute return 11.8% 10.0% (29)%
Shareholding pattern (as of Dec’18 end)
Promoter 37.3%
FII+DII 27.0%
Others 35.7%
Sensex: 38,701 52 Week h/l (Rs) 740/356 6m Avg t/o (Rs mn): 32.7 FV (Rs): 2 Div yield (%): 0.8 Bloomberg code: FNXC IN BSE code: 500144 NSE code: FINCABLES
20
50
80
110
140
Apr-18 Aug-18 Dec-18 Apr-19
Finolex Cables Sensex
Finolex Cables Ltd
27
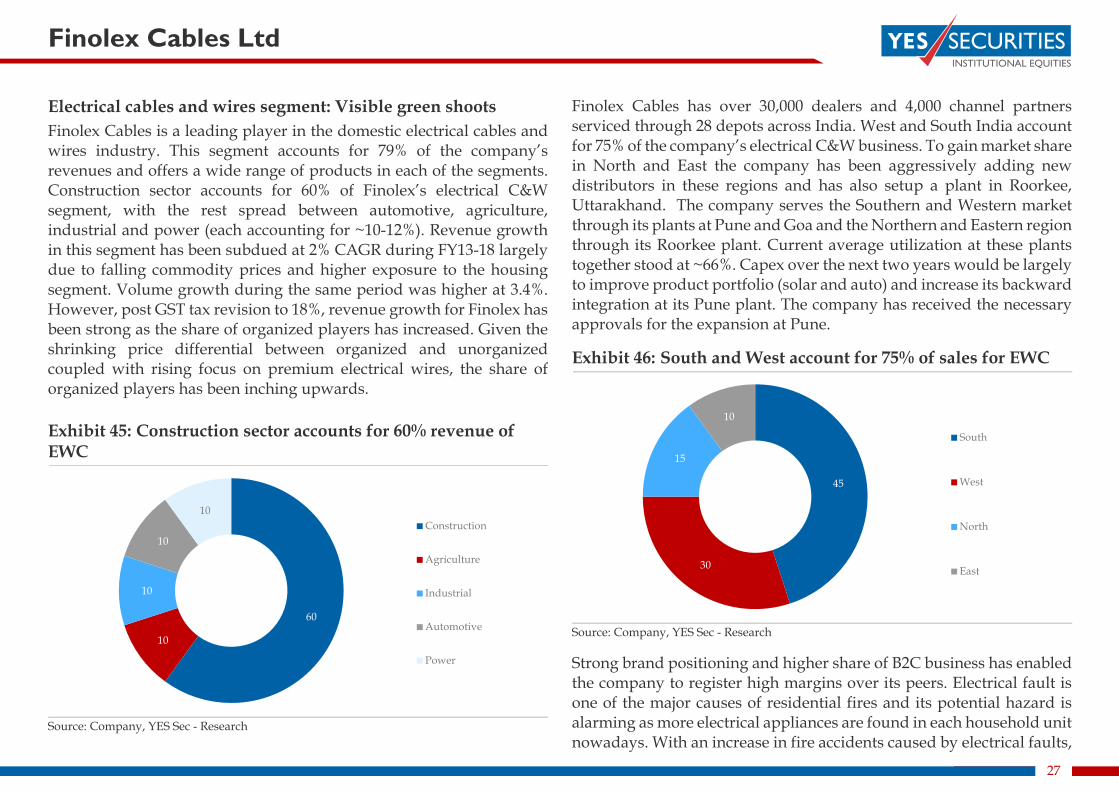
Electrical cables and wires segment: Visible green shoots Finolex Cables is a leading player in the domestic electrical cables and wires industry. This segment accounts for 79% of the company’s revenues and offers a wide range of products in each of the segments. Construction sector accounts for 60% of Finolex’s electrical C&W segment, with the rest spread between automotive, agriculture, industrial and power (each accounting for ~10-12%). Revenue growth in this segment has been subdued at 2% CAGR during FY13-18 largely due to falling commodity prices and higher exposure to the housing segment. Volume growth during the same period was higher at 3.4%. However, post GST tax revision to 18%, revenue growth for Finolex has been strong as the share of organized players has increased. Given the shrinking price differential between organized and unorganized coupled with rising focus on premium electrical wires, the share of organized players has been inching upwards. Exhibit 45: Construction sector accounts for 60% revenue of EWC
Source: Company, YES Sec - Research
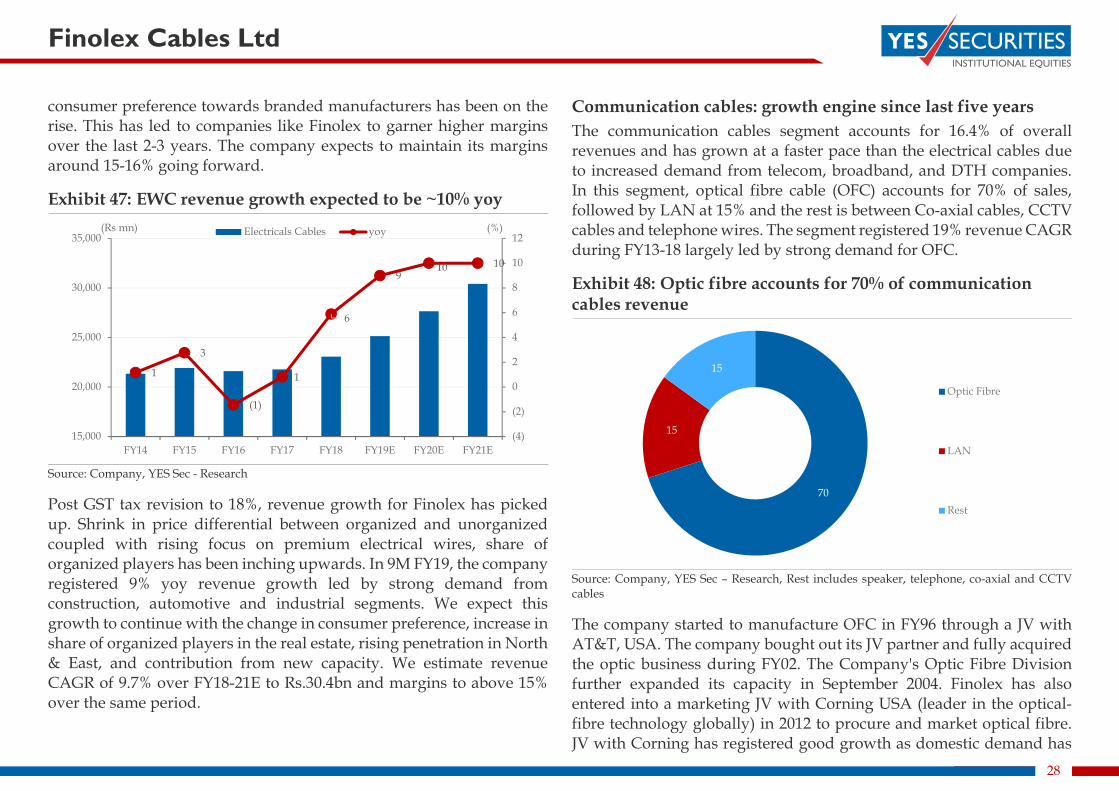
Finolex Cables has over 30,000 dealers and 4,000 channel partners serviced through 28 depots across India. West and South India account for 75% of the company’s electrical C&W business. To gain market share in North and East the company has been aggressively adding new distributors in these regions and has also setup a plant in Roorkee, Uttarakhand. The company serves the Southern and Western market through its plants at Pune and Goa and the Northern and Eastern region through its Roorkee plant. Current average utilization at these plants together stood at ~66%. Capex over the next two years would be largely to improve product portfolio (solar and auto) and increase its backward integration at its Pune plant. The company has received the necessary approvals for the expansion at Pune.
Exhibit 46: South and West account for 75% of sales for EWC
Source: Company, YES Sec - Research
Strong brand positioning and higher share of B2C business has enabled the company to register high margins over its peers. Electrical fault is one of the major causes of residential fires and its potential hazard is alarming as more electrical appliances are found in each household unit nowadays. With an increase in fire accidents caused by electrical faults,
60
10
10
10
10Construction
Agriculture
Industrial
Automotive
Power
45
30
15
10
South
West
North
East
Finolex Cables Ltd
28
consumer preference towards branded manufacturers has been on the rise. This has led to companies like Finolex to garner higher margins over the last 2-3 years. The company expects to maintain its margins around 15-16% going forward.
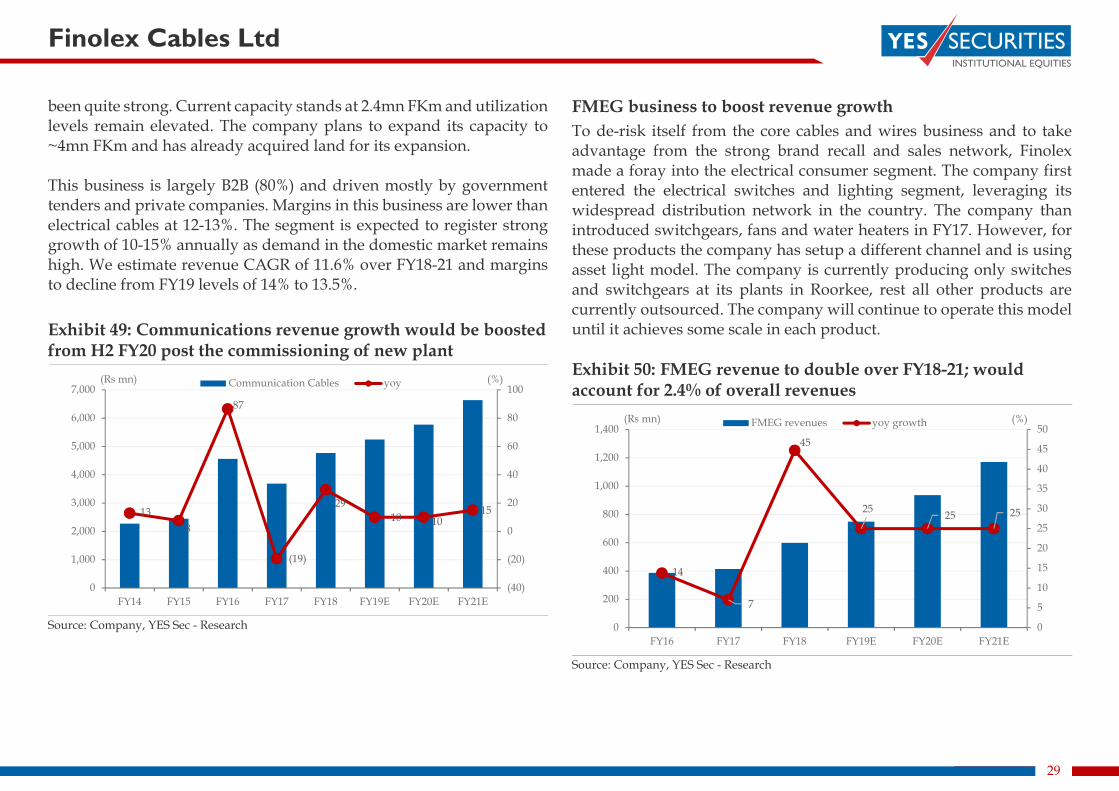
Exhibit 47: EWC revenue growth expected to be ~10% yoy
Source: Company, YES Sec - Research
Post GST tax revision to 18%, revenue growth for Finolex has picked up. Shrink in price differential between organized and unorganized coupled with rising focus on premium electrical wires, share of organized players has been inching upwards. In 9M FY19, the company registered 9% yoy revenue growth led by strong demand from construction, automotive and industrial segments. We expect this growth to continue with the change in consumer preference, increase in share of organized players in the real estate, rising penetration in North & East, and contribution from new capacity. We estimate revenue CAGR of 9.7% over FY18-21E to Rs.30.4bn and margins to above 15% over the same period.
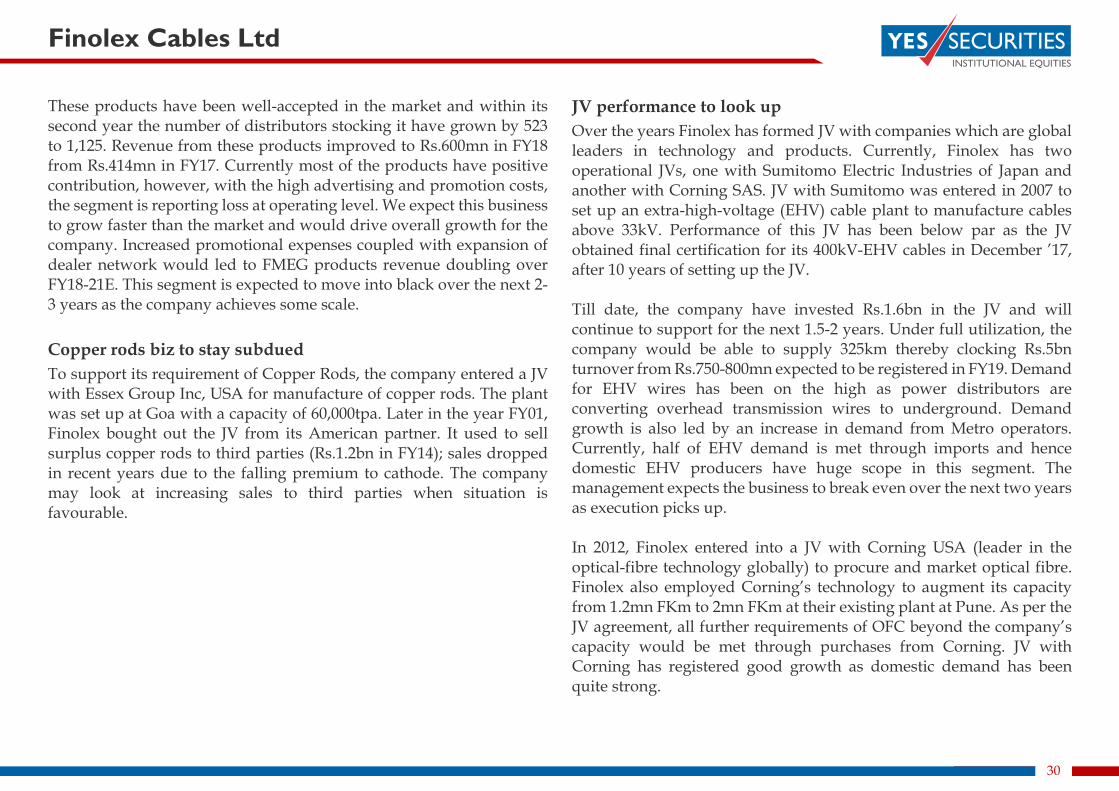
Communication cables: growth engine since last five years The communication cables segment accounts for 16.4% of overall revenues and has grown at a faster pace than the electrical cables due to increased demand from telecom, broadband, and DTH companies. In this segment, optical fibre cable (OFC) accounts for 70% of sales, followed by LAN at 15% and the rest is between Co-axial cables, CCTV cables and telephone wires. The segment registered 19% revenue CAGR during FY13-18 largely led by strong demand for OFC.
Exhibit 48: Optic fibre accounts for 70% of communication cables revenue
Source: Company, YES Sec – Research, Rest includes speaker, telephone, co-axial and CCTV cables
The company started to manufacture OFC in FY96 through a JV with AT&T, USA. The company bought out its JV partner and fully acquired the optic business during FY02. The Company's Optic Fibre Division further expanded its capacity in September 2004. Finolex has also entered into a marketing JV with Corning USA (leader in the optical-fibre technology globally) in 2012 to procure and market optical fibre. JV with Corning has registered good growth as domestic demand has
1
3
(1)
1
6
9 10 10
(4)
(2)
0
2
4
6
8
10
12
15,000
20,000
25,000
30,000
35,000
FY14 FY15 FY16 FY17 FY18 FY19E FY20E FY21E
(%)(Rs mn) Electricals Cables yoy
70
15
15
Optic Fibre
LAN
Rest
Finolex Cables Ltd
29
been quite strong. Current capacity stands at 2.4mn FKm and utilization levels remain elevated. The company plans to expand its capacity to ~4mn FKm and has already acquired land for its expansion. This business is largely B2B (80%) and driven mostly by government tenders and private companies. Margins in this business are lower than electrical cables at 12-13%. The segment is expected to register strong growth of 10-15% annually as demand in the domestic market remains high. We estimate revenue CAGR of 11.6% over FY18-21 and margins to decline from FY19 levels of 14% to 13.5%. Exhibit 49: Communications revenue growth would be boosted from H2 FY20 post the commissioning of new plant
Source: Company, YES Sec - Research
FMEG business to boost revenue growth To de-risk itself from the core cables and wires business and to take advantage from the strong brand recall and sales network, Finolex made a foray into the electrical consumer segment. The company first entered the electrical switches and lighting segment, leveraging its widespread distribution network in the country. The company than introduced switchgears, fans and water heaters in FY17. However, for these products the company has setup a different channel and is using asset light model. The company is currently producing only switches and switchgears at its plants in Roorkee, rest all other products are currently outsourced. The company will continue to operate this model until it achieves some scale in each product. Exhibit 50: FMEG revenue to double over FY18-21; would account for 2.4% of overall revenues
Source: Company, YES Sec - Research
13 8
87
(19)
29 10 10
15
(40)
(20)
0
20
40
60
80
100
0
1,000
2,000
3,000
4,000
5,000
6,000
7,000
FY14 FY15 FY16 FY17 FY18 FY19E FY20E FY21E
(%)(Rs mn) Communication Cables yoy
14
7
45
25 25 25
0
5
10
15
20
25
30
35
40
45
50
0
200
400
600
800
1,000
1,200
1,400
FY16 FY17 FY18 FY19E FY20E FY21E
(%)(Rs mn) FMEG revenues yoy growth
Finolex Cables Ltd
30
These products have been well-accepted in the market and within its second year the number of distributors stocking it have grown by 523 to 1,125. Revenue from these products improved to Rs.600mn in FY18 from Rs.414mn in FY17. Currently most of the products have positive contribution, however, with the high advertising and promotion costs, the segment is reporting loss at operating level. We expect this business to grow faster than the market and would drive overall growth for the company. Increased promotional expenses coupled with expansion of dealer network would led to FMEG products revenue doubling over FY18-21E. This segment is expected to move into black over the next 2-3 years as the company achieves some scale. Copper rods biz to stay subdued To support its requirement of Copper Rods, the company entered a JV with Essex Group Inc, USA for manufacture of copper rods. The plant was set up at Goa with a capacity of 60,000tpa. Later in the year FY01, Finolex bought out the JV from its American partner. It used to sell surplus copper rods to third parties (Rs.1.2bn in FY14); sales dropped in recent years due to the falling premium to cathode. The company may look at increasing sales to third parties when situation is favourable.
JV performance to look up Over the years Finolex has formed JV with companies which are global leaders in technology and products. Currently, Finolex has two operational JVs, one with Sumitomo Electric Industries of Japan and another with Corning SAS. JV with Sumitomo was entered in 2007 to set up an extra-high-voltage (EHV) cable plant to manufacture cables above 33kV. Performance of this JV has been below par as the JV obtained final certification for its 400kV-EHV cables in December ’17, after 10 years of setting up the JV. Till date, the company have invested Rs.1.6bn in the JV and will continue to support for the next 1.5-2 years. Under full utilization, the company would be able to supply 325km thereby clocking Rs.5bn turnover from Rs.750-800mn expected to be registered in FY19. Demand for EHV wires has been on the high as power distributors are converting overhead transmission wires to underground. Demand growth is also led by an increase in demand from Metro operators. Currently, half of EHV demand is met through imports and hence domestic EHV producers have huge scope in this segment. The management expects the business to break even over the next two years as execution picks up. In 2012, Finolex entered into a JV with Corning USA (leader in the optical-fibre technology globally) to procure and market optical fibre. Finolex also employed Corning’s technology to augment its capacity from 1.2mn FKm to 2mn FKm at their existing plant at Pune. As per the JV agreement, all further requirements of OFC beyond the company’s capacity would be met through purchases from Corning. JV with Corning has registered good growth as domestic demand has been quite strong.
Finolex Cables Ltd
31
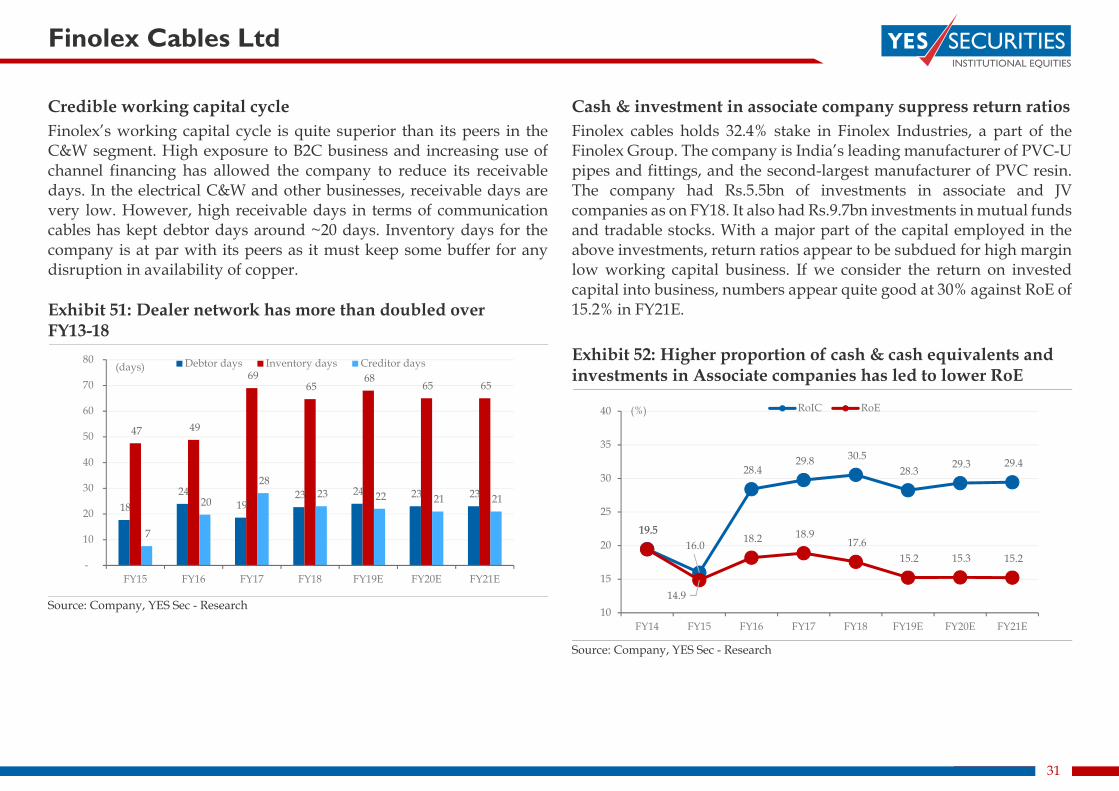
Credible working capital cycle Finolex’s working capital cycle is quite superior than its peers in the C&W segment. High exposure to B2C business and increasing use of channel financing has allowed the company to reduce its receivable days. In the electrical C&W and other businesses, receivable days are very low. However, high receivable days in terms of communication cables has kept debtor days around ~20 days. Inventory days for the company is at par with its peers as it must keep some buffer for any disruption in availability of copper. Exhibit 51: Dealer network has more than doubled over FY13-18
Source: Company, YES Sec - Research
Cash & investment in associate company suppress return ratios Finolex cables holds 32.4% stake in Finolex Industries, a part of the Finolex Group. The company is India’s leading manufacturer of PVC-U pipes and fittings, and the second-largest manufacturer of PVC resin. The company had Rs.5.5bn of investments in associate and JV companies as on FY18. It also had Rs.9.7bn investments in mutual funds and tradable stocks. With a major part of the capital employed in the above investments, return ratios appear to be subdued for high margin low working capital business. If we consider the return on invested capital into business, numbers appear quite good at 30% against RoE of 15.2% in FY21E. Exhibit 52: Higher proportion of cash & cash equivalents and investments in Associate companies has led to lower RoE
Source: Company, YES Sec - Research
18 24
19 23 24 23 23
47 49
69 65
68 65 65
7
20
28 23 22 21 21
-
10
20
30
40
50
60
70
80
FY15 FY16 FY17 FY18 FY19E FY20E FY21E
(days) Debtor days Inventory days Creditor days
19.5 16.0
28.4 29.8 30.5
28.3 29.3 29.4
19.5
14.9
18.2 18.9 17.6
15.2 15.3 15.2
10
15
20
25
30
35
40
FY14 FY15 FY16 FY17 FY18 FY19E FY20E FY21E
(%) RoIC RoE
Finolex Cables Ltd
32
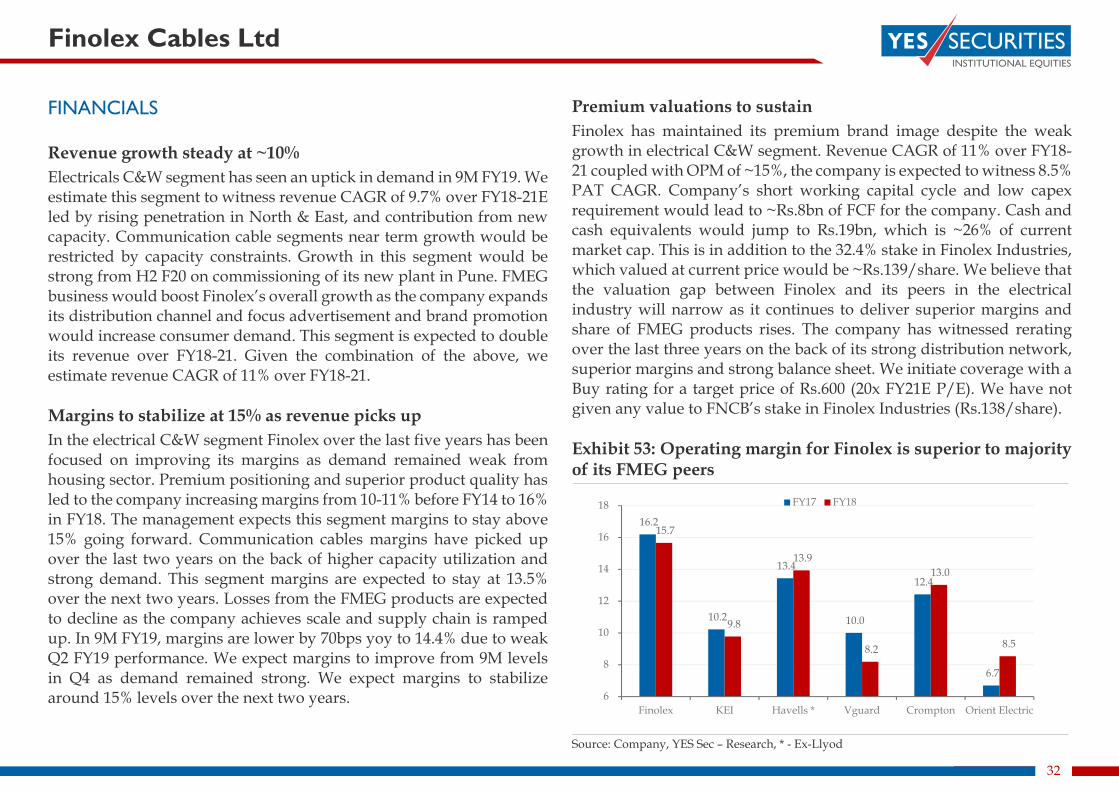
FINANCIALS Revenue growth steady at ~10% Electricals C&W segment has seen an uptick in demand in 9M FY19. We estimate this segment to witness revenue CAGR of 9.7% over FY18-21E led by rising penetration in North & East, and contribution from new capacity. Communication cable segments near term growth would be restricted by capacity constraints. Growth in this segment would be strong from H2 F20 on commissioning of its new plant in Pune. FMEG business would boost Finolex’s overall growth as the company expands its distribution channel and focus advertisement and brand promotion would increase consumer demand. This segment is expected to double its revenue over FY18-21. Given the combination of the above, we estimate revenue CAGR of 11% over FY18-21. Margins to stabilize at 15% as revenue picks up In the electrical C&W segment Finolex over the last five years has been focused on improving its margins as demand remained weak from housing sector. Premium positioning and superior product quality has led to the company increasing margins from 10-11% before FY14 to 16% in FY18. The management expects this segment margins to stay above 15% going forward. Communication cables margins have picked up over the last two years on the back of higher capacity utilization and strong demand. This segment margins are expected to stay at 13.5% over the next two years. Losses from the FMEG products are expected to decline as the company achieves scale and supply chain is ramped up. In 9M FY19, margins are lower by 70bps yoy to 14.4% due to weak Q2 FY19 performance. We expect margins to improve from 9M levels in Q4 as demand remained strong. We expect margins to stabilize around 15% levels over the next two years.
Premium valuations to sustain Finolex has maintained its premium brand image despite the weak growth in electrical C&W segment. Revenue CAGR of 11% over FY18-21 coupled with OPM of ~15%, the company is expected to witness 8.5% PAT CAGR. Company’s short working capital cycle and low capex requirement would lead to ~Rs.8bn of FCF for the company. Cash and cash equivalents would jump to Rs.19bn, which is ~26% of current market cap. This is in addition to the 32.4% stake in Finolex Industries, which valued at current price would be ~Rs.139/share. We believe that the valuation gap between Finolex and its peers in the electrical industry will narrow as it continues to deliver superior margins and share of FMEG products rises. The company has witnessed rerating over the last three years on the back of its strong distribution network, superior margins and strong balance sheet. We initiate coverage with a Buy rating for a target price of Rs.600 (20x FY21E P/E). We have not given any value to FNCB’s stake in Finolex Industries (Rs.138/share). Exhibit 53: Operating margin for Finolex is superior to majority of its FMEG peers
Source: Company, YES Sec – Research, * - Ex-Llyod
16.2
10.2
13.4
10.0
12.4
6.7
15.7
9.8
13.9
8.2
13.0
8.5
6
8
10
12
14
16
18
Finolex KEI Havells * Vguard Crompton Orient Electric
FY17 FY18
Finolex Cables Ltd
33
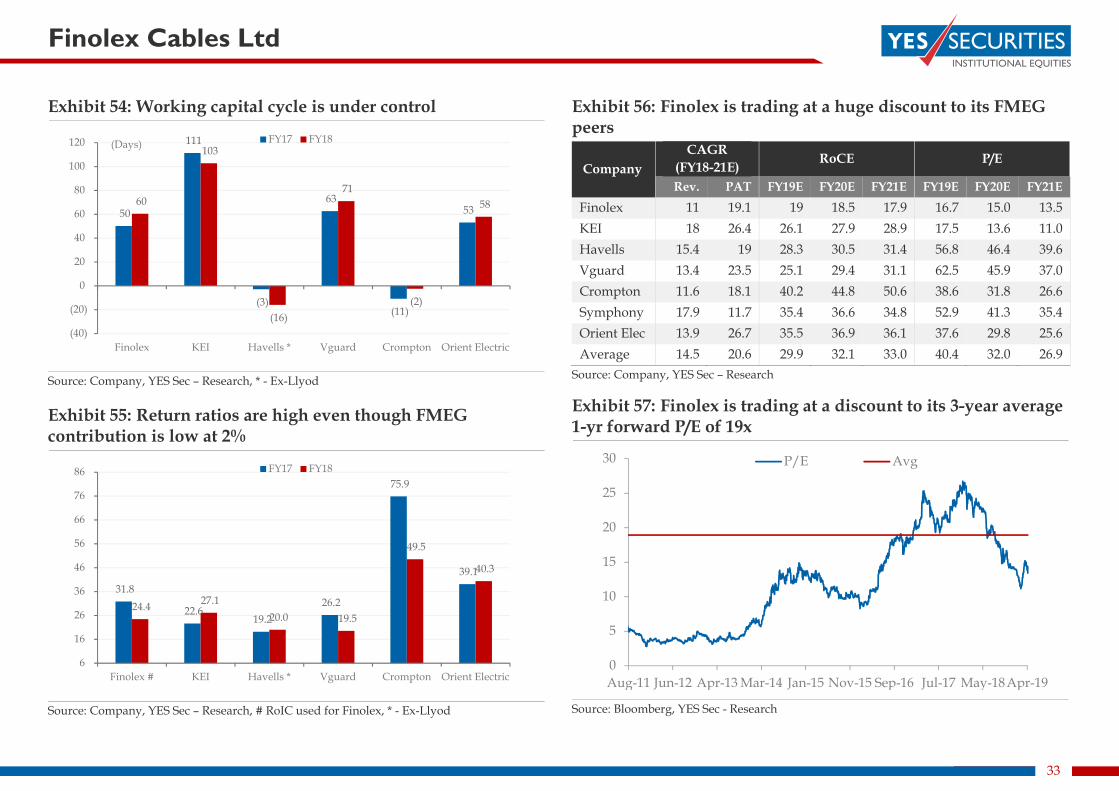
Exhibit 54: Working capital cycle is under control
Source: Company, YES Sec – Research, * - Ex-Llyod Exhibit 55: Return ratios are high even though FMEG contribution is low at 2%
Source: Company, YES Sec – Research, # RoIC used for Finolex, * - Ex-Llyod
Exhibit 56: Finolex is trading at a huge discount to its FMEG peers
Company CAGR
(FY18-21E) RoCE P/E
Rev. PAT FY19E FY20E FY21E FY19E FY20E FY21E Finolex 11 19.1 19 18.5 17.9 16.7 15.0 13.5 KEI 18 26.4 26.1 27.9 28.9 17.5 13.6 11.0 Havells 15.4 19 28.3 30.5 31.4 56.8 46.4 39.6 Vguard 13.4 23.5 25.1 29.4 31.1 62.5 45.9 37.0 Crompton 11.6 18.1 40.2 44.8 50.6 38.6 31.8 26.6 Symphony 17.9 11.7 35.4 36.6 34.8 52.9 41.3 35.4 Orient Elec 13.9 26.7 35.5 36.9 36.1 37.6 29.8 25.6 Average 14.5 20.6 29.9 32.1 33.0 40.4 32.0 26.9
Source: Company, YES Sec – Research
Exhibit 57: Finolex is trading at a discount to its 3-year average 1-yr forward P/E of 19x
Source: Bloomberg, YES Sec - Research
50
111
(3)
63
(11)
53 60
103
(16)
71
(2)
58
(40)
(20)
0
20
40
60
80
100
120
Finolex KEI Havells * Vguard Crompton Orient Electric
(Days) FY17 FY18
31.8
22.6 19.2
26.2
75.9
39.1
24.4 27.1 20.0 19.5
49.5
40.3
6
16
26
36
46
56
66
76
86
Finolex # KEI Havells * Vguard Crompton Orient Electric
FY17 FY18
0
5
10
15
20
25
30
Aug-11 Jun-12 Apr-13 Mar-14 Jan-15 Nov-15 Sep-16 Jul-17 May-18Apr-19
P/E Avg

Finolex Cables Ltd
34
COMPANY BACKGROUND In July 1945, two brothers P.P. Chhabria and K.P. Chhabria came to Pune from Karachi and within six months, they set up a retail business selling electrical cables which became quite successful. A sizeable order in the mid 1950's from the Defence Department for wire harnesses for trucks and tanks bolstered their confidence, and hence they ventured into cable manufacture. Today, Finolex Cables is a leading manufacturer of electrical and telecommunication cables. The company started its operation with the manufacture of PVC insulated electrical cables for the automobile industry. Since then, the Company has constantly endeavored to augment its product range to include different category of cables and wires. In 2006, it entered the electrical space by launching switches and CFL. Post 2013, it started entering other categories such as LED lighting, Fans, switchgears and Water heater. The company has manufacturing facilities at Pimpri and Urse in Pune as well as at Goa & Uttarakhand. These plants produce Electrical & Telecommunication cables, LT & HT Power & Control Cables, Electrical Switches, Compact Fluorescent Lamps (CFL's), PVC Sheets & Copper Rods. Rest of the products are outsourced. Exhibit 58: Plant-wise capacity
(km) Capacity Electrical cables Pimpri, Roorkee Electrical & Communication cables Urse, Goa Optic fibre and Optic fibre cables Urse, Goa Lighting Urse Switches Urse Power cables Urse CCC rods Goa
Source: Company, YES Sec - Research
Exhibit 59: Key management Team Name Designation Mr. D.K.Chhabria Executive Chairman Mr.Mahesh Viswanathan Executive Director & CFO Mr. Sanjay K. Asher Independent Director Mr. Pradeep R.Rathi Independent Director Mr. Shishir Lall Independent Director Ms. Shruti Udeshi Non-Executive Director Mr. Pratap Pawar Independent Director Ms. Poornima K Prabhu Independent Director Mr. Mohan Lal Jain Additional Non-Executive Director
Source: Company, YES Sec - Research Exhibit 60: JV and Associate
Company JV's/associate Ownership (%) Finolex Industries Associate 32.4 Finolex J-Power Systems Pvt. Ltd. JV 49.0 Corning Finolex Optical Fibre Pvt Ltd. JV 50.0
Source: Company, YES Sec - Research
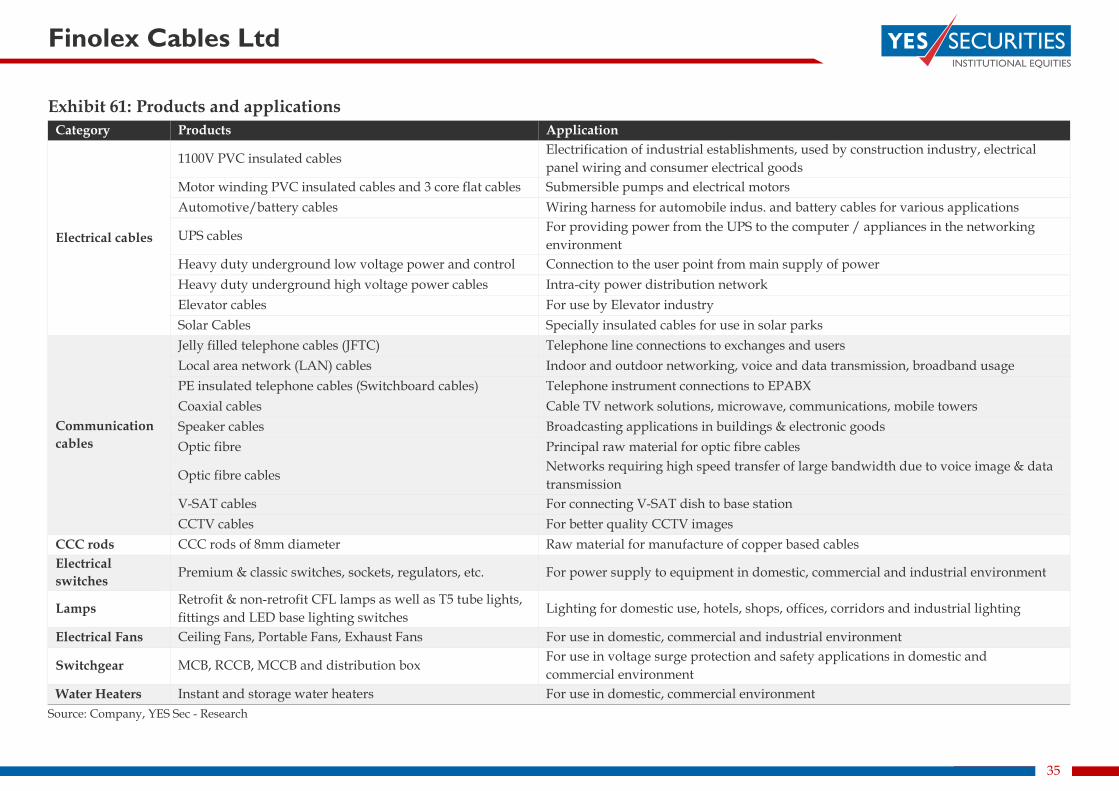
Finolex Cables Ltd
35
Exhibit 61: Products and applications Category Products Application
Electrical cables
1100V PVC insulated cables Electrification of industrial establishments, used by construction industry, electrical panel wiring and consumer electrical goods
Motor winding PVC insulated cables and 3 core flat cables Submersible pumps and electrical motors Automotive/battery cables Wiring harness for automobile indus. and battery cables for various applications
UPS cables For providing power from the UPS to the computer / appliances in the networking environment
Heavy duty underground low voltage power and control Connection to the user point from main supply of power Heavy duty underground high voltage power cables Intra-city power distribution network Elevator cables For use by Elevator industry Solar Cables Specially insulated cables for use in solar parks
Communication cables
Jelly filled telephone cables (JFTC) Telephone line connections to exchanges and users Local area network (LAN) cables Indoor and outdoor networking, voice and data transmission, broadband usage PE insulated telephone cables (Switchboard cables) Telephone instrument connections to EPABX Coaxial cables Cable TV network solutions, microwave, communications, mobile towers Speaker cables Broadcasting applications in buildings & electronic goods Optic fibre Principal raw material for optic fibre cables
Optic fibre cables Networks requiring high speed transfer of large bandwidth due to voice image & data transmission
V-SAT cables For connecting V-SAT dish to base station CCTV cables For better quality CCTV images
CCC rods CCC rods of 8mm diameter Raw material for manufacture of copper based cables Electrical switches Premium & classic switches, sockets, regulators, etc. For power supply to equipment in domestic, commercial and industrial environment
Lamps Retrofit & non-retrofit CFL lamps as well as T5 tube lights, fittings and LED base lighting switches
Lighting for domestic use, hotels, shops, offices, corridors and industrial lighting
Electrical Fans Ceiling Fans, Portable Fans, Exhaust Fans For use in domestic, commercial and industrial environment
Switchgear MCB, RCCB, MCCB and distribution box For use in voltage surge protection and safety applications in domestic and commercial environment
Water Heaters Instant and storage water heaters For use in domestic, commercial environment Source: Company, YES Sec - Research
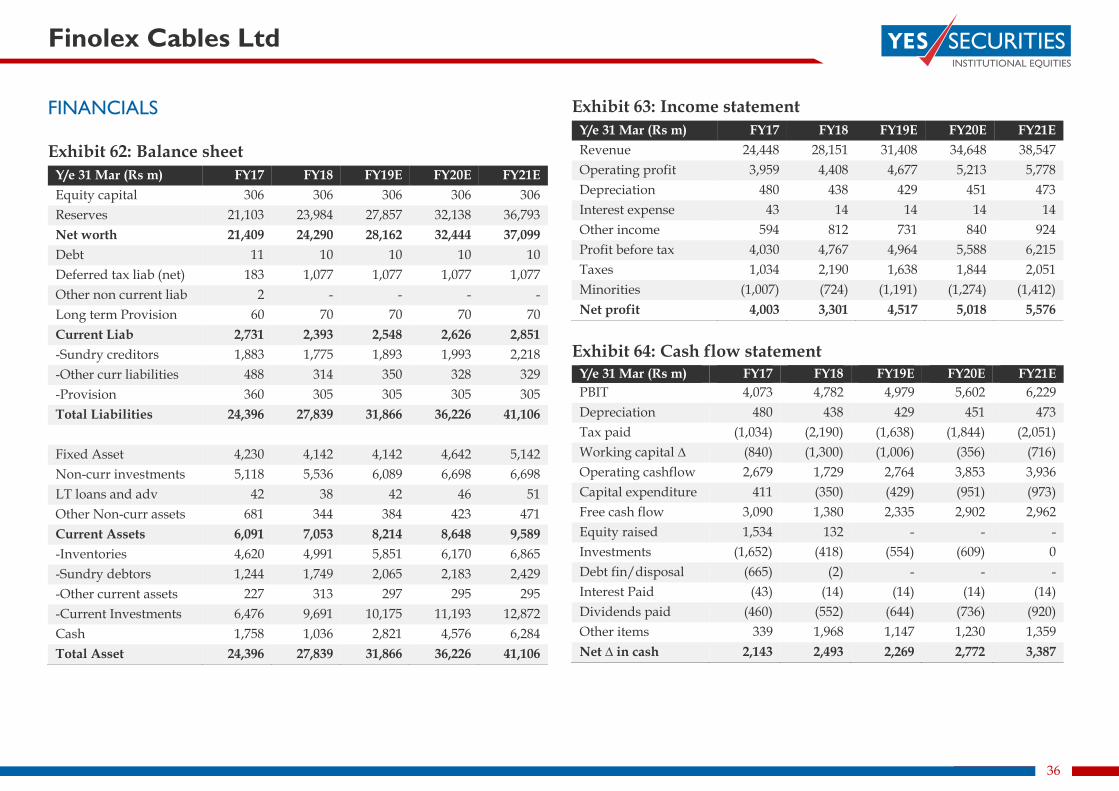
Finolex Cables Ltd
36
FINANCIALS Exhibit 62: Balance sheet
Y/e 31 Mar (Rs m) FY17 FY18 FY19E FY20E FY21E Equity capital 306 306 306 306 306 Reserves 21,103 23,984 27,857 32,138 36,793 Net worth 21,409 24,290 28,162 32,444 37,099 Debt 11 10 10 10 10 Deferred tax liab (net) 183 1,077 1,077 1,077 1,077 Other non current liab 2 - - - - Long term Provision 60 70 70 70 70 Current Liab 2,731 2,393 2,548 2,626 2,851 -Sundry creditors 1,883 1,775 1,893 1,993 2,218 -Other curr liabilities 488 314 350 328 329 -Provision 360 305 305 305 305 Total Liabilities 24,396 27,839 31,866 36,226 41,106
Fixed Asset 4,230 4,142 4,142 4,642 5,142 Non-curr investments 5,118 5,536 6,089 6,698 6,698 LT loans and adv 42 38 42 46 51 Other Non-curr assets 681 344 384 423 471 Current Assets 6,091 7,053 8,214 8,648 9,589 -Inventories 4,620 4,991 5,851 6,170 6,865 -Sundry debtors 1,244 1,749 2,065 2,183 2,429 -Other current assets 227 313 297 295 295 -Current Investments 6,476 9,691 10,175 11,193 12,872 Cash 1,758 1,036 2,821 4,576 6,284 Total Asset 24,396 27,839 31,866 36,226 41,106
Exhibit 63: Income statement Y/e 31 Mar (Rs m) FY17 FY18 FY19E FY20E FY21E Revenue 24,448 28,151 31,408 34,648 38,547 Operating profit 3,959 4,408 4,677 5,213 5,778 Depreciation 480 438 429 451 473 Interest expense 43 14 14 14 14 Other income 594 812 731 840 924 Profit before tax 4,030 4,767 4,964 5,588 6,215 Taxes 1,034 2,190 1,638 1,844 2,051 Minorities (1,007) (724) (1,191) (1,274) (1,412) Net profit 4,003 3,301 4,517 5,018 5,576
Exhibit 64: Cash flow statement
Y/e 31 Mar (Rs m) FY17 FY18 FY19E FY20E FY21E PBIT 4,073 4,782 4,979 5,602 6,229 Depreciation 480 438 429 451 473 Tax paid (1,034) (2,190) (1,638) (1,844) (2,051) Working capital ∆ (840) (1,300) (1,006) (356) (716) Operating cashflow 2,679 1,729 2,764 3,853 3,936 Capital expenditure 411 (350) (429) (951) (973) Free cash flow 3,090 1,380 2,335 2,902 2,962 Equity raised 1,534 132 - - - Investments (1,652) (418) (554) (609) 0 Debt fin/disposal (665) (2) - - - Interest Paid (43) (14) (14) (14) (14) Dividends paid (460) (552) (644) (736) (920) Other items 339 1,968 1,147 1,230 1,359 Net ∆ in cash 2,143 2,493 2,269 2,772 3,387
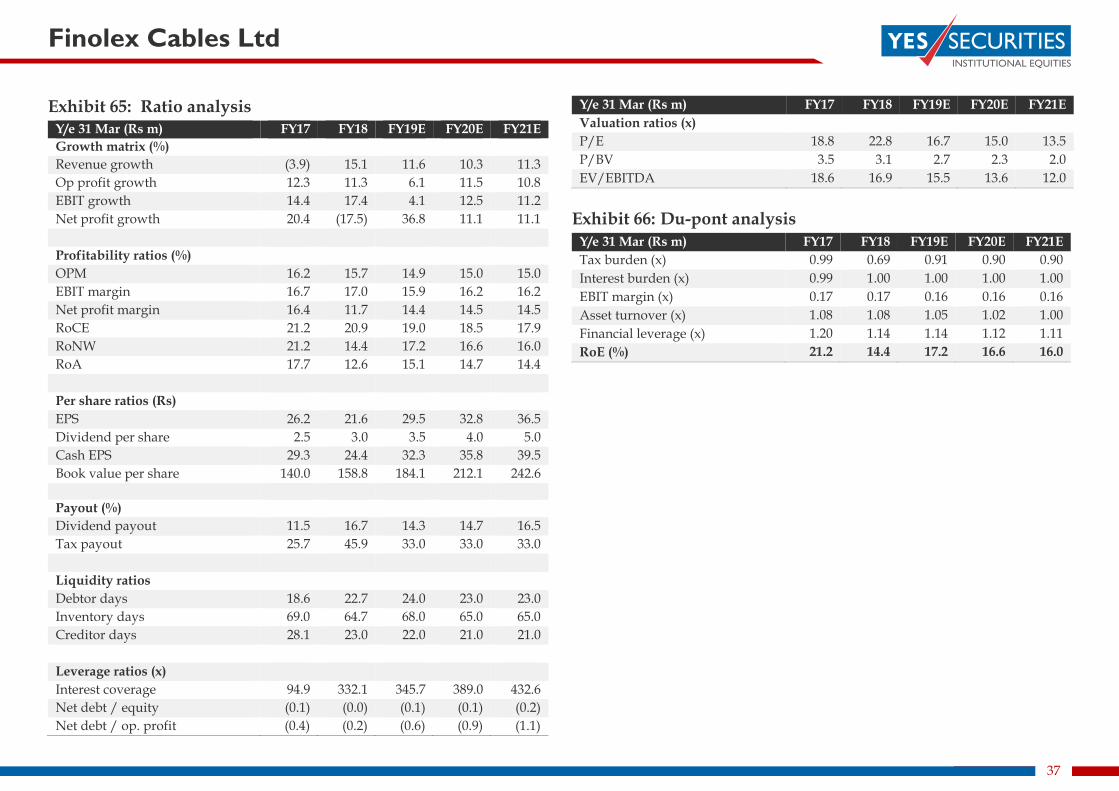
Finolex Cables Ltd
37
Exhibit 65: Ratio analysis Y/e 31 Mar (Rs m) FY17 FY18 FY19E FY20E FY21E Growth matrix (%) Revenue growth (3.9) 15.1 11.6 10.3 11.3 Op profit growth 12.3 11.3 6.1 11.5 10.8 EBIT growth 14.4 17.4 4.1 12.5 11.2 Net profit growth 20.4 (17.5) 36.8 11.1 11.1 Profitability ratios (%) OPM 16.2 15.7 14.9 15.0 15.0 EBIT margin 16.7 17.0 15.9 16.2 16.2 Net profit margin 16.4 11.7 14.4 14.5 14.5 RoCE 21.2 20.9 19.0 18.5 17.9 RoNW 21.2 14.4 17.2 16.6 16.0 RoA 17.7 12.6 15.1 14.7 14.4 Per share ratios (Rs) EPS 26.2 21.6 29.5 32.8 36.5 Dividend per share 2.5 3.0 3.5 4.0 5.0 Cash EPS 29.3 24.4 32.3 35.8 39.5 Book value per share 140.0 158.8 184.1 212.1 242.6 Payout (%) Dividend payout 11.5 16.7 14.3 14.7 16.5 Tax payout 25.7 45.9 33.0 33.0 33.0 Liquidity ratios Debtor days 18.6 22.7 24.0 23.0 23.0 Inventory days 69.0 64.7 68.0 65.0 65.0 Creditor days 28.1 23.0 22.0 21.0 21.0 Leverage ratios (x) Interest coverage 94.9 332.1 345.7 389.0 432.6 Net debt / equity (0.1) (0.0) (0.1) (0.1) (0.2) Net debt / op. profit (0.4) (0.2) (0.6) (0.9) (1.1)
Y/e 31 Mar (Rs m) FY17 FY18 FY19E FY20E FY21E Valuation ratios (x) P/E 18.8 22.8 16.7 15.0 13.5 P/BV 3.5 3.1 2.7 2.3 2.0 EV/EBITDA 18.6 16.9 15.5 13.6 12.0
Exhibit 66: Du-pont analysis
Y/e 31 Mar (Rs m) FY17 FY18 FY19E FY20E FY21E Tax burden (x) 0.99 0.69 0.91 0.90 0.90 Interest burden (x) 0.99 1.00 1.00 1.00 1.00 EBIT margin (x) 0.17 0.17 0.16 0.16 0.16 Asset turnover (x) 1.08 1.08 1.05 1.02 1.00 Financial leverage (x) 1.20 1.14 1.14 1.12 1.11 RoE (%) 21.2 14.4 17.2 16.6 16.0
38
RECOMMENDATION PARAMETERS FOR FUNDAMENTAL REPORTS Analysts assign ratings to the stocks according to the expected upside/downside relative to the current market price and the estimated target price. Depending on the expected returns, the recommendations are categorized as mentioned below. The performance horizon is 12 to 18 months unless specified and the target price is defined as the analysts’ valuation for a stock. No benchmark is applicable to the ratings mentioned in this report.
BUY > 15%
ADD 5% to 15%
HOLD -15% to +5%
SELL > - 15%
NOT RATED
UNDER REVIEW
POSITIVE: Positive is rating given to stocks we like but yet to be formally included in our coverage universe.
NEGATIVE: Negative is rating given to stocks yet to be formally included in our coverage universe, but we find valuations expensive vis-a-vis fundamentals.
NEUTRAL: Neutral rating is given to stocks that are not under our formal coverage yet, but we find current valuation fairly representing fundamentals.
ABOUT YES SECURITIES (INDIA) LIMITED YES SECURITIES (INDIA) LIMITED (‘‘YSL’’) was incorporated on 14th March 2013 as a wholly owned subsidiary of YES BANK LIMITED. YSL does not have any other associates. YSL is a SEBI registered stock broker holding membership of NSE and BSE. YSL is also a SEBI registered Category I Merchant Banker, Investment Adviser and a Research Analyst. YSL offers, inter alia, trading/investment in equity and other financial products along with various value added services. We hereby declare that there are no disciplinary actions taken against YSL by SEBI/Stock Exchanges.
26
DISCLAIMER Investments in securities market are subject to market risks, read all the related documents carefully before investing.
The information and opinions in this report have been prepared by YSL and are subject to change without any notice. The report and information contained herein are strictly confidential and meant solely for the intended recipient and may not be altered in any way, transmitted to, copied or redistributed, in part or in whole, to any other person or to the media or reproduced in any form, without prior written consent of YSL.
The information and opinions contained in the research report have been compiled or arrived at from sources believed to be reliable and have not been independently verified and no guarantee, representation of warranty, express or implied, is made as to their accuracy, completeness, authenticity or validity. No information or opinions expressed constitute an offer, or an invitation to make an offer, to buy or sell any securities or any derivative instruments related to such securities. Investments in securities are subject to market risk. The value and return on investment may vary because of changes in interest rates, foreign exchange rates or any other reason. Investors should note that each security's price or value may rise or fall and, accordingly, investors may even receive amounts which are less than originally invested. The investor is advised to take into consideration all risk factors including their own financial condition, suitability to risk return profile and the like, and take independent professional and/or tax advice before investing. Opinions expressed are our current opinions as of the date appearing on this report. Investor should understand that statements regarding future prospects may not materialize and are of general nature which may not be specifically suitable to any particular investor. Past performance may not necessarily be an indicator of future performance. Actual results may differ materially from those set forth in projections.
Technical Analysis reports focus on studying the price movement and trading turnover charts of securities or its derivatives, as opposed to focussing on a company’s fundamentals and opinions, as such, may not match with reports published on a company’s fundamentals.
YSL, its research analysts, directors, officers, employees and associates accept no liabilities for any loss or damage of any kind arising out of the use of this report. This report is not directed or intended for distribution to, or use by, any person or entity who is a citizen or resident of or located in any locality, state, country or other jurisdiction, where such distribution, publication, availability or use would be contrary to law, regulation or which would subject YSL and associates to any registration or licensing requirement within such jurisdiction. The securities described herein may or may not be eligible for sale in all jurisdictions or to certain category of investors. Persons in whose possession this document may come are required to inform themselves of and to observe such restriction.
DISCLOSURE OF INTEREST Name of the Research Analyst : Tarang Bhanushali, Rahul Jain
The analyst hereby certifies that opinion expressed in this research report accurately reflect his or her personal opinion about the subject securities and no part of his or her compensation was, is or will be directly or indirectly related to the specific recommendation and opinion expressed in this research report.
Sr. No. Particulars Yes/No
1 Research Analyst or his/her relative’s financial interest in the subject company(ies)
No
2 Research Analyst or his/her relative or YSL’s actual/beneficial ownership of 1% or more securities of the subject company(ies) at the end of the month immediately preceding the date of publication of the Research Report
No
3 Research Analyst or his/her relative or YSL has any other material conflict of interest at the time of publication of the Research Report
No
4 Research Analyst has served as an officer, director or employee of the subject company(ies)
No
5 YSL has received compensation or other benefits from the subject company(ies) or third party in connection with this research report
No
6 Broking/Investment Banking/Merchant Banking relationship with the subject company at the time of publication of Research Report
No
7 YSL has managed or co-managed public offering of securities for the subject company in the past twelve months
No
8 Research Analyst or YSL has been engaged in market making activity for the subject company(ies)
No
Since YSL and its associates are engaged in various businesses in the financial services industry, they may have financial interest or may have received compensation for investment banking or merchant banking or brokerage services or for any other product or services of whatsoever nature from the subject company(ies) in the past twelve months or associates of YSL may have managed or co-managed public offering of securities in the past twelve months of the subject company(ies) whose securities are discussed herein.
Associates of YSL may have actual/beneficial ownership of 1% or more and/or other material conflict of interest in the securities discussed herein.
YES SECURITIES (INDIA) LIMITED Registered Office: Unit No. 602 A, 6th Floor, Tower 1 & 2, Indiabulls Finance Centre,
Senapati Bapat Marg, Elphinstone Road, Mumbai – 400013, Maharashtra, India. Tel: +91-22-71123123 | Email: [email protected] | Website: www.yesinvest.in
CIN: U74992MH2013PLC240971 | SEBI Single Registration No.: NSE, BSE & MCX: INZ000185632 | MERCHANT BANKER: INM000012227 | RESEARCH ANALYST:
INH000002376 |INVESTMENT ADVISER: INA000007331| AMFI ARN Code – 94338 | Details of Compliance Officer: Name: Vaibhav Purohit,
Email id: [email protected], Contact No-+91-22-33479208


![ESCC 3902/003 (Wires and Cables), [ARCHIVED] - ESCIES](https://static.fdokumen.com/doc/165x107/63281d0c6d480576770d9bd9/escc-3902003-wires-and-cables-archived-escies.jpg)