Nuvoco Vistas Corporation Ltd. - Ventura Securities
32
1 | Page (03 rd Nov 21) For any further query, please email us on [email protected] Nuvoco Vistas Corporation Ltd. Fifth largest cement player with multiple triggers for value unlocking
-
Upload
khangminh22 -
Category
Documents
-
view
0 -
download
0
Transcript of Nuvoco Vistas Corporation Ltd. - Ventura Securities

1 | P a g e ( 0 3 r d N o v 2 1 )
For any further query, please email us on [email protected]
TABLE OF CONTENTS
Nuvoco Vistas Corporation Ltd.
Fifth largest cement player with multiple triggers for value
unlocking

2 | P a g e ( 0 3 r d N o v 2 0 2 1 )
For any further query, please email us on [email protected]
TABLE OF CONTENTS
Summary 3
Valuation and Peer Comparison 4
Financial Analysis & Projections 7
Journey and Plant Location with Capacity 8
Key Growth Drivers 9
Industry wide growth opportunity 9
Leadership position especially in east India region 11
Strategically located cement production facilities 18
Business Quality Score 23
Annual Report Takeaways 24
Key Management Personnel 26
Risk & Concerns 26
Quarterly Financials 29
Summary of Management Commentary on Quarterly Performance 30
Financial Statement Analysis & Projections 31
Disclaimer 32

3 | P a g e ( 0 3 r d N o v 2 0 2 1 )
For any further query, please email us on [email protected]
Nuvoco Vistas Corp. Ltd. (Nuvoco) promoted by Dr. Karsanbhai K. Patel (Nirma
Group) is one of the largest cement company and concrete manufacturers in East
India. Over FY14-21 Nuvoco has aggressively expanded capacity at 15% CAGR to 22.32
MMTPA (primarily through acquisitions of Lafarge in 2016 and Emami in FY21) to
emerge as the 5th largest cement company in India.
Being primarily located in East India (75% capacity) and the North, Nuvoco is well
placed to benefit from the cement demand due to higher infrastructural growth, rural
housing aided by PMAY-G, and increasing budgetary allocations for various
government schemes. We forecast average utilization levels to remain over 80%+
leading to a revenue growth of 17.1% CAGR to INR 12,039.3 crore (volume CAGR of
11.9% to 23.75 MTPA, average realization CAGR of 5% to INR 5069/ton) over the
period FY21-24.
Coupled with the higher utilizations and significant cost rationalization initiatives (like
reworking logistics and focusing on captive power) EBIDTA/tonne is expected to be
enhanced by ~INR 250 by FY23. With the implementation of these measure, we
believe Nuvoco would be better placed (than peers) to tide over the headwinds of
input cost inflation. In addition, the paring of debt from the IPO proceeds has
significantly helped in deleveraging the balance sheet.
At the CMP of INR 549.2, Nuvoco is valued at $105.2 FY24E EV/T. This is at a significant
discount to that of its peers operating in the eastern geography. We believe that the
valuation discount is unjustified and expect the stock to get re-rated once the market
starts taking cognizance of (i) the size of its operations (5th largest cement company
in India) (ii) operating leverage from the high utilization levels and cost saving
initiatives, and (iii) de-levered balance sheet.
We initiate coverage with a BUY for a 24-month price target of INR 680 (8.9x
FY24EV/ EBIDTA, $130 FY24E EV/T), representing an upside of 24.2% from the CMP
of INR 547.3.
Key Financial Data (INR Cr, unless specified)
Revenue EBITDA
Net Profit
EBITDA (%)
Net Profit
(%) EPS (₹)
BVPS (₹)
RoE (%)
RoIC (%)
P/E (X) P/BV
(X)
EV/ EBITDA
(X)
FY20 6,793.2 1,297.1 249.3 19.1 3.7 7.9 167.5 4.7 5.6 69.4 3.3 17.5
FY21 7,488.8 1,460.5 (25.9) 19.5 (0.3) (0.8) 232.4 (0.4) (3.6) (667.6) 2.4 16.9
FY22E 8,975.2 1,682.6 209.7 18.7 2.3 5.9 252.9 2.3 4.7 93.5 2.2 13.5
FY23E 10,784.6 2,371.4 769.0 22.0 7.1 21.5 274.5 7.8 8.6 25.5 2.0 9.1
FY24E 12,039.3 2,727.2 1,109.9 22.7 9.2 31.1 303.0 10.3 10.8 17.7 1.8 7.2
BUY @ CMP INR 547 Target: INR 680 in 24 months Upside Potential: 24%
Fifth largest cement player with multiple triggers for value unlocking
Industry Cement
Scrip Details
Face Value (INR) 10.0
Market Cap (INR Cr) 19,547
Price (INR) 547.3
No of Shares O/S (Cr) 35.7
3M Avg Vol (000) 104
52W High/Low (INR) 578/471
Dividend Yield (%) 0
Shareholding (%) Sept 2021
Promoter 71.03
Institution 23.66
Public 5.31
TOTAL 100.0
Price Chart
52000
54000
56000
58000
60000
62000
64000
460
480
500
520
540
560
580A
ug, 2
1
Sep
, 21
Oct
, 21
Nuvoco (LHS) SENSEX (RHS)
Nuvoco Vistas Corporation Ltd.

4 | P a g e ( 0 3 r d N o v 2 1 )
For any further query, please email us on [email protected]
Valuation and Comparable Metric of Domestic and Global Cement Manufacturing Companies
Source: Ventura Research & Bloomberg
PEG
Company Name Mkt Cap Price 2024 2022 2023 2024 2022 2023 2024 2022 2023 2024 2022 2023 2024 2022 2023 2024 2022 2023 2024 2022 2023 2024
(fig in INR Crores)
Nuvoco Vistas 19,613 549.2 0.3 89.7 24.5 16.9 13.0 8.8 6.9 2.3 7.8 10.3 5.3 9.4 12.3 8,975 10,785 12,039 18.7 22.0 22.7 2.3 7.1 9.2
Ultratech Cement 2,22,784 7,709.7 1.0 31.7 26.4 22.3 17.1 14.9 12.4 14.0 14.8 15.3 20.1 21.5 25.2 53,026 58,995 63,552 25.0 25.4 27.0 13.2 14.3 15.7
Dalmia Bharat 37,863 2,023.5 1.5 32.5 26.0 21.0 13.2 11.3 9.8 8.5 9.7 10.7 11.0 12.6 14.3 12,175 14,022 15,783 24.6 24.9 25.2 9.6 10.4 11.4
Shree Cement 1,04,446 28,948.0 1.6 38.9 33.3 28.0 23.3 20.3 15.0 15.1 15.2 15.3 17.4 17.8 53.2 15,945 18,252 20,375 28.1 28.2 28.8 16.9 17.2 18.3
ACC 45,003 2,396.5 2.6 20.6 18.4 18.2 11.0 9.4 NA 13.6 13.6 13.1 30.7 34.4 NA 18,187 19,742 21,236 18.9 19.3 19.5 12.0 12.4 11.7
Ambuja Cement 81,014 408.0 1.5 22.1 20.5 17.8 9.0 7.7 6.3 12.9 12.4 12.5 43.3 48.5 32.4 33,399 36,069 39,638 22.2 22.6 23.4 11.0 11.0 11.5
Star Cement 4,126 100.0 1.5 14.2 10.7 NA 9.0 7.3 NA 14.7 17.3 NA NA NA NA 2,173 2,487 NA 20.6 22.2 NA 14.8 17.1 NA
Net Margin (%)P/E (x) EV/EBIDTA (x) RoE (%) RoIC (%) Sales EBITDA Margin (%)
Company North West South East Central
ACC 18 12 31 23 17
Ambuja Cement 41 28 0 24 7
Birla Corp 21 29 0 15 35
Dalmia Bharat 0 10 40 51 0
Nuvoco 22 0 0 78 0
Shree Cement 61 0 7 32 0
Star Cement 0 0 0 100 0
The Ramco Cement 0 0 84 16 0
Ultratech Cement 21 25 18 14 21
Regions wise capacity share (%)
For any further query, please email us on [email protected]

5 | P a g e ( 0 3 r d N o v 2 1 )
For any further query, please email us on [email protected]
More than 20% ROIC and significant room for margin expansion are potential re-rating factors
Source: Ventura Research, ACE Equity & Bloomberg
Ultratech Cement
Dalmia Bharat
Shree Cement
Ambuja Cement
10.0
15.0
20.0
25.0
30.0
35.0
40.0
45.0
50.0
55.0
60.0
6.0 7.0 8.0 9.0 10.0 11.0 12.0 13.0 14.0 15.0 16.0
FY24
Ro
IC (
%)
FY24 EV/EBIDTA (x)
Nuvoco Vistas
Ultratech Cement
Dalmia Bharat
Shree Cement
ACCAmbuja Cement
5
7
9
11
13
15
17
19
21
18 20 22 24 26 28 30 32
FY24
Re
ven
ue
CA
GR
(%
)
FY24 EBIDTA Margin (%)

6 | P a g e ( 0 3 r d N o v 2 0 2 1 )
For any further query, please email us on [email protected]
Our Bull and Bear Case Scenarios
We have prepared a Bull and Bear case scenario based on Nuvoco’s FY24 sales, EBIDTA, and
EV/EBIDTA.
• Bull Case: We have assumed Rs.12,039.3 cr of sales in FY24E (CAGR of 17.1%), EBIDTA
Margin of 22.7%, along with the marginal re-rating to 9.7X FY24E EV/EBITDA, which
will result in a Bull Case price target of INR 740 per share (upside of 35.2% from CMP).
• Bear Case: We have assumed Rs.10,521.3 cr of sales in FY24 (CAGR of 12.0%), EBIDTA
Margin of 20.7% along with 7.7X FY24E EV/EBITDA, which will result in a Bear Case
price target of INR 472 per share (downside of 13.8% from CMP).
Bull & Bear Case Scenario
Bull Case Price
INR 740 per share
Target Price
INR 680 per share
Bear Case Price
INR 472 per share
Current Price
INR 547.3 per share
Sales of Rs.12,039.3 cr in FY24 (CAGR
of 17.1%) and 9.7x FY24E EV/EBIDTA.
Sales of Rs.10,521.3 cr in FY24 (CAGR
of 12.0%) and 7.7x FY24E EV/EBIDTA.

7 | P a g e ( 0 3 r d N o v 2 0 2 1 )
For any further query, please email us on [email protected]
Financial Analysis and Projections
With all the key drivers in place, we expect Nuvoco’s sales volumes and revenues to grow at a
CAGR of 11.9% to 23.75 MTPA and 17.1% to INR 12,039.3 cr over FY21-24E respectively.
Premium product launches, cost rationalization and the captive power generation will help to
improve profitability. EBITDA is estimated to grow at a CAGR of 23.1% to INR 2,727.2 cr, while
EBITDA/T is expected to improve to INR 1,148/T by FY24E. The company aims to be net debt-
free by FY25, which would lead to faster growth in PAT (from the loss of INR 25.9 cr to a profit
of INR 1,109.9 cr by FY24E). Subsequently, RoE and RoIC are expected to improve to 10.3%
(+1061bps) and 12.3% (+1619bps), respectively, by FY24E.
Nuvoco’s Financial Summary
Source: Company Reports & Ventura Research
Figures in INR Crores FY19 FY20 FY21 FY22E FY23E FY24E
Sales Volume (MTPA) 15.8 14.6 17.0 18.7 21.7 23.8
YoY Growth (%) (7.5) 15.9 10.2 16.1 9.4
Capacity Utilization (%) 93.1 90.3 77.6 78.5 86.7 94.9
NSR (Rs./T) 4,457.0 4,639.4 4,412.9 4,801.2 4,969.2 5,068.6
Revenue 7,052.1 6,793.2 7,488.8 8,975.2 10,784.6 12,039.3
YoY Growth (%) (3.7) 10.2 19.8 20.2 11.6
Raw Material cost 1,444.7 1,230.0 1,206.8 1,265.5 1,553.0 1,793.9
Raw Material cost (Rs./T) 913.0 840.0 711.1 677.0 715.6 755.2
Power & Fuel 1,374.1 1,225.6 1,356.3 1,903.8 1,945.0 1,915.8
Power & Fuel cost (Rs./T) 868.5 837.0 799.2 1,018.4 896.2 806.6
Freight and forwarding charges 1,983.2 1,776.1 2,029.4 2,463.7 2,933.4 3,310.8
Freight and forwarding cost (Rs./T) 1,564.0 1,407.4 1,172.2 1,317.9 1,351.6 1,393.9
Employee Cost 381.1 404.6 482.0 573.6 676.9 798.7
Employee Cost (Rs./T) 240.9 276.3 284.0 306.9 311.9 336.3
Other Expenses 951.3 859.7 953.8 1,086.0 1,304.9 1,492.9
Other Expenses (Rs./T) 601.2 587.1 562.0 580.9 601.3 628.5
EBIDTA 917.7 1,297.1 1,460.5 1,682.6 2,371.4 2,727.2
EBIDTA Margin (%) 13.0 19.1 19.5 18.7 22.0 22.7
EBIDTA (Rs./T) 580.0 885.9 860.6 900.1 1,092.7 1,148.2
PAT (26.5) 249.3 (25.9) 209.7 769.0 1,109.9
PAT Margin (%) (0.4) 3.7 (0.3) 2.3 7.1 9.2
PAT (Rs./T) (16.7) 170.2 (15.3) 112.2 354.3 467.3
Net Worth 4,988.3 5,279.3 7,323.7 9,033.4 9,802.4 10,823.0
Return on Equity (%) (0.5) 4.7 (0.4) 2.3 7.8 10.3
Invested Capital 7,783.4 8,410.5 12,320.4 12,110.0 11,852.2 10,942.6
Return on Invested Capital (%) (8.6) 5.9 (3.8) 5.3 9.4 12.3
Cash Flow from Operations 860.1 1,024.8 1,717.4 1,428.0 2,316.7 2,862.3
Cash Flow from Investing (148.6) (310.1) (2,924.1) (447.3) (883.5) (553.7)
Cash Flow from Financing (646.8) (559.1) 1,419.7 (473.2) (1,823.2) (1,940.2)
Net Cash Flow 64.7 155.6 213.0 507.5 (390.1) 368.5
Free Cash Flow 279.3 455.3 1,165.7 901.0 1,716.7 2,762.3
YoY Growth (%) 63.0 156.0 (22.7) 90.5 60.9
Total Debt 3,375.4 3,642.1 5,908.7 4,538.2 3,214.2 1,716.9
Net Debt 2,795.1 3,131.2 4,996.7 3,076.6 2,049.8 119.6
Net Debt to Equity (x) 0.6 0.6 0.7 0.3 0.2 0.0
Net Debt to EBITDA (x) 3.0 2.4 3.4 1.8 0.9 0.0

8 | P a g e ( 0 3 r d N o v 2 0 2 1 )
For any further query, please email us on [email protected]
Journey of the company
Source: RHP, Company Reports & Ventura Research
Plant locations and capacity
Capacity (MTPA)
Region/States FY19 FY20 FY21 FY22E FY23E
East India Production 8.7 9.1 17.4 18.9 20.1
Arasmeta 1.9 1.9 1.9 1.9 1.9
Sonadih 0.6 0.6 0.7 0.7 0.7
Jojobera 4.6 5.0 5.0 6.5 6.5
Mejia 1.7 1.7 1.7 1.7 1.7
Risda 0.0 0.0 3.0 3.0 3.0
Panagarh 0.0 0.0 2.5 2.5 2.5
Bhabua 0.0 0.0 0.8 0.8 2.0
Jajpur 0.0 0.0 2.0 2.0 2.0
North India Production 4.9 4.9 4.9 4.9 4.9
Chittorgarh 2.1 2.1 2.1 2.1 2.1
Nimbol 2.3 2.3 2.3 2.3 2.3
Bhiwani 0.5 0.5 0.5 0.5 0.5
Total Cement capacity 13.6 14.0 22.3 23.8 25.0
Source: Company Reports & Ventura Research
Year Events
1999Commencement of operations in India with acquisition of cement business of Tata Iron & Steel Company Ltd. in Jharkhand
incuding Jojobera and Sonadih Cement Plants.
2000 Acquisition of the cement business of Raymond Ltd, Chhattisgarh including the Arasmeta Cement Plant.
2008 Acquisition of ready-mix concrete business of Larsen & Toubro Limited.
2009 Commissioning of the Mejia grinding unit in West Bengal. Commissioning of a new clicnker line at the Sonadih Cement Plant.
2012 Inauguration of Construction Development and Innovation Centre (CDIC) in Mumbai.
2013 Commissioning of operations at Chittorgarh Cement Plant, Rajasthan.
2014Nirma Group entered the cement business through a greenfield cement plant in Nimbol. Commissioning of operations at
Bhiwani Cement Plant, Haryana.
2016 Acquisition of all Equity shares held by Lafarge to Nirchem Cement Limited (erstwhile wholly-owned subsidiary of Nirma Ltd.).
2017 Amalgamation of Nirchem Cement Limited with Nuvoco Vistas Corp. Ltd.
2019 Commissioning of first Captive Power Plant and Waste Heat Recovery in Chittorgarh Cement Plant
2020Amalgamation with Nimbol Cement Plant, Rajasthan of Nirma Ltd. Acquisition of NU Vista Limited (formerly Emami Cement Ltd.)
as a wholly-owned subsidiary

9 | P a g e ( 0 3 r d N o v 2 0 2 1 )
For any further query, please email us on [email protected]
Key Growth Drivers
Industry-wide growth opportunity
India is the second largest cement producer in the world. The Indian cement industry is a vital
part of its economy and provides employment, directly or indirectly, to more than a million
people. According to the Budget of FY22, the Indian Cement Industry has an installed capacity
of approximately 545 million tonnes comprising over 250 large cement plants. The share of the
top 5 players in the industry has grown to ~50.5% led by consolidation and higher organic
growth by large players. Driven by its foray into value-added products such as RMC and white
cement, the industry has diversified a little.
Sectoral Mix and growth
Source: RHP, Company Reports & Ventura Research
6223
15
63
27
10
Sectoral Mix (%)
Housing Infrastructure Commercial & Industrial
FY21
FY26E 5.5
7.55.0
6.0
8.5
8.5
8.0
7.0
Demand growth segmentation (%)
Housing Infrastructure Commercial & Industrial Overall
FY21
FY26E

10 | P a g e ( 0 3 r d N o v 2 0 2 1 )
For any further query, please email us on [email protected]
Regional Capacity Breakup
23
23
16
9
7
22
Northern region capacity breakup (%)
Ultratech Cement Shree Cement Lafarge Holcim
JK Cement JK Lakshmi Rest
17
16
1615
11
26
Eastern region capacity breakup (%)
Nuvoco Lafarge Holcim Dalmia Bharat
Ultratech Cement Shree Cement Rest
41
21
63
3
26
Western region capacity breakup (%)
Ultratech Cement Lafarge Holcim Sanghi Industries
JK Lakshmi JSW Cement Rest11
9
7
7
7
59
Southern region capacity breakup (%)
Ultratech Cement Ramco Chettinad
India Cement Dalmia Bharat Rest
34
1312
10
9
22
Central region capacity breakup (%)
Ultratech Cement Birla Corporation Jaypee Group
Prism Cement Lafarge Holcim Rest

11 | P a g e ( 0 3 r d N o v 2 0 2 1 )
For any further query, please email us on [email protected]
State-wise cement demand State-wise cement capacity Zone FY21E FY26E CAGR (%) Zone FY21E FY26E CAGR (%) Jharkhand East 9.1 14.5 10 Bihar East 9.0 15.5 11 Odisha East 14.5 23.0 10 Odisha East 20.0 34.0 11 Bihar East 17.5 26.5 9 West Bengal East 27.5 35.0 5 West Bengal East 21.5 31.0 8 Jharkhand East 15.5 18.5 4 Chhattisgarh East 9.8 13.5 7 Punjab North 5.5 6.5 3 Gujarat West 23.0 30.5 6 Chhattisgarh East 26.5 30.5 3 Rajasthan North 22.8 30.0 6 Rajasthan North 79.0 90.5 3 Punjab North 9.1 10.5 3 Gujarat West 35.0 37.0 1
Source: RHP, Company Reports & Ventura Research
In order to develop the country's infrastructure, the Indian government has undertaken several
projects related to the construction of roads and highways, both in the rural and urban areas,
along with the development of industrial hubs in different parts of the country. These schemes
and initiatives are together expected to drive the growth of the Indian cement industry, since
it is one of the primary materials for the successful execution of such projects.
The Pradhan Mantri Awas Yojana aims to provide affordable housing for all by 2022 in over
4000 towns across India. This is likely to provide the necessary push to the affordable housing
segment and boost the growth of the construction sector, which would lead to an increase in
demand for cement, hence helping it grow further. In the Union Budget FY 2021-22, the
Government of India has extended benefits, under Section 80-IBA of the Income Tax Act, until
March 31, 2022, to promote affordable rental housing in India.
The allocation of INR. 13,750 crores and INR. 12,294 cr for Urban Rejuvenation Mission:
AMRUT and the Smart Cities Mission and Swachh Bharat Mission, respectively and Rs. 27,500
cr in the Union Budget under Pradhan Mantri Awas Yojana.
Leadership position especially in east India region
The company is the largest cement manufacturer in East India and the fifth largest cement
manufacturer in India in terms of capacity. Nuvoco’s capacity share was approximately 17% in
terms of consolidated capacity in East India, ~4.7% in terms of consolidated capacity in North
India and consolidated capacity was 22.32 MMTPA as on FY21, ~4.2% of the industry’s installed
capacity in India as of December 2020. The company grew at a fast pace, owing to mega
acquisition of Lafarge Holcim in 2016 and NU Vista (formerly Emami Cement Ltd) in 2020. With
a consolidated cement capacity of 23.8 MTPA currently (end of 1QFY22), Nuvoco has become
the fifth largest cement company in India.
In the northern region, Nuvoco has an integrated plant in Chittogargh, a split blending unit in
Haryana and an integrated unit in Nimbol (transferred from Nirma to NVCL in fiscal 2020).
These units will benefit from synergies, including rationalisation of the marketing network and
cost savings because of ramp-up in scale of operations.
India has over 20 large and medium cement manufacturers and more than 50 smaller
producers. Cement brands are largely classified into three brands - Category A, B and C brands

12 | P a g e ( 0 3 r d N o v 2 0 2 1 )
For any further query, please email us on [email protected]
(“CAT A, B and C” respectively). CAT A producers are considered to be premium cement brands,
whereas CAT B and CAT C producers sell at par or below the price of the base brand of a CAT
A player. This leads to a huge variation in cement prices with the difference between the
Premiums brand of CAT A companies and that of CAT C brand in the same market. Premium
brands like Nuvoco Vistas Concreto and Duraguard MF, Ultratech Weatherplus and ACC Gold
are market leaders in prices and usually enjoy a premium of Rs 100-150/ bag over CAT C Brand
in the same market.
Leadership position with dominant position at East India region
Source: RHP, Company Reports & Ventura Research

13 | P a g e ( 0 3 r d N o v 2 0 2 1 )
For any further query, please email us on [email protected]
Pan-India capacity
Source: RHP, Company Reports & Ventura Research

14 | P a g e ( 0 3 r d N o v 2 0 2 1 )
For any further query, please email us on [email protected]
Fifth largest cement player with region-wise revenue share
Source: RHP, Company Reports & Ventura Research
Diversified range of revenue stream
The company offer a range of over 50 products across cement, RMX and modern building
materials.
Cement
As a part of its cement portfolio, Nuvoco has leading brands with multiple products under each
brand including Concreto, Duraguard, Premium Slag Cement, Nirmax, Double Bull, Infracem
and Procem. The company’s key brands include Concreto, Concreto Green, Duraguard,
Duraguard Microfiber, Duraguard Waterseal, Duraguard Silver, Duraguard Rapidx Xtra,
Premium Slag Cement, Nirmax Cement, Infracem Cement, Double Bull Cement, Procem
Cement, Double Bull Master and Double Bull Subh. After being launched in 2004 Concreto has
been one of the best-selling brands, while Concreto and Duraguard are market leaders in terms
of cement prices in the respective segment as well as regions.
Nuvoco has 79% contribution to turnover coming from the trade segment and this is 800bps
higher than its peers. The trade segment has better realisations which lead to higher
profitability.
Ready Mix Concrete (RMC)
Nuvoco’s brand portfolio in the ready-mix concrete business includes Concreto, Instamix,
Artiste and X-Con range of products. This portfolio includes products such as self-compacting
concrete, decorative concrete, ready-to-use concrete, crack-resistant concrete, concrete with
steel fibers, and lean concrete, as well as concrete with varied characteristics for specialty uses.
Nuvoco had scaled down its RMC business in FY21 as it exited various non-profitable markets.
116.8
66.0
43.430.8
22.3
0
20
40
60
80
100
120
140
Ult
rate
ch
Lafa
rge
Ho
lcim
gro
up
Shre
e C
emen
t
Dal
mia
Nu
voco
Cement capacity (MTPA) as on FY21
75
20
5
Region-wise revenue share (%)
East North Central

15 | P a g e ( 0 3 r d N o v 2 0 2 1 )
For any further query, please email us on [email protected]
RMC region wise capacity
Source: RHP, Company Reports & Ventura Research
Modern Building Materials
The company’s modern building material products are a key differentiator. Nuvoco’s suite of
products under this category include a range of construction chemicals, tile adhesives, wall
putty, dry plaster, cover blocks and ready-mix dry concrete. Its modern building material
products are marketed and sold under the “Zero M” and “Instamix” brands.
The company has a dedicated Construction Development and Innovation Centre (CDIC) located
in Mumbai and 17,500 sq. feet, NABL1-accredited facility serving as an incubation centre for
innovative products.
33
25
24
18
Nuvoco’s RMC plants are spread across India (FY21) (%)
West North South East

16 | P a g e ( 0 3 r d N o v 2 0 2 1 )
For any further query, please email us on [email protected]
Nuvoco’s Product Portfolio
Source: RHP, Company Reports & Ventura Research
Cement
Source: RHP, Company Reports & Ventura Research
Ready-Mix Concrete (RMX) Modern Building Materials
Source: RHP, Company Reports & Ventura Research

17 | P a g e ( 0 3 r d N o v 2 0 2 1 )
For any further query, please email us on [email protected]
Innovative Products
Source: RHP, Company Reports & Ventura Research
Double digit growth with strong realization
Source: Bloomberg, Company Reports & Ventura Research
15.814.6
17.018.7
21.7
23.8
4457
4639
4413
4801
4969
5069
4,000
4,200
4,400
4,600
4,800
5,000
5,200
0
5
10
15
20
25
FY19 FY20 FY21 FY22E FY23E FY24E
Sales Vol. & NSR
Sales Vol. (MTPA) NSR (Rs./T) (RHS) 93% 90%
78% 78%
87%
95%
0%
10%
20%
30%
40%
50%
60%
70%
80%
90%
100%
FY19 FY20 FY21 FY22E FY23E FY24E
Total Cement Utilization (%)
100
105
110
115
120
125
130
Ap
r-1
2
No
v-12
Jun
-13
Jan
-14
Aug
-14
Mar
-15
Oct
-15
May
-16
Dec
-16
Jul-
17
Feb
-18
Sep
-18
Ap
r-1
9
No
v-19
Jun
-20
Jan
-21
Aug
-21
India cement prices WPI
250
260
270
280
290
300
310
320
330
340
350
FY17 FY18 FY19 FY20 FY21 H1FY22
Cement Price (Rs./Bag)
North East

18 | P a g e ( 0 3 r d N o v 2 0 2 1 )
For any further query, please email us on [email protected]
Strategically located cement production facilities that are in close proximity to
raw materials and key markets
Nuvoco’s plants are spread across different states in the eastern region, so that flyash is largely
available at less than 150kms. Its Jojobera (Jharkhand) and Mejia (West Bengal) grinding units
are at less than 2kms distance from thermal power plants. Its Panagarh (West Bengal) plant
also has less than 50km lead distance for flyash sourcing. In the north, Nuvoco’s flyash lead
distance ranges between 120-600kms. Most of the slag cement manufacturing plants can
source slag requirements at less than 180km. It has a ~20 years supply arrangement for ~2.1mn
MT at a pre-determined rate (lower than spot market price) and another 0.5mn MT at market
price, adding further to its cost competitiveness.
The company has strong distribution capabilities in the eastern region. Nuvoco also has railway
connectivity across six out of its 11 plants, which is helping for movement of raw material, fuel
and cement. The business integration & synergy of Nu Vista with Nuvoco will help to bring
down its overall lead distance. Through the synergy of NU Vista, Nuvoco intends to bring down
the overall lead distance from ~390km to ~350km through cross manufacturing of brands at
its various factories. Nuvoco is also reorganising clinker logistics for its grinding units in the
east, thus lowering its clinker movement cost.
The company has five integrated plants across Rajasthan and Chhattisgarh. In the past two
years, it has added thermal and WHRS capacities across these five locations, leading to 105MW
of CPP and 45MW of WHRS. Total power capacity of Nuvoco reach to 196 MW.
The company has a long-term tie-up with Tata Steel in the state of Jharkhand for the Jojobera
plant. A 20-year contract starting February 2019 to 2039.
Production Mix
Source: RHP, Brokers report, Ventura Research
60
26
14
Production Mix (%)
PPC Slag cement OPC
1.8 1.7 1.81.9
2.12.2
0.0
0.5
1.0
1.5
2.0
2.5
FY19 FY20 FY21 FY22E FY23E FY24E
Cement to clinker ratio
(x)

19 | P a g e ( 0 3 r d N o v 2 0 2 1 )
For any further query, please email us on [email protected]
Strategic locational benefits
Locations Plant Type
FY21 Cement Capacity (MTPA)
Limestone Lead distance
(km)
Clinker lead Distance
(km)
Flyash lead Distance
(km)
Slag lead Distance
(km)
Railway sidings
Nimbol (Rajasthan) IU 2.3 4-10
300-480 NA No Chittorgarh (Rajasthan) IU 2.1 0.5-6
120-600 NA Yes
Sonadih (Chhattisgarh) IU 0.65 2-2.5
70-150 NA Yes Arasmeta (Chhattisgarh) IU 1.89 3-45
45-100 NA Yes
Risda (Chhattisgarh) IU 3 2
110-150 120 No
Mejia (West Bengal) GU 1.65
620-690 1-2 NA Yes Panagarh (West Bengal) GU 2.5
800 30-65 32-180 Yes
Jojobera (Jharkhand) GU 4.95
450-530 1-2 10-350 Yes
Bhabua (Bihar) GU 0.8
600 115-220 NA No Jajpur (Odisha) GU 2
600 NA 12-180 No
Bhiwani (Haryana) BU 0.5
450-550 Nearby NA No
IU: Integrated Unit, GU: Grinding Unit, BU: Blending Unit
Source: RHP, Brokers report, Ventura Research
Limestone reserves
Operational Mines
Mine Name Location Reserves Date of Certification of Mining
Plan Arasmeta Chhattisgarh 25.0 12-Feb-21 Chilhati Chhattisgarh 150.0 11-Dec-19 Kirari Chhattisgarh 25.3 12-Feb-21 Sonadih Chhattisgarh 23.1 10-Dec-20 Sinla Rajasthan 14.7 05-Apr-21 Digrana Rajasthan 14.1 05-Apr-21 Sita Ram Ji ka Khera Rajasthan 66.0 26-Mar-18 Arniya Joshi Rajasthan 63.9 24-Jan-20 Chittapur Karnataka 221.2 20-Apr-18 Risda Chhattisgarh 222.1 18-Jan-20 Total 821.5 Non-Operational Mines
Mine Name Location Reserves Date of Certification of Mining
Plan Arasmeta Chhattisgarh 14.2 28-Oct-20 Sonadih Chhattisgarh 156.8 03-Oct-16 Dhandhani Chhattisgarh 15.8 06-Jan-21 Nagaur Rajasthan 127.0 24-Jul-19 Nagaur Rajasthan 168.8 24-Jul-19 Tengada Andhra Pradesh 391.8 21-Oct-14 Total 874.3
Source: RHP, Ventura Research

20 | P a g e ( 0 3 r d N o v 2 0 2 1 )
For any further query, please email us on [email protected]
Upcoming capacities & various projects to fuel further profitable growth
The cement plants are located at various strategic locations in East and North India. These
locations allow the company to effectively sell and market their products in East and North
India as well as access to select key markets in Central India. It has three integrated units and
five grinding units located in East India, and two integrated units, and one blending unit located
in North India.
Nuvoco has 30+ years of limestone reserves across all its plant locations in the north and east
regions. At its Nimbol plants, the current limestone capacity can last for the next 12 years.
However, the company intends to participate in upcoming auctions of new mines in the region
to augment its limestone capacity.
The company is to set up captive power plants in all integrated units and at the Jojobera
grinding unit. The Arasmeta plant as well as the Jojobera plant is expected to start generating
electricity by Q3FY22. By Q3FY22, the company would have completed all power projects and
with that will have 150 megawatts of Captive Power Plants, 45 megawatts of Waste Heat
Recovery systems and 1.5 megawatts of solar plants. All these projects combined are expected
to meet ~65-70% of the total power requierments of the company by FY24E. The company is
among the best in the industry in terms of installed capacity of WHR per million tonne of
cement capacity.
The company is implementing clinker rerouting, where the clinker from the Risda Cement Plant
will be moved via Sonadih Cement Plant railhead to grinding unit, which will eliminate
additional handling charges and reduce overall cost and increased profitability of the business.
Lowering external power dependency
Source: Company Reports & Ventura Research
The company is debottlenecking its cement grinding capacity by 2.7MTPA – all in the east. It
completed its Jharkhand grinding unit expansion (1.5 MTPA) at the end of Q1FY22 and expects
0%
20%
40%
60%
80%
100%
120%
FY19 FY20 FY21
Power requierment
Grid WHR CPP Solar
0
1
1
2
2
3
3
4
4
5
5
0
200
400
600
800
1,000
1,200
Power cost/T (Rs.) FY21 WHRS / Cement (MW/MT)

21 | P a g e ( 0 3 r d N o v 2 0 2 1 )
For any further query, please email us on [email protected]
to commission the Bihar grinding expansion (1.2MTPA) by H1FY23. It is also debottlenecking
its clinker capacity by 0.9 MTPA (across three plant locations – 0.3mn MT each at Nimbol in
Rajasthan, and Sonadih and Risda in Chhattisgarh) by FY23E. Other greenfield projects are
Gulburge and Maharashtra yet to announce size. The company is embarking on clinker
debottlenecking in three of its kilns, out of which the company has already started work on
two kilns; one in the Nimbol plant in the North and the other in the Risda plant in the East and
Nuvoco is expecting to commission the debottlenecking by FY23. The company is looking at a
capex of over close to Rs.1,000 cr in FY22 and FY23.
In the northern region, the company has launched the Double Bull brand in the trade segment
under a separate channel. The company has also launched its Concreto brand in Odisha from
the NU Vista plant. These moves will increase Nuvuco’s blended cement sales and share of
trade sales as well, thereby improving its cement realization.
After completion of all the projects, the company is targetting cost savings of ~INR 250 till
FY23E. It will fuel profitable growth for the company as well as improve margins significantly.
Unit cost analysis
Particular FY19 FY20 FY21 FY22E FY23E FY24E NSR (Rs./T) 4,457.0 4,639.4 4,412.9 4,801.2 4,969.2 5,068.6 YoY Growth (%) 4.1 (4.9) 8.8 3.5 2.0 Raw Material cost (Rs./T) 913.0 840.0 711.1 677.0 715.6 755.2 YoY Growth (%) (8.0) (15.3) (4.8) 5.7 5.5 Power & Fuel cost (Rs./T) 868.5 837.0 799.2 1,018.4 896.2 806.6 YoY Growth (%) (3.6) (4.5) 27.4 (12.0) (10.0) Employee Cost (Rs./T) 240.9 276.3 284.0 306.9 311.9 336.3 YoY Growth (%) 14.7 2.8 8.0 1.6 7.8 Freight and forwarding (Rs./T) 1,564.0 1,407.4 1,172.2 1,317.9 1,351.6 1,393.9 YoY Growth (%) (10.0) (16.7) 12.4 2.6 3.1 Other Expenses (Rs./T) 601.2 587.1 562.0 580.9 601.3 628.5 YoY Growth (%) (2.3) (4.3) 3.4 3.5 4.5 EBIDTA (Rs./T) 580.0 885.9 860.6 900.1 1,092.7 1,148.2 YoY Growth (%) 52.7 (2.9) 4.6 21.4 5.1
Source: Company Reports & Ventura Research
Improvement in financial position
Financials of the company have remained stressed due to serial acquitions made by Nuvoco.
The recent IPO has helped with fuel of Rs.1500 cr and other Rs.500 cr through equity
conversion of debt from Kotak Special Situation Fund in FY21, which has reduced balance sheet
stress.

22 | P a g e ( 0 3 r d N o v 2 0 2 1 )
For any further query, please email us on [email protected]
Gaining financial strength
Source: Company Reports & Ventura Research
-5
0
5
10
15
20
25
0
2,000
4,000
6,000
8,000
10,000
12,000
14,000
FY19 FY20 FY21 FY22E FY23E FY24E
Revenue to improve on capacities addition with better realizations
Total Revenue YoY growth
-10
-5
0
5
10
15
0
2,000
4,000
6,000
8,000
10,000
12,000
14,000
FY19 FY20 FY21 FY22E FY23E FY24E
Higher profitability and debt repayment to improve return ratios
Net Worth Invested Capital
ROIC (RHS) ROE (RHS)
-5
0
5
10
15
20
25
-500
0
500
1,000
1,500
2,000
2,500
3,000
FY19 FY20 FY21 FY22E FY23E FY24E
Cost reduction to drive profitability
EBITDA PAT
EBITDA Margin (RHS) PAT Margin (RHS)
0
5
10
15
20
25
-1,000
-500
0
500
1,000
1,500
2,000
2,500
3,000
3,500
FY19 FY20 FY21 FY22E FY23E FY24E
Improvement in margins accelerate cash flow generation
CFO FCFF Net Working Capital Days (RHS)
0
1
2
3
4
5
6
0
1,000
2,000
3,000
4,000
5,000
6,000
7,000
FY19 FY20 FY21 FY22E FY23E FY24E
Operating cash flow would be utilized towards faster debt repayments
Total Debt Net Debt
Net Debt to Equity Net Debt to EBITDA
Interest Coverage Ratio
1
1
1
1
1
1
1
1
1
2
FY19 FY20 FY21 FY22E FY23E FY24E
Strong volume growth with better realizations drive assets utilization
INR Cr %
INR Cr %
INR Cr %
INR Cr Days
INR Cr (x)
(x)

23 | P a g e ( 0 3 r d N o v 2 0 2 1 )
For any further query, please email us on [email protected]
Business Quality Score
Key Criteria Score Risk Comments
Management & Leadership
Management Quality 8 Low The management is of decent quality. It has been able to deliver growth by taking calculated risks.
Promoters Holding Pledge 10 Low The promoter holding is 71.03% and there is no promoter pledging as of Sept 2021.
Board of Directors Profile 7 Low The average experience of directors is >20 years with significant experience in cement, RMX, manufacturing, FMCG, accounts/finance, strategic planning and operations
Industry Consideration
Industry Growth 7 Low Cement industry is key to development of infrastructure and housing. The government’s thrust is towards infrastructure creation & development, road & highway construction, and boost in affordable housing.
Regulatory Environment or Risk 7 Low
The company operates in the domestic market and is therefore not exposed to international regulations. But the company is exposed to a range of environmental laws & regulations, ban or restriction in usage of few raw material
Entry Barriers / Competition 8 Low
Entry of a new company in the cement industry would require a strong capital base and a huge investment. There are 30+ large, mid and small cement manufacturers available in the country. Larger players get the benefits of consolidation and gaining market share.
Business Prospects
New Business / Client Potential 8 Low The company has a leading market share in the eastern India region which is expected to grow at a higher rate compared to other regions.
Business Diversification 4 High
Cement is a regional specific industry and the growth of regions will drive the growth of businesses in the industry. Nuvoco has premium cement products which command a premium price in the industry. RMX and other business segments contribute to lower revenue to the company.
Market Share Potential 8 Low Nuvoco is the fifth largest and dominant east India player in India.
Margin Expansion Potential 7 Low Cost rationalization, captive power plant helps to Nuvoco to improve its profitability and financial strength.
Earnings Growth 8 Low Higher east India growth and new capacity will lead volume growth and margin expansion
Valuation and Risk
Balance Sheet Strength 7 Low Higher debt on the balance sheet drags down its strength but IPO funds and improvement in operating cash flows on account of better margins and decent volume growth will lead to strengthening balance sheet.
Debt Profile 7 Low With the increase in CFO due to reducing capex, we expected that Nuvoco can become net debt-free by FY24.
FCF Generation 7 Low With all the key drivers in place, we are expecting positive FCF generation.
Dividend Policy 1 High The company has never paid a dividend in the past 6 years.
Total Score
Ventura Score (%)
104
70 Moderate
The overall risk profile of the company is good and we consider it as a Moderate risk company for investments
Source: Company Reports & Ventura Research

24 | P a g e ( 0 3 r d N o v 2 0 2 1 )
For any further query, please email us on [email protected]
Annual Report Takeaways
We analyzed the FY21 annual report of Nuvoco and our key observations are as follows:
Key Takeaways
• Reduction in power cost & Freight cost: For cement operations, the power and fuel
costs of the company have decreased by 13% from Rs.990/T in FY20 to Rs.858/T in
FY21. Power cost has reduced mainly due to the commissioning of CPP at the Sonadih
Cement Plant, a ramp up of existing WHRs and CPP commissioned in FY 2019-20 and a
reduction in the electricity tariff rate.
For cement operations, the freight and forwarding cost decreased by 10%, from
Rs.1,324/T in FY20 to Rs.1,197/T in FY21 due to an increase in direct dispatches and a
reduction in road freight costs in the North, partially offset by an increase in diesel
prices.
• Rights issue: The Company has allotted 54,545,455 and 18,181,819 fully paid-up equity
shares, having a face value of Rs.10/- each of the Company to Niyogi Enterprise Private
Limited (the “Holding Company”) on a Rights basis on June 8, 2020 and July 22, 2020,
respectively. This resulted in an increase in the issued, subscribed and paid-up share
capital of the Company to Rs.3,150,890,610; divided into 315,089,061 equity shares
having face value of Rs.10/- each.
• New Product Development: Cement - During FY21, the company launched Duraguard
Silver (premium composite cement). With reduced porosity and lesser chances of
thermal cracks, Duraguard Silver helps in preventing any damage caused by seepage
or temperature changes. Its high resistance to chloride makes it a better alternative
than regular PPC providing increased protection to the TMT bars.
RMX – the company launched four products namely, InstaMix Xpress (pre-mixed,
ready-to-use, bagged, dry concrete), Artiste Signature (a special and collaborative
collection designed by Gauri Khan Designs and International Designs available
exclusively for Nuvoco’s customers), Concreto Permadure (a water-and-
cracksresistant concrete) and Concreto Ecodure (controls thermal cracks in mass
concrete foundation and improves durability).
Modern Building Materials (MBM) - During FY21, Nuvoco launched ‘Zero M Type 3
Premium Cover Blocks’.
Pay Grades
The remuneration growth of Vice Chairman & MD and CFO has significantly outpaced the
median remuneration growth of the company in the past 5 years. Further, it has also outpaced
the CAGR growth in revenue, EBITDA and PAT over the same period.

25 | P a g e ( 0 3 r d N o v 2 0 2 1 )
For any further query, please email us on [email protected]
Remuneration in the last 5 years
Source: Company Reports & Ventura Research
Management & Leadership Team Turnover
Details on Board of Director and KMPs
Source: Company Reports
Auditor qualifications & significant notes to accounts
MSKA & Associates is the auditor and there were no qualifications/emphasis of matters
highlighted by them in the FY21 Annual Report.
Parameter (Fig in INR Cr) FY17 FY18 FY19 FY20 FY21 CAGR%
Vice Chairman & MD 7.4 6.6 9.5 4.7 5.2 (8.5)
Share in Total Employee Cost (%) 2.6 2.1 2.5 1.2 1.1
Chief Financial Officer 3.0 0.7 1.7 2.2 2.7 (3.0)
Share in Total Employee Cost (%) 1.0 0.2 0.5 0.5 0.6
Remuneration of SVP/VP/GM 0.5 0.6 0.9 0.8 0.9 12.6
Share in Total Employee Cost (%) 0.2 0.2 0.2 0.2 0.2
Employee Cost 290.0 317.5 381.1 404.6 482.0 13.5
Employee Cost as % of Revenue (%) 5.0 5.0 5.4 6.0 6.4
Board of Director & KMP FY17 FY18 FY19 FY20 FY21
Hiren Patel CM CM CM
Jayakumar Krishnaswamy MD MD MD
Ujjwal Batria MD MD
Berjis Desai ID ID ID ID ID
Bhavna Doshi ID ID ID ID ID
Achal Bakeri ID
Kaushikbhai Patel ID ID NED
Shruta Sanghavi CS CS CS
Ajay Pratap Singh CS CS
Suketu Shah NED NED NED NED
Sharad Shrimali NED
Mr. Maneesh Agrawal CFO CFO CFO CFO
CM-Chairman NED-Non Executive Director
MD-Managing Director ID-Independent Director
CFO-Chief Financial Officer CS-Company Secretary

26 | P a g e ( 0 3 r d N o v 2 0 2 1 )
For any further query, please email us on [email protected]
Major Related Party Transactions with promoters and KMPs
In FY19 and FY20, related party transactions are higher due to intercorporate deposit.
Related Party Transactions are relatively low
Source: Company Reports & Ventura Research
Contingent Liabilities
Contingent liabilities are very high compared to the net worth and revenue. These are mostly
from disputes on Income Tax.
Contingent Liabilities are reasonably high
Source: Company Reports & Ventura Research
Management Team
Source: Company Reports
Key Risks & Concerns
• COVID-19 pandemic led slowdown
Since late 2019, the outbreak of COVID-19 has resulted in a global health crisis and
triggered a global economic downturn and contraction. Due to a production halt
during the lockdown period, the company continued to incur fixed and semi-variable
costs, which adversely impacted its profitability for FY21.
Parameter (Fig in INR Cr) FY17 FY18 FY19 FY20 FY21
Related Party Trans 44.5 154.2 484.4 814.5 33.2
Compensation to KMP 12.4 6.8 0.9 8.8 3.2
Transactions as % of Revenue (%) 1.0 2.6 6.9 12.1 0.5
Parameter (Fig in INR Cr) FY17 FY18 FY19 FY20 FY21
Claims against the company not acknowledged 517.1 658.2 494.7 621.0 641.6
Transactions as % of Revenue (%) 8.9 10.5 7.0 9.1 8.6
Transactions as % of Net Worth (%) 13.6 16.6 9.9 11.8 8.8
Key Person Designation Details
Mr. Hiren PatelChairman & Non-
executive Director
He holds a bachelor’s degree in engineering from Stevens Institute of Technology, New Jersey,
USA and a master’s degree in business administration from Drexel University, Pennsylvania,
USA. He has been associated with the Nirma group since the year 1997. He has experience in the
cement, consumer goods, chemicals and health care industry.
Mr. Jayakumar Krishnaswamy MD
He holds a bachelor’s degree in engineering (mechanical) from University of Delhi. He has
experience across FMCG, paint, and coating industry. He has previously been associated with
Hindustan Unilever Limited and Akzo Nobel India Limited.
Mr. Maneesh Agrawal Chief Financial Officer
He holds a bachelor’s degree in commerce from Hansraj College, University of Delhi. He is a
qualified chartered accountant. He has over two decades of experience primarily in cement,
RMX and paper businesses. He has previously been associated with Dalmia Bharat Limited and
Ballarpur Industries Limited.
27 | P a g e ( 0 3 r d N o v 2 0 2 1 )
For any further query, please email us on [email protected]
In addition, throughout March, April and May 2021, due to an increase in the number
of daily COVID-19 cases, several state governments in India re-imposed lockdowns,
curfews and other restrictions to curb the spread of the virus. The detection of new
strains and subsequent waves of COVID-19 infections in several states in India as well
as throughout various parts of the world, which has adversely affected business
operations.
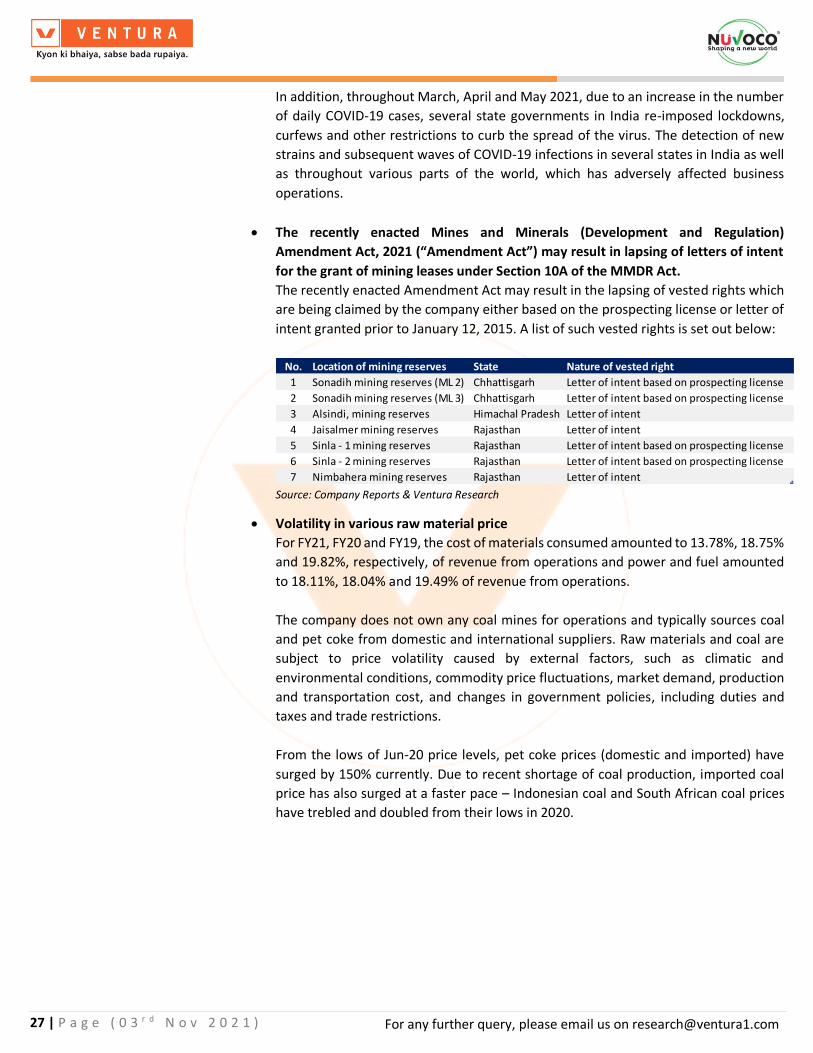
• The recently enacted Mines and Minerals (Development and Regulation)
Amendment Act, 2021 (“Amendment Act”) may result in lapsing of letters of intent
for the grant of mining leases under Section 10A of the MMDR Act.
The recently enacted Amendment Act may result in the lapsing of vested rights which
are being claimed by the company either based on the prospecting license or letter of
intent granted prior to January 12, 2015. A list of such vested rights is set out below:
Source: Company Reports & Ventura Research
• Volatility in various raw material price
For FY21, FY20 and FY19, the cost of materials consumed amounted to 13.78%, 18.75%
and 19.82%, respectively, of revenue from operations and power and fuel amounted
to 18.11%, 18.04% and 19.49% of revenue from operations.
The company does not own any coal mines for operations and typically sources coal
and pet coke from domestic and international suppliers. Raw materials and coal are
subject to price volatility caused by external factors, such as climatic and
environmental conditions, commodity price fluctuations, market demand, production
and transportation cost, and changes in government policies, including duties and
taxes and trade restrictions.
From the lows of Jun-20 price levels, pet coke prices (domestic and imported) have
surged by 150% currently. Due to recent shortage of coal production, imported coal
price has also surged at a faster pace – Indonesian coal and South African coal prices
have trebled and doubled from their lows in 2020.
No. Location of mining reserves State Nature of vested right
1 Sonadih mining reserves (ML 2) Chhattisgarh Letter of intent based on prospecting license
2 Sonadih mining reserves (ML 3) Chhattisgarh Letter of intent based on prospecting license
3 Alsindi, mining reserves Himachal Pradesh Letter of intent
4 Jaisalmer mining reserves Rajasthan Letter of intent
5 Sinla - 1 mining reserves Rajasthan Letter of intent based on prospecting license
6 Sinla - 2 mining reserves Rajasthan Letter of intent based on prospecting license
7 Nimbahera mining reserves Rajasthan Letter of intent

28 | P a g e ( 0 3 r d N o v 2 0 2 1 )
For any further query, please email us on [email protected]
Raw material price surging
Source: Index Mundi, Bloomberg, Company Reports
• Dependency on eastern and northern region
A majority of cement operations are concentrated in the eastern and northern region
of India, such as Jojobera (in Jharkhand), Bhabua (in Bihar), Jajpur (in Orissa), Mejia
and Panagarh (in West Bengal), Sonadih, Arasmeta and Risda (in Chhattisgarh), Nimbol
and Chittorgarh (in Rajasthan) and Bhiwani (in Haryana). For FY21, 81% of the total
sales volume was in East India (covering the states such as West Bengal, Chhattisgarh,
Jharkhand, Bihar, Odisha and Assam) and 19% of the total sales volume was in North
India (covering the states such as Rajasthan, Haryana, Delhi and Punjab). Nuvoco faces
the risk of regional concentration and presence in over supply markets, which may
result in lower than peer valuations.
• Any change in incentives and subsidies applicable to the company or a delay in
disbursement of benefits
In FY21, FY20 and FY19, the company availed incentives and subsidies amounting to
Rs.77 cr, Rs.47 cr and Rs.81 cr, respectively. This does not include power subsidies,
which are adjusted against Nuvoco’s monthly power bills. Any delay or changes in
schemes by state governments can affect the financial performance of the company.
0
50
100
150
200
250
55
60
65
70
75
80
85
90
95
100
105
Jan
-18
Apr
-18
Jul-
18
Oct
-18
Jan
-19
Apr
-19
Jul-
19
Oct
-19
Jan
-20
Apr
-20
Jul-
20
Oct
-20
Jan
-21
Apr
-21
Jul-
21
Oct
-21
Diesel Price (Rs./Ltr) Pet Coke Price (Rs.) (RHS)
25
75
125
175
225
275
Oct
-16
Feb
-17
Jun
-17
Oct
-17
Feb
-18
Jun
-18
Oct
-18
Feb
-19
Jun
-19
Oct
-19
Feb
-20
Jun
-20
Oct
-20
Feb
-21
Jun
-21
Coal prices ($)
Indonesia coal prices Australia coal prices

29 | P a g e ( 0 3 r d N o v 2 0 2 1 )
For any further query, please email us on [email protected]
Quarterly and Annual Performance
Source: Company Reports & Ventura Research
Figures in INR Crores FY20 Q1FY21 Q4FY21 FY21 Q1FY22 FY22E FY23E FY24E
Sales Volume (MTPA) 14.6 1.8 5.6 17.0 4.2 18.7 21.7 23.8
YoY Growth (%) 15.9 141.7 10.2 16.1 9.4
Capacity Utilization (%) 90.3 77.6 78.5 86.7 94.9
NSR (Rs./T) 4,639.4 4,808.7 4,699.3 4,412.9 5,208.0 4,801.2 4,969.2 5,068.6
Revenue 6,793.2 841.5 2,631.6 7,488.8 2,203.0 8,975.2 10,784.6 12,039.3
YoY Growth (%) 10.2 161.8 19.8 20.2 11.6
Raw Material cost 1,230.0 181.0 494.7 1,206.8 249.5 1,265.5 1,553.0 1,793.9
Raw Material cost (Rs./T) 840.0 1,034.5 883.4 711.1 589.7 677.0 715.6 755.2
Power & Fuel 1,225.6 134.1 440.8 1,356.3 429.5 1,903.8 1,945.0 1,915.8
Power & Fuel (Rs./T) 837.0 766.4 787.2 799.2 1,015.3 1,018.4 896.2 806.6
Freight and forwarding charges 1,776.1 207.3 718.4 2,029.4 591.7 2,463.7 2,933.4 3,310.8
Freight and forwarding (Rs./T) 1,213.0 1,184.5 1,282.8 1,195.9 1,398.9 1,317.9 1,351.6 1,393.9
Employee Cost 404.6 98.8 131.9 482.0 140.7 573.6 676.9 798.7
Employee Cost (Rs./T) 276.3 564.6 235.6 284.0 332.6 306.9 311.9 336.3
Other Expenses 859.7 97.4 321.7 953.8 277.3 1,086.0 1,304.9 1,492.9
Other Expenses (Rs./T) 587.1 556.5 574.5 562.0 655.6 580.9 601.3 628.5
EBIDTA 1,297.1 123.0 524.0 1,460.5 514.0 1,682.6 2,371.4 2,727.2
EBIDTA Margin (%) 19.1 14.6 19.9 19.5 23.3 18.7 22.0 22.7
EBIDTA (Rs./T) 885.9 702.9 935.7 860.6 1,215.1 900.1 1,092.7 1,148.2
PAT 249.3 (91.0) (91.0) (25.9) 114.0 209.7 769.0 1,109.9
PAT Margin (%) 3.7 (10.8) (3.5) (0.3) 5.2 2.3 7.1 9.2
PAT (Rs./T) 170.2 (520.0) (162.5) (15.3) 269.5 112.2 354.3 467.3
Adjusted EPS (Rs) 7.9 (3.1) (3.1) (0.8) 3.6 5.9 21.5 31.1
P/E Ratio 69.2 (665.3) 93.2 25.4 17.6
Enterprise Value 22,678.4 24,543.9 22,623.7 21,597.0 19,666.8
EV/EBITDA 17.5 16.8 13.4 9.1 7.2
Net Worth 5,279.3 7,323.7 9,033.4 9,802.4 10,823.0
Return on Equity (%) 4.7 (0.4) 2.3 7.8 10.3
Invested Capital 8,410.5 12,320.4 13,571.6 13,016.6 12,539.9
Return on Invested Capital (%) 5.9 (3.8) 5.3 9.4 12.3
Cash Flow from Operations 1,024.8 1,717.4 1,428.0 2,316.7 2,862.3
Cash Flow from Investing (310.1) (2,924.1) (447.3) (883.5) (553.7)
Cash Flow from Financing (559.1) 1,419.7 (473.2) (1,823.2) (1,940.2)
Net Cash Flow 155.6 213.0 507.5 (390.1) 368.5
Total Debt 3,642.1 5,908.7 4,538.2 3,214.2 1,716.9
Net Debt 3,131.2 4,996.7 3,076.6 2,049.8 119.6
Net Debt to Equity (x) 0.6 0.7 0.3 0.2 0.0
Net Debt to EBITDA (x) 2.4 3.4 1.8 0.9 0.0

30 | P a g e ( 0 3 r d N o v 2 0 2 1 )
For any further query, please email us on [email protected]
Summary of Management Commentary and Quarterly Performance over last few quarters
Key Criteria View Comments Q1FY22
Business Performance POSITIVE
Sales volume up by 141.7% YoY to 4.2 MTPA and capacity utilization was 76.0%
Revenues up 161.8% YoY to INR 2203 cr, EBITDA up 317.9% to INR 514 cr (EBITDA/T of INR 1215), PAT of INR 114 cr (PAT/T of INR 270) against loss of INR 91 cr in Q1FY21.
Healthy pricing across eastern & northern region has help to improve realisation.
An increase in capacity utilization and cost efficiencies from Aichi Steel along with strong metal prices, compared to Q1FY21, improved the overall performance.
Outlook & Strategy POSITIVE
Arasmeta plant as well as the Jojobera plant is expected to start generating electricity by Q3FY22. By Q3FY22, the company would have completed all power projects and with that will have 150 megawatt of Captive Power Plants and 45 megawatts of Waste Heat Recovery systems.
Sales volume guidance for FY22: 18 – 18.7 MTPA.
EBITDA/tn guidance for FY22: INR 840-879.
Source: Company Reports & Ventura Research

31 | P a g e ( 0 3 r d N o v 2 0 2 1 )
For any further query, please email us on [email protected]
Financial Analysis & Projections
Figures in INR Crores FY20 FY21 FY22E FY23E FY24E Figures in INR Crores FY20 FY21 FY22E FY23E FY24E
Income Statement Per Share Data & Yield
Revenue 6,793.2 7,488.8 8,975.2 10,784.6 12,039.3 Adjusted EPS (Rs) 7.9 (0.8) 5.9 21.5 31.1
YoY Growth (%) (3.7) 10.2 19.8 20.2 11.6 Adjusted CEPS (Rs) 24.7 24.4 32.8 46.2 56.9
Raw Material Cost 1,230.0 1,206.8 1,265.5 1,553.0 1,793.9 Adjusted BVPS (Rs) 167.5 232.4 252.9 274.5 303.0
YoY Growth (%) (14.9) (1.9) 4.9 22.7 15.5 FCF per share (Rs) 14.2 (5.0) 21.2 34.9 59.8
Power & Fuel Cost 1,225.6 1,356.3 1,903.8 1,945.0 1,915.8 FCF Yield (%) 2.6 (0.9) 3.9 6.4 10.9
YoY Growth (%) (10.8) 10.7 40.4 2.2 (1.5) CFO per share (Rs) 32.5 54.5 40.0 64.9 80.1
Employee Cost 404.6 482.0 573.6 676.9 798.7 CFO Yield (%) 5.9 9.9 7.3 11.8 14.6
YoY Growth (%) 6.2 19.1 19.0 18.0 18.0
Freight Cost 1,776.1 2,029.4 2,463.7 2,933.4 3,310.8 Sovency Ratio (X)
YoY Growth (%) (10.4) 14.3 21.4 19.1 12.9 Total Debt to Equity 0.7 0.8 0.5 0.3 0.2
Other Expenses 859.7 953.8 1,086.0 1,304.9 1,492.9 Net Debt to Equity 0.6 0.7 0.3 0.2 0.0
YoY Growth (%) (9.6) 10.9 13.9 20.2 14.4 Net Debt to EBITDA 2.4 3.4 1.8 0.9 0.0
EBITDA 1,297.1 1,460.5 1,682.6 2,371.4 2,727.2 Interest Coverage Ratio 1.8 1.0 1.4 3.0 5.1
YoY Growth (%) 41.4 12.6 15.2 40.9 15.0
Margin (%) 19.1 19.5 18.7 22.0 22.7 Return Ratios (%)
Depreciation & Amortization 527.9 793.8 824.6 881.0 921.7 Return on Equity 4.7 (0.4) 2.3 7.8 10.3
EBIT 769.3 666.7 858.0 1,490.4 1,805.5 Return on Capital Employed 5.6 (3.6) 4.7 8.6 10.8
YoY Growth (%) 83.3 (13.3) 28.7 73.7 21.1 Return on Invested Capital 5.9 (3.8) 5.3 9.4 12.3
Margin (%) 11.3 8.9 9.6 13.8 15.0
Other Income 36.7 33.9 25.0 36.5 31.2 Working Capital Ratios
Finance Cost 419.2 664.0 602.7 499.2 353.6 Receivable Days 27 22 24 26 26
Exceptional Item 0.0 0.0 0.0 0.0 0.0 Inventory Days 32 35 37 36 35
PBT 386.8 36.5 280.2 1,027.7 1,483.2 Payable Days 42 44 43 42 42
YoY Growth (%) 2,229.7 (90.6) 667.0 266.7 44.3 Net Working Capital Days 18 13 18 20 19
Margin (%) 5.7 0.5 3.1 9.5 12.3 Net Working Capital to Sales (%) 0.3 0.2 0.2 0.2 0.2
Reported Tax 137.5 62.5 70.5 258.7 373.3
Tax Rate (%) 35.6 170.9 25.2 25.2 25.2 Valuation (X)
PAT 249.3 (25.9) 209.7 769.0 1,109.9 P/E Ratio 69.4 (667.6) 93.5 25.5 17.7
YoY Growth (%) - - - 266.7 44.3 P/BV Ratio 3.3 2.4 2.2 2.0 1.8
Margin (%) 3.7 (0.3) 2.3 7.1 9.2 EV/EBITDA 17.5 16.9 13.5 9.1 7.2
EV/Sales 3.3 3.3 2.5 2.0 1.6
Balance Sheet
Share Capital 242.4 315.1 357.2 357.2 357.2 Cash Flow Statement
Total Reserves 5,036.9 7,008.6 8,676.3 9,445.3 10,465.8 Profit Before Tax 386.8 36.5 280.2 1,027.7 1,483.2
Shareholders' Fund 5,279.3 7,323.7 9,033.4 9,802.4 10,823.0 Add: Depreciation 527.9 793.8 824.6 881.0 921.7
Long Term Borrowings 2,931.3 5,561.2 4,161.2 2,761.2 1,211.2 Add: Finance Cost 419.2 664.0 602.7 499.2 353.6
Long Term Lease Liabilities 33.6 89.1 107.7 129.4 144.5 Change in Other Assets & Liabilities (163.3) 216.1 (25.2) 315.8 513.0
Other Financial Liabilities 52.8 62.5 74.9 90.1 100.5 Change in Working Capital (8.3) 69.4 (183.9) (148.3) (35.8)
Long Term Provisions 70.3 81.4 96.9 114.3 134.9 Less: Tax Paid (137.5) (62.5) (70.5) (258.7) (373.3)
Other Non Current Liabilities 0.0 2.1 2.6 3.1 3.4 Cash Flow from Operations 1,024.8 1,717.4 1,428.0 2,316.7 2,862.3
Deferred Tax Liabilities 1,441.9 1,881.0 1,839.9 2,210.8 2,468.1 Net Capital Expenditure (569.5) (547.3) (527.0) (600.0) (100.0)
Total Liabilities 9,809.1 15,001.1 15,316.6 15,111.3 14,885.6 Change in Investments 259.3 (2,376.8) 79.7 (283.5) (453.7)
Net Block 6,220.8 9,324.2 9,226.9 9,176.7 8,607.1 Cash Flow from Investing (310.1) (2,924.1) (447.3) (883.5) (553.7)
Capital WIP 647.0 1,235.8 617.9 247.2 247.2 Proceeds from issue of equity capital 0.0 1,600.0 1,500.0 0.0 0.0
Right of Use Assets 101.7 329.3 282.6 235.6 179.6 Payment of Lease Liabilities (20.1) (63.2) 29.9 36.2 25.1
Invesment Properties 1.2 0.5 0.6 0.8 0.8 Change in LT Borrowings (220.0) 8.8 (1,400.0) (1,400.0) (1,550.0)
Goodwill 2,443.9 3,278.5 3,278.5 3,278.5 3,278.5 Change in ST Borrowings 0.0 74.4 (0.3) 39.8 27.6
Other Intangible Assets 1,202.6 2,109.0 2,493.6 2,963.9 3,221.5 Proceeds from issue of Debentures 0.0 500.0 0.0 0.0 0.0
Intangible Assets under development 0.0 4.4 4.4 4.4 4.4 Share issue expenses (0.9) (49.7) 0.0 0.0 0.0
Investments 0.1 0.1 0.1 0.1 0.1 Less: Finance Cost (419.2) (664.0) (602.7) (499.2) (353.6)
Loans 0.2 1.5 1.8 2.2 2.4 Change in Other Liabilities 101.2 13.5 0.0 0.0 0.0
Other LT Financial Assets 579.1 787.5 943.8 1,134.0 1,266.0 Cash Flow from Financing (559.1) 1,419.7 (473.2) (1,823.2) (1,940.2)
Income Tax Assets 133.9 133.2 146.5 153.9 161.6 Net Cash Flow 155.6 213.0 507.5 (390.1) 368.5
Other Non Current Assets 107.1 191.3 229.2 275.5 307.5 Opening Balance of Cash 98.3 253.9 493.1 1,000.6 610.5
Net Current Asset (1,628.4) (2,394.2) (1,909.2) (2,361.2) (2,390.9) Addition through business combination 0.0 26.3 0.0 0.0 0.0
Total Assets 9,809.1 15,001.1 15,316.6 15,111.3 14,885.6 Closing Balance of Cash 253.9 493.1 1,000.6 610.5 979.0

32 | P a g e ( 0 3 r d N o v 2 0 2 1 )
For any further query, please email us on [email protected]
Disclosures and Disclaimer
Ventura Securities Limited (VSL) is a SEBI registered intermediary offering broking, depository and portfolio management services to clients. VSL is member of BSE, NSE
and MCX-SX. VSL is a depository participant of NSDL. VSL states that no disciplinary action whatsoever has been taken by SEBI against it in last five years except
administrative warning issued in connection with technical and venial lapses observed while inspection of books of accounts and records. Ventura Commodities Limited,
Ventura Guaranty Limited, Ventura Insurance Brokers Limited and Ventura Allied Services Private Limited are associates of VSL. Research Anal yst (RA) involved in the
preparation of this research report and VSL disclose that neither RA nor VSL nor its associates (i) have any financial interest in the company which is the subject matter
of this research report (ii) holds ownership of one percent or more in the securities of subject company (iii) have any material conflict of interest at the time of
publication of this research report (iv) have received any compensation from the subject company in the past twelve months (v) have managed or co-managed public
offering of securities for the subject company in past twelve months (vi) have received any compensation for investment banking merchant banking or brokerage
services from the subject company in the past twelve months (vii) have received any compensation for product or services from the subject company in the past twelve
months (viii) have received any compensation or other benefits from the subject company or third party in connection with the research report. RA involved in the
preparation of this research report discloses that he / she has not served as an officer, director or employee of the subject company. RA involved in the preparation of
this research report and VSL discloses that they have not been engaged in the market making activity for the subject company. Our sales people, dealers, traders and
other professionals may provide oral or written market commentary or trading strategies to our clients that reflect opinions that are contrary to the opinions expressed
herein. We may have earlier issued or may issue in future reports on the companies covered herein with recommendations/ information inconsistent or different those
made in this report. In reviewing this document, you should be aware that any or all of the foregoing, among other things, may give rise to or potential conflicts of
interest. We may rely on information barriers, such as "Chinese Walls" to control the flow of information contained in one or more areas within us, or other areas, units,
groups or affiliates of VSL. This report is for information purposes only and this document/material should not be construed as an offer to sell or the solicitation of an
offer to buy, purchase or subscribe to any securities, and neither this document nor anything contained herein shall form the basis of or be relied upon in connection
with any contract or commitment whatsoever. This document does not solicit any action based on the material contained herein. It is for the general information of the
clients / prospective clients of VSL. VSL will not treat recipients as clients by virtue of their receiving this report. It does not constitute a personal recommendation or
take into account the particular investment objectives, financial situations, or needs of clients / prospective clients. Similarly, this document does not have regard to
the specific investment objectives, financial situation/circumstances and the particular needs of any specific person who may receive this document. The securities
discussed in this report may not be suitable for all investors. The appropriateness of a particular investment or strategy wi ll depend on an investor's individual
circumstances and objectives. Persons who may receive this document should consider and independently evaluate whether it is suitable for his/ her/their particular
circumstances and, if necessary, seek professional/financial advice. And such person shall be responsible for conducting his/her/their own investigation and analysis of
the information contained or referred to in this document and of evaluating the merits and risks involved in the securities forming the subject matter of this document.
The projections and forecasts described in this report were based upon a number of estimates and assumptions and are inherently subject to significant uncertainties
and contingencies. Projections and forecasts are necessarily speculative in nature, and it can be expected that one or more of the estimates on which the projections
and forecasts were based will not materialize or will vary significantly from actual results, and such variances will likely increase over time. All projections and forecasts
described in this report have been prepared solely by the authors of this report independently of the Company. These projections and forecasts were not prepared with
a view toward compliance with published guidelines or generally accepted accounting principles. No independent accountants have expressed an opinion or any other
form of assurance on these projections or forecasts. You should not regard the inclusion of the projections and forecasts des cribed herein as a representation or
warranty by VSL, its associates, the authors of this report or any other person that these projections or forecasts or their underlying assumptions will be achieved. For
these reasons, you should only consider the projections and forecasts described in this report after carefully evaluating all of the information in this report, including
the assumptions underlying such projections and forecasts. The price and value of the investments referred to in this document/material and the income from them
may go down as well as up, and investors may realize losses on any investments. Past performance is not a guide for future performance. Future returns are not
guaranteed and a loss of original capital may occur. Actual results may differ materially from those set forth in projections . Forward-looking statements are not
predictions and may be subject to change without notice. We do not provide tax advice to our clients, and all investors are s trongly advised to consult regarding any
potential investment. VSL, the RA involved in the preparation of this research report and its associates accept no liabilities for any loss or damage of any kind arising out
of the use of this report. This report/document has been prepared by VSL, based upon information available to the public and sources, believed to be reliable. No
representation or warranty, express or implied is made that it is accurate or complete. VSL has reviewed the report and, in so far as it includes current or historical
information, it is believed to be reliable, although its accuracy and completeness cannot be guaranteed. The opinions expressed in this document/material are subject
to change without notice and have no obligation to tell you when opinions or information in this report change. This report or recommendations or information
contained herein do/does not constitute or purport to constitute investment advice in publicly accessible media and should not be reproduced, transmitted or published
by the recipient. The report is for the use and consumption of the recipient only. This publication may not be distributed to the public used by the public media without
the express written consent of VSL. This report or any portion hereof may not be printed, sold or distributed without the wri tten consent of VSL. This document does
not constitute an offer or invitation to subscribe for or purchase or deal in any securities and neither this document nor anything contained herein shall form the basis
of any contract or commitment whatsoever. This document is strictly confidential and is being furnished to you solely for your information, may not be distributed to
the press or other media and may not be reproduced or redistributed to any other person. The opinions and projections express ed herein are entirely those of the
author and are given as part of the normal research activity of VSL and are given as of this date and are subject to change without notice. Any opinion estimate or
projection herein constitutes a view as of the date of this report and there can be no assurance that future results or events will be consistent with any such opinions,
estimate or projection. This document has not been prepared by or in conjunction with or on behalf of or at the instigation of, or by arrangement with the company or
any of its directors or any other person. Information in this document must not be relied upon as having been authorized or approved by the company or its directors
or any other person. Any opinions and projections contained herein are entirely those of the authors. None of the company or its directors or any other person accepts
any liability whatsoever for any loss arising from any use of this document or its contents or otherwise arising in connection therewith. The information contained herein
is not intended for publication or distribution or circulation in any manner whatsoever and any unauthorized reading, dissemination, distribution or copying of this
communication is prohibited unless otherwise expressly authorized. Please ensure that you have read “Risk Disclosure Document for Capital Market and Derivatives
Segments” as prescribed by Securities and Exchange Board of India before investing in Securities Market.
Ventura Securities Limited - SEBI Registration No.: INH000001634
Corporate Office: I-Think Techno Campus, 8th Floor, ‘B’ Wing, Off Pokhran Road No 2, Eastern Express Highway, Thane (W) – 400608