Adani group - Ventura Securities
250
1
-
Upload
khangminh22 -
Category
Documents
-
view
1 -
download
0
Transcript of Adani group - Ventura Securities

1

( 0 9 t h D e c 2 1 )
For any further query, please email us on [email protected]
TABLE OF CONTENTS
Significant wealth creators 03
Adani Green Energy 06
Adani Ports & Special Economic Zone 50
Adani Transmission 117
Adani Total Gas 161
Adani Enterprises 195
Disclaimer 250
22

( 0 9 t h D e c 2 1 )
For any further query, please email us on [email protected]
Significant wealth creators
From humble origins with the listing of Adani Enterprises Ltd, today the group has spawned
into a multi national diversified conglomerate with a cumulative market cap of 133.25 bn $
comprising 6 listed entities namely
• Adani Enterprises Ltd (AEL) -m.cap 25.6 bn $)
• Adani Ports and SEZ Ltd (APSEZ) -m.cap 21.2 bn $)
• Adani Transmission Ltd (ATL) -m.cap 28.1 bn $)
• Adani Green Energy Ltd (AGEL) -m.cap 29.4 bn $)
• Adani Total gas Ltd (ATGL) -m.cap 26.1 bn $)
• Adani Power Ltd -m.cap 5.4 bn $)
Intergenerational promoters with a large stake bring long term focus to the business
Today Gautam Adani, family and next generation with their vision of “Courage, Commitment
and Trust” have built one of the most vibrant and dynamic business groups. With significant
stake in the listed entities in their individual capacities, they bring to the business stability and
long term focus which has contributed to significant wealth creation.
Strategic partnerships with domain experts have added value to the business entities
Value creation has been the single most important focus that has aided the Adani group.
Wherever essential they have entered into strategic partnerships/JV’s with international
domain leaders to bring best practices to the existing businesses. They roped in
• The Total Energies SE, a French group, for their foray into City Gas Distribution (CGD)
business of Adani Total Gas Ltd (ATGL) and the renewable energy business of Adani
Green Energy Ltd (AGEL). Today, not only is ATGL India’s largest CGD company but
AGEL has gone a step further to emerge as the world’s largest solar energy player by
2025 and the world’s largest renewable energy producer by 2030.
• Adani Wilmar Limited (AWL) an equal JV started in 1999 is today one of India’s largest
agribusiness company which is slated to IPO in the not too distant future. The JV
partner Wilmar group is Asia’s leading agri business group and has scripted the success
story of Adani Wilmar. The edible oil brand Fortune is the leader in its category with
~17% market share.
• When Adani Transmission Limited (ATL) acquired the power distribution business for
the Mumbai geography, they roped in Qatar Investment Authority as a strategic
financial investor in their step down subsidiary Adani Electricity Mumbai Ltd (AEML).
• For its data centre business, Adani Enterprises Ltd (AEL) has entered into a JV with
EdgeConneX, a company with a decade’s experience of serving global cloud service
providers in mature markets.
33

( 0 9 t h D e c 2 0 2 1 )
For any further query, please email us on [email protected]
• In the Airport vertical, AEL is scouting for domain experts who will beef up the growth
of the airports business. In addition, it is also looking at tieing up with business partners
to develop non aero revenue streams.
Secret sauce of the success of the Adani group
1. Executions Skill- The group believes in a time bound execution philosophy with clear
deliverables in place.
2. Capital Management- The group redesigns the capital structure of the asset & has
access to pool of best global investors.
3. Multi fold growth- The business is scaled up to match industry leading practices along
with significant focus on revenue expansion.
4. Value creation- Once the revenue expansion is done, focus turns to earning industry
leading margins via large operating scale.
ESG
The group’s future investment is aligned to sustainable growth with focus on preserving
environment. Adani group has publicly disclosed various ESG goals and is among the few
groups to have ESG committee in place across all its listed companies.
We initiate coverage on the listed entities of the Adani group as follows:
Adani Enterprises Ltd- AEL stands among the few listed company to have generated >30%
CAGR in wealth for its investors Over the years, AEL has incubated various businesses of the
group like transmission, renewable energy, city gas distribution etc which have themselves
gone on to become big business themselves. In its 2nd phase, AEL is currently incubating
several new businesses like airports, data centres, solar manufacturing, roads, defence & green
businesses. Adani Wilmar a JV company is on the verge of unlocking value through its proposed
IPO.
Adani Ports and SEZ Ltd- In a post-covid scenario, where the world is distancing itself from its
over dependance on China, India has emerged as a reliable, responsible and geopolitically
viable option for global manufacturing. Further, favourable policies like Atmanirbhar Bharat,
Make in India Make for World, PLI schemes, etc., have helped create a launch pad for resurgent
Company name Rating CMP INR PT INR
Upside
%
M.cap
INR cr
Revenue
CAGR
FY21-24
%
EBITDA
CAGR
FY21-24
%
PAT
CAGR
FY21-24
%
FY24 RoE
%
FY24 RoIC
%
AEL
Buy for long
term 1,723 1,889 10 189,519 20.6 54.5 10.0 5.8 8.6
APSEZ Buy 770 1,697 121 157,133 24.3 24.8 20.1 18.6 19.0
ATL Buy 1,854 2,797 51 203,921 17.0 20.3 31.2 18.1 10.8
AGEL Buy 1,390 2,810 102 217,343 72.3 78.7 146.9 40.2 11.5
ATGL Buy 1,685 2,012 19 185,356 45.6 33.8 40.1 28.7 28.8
44

( 0 9 t h D e c 2 0 2 1 )
For any further query, please email us on [email protected]
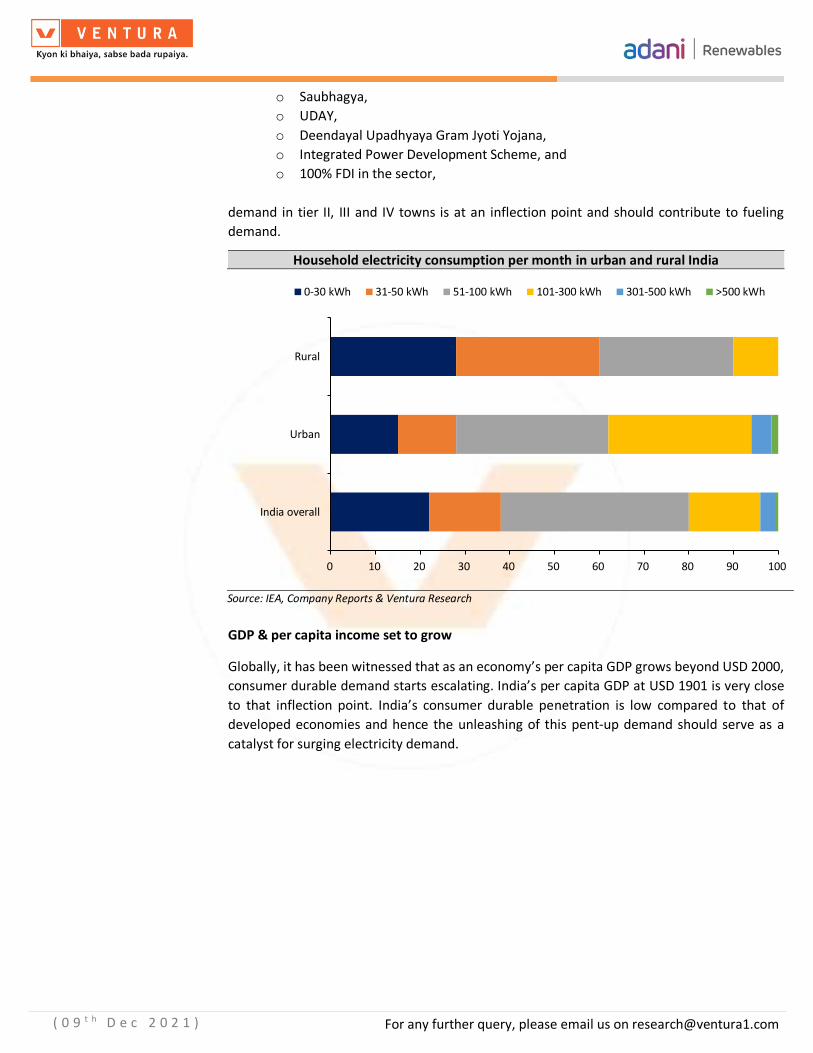
EXIM volumes, which are expected to scale to 1790-2570 MMT by FY30 from 971 MMT clocked
in FY21. Adani Ports & Special Economic Zone Ltd (APSEZ) with its portfolio of 13 ports
(installed capacity of 560 MMT & 28.6% EXIM volume share), is well positioned to expand its
market share to 38.9% from this surge in EXIM trade.
Adani Transmission Ltd- Adani Transmission Ltd (ATL) is India’s leading private sector
transmission player with a 35% market share. ~INR 3 trillion of TBCB projects are expected to
be allocated to the private players over FY21-30. ATL with its superior execution and O&M
skills, demonstrated high ‘total availability factor’, best in class EBIDTA margins of 92% and
capital management excellence is best placed to benefit from this. The 35-year TBCB contracts
provide for long term visibility. Over FY21-24, we expect a 33.4%/26.1% CAGR in the
operational asset base and revenues to INR 41,560 crore /INR 6,257 crore respectively.
Adani Green Energy Ltd- Adani Green Energy Limited (AGEL) is one of the largest renewable
companies in India, with a current project portfolio of 13,990 MW and 20,284 of MW locked-
in growth (from under construction assets). The company has aspirations to up its installed
capacity to 25 GW / 45 GW by 2025 / 2030 respectively making it the world’s largest renewable
company by capacity. With India’s stated intent of procuring 450 GW from renewable energy
by 2030, AGEL is well placed to benefit from this megatrend. Currently the company has a
~5.3% of share in India’s renewable installed capacity, which is set to grow to ~10% by 2030.
Adani Total Gas Ltd- ATGL, a JV (equal stake of 37.4%) between Adani Group and French
energy major Total Energies (TOTAL), is India’s largest private-sector city gas distributor (CGD),
with 19 standalone operational geographical areas (GAs). In addition, ATGLs equal stake JV
with Indian Oil Corporation (IOC) – IOAGPL houses another 19 GA thus enabling ATGL to
emerge as a true pan India CGD player. Both JV partners, Total (which has operations in 108
countries) and IOC (parent of Petronet LNG), bring rich experience in sourcing LNG at
competitive prices besides ensuring availability.
55

( 0 9 t h D e c 2 1 )
For any further query, please email us on [email protected]
TABLE OF CONTENTS
Adani Green Energy Ltd.
Parabolic growth trajectory while significantly de-risked
66

( 0 9 t h D e c 2 0 2 1 )
For any further query, please email us on [email protected]
Adani Green Energy Limited (AGEL) is one of the largest renewable companies in
India, with a current project portfolio of 13,990 MW and 20,284 of MW locked-in
growth (from under construction assets). The company has aspirations to up its
installed capacity to 25 GW / 45 GW by 2025 / 2030 respectively making it the world’s
largest renewable company by capacity. With India’s stated intent of procuring 450
GW from renewable energy by 2030, AGEL is well placed to benefit from this
megatrend. Currently the company has a ~5.3% of share in India’s renewable installed
capacity, which is set to grow to ~10% by 2030.
AGEL’s strong execution skills, land procurement strategy and superlative capital
management have ensured that project implementation is done before time, leading
to a shorter payback period and faster cash flow generation. Further, the fact that
Adani Green is able to dispatch its entire capacity at a 10% discount to the current
market clearing price (of the relevant state) and still deliver returns ensures that AGEL
has the highest possible efficiency and return on investment.
Risk mitigation through long term PPAs, pervasive use of technology, roping in Total
Energy as a strategic partner, and matching debt mature profile to the life-cycle of
the PPA contracts is an added advantage.
Marquee global investors have subscribed to its Investment Grade long term Green
Bonds and consortium of 18 international bankers provide for construction finance
on revolving credit. This is a testimony of AGEL’s inherent strengths in attracting
global capital, which is so vital for sustaining the blitzkrieg pace of growth. On ESG
compliance too, AGEL has left no stone unturned to deploy best global practices.
Despite the fact that AGEL has seen a sharp spurt in its stock price (outperforming the
broader index and its peers by a wide margin), we believe that there exists significant
room for further upside. We initiate coverage on AGEL with a BUY and FY24 based
target price of INR 2,810 per share, implying 102% upside over the next 24 months.
Key Financial Data (INR Cr, unless specified)
Revenue EBITDA
Net Profit
EBITDA (%)
Net Profit
(%) EPS (₹)
BVPS (₹)
RoE (%)
RoIC (%)
P/E (X) P/BV
(X)
EV/ EBITDA
(X)
FY20 2,549 1,450 (23) 56.9 (0.9) (0.1) 14.8 (1.0) 6.6 (9,371.4) 93.3 158.0
FY21 3,124 2,235 210 71.5 6.7 1.3 13.6 9.5 7.0 1,026.4 101.4 106.6
FY22E 6,224 4,767 1,084 76.6 17.4 6.9 20.5 33.0 10.1 198.8 67.1 52.4
FY23E 9,129 7,294 1,414 79.9 15.5 9.0 29.6 30.1 10.1 152.5 46.6 36.7
FY24E 15,978 12,750 3,162 79.8 19.8 20.2 49.8 40.2 11.5 68.2 27.7 23.3
BUY @ CMP INR 1,390 Target: INR 2,810 in 24 months Upside Potential: 102%
Parabolic growth trajectory while significantly de-risked
Industry Power
Scrip Details
Face Value (INR) 10.0
Market Cap (INR Cr) 2,17,343
Price (INR) 1,390
No of Shares O/S (Cr) 156
3M Avg Vol (000) 52.2
52W High/Low (INR) 1428/860
Dividend Yield (%) 0
Shareholding (%) Sept 2021
Promoter 60.14
Institution 18.15
Public 21.71
TOTAL 100.0
Price Chart
20,000
30,000
40,000
50,000
60,000
70,000
10
510
1,010
1,510
Jun
-18
Dec
-18
Jun
-19
Dec
-19
Jun
-20
Dec
-20
Jun
-21
AGEL (LHS) SENSEX (RHS)
Adani Green Energy Ltd.
77

( 0 9 t h D e c 2 0 2 1 )
For any further query, please email us on [email protected]
Source: Company Reports & Ventura Research
0
500
1,000
1,500
2,000
Apr-20 Jul-20 Oct-20 Jan-21 Apr-21 Jul-21 Oct-21
1 year forward EV/EBITDA band chart
EV per sh 52.07x 58.57x
65.07x 71.57x 78.07x
-50
0
50
100
150
200
250
300
Apr
-20
Jun
-20
Aug
-20
Oct
-20
Dec
-20
Feb
-21
Apr
-21
Jun
-21
Aug
-21
Oct
-21
EV/EBITDA & Std Deviation
EV/EBIDTA Average Upper SD 1
Upper SD 2 Lower SD 1 Lower SD 2
Strong growth visibility drives price
88

( 0 9 t h D e c 2 0 2 1 )
For any further query, please email us on [email protected]
Valuation
Adani Green Energy Limited (AGEL) is one of the largest renewable energy companies in India,
with a current project portfolio of 13,990 MW with locked-in growth of 20,284 MW.
We have used the DCF model to value AGEL since it has signed PPAs that throw up significant
cash over the next 25 years (typical life of a renewable PPA contract). While AGEL’s stated
intent is to build capacities of 45GW by 2030, the confirmed PPAs on hand are for 20.3 GW by
2025 and cash flows from these projects would be available at least till FY50. We have modeled
25 GW of capacity by FY25 and over the period FY25-FY55, we have conservatively modeled
1000 MW per annum. Any further confirmed PPA’s signed would be over and above our
estimates. We have also built-in conservative assumptions with regards to CUF & margin
assumptions and we would want to see “proof of the pudding” before we incorporate the same
in our financial model.
India, in its bid to achieve net zero emissions by 2070, would have to rely heavily on renewable
energy and enhance its total capacity 14.5X to 5630 GW (bulk of which would be from
renewable sources). As demonstrated across all business units of the Adani Group, they intend
to achieve significant scale and size and hence, our 1000 MW per annum capacity addition
post 2025 is an extremely conservative estimate.
We have discounted back the future cash flows to FY24 and value the company at INR 2,810
per share, presenting an upside of 102% from the CMP of INR 1,390.
99

( 0 9 t h D e c 2 0 2 1 )
For any further query, please email us on [email protected]
DCF Valuation
Source: Company Reports & Ventura Research
FY22E FY23E FY24E FY25E FY26E FY27E FY28E FY29E FY30E FY40E FY45E FY50E FY55ETotal Installed capacity (MW) 7,954 11,234 18,300 25,000 26,000 27,000 28,000 29,000 30,000 40,000 45,000 50,000 55,000
Solar capacity (MW) 5,163 6,793 13,409 20,109 21,109 22,109 23,109 24,109 25,109 35,109 40,109 45,109 50,109
Wind capacity (MW) 1,101 1,701 2,151 2,151 2,151 2,151 2,151 2,151 2,151 2,151 2,151 2,151 2,151
Hybrid capacity (MW) 1,690 2,740 2,740 2,740 2,740 2,740 2,740 2,740 2,740 2,740 2,740 2,740 2,740
Solar CUF (%) 25.0 25.3 25.4 25.4 25.4 25.4 25.4 25.4 25.4 25.4 25.4 25.4 25.4
Wind CUF (%) 36.8 38.6 38.6 38.6 38.6 38.6 38.6 38.6 38.6 38.6 38.6 38.6 38.6
Hybrid CUF (%) 40.0 46.0 46.0 46.0 46.0 46.0 46.0 46.0 46.0 46.0 46.0 46.0 46.0
Solar Revenue (Rs.Cr.) 4,318 5,080 10,771 21,344 23,808 24,705 25,584 26,411 27,230 34,701 38,026 41,114 43,967
Wind Revenue (Rs.Cr.) 774 1,463 2,134 2,134 2,134 2,133 2,133 2,133 2,133 2,133 2,133 2,133 2,133
Hybrid Revenue (Rs.Cr.) 426 2,556 3,043 3,043 3,043 3,043 3,043 3,043 3,043 3,043 3,043 3,043 3,043
EBIDTA (Rs.Cr.) 4,767 7,294 12,750 21,188 23,155 23,900 24,603 25,265 25,919 31,851 34,506 36,972 39,250
EBIDTA Margin (%) 76.6 79.9 79.8 79.8 79.8 79.9 79.9 79.9 79.9 79.8 79.8 79.8 79.8
Long Term Market Return 11.0%
Risk Free Rate 6.4%
Cost of Equity 6.7%
Interest Rate 10.5%
Tax Rate 25.2%
Cost of Debt 7.9%
WACC 7.1%
Terminal Value Growth 3.0%
Terminal Value 6,11,329
FY24E FY25E FY26E FY27E FY28E FY29E FY30E FY40E FY45E FY50E FY55E
FCFF (20,855) (19,032) 4,296 13,556 14,126 14,611 15,147 19,164 21,131 22,224 24,194
Discount Factor from FY24 0.93 0.87 0.81 0.76 0.71 0.66 0.62 0.31 0.22 0.16 0.11
Discounted FCFF from FY24 (19,477) (16,600) 3,499 10,313 10,036 9,694 9,386 5,994 4,695 3,508 2,713
Total of Discounted FCFF FY24 1,42,870
FY24 Present Value of Terminal Value 3,78,808
FY24 Value of Operations 5,21,678
FY24 Net Debt 82,153
FY24 Value of Equity 4,39,525
FY24 Value of Equity per share 2,810
1010

( 0 9 t h D e c 2 0 2 1 )
For any further query, please email us on [email protected]
Our Bull and Bear Case Scenarios
We have prepared a Bull and Bear case scenario based on AGEL’s terminal growth.
• Bull Case: With the ambitious capacity expansion plan to become the world’s largest
renewable energy generation company. AGEL has a significant opportunity to grow its
business in the coming years. We have assumed a terminal growth of 4%, which will
result in a Bull case price target of INR 3,629 (upside of 161% from the CMP).
• Bear Case: We have assumed a terminal growth of 1%, which will result in a Bear case
price target of INR 1,982 (upside of 43% from the CMP). Our base case implies a
significant margin of safety for buying at the current price.
Bull & Bear Case Scenario
Source: Ventura Research
Investment Triggers
• Strong growth potential of the industry
• De-risking strategies that provide long term revenue visibility and strong cashflow generation.
Catalysts
• Need for adoption of renewable energy sources
• Rapid urbanization, rural electrification, adoption of EVs, raising consumer durable penetration, growth in GDP & per capita income, Make in India and China+1 are likely to increase power consumption in India.
Bull Case Price
INR 3,629 per share
Target Price
INR 2,810 per share
Bear Case Price
INR 1,982 per share
Current Price
INR 1,390 per share
4% terminal value growth
3% terminal value growth
1% terminal value growth
1111

( 0 9 t h D e c 2 1 )
For any further query, please email us on [email protected]
Valuation and Comparable Metric of Domestic and Global Renewable energy Companies
Source: Ventura Research & Bloomberg
AGEL is a pureplay renewable IPP
NTPC & Tata Power are energy companies with a mix bag of thermal, renewable, manufacturing etc.
Sterling & Wilson is primarily an EPC company.
Azure & Renew Power are Indian corporates listed in US
For any further query, please email us on [email protected] 1212

( 0 9 t h D e c 2 1 )
For any further query, please email us on [email protected]
Strong EBIDTA growth and significant room for margin sustainability are potential re-rating factors
Source: Ventura Research, ACE Equity & Bloomberg
Adani Green
Tata PowerNTPC Ltd.
JSW Energy
Enphase Energy
Darling Ingredients
Brookfield Renewable
Clearway Energy
First Solar
NextEra Energy
SolarEdge Tech
Orsted A/S
Siemens Gamesa
Enel
Azure Power
-2.0
8.0
18.0
28.0
38.0
48.0
58.0
68.0
78.0
88.0
5.5 10.5 15.5 20.5 25.5 30.5 35.5 40.5
FY24
EB
IDT
A C
AG
R (
%)
FY24 EV/EBIDTA (x)
Adani Green
Tata Power
NTPC Ltd.
10
20
30
40
50
60
70
80
90
100
110
4 14 24 34 44 54 64 74 84 94
FY24
Rev
en
ue
CA
GR
(%
)
FY24 EBIDTA Margin (%)
1313

( 0 9 t h D e c 2 0 2 1 )
For any further query, please email us on [email protected]
Financial Analysis and Projections
We expect AGEL’s overall revenues to grow at a CAGR of 72.3% to INR 15,978.0 cr over FY21-
24E as 18,300 MW of renewable capacity is operationalized. This blitzkrieg growth is
supported by
• 65% CAGR in solar installation capacity to 13.4 GW, resulting in 86% CAGR volume
growth to 31,424 Mn Units, and 68% CAGR revenue growth to INR 10,771 cr.
• wind power generation capacity is expected to grow at 84% CAGR to 2 GW leading to
a 132% CAGR volume growth to 7,412 Mn Units, and 122% CAGR revenue growth to
INR 2,134 cr.
• hybrid generation is expected to clock a 27% CAGR to 2.7 GW triggering a 96% CAGR
volume growth to 11,041 Mn Units, and 93% CAGR revenue growth to INR 3,043 cr.
EBITDA is estimated to grow at a CAGR of 78.7% to INR 12,750.4 cr. PAT is estimated to grow
at a CAGR of 146.9% to INR 3,162.4 cr. Subsequently, RoE and RoIC are expected to improve
to 40.2% (+3,069bps) and 11.5% (+445bps), respectively, by FY24E.
1414

( 0 9 t h D e c 2 0 2 1 )
For any further query, please email us on [email protected]
AGEL’s Financial Summary
Source: Company Reports & Ventura Research
1515

( 0 9 t h D e c 2 0 2 1 )
For any further query, please email us on [email protected]
AGEL’s story in charts
0
50
100
150
200
250
0
2,000
4,000
6,000
8,000
10,000
12,000
14,000
16,000
18,000
FY18 FY19 FY20 FY21 FY22E FY23E FY24E
Strong revene growth on the cards
Solar power Wind power Hybrid power
EPC Traded Goods YoY Growth (%)
(%)INR Cr.
0
20
40
60
80
100
120
FY19 FY20 FY21 FY22E FY23E FY24E
Solar projects to remain the mainstay of the renewable energy source
Solar power Wind power Hybrid power
EPC Traded Goods
0.0
1.0
2.0
3.0
4.0
5.0
6.0
0
10,000
20,000
30,000
40,000
50,000
60,000
70,000
80,000
90,000
FY19 FY20 FY21 FY22E FY23E FY24E FY25E
Growing energy units sale
Total Units sale Blended Average Tariff (Rs./Unit)
Mn Units Rs.
0
1
2
3
4
5
6
0
5,000
10,000
15,000
20,000
25,000
30,000
FY19 FY20 FY21 FY22E FY23E FY24E
Growing units sales across sources
Solar Units sale Wind Units sale
Hybrid Units sale Solar Tariff (Rs./Units)
Wind Tariff (Rs./Units) Hybrid Tariff (Rs./Units)
Mn Units Rs.
(40)
(20)
0
20
40
60
80
100
(2,000)
0
2,000
4,000
6,000
8,000
10,000
12,000
14,000
FY18 FY19 FY20 FY21 FY22E FY23E FY24E
Improving profitability
EBITDA Net Profit
EBITDA Margin (%) Net Margin (%)(%)
INR Cr
(30)
(20)
(10)
0
10
20
30
40
50
0
20,000
40,000
60,000
80,000
1,00,000
FY18 FY19 FY20 FY21 FY22E FY23E FY24E
Improving return ratio despite ongoing capex
Net Worth Invested Capital
RoE (%) RoIC (%)
(%)INR Cr
1616

( 0 9 t h D e c 2 0 2 1 )
For any further query, please email us on [email protected]
Source: Company Reports & Ventura Research
0
2
4
6
8
10
12
0
20,000
40,000
60,000
80,000
1,00,000
FY18 FY19 FY20 FY21 FY22E FY23E FY24E
Higher debt due to huge capex plans
Total Debt Net Debt
Net Debt to Equity (X) Net Debt to EBITDA (X)
(X)INR Cr
(4,000)
(2,000)
0
2,000
4,000
6,000
8,000
10,000
(25,000)
(20,000)
(15,000)
(10,000)
(5,000)
0
5,000
10,000
FY17 FY18 FY19 FY20 FY21 FY22E FY23E FY24E
High capex to be a drag on FCF generation
CFO FCF
CFO to EBITDA (%) FCF to Net Profit (%)
(%)INR Cr
1717

( 0 9 t h D e c 2 0 2 1 )
For any further query, please email us on [email protected]
Company overview
With a portfolio of 13,990 MW of installed capacity and secured PPAs of 20,284 MW, Adani
Green Energy Limited (AGEL), part of the Adani group, is one of the largest renewable energy
companies in India. The electricity generated is supplied to sovereign and sub sovereign
promoted entities on the back of 25-year long-term Power Purchase Agreements (PPAs). With
a portfolio of 54 operational projects and 12 projects under construction, AGEL is driving India
on its renewable energy journey.
Source wise Capacity Breakup (in MW)
Source: Company Reports & Ventura Research
By 2030, AGEL aspires to emerge as the world’s largest renewable energy company scaling its
renewable generation capacities to 25GW by 2025 and further to 45GW by 2030.
AGEL is the first Indian renewable energy developer to issue a 20-year amortizing project
finance type structure - the USD Green Bond of USD 362.5 mn. This provides foreign investors
an opportunity to participate in the Indian renewable energy space via investment-grade
bonds.
AGEL past performance – launchpad for its aggressive growth trajectory
In the past 5 years, while leading peers have struggled to grow, AGEL has successfully
onboarded significant capacity driven by
• strong pipeline of greenfield capacities
• fully funded capex
• harnessing inorganic growth opportunities
However, margins of the company remained volatile in the past 5 years.
4763
647
15393
2151
2740
Solar Wind Hybrid
5,410 MW operational
20,284 MW Locked-in Growth
1818

( 0 9 t h D e c 2 0 2 1 )
For any further query, please email us on [email protected]
AGEL posted profitable growth
Source: Company Reports & Ventura Research
Particulars FY17 FY18 FY19 FY20 FY21 CAGR (%) Min (%) Max (%) FY17 FY18 FY19 FY20 FY21
Adani Green 1716.9 195.1 39.0 23.9 22.6 58.0 22.6 1716.9 80.4 56.3 74.1 56.9 71.5
TATA Power -6.5 -2.7 11.3 -2.5 11.4 4.2 -6.5 11.4 20.0 9.0 10.0 18.0 18.0
SW Solar 19.9 -32.3 -8.9 -9.6 -32.3 19.9 8.0 8.0 6.0 -7.0
Websol Energy 5.9 -38.1 -62.6 185.2 -21.5 -15.1 -62.6 185.2 10.0 9.0 -36.0 1.0 22.0
NTPC 11.8 7.4 13.9 9.2 1.9 8.0 1.9 13.9 26.0 26.0 23.0 29.0 31.0
Borosil Renewable 34.3 13.6 20.4 25.0 85.0 -2.6 13.6 85.0 11.0 14.0 14.0 14.0 39.0
JSW Energy -15.9 -2.6 13.5 -9.5 -16.3 -15.1 -16.3 13.5 40.0 34.0 31.0 43.0 42.0
KPI Global -6.0 23.0 9.0 72.0 73.0 40.7 -6.0 73.0 68.0 59.0 45.0 46.0 57.0
India Macro Factors
Power Consumption Growth (%) 4.1 6.1 5.2 1.3 -1.1 3.1 -1.1 6.1
GDP Growth - Nominal (%) 11.8 11.0 10.5 7.8 -3.0 7.5 -3.0 11.8
GDP Growth - Real (%) 8.3 6.8 6.5 4.0 -7.3 3.5 -7.3 8.3
Core Sector Growth (%) 5.3 4.5 5.8 -8.6 12.6 0.0 -8.6 12.6
Revenue Growth (%) EBITDA Margin (%)5 yrs Revenue Performance
1919

( 0 9 t h D e c 2 0 2 1 )
For any further query, please email us on [email protected]
Key growth drivers
Gargantuan growth opportunity for the renewable energy sector
The coming together of multiple factors has resulted in the renewable energy sector offering
growth potential which is expected to sustain for decades. These factors are enumerated
below
Low per capita electricity consumption cannot last for very long
Today, India is the third-largest energy-consuming country globally, and yet it has one of the
lowest per capita consumption. In our opinion, this dichotomy cannot last for very long and
the per capita consumption is only set to explode.
World Per capital energy consumption (kWh)
Source: Ministry of power, World data, Company Reports & Ventura Research
As per an independent think-tank Council on Energy, Environment and Water (CEEW), for net
zero emissions by 2070 India would need to put up 5630 GW of renewable power (or ~14.5X
the current installed capacity of 388 GW). The reasons for this surge in renewable power
demand are enumerated below
• India’s population to overtake China by 2027
It is expected that by 2027, India will become the most populous country, overtaking
China.
0
2,000
4,000
6,000
8,000
10,000
12,000
14,000
0
200
400
600
800
1,000
1,200
India Per capita electricity (kWh)
5% CAGR 2010-18
2020

( 0 9 t h D e c 2 0 2 1 )
For any further query, please email us on [email protected]
Population growth -
Source: Statista, Company Reports & Ventura Research
With its median age of 29 (compared to 38 for USA and China), India has the largest youthful
population in the world. This will ensure that the growth in consumption will sustain over
decades.
India’s youthful population to sustain power consumption growth for decades -
Source: Statista, Company Reports & Ventura Research
• Electricity demand in Tier II, III and IV towns set for a long-term upward trajectory
Over 65.5% of India’s electricity demand is concentrated among the cosmopolitan
centres and large cities. With the success of the reform schemes like
o 24*7 power for all,
150
350
550
750
950
1,150
1,350
1,550
1,750
China India USA Indonesia Pakistan Brazil
Population of countries (in Mn.) 2021 Population of countries (in Mn.) 2030
Population of countries (in Mn.) 2050
15
20
25
30
35
40
45
50
India China USA Brazil Japan
2121
( 0 9 t h D e c 2 0 2 1 )
For any further query, please email us on [email protected]
o Saubhagya,
o UDAY,
o Deendayal Upadhyaya Gram Jyoti Yojana,
o Integrated Power Development Scheme, and
o 100% FDI in the sector,
demand in tier II, III and IV towns is at an inflection point and should contribute to fueling
demand.
Household electricity consumption per month in urban and rural India -
Source: IEA, Company Reports & Ventura Research
GDP & per capita income set to grow
Globally, it has been witnessed that as an economy’s per capita GDP grows beyond USD 2000,
consumer durable demand starts escalating. India’s per capita GDP at USD 1901 is very close
to that inflection point. India’s consumer durable penetration is low compared to that of
developed economies and hence the unleashing of this pent-up demand should serve as a
catalyst for surging electricity demand.
0 10 20 30 40 50 60 70 80 90 100
India overall
Urban
Rural
0-30 kWh 31-50 kWh 51-100 kWh 101-300 kWh 301-500 kWh >500 kWh
2222

( 0 9 t h D e c 2 0 2 1 )
For any further query, please email us on [email protected]
Under penetration of consumer durables demand sets the tone for exponential growth in electricity consumption
Source: Havells presentation, Company Reports & Ventura Research
Appliance ownership in India has been growing and diversifying. In 1990, the only appliance
that most households had was a ceiling fan. By 2019, television had also become quite
commonplace, and the number of refrigerators was steadily increasing.
By 2040, air conditioners, personal computers, and washing machines are expected to become
much more common, particularly in urban areas.
Indian household’s appliance ownership is set to explode
Source: IEA, Company Reports & Ventura Research
An illustration of how the demand explosion is expected to occur can be better visualized
taking into consideration demand for air conditioning. Air conditioner stock is expected to
zoom to 670 million units by 2040 from a paltry 30+ million units presently. As a result, India’s
3
23
43
63
83
103
123
India China USA
10 10
15
11
5
7
9
11
13
15
17
5,000
10,000
15,000
20,000
25,000
30,000
35,000
40,000
45,000
50,000
WashingMachines
Refrigerator Room AirConditioner
ColorTelevision
2019 2025E CAGR (%)
INR Cr
-0.2
0.0
0.2
0.4
0.6
0.8
1.0
1.2
1.4
1.6
1990 2000 2010 2019 2030 2040
Room Air Conditioner Color Television Refrigerator
Personal computer Washing Machines Dishwasher
Dryer
2323

( 0 9 t h D e c 2 0 2 1 )
For any further query, please email us on [email protected]
consumption of electricity for cooling will grow six-fold to reach 650 TWh by 2040. Around
two‐thirds of this demand will come from the residential sector, with the remainder stemming
from a steady rise in office buildings, retail, education, hotels, and hospitals, etc.
Present-day lifestyle of always being connected to fuel incremental demand
The present-day lifestyle of always being connected, would mean that the demand on the
existing energy capacities would only multiply.
Connected lifestyle
Source: Company Reports & Ventura Research
Action on climate change to lead to an irreversible change for renewable energy sources
With climate change and global warming being a pressing issue, alternate sources of non-
polluting fossil fuel-based energy resources would have to be speedily inducted into the energy
mix. Solar and wind are infinite sources of this non-polluting energy.
India, in keeping with its pledge at the Paris convention and COP26, has undertaken to enhance
the renewable energy generation from the current 175 GW to 450 GW by 2030.
During the COP 26 summit, the Indian PM has taken a pledge to meet 50 percent of the
country’s energy requirements from renewable energy (RE) by 2030.
2424

( 0 9 t h D e c 2 0 2 1 )
For any further query, please email us on [email protected]
Power generation growth & capacity break-up -
Source: Ministry of power, Company Reports & Ventura Research
Installed Capacity Mix 2030
Source: CEA, Company Reports & Ventura Research
India has abundant untapped sources of renewable energy
The National Institute of Solar Energy has assessed India’s solar potential at 748 GW (assuming
3% wasteland coverage by solar PV modules). The assessed wind energy potential, as per the
National Institute of Wind Energy, is estimated at 302.25 GW at 100 meters above ground
level.
(5)
0
5
10
15
20
0200400600800
1,0001,2001,4001,600
Power Generation (Bn Units)
Fossil Fuel Generation Grw (%)
Non-Fossil Fuel Generation Grw (%)
Power Generation Grw (%)
Bn Units (%)
Power generation sources break-up (%)
Coal Other Fosil fuel
Hydro Wind, Solar & Other RE
Nuclear
Fossil Fuels Non-Fossil Fuels
2525

( 0 9 t h D e c 2 0 2 1 )
For any further query, please email us on [email protected]
State wise potential of renewable energy generation
Source: karenvis, Company Reports & Ventura Research
These represent adequate sources of renewable energy to meet India’s total energy
requirements.
Current solar and wind capacity installation suggest significant growth opportunities still to be tapped
Source: CEA, Company Reports & Ventura Research
161
120 110 111 81
469
0
50
100
150
200
250
300
350
400
450
500
Rajasthan Gujarat Maharashtra Jammu &Kashmir
Karnataka Others
Wind Energy (GW) Solar Energy (GW) Total Renewable potential (GW)
0
2
4
6
8
10
12
14
16
Solar Wind
2626

( 0 9 t h D e c 2 0 2 1 )
For any further query, please email us on [email protected]
Solar & wind share of total annual generation in India's renewables-rich states -
Source: CEA, Company Reports & Ventura Research
Need for electric mobility solutions
The global drive to embrace electric mobility itself would mean that power requirements
would surge dramatically.
The subsidy programs Faster Adoption and Manufacturing of Electric Vehicles (FAME) 2015
and the second phase of the policy, FAME‐II 2019 (with a budget of $1.4 billion for three years)
provided the much-needed initial encouragement for the growth of EVs in India. The incentives
included were not only for the purchase of electric and hybrid vehicles but also for the
deployment of charging stations.
It is estimated that ~7 million electric cars will ply on Indian roads by 2030 and 27 million by
2040. A more significant opportunity for electrification exists in the form of 2W & 3W EVs.
From 1.8 million 2W & 3W in 2019, it is estimated that this number will gallop to 55 million by
2030 and 160 million by 2040.
0
5
10
15
20
25
30
35
Solar Wind
2727

( 0 9 t h D e c 2 0 2 1 )
For any further query, please email us on [email protected]
EV Penetration (%)
Source: KPMG, Company Reports & Ventura Research
Fuel inflation will get contained in a renewable energy regime
Fossil fuel inflation has been a cash guzzler for Indian households. On the other hand,
renewable energy contracts are typically long-term in nature and the recent downtrend in
price discovery has proven that declining prices of renewable energy (lower than fossil fuels)
supplies are possible. This, in our opinion, is one of the single largest attributes of renewable
energy that can accelerate EV adoption and replace IC vehicles.
AGEL leveraging the large renewable energy opportunity
Adani Green Energy Limited (AGEL), capitalizing on the large renewable energy opportunity,
has been quick to establish one of the largest Indian renewable companies. Today, it has an
operational portfolio of 5.4 GW out of the 20.4 GW of PPA contracts, offering a 4x locked-in
growth.
The portfolio also includes an inorganic acquisition of 5 GW renewable assets of SB Energy
India. This portfolio holds 1,700 MW of operational renewable assets, 2,554 MW of assets
under construction and 700 MW of assets near construction. Solar capacity accounts for 84%
of the portfolio (4,180 MW), wind-solar hybrid capacity accounts for 9% (450 MW) and wind
capacity accounts for 7% (324 MW).
The total renewable portfolio of AGEL of around ~20.4 GW makes the company the largest
renewable power developer in India today. By 2030, AGEL aspires to build a renewable energy
capacity of 45 GW. In the process, AGEL by 2025 would become the world’s largest solar power
company and the largest renewable power company by 2030. Currently the company has a
~5.3% share in India’s renewable installed capacity, which is set to grow to ~10% by 2030.
Segment Sub-segment EV Penetration (%)
2025 2030
2W Scooters 15-25 50-70 B2B 40-60 60-80 B2C 13-18 40-60 Motorcycles 1-2 10-20 Overall 7-10 25-35
3W Overall 35-45 65-75
4W-PV Personal 1-3 10-15 Commercial 5-10 20-30
Buses STUs 15-25 25-40
2828

( 0 9 t h D e c 2 0 2 1 )
For any further query, please email us on [email protected]
AGEL’s aspirations defying gravity
Source: Company Reports & Ventura Research
AGEL has been successful in de-risking all aspects of capacity creation that has ensured speed
in scaling up
AGEL’s speed in building capacity has been nothing less than extraordinary. They have been
able to scale their capacities given their
- strong project management and execution skills,
- in-house EPC and O&M, which is a low-cost enabler,
- a speedy implementation which results in lower payback and early cashflow generation,
- leveraging global capital at competitive costs & elongated maturities that help in sustaining
cashflow
- ability to tie-up long term fixed price PPAs with low counterparty risk providing for project
viability and revenue visibility
Strong project management and execution skills
Land acquisition experience and ability to secure right-of-way
Land acquisition and securing the ‘right-of-way’ are the biggest challenges to the timely
completion of the projects. Adani Group has rich experience in pan-Indian land identification
and pricing as well as liaisoning with local and state-level officials for securing the right of way.
As a result of which, it has a head start compared to its peers.
The Adani Group has been proactive in identifying ~2 lac acres of land at 85+ locations pan-
India having good renewable energy potential. It has already secured the purchase of 1 lac
acres with its philosophy of resource planning 3 years in advance.
1.9 2.0 2.5 3.5
8.2
12.3
18.3
25.0
45.0
1.0
6.0
11.0
16.0
21.0
26.0
31.0
36.0
41.0
46.0
51.0
FY18 FY19 FY20 FY21 FY22E FY23E FY24E FY25E FY30E
2929

( 0 9 t h D e c 2 0 2 1 )
For any further query, please email us on [email protected]
Where ever possible AGEL has introduced a combination of bi-facial & mono-facial PV modules
to maximize “sun capture”, thereby lowering its land footprint per MW to 3.2 acres per MW
(from the earlier 5 acres per MW).
Project implementation initiated only post securing 100% transmission connectivity
Further, the company ensures 100% transmission connectivity before any project
implementation is initiated. This helps in mitigating any unforeseen risks before
implementation of any projects.
Centralized and digitally-enabled Project Management & O&M teams ensure smooth
operational sustenance
For project implementation, it has well-established standardized SOPs for execution and O&M.
All project implementation is centrally managed by a Project Management and Assurance
Group (PMAG) and 125 strong Energy Network Operation Center (ENOC) . The digitally-
enabled ENOC provides real-time data monitoring with regards to electricity generation,
locations of plant faults, and rectification.
The capable of fault monitoring has been refined right down to the module level of 315 watts i.e.
0.000315 MW and at each WTG level for the wind farms. Further at the inception stage itself, we ensure
plants design is configured to generate such a granular level of data. AGEL’s IoT and Cloud-Based
Analytics Platform at the ENOC enables analytics driven real time monitoring of renewable plants
across 12 states in India thereby ensuring high plant availability of 99% (Solar) and significantly
high power supply EBITDA of over 90%.
As a second layer of performance assurance process of integrating and using automated drones for
thermography of solar modules for identifying module-level faults and waer & tear of WTGs is a;lso
being taken up.
Thus, remote management of all sites from a single location leads to rapid scale-up of capacity.
For O&M, AGEL deploys ~3-4 employees for a 250 MW plant. Further, outsourced contract
labour is deployed on a fortnightly basis and nearly ~20% of the company’s plants undertake
robotic cleaning of the PV modules. For training of filed engineers modern technologies like
AR & VR are being experimented with.
This wholistic technology-driven approach and in-depth data analytic has enabled AGEL benchmark
energy generation near P50 level generation (for solar) and P75 level (for wind) which is at par with the
highest global thresholds.
Assured & timely equipment supply from global vendors ensures timely project execution
The scale at which the company operates, assured supply chain becomes important. AGEL has
strong relationship with global vendors which results in timely supply at cheapest of costs
without compromising on quality.
The vibrancy of this supply chain was tested during the pandemic when AGEL was able to
commission 571 MW of capacity without any material delays.
3030

( 0 9 t h D e c 2 0 2 1 )
For any further query, please email us on [email protected]
It also leverages existing relationships with over 200,000 vendors on a pan-India basis which
helps in successful and timely implementation of its projects.
All these measures taken to de-risk project implementation have ensured that capacities are
commenced well ahead of stipulated timelines leading to earlier payback and cashflow
generation.
Advance de-risking for potential pipeline with focus on most critical resource
Source: Company Reports & Ventura Research
Energy network operation center
Source: Company Reports & Ventura Research
3131

( 0 9 t h D e c 2 0 2 1 )
For any further query, please email us on [email protected]
Adequate financing with long tenure and lowest cost ensures project viability and revenue
visibility
The capital requirements for a renewable energy project ranges between INR 4-6 crore per
MW. Considering the aspirations of AGEL, needless to say, there is a huge demand for capital.
To shore up its equity base, AGEL roped in global major Total Energy as a strategic partner.
Total not only invested INR 3707 cr for a 50% stake in 3 SPVs (with a cumulative 2.35 GW of
capacity) but also sourced a 20% stake at the holdco level from the promoters for a sum of
USD 2.5 Bn. For this consideration, Total has one board representative who brings project
execution experience to the table.
AGEL’s Capital Management Program enables de-risking at both the construction and
operation stage while optimizing the stakeholder returns with well-established access to
international capital markets through a revolving construction facility and placement of green
bonds.
Total Energy investment
Source: Company Reports & Ventura Research
Matching funding with the PPA tenure
As 75% of the project capex is funded through debt, AGEL’s ability to tie-up debt at the SPVs
remains a key monitorable.
- The company has issued Green bonds worth USD 750 mn at the holdco level to meet
the equity funding needs of the SPVs. It is also in the process of tying up another USD
950 mn. Moody’s has done credit assessments for a total of USD 1.7 bn.
- AGEL has further secured a revolving Construction Framework Agreement for USD
1.35 bn with participation from 18 international banks to fully fund the construction
pipeline.
Once a project is commissioned and power generation stabilized (within the first three-to-six
months), the construction finance debt is refinanced with the help of long tenure Green bonds.
For this purpose, the company has issued
- ‘BB+‘ rated USD 500 mn Green Bonds of 5 years tenure and 10.5% cost issued for
refinancing 930 MW Restricted Group 1 (RG 1),
- ‘BBB-‘ IG rated USD 362.5 mn Green Bonds of 20 years tenure and 9.5% cost issued for
refinancing 570 MW Restricted Group 2 (RG 2).
3232

( 0 9 t h D e c 2 0 2 1 )
For any further query, please email us on [email protected]
All in all, the company has a total limit of Rs.13000 cr of bond issuance already approved.
Going forward, AGEL is looking to raise long term funding to match the tenures of PPAs,
thereby de-risking any kind of asset liability mismatch.
Funding hierarchy
Source: Company Reports & Ventura Research
Long-term PPA contracts and low counterparty risk
Most of the PPA contracts (88%) secured by AGEL are with sovereign or sub-sovereign counter
parties (NTPC, NHPC, Adani power and SECI). This helps negate the counter party risk of default
or any delays in receipts.
Also, with all of the future power generation being pre-sold, all revenue related uncertainties
are eliminated, leading to long-term asset viability and revenue visibility.
As of today, only ~3% of revenue from Tamil Nadu State Electricity Board (TNEB) are delayed.
This delay has led to a penal interest liability of ~INR 500 cr, which is also receivables.
Low counterparty risk
Source: Company Reports & Ventura Research
Sovereign / Sovereign equivalent rated Others
3333

( 0 9 t h D e c 2 0 2 1 )
For any further query, please email us on [email protected]
Strong revenue visibility on the cards
The company has spread its power generation resources across 12 states which reduces
dependency on any one state as well as weather and state specific risks.
AGEL pan-India presence
Source: Company Reports & Ventura Research
During the period FY21-24E, we expect the solar capacity to grow at 65% CAGR to 13.4 GW
which will resulting in 86% CAGR volume growth to 31,424 Mn Units, and 68% CAGR revenue
growth to INR 10,771 cr.
3434

( 0 9 t h D e c 2 0 2 1 )
For any further query, please email us on [email protected]
During the period FY21-24E, we expect the wind capacity to grow at 84% CAGR to 2 GW which
will resulting in 132% CAGR volume growth to 7,412 Mn Units, and 122% CAGR revenue growth
to INR 2,134 cr.
During the period FY22E-24E, we expect the hybrid capacity to grow at 27% CAGR to 2.7 GW
which will result in 96% CAGR volume growth to 11,041 Mn Units, and 93% CAGR revenue
growth to INR 3,043 cr.
With all the key drivers in place, we expect AGEL’s overall revenues to grow at a CAGR of 72.3%
to INR 15,978.0 cr over FY21-24E. EBITDA is estimated to grow at a CAGR of 78.7% to INR
12,750.4 cr. PAT is estimated to grow at a CAGR of 146.9% to INR 3,162.4 cr. Subsequently,
RoE and RoIC are expected to improve to 40.2% (+3,069bps) and 11.5% (+445bps),
respectively, by FY24E.
The company is targeting ~17% of equity IRR from any projects and projects IRR of ~12-13%.
The company has ~20-25% of equity IRR for some projects.
Power supply capacity and revenue mix
Source: Company Reports & Ventura Research
1,970 2,319 3,320
7,954 11,234
18,300
25,000 26,000
27,000 28,000
29,000 30,000
0
5,000
10,000
15,000
20,000
25,000
30,000
35,000
Average Installed Capacity (MW)
Solar (MW) Wind (MW)
Hybrid (MW) Installed capacity (MW)
1,913 2,065 2,419
6,065
9,676
16,586
28,410
0
5,000
10,000
15,000
20,000
25,000
30,000
FY19 FY20 FY21 FY22E FY23E FY24E FY25E
Power supply revenue mix (Rs.Cr.)
Solar (Rs.Cr.) Wind (Rs.Cr.) Hybrid (Rs.Cr.) Revenue (Rs. Cr)
3535

( 0 9 t h D e c 2 0 2 1 )
For any further query, please email us on [email protected]
Renewable energy portfolio performance
Source: Company Reports & Ventura Research
2.0
2.5
3.0
3.5
4.0
4.5
5.0
5.5
1,500
11,500
21,500
31,500
41,500
51,500
61,500
71,500
FY19 FY20 FY21 FY22E FY23E FY24E FY25E
Solar Units sale (mn units) Average Tariff (Rs./Unit)
2.0
2.5
3.0
3.5
4.0
4.5
20
1,020
2,020
3,020
4,020
5,020
6,020
7,020
8,020
FY19 FY20 FY21 FY22E FY23E FY24E FY25E
Wind Units sale (mn units) Average Tariff (Rs./Unit)
2.7
2.7
2.8
2.8
2.9
2.9
3.0
800
2,800
4,800
6,800
8,800
10,800
12,800
FY22E FY23E FY24E FY25E
Hybrid Units sale (mn units) Average Tariff (Rs./Unit)
0.0
1.0
2.0
3.0
4.0
5.0
6.0
0
10,000
20,000
30,000
40,000
50,000
60,000
70,000
80,000
90,000
FY19 FY20 FY21 FY22E FY23E FY24E FY25E
Total Units sale Blended Average Tariff (Rs./Unit)
(40)
(20)
0
20
40
60
80
100
(2,000)
0
2,000
4,000
6,000
8,000
10,000
12,000
14,000
FY18 FY19 FY20 FY21 FY22E FY23E FY24E
Improving profitability
EBITDA Net Profit
EBITDA Margin (%) Net Margin (%)(%)
INR Cr
0
10,000
20,000
30,000
40,000
50,000
60,000
70,000
80,000
90,000
1,00,000
FY19 FY20 FY21 FY22E FY23E FY24E
Growing CFO but higher capex needs more debt
CFO (RHS) Total Debt (LHS)
3636

( 0 9 t h D e c 2 0 2 1 )
For any further query, please email us on [email protected]
Strong organizational commitment to adopting best in class ESG initiatives
AGEL has a strong commitment to emerge
• in the Top 10 global companies for ESG benchmarking for the electric utility sector by
FY25
• to become a Single use Plastic Free ( SuPF ) company by FY24
• to become Zero Waste to Landfill (ZWL) company by FY25
• to become net water neutral for all its plants (with more than 200 MW generation
capacity) by FY25
AGEL has further adopted strong ESG practices and recently scored 66 out of 100 in DJSI-S&P
Global’s Corporate Sustainability Assessment significantly ahead of global Electric Utility sector
average of 38. Also, it has been assigned MSCI ESG rating of ‘A’.
ESG philosophy
Source: Ministry of power, Company Reports & Ventura Research
3737

( 0 9 t h D e c 2 0 2 1 )
For any further query, please email us on [email protected]
Environmental philosophy
Source: Ministry of power, Company Reports & Ventura Research
Social philosophy
Source: Ministry of power, Company Reports & Ventura Research
3838

( 0 9 t h D e c 2 0 2 1 )
For any further query, please email us on [email protected]
Governance philosophy
Source: Ministry of power, Company Reports & Ventura Research
3939

( 0 9 t h D e c 2 0 2 1 )
For any further query, please email us on [email protected]
Business Quality Score
Key Criteria Score Risk Comments
Management & Leadership
Management Quality 8 Low The management is of decent quality. It has been able to deliver growth while taking calculated risks.
Promoters Holding Pledge 5 Moderate The promoter holding is 60.14% and there is 1.1% of promoter pledging as of Sept 2021.
Board of Directors Profile 7 Low The average experience of directors is >20 years with significant experience in industry. Also, many of the board members are working since inception.
Industry Consideration
Industry Growth 7 Low Renewable energy is the need of the hour for tackling climate change. Further, India's per capita electricity consumption which is abysmally low (when compared to developed nations) is set to explode.
Regulatory Environment or Risk 7 Low The company has locked in growth for 25 GW of renewable capacity. In addition, the 25 years of PPAs provides strong revenue visibility.
Entry Barriers / Competition 6 Moderate High capex and long gestation period provide for high entry barriers. Competitive environment is low since there is enough room for growth spanning decades.
Business Prospects
New Business / Client Potential 8 Low India’s power requirements are set to explode and renewable energy is expected to replace conventional fossil fuels. As such there is no dearth of business potential.
Business Diversification 6 Moderate The company is into the renewable power generation business which has limited scope for diversification.
Market Share Potential 8 Low AGEL is the largest renewable energy generator company in India.
Margin Expansion Potential 7 Low Cost rationalization, improving utilization of under constructed assets will helps to AGEL to improve its profitability.
Earnings Growth 8 Low Higher electricity demand and needs for renewable energy generation will drive growth.
Valuation and Risk
Balance Sheet Strength 4 High
Elevated debt levels and capex hungry growth will mean that the balance sheet will remain leveraged. However, the innovated financial engineering has helped lower stress on the balance sheet by extending the debt tenure and addressing any potential asset-liability mismatch.
Debt Profile 4 High Higher debt on the balance sheet and aggressive capex plans will not go towards reducing the debt burden.
FCF Generation 6 Moderate Higher capex plans will result in a negative FCF for the next few years.
Dividend Policy 4 High Aggressive growth plans shun the possibility of any dividend payout in the short to medium term.
Total Score
Ventura Score (%)
95
65 Moderate
The overall risk profile of the company is moderate and we consider it as a Moderate risk company for investments
Source: Company Reports & Ventura Research
4040

( 0 9 t h D e c 2 0 2 1 )
For any further query, please email us on [email protected]
Annual Report Takeaways
We analyzed the FY21 annual report of AGEL and our key observations are as follows:
Key Takeaways
• Scale: The company believes that the vastness of the opportunity is among the largest
in the world. It is servicing the growing needs of a nation where the per capita
electricity consumption is a fraction of the corresponding consumption in developed
economies, representing decades of prospective growth. India’s primary energy
demand is expected to grow at a CAGR of 4.2% between 2017 and 2040, faster than
any major economy.
• Low-cost bidder: AGEL is also the lowest (L1) bidder in 4.5 GW solar tenders from
Andhra Pradesh Green Energy Corporation. The total renewable portfolio of AGEL of
around ~19 GW makes the company the largest renewable power developer in India
today.
• Investment of Total Energy: An important development at AGEL was the expansion of
its partnership with French energy major TOTAL SA. The latter acquired 20% equity in
the company in addition to holding 50% in 2,353 MW of operational solar assets. This
respect enhancing equity ownership is a validation of AGEL’s capability in building
quality assets, O&M excellence and governance practices.
• Strong pipeline: AGEL’s consolidated portfolio and pipeline were a sizable ~19 GW as
on 31st March, 2021, with considerable optimism of achieving its stated aspiration of
25 GW in renewable energy capacity by 2025.
• Funding pipeline: The company diversified its funding source from conventional Indian
debt providers to the global Green Bond market. Global funding access holds out twin
advantages of predictable long-term costs on the one hand, and an extended
repayment tenure on the other, graduating what is essentially a debt instrument to
quasi-equity. AGEL mobilized a USD 1.35 Billion revolving construction facility that will
keep financing the long under-construction pipeline. This is one of the largest revolving
project financing deals in Asia’s renewable energy sector.
Pay Grades
The remuneration growth of KMP is in line with the performance of the company. The
Chairman has not taken any hike in remuneration in the last four years.
Remuneration in the last 4 years
Source: Company Reports & Ventura Research
Parameter (Fig in INR Cr) FY18 FY19 FY20 FY21 CAGR%
Chairman 0.0 0.0 0.0 0.0 NA
Share in Total Employee Cost (%) NA NA NA NA
Chief Financial Officer 1.4 2.3 1.4 0.0 NA
Share in Total Employee Cost (%) 3.3 3.9 1.3 NA
Remuneration of SVP/VP/GM 0.0 4.2 6.3 7.7 760.0
Share in Total Employee Cost (%) 0.0 7.1 5.9 20.2
Employee Cost 43.7 59.7 107.0 38.0 (4.5)
Employee Cost as % of Revenue (%) 2.9 2.9 4.2 1.2
4141

( 0 9 t h D e c 2 0 2 1 )
For any further query, please email us on [email protected]
Management & Leadership Team Turnover
Details on Board of Director and KMPs
Source: Company Reports
Auditor qualifications & significant notes to accounts
BSR & Co. LLP & Dharmesh Parikh & Co. LLP are the auditors and there were no
qualifications/emphasis of matters highlighted by them in the FY21 Annual Report.
Major Related Party Transactions with promoters and KMPs
Over the last four years, related party transactions continue to remain elevated. These
transactions are mainly due to Unsecured Perpetual Debt & Loans and Advances given to
various parties.
Related Party Transactions are relatively higher
Source: Company Reports & Ventura Research
Board of Director & KMP FY18 FY19 FY20 FY21
Gautam S Adani CM CM CM CM
Vneet S Jaain MD & CEO
Jayant Parimal CEO CEO CEO
Rajesh S Adani NED NED NED NED
Dinesh Kanabar NED NED
Raminder Singh Gujral NED NED
Sandeep Singhi ID ID ID ID
Poornima Advani ID ID ID
Jose Ignacio Sanz Saiz ID ID
Sagar R Adani ED ED ED
Pragnesh S Darji CS CS CS CS
Raaj Kumar Sah ID ID
Jay Shah ID
Sushama Oza ID
CM-Chairman NED-Non Executive Director
MD-Managing Director ID-Independent Director
CFO-Chief Financial Officer CS-Company Secretary
WTD-Whole Time Director ED-Executive Director
Parameter (Fig in INR Cr) FY18 FY19 FY20 FY21
Related Party Trans 8,444.9 2,681.5 2,470.0 5,339.0
Compensation to KMP 1.4 6.6 0.0 3.0
Transactions as % of Revenue (%) 570.6 130.6 96.9 171.0
4242

( 0 9 t h D e c 2 0 2 1 )
For any further query, please email us on [email protected]
Contingent Liabilities
Contingent liabilities are well within range.
Contingent Liabilities are lower
Source: Company Reports & Ventura Research
Management Team
Source: Company Reports
Parameter (Fig in INR Cr) FY18 FY19 FY20 FY21
Claims against the company not acknowledged 30.9 52.6 60.0 66.0
Contingent Lia. as % of Revenue (%) 2.1 2.6 2.4 2.1
Contingent Lia. as % of Net Worth (%) 2.3 2.7 2.5 3.0
Key Person Designation Details
Mr. Gautam Adani Chairman & MD
Mr. Gautam Adani has over 36 years of business experience. Under his
leadership, the Adani Group has emerged as a global integrated infrastructure
player with interests across resources, logistics and energy verticals.
Mr. Rajesh Adani Non-Executive Director
Mr. Rajesh Adani has been associated with Adani Group since its inception.
He is in-charge of the operations of the Group and is responsible for
developing its business relationships.
Mr. Sagar R. Adani Executive Director
He aims to build the Group’s identity around an integrated business model,
backed by his sound understanding of new processes, systems, and
macroeconomic issues, coupled with his growing experience. He holds a
degree in Economics from Brown University, USA.
Mr. Vneet Jaain CEO
He has been associated with Adani Group for over 15 years. During his
association, he has been spearheaded on Group’s strategy for its energy and
infrastructure business and has been instrumental growing various
businesses from conceptualisation to operation - renewable, power
CA Kaushal Shah CFO
He has held various leadership positions in Adani Group during his total 29
years of experience. Kaushal is a Chartered Accountant of 1993 batch and
holds a Bachelor of commerce from Gujarat University, India and degree of
PGDISA from Institute of Chartered Accountants of India.
4343

( 0 9 t h D e c 2 0 2 1 )
For any further query, please email us on [email protected]
Key Risks & Concerns
• Land availability risk
Renewable energy projects require a huge land parcel, 4 acres of land for a 1 MW
power generation unit. So, for the total under construction pipeline of 20 GW of
project execution, the company requires ~80,000 acres of land. Also, for ongoing capex
further requires a land of ~1,80,000 acre of land. Any unavailability of land or delay in
land acquisition will adversely impact the performance of the company.
• Higher leverage on the balance sheet
Majority of growth of the company is debt funded growth so any adverse situation or
inability to repay debt will impact business and performance adversely. Higher debt
will increase the interest burden and any adverse business scenario will hamper future
growth. Higher ongoing and future capex will require higher borrowing in future also.
However, the company’s renewable capacity installed in the past started throwing
decent cash flows, which will definitely support balance sheet strength.
Debt laden balance sheet
Source: Company Reports & Ventura Research
• Promoters stake pledge
This was at disconcerting levels in FY21 but has subsequently reduced to being less of
an issue
0
2
4
6
8
10
12
0
10,000
20,000
30,000
40,000
50,000
60,000
70,000
80,000
90,000
1,00,000
FY17 FY18 FY19 FY20 FY21 FY22E FY23E FY24E
Total Debt Net Debt Net Debt to Equity (X) Net Debt to EBITDA (X)
4444

( 0 9 t h D e c 2 0 2 1 )
For any further query, please email us on [email protected]
Pledge as a % of total Shares held by Promoters
Source: Company Reports & Ventura Research
• The renewable energy sites are vulnerable to the hostile impact of cyclone and other
adverse weather conditions.
0
5
10
15
20
25
30
35
40
45
4545

( 0 9 t h D e c 2 0 2 1 )
For any further query, please email us on [email protected]
Quarterly and Annual Performance
Source: Company Reports & Ventura Research
4646

( 0 9 t h D e c 2 0 2 1 )
For any further query, please email us on [email protected]
Summary of Management Commentary and Quarterly Performance over last few quarters
Key Criteria View Comments
Q2FY21
Business Performance POSITIVE Revenues up 1% YoY to INR 718 cr, Revenue from power supply up 15% to INR 530 cr, Power supply EBITDA up 19% to INR 490 cr.
Solar energy units up 22% to 1,187 Mn units, CUF of 20.7%, Wind energy units up 11% to 162 Mn units, CUF of 30.3%
Q3FY21
Business Performance POSITIVE
Revenues up 61% YoY to INR 843 cr, Revenue from power supply up 31% to INR 591 cr, Power supply EBITDA up 34% to INR 532 cr. Solar energy units up 27% to 1,200 Mn units, CUF of 20.8%, Wind energy units up 106% to 103 Mn units, CUF of 18.9%
Q4FY21
Business Performance POSITIVE
Revenues up 51% YoY to INR 1,082 cr, Revenue from power supply up 15% to INR 690 cr, Power supply EBITDA up 15% to INR 626 cr. Solar energy units up 24% to 1,482 Mn units, CUF of 24.3%, Wind energy units up 20% to 132 Mn units, CUF of 22.2%
Q1FY22
Business Performance POSITIVE
Revenues up 23% YoY to INR 1,079 cr, Revenue from power supply up 39% to INR 848 cr, Power supply EBITDA up 41% to INR 789 cr. Solar energy units up 39% to 1,650 Mn units, CUF of 25%, Wind energy units up 103% to 404 Mn units, CUF of 38.5%
Outlook & Strategy POSITIVE
150 MW wind plant commissioned in Gujarat
50 MW solar plant commissioned in Uttar Pradesh
Signed definitive agreements for 100% acquisition of SB Energy Holdings Limited. It houses 4,954 MW of renewable assets in India. The target portfolio consists of 84% solar capacity (4,180 MW), 9% wind-solar hybrid capacity (450 MW) and 7% wind capacity (324 MW).
Q2FY22
Business Performance POSITIVE Revenues up 112% YoY to INR 1,295 cr, Revenue from power supply up 58% to INR 834 cr, Power supply EBITDA up 61% to INR 787 cr. Solar energy units up 41% to 1,430 Mn units, CUF of 21.4%, Wind energy units up 185% to 471 Mn units, CUF of 42.9%
Outlook & Strategy POSITIVE
PPA signing commenced with SECI towards Letter of Award previously received for manufacturing linked solar project of 8 GW with signing of PPAs for 867 MW in Oct 2021. Awarded 450 MW Wind project from SECI in Oct 2021
Capacity guidance for FY25: 25000 MW (including inorganic acquisition).
Run-rate EBITDA guidance for FY25: ~INR 20,000 cr.
Source: Company Reports & Ventura Research
4747

( 0 9 t h D e c 2 0 2 1 )
For any further query, please email us on [email protected]
Financial Analysis & Projections
Source: Company Reports & Ventura Research
4848

( 0 9 t h D e c 2 0 2 1 )
For any further query, please email us on [email protected]
This page left intentionally blank
4949

( 0 9 t h D e c 2 1 )
For any further query, please email us on [email protected]
TABLE OF CONTENTS
Adani Ports & Special
Economic Zone Ltd.
The largest port and integrated logistics player
5050

( 0 9 t h D e c 2 0 2 1 )
For any further query, please email us on [email protected]
In a post-covid scenario, where the world is distancing itself from its over dependance
on China, India has emerged as a reliable, responsible and geopolitically viable option
for global manufacturing. Further, favourable policies like Atmanirbhar Bharat, Make
in India Make for World, PLI schemes, etc., have helped create a launch pad for
resurgent EXIM volumes, which are expected to scale to 1790-2570 MMT by FY30
from 971 MMT clocked in FY21. Adani Ports & Special Economic Zone Ltd (APSEZ)
with its portfolio of 13 ports (installed capacity of 560 MMT & 28.6% EXIM volume
share), is well positioned to expand its market share to 38.9% from this surge in EXIM
trade.
Another growth driver of APSEZ is its foray into the highly fragmented USD 160 bn
(growing at 10% CAGR) logistic infrastructure vertical through its wholly owned
subsidiary Adani Logistics Limited (ALL). ALL has fast established itself as a leading
player in the container handling, bulk goods, agri-logistics and warehousing verticals.
PM Modi’s “Gati Shakti” in combination with the National Logistic Policy and
digitization is expected to be a game-changer as it aims to lower the logistic cost from
the present 14% of GDP to 7-8% over the next 5-6 years and boost economic
development. Given the Adani group’s global scale of operations, execution
excellence and capital raising capability, we expect APSEZ to emerge as the largest
transport utility.
We expect a 20.4% CAGR volume growth to 432 MMT and 52.2% growth from
logistics leading to a 24.3% /24.8% /20.1% CAGR growth in revenue / EBIDTA / PAT to
INR 24,106.2 cr/ INR 15,515.4 cr/ INR 8,769.9 cr by FY24. Despite continuing
investments, we believe that peak debt is behind us and strong cashflow generation
should enable APSEZ to achieve lower balance sheet leverage. We initiate coverage
with a BUY for a DCF based price objective of INR 1,697, representing an upside of
120% over the next 24 months. Concor is a strategic fit for APSEZ and a winning bid
would lead to a major re-rating of the stock.
Omicron breakout and slowdown in global trade are risks to our estimates.
Key Financial Data (INR Cr, unless specified)
Revenue EBITDA
Net Profit
EBITDA (%)
Net Profit
(%) EPS (₹)
BVPS (₹)
RoE (%)
RoIC (%)
P/E (X) P/BV
(X)
EV/ EBITDA
(X)
FY20 11,439 5,505 3,763 48.1 32.9 17.5 120.2 14.7 7.9 41.5 6.0 32.5
FY21 12,550 7,983 4,994 63.6 39.8 23.2 149.3 16.3 9.8 31.2 4.9 23.2
FY22E 16,917 10,848 5,592 64.1 33.1 26.0 170.0 15.9 13.2 27.9 4.3 16.9
FY23E 19,955 12,912 6,762 64.7 33.9 31.5 194.5 16.8 15.8 23.1 3.7 13.9
FY24E 24,106 15,515 8,770 64.4 36.4 40.8 225.9 18.6 19.0 17.8 3.2 11.2
BUY @ CMP INR 770 Target: INR 1,697 in 24 months Upside Potential: 120%
The largest port and integrated logistics player
Industry Ports
Scrip Details
Face Value (INR) 2.0
Market Cap (INR Cr) 1,52,049
Price (INR) 770
No of Shares O/S (Cr) 204
3M Avg Vol (000) 267
52W High/Low (INR) 901/428
Dividend Yield (%) 0.69
Shareholding (%) Sept 2021
Promoter 63.83
Institution 31.15
Public 5.02
TOTAL 100.0
Price Chart
20000
30000
40000
50000
60000
70000
120.00
320.00
520.00
720.00
920.00
APSEZ SENSEX
Adani Ports & Special Economic
Zone Ltd.
5151

( 0 9 t h D e c 2 0 2 1 )
For any further query, please email us on [email protected]
Source: Company Reports & Ventura Research
0
200
400
600
800
1,000
1,200
Apr
-14
Jul-
14O
ct-1
4Ja
n-1
5A
pr-1
5Ju
l-15
Oct
-15
Jan
-16
Apr
-16
Jul-
16O
ct-1
6Ja
n-1
7A
pr-1
7Ju
l-17
Oct
-17
Jan
-18
Apr
-18
Jul-
18O
ct-1
8Ja
n-1
9A
pr-1
9Ju
l-19
Oct
-19
Jan
-20
Apr
-20
Jul-
20O
ct-2
0Ja
n-2
1A
pr-2
1Ju
l-21
1 year forward EV/EBITDA band chart
EV per sh 7.76x 12.11x
16.46x 20.81x 25.16x
0
5
10
15
20
25
30
01-A
pr-
14
01-S
ep-1
4
01-F
eb-1
5
01-J
ul-
15
01-D
ec-1
5
01-M
ay-1
6
01-O
ct-1
6
01-M
ar-1
7
01-A
ug-
17
01-J
an-1
8
01-J
un
-18
01-N
ov-1
8
01-A
pr-
19
01-S
ep-1
9
01-F
eb-2
0
01-J
ul-
20
01-D
ec-2
0
01-M
ay-2
1
EV/EBITDA & Std Deviation
EV/EBIDTA Average Upper SD 1
Upper SD 2 Lower SD 1 Lower SD 2
30.00
130.00
230.00
330.00
430.00
530.00
630.00
730.00
830.00
930.00
02-Apr-18 02-Apr-19 02-Apr-20 02-Apr-21
Peer group price performance
APSEZ CONCOR Gujarat Pipavav GDL
0.5
0.7
0.9
1.1
1.3
1.5
1.7
1.9
2.1
10-Apr-18 10-Apr-19 10-Apr-20 10-Apr-21
APSEZ commands slightly premium valuation to CONCOR, which has significantly expanded in
the past 1 year
Strong business potential deserves re-rating
5252

( 0 9 t h D e c 2 0 2 1 )
For any further query, please email us on [email protected]
Valuation
We have used the DCF model to value APSEZ. We have discounted back the future cash flows
to FY24 and value the company at INR 1,697 per share, presenting an upside of 120% from the
CMP of INR 770.
DCF Valuation
Source: Company Reports & Ventura Research
Long Term Market Return 11%
Risk Free Rate 6.3%
Cost of Equity 9.6%
Interest Rate 9.0%
Tax Rate 22.0%
Cost of Debt 6.9%
WACC 8.4%
Terminal Value Growth 3.0%
Terminal Value 5,56,877
FY24E FY25E FY26E FY27E FY28E FY29E FY30E FY31EFCFF 8237 10090 12539 14795 17605 20441 24791 29124
Discount Factor from FY24 0.92 0.85 0.79 0.72 0.67 0.62 0.57 0.53
Discounted FCFF from FY24 7,600 8,589 9,847 10,720 11,770 12,608 14,108 15,291
Total of Discounted FCFF FY24 90,533
FY24 Present Value of Terminal Value 2,92,380
FY24 Value of Operations 3,82,913
FY24 Net Debt 18,223
FY24 Value of Equity 3,64,690
FY24 Value of Equity per share 1,697
5353

( 0 9 t h D e c 2 0 2 1 )
For any further query, please email us on [email protected]
Our Bull and Bear Case Scenarios
We have prepared a Bull and Bear case scenario based on APSEZ’s terminal growth.
• Bull Case: As the largest integrated port and logistics company in India, APSEZ has a
significant opportunity to grow its business in the coming years. We have assumed a
terminal growth of 4%, which will result in a Bull case price target of INR 1,931 (upside
of 151% from the CMP).
• Bear Case: We have assumed a terminal growth of 1%, which will result in a Bear case
price target of INR 1,294 (upside of 68% from the CMP). Our base case implies a
significant margin of safety for buying at the current price.
Bull & Bear Case Scenario
Source: Ventura Research
Investment Triggers
• Strong growth potential of the industry
• Largest private port player in India with growing market share
• Integrated logistics player which helps to provide end-to-end service to the customers
Catalysts
• Gateway to growing international trades and supports domestic logistics need
• Indian economy is on an explosive growth trajectory which helps to grow EXIM trades and Make in India and China + 1 themes will support further.
Bull Case Price
INR 1,931 per share
Target Price
INR 1,697 per share
Bear Case Price
INR 1,294 per share
Current Price
INR 770 per share
4% terminal value growth
3% terminal value growth
1% terminal value growth
5454

( 0 9 t h D e c 2 1 )
For any further query, please email us on [email protected]
Valuation and Comparable Metric of Domestic and Global Port & Logistics Companies
Source: Ventura Research & Bloomberg
PEG
Company Name Mkt Cap Price 2024 2022 2023 2024 2022 2023 2024 2022 2023 2024 2022 2023 2024 2022 2023 2024 2022 2023 2024 2022 2023 2024
Domestic Peers (fig in INR Crores)
Adani Port 148241 726.0 0.7 27.9 23.1 17.8 16.9 13.9 11.2 15.9 16.8 18.6 13.2 15.8 19.0 16917 19955 24106 64.1 64.7 64.4 33.1 33.9 36.4
CONCOR 39808 653.0 0.4 34.2 25.9 21.3 20.4 14.7 12.0 10.6 12.8 14.3 14.9 20.3 25.0 7640 9369 10956 24.3 26.9 27.5 15.3 16.4 17.1
Gateway Distripark 3483 279.0 0.4 22.7 18.6 13.8 10.6 9.0 7.5 9.7 11.0 12.8 12.0 14.1 14.9 1359 1547 1756 27.1 26.9 27.5 11.3 12.1 14.4
Gujarat Pipavav port 4904 101.0 0.8 22.7 14.8 13.8 8.9 7.3 6.6 10.2 15.4 16.4 25.3 33.8 37.7 796 921 999 57.7 59.7 60.7 27.1 35.9 35.6
Mahindra Logistics 5343 743.0 0.4 82.1 45.5 32.9 23.9 17.6 14.4 10.5 16.4 18.9 19.6 27.3 27.9 4119 4960 5889 5.5 6.1 6.3 1.6 2.4 2.8
Allcargo Logistics 8707 354.0 0.4 21.4 20.0 17.4 NA NA NA 15.2 14.5 NA NA NA NA 14165 14331 13878 6.6 6.9 8.1 2.9 3.0 3.6
Transport Corp. of India 5174 670.0 0.4 20.7 18.4 14.7 14.3 13.0 10.3 17.9 17.1 17.7 18.2 18.5 19.3 NA NA NA NA NA NA NA NA NA
TCI Express 7762 2017.0 1.2 54.9 43.8 35.9 40.3 32.5 25.7 25.7 25.6 24.4 38.5 41.0 43.4 NA NA NA NA NA NA NA NA NA
Global Peers (fig in mn USD)
Public Storage 58172 331.7 4.2 35.4 32.9 30.8 25.1 23.5 21.8 26.5 27.9 NA 13.3 13.3 NA 3584 3771 4206 72.9 74.3 72.1 45.9 46.8 44.8
Hutchison Port holdings 2004 0.2 NA 17.2 17.2 NA 5.0 4.9 NA 3.5 3.6 NA 8.5 8.5 NA 1462 1459 NA 59.8 59.3 NA 8.0 8.0 NA
Port of Tauranga 3301 4.9 4.4 42.4 39.8 36.5 27.3 26.0 24.4 7.7 8.1 8.7 8.1 8.4 8.9 253 262 276 53.0 54.3 54.9 30.8 31.7 32.7
Hamburger Hafen 1742 23.2 NA 16.6 14.6 NA 6.2 6.8 NA 14.3 14.6 NA 14.1 12.2 NA 1602 1624 1637 26.1 26.5 29.5 6.5 7.3 NA
Sahathai Terminal 47 0.1 NA 23.5 NA NA NA NA NA 4.1 NA NA NA NA NA 46 NA NA 27.5 NA NA 4.3 NA NA
Globalport 900 312 0.1 NA NA NA NA NA NA NA NA NA NA NA NA NA NA NA NA NA NA NA NA NA NA
Danaos Corp. 1811 72.6 NA 3.8 3.1 NA 3.6 2.2 NA 16.9 16.5 NA 15.7 18.3 NA 855 954 NA 79.1 80.8 NA 56.4 61.7 NA
Navios Maritime Partners LP 793 25.8 NA 1.3 1.3 NA 1.5 1.1 NA 25.3 20.9 NA 24.1 22.2 NA 1218 1216 NA 67.7 68.0 NA 51.3 51.6 NA
Net Margin (%)P/E Ratio EV/EBIDTA RoE (%) RoIC (%) Sales EBITDA Margin (%)
For any further query, please email us on [email protected] 5555

( 0 9 t h D e c 2 1 )
For any further query, please email us on [email protected]
Improving ROIC and significant room for margin expansion are potential re-rating factors
Source: Ventura Research, ACE Equity & Bloomberg
Adani Port
CONCOR
Gateway Distripark
Gujarat Pipavav port
Mahindra Logistics
Transport Corp. of India
TCI Express
Port of Tauranga
7.0
12.0
17.0
22.0
27.0
32.0
37.0
42.0
47.0
5.0 10.0 15.0 20.0 25.0 30.0
FY24
Ro
IC (
%)
FY24 EV/EBIDTA (x)
Adani PortCONCOR
Gateway DistriparkGujarat Pipavav port
Mahindra Logistics
Allcargo Logistics
5.0
7.0
9.0
11.0
13.0
15.0
17.0
19.0
21.0
23.0
25.0
2.0 12.0 22.0 32.0 42.0 52.0 62.0 72.0 82.0
FY24
Rev
en
ue
CA
GR
(%
)
FY24 EBIDTA Margin (%)
5656

( 0 9 t h D e c 2 0 2 1 )
For any further query, please email us on [email protected]
Financial Analysis and Projections
Ports business unit
During FY18-21, the Ports capacity was enhanced from 335 MMT in FY18 to 498 MMT in FY21.
Given the pandemic, despite a strong volume growth of 11.1% CAGR to 247 MMT in FY21 from
180 MMT recorded in FY18, revenues grew at 1% CAGR to INR 9,015 crore while EBIDTA
declined at 1% CAGR to INR 6,050 crore. Margins too declined 350 bps to 67.1% in FY21.
During FY21 and H1FY22, the company acquired the Krishnapatnam and Gangavaram ports,
both of which are expected to improve the overall performance of the port business in the
years to come.
During FY21-24E, we expect the capacities to grow at 10% CAGR to 667 MMT. We expect
volumes to grow at 20% CAGR to 432 MMT leading to 23.4% CAGR growth in revenue to INR
16,927 cr. EBIDTA is expected to grow at 24.3% CAGR to INR 11,630 cr. Margins are expected
to remain stable at 68.7% (+160 bps)
Harbour business
During FY18-21, the harbour business reported a 11% revenue CAGR to INR 1,408 crore while
EBIDTA grew at 11% CAGR to INR 1,266 crore. Earlier the harbour revenue clubbed along with
port revenue at certain assets. Going forth the harbour revenue as a matter of policy will be
disclosed separately.
During FY21-24E, we expect the harbour revenue to grow at 20.4% CAGR to INR 2,459 cr. The
EBIDTA is expected to grow at a 18.4% CAGR to INR 2,102 cr. Margins are expected to remain
stable at 85.5%.
Logistics business
During FY18-21, the logistics business reported a 5% revenue CAGR to INR 958 crore while
EBIDTA grew at 44% CAGR to INR 226 crore.
During FY21-24E, we expect the logistics revenue to grow at 52.2% CAGR to INR 3,380 cr.
EBIDTA is expected to grow at 72.1% CAGR to INR 1,153 cr. Margins are expected to expands
to 34.1% (+1052 bps).
8433584329
SEZ and other business
During FY18-21, the SEZ & other businesses reported an 18.9% revenue CAGR to INR 1,169
crore.
During FY21-24E, we expect the SEZ and others revenue to grow at a 4.7% CAGR to INR 1,340
cr. EBIDTA is expected to grow at 12.6% CAGR to INR 630 cr. Margins are expected to expand
to 47.01% (+927bps).
Sweating of port assets and strong growth of the fledgling logistics business are expected to
propel APSEZ’s overall revenues to INR 24,106.2 cr (24.3% CAGR) over FY21-24E. EBITDA is
estimated to grow at a CAGR of 24.8% to INR 15,515.4 cr while PAT is estimated to grow at
5757

( 0 9 t h D e c 2 0 2 1 )
For any further query, please email us on [email protected]
a CAGR of 20.1% to INR 8,769.9 cr. Subsequently, RoE and RoIC are expected to improve to
18.6% (+232bps) and 19.0% (+920bps), respectively, over the same period.
APSEZ’s Financial Summary
Source: Company Reports & Ventura Research
Fig in INR Cr (unless specified) FY17 FY18 FY19 FY20 FY21 FY22E FY23E FY24E FY25E FY26E FY27E FY28E FY29E FY30E FY31ERevenue from operations 8,439.4 11,323.0 10,925.4 11,438.8 12,549.6 16,917.3 19,954.7 24,106.2 28,758.5 34,605.8 40,773.9 47,472.1 54,882.3 62,228.8 69,795.3YoY Growth (%) 18.7 34.2 (3.5) 4.7 9.7 34.8 18.0 20.8 19.3 20.3 17.8 16.4 15.6 13.4 12.2Raw Material Cost 0.0 0.0 0.0 0.0 0.0 0.0 0.0 0.0 0.0 0.0 0.0 0.0 0.0 0.0 0.0RM Cost to Sales (%) 0.0 0.0 0.0 0.0 0.0 0.0 0.0 0.0 0.0 0.0 0.0 0.0 0.0 0.0 0.0Employee Cost 383.1 447.3 529.8 546.5 615.1 710.4 827.5 990.1 1,176.0 1,403.2 1,666.6 1,979.4 2,351.0 2,740.0 3,134.6Employee Cost to Sales (%) 4.5 4.0 4.8 4.8 4.9 4.2 4.1 4.1 4.1 4.1 4.1 4.2 4.3 4.4 4.5Other Expenses 2,641.5 4,051.5 3,804.1 5,387.5 3,951.1 5,359.4 6,214.9 7,600.7 9,163.9 11,030.3 13,167.9 15,306.9 17,537.6 19,653.7 21,667.2Other Expenses to Sales (%) 31.3 35.8 34.8 47.1 31.5 31.7 31.1 31.5 31.9 31.9 32.3 32.2 32.0 31.6 31.0EBITDA 5,414.7 6,824.1 6,591.6 5,504.7 7,983.4 10,847.5 12,912.3 15,515.4 18,418.6 22,172.3 25,939.4 30,185.8 34,993.7 39,835.1 44,993.4EBITDA Margin (%) 64.2 60.3 60.3 48.1 63.6 64.1 64.7 64.4 64.0 64.1 63.6 63.6 63.8 64.0 64.5EBIT 4,254.5 5,635.7 5,218.1 3,824.4 5,876.1 8,248.1 10,082.0 12,438.3 15,074.9 18,556.9 22,012.0 25,914.3 30,326.2 34,782.1 39,556.7EBIT Margin (%) 50.4 49.8 47.8 33.4 46.8 48.8 50.5 51.6 52.4 53.6 54.0 54.6 55.3 55.9 56.7Interest 1,393.2 1,257.4 1,428.3 1,950.6 2,255.3 3,276.1 4,135.6 4,145.0 4,200.6 4,601.1 4,616.2 4,621.9 4,633.3 4,641.0 4,652.2Interest cost to Sales (%) 16.5 11.1 13.1 17.1 18.0 19.4 20.7 17.2 14.6 13.3 11.3 9.7 8.4 7.5 6.7Net Profit 3,911.5 3,673.6 3,990.2 3,763.1 4,994.3 5,591.7 6,762.3 8,769.9 10,769.3 13,161.0 16,298.1 19,833.5 23,342.2 26,777.8 31,123.8Net Margin (%) 46.3 32.4 36.5 32.9 39.8 33.1 33.9 36.4 37.4 38.0 40.0 41.8 42.5 43.0 44.6
Adjusted EPS 19.3 18.1 19.6 18.5 24.6 27.5 33.3 43.2 53.0 64.8 80.2 97.6 114.9 131.8 153.2P/E (X) 37.7 40.2 37.0 39.2 29.5 26.4 21.8 16.8 13.7 11.2 9.1 7.4 6.3 5.5 4.7Adjusted BVPS 86.3 103.7 120.8 126.1 150.7 172.6 198.6 231.8 272.1 320.7 380.0 451.3 534.0 627.6 734.8P/BV (X) 8.4 7.0 6.0 5.8 4.8 4.2 3.7 3.1 2.7 2.3 1.9 1.6 1.4 1.2 1.0Enterprise Value 1,75,378.5 1,74,766.9 1,77,114.6 1,78,800.1 1,85,151.3 1,83,284.8 1,79,684.8 1,74,273.0 1,65,466.1 1,57,999.3 1,49,556.6 1,38,810.8 1,26,455.2 1,11,003.5 92,206.7EV/EBITDA (X) 32.4 25.6 26.9 32.5 23.2 16.9 13.9 11.2 9.0 7.1 5.8 4.6 3.6 2.8 2.0
Net Worth 17,526.0 21,068.8 24,538.2 25,623.5 30,628.3 35,069.2 40,343.8 47,096.6 55,281.3 65,152.1 77,212.7 91,691.1 1,08,497.5 1,27,509.7 1,49,296.4Return on Equity (%) 22.3 17.4 16.3 14.7 16.3 15.9 16.8 18.6 19.5 20.2 21.1 21.6 21.5 21.0 20.8Capital Employed 39,740.2 43,273.0 52,083.9 55,699.3 65,569.1 82,030.0 87,373.8 94,270.5 1,03,576.0 1,13,723.1 1,25,823.9 1,40,382.5 1,57,350.2 1,76,363.2 1,98,383.1Return on Capital Employed (%) 10.0 9.2 7.9 6.1 7.2 8.2 9.4 10.7 11.7 12.7 13.6 14.4 15.0 15.4 15.6Invested Capital 36,854.4 39,785.7 45,602.8 48,373.5 59,729.5 62,304.0 63,978.5 65,319.6 64,697.4 67,101.3 70,719.2 74,451.9 78,902.6 82,463.1 85,453.0Return on Invested Capital (%) 11.5 14.2 11.4 7.9 9.8 13.2 15.8 19.0 23.3 27.7 31.1 34.8 38.4 42.2 46.3
Cash Flow from Operations 4,062.6 5,608.1 6,029.4 7,401.8 7,555.8 8,563.2 13,508.9 16,148.7 20,478.2 20,277.0 22,931.3 26,877.4 30,603.8 34,455.5 39,134.4Cash Flow from Investing (2,639.4) (3,845.8) (4,424.2) (750.4) (14,142.7) (5,635.1) (6,333.3) (4,758.9) (5,092.2) (5,177.9) (6,817.5) (7,439.1) (8,499.8) (8,005.8) (7,799.1)Cash Flow from Financing (1,324.7) (1,889.0) 2,313.3 (4,255.6) 3,513.9 8,658.7 (5,554.0) (6,018.2) (5,664.4) (7,615.0) (8,813.5) (9,896.7) (11,007.8) (12,405.7) (13,756.1)Net Cash Flow 98.5 (126.7) 3,918.6 2,395.8 (3,073.0) 11,586.8 1,621.6 5,371.6 9,721.5 7,484.1 7,300.2 9,541.6 11,096.2 14,043.9 17,579.3Free Cash Flow 744.7 891.9 3,811.3 1,717.2 4,266.3 2,121.2 6,509.1 8,237.4 10,089.8 12,538.5 14,794.6 17,605.2 20,441.4 24,791.1 29,124.1FCF to Revenue (%) 8.8 7.9 34.9 15.0 34.0 12.5 32.6 34.2 35.1 36.2 36.3 37.1 37.2 39.8 41.7FCF to EBITDA (%) 13.8 13.1 57.8 31.2 53.4 19.6 50.4 53.1 54.8 56.6 57.0 58.3 58.4 62.2 64.7FCF to Net Profit (%) 19.0 24.3 95.5 45.6 85.4 37.9 96.3 93.9 93.7 95.3 90.8 88.8 87.6 92.6 93.6FCF to Net Worth (%) 4.2 4.2 15.5 6.7 13.9 6.0 16.1 17.5 18.3 19.2 19.2 19.2 18.8 19.4 19.5
Total Debt 22,214.3 22,204.2 27,545.7 30,075.8 34,940.8 46,960.8 47,030.0 47,173.9 48,294.7 48,571.0 48,611.2 48,691.3 48,852.7 48,853.5 49,086.8Net Debt 19,328.4 18,716.8 21,064.6 22,750.0 29,101.3 27,234.8 23,634.7 18,223.0 9,416.1 1,949.2 (6,493.5) (17,239.2) (29,594.9) (45,046.6) (63,843.4)Net Debt to Equity (X) 1.1 0.9 0.9 0.9 1.0 0.8 0.6 0.4 0.2 0.0 (0.1) (0.2) (0.3) (0.4) (0.4)Net Debt to EBITDA (X) 3.6 2.7 3.2 4.1 3.6 2.5 1.8 1.2 0.5 0.1 (0.3) (0.6) (0.8) (1.1) (1.4)Interest Coverage Ratio (X) 3.1 4.5 3.7 2.0 2.6 2.5 2.4 3.0 3.6 4.0 4.8 5.6 6.5 7.5 8.5
5858

( 0 9 t h D e c 2 0 2 1 )
For any further query, please email us on [email protected]
APSEZ’s story in charts
Source: Company Reports & Ventura Research
(10)
0
10
20
30
40
0
5,000
10,000
15,000
20,000
25,000
FY17 FY18 FY19 FY20 FY21 FY22E FY23E FY24E
Strong all round revenue growth
Port Revenue Adani Logistics Revenue
Harbour Services SEZ
YoY Growth (%)
0
20
40
60
80
100
120
FY17 FY18 FY19 FY20 FY21 FY22E FY23E FY24E
Logistic revenue share set to expand
Port Revenue Adani Logistics Revenue
Harbour Services Others
0
10
20
30
40
50
60
70
0
2,000
4,000
6,000
8,000
10,000
12,000
14,000
16,000
18,000
FY17 FY18 FY19 FY20 FY21 FY22E FY23E FY24E
Marginal expansion in profitability
EBITDA Net Profit
EBITDA Margin (%) Net Margin (%)
0
5
10
15
20
25
0
10,000
20,000
30,000
40,000
50,000
60,000
70,000
FY17 FY18 FY19 FY20 FY21 FY22E FY23E FY24E
Improving return ratios despite capex
Net Worth Invested Capital
RoE (%) RoIC (%)
0
1
1
2
2
3
3
4
4
5
0
10,000
20,000
30,000
40,000
50,000
FY17 FY18 FY19 FY20 FY21 FY22E FY23E FY24E
Stable balance sheet strength
Total Debt Net Debt
Net Debt to Equity (X) Net Debt to EBITDA (X)
0
20
40
60
80
100
120
140
160
0
2,000
4,000
6,000
8,000
10,000
12,000
14,000
16,000
18,000
FY17 FY18 FY19 FY20 FY21 FY22E FY23E FY24E
Strong cash flow generation
CFO FCF
CFO to EBITDA (%) FCF to Net Profit (%)
INR (Cr) %
INR (Cr) INR (Cr)
INR (Cr) INR (Cr)
% %
% X
5959

( 0 9 t h D e c 2 0 2 1 )
For any further query, please email us on [email protected]
Company overview
Adani Ports & Special Economic Zone Ltd. (APSEZL) is the largest private sector developer and
operator of ports in India. It has a portfolio of 13 operational ports/terminals located at
Mundra, Dahej, Hazira, Dhamra, Kattupalli, Krishnapatnam, Mormugao, GPL, Vizag, Dighi,
Ennore, etc. This portfolio presents the most widespread national footprint with deepened
hinterland connectivity.
Having consolidated its position as a pan-India operator, it is now looking to transform into an
integrated port and logistics service company. Through its subsidiary Adani Logistics Ltd.,
APSEZ operates three logistics parks located at Patli in Haryana, Kila-Raipur in Punjab and
Kishangarh in Rajasthan. With the ability to handle 500,000 twenty-foot equivalent units
(TEUs) annually, the Adani logistics business is growing at a rapid pace.
Organizational Structure
Source: Company Reports & Ventura Research
6060

( 0 9 t h D e c 2 0 2 1 )
For any further query, please email us on [email protected]
Journey of logistics business of the company
Source: Company Reports & Ventura Research
6161

( 0 9 t h D e c 2 0 2 1 )
For any further query, please email us on [email protected]
Schematic representation of Adani’s integrated port and logistics operation
Source: Company Reports & Ventura Research
6262

( 0 9 t h D e c 2 0 2 1 )
For any further query, please email us on [email protected]
Port locations and capacity
Installed capacity (MMT) FY18 FY19 FY20 FY21 FY22 FY23 FY24
Total Port capacity 335 395 426 498 562 601 689
Major Ports
Mundra Port 242 249 264 264 264 264 264
Hazira Port 35 30 30 30 30 38 47
Dahej Port 14 14 14 14 14 14 18
Dhamra Port 35 45 45 45 45 59 59
Kattupalli Port 18 18 18 18 18 18
KPCL 64 64 64 80
GPL 64 64 80
Vizhinjam 18 35
Colombo 26
Minor Ports 9 39 55 63 63 63 63
Warehousing (Mn. Sq.Ft.) 0 0 2 6 14
Source: Company Reports & Ventura Research; Minor ports includes – Tuna, Mormugao, Dighi, Ennore, Vizag
6363
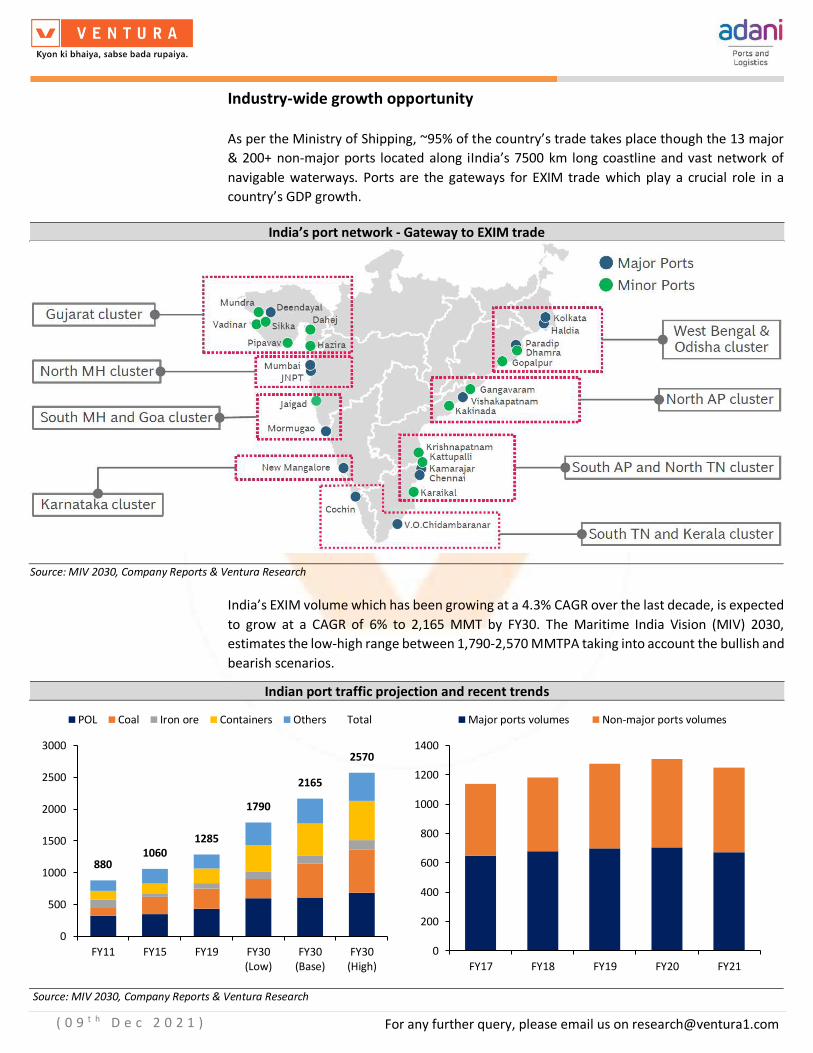
( 0 9 t h D e c 2 0 2 1 )
For any further query, please email us on [email protected]
Industry-wide growth opportunity
As per the Ministry of Shipping, ~95% of the country’s trade takes place though the 13 major
& 200+ non-major ports located along iIndia’s 7500 km long coastline and vast network of
navigable waterways. Ports are the gateways for EXIM trade which play a crucial role in a
country’s GDP growth.
India’s port network - Gateway to EXIM trade
Source: MIV 2030, Company Reports & Ventura Research
India’s EXIM volume which has been growing at a 4.3% CAGR over the last decade, is expected
to grow at a CAGR of 6% to 2,165 MMT by FY30. The Maritime India Vision (MIV) 2030,
estimates the low-high range between 1,790-2,570 MMTPA taking into account the bullish and
bearish scenarios.
Indian port traffic projection and recent trends
Source: MIV 2030, Company Reports & Ventura Research
8801060
1285
1790
2165
2570
0
500
1000
1500
2000
2500
3000
FY11 FY15 FY19 FY30(Low)
FY30(Base)
FY30(High)
POL Coal Iron ore Containers Others Total
0
200
400
600
800
1000
1200
1400
FY17 FY18 FY19 FY20 FY21
Major ports volumes Non-major ports volumes
6464

( 0 9 t h D e c 2 0 2 1 )
For any further query, please email us on [email protected]
Port Cluster-wise traffic projection by 2030
Source: MIV 2030, Company Reports & Ventura Research
Maritime India Vision (MIV) 2030 road map
MIV 2030 envisions an overall investment of INR 3,00,000 – 3,50,000 cr across ports, shipping,
and inland waterways categories. This vision roadmap is estimated to help unlock INR 20,000+
Cr worth of potential annual revenue for Indian Ports.
Maritime India Vision (MIV) 2030
Source: MIV 2030, Company Reports & Ventura Research
Government initiatives to boost EXIM trades are as enumerated below
Sagarmala Pariyojana
Sagarmala Pariyojana, launched in 2015, focuses on enhancing the performance of the logistics
sector in India by setting up new mega ports, modernizing existing ports. More than 605
projects having a total cost of INR 8.80 trillion have been identified under the Sagarmala
Pariyojana. Of these, 89 projects worth INR 140 Bn have been completed and 443 projects
worth INR 4.32 trillion are under various stages of implementation and development.
Ease of doing business
Direct Port Delivery (DPD) and Direct Port Entry (DPE) has been introduced to make import and
export more efficient and cost-effective. Along with this, some changes have also been made
in customs law to facilitate trade.
Dedicated Freight Corridor (DFC)
A network of DFCs is planned which will help build connectivity of the ports with the hinterland
to facilitate faster movement of traffic.
Proposed network of DFCs
Source: DFC report, Company Reports & Ventura Research
Base High Base High Base High Base High Base High Base High Base High Base High
Gujarat - 5 45 55 310 330 5 15 - 5 10 20 100 120 470 550
North Maharashtra - 5 - 5 60 70 5 15 - 5 5 10 - 5 70 115
South Maharashtra & Goa - 5 30 40 - 5 40 50 - 5 - 3 10 20 80 128
Karnataka - 5 - 5 40 50 - 5 - 5 - 3 10 20 50 93
South Tamil Nadu & Kerala - 5 20 30 30 40 - 5 - 5 3 5 20 30 73 120
South Andhra Pradesh & North Tamil Nadu - 5 110 130 30 40 5 15 - 5 3 5 80 100 228 300
North Andhra Pradesh 25 35 15 25 30 40 20 30 - 5 - 3 40 60 130 198
West Bengal & Odisha 40 50 150 170 70 90 25 35 - 5 - 3 45 55 330 408
Total 65 115 370 460 570 665 100 170 - 40 21 52 305 410 1,431 1,912
Others TotalCoking Coal Thermal Coal POL Iron Ore Steel Container
Key Performance Indicator Current (2020) Target (2030)
Major Ports with >300 MTPA cargo handling capacity - 3
% of Indian cargo transshipmenthandled by Indian ports 25 >75
% of cargo handled at Major Ports by PPP/ other operators 51 >85
Average vessel turnaround time (containers) in hours 25 <20
Locations Kms.
East – West Corridor (Kolkata–Mumbai) 2,000
North-South Corridor (Delhi-Chennai) 2,173
East Coast Corridor (Kharagpur-Vijayawada) 1,100
Southern Corridor (Chennai-Goa) 890
6565

( 0 9 t h D e c 2 0 2 1 )
For any further query, please email us on [email protected]
Proposed network of DFCs
Source: DFC report, Company Reports & Ventura Research
6666

( 0 9 t h D e c 2 0 2 1 )
For any further query, please email us on [email protected]
Currently two corridors, the Eastern Corridor and the Western Corridor are under
implementation. The two routes cover a total length of 3,360 kilometres with the Eastern DFC
stretching from Ludhiana in Punjab to Dankuni in West Bengal and the Western DFC from
Jawaharlal Nehru Port in Mumbai to Dadri in Uttar Pradesh.
DFC Locations (Western Corridor)
Source: DFC report, Company Reports & Ventura Research
DFC Locations (Eastern Corridor)
Source: DFC report, Company Reports & Ventura Research
6767

( 0 9 t h D e c 2 0 2 1 )
For any further query, please email us on [email protected]
Advantages of using DFCs
Source: Company Reports & Ventura Research
The DFC network is heralded to be the biggest harbinger of change leading to exponential
growth in EXIM volume.
6868

( 0 9 t h D e c 2 0 2 1 )
For any further query, please email us on [email protected]
APSEZ is the biggest beneficiary of India’s booming EXIM trade
APSEZL has grown from being a single port operator in 2001 to a multilocational, deep draft
sea port company with a portfolio of 13 ports. These strategically located ports and terminals
represent 20%+ of the country’s port capacity and catered to 28.6% of India’s EXIM trades
(including 42.6% of containers market share) as on H1FY22.
The company offers a wide range of services like ports, port infrastructure (including marine
services such as anchorage, pilotage, tug pulling, berthing), SEZs, and logistics. These wide
ranges of services provide clients comfort in having to deal with only one vendor with a single-
window interface for seamless end-to-end logistics solutions, right from unloading of cargo to
final delivery of goods.
APSEZ’s Port network
Source: Company Reports & Ventura Research
6969

( 0 9 t h D e c 2 0 2 1 )
For any further query, please email us on [email protected]
APSEZ growing faster than market
Source: Company Reports & Ventura Research
Stable cargo mix
Source: Company Reports & Ventura Research
During FY21-24E, we expect the capacities to grow at 10% CAGR to 667 MMT. We expect
volumes to grow at 20% CAGR to 432 MMT leading to 23.4% CAGR growth in revenue to INR
16,927 cr. EBIDTA is expected to grow at 24.3% CAGR to INR 11,630 cr. Margins are expected
to remain stable at 68.7%.
0
5
10
15
20
25
30
35
40
45
0
200
400
600
800
1000
1200
1400
1600
FY17 FY18 FY19 FY20 FY21 H1FY22
All India Cargo Vol. APSEZ Cargo Vol.
All India Container Vol. APSEZ Container Vol.
APSEZ Cargo Market share (RHS) APSEZ Container Market share (RHS)
MMT
%
0
20
40
60
80
100
120
FY16 FY17 FY18 FY19 FY20 FY21 H1FY22
Cargo Mix (%)
Dry Container Liquid (incl. Crude) Gas
7070

( 0 9 t h D e c 2 0 2 1 )
For any further query, please email us on [email protected]
Port wise revenue contribution
Source: Company Reports & Ventura Research
Port wise EBIDTA contribution
Source: Company Reports & Ventura Research
Mundra port
APSEZ’s Mundra port is the largest commercial port in India. It emerged as the largest
container handling port in FY20-21 (surpassing JNPT) with a market share of 32% (+500bps).
This port has twenty-six berths and two single point moorings with an annual capacity of 264
MMT cargo with dedicated terminals for different cargo and commodity types. It is also
capable of berthing fully loaded capesize vessels (VLCC and ULCC) and has a privately
developed rail network of 69 km from Adipur to Mundra port, opening gates to nation-wide
connectivity. It is also connected to the Indian National Highway (NH) network through State
(10)
(5)
0
5
10
15
20
25
30
35
40
0
2,000
4,000
6,000
8,000
10,000
12,000
14,000
16,000
18,000
20,000
FY18 FY19 FY20 FY21 FY22E FY23E FY24E
Mundra Port Hazira Port Dahej Port
Dhamra Port Kattupalli Port KPCL
GPL Terminals at Major Ports Vizhinjam
Colombo YoY Growth (%)
(30)
(20)
(10)
0
10
20
30
40
50
60
(2,000)
0
2,000
4,000
6,000
8,000
10,000
12,000
14,000
FY18 FY19 FY20 FY21 FY22E FY23E FY24E
Mundra Port Hazira Port Dahej Port
Dhamra Port Kattupalli Port KPCL
GPL Terminals at Major Ports Vizhinjam
Colombo YoY Growth (%)
INR (Cr.)
(%)
INR (Cr.)
(%)
7171

( 0 9 t h D e c 2 0 2 1 )
For any further query, please email us on [email protected]
Highway 48 via Anjar and State Highway 6. A concession with 40 km water front from Gujarat
Maritime Board and ample land for expansion with 99-year lease from Gujarat Govt.
Mundra is the world’s largest coal import terminal and also handles LNG and LPG operations
since FY20.
During FY21-24E, we expect the capacities to remain unchanged at 264 MMT. We expect
volumes to grow at 8% CAGR to 184 MMT leading to 10.4% CAGR growth in revenue to INR
5,890 cr. EBIDTA is expected to grow at 11.5% CAGR to INR 4,179 cr. Margins are expected to
remain stable at 71.0%.
Mundra port financial snapshot
Source: Company Reports & Ventura Research
Dhamra port – Being modeled on the lines of Mundra
Dhamra has the potential to handle more than 100 MMTPA of dry bulk, liquid bulk, breakbulk,
containerized and general cargo. Its proximity to the mineral belts of Odisha, Jharkhand and
West Bengal, helps serve the hinterland with the greatest of efficiencies. Dhamra also has a 62
km rail connectivity to Bhadrak/Ranital Link Cabin connecting the main Howrah-Chennai line.
This port has four berths with a current annual capacity to handle 45 MMT of cargo. During
FY21-24E, we expect the capacities to grow at 9% CAGR to 59 MMT. We expect volumes to
grow at 12% CAGR to 45 MMT leading to 13.8% CAGR growth in revenue to INR 2,193 cr.
EBIDTA is expected to grow at 13.4% CAGR to INR 1,472 cr. Margins are expected to remain
stable at 67.1%.
100
200
300
400
500
600
1,000
2,000
3,000
4,000
5,000
6,000
7,000
FY18 FY19 FY20 FY21 FY22E FY23E FY24E
Revenue
EBIDTA
Net Sales Realisation (Rs./MT) (RHS)
EBIDTA (Rs./MT) (RHS)
40
45
50
55
60
65
70
75
100
120
140
160
180
200
220
240
260
280
FY18 FY19 FY20 FY21 FY22E FY23E FY24E
Installed capacity (MMT)
Vol. (MMT)
Capacity Utilization (%) (RHS)
7272

( 0 9 t h D e c 2 0 2 1 )
For any further query, please email us on [email protected]
Dhamra port financial snapshot
Source: Company Reports & Ventura Research
Hazira port
Hazira is set to emerge as the largest multi-product commercial port in south Gujarat. It is
capable of berthing Panamax vessels, liquid tankers and container vessels. The Hazira port is
located on the main broad gauge rail route between Delhi and Mumbai which is double track,
fully electrified and designed for fast trains which brings a strategic locational advantage.
Hazira port has six berths with an annual capacity to handle 30 MMT cargo and the potential
to handle 75 MMTPA of cargo in the coming years. During FY21-24E, we expect the capacities
to grow at 16% CAGR to 47 MMT. We expect volumes to grow at 13.6% CAGR to 32 MMT
leading to 15.8% CAGR growth in revenue to INR 1,999 cr. EBIDTA is expected to grow at 17.0%
CAGR to INR 1,537 cr. Margins are expected to remain stable at 76.9%.
Hazira port financial snapshot
Source: Company Reports & Ventura Research
200
250
300
350
400
450
500
550
600
450
950
1,450
1,950
2,450
FY18 FY19 FY20 FY21 FY22E FY23E FY24E
Revenue
EBIDTA
Net Sales Realisation (Rs./MT) (RHS)
EBIDTA (Rs./MT) (RHS)
0
10
20
30
40
50
60
70
80
90
0
10
20
30
40
50
60
70
FY18 FY19 FY20 FY21 FY22E FY23E FY24E
Installed capacity (MMT)
Vol. (MMT)
Capacity Utilization (%) (RHS)
300
350
400
450
500
550
600
650
500
700
900
1,100
1,300
1,500
1,700
1,900
FY18 FY19 FY20 FY21 FY22E FY23E FY24E
Revenue
EBIDTA
Net Sales Realisation (Rs./MT) (RHS)
EBIDTA (Rs./MT) (RHS)
20
30
40
50
60
70
80
90
10
15
20
25
30
35
40
45
50
FY18 FY19 FY20 FY21 FY22E FY23E FY24E
Installed capacity (MMT)
Vol. (MMT)
Capacity Utilization (%) (RHS)
7373

( 0 9 t h D e c 2 0 2 1 )
For any further query, please email us on [email protected]
Dahej port
Dahej is equipped to handle all kinds of dry bulk and break-bulk cargo, including coal, fertilizers,
agri products, steel cargo and minerals, among others. It is capable of berthing Capesize and
Panamax vessels. It is connected to contiguous industrial hubs of Gujarat, Maharashtra and
eastern Madhya Pradesh. This port is also connected to the National Highway 8 through the
six-lane State Highway 6. Dahej port has a multi-user waterfront facility (Ro-Ro Jetty) to
support cargo movement.
It can handle 14 MMTPA with two dry and break-bulk berths and dedicated facilities for
handling project cargo. During FY21-24E, we expect the capacities to grow at 7.7% CAGR to 18
MMT. We expect volumes to grow at 30.1% CAGR to 12.9 MMT leading to 32.6% CAGR growth
in revenue to INR 680 cr. EBIDTA is expected to grow at 37.7% CAGR to INR 457 cr. Margins
are expected to remain stable at 67.1%.
Dahej port financial snapshot
Source: Company Reports & Ventura Research
Kattupalli port
Kattupalli is located on the Coromandel coast about 24 km north of Chennai Port. It is capable
of berthing fully loaded capesize vessels and container vessels. It has three berths with 710
quay length with an annual capacity to handle 18 MMT cargo. This port has an off-dock CFS
with 45,000 sq. ft. of closed warehouse and a gated complex with 6 lanes ensuring faster
turnaround times for trailers. The company has commenced liquid terminal operations;
handled 80,000 Tonnes of cargo.
The cargo volume was lower in H1FY22 due to the continued impact of COVID-19 in the
Chennai cluster, especially as the auto ancillary sector was impacted the most. However, since
then, the company has witnessed quarter on quarter improvement. Realization and margin
profile will continue to improve with growth in cargo volumes. The company has recently
captured a few new lines at the port, which will help improve volumes.
During FY21-24E, we expect the capacities to remains flat at 18 MMT. We expect volumes to
grow at 4.0% CAGR to 9.9 MMT leading to 5.3% CAGR growth in revenue to INR 270 cr. EBIDTA
250
300
350
400
450
500
550
150
250
350
450
550
650
750
FY18 FY19 FY20 FY21 FY22E FY23E FY24E
Revenue
EBIDTA
Net Sales Realisation (Rs./MT) (RHS)
EBIDTA (Rs./MT) (RHS)
30
35
40
45
50
55
60
65
70
75
80
5
7
9
11
13
15
17
19
FY18 FY19 FY20 FY21 FY22E FY23E FY24E
Installed capacity (MMT)
Vol. (MMT)
Capacity Utilization (%) (RHS)
7474

( 0 9 t h D e c 2 0 2 1 )
For any further query, please email us on [email protected]
is expected to grow at 0.8% CAGR to INR 144 cr. Margins are expected to remain stable at
53.5%.
Kattupalli port financial snapshot
Source: Company Reports & Ventura Research
Krishnapatnam port (KPCL)
KPCL, acquired in FY21, is located on the east coast in the Nellore district of Andhra Pradesh
(~180 km from Chennai Port). KPCL has been developed under a 50-year concession starting
Mar-09 (30+10+10) from the AP government. As per the concession terms, KPCL currently pays
a revenue share of 2.6% of its gross revenue to the AP Government. It is the largest private
port on the east coast & the 2nd largest private port in the country. It is an all-weather, deep-
water port having 64 MMTPA of multi-cargo capacity. It is also equipped to handle dry, liquid
& container cargo and has 5 terminals with a combined quay length of 3.3 km.
It has road connectivity through an Internal Road network of 55 Kms, connected by a 25 kms
long dedicated four-lane road with four lane NH-5 Chennai Kolkata corridor. Upgradation of
the 4 lane to 6 lane road is in progress with ROW of 60 m. For rail connectivity, Krishnapatnam
Rail Co. Ltd. (KRCL) – SPV formed for Double Rail Line from Venkatachalam to Port. (15 Km)
with ROW of 30 m & Single Rail Line from Venkatachalam to Obulavaripalle (91 Km). KPCL holds
12.96% in KRCL.
APSEZ as per its master plan has approvals to enhance capacity to 300 MMTPA from current
64 MMTPA. Currently, only 3,064 acres of the 6,800 acres of available land has been
developed.
The company has a target to enhance the volume at KPCL to 100 MMT by FY25 and double its
EBIDTA by FY23.
100
150
200
250
300
75
125
175
225
275
325
FY19 FY20 FY21 FY22E FY23E FY24E
Revenue
EBIDTA
Net Sales Realisation (Rs./MT) (RHS)
EBIDTA (Rs./MT) (RHS)
30
35
40
45
50
55
60
65
6
8
10
12
14
16
18
20
FY19 FY20 FY21 FY22E FY23E FY24E
Installed capacity (MMT)
Vol. (MMT)
Capacity Utilization (%) (RHS)
7575

( 0 9 t h D e c 2 0 2 1 )
For any further query, please email us on [email protected]
Capacity expansion potential at KPCL
Land Bank with Port Area in Acres
Total Land in Possession 4,621
Additional land allotted by Government & to be acquired 2,169
Total Land for the Port 6,790
Capex possibilities MMT
Existing Capacity 64
Debottlenecking plans 100
Port expansion potential 500
Source: Company Reports & Ventura Research
KPCL capacity break-up
Source: Company Reports & Ventura Research
The company has planned on reducing costs and to improve EBIDTA to 78% by FY25.
Dry Bulk Container Liquid
FY20 - 64 MMT
Dry Bulk Container Liquid
FY25 - 100 MMT
7676

( 0 9 t h D e c 2 0 2 1 )
For any further query, please email us on [email protected]
Cost Saving measures at KPCL
Source: Company Reports & Ventura Research
During FY21-24E, we expect the capacities to grow at 4.8% CAGR to 74 MMT. We expect
volumes to grow at 38.3% CAGR to 52 MMT leading to 36.3% CAGR growth in revenue to INR
2,475 cr. EBIDTA is expected to grow at 40.2% CAGR to INR 1,905 cr. Margins are expected to
remain stable at 77.0%.
KPCL financial snapshot
Source: Company Reports & Ventura Research
Cost Saving measures Annual savings (Rs Cr)
(A) Operational Processes 80
Rationalized dumpers, wheel loaders, excavators etc. and process improvement 35
A decrease in repair & maintenance & fuel expenses due to equipment rationalization 20
Increased utilization of mechanized systems from 45% in Dec-19 to 55% in Nov-20 7
Others 18
(B) Contracting Processes 68
Activity-based costing 17
Fixed to the variable conversion of the equipment hired on a fixed period basis to per MT 13
Alternate sources of procurement of spares & consumables 12
Others 26
(C) Rationalization Processes 98
Insurance premium 46
Rationalization of rental and business promotion expenses 12
The decrease in consultancy & personnel expenses 12
Others 28
Grand total (A + B + C) 246
250
300
350
400
450
500
550
500
1,000
1,500
2,000
2,500
3,000
FY21 FY22E FY23E FY24E
Revenue
EBIDTA
Net Sales Realisation (Rs./MT) (RHS)
EBIDTA (Rs./MT) (RHS)
25
30
35
40
45
50
55
60
65
70
75
15
25
35
45
55
65
75
85
FY21 FY22E FY23E FY24E
Installed capacity (MMT)
Vol. (MMT)
Capacity Utilization (%) (RHS)
7777
( 0 9 t h D e c 2 0 2 1 )
For any further query, please email us on [email protected]
Gangavaram Port (GPL)
GPL commenced operations in 2009 (BOOT model) and has a 50-year concession till 2059.
Gangavaram port is a zero-debt company and has cash balance of INR 957 Cr as of 30-Sep-21.
In Q2FY22, APSEZ secured ownership of this asset post acquisition from Warburg Pincus (31.5%
stake) and Government of Andhra Pradesh (10.4%). With this APSEZ is currently holding a
41.9% stake in Gangavaram Port Ltd. (GPL).
The balance 58.1% stake is to be acquired from the DVS Raju family and in consideration 4.77
cr shares of APSEZ are to be issued. The entire transaction is done at a valuation of INR 6,200
cr (8.8x FY21 EV/EBIDTA).
GPL is an all-weather, deep water multipurpose port, located at Vizag. GPL has excellent
connectivity to service states which contribute ~43% of India’s GDP (the rich mineral and metal
industrial belt) and has excellent road and rail connectivity.
• Twin Railway line connectivity to the main broad gauge national network of "Chennai-
Visakhapatnam-Howrah".
• 4 lane expressway of 3.8 km connecting the port with the NH5 (Chennai - Kolkata), to
be widened to 6 lane under BharatMala Project (BMP).
It has an operational capacity of 64 MMTPA and having 9 berths with 19.5 m draft. Gangavaram
port has freehold land of 1,800 acres of which 800 acres available for future development. Also,
an additional leased land of 1,052 acres can be used for future development.
The company has a master plan to enhance capacity to 250 MMTPA with 31 berths.
Cargo Mix (%)
Source: Company Reports & Ventura Research
During FY22E-24E, we expect the capacities to remain flat at 47 MMT. We expect volumes to
grow at 13.0% CAGR to 47 MMT leading to 15.3% CAGR growth in revenue to INR 1,868 cr.
EBIDTA is expected to grow at 16.2% CAGR to INR 1,260 cr. Margins are expected to remain
stable at 67.5%.
Non cocking coal Cocking coal Iron Ore Limestone Minerals Steel Others
7878

( 0 9 t h D e c 2 0 2 1 )
For any further query, please email us on [email protected]
Gangavaram port financial snapshot
Source: Company Reports & Ventura Research
Vizhinjam port
Vizhinjam is a deep draft, all-weather port under construction in South Kerala. The first phase
of 17.59 MMTPA capacity is expected to be commissioned in FY23 while the second phase of
another 17.59 MMTPA capacity is expected to come up in FY24.
Vizhinjam Port is an ambitious plan of APSEZ to develop India’s first Mega Transshipment
Container Terminal at Vizhinjam, Kerala.
Vizhinjam port financial snapshot
Source: Company Reports & Ventura Research
200
250
300
350
400
600
800
1,000
1,200
1,400
1,600
1,800
FY22E FY23E FY24E
Revenue
EBIDTA
Net Sales Realisation (Rs./MT) (RHS)
EBIDTA (Rs./MT) (RHS)
52
54
56
58
60
62
64
66
68
70
20
25
30
35
40
45
50
55
60
65
70
FY22E FY23E FY24E
Installed capacity (MMT)
Vol. (MMT)
Capacity Utilization (%) (RHS)
0
50
100
150
200
250
300
350
0
50
100
150
200
250
300
350
FY23E FY24E
Revenue
EBIDTA
Net Sales Realisation (Rs./MT) (RHS)
EBIDTA (Rs./MT) (RHS)
0
5
10
15
20
25
30
35
40
45
0
5
10
15
20
25
30
35
40
FY23E FY24E
Installed capacity (MMT)
Vol. (MMT)
Capacity Utilization (%) (RHS)
7979
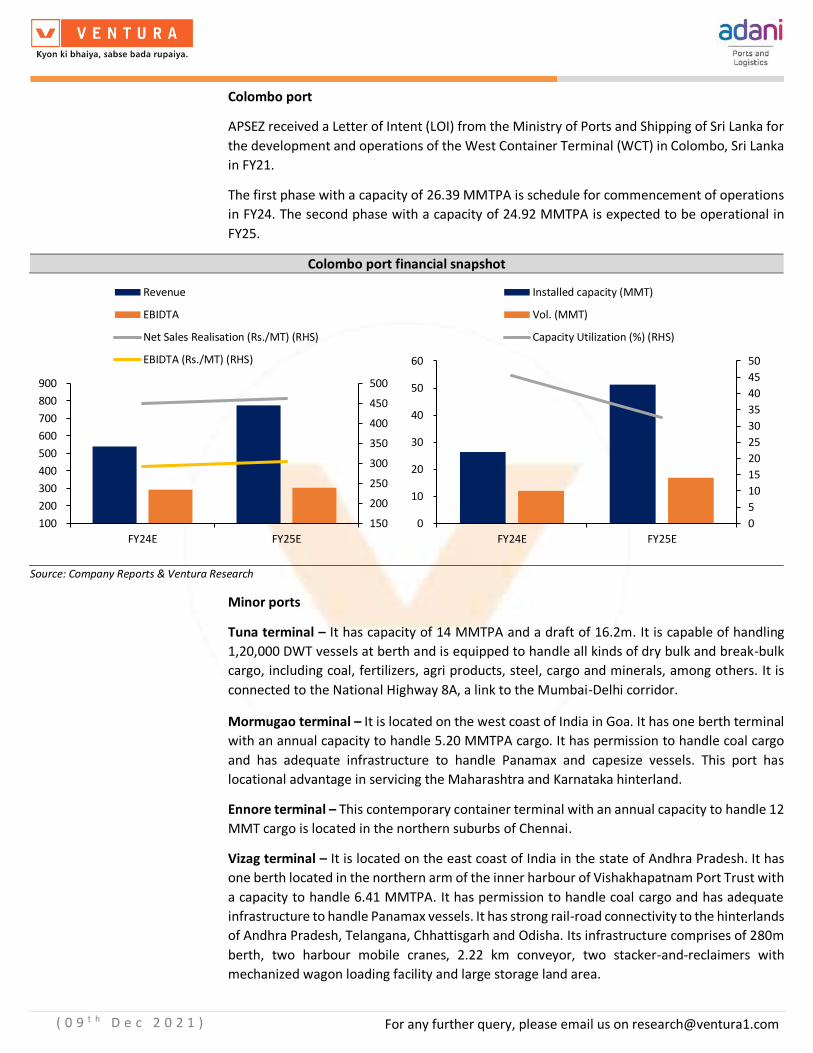
( 0 9 t h D e c 2 0 2 1 )
For any further query, please email us on [email protected]
Colombo port
APSEZ received a Letter of Intent (LOI) from the Ministry of Ports and Shipping of Sri Lanka for
the development and operations of the West Container Terminal (WCT) in Colombo, Sri Lanka
in FY21.
The first phase with a capacity of 26.39 MMTPA is schedule for commencement of operations
in FY24. The second phase with a capacity of 24.92 MMTPA is expected to be operational in
FY25.
Colombo port financial snapshot
Source: Company Reports & Ventura Research
Minor ports
Tuna terminal – It has capacity of 14 MMTPA and a draft of 16.2m. It is capable of handling
1,20,000 DWT vessels at berth and is equipped to handle all kinds of dry bulk and break-bulk
cargo, including coal, fertilizers, agri products, steel, cargo and minerals, among others. It is
connected to the National Highway 8A, a link to the Mumbai-Delhi corridor.
Mormugao terminal – It is located on the west coast of India in Goa. It has one berth terminal
with an annual capacity to handle 5.20 MMTPA cargo. It has permission to handle coal cargo
and has adequate infrastructure to handle Panamax and capesize vessels. This port has
locational advantage in servicing the Maharashtra and Karnataka hinterland.
Ennore terminal – This contemporary container terminal with an annual capacity to handle 12
MMT cargo is located in the northern suburbs of Chennai.
Vizag terminal – It is located on the east coast of India in the state of Andhra Pradesh. It has
one berth located in the northern arm of the inner harbour of Vishakhapatnam Port Trust with
a capacity to handle 6.41 MMTPA. It has permission to handle coal cargo and has adequate
infrastructure to handle Panamax vessels. It has strong rail-road connectivity to the hinterlands
of Andhra Pradesh, Telangana, Chhattisgarh and Odisha. Its infrastructure comprises of 280m
berth, two harbour mobile cranes, 2.22 km conveyor, two stacker-and-reclaimers with
mechanized wagon loading facility and large storage land area.
150
200
250
300
350
400
450
500
100
200
300
400
500
600
700
800
900
FY24E FY25E
Revenue
EBIDTA
Net Sales Realisation (Rs./MT) (RHS)
EBIDTA (Rs./MT) (RHS)
0
5
10
15
20
25
30
35
40
45
50
0
10
20
30
40
50
60
FY24E FY25E
Installed capacity (MMT)
Vol. (MMT)
Capacity Utilization (%) (RHS)
8080

( 0 9 t h D e c 2 0 2 1 )
For any further query, please email us on [email protected]
Dighi port – The port is equipped to handle bulk and liquid cargo with an annual capacity of 8
MMTPA. It will empower APSEZ to service customers in Maharashtra, North Karnataka, West
Telangana and Madhya Pradesh.
During FY21-24E, we expect the capacities to flat to 63 MMT. We expect volumes to grow at
24% CAGR to 26.9 MMT leading to 26.3% CAGR growth in revenue to INR 728 cr. EBIDTA is
expected to grow at 35.0% CAGR to INR 139 cr. Margins are expected to grows to 19.1%.
Minor ports growth in numbers
Source: Company Reports & Ventura Research
APSEZ is among the five fastest growing port companies in the world and intends to retain this
position by targeting 500 MMT of cargo volume by 2025 (Indian market share of 40%).
APSEZ port volume estimation
H1FY22 FY30
Low Base High
Indian cargo (As per MIV 2030) MMT 504 1,790 2,165 2,570 APSEZ market share (%) 29 35 38 40
APSEZ cargo vol. (MMT) 144 627 823 1,028
Our assumption (MMT) 841.5
Source: Company Reports & Ventura Research
APSEZL has been in Capex mode over the last few years. Many of the port projects
commissioned in recent years are witnessing a gradual ramp-up in cargo volumes amid a
challenging external trade environment.
APSEZL has ongoing projects at Mundra, Kattupalli and Dhamra ports to enhance capacity,
which will boost cargo volumes in the long-term. The above projects would entail a total Capex
of about Rs. 3,000-3,500 crore annually over FY22E-FY23E.
APSEZ is building 10mn ton of LPG & LNG capacity at Mundra and another 10mn ton of capacity
at Dhamra. It is also targeting doubling these capacity in the coming five years for which
infrastructure is already in place. Dhamra port 5mn MT of capacity is sold out to IOCL for next
30 yrs.
(50)
0
50
100
150
200
250
300
(200)
0
200
400
600
800
1,000
FY19 FY20 FY21 FY22E FY23E FY24E
Revenue
EBIDTA
Net Sales Realisation (Rs./MT) (RHS)
EBIDTA (Rs./MT) (RHS)
15
20
25
30
35
40
45
50
5
15
25
35
45
55
65
75
FY19 FY20 FY21 FY22E FY23E FY24E
Installed capacity (MMT)
Vol. (MMT)
Capacity Utilization (%) (RHS)
8181

( 0 9 t h D e c 2 0 2 1 )
For any further query, please email us on [email protected]
During FY21-24E, we expect the capacities to grow at 10% CAGR to 667 MMT. We expect
volumes to grow at 20% CAGR to 432 MMT leading to 23.4% CAGR growth in revenue to INR
16,927 cr. EBIDTA is expected to grow at 24.3% CAGR to INR 11,630 cr. Margins are expected
to remain stable at 68.7%.
Consolidated port segment growth in numbers
Source: Company Reports & Ventura Research
West-East coast parity
APSEZ after tasting success at its Mundra port, adopted a string of pearls strategy and today it
runs a portfolio of port assets across the 7500 km coastline. Today 60% of the traffic comes
from the western part of the country with the remaining being contributed by the ports on the
eastern coast.
West-East coast parity
Source: Company Reports & Ventura Research
150
200
250
300
350
400
450
500
550
3,000
5,000
7,000
9,000
11,000
13,000
15,000
17,000
19,000
FY18 FY19 FY20 FY21 FY22E FY23E FY24E
Revenue
EBIDTA
Net Sales Realisation (Rs./MT) (RHS)
EBIDTA (Rs./MT) (RHS)
40
45
50
55
60
65
150
250
350
450
550
650
750
FY18 FY19 FY20 FY21 FY22E FY23E FY24E
Installed capacity (MMT)
Vol. (MMT)
Capacity Utilization (%) (RHS)
West East
FY02 - 100% West coast
H1FY22 - 60% West, 40% East coast
8282
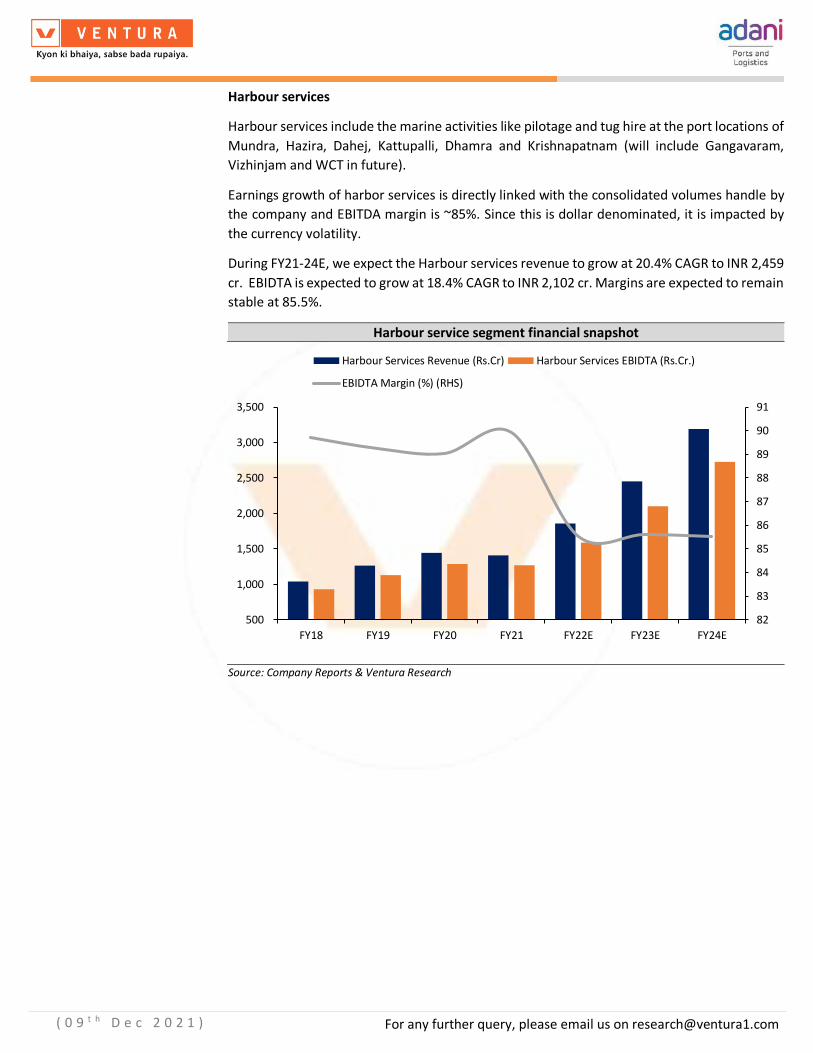
( 0 9 t h D e c 2 0 2 1 )
For any further query, please email us on [email protected]
Harbour services
Harbour services include the marine activities like pilotage and tug hire at the port locations of
Mundra, Hazira, Dahej, Kattupalli, Dhamra and Krishnapatnam (will include Gangavaram,
Vizhinjam and WCT in future).
Earnings growth of harbor services is directly linked with the consolidated volumes handle by
the company and EBITDA margin is ~85%. Since this is dollar denominated, it is impacted by
the currency volatility.
During FY21-24E, we expect the Harbour services revenue to grow at 20.4% CAGR to INR 2,459
cr. EBIDTA is expected to grow at 18.4% CAGR to INR 2,102 cr. Margins are expected to remain
stable at 85.5%.
Harbour service segment financial snapshot
Source: Company Reports & Ventura Research
82
83
84
85
86
87
88
89
90
91
500
1,000
1,500
2,000
2,500
3,000
3,500
FY18 FY19 FY20 FY21 FY22E FY23E FY24E
Harbour Services Revenue (Rs.Cr) Harbour Services EBIDTA (Rs.Cr.)
EBIDTA Margin (%) (RHS)
8383

( 0 9 t h D e c 2 0 2 1 )
For any further query, please email us on [email protected]
Logistics sector huge headroom for growth
According to industry estimates, the logistics sector in India is pegged at upwards of $160
billion, with an annual growth rate of 10.5%. The logistics industry is highly fragmented and
the organized sector accounts for a mere 10% of the total share. Strong growth supported by
government reforms, transportation sector development plans, growing retail sales and the E-
commerce sector are likely to be the key drivers of the logistics industry in India over the next
decade.
The logistics industry got recognition as a full fledge department only in 2019 under the Modi
government, when a draft National Logistic Policy was initiated. The policy aims to
• lower prohibitively high costs from 13% of the country’s GDP to 8% over five years,
• ensure faster movement of goods, and
• boost exports
The logistic sector remains extremely fragmented, involving 12 million employees, 200
shipping agencies and 36 logistics services. Any outcome of the national logistics policy will be
positive for large logistic companies, which have a presence across the entire value chain.
The future demand is for integrated end-to-end Logistics solutions which would include
development of Multimodal Logistics Parks (MMLPs), streamlined economic corridor routes
for efficient freight movement, and intermodal stations to connect various transportation
modes to ensure service integration.
Warehousing - exponential growth in the offing
The domestic warehousing space is highly fragmented and controlled by the unorganized
players, having small-sized warehouses (average size <10,000 SFT) with limited mechanization.
Warehousing has become one of the major segments of the rapidly growing Indian logistics
industry driven by the manufacturing and e-commerce industry. The sector is evolving fast,
with both the nature of the business and technology driving it, and undergoing dynamic
changes.
Sector-wise share of warehousing transactions
Source: AL Consulting, CARE Ratings, Company Reports & Ventura Research
26
36
17
7
14
E-commerce 3PL Engineering Retail Others
FY2131
61
2 3 3
E-commerce 3PL Engineering Retail Others
FY25E
8484

( 0 9 t h D e c 2 0 2 1 )
For any further query, please email us on [email protected]
The e-commerce market in India, which was growing at a CAGR of 19.6% since FY20 has
suddenly shown a sharp increase of 25.9% since the lockdown. This growth is primarily led by
market giants like Amazon, Flipkart and other platform companies.
The current Grade A warehousing capacity is 164 mn Sqft and expected to increase to 370 mn
Sqft. In addition, over the next couple of years, industrial warehousing is expected to see a
surge in demand as global manufacturing units look to shift or diversify out of China. India, as
part of its plan to attract such manufacturing units, is looking at building warehouses at a
frantic pace.
Warehousing growth
Source: Company Reports & Ventura Research
Gati Shakti plan to give a boost to multimodal connectivity
The Prime Minister Narendra Modi launched Gati Shakti - National Master Plan for Multi-
modal Connectivity. This is essentially a digital platform to bring 16 Ministries, including
Railways and Roadways, together for integrated planning and coordinated implementation of
infrastructure connectivity projects. The multi-modal connectivity will provide integrated and
seamless connectivity for the movement of people, goods and services from one mode of
transport to another. It will facilitate the last mile connectivity of infrastructure and also reduce
travel time for people.
It will incorporate infrastructure schemes of various Ministries and State Governments like
Bharatmala, Sagarmala, inland waterways, dry/land ports, UDAN etc. Economic Zones like
textile clusters, pharmaceutical clusters, defence corridors, electronic parks, industrial
corridors, fishing clusters, agri zones will be covered to improve connectivity and make Indian
businesses more competitive. It will also leverage technology extensively, including spatial
planning tools with ISRO imagery developed by BiSAG-N (Bhaskaracharya National Institute for
Space Applications and Geoinformatics).
4.4
1.090.8
0.020.0
0.5
1.0
1.5
2.0
2.5
3.0
3.5
4.0
4.5
5.0
USA UK China India
Per capita warehousing stock (Sq.ft.)
40
5561
6876
85
24
3337
4145
50
0
10
20
30
40
50
60
70
80
90
FY21 FY22E FY23E FY24E FY25E FY26E
Demand to reach ~370 mn Sqft. in next 5 years for Grade A
Total warehouse absorption Grade A warehouse absorption
8585

( 0 9 t h D e c 2 0 2 1 )
For any further query, please email us on [email protected]
“In the coming days, we will launch PM Gati Shakti Plan, a 100-lakh crore national
infrastructure master plan which will make a foundation for holistic infrastructure and give an
integrated pathway to our economy,” PM Modi said.
As on 25th Nov, 2021, the Ministry of Ports, Shipping and Waterways identified 101 projects
under PM Gati Shakti National Master Plan to enhance port connectivity with consumption
and production centres.
Gati Shakti plan targets up to 2024-25
Source: PIB, Ventura Research
8686

( 0 9 t h D e c 2 0 2 1 )
For any further query, please email us on [email protected]
Adani logistics
Adani Logistics (ALL) will be a one stop solution for providing integrated logistics solutions from
port gate to customer gate and return. Thus, providing a bouquet of services under logistics
platform including end mile connectivity. ALL is one of the leading end-to-end logistics service
providers in the country with a presence across all major markets. It is the leading private rail
operator in containerized transportation connecting all major seaports across India. The
company also provides customized solutions for automobiles, steel coil and liquid logistics.
APSEZ is focused on providing integrated supply chain solutions with a one stop customer
centric approach to capture higher wallet share. This will result in sustainable growth going
forward.
The present assets of the logistics verticals include the following
• The operational logisticspParks of the company includes those at Patli, Kishangarh,
Kila-Raipur, Malur and Nagpur with more in the pipeline, across India.
• 60 rakes (43 - container, 21 - GPWIS, 1 AFTO and 7 Agri Rakes),
• 800,000 sq ft of warehousing space,
• 5,000 + containers,
• 0.9 million metric tonnes of grain silos, and
• 6 inland waterways vessels
• 620 km of rail line
8787

( 0 9 t h D e c 2 0 2 1 )
For any further query, please email us on [email protected]
Integrated end-to-end logistics solution offered by APSEZ
Source: Company Reports & Ventura Research
8888

( 0 9 t h D e c 2 0 2 1 )
For any further query, please email us on [email protected]
Logistics Park
The company operates multi-modal logistics parks with rail connectivity at Patli, Kishangarh,
Kilaraipur, Kanech and Malur with a cumulative capacity of ~500,000 TEUs spread across 400
acres. The company’s ICD services (custom clearance) are available at Patli & Kilaraipur. In
addition, storage solutions for containers, bulk & break-bulk cargo and automobiles are also
provided. The company provides value-added services like sorting, labelling, packing, etc.
Logistics parks, currently under development at Nagpur and Mundra, are expected to be
operationalized in FY22.
Auto Logistics
This segment operates 1 BCA-CBM rake (JV with NYK Logistics) for rail transportation of
automobiles. This service helps to connect auto manufacturing hubs with gateway ports and
consumption centers (and storage yard options available pan-India). It also provides last mile
distribution to dealer locations. The company is specializing in the rail movement of finished
cars in containers using patented equipment designed especially for a large automobile
customer. It has dedicated RO-RO facility available at Adani Port, Mundra with pre-dispatch
storage capacity of 20,000 cars.
Inland Waterways
The company has dedicated inland vessels for cargo transportation using inland waterways. It
has Fleet of 6 inland vessels and also looking to expand this offering. Vessel capacities range
from 64 TEUs to 68 TEUs.
The company also undertakes transportation of bulk, break bulk and containers on National
Waterways 1 and National Waterways 2 (through Indo Bangladesh Protocol Route).
8989

( 0 9 t h D e c 2 0 2 1 )
For any further query, please email us on [email protected]
Inland Waterways Locations
Source: Company Reports & Ventura Research
Bulk Cargo Rail Logistics Solutions
The company operates 21 BOXN-HL rakes (under GPWIS) for transportation of bulk cargo viz.
coal, limestone, iron ore, etc. It also provides assurance of rake supply through dedicated rakes
for various customers viz. steel, cement & power plants to address their supply chain
requirements. This service provide cost savings to end customers in the form of reduced
demurrage charges (vessel/ rake), handling loss, idle freight loss, etc.
This service is currently deployed on the east coast of India for easing logistics of bulk material
between the ports and major industrial units. There is further scope for pan-India deployment
for connecting gateway ports, mines or production centres with consumption centres.
9090

( 0 9 t h D e c 2 0 2 1 )
For any further query, please email us on [email protected]
Bulk cargo rail logistics locations
Source: Company Reports & Ventura Research
Container Rail Logistics Solutions
APSEZ is India’s largest private container train operator – it operates 43 container trains (BLCM)
under Category-I license issued by Indian Railways. It provides transportation of container
cargo from Gateway ports (Mundra, Pipapav, Ennore & Dhamra) to logistics parks located in
Patli, Kishangarh, Kilaraipur, Kanech, Malur and other network locations. It also provides
customized solutions for containerized rail transportation of automobiles, steel coil and liquid
cargo.
9191
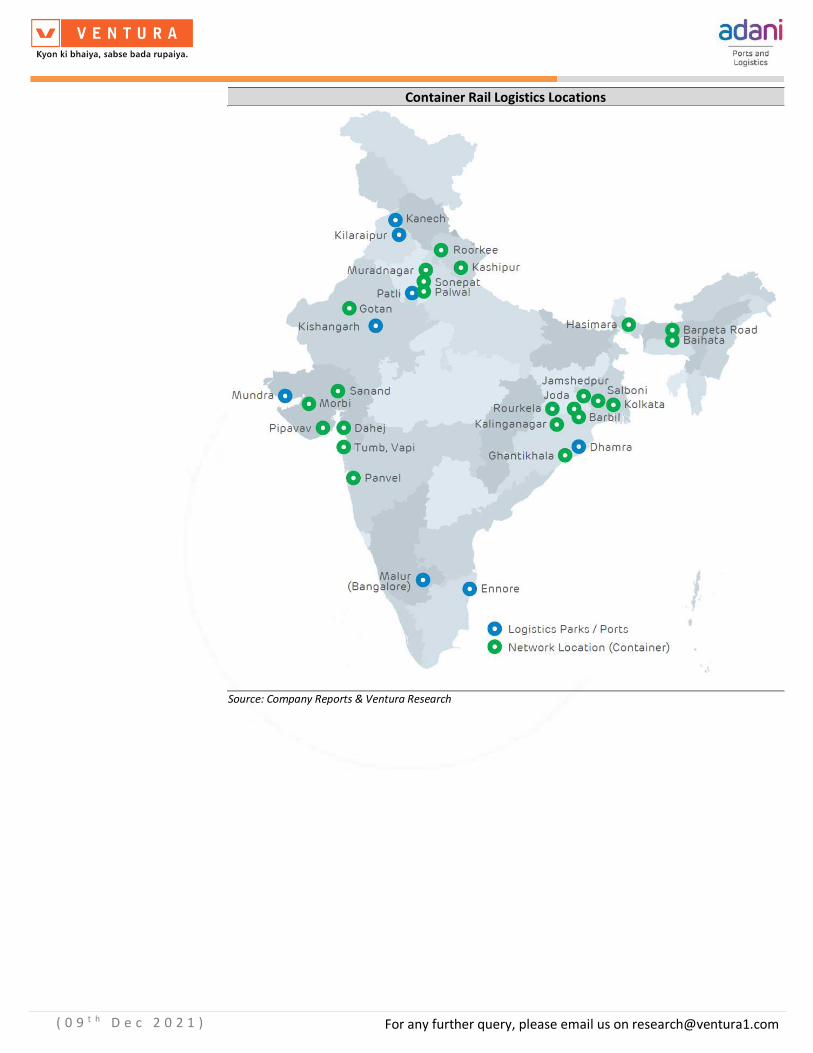
( 0 9 t h D e c 2 0 2 1 )
For any further query, please email us on [email protected]
Container Rail Logistics Locations
Source: Company Reports & Ventura Research
9292

( 0 9 t h D e c 2 0 2 1 )
For any further query, please email us on [email protected]
Rail assets of APSEZ
Source: Company Reports & Ventura Research
Sarguja Rail Corridor (SRCPL)
APESZ is consolidating its rail track assets by acquiring Sarguja Rail Corridor (SRCPL). SRCPL has
70 km of track length, capacity to handle 16 rakes per day. SRCPL has 50 years of land lease till
2065. The company has 30 years of Track Access & Usage Agreement (TAUA) with Rajasthan
Rajya Vidyut Utpadan Nigam Limited (RRVUNL) Till 2044. This asset has the potential to handle
~100 MMTPA with ~40 MMTPA of visibility for the near to mid-term. Acquisition of SRCPL will
resulted in equity dilution of ~7 cr shares.
SRCPL track capacity
Source: Company Reports & Ventura Research
The company has plan to expand into the logistics segment to enhance its integrated logistics
market share. Also, the company has entered the warehousing business which has huge
growth potential going forward with higher profitability margin.
9393

( 0 9 t h D e c 2 0 2 1 )
For any further query, please email us on [email protected]
ICDs building on DFC corridors
There was an open bidding process run by DFCCIL and the company has acquired eight strategic
assets on these DFC corridors, on the western DFC as well as the eastern DFC. The company
will have to sign the formal Letter of Agreement (LOA) in the next few months. After that the
company will construct ICD in these eight strategic locations in the next three years, which
means acquisition of land, making the detail project report, commencing the construction, and
operationalizing this asset. The company is well poised to complete these 8 stations within the
stipulated lines of three years and this will add on to the current fleet of ICD. This may need a
tentative capex of INR 50-150 cr depending on the size of the land and facility to be build there.
ICDs of APSEZ locations are New Palghar, New Sanjali, New Dadri, New Chawapail, New
Bhimsen, New Gholwad, New Gothangam and New Phulerain at WDFC and EDFC.
Each of the ports in Gujarat has its own strength and captive cargo catchment. Mundra with
adequate capacity does stand to gain more initially. Predominantly, Mundra Port would pose
a challenge to JNPT once the partial commissioning of DFC is done.
All the above enumerated logistics services are clubbed under container revenues. While the
container revenues over FY18-21 grew at 1% CAGR to INR 848 cr, EBIDTA has experienced
35.7% CAGR to INR 190 cr due to the operationalization of the value enhancing services. Going
ahead, we expect an upward trajectory of 45.7% CAGR in revenues to INR 2,620 cr with a
50.1% CAGR in EBIDTA to INR 642 cr over FY21-24. Margins too are set to expand by 209bps
to 24.5% over the forecast period.
Container segment financial snapshot
Source: Company Reports & Ventura Research
Warehousing
The company has the capability to deliver warehousing solutions pan-India. Its current
warehousing capacity of 800,000 sq. ft. is expected to witness a quantum jump to reach 60mn+
5
10
15
20
25
30
50
550
1,050
1,550
2,050
2,550
3,050
FY18 FY19 FY20 FY21 FY22E FY23E FY24E
Container Revenue Container EBIDTA EBIDTA Margin (%) (RHS)
9494

( 0 9 t h D e c 2 0 2 1 )
For any further query, please email us on [email protected]
sq.ft. by 2025 by way of organic expansion (50%) and inorganic acquisition (50%). Additional
warehousing projects are being developed at Taloja (Mumbai), Nagpur, Patli (Gurugram),
Chennai and Mundra.
At its warehouses, several options such as bonded, domestic, FTWZ, cargo-specific, as well as
built to suit facilities are offered. It also provides value-added services like sorting, quality
inspection, labelling, packing, omni-channel distribution, etc. Particularly at the FTWZ at
Mundra, benefits include duty deferment, tax exemptions, ease of re-exporting and other
value-added services.
Strategic partnership with Flipkart
Flipkart, India’s leading e-commerce marketplace, it has announced a strategic and commercial
partnership with the APSEZ. In this two-pronged partnership, Flipkart will work with Adani
Logistics Ltd, a wholly owned subsidiary of APSEZ, to strengthen Flipkart’s supply chain
infrastructure and further enhance its ability to serve its rapidly growing base of customers.
As part of this partnership, Adani Logistics will construct a massive 534,000 sq. ft. fulfilment
centre in its upcoming logistics hub in Mumbai that will be leased to Flipkart to address the
growing demand for e-commerce in Western India and support market access of several
thousands of sellers and MSMEs in the region. The centre is expected to be operational in
Q3FY22 and will have the capacity to house 10 million units of sellers’ inventory at any point.
Warehousing locations
Source: Company Reports & Ventura Research
9595

( 0 9 t h D e c 2 0 2 1 )
For any further query, please email us on [email protected]
Aspirational inorganic growth footprint for warehousing
Source: Company Reports & Ventura Research
During FY21-24E, we expect the warehousing capacities to grow at 225.5% CAGR to 14 SFT
leading to 278% CAGR growth in revenue to INR 514 cr. EBIDTA is expected to grow at 280.2%
CAGR to INR 437 cr. Margins are expected to remain stable at 85%.
9696

( 0 9 t h D e c 2 0 2 1 )
For any further query, please email us on [email protected]
Warehousing segment financial snapshot
Source: Company Reports & Ventura Research
Agri Logistics
The company operates 7 BCBFG rakes for transportation of food grains from base depots in
the North to field depots across numerous locations in India. It has 21 storage infrastructure
facilities (14 operational, 3 under implementation & 4 awarded) in 9 states across India. Also,
the company has 1.275 MMT Silo Capacity (69% operational, 31% contracted & under
implementation).
These facilities are connecting major food grain producing states viz. Punjab, Haryana &
Madhya Pradesh with major consumption centers located in Karnataka, Tamil Nadu,
Maharashtra, West Bengal & Gujarat through a pan-India network of procurement &
distribution silos.
APSEZ has setup India’s first integrated bulk handling, storage, and logistics system for food
grains. The scope includes
• procurement in bulk from farmers,
• cargo cleaning,
• storage in steel silos,
• high-tech preservation,
• real-time monitoring, and
• transport to field depots by rail wagons in bulk
The company provides a seamless end-to-end bulk supply chain to The Food Corporation of
India.
It also provides quality assurance where incoming cargo from farmers is checked for eight
quality parameters set out by the Government of India prior to storage and preservation in
silos. Outgoing cargo is also checked on similar quality parameters to ensure quality of food
grains distributed through PDS and other welfare schemes of GOI.
250
270
290
310
330
350
370
390
20
120
220
320
420
520
620
FY22E FY23E FY24E
Warehousing Revenue
Warehousing EBIDTA
Net Sales Realisation (Rs./Sq.Ft) (RHS)
EBIDTA (Rs./Sq.Ft) (RHS)
1
3
5
7
9
11
13
15
FY22E FY23E FY24E
Installed capacity (Sq.Ft)
9797

( 0 9 t h D e c 2 0 2 1 )
For any further query, please email us on [email protected]
Agri logistics Locations
Source: Company Reports & Ventura Research
During FY21-24E, we expect the agri logistics revenue to grow at 30.6% CAGR to INR 245 cr.
EBIDTA is expected to grow at 26.9% CAGR to INR 74 cr. Margins are expected to remain stable
at 30%.
9898

( 0 9 t h D e c 2 0 2 1 )
For any further query, please email us on [email protected]
Agri logistics segment financial snapshot
Source: Company Reports & Ventura Research
During FY21-24E, we expect the logistics revenue to grow at 52.2% CAGR to INR 3,380 cr.
EBIDTA is expected to grow at 72.1% CAGR to INR 1,153 cr. Margins are expected to remain
stable at 34.1%.
Logistics segment financial snapshot
Source: Company Reports & Ventura Research
20
25
30
35
40
45
50
55
60
25
45
65
85
105
125
145
165
185
205
FY20 FY21 FY22E FY23E FY24E
Agri logistics Revenue (Rs.Cr.) Agri logistics EBIDTA (Rs.Cr.)
EBIDTA Margin (%) (RHS)
0
500
1,000
1,500
2,000
2,500
3,000
3,500
4,000
FY19 FY20 FY21 FY22E FY23E FY24E
Growing logistics segmental revenue (Rs.Cr.)
Container Agri logistics Warehousing
0
20
40
60
80
100
120
FY19 FY20 FY21 FY22E FY23E FY24E
Logistics revenue mix (%)
Container Agri logistics Warehousing
9999

( 0 9 t h D e c 2 0 2 1 )
For any further query, please email us on [email protected]
Logistics assets and expansion plan
Source: Company Reports & Ventura Research
Bidding for CONCOR
CCEA granted in-principal approval for the strategic disinvestment of the Government of India
(GoI) share in Container Corporation of India (CONCOR). The GoI is looking to divest 30.8% in
CONCOR, along with transfer of management control.
The acquisition of CONCOR is a strategic fit, considering the ambitious growth plans of APSEZ.
The company is focusing on the acquisition of CONCOR, which will help to gain market share.
The company has plans to gain market share with or without winning CONCOR. If it wins
CONCOR then it will reduce organic capex to build capacity. By winning CONCOR it will become
the first logistic company of India. And if it does not win CONCOR, it will be the second largest,
post CONCOR. The company foresees immense competition over the next few years, which
will eliminate many logistics players from the business. Consolidation will take place due to
price wars, etc.
Special Economic Zone (SEZ)
Spanning an area of 15,000 hectares, the Mundra Economic Hub offers investment options at
the largest multi-product Special Economic Zone (SEZ), Free Trade and Warehousing Zone
(FTWZ) and Domestic Industrial Zone. It is well connected via all forms of connectivity,
including an Airport at Mundra, which can handle large passenger and cargo planes.
A ready ecosystem is available for future development. Businesses can set up their factories
on a turn-key basis.
100100

( 0 9 t h D e c 2 0 2 1 )
For any further query, please email us on [email protected]
SEZ segment growth in numbers
Source: Company Reports & Ventura Research
FY21 peak of balance sheet leverage. Strong cashflow generation to enable
APSEZ become net debt free by FY27
The company has been in an extremely rapid growth phase which has been funded primarily
by debt. Despite the aggressive expansion, the balance sheet leverage continues to be under
control with the net debt/equity of 0.9x and net debt/EBIDTA of 3.6x as of FY21. The strong
cashflow generation FY21 onwards should enable the company to not only finance its growth
through internal accruals but achieved a net debt free status by FY27.
Balance sheet - significant deleveraging on the cards
Source: Company Reports & Ventura Research
0
100
200
300
400
500
600
700
800
900
FY21 FY22E FY23E FY24E
SEZ Revenue SEZ EBIDTA
0
1
1
2
2
3
3
4
4
5
0
10,000
20,000
30,000
40,000
50,000
FY17 FY18 FY19 FY20 FY21 FY22E FY23E FY24E
Stable balance sheet strength
Total Debt Net Debt
Net Debt to Equity (X) Net Debt to EBITDA (X)
0
20
40
60
80
100
120
140
160
0
2,000
4,000
6,000
8,000
10,000
12,000
14,000
16,000
18,000
FY17 FY18 FY19 FY20 FY21 FY22E FY23E FY24E
Strong cash flow generation
CFO FCF
CFO to EBITDA (%) FCF to Net Profit (%)
INR (Cr) INR (Cr) % X
101101

( 0 9 t h D e c 2 0 2 1 )
For any further query, please email us on [email protected]
APSEZ is committed to improving at ESG front
In line with the In line with India's commitment to net zero targets at COP26 of the Government
of India, APSEZ developed a vision of emerging as a zero waste Company in 2014 by adopting
the 5R principles of waste management.
In FY18-19, 5718 MT of waste was disposed of. In FY19-20, this declined to 2610 MT and in
FY20-21 it declined to 2042 MT.
APSEZ businesses and future investments are aligned to sustainable growth with a focus on
preserving the environment and inclusive growth. The ESG framework rests on three pillars –
firm commitments, guiding principles and policies.
• Climate change, biodiversity conservation, the safety of the workforce, sustainable
livelihood, sustainable supply chain, customer centricity and ensuring world-class
corporate governance structure continues to be APSEZ’s focus areas.
• APSEZ is the first port company in India to become a supporter of TCFD. Thus, it is
aligning disclosures to global standards.
• APSEZ is the first port company in India to come out with its vision of achieving carbon
neutrality by 2025.
• In the area of bio-diversity, APSEZ is the largest corporate in India that have carried
out massive mangrove afforestation to the tune of 2989 hectares and also is
conserving mangrove of over 2596 Hectares at Mundra. APSEZ is committed to
increasing mangrove afforestation area of up to 4000 hectares and 1200 hectares of
terrestrial plantation area by FY2025.
• The company consider safety as a value and APSEZ is committed to ensuring zero
fatalities at its ports, safety is one of the KPIs for CEO of various locations with their
annual incentives linked to it.
APSEZ’s environmental commitments
Source: Company Reports & Ventura Research
102102

( 0 9 t h D e c 2 0 2 1 )
For any further query, please email us on [email protected]
APSEZ’s social philosophy
Source: Company Reports
APSEZ’s governance policy
Source: Company Reports
103103

( 0 9 t h D e c 2 0 2 1 )
For any further query, please email us on [email protected]
Business Quality Score
Key Criteria Score Risk Comments
Management & Leadership
Management Quality 8 Low The management is of decent quality. It has been able to deliver growth by taking calculated risks.
Promoters Holding Pledge 5 Moderate The promoter holding is 63.83% and there is 15.33% of promoter pledging as of Sept 2021.
Board of Directors Profile 7 Low The average experience of directors is >20 years with significant experience in industry. Also, many of the board members have been working since inception with the company.
Industry Consideration
Industry Growth 7 Low
Ports are the gateways for EXIM trade and they play a crucial role in India’s international trade. According to the Ministry of Shipping, approximately 95% of the country’s trade by volume and 70% by value moves through maritime transport.
Regulatory Environment or Risk 6 Moderate The company is impacted by the global trades environment and any disruption in global trades could have an adverse impact. The company is exposed to a range of environmental laws & regulations.
Entry Barriers / Competition 8 Low Entry of a new company in the port industry would require a strong capital base and a huge investment.
Business Prospects
New Business / Client Potential 8 Low
The company has a leading market share in private port players in India and is working on becoming the larger integrated logistics player. Also, working aggressively towards gaining market share which will resulted into further growth.
Business Diversification 7 Low The company is focusing on providing entire integrated logistics solutions which diversify the business from being only a port player.
Market Share Potential 8 Low APSEZ is the largest private port player.
Margin Expansion Potential 7 Low Cost rationalization, diversifying revenue, improving utilization of recently acquired assets will helps to APSEZ to improve its profitability and financial strength.
Earnings Growth 8 Low Higher economic growth and growth of EXIM trades will result into higher profitable growth.
Valuation and Risk
Balance Sheet Strength 6 Moderate Higher debt on the balance sheet drags down its strength, return ratio and higher interest burden but better revenue mix and higher growth can provide support to sustain its financial profile.
Debt Profile 6 Moderate Moderate debt on the balance sheet and fruit of aggressive capex plans will help to strengthen balance sheet.
FCF Generation 7 Low With all the key drivers in place, we are expecting positive FCF generation.
Dividend Policy 6 Moderate The company has paid dividend in the past 6 years but higher debt and aggressive capex can lower dividend payments.
Total Score
Ventura Score (%)
104
70 Moderate
The overall risk profile of the company is good and we consider it as a Moderate risk company for investments
Source: Company Reports & Ventura Research
104104

( 0 9 t h D e c 2 0 2 1 )
For any further query, please email us on [email protected]
Annual Report Takeaways
We analyzed the FY21 annual report of APSEZ and our key observations are as follows:
Key Takeaways
• Inorganic growth: The Company completed 75% acquisition of Krishnapatnam port
and entered into a definitive agreement for the acquisition of the balance 25% stake
for an Enterprise Value of INR 13,675 crore. The company is operating at a capacity of
64 MMT; the port has an approved master plan for 300 MTPA; the company plans to
take annual throughput above 100 MMT in a few years. The company completed the
acquisition of Dighi port in February 2021 for INR 705 crore under the Corporate
Insolvency Resolution Plan. The company plans to invest INR 10,000 cr and develop
Dighi port as an alternative gateway to Jawaharlal Nehru Port Trust (JNPT) operations
in Navi Mumbai. The company emerged as India’s first private sector rail track
Company by acquiring SRCPL to invest in strategic rail lines under the PPP model. It
also announced the setting up of a container terminal at Colombo port in partnership
with John Keells and SLPA.
• Opex cost optimisation: The company is moving from fixed costs to variable costs
wherever possible, renegotiating operational contracts through re-engineering,
reducing built-in escalation and redeploying manpower and machines. The Company
digitized processes and improved resource utilization to optimize costs, which
strengthened EBIDTA margins by 100 bps and is likely to expand 200-250 bps following
increased volumes in the next few years.
• Mundra, the largest container port: The Company’s Mundra port, the largest
commercial port in India, emerged as the largest container handling port in FY 2020-
21 (surpassing JNPT) with a market share of 32% (gain of around 5%).
• New growth from entering into the warehousing segment: Adani Logistics (ALL)
forayed into the warehousing sector with the vision to become the largest player in
this sector in five years. ALL set target to build 30 million sq. ft. warehousing capacity
during this period. As a part of this plan, ALL announced a strategic and commercial
partnership with e-commerce major Flipkart to strengthen its supply chain
infrastructure. ALL will construct a massive 5,34,000 sq. ft. fulfilment center by
leveraging state-of-the-art technologies in its proposed logistics hub in Mumbai.
• Winning bid for ICDs at DFC corridor: As a part of expansion into the Inland Freight
Terminal business, ALL emerged as a successful bidder and received Letter of Award
from DFCCIL for the development of freight terminals with exclusive station
connectivity across eight locations (New Palghar, New Sanjali, New Dadri, New
Chawapail, New Bhimsen, New Gholwad, New Gothangam and New Phulerain WDFC
and EDFC). Once developed, these terminals on WDFC will enjoy direct DFC corridor
connectivity.
• Goal of the company: Emerge as India’s largest ports company with 500 MMT cargo
throughput by 2025 and emerge as the world’s largest ports company by 2030.
105105

( 0 9 t h D e c 2 0 2 1 )
For any further query, please email us on [email protected]
Pay Grades
The remuneration growth of KMP is in line with the performance of the company. The
Chairman has not taken any hike in remuneration in the last five years.
Remuneration in the last 5 years
Source: Company Reports & Ventura Research
Management & Leadership Team Turnover
Details on Board of Director and KMPs
Source: Company Reports
Auditor qualifications & significant notes to accounts
Deloitte Haskins & Sells LLP is the auditor and there were no qualifications/emphasis of
matters highlighted by them in the FY21 Annual Report.
Parameter (Fig in INR Cr) FY17 FY18 FY19 FY20 FY21 CAGR%
Chairman & MD 2.8 2.8 2.8 2.8 2.8 0.0
Share in Total Employee Cost (%) 0.7 0.6 0.5 0.5 0.5
Chief Financial Officer 3.5 5.1 5.7 7.1 7.0 18.7
Share in Total Employee Cost (%) 0.9 1.1 1.1 1.3 1.1
Remuneration of SVP/VP/GM 11.6 13.1 11.7 14.5 14.7 6.1
Share in Total Employee Cost (%) 3.0 2.9 2.2 2.7 2.4
Employee Cost 383.1 447.3 529.8 546.5 615.1 12.6
Employee Cost as % of Revenue (%) 4.5 4.0 4.8 4.8 4.9
Board of Director & KMP FY17 FY18 FY19 FY20 FY21
Gautam S Adani CM & MD CM & MD CM & MD CM & MD CM & MD
Avantika Singh Aulakh NED NED
Rajesh S Adani NED NED NED NED NED
Malay Mahadevia WTD WTD WTD WTD WTD
Karan Adani WTD WTD WTD WTD WTD
Ganesan Raghuram ID ID ID ID ID
Gopal Krishna Pillai ID ID ID ID ID
Nirupama Rao ID ID ID
Bharat Sheth ID ID ID
P S Jayakumar ID
Kamlesh Bhagia CS CS CS CS
Dipti Shah CS
Mukesh Kumar NED NED
Radhika Haribhakti ID ID ID
Sanjay Lalbhai ID ID
Deepak Maheshwari CFO CFO CFO CFO
CM-Chairman NED-Non Executive Director
MD-Managing Director ID-Independent Director
CFO-Chief Financial Officer CS-Company Secretary
WTD-Whole Time Director
106106

( 0 9 t h D e c 2 0 2 1 )
For any further query, please email us on [email protected]
Major Related Party Transactions with promoters and KMPs
In the last five years, we can see higher related party transactions.
Related Party Transactions are relatively low
Source: Company Reports & Ventura Research
Contingent Liabilities
Contingent liabilities were rather high in FY17-20 compared to the net worth and revenue,
which has reduced in FY21. These are mostly from disputes on Income Tax.
Contingent Liabilities are reasonably high
Source: Company Reports & Ventura Research
Management Team
Source: Company Reports
Key Risks & Concerns
• Concession period of Mundra port
Concession period of Mundra port will end in 2031. The company is confident of
renewing the concession. However, in case the concession lapses then the company
will face adverse financial impact as the Mundra port is the mainstay of its operations.
• Exit of Myanmar business can be at a discount to book value
Parameter (Fig in INR Cr) FY17 FY18 FY19 FY20 FY21
Related Party Trans 3,116.3 5,084.5 4,953.9 3,947.4 3,052.6
Compensation to KMP 18.9 21.3 20.8 24.4 24.3
Transactions as % of Revenue (%) 37.1 45.1 45.5 34.7 24.5
Parameter (Fig in INR Cr) FY17 FY18 FY19 FY20 FY21
Claims against the company not acknowledged 1,331.2 1,272.3 1,834.6 1,445.9 631.6
Transactions as % of Revenue (%) 15.8 11.2 16.8 12.6 5.0
Transactions as % of Net Worth (%) 7.6 6.0 7.5 5.6 2.1
Key Person Designation Details
Mr. Gautam Adani Chairman & MD
Mr. Gautam Adani has over 36 years of business experience. Under his leadership, the
Adani Group has emerged as a global integrated infrastructure player with interests
across resources, logistics and energy verticals.
Mr. Rajesh Adani Non-Executive Director
Mr. Rajesh Adani has been associated with Adani Group since its inception. He is in-
charge of the operations of the Group and is responsible for developing its business
relationships.
Mr. Karan Adani CEOMr. Karan Adani holds a degree in economics from Purdue University, USA. He started
his career by learning about the intricacies of port operations at Mundra.
Dr. Malay Mahadevia Whole-Time Director
Dr. Malay Mahadevia holds a master’s degree in dental surgery from Nair Hospital
Dental College. He completed his Doctor of Philosophy in coastal ecology around
Mundra area, Kutch District, from the Gujarat University in 2008.
107107

( 0 9 t h D e c 2 0 2 1 )
For any further query, please email us on [email protected]
To accomplish its business goals in Myanmar, the company established a 100%
subsidiary, Adani Yangon International Terminal Company Limited (AYITCL) in February
2019. In May 2019, the company announced its intent to set up a container terminal
at Yangon, Myanmar, and entered into a lease agreement with the democratically
elected government at that time. The military coup and subsequent violence in
Myanmar have resulted in uncertainty. APSEZ will abandon the project and write down
project investments in full. The write-down will not materially impact the Balance
Sheet as it is equivalent to about 1.3% of the total assets of APSEZ.
• Promoters stake at Pledge
Promoter's pledge at APSEZ has come down significantly in past 12 months from the
high of 50%+ of promoter's holding to currently the same is less than 10% of total
holding and 15% of promoter's holding as per last fillings. The promoters have pledged
stake worth of Rs.19933 cr. The promoters intend to revoke the the entire pledge in
12-18 months.
Pledge as a % of total Shares held by Promoters
Source: Company Reports & Ventura Research
• Higher related party transactions
APSEZ has higher receivables from the related party which is keeping its receivables
days relatively high compared to its peers. The company has started working on an
issue that has resulted in a fall in the related party’s receivables as a % of total
receivables. Receivable from related parties like Adani Power and Adani enterprises
have been coming down progressively and help improve working capital cycle as well
as improve DSO.
10
20
30
40
50
60
70
Q3F
Y16
Q4F
Y16
Q1F
Y17
Q2F
Y17
Q3F
Y17
Q4F
Y17
Q1F
Y18
Q2F
Y18
Q3F
Y18
Q4F
Y18
Q1F
Y19
Q2F
Y19
Q3F
Y19
Q4F
Y19
Q1F
Y20
Q2F
Y20
Q3F
Y20
Q4F
Y20
Q1F
Y21
Q2F
Y21
Q3F
Y21
Q4F
Y21
Q1F
Y22
Q2F
Y22
108108

( 0 9 t h D e c 2 0 2 1 )
For any further query, please email us on [email protected]
Higher receivables from related parties
Source: Company Reports & Ventura Research
• The operation of the company has a direct dependency on the domestic and
international economic growth. Any slowdown in the economy will have an adverse
impact on the performance of the company.
• Ports are a gateway to the seas and any weather conditions can impact operations.
4
14
24
34
44
54
64
74
400
900
1,400
1,900
2,400
2,900
3,400
3,900
4,400
4,900
FY15 FY16 FY17 FY18 FY19 FY20 FY21
Total Receivables
Related party Receivables
Related Party receivable % of Total Receivables
Related Party receivable % of Revenue
109109

( 0 9 t h D e c 2 0 2 1 )
For any further query, please email us on [email protected]
Quarterly and Annual Performance
Source: Company Reports & Ventura Research
Fig in INR Cr (unless specified) Q1FY20 Q2FY20 Q3FY20 Q4FY20 FY20 Q1FY21 Q2FY21 Q3FY21 Q4FY21 FY21 Q1FY22 Q2FY22 FY22E FY23E FY24E
Revenue from operations 2,794.5 2,821.2 2,902.0 2,921.2 11,438.8 2,292.7 2,902.5 3,746.5 3,607.9 12,549.6 4,556.8 3,532.4 16,917.3 19,954.7 24,106.2
YoY Growth (%) 4.7 (18.0) 2.9 29.1 23.5 9.7 98.8 21.7 34.8 18.0 20.8
Raw Material Cost 0.0 0.0 0.0 0.0 0.0 0.0 0.0 0.0 0.0 0.0 0.0 0.0 0.0 0.0 0.0
RM Cost to Sales (%) 0.0 0.0 0.0 0.0 0.0 0.0 0.0 0.0 0.0 0.0 0.0 0.0 0.0 0.0 0.0
Employee Cost 132.5 135.2 128.1 150.7 546.5 140.4 147.0 160.7 167.0 615.1 164.1 168.2 710.4 827.5 990.1
Employee Cost to Sales (%) 4.7 4.8 4.4 5.2 4.8 6.1 5.1 4.3 4.6 4.9 3.6 4.8 4.2 4.1 4.1
Other Expenses 818.9 1,374.8 632.0 2,130.8 5,387.5 794.4 905.0 1,097.8 1,130.0 3,951.1 2,161.7 1,157.4 5,359.4 6,214.9 7,600.7
Other Expenses to Sales (%) 29.3 48.7 21.8 72.9 47.1 34.7 31.2 29.3 31.3 31.5 47.4 32.8 31.7 31.1 31.5
EBITDA 1,843.0 1,311.1 2,141.8 639.7 5,504.7 1,357.9 1,850.6 2,488.0 2,311.0 7,983.4 2,231.0 2,206.8 10,847.5 12,912.3 15,515.4
EBITDA Margin (%) 66.0 46.5 73.8 21.9 48.1 59.2 63.8 66.4 64.1 63.6 49.0 62.5 64.1 64.7 64.4
Net Profit 1,022.4 1,054.2 1,352.2 334.4 3,763.1 758.0 1,387.0 1,561.5 1,287.8 4,994.3 1,306.7 951.7 5,591.7 6,762.3 8,769.9
Net Margin (%) 36.6 37.4 46.6 11.4 32.9 33.1 47.8 41.7 35.7 39.8 28.7 26.9 33.1 33.9 36.4
Adjusted EPS 5.0 5.2 6.7 1.6 18.5 3.7 6.8 7.7 6.3 24.6 6.4 4.7 27.5 33.3 43.2
P/E (X) 39.2 29.5 26.4 21.8 16.8
Adjusted BVPS 126.1 150.7 172.6 198.6 231.8
P/BV (X) 5.8 4.8 4.2 3.7 3.1
Enterprise Value 1,78,800.1 1,85,151.3 1,83,284.8 1,79,684.8 1,74,273.0
EV/EBITDA (X) 32.5 23.2 16.9 13.9 11.2
Net Worth 25,623.5 30,628.3 35,069.2 40,343.8 47,096.6
Return on Equity (%) 14.7 16.3 15.9 16.8 18.6
Capital Employed 55,699.3 65,569.1 82,030.0 87,373.8 94,270.5
Return on Capital Employed (%) 6.1 7.2 8.2 9.4 10.7
Invested Capital 48,373.5 59,729.5 62,304.0 63,978.5 65,319.6
Return on Invested Capital (%) 7.9 9.8 13.2 15.8 19.0
Cash Flow from Operations 7,401.8 7,555.8 8,563.2 13,508.9 16,148.7
Cash Flow from Investing (750.4) (14,142.7) (5,635.1) (6,333.3) (4,758.9)
Cash Flow from Financing (4,255.6) 3,513.9 8,658.7 (5,554.0) (6,018.2)
Net Cash Flow 2,395.8 (3,073.0) 11,586.8 1,621.6 5,371.6
Free Cash Flow 1,717.2 4,266.3 2,121.2 6,509.1 8,237.4
FCF to Revenue (%) 15.0 34.0 12.5 32.6 34.2
FCF to EBITDA (%) 31.2 53.4 19.6 50.4 53.1
FCF to Net Profit (%) 45.6 85.4 37.9 96.3 93.9
FCF to Net Worth (%) 6.7 13.9 6.0 16.1 17.5
Total Debt 30,075.8 34,940.8 46,960.8 47,030.0 47,173.9
Net Debt 22,750.0 29,101.3 27,234.8 23,634.7 18,223.0
Net Debt to Equity (X) 0.9 1.0 0.8 0.6 0.4
Net Debt to EBITDA (X) 4.1 3.6 2.5 1.8 1.2
Interest Coverage Ratio (X) 2.0 2.6 2.5 2.4 3.0
110110

( 0 9 t h D e c 2 0 2 1 )
For any further query, please email us on [email protected]
Summary of Management Commentary and Quarterly Performance over last few quarters
Key Criteria View Comments
Q2FY21
Business Performance POSITIVE Revenues up 2.9% YoY to INR 2,903 cr, EBITDA up 75.1% to INR 2,296 cr, PAT up 31.6% YoY to INR 1,387 cr.
Port revenue up 3% YoY to INR 2,432 cr, Logistics revenue down 9.8% YoY to INR 231 cr.
Outlook & Strategy POSITIVE Sales guidance for FY22: INR 12,500-13,000 cr. EBITDA guidance for FY22: INR 8,000-8,500 cr.
Q3FY21
Business Performance POSITIVE Revenue up 12% YoY to INR 3,746 cr. On the back of 37% growth of cargo volume, Port revenue grew by 35% and port EBITDA by 38%. Logistics revenue up 8% YoY to INR 259 cr.
Outlook & Strategy POSITIVE Sales guidance for FY22: ~INR 12,700 cr. EBITDA guidance for FY22: ~INR 8,200 cr.
Q4FY21
Business Performance POSITIVE Revenue up 24% YoY to INR 3,608 cr. On the back of 27% growth of cargo volume, Port revenue grew by 30% and port EBITDA by 42%. Logistics revenue down 7% YoY to INR 268 cr.
Outlook & Strategy POSITIVE Sales guidance for FY22: INR 16,000-16,800 cr. EBITDA guidance for FY22: INR 10,200-10,700 cr.
Q1FY22
Business Performance POSITIVE
Revenues up 98.8% YoY to INR 4,556.8 cr, EBITDA up 64.3% to INR 2,231.0 cr, PAT up 72.4% YoY to INR 1,306.7 cr. Port revenue up 110.3% YoY to INR 3,811.8 cr, Logistics revenue up 34.0% YoY to INR 268 cr, Harbour services revenue up 70.4% YoY to INR 477 cr.
Outlook & Strategy POSITIVE
Logistics revenue increased on account of higher rail volume (up 10%), terminal volume (up 13%) and higher bulk cargo handled through GPWIS (up 59%). Mundra port continues to be the largest commercial port, 19% ahead of the second largest port Deendayal (Kandla) Port. Sales guidance for FY22: INR 18,000-18,800 cr (including inorganic acquuisition). EBITDA guidance for FY22: INR 11,500-12,000 cr.
Q2FY22
Business Performance POSITIVE Revenues up 21.7% YoY to INR 3,532.4 cr, EBITDA up 19.3% to INR 2,206.8 cr, PAT down 31.4% YoY to INR 951.7 cr.
Port revenue up 21.3% YoY to INR 2,805.4 cr, Logistics revenue up 20.3% YoY to INR 278 cr, Harbour services revenue up 25.1% YoY to INR 449 cr.
Due to exceptional item the company has to face lower PAT in Q2FY22
111111

( 0 9 t h D e c 2 0 2 1 )
For any further query, please email us on [email protected]
Outlook & Strategy POSITIVE
Volume has improved YoY due to improvement in EXIM trades. Acquisition of 10.4% stake in Gangavaram Port (GPL) held by Government of Andhra Pradesh is completed for a consideration of Rs.645 Cr. With this APSEZ holds 41.9% stake in GPL. The Board has decided to actively work on a plan on exiting Company’s investment in Myanmar including divestment opportunities. Sales guidance for FY22: INR 18,000-18,800 cr (including inorganic acquuisition). EBITDA guidance for FY22: INR 11,500-12,000 cr.
Source: Company Reports & Ventura Research
112112

( 0 9 t h D e c 2 0 2 1 )
For any further query, please email us on [email protected]
Appendix
Cluster-wise potential Coal Traffic by 2030
Source: MIV 2030, Company Reports & Ventura Research
Cluster-wise potential POL Traffic by 2030
Source: MIV 2030, Company Reports & Ventura Research
113113

( 0 9 t h D e c 2 0 2 1 )
For any further query, please email us on [email protected]
Cluster-wise potential Iron Ore Traffic by 2030
Source: MIV 2030, Company Reports & Ventura Research
Cluster-wise potential Container Traffic by 2030
Source: MIV 2030, Company Reports & Ventura Research
114114

( 0 9 t h D e c 2 0 2 1 )
For any further query, please email us on [email protected]
Financial Analysis & Projections
Source: Company Reports & Ventura Research
Fig in INR Cr (unless specified) FY19 FY20 FY21 FY22E FY23E FY24E Fig in INR Cr (unless specified) FY19 FY20 FY21 FY22E FY23E FY24E
Income Statement Per share data & Yields
Revenue 10,925.4 11,438.8 12,549.6 16,917.3 19,954.7 24,106.2 Adjusted EPS (INR) 18.6 17.5 23.2 26.0 31.5 40.8
YoY Growth (%) 4.7 9.7 34.8 18.0 20.8 Adjusted Cash EPS (INR) 25.0 25.3 33.0 38.1 44.6 55.1
Raw Material Cost 0.0 0.0 0.0 0.0 0.0 0.0 Adjusted BVPS (INR) 115.1 120.2 149.3 170.0 194.5 225.9
RM Cost to Sales (%) 0.0 0.0 0.0 0.0 0.0 0.0 Adjusted CFO per share (INR) 28.1 34.4 35.2 39.8 62.8 75.1
Employee Cost 529.8 546.5 615.1 710.4 827.5 990.1 CFO Yield (%) 3.9 4.7 4.8 5.5 8.7 10.3
Employee Cost to Sales (%) 4.8 4.8 4.9 4.2 4.1 4.1 Adjusted FCF per share (INR) 17.7 8.0 19.8 9.9 30.3 38.3
Other Expenses 3,804.1 5,387.5 3,951.1 5,359.4 6,214.9 7,600.7 FCF Yield (%) 2.4 1.1 2.7 1.4 4.2 5.3
Other Exp to Sales (%) 34.8 47.1 31.5 31.7 31.1 31.5
EBITDA 6,591.6 5,504.7 7,983.4 10,847.5 12,912.3 15,515.4 Solvency Ratio (X)
Margin (%) 60.3 48.1 63.6 64.1 64.7 64.4 Total Debt to Equity 1.1 1.2 1.1 1.3 1.1 1.0
YoY Growth (%) (16.5) 45.0 35.9 19.0 20.2 Net Debt to Equity 0.9 0.9 0.9 0.7 0.6 0.4
Depreciation & Amortization 1,373.5 1,680.3 2,107.3 2,599.4 2,830.4 3,077.1 Net Debt to EBITDA 3.2 4.1 3.6 2.5 1.8 1.2
EBIT 5,218.1 3,824.4 5,876.1 8,248.1 10,082.0 12,438.3
Margin (%) 47.8 33.4 46.8 48.8 50.5 51.6 Return Ratios (%)
YoY Growth (%) (26.7) 53.6 40.4 22.2 23.4 Return on Equity 16.3 14.7 16.3 15.9 16.8 18.6
Other Income 1,405.5 2,433.2 2,685.5 1,847.0 2,350.9 2,533.7 Return on Capital Employed 7.9 6.1 7.2 8.2 9.4 10.7
Finance Cost 1,428.3 1,950.6 2,255.3 3,276.1 4,135.6 4,145.0 Return on Invested Capital 11.4 7.9 9.8 13.2 15.8 19.0
Interest Coverage (X) 3.7 2.0 2.6 2.5 2.4 3.0
Exceptional Item (69.0) (58.6) 0.0 0.0 0.0 0.0 Working Capital Ratios
PBT 5,126.3 4,248.3 6,306.3 6,819.1 8,297.3 10,827.1 Payable Days (Nos) 19 23 29 25 25 25
Margin (%) 46.9 37.1 50.3 40.3 41.6 44.9 Inventory Days (Nos) 27 9 29 29 29 29
YoY Growth (%) (17.1) 48.4 8.1 21.7 30.5 Receivable Days (Nos) 93 102 85 75 73 71
Tax Expense 1,081.5 459.4 1,243.3 1,227.4 1,535.0 2,057.1 Net Working Capital Days (Nos) 101 88 84 79 77 75
Tax Rate (%) 21.1 10.8 19.7 18.0 18.5 19.0 Net Working Capital to Sales (%) 27.7 24.1 23.1 21.6 21.1 20.5
PAT 4,044.8 3,788.9 5,063.0 5,591.7 6,762.3 8,769.9
Margin (%) 37.0 33.1 40.3 33.1 33.9 36.4 Valuation (X)
YoY Growth (%) (6.3) 33.6 10.4 20.9 29.7 P/E 39.1 41.5 31.2 27.9 23.1 17.8
Min Int/Sh of Assoc (54.6) (25.8) (68.7) 0.0 0.0 0.0 P/BV 6.3 6.0 4.9 4.3 3.7 3.2
Net Profit 3,990.2 3,763.1 4,994.3 5,591.7 6,762.3 8,769.9 EV/EBITDA 26.9 32.5 23.2 16.9 13.9 11.2
Margin (%) 36.5 32.9 39.8 33.1 33.9 36.4 EV/Sales 16.2 15.6 14.8 10.8 9.0 7.2
YoY Growth (%) (5.7) 32.7 12.0 20.9 29.7
Cash Flow Statement
Balance Sheet PBT 5,126.3 4,248.3 6,306.3 6,819.1 8,297.3 10,827.1
Share Capital 414.2 406.4 406.4 429.9 429.9 429.9 Adjustments 668.4 3,350.3 2,634.8 3,729.4 7,294.7 8,122.5
Total Reserves 24,334.0 25,436.7 31,690.4 36,107.8 41,382.4 48,135.2 Change in Working Capital 1,316.2 262.6 (142.0) (757.8) (548.1) (743.7)
Shareholders Fund 24,748.1 25,843.1 32,096.7 36,537.7 41,812.3 48,565.1 Less: Tax Paid (1,081.5) (459.4) (1,243.3) (1,227.4) (1,535.0) (2,057.1)
Long Term Borrowings 19,883.3 26,181.3 32,935.5 45,935.5 45,935.5 45,935.5 Cash Flow from Operations 6,029.4 7,401.8 7,555.8 8,563.2 13,508.9 16,148.7
Deferred Tax Assets / Liabilities (812.4) (922.7) 321.4 305.4 305.4 305.4 Net Capital Expenditure (2,886.7) (3,558.4) (2,347.9) (6,483.8) (3,990.0) (4,171.0)
Other Long Term Liabilities 1,324.4 2,187.6 1,845.7 2,214.9 2,612.5 3,156.1 Change in Investments (1,537.5) 2,808.0 (11,794.8) 848.8 (2,343.3) (587.9)
Long Term Trade Payables 0.0 0.0 0.0 0.0 0.0 0.0 Cash Flow from Investing (4,424.2) (750.4) (14,142.7) (5,635.1) (6,333.3) (4,758.9)
Long Term Provisions 3.9 8.2 26.7 30.8 35.9 42.9 Change in Borrowings 4,160.1 354.9 5,769.4 13,085.4 69.3 143.8
Total Liabilities 45,147.4 53,297.6 67,226.1 85,024.3 90,701.6 98,005.0 Less: Finance Cost (1,428.3) (1,950.6) (2,255.3) (3,276.1) (4,135.6) (4,145.0)
Net Block 28,121.4 32,714.5 48,136.9 52,021.4 53,181.0 54,274.9 Proceeds from Equity 0.0 0.0 0.0 23.5 0.0 0.0
Capital Work in Progress 4,483.5 3,216.3 3,697.1 0.0 0.0 0.0 Buyback of Shares 0.0 (1,960.0) 0.0 0.0 0.0 0.0
Intangible assets under development 0.0 0.0 0.0 0.0 0.0 0.0 Dividend Paid (418.5) (699.9) (0.2) (1,174.2) (1,487.7) (2,017.1)
Non Current Investments 268.5 1,166.1 1,097.4 1,646.1 1,941.6 2,345.6 Cash flow from Financing 2,313.3 (4,255.6) 3,513.9 8,658.7 (5,554.0) (6,018.2)
Long Term Loans & Advances 6,031.1 6,518.2 6,342.9 7,611.4 9,133.7 10,960.5 Net Cash Flow 3,918.6 2,395.8 (3,073.0) 11,586.8 1,621.6 5,371.6
Other Non Current Assets 1,963.5 2,559.0 2,337.1 3,388.8 3,997.2 4,828.9 Forex Effect 0.0 0.0 0.0 0.0 0.0 0.0
Net Current Assets 4,279.5 7,123.4 5,614.7 20,356.6 22,448.0 25,595.2 Opening Balance of Cash 823.5 4,798.2 7,195.5 4,201.0 15,787.7 17,409.4
Total Assets 45,147.4 53,297.6 67,226.1 85,024.3 90,701.6 98,005.0 Closing Balance of Cash 4,742.1 7,194.0 4,122.4 15,787.7 17,409.4 22,780.9
115115

( 0 9 t h D e c 2 0 2 1 )
For any further query, please email us on [email protected]
This page left intentionally blank
116116

( 9 t h D e c 2 1 )
For any further query, please email us on [email protected]
Adani Transmission Ltd
A frontrunner in the rapidly expanding Power T&D space
117117

( 9 t h D e c 2 0 2 1 )
For any further query, please email us on [email protected]
Adani Transmission Ltd (ATL) is India’s leading private sector transmission player with
a 35% market share. ~INR 3 trillion of TBCB projects are expected to be allocated to
the private players over FY21-30. ATL with its superior execution and O&M skills,
demonstrated high ‘total availability factor’, best in class EBIDTA margins of 92% and
capital management excellence is best placed to benefit from this. The 35-year TBCB
contracts provide for long term visibility. Over FY21-24, we expect a 33.4%/26.1%
CAGR in the operational asset base and revenues to INR 41,560 crore /INR 6,257 crore
respectively.
ATL’s distribution business has a strong capex commitment of 9,600 cr over FY21-25
(part of INR 16,000 cr capex the next 10 years) for upgradation and modernization of
the 90 year old infrastructure of Adani Electricity Mumbai Ltd (AEML). This capex led
increase in the RAB - regulated asset base (financed by 70:30 debt to equity) earns a
fix annual return of 15.5% on equity and is EBIDTA accretive. Another trigger is the
INR 6,000 – 7,000 cr ROA framework based HVDC transmission Asset (form Mumbai)
which is to be operationalized over the next three years providing for an annual
contribution of approx. INR 1,400 cr. We expect a revenue CAGR of 11.4% to INR
8,358 cr during FY21-24E.
With the government keen on privatization of the inefficient existing discoms, there
exists a significant scope for non linear growth of ATL’s distribution business through
acquisitions.
We initiate coverage on ATL with a BUY for a DCF based price target of INR 2,797 per
share, implying a 48.2% upside from the CMP of INR 1,887. Our conviction is
underpinned by the following.
Risks to our optimism stem from delay in the execution of under construction
transmission projects and any changes in tariff regulations.
Key Financial Data (INR Cr, unless specified)
Revenue EBITDA
Net Profit
EBITDA (%)
Net Profit
(%)
EPS (₹)
BVPS (₹)
RoE (%)
RoIC (%)
Debt to EBITDA
(X)
P/E (X)
P/BV (X)
EV/ EBITDA
(X)
FY20 11,416.0 4,253.9 741.8 37.3 6.5 6.7 86.9 8.7 10.2 5.1 274.9 21.3 53.0
FY21 9,926.3 4,533.2 1,224.0 45.7 12.3 11.1 91.1 13.7 9.3 5.6 166.6 20.3 50.6
FY22E 11,485.1 5182.0 1,813.7 45.1 15.8 16.5 107.7 16.9 11.5 4.2 112.4 17.2 43.5
FY23E 13,486.2 6350.3 2,297.1 47.1 17.0 20.9 127.6 17.9 11.1 4.3 88.8 14.5 36.5
FY24E 15,906.0 7891.5 2,764.0 49.6 17.4 25.1 150.9 18.1 10.8 4.6 73.8 12.3 30.4
BUY @ CMP INR 1,887 Target: INR 2,797 in 24 months Upside Potential: 48.2%
A frontrunner in rapidly expanding Power T&D space
Industry Power T&D
Scrip Details
Face Value (INR) 10.0
Market Cap (INR Cr) 2,07,534
Price (INR) 1,887
No of Shares O/S (Cr) 109.98
3M Avg Vol (000) 33
52W High/Low (INR) 2,025/345
Dividend Yield (%) 0.0
Shareholding (%) Sept 2021
Promoter 74.9
Institution 23.6
Public 1.5
TOTAL 100.0
Price Chart
20000
30000
40000
50000
60000
70000
0
500
1000
1500
2000
2500
Nov-18 Nov-19 Nov-20 Nov-21
ATL Sensex
Adani Transmission Ltd
118118

( 9 t h D e c 2 0 2 1 )
For any further query, please email us on [email protected]
Source: Ventura Research
100
300
500
700
900
1,100
1,300
1,500
1,700
1,900
2,100
2,300
Ap
r-18
Jul-
18
Oct
-18
Jan
-19
Ap
r-19
Jul-
19
Oct
-19
Jan
-20
Ap
r-20
Jul-
20
Oct
-20
Jan
-21
Ap
r-21
Jul-
21
Oct
-21
1 year forward EV/EBITDA
EV per sh 13.85x 16.45x
19.05x 21.65x 24.25x
5
10
15
20
25
30
35
40
45
50
55
Ap
r-18
Jul-
18
Oct
-18
Jan
-19
Ap
r-19
Jul-
19
Oct
-19
Jan
-20
Ap
r-20
Jul-
20
Oct
-20
Jan
-21
Ap
r-21
Jul-
21
Oct
-21
EV/EBITDA & Std Deviation
EV/EBITDA Average Upper SD1
Upper SD2 Lower SD1 Lower SD2
-200
0
200
400
600
800
1,000
1,200
Ap
r-18
Jul-
18
Oct
-18
Jan
-19
Ap
r-19
Jul-
19
Oct
-19
Jan
-20
Ap
r-20
Jul-
20
Oct
-20
Jan
-21
Ap
r-21
Jul-
21
Oct
-21
Peer group price performance
ATL PGCIL GE T&D KEC Kalpataru
0
1
2
3
4
5
6
7
8
9
Ap
r-18
Jul-
18
Oct
-18
Jan
-19
Ap
r-19
Jul-
19
Oct
-19
Jan
-20
Ap
r-20
Jul-
20
Oct
-20
Jan
-21
Ap
r-21
Jul-
21
Oct
-21
ATL commands premium valuation to Power Grid Corp, which has significantly expanded in
the past 1 year
Despite substantial recent outperformance, attractive decadal outlook portends substantial room for growth
119119

( 9 t h D e c 2 0 2 1 )
For any further query, please email us on [email protected]
Valuation
ATL is amongst the largest private transmission players and second only to PGCIL in India. With
its growth DNA, ATL is expected to grow its transmission network aggressively through both
organic and inorganic routes. Further, with INR 3.0 trillion worth of upcoming opportunities in
the private TBCB space, there is strong visibility growth of its power transmission business.
We have used the DCF model to value ATL since its TBCB contracts throw up significant cash
over the next 35 (typical life of a TBCB contract). We have discounted back the future cash
flows to FY24 and value the company at INR 2,797, presenting an upside of 48.2% from the
CMP of 1,887 (32.1X FY24 EV/EBIDTA)
DCF Valuation
Source: Ventura Research
Long Term Market Return 10.0%
Risk Free Rate 6.0%
Cost of Equity 7.1%
Interest Rate 7.0%
Tax Rate 25.2%
Cost of Debt 5.2%
WACC 6.9%
Terminal Value Growth 3.0%
Terminal Value 18,17,261
FY24E FY25E FY26E FY27E FY28E FY29E FY30E FY35E FY40E FY45E FY50E FY55E
FCFF -6,116 -6,632 -356 -903 -1,273 -1,381 -1,196 6,736 17,708 31,723 48,868 69,034
Discount Factor from FY24 0.94 0.87 0.82 0.77 0.72 0.67 0.63 0.45 0.32 0.23 0.16 0.12
Discounted FCFF from FY24 -5,720 -5,802 -292 -691 -911 -925 -749 3,020 5,684 7,290 8,039 8,131
Total of Discounted FCFF FY24 1,29,727
FY24 PV of Terminal Value 2,14,030
FY24 Enterprise Value 3,43,758
FY24 Net Debt 36,174
FY24 Value of Equity 3,07,584
FY24 Value of Equity per share 2,797
120120

( 9 t h D e c 2 0 2 1 )
For any further query, please email us on [email protected]
Our Bull and Bear Case Scenarios
We have prepared a Bull and Bear case scenario based on ATL’s terminal value growth.
• Bull Case: India has a significant opportunity to grow the quality of earnings from its
power transmission assets by shifting from 220 KV lines to high voltage lines. Plus, ATL
is looking at acquisitions to grow its power distribution business. We have assumed a
terminal growth of 4%, which will result in a Bull case price target of INR 3,499 (upside
of 85.4% from CMP).
• Bear Case: We have assumed terminal value growth of 1%, which will result in a Bear
case price target of INR 2,106 (upside of 11.6% from CMP). Our base case implies a
significant margin of safety for buying at the current price
Bull & Bear Case Scenario
Investment Triggers
• Strong market share of 35% in private TBCB space
• Inorganic expansion route for the distribution business in other metro cities
Catalysts
• The government is expected to open INR 3.0 trillion worth of power transmission
projects for private players through the TBCB route.
• Rapid urbanization, rural electrification, Make in India and China+1are likely to
increase power consumption in India. This is expected to improve demand for high
voltage transmission lines.
Bull Case Price
INR 3,499 per share
Target Price
INR 2,797 per share
Bear Case Price
INR 2,020 per share
Current Price
INR 1,887 per share
4% terminal value growth.
3% terminal value growth
1% terminal value growth
121121

( 9 t h D e c 2 1 )
For any further query, please email us on [email protected]
Valuation and Comparable Metric of Domestic and Global Power T&D companies (red & bold)
Source: Ventura Research & Bloomberg
Company Name Mkt Cap PricePEG
20242022 2023 2024 2022 2023 2024 2022 2023 2024 2022 2023 2024 2022 2023 2024 2022 2023 2024 2022 2023 2024 2022 2023 2024
Domestic Peers (Data in INR Cr, unless specified)
Adani Transmission Ltd 2,03,905 1,854.0 2.4 112.4 88.8 73.8 19.0 15.9 13.4 43.5 36.5 30.4 16.9 17.9 18.1 11.5 11.1 10.8 11,485 13,486 15,906 45.1 47.1 49.6 15.8 17.0 17.4
Power Grid Corp of India Ltd 1,42,892 205.0 1.3 10.7 10.2 9.7 1.8 1.7 1.7 7.2 6.6 6.4 17.1 16.8 17.0 11.6 12.2 12.9 41,241 43,538 44,061 88.3 87.3 87.3 32.3 32.0 33.3
GE T&D Ltd 3,197 125.0 0.3 31.5 20.4 18.5 2.7 2.5 2.2 18.4 13.9 12.6 8.5 12.0 12.0 8.1 11.2 11.4 3,638 3,952 4,348 5.2 6.3 6.3 2.8 4.0 4.0
Tata Power Co Ltd 73,285 229.0 1.0 35.7 30.5 25.3 3.3 3.0 2.9 14.3 12.3 10.4 9.2 9.9 11.3 8.3 9.7 11.5 41,262 45,816 51,167 19.1 20.0 20.8 5.0 5.2 5.7
NTPC Ltd 1,23,438 127.0 0.6 7.8 6.9 6.5 0.9 0.8 0.8 7.6 7.0 6.1 11.9 12.2 12.7 8.6 9.1 9.9 1,25,776 1,37,743 1,49,268 32.5 32.7 33.0 12.7 13.0 12.8
KEC International Ltd 11,646 453.0 0.5 20.8 14.3 11.6 3.1 2.6 2.2 11.3 8.3 6.8 14.7 18.2 18.7 18.7 23.6 26.8 14,681 16,422 18,279 8.0 9.5 9.9 3.8 5.0 5.5
Kalpataru Power Transmission Ltd 5,616 377.0 0.3 11.7 7.8 6.7 1.3 1.2 1.0 4.9 3.7 3.0 11.6 15.1 15.1 19.5 24.0 29.6 13,682 15,652 16,007 10.9 11.6 12.5 3.5 4.6 5.2
Torrent Power Ltd 28,019 583.0 1.8 20.4 18.0 17.8 2.5 2.3 2.2 9.3 8.4 8.0 12.3 12.8 12.2 13.4 14.5 14.4 13,535 14,547 15,314 27.2 27.4 27.2 10.2 10.7 10.3
CESC Ltd 10,994 88.0 0.6 7.7 7.1 6.3 1.0 1.0 0.9 6.3 5.7 5.0 13.7 14.0 14.9 13.0 14.1 15.1 12,775 13,350 14,001 28.2 27.5 27.4 11.2 11.6 12.4
Global Peers (Data in USD Mn, unless specified)
Verbund AG (Austria) 34,761 100.1 1.9 29.8 29.7 27.9 4.4 4.1 3.8 16.4 16.3 14.6 14.7 13.9 13.7 17.8 16.2 17.7 4,862 4,912 5,025 46.4 46.1 49.9 24.0 23.9 24.8
Elia Group SA (Belgium) 7,949 115.8 1.6 24.5 22.6 20.6 1.6 1.4 1.3 13.3 12.9 11.7 6.4 6.2 6.2 5.2 5.1 5.4 3,083 3,184 3,503 41.8 43.3 43.3 10.5 11.0 11.0
Centrais Electricas Brasilier (Brazil) 9,228 5.9 0.4 8.5 4.5 4.1 0.7 0.7 0.6 4.3 3.4 3.1 8.8 15.8 15.8 16.5 18.4 18.7 6,191 6,276 6,903 48.8 52.2 52.2 17.5 32.9 32.9
Fortis Inc (Canada) 21,081 44.6 2.4 19.3 18.1 17.1 1.5 1.4 1.3 11.9 11.4 11.1 7.5 7.8 7.5 6.3 6.5 6.6 7,873 8,044 8,412 46.0 48.3 48.2 13.9 14.5 14.7
CLP Holdings Ltd (China) 24,578 9.7 2.2 15.8 15.4 14.0 1.6 1.5 1.4 9.3 9.1 8.2 9.9 9.9 9.9 10.1 9.8 10.0 11,094 11,370 12,507 28.9 28.8 28.8 14.0 14.0 14.0
HK Electric Investments (China) 8,687 1.0 3.2 22.9 21.8 19.8 1.4 1.4 1.3 15.3 14.9 13.6 6.2 6.4 6.4 3.6 3.3 3.5 1,475 1,497 1,647 67.2 68.9 68.9 25.7 26.6 26.6
Fortum OYJ (Finland) 25,044 28.2 4.4 15.4 15.1 13.2 1.5 1.4 1.4 8.2 8.2 7.5 9.4 9.3 10.8 9.7 9.7 11.2 79,803 78,465 73,005 4.7 4.7 5.5 2.0 2.1 2.6
EDF (France) 44,320 14.0 1.0 7.7 7.2 7.4 0.8 0.7 0.7 4.2 4.1 4.1 10.0 10.4 9.6 9.5 10.0 9.3 91,148 92,849 95,234 25.5 26.0 25.6 6.4 6.6 6.3
Terna-Rete Electrica Naziona (Italy) 14,855 7.4 5.1 17.4 16.7 15.2 2.7 3.2 2.5 13.1 13.0 12.8 15.2 19.4 16.5 7.4 7.8 7.3 2,917 3,018 3,181 70.6 71.5 72.1 29.2 29.6 30.7
Kansai Electric Power Co (Japan) 8,413 9.0 3.1 12.6 10.4 7.6 0.5 0.5 0.5 13.5 13.0 11.1 4.2 4.9 6.5 1.6 2.0 2.7 23,073 23,582 23,544 15.8 16.4 19.2 2.9 3.4 4.7
Tenaga Nasional BHD (Malaysia) 12,998 2.3 0.5 11.1 10.7 7.4 0.9 0.9 0.8 4.6 4.6 4.0 8.5 8.3 11.2 10.2 9.9 10.9 11,807 12,014 12,905 38.2 37.1 38.0 9.9 10.1 13.6
Mercury NZ Ltd (New Zeeland) 5,486 4.0 1.3 40.9 34.2 30.4 1.7 1.8 1.8 15.8 14.3 13.1 4.3 5.1 5.8 5.1 6.2 7.2 1,502 1,612 1,549 28.6 29.4 33.0 8.9 10.0 11.6
Saudi Electricity Co (S Arabia) 27,499 6.6 5.0 12.7 11.6 12.4 0.6 0.6 0.4 10.1 9.0 9.2 4.6 4.9 3.1 3.8 4.3 3.2 18,525 19,993 19,485 52.5 54.2 54.9 11.7 11.9 11.3
Korea Electric Power Corp (S Korea) 12,056 18.8 2.6 -4.3 -81.1 -185.0 0.2 0.2 0.2 10.6 6.9 7.1 -5.3 -0.3 -0.1 -3.0 0.8 1.3 53,954 55,871 56,710 13.4 20.1 19.6 -5.2 -0.3 -0.1
Endesa SA (Spain) 22,814 21.5 3.2 12.2 11.2 11.1 2.7 2.5 2.4 7.5 7.2 7.2 22.2 22.7 21.7 13.6 13.8 13.3 22,090 22,616 22,650 20.2 21.0 21.4 8.5 9.0 9.1
Acciona SA (Spain) 9,833 179.2 0.9 19.3 16.8 15.2 2.3 2.1 2.0 9.0 8.5 8.6 11.8 12.6 13.3 10.0 10.4 9.8 9,250 9,622 10,163 18.8 20.1 20.6 5.5 6.1 6.4
Next Era Energy Inc (UK) 47,928 13.3 1.0 16.8 15.1 14.6 1.7 1.6 1.5 13.6 11.8 12.1 10.0 10.4 10.4 6.0 6.9 6.6 21,083 21,942 22,564 35.9 38.7 38.4 13.5 14.5 14.6
SSE PLC (UK) 22,959 21.5 0.5 19.0 16.2 16.4 2.5 2.4 2.1 12.6 11.7 11.2 13.1 14.6 13.0 9.2 9.4 9.3 10,615 11,551 12,133 25.8 26.1 26.2 11.4 12.3 11.5
Duke Energy Corp (USA) 75,685 98.4 2.8 18.0 17.0 16.0 1.5 1.5 1.4 11.9 11.3 10.7 8.5 8.8 9.0 5.7 5.8 5.1 26,405 27,181 27,225 46.2 48.3 52.6 15.9 16.3 17.4
Southern Company (USA) 66,418 62.7 1.8 17.5 16.1 14.8 2.1 2.0 2.1 12.1 11.8 12.3 12.2 12.7 14.3 7.2 7.4 7.2 22,468 23,291 23,854 44.2 44.2 42.4 16.9 17.7 18.8
The National Grid PLC (USA) 47,912 66.2 1.0 16.8 15.1 14.6 1.5 1.4 1.4 13.6 11.8 12.1 9.2 9.5 9.5 5.9 6.7 6.4 21,083 21,942 22,564 35.9 38.7 38.4 13.5 14.5 14.6
Eversouce Energy (USA) 28,832 83.9 2.2 20.3 18.9 17.5 1.9 1.8 1.7 13.5 13.1 13.9 9.2 9.4 9.6 6.7 6.8 6.5 9,793 10,122 10,601 36.5 37.4 35.6 14.5 15.1 15.6
Edison International (USA) 24,656 64.9 2.0 13.7 12.7 12.1 1.6 1.5 1.5 9.5 9.1 9.2 11.6 11.9 12.2 7.1 7.4 7.0 14,789 15,355 15,593 37.2 38.8 39.7 12.2 12.6 13.1
PG & E Corp (USA) 24,579 12.4 0.8 10.6 9.3 8.4 1.0 1.0 1.0 7.5 6.9 6.6 9.7 10.5 11.9 7.3 7.5 7.1 20,902 21,573 22,132 40.3 42.5 44.2 11.1 12.3 13.1
XCEL Energy Inc (USA) 35,068 65.1 2.3 20.4 19.0 17.6 2.2 2.1 1.9 12.5 12.0 11.7 10.7 10.9 10.7 6.2 6.3 5.7 12,791 13,259 13,435 37.6 38.9 40.3 13.5 14.0 14.8
Entergy Corp (USA) 21,294 106.0 1.7 16.3 15.1 14.0 2.2 2.0 1.6 10.8 10.7 10.2 13.3 13.3 11.4 7.1 6.7 6.7 10,872 11,136 11,293 38.9 39.8 41.8 12.0 12.7 13.5
PPL Corp (USA) 21,320 28.4 1.7 17.9 16.1 15.1 1.5 1.4 1.3 10.3 9.6 9.1 8.1 8.7 8.4 7.5 7.7 7.4 6,703 7,031 7,169 46.8 48.4 50.0 17.8 18.9 19.7
Firstenergy Corp (USA) 20,976 38.5 2.6 14.7 13.7 12.9 2.2 2.1 1.9 10.8 10.5 10.4 15.2 15.0 14.5 8.2 8.3 8.2 11,637 11,895 12,141 35.0 35.9 36.0 12.3 12.9 13.4
Avangrid Inc (USA) 19,806 51.2 1.7 21.7 20.2 19.1 1.0 0.9 0.9 11.9 11.7 10.0 4.4 4.6 4.5 4.4 4.5 4.9 7,524 7,817 8,213 35.9 36.3 35.6 12.1 12.5 12.6
Evergy Inc (USA) 14,893 65.6 3.6 18.4 17.2 16.0 1.6 1.5 1.5 11.2 10.7 10.2 8.7 9.0 9.3 6.7 6.9 7.2 5,261 5,435 5,509 44.2 45.4 48.2 15.4 15.9 16.8
American Electric Power (USA) 41,994 83.4 1.8 16.3 15.2 14.2 1.8 1.7 1.6 11.9 11.5 11.5 10.8 11.1 11.5 6.2 6.4 6.4 17,160 17,756 18,769 39.9 41.1 40.2 15.0 15.6 15.7
Alliant Energy Corp (USA) 14,218 56.8 3.2 20.7 19.4 18.3 2.2 2.1 1.9 13.7 13.2 12.7 10.8 11.0 10.6 6.5 6.6 6.7 3,640 3,766 3,897 44.5 45.0 46.5 18.8 19.5 20.0
EBITDA Margin (%) Net Margin (%)P/E (X) P/B (X) EV/EBITDA (X) RoE (%) RoIC (%) Sales
For any further query, please email us on [email protected] 122122

( 9 t h D e c 2 1 )
For any further query, please email us on [email protected]
ATL managed to sustain double digit RoIC in its high growth phase
Source: Ventura Research, ACE Equity & Bloomberg
ATL
PGCIL
GE T&D Tata PowerNTPC
KEC Int
Kalpataru Power
Torrent PowerCESC
Verbund
Elia SA
Centrais Electricas
Fortis
CLP Holdings
HK Electric
EDF Terna-Rete
Kansai Electric
Tenaga Nasional
Mercury
Saudi ElectricityKorea Electric
Endesa
Acciona
Next Era Energy
Duke Energy
Southern CoNational Grid
Eversouce Energy
Edison IntPG&E Corp
XCEL Energy
EntergyPPL
Firstenergy Corp
Avangrid
Evergy
American ElectricAlliant Energy
0
5
10
15
20
25
30
35
0.0 0.5 1.0 1.5 2.0 2.5 3.0 3.5 4.0 4.5
FY24
Ro
IC (
%)
FY24 EV/EBITDA to FY21-24 EBITDA CAGR (X)
ATL
PGCIL
GE T&D
Tata Power
NTPC
KEC Int
Kalpataru Power
Torrent Power
CESC
0
2
4
6
8
10
12
14
16
18
20
0 10 20 30 40 50 60 70 80 90 100
FY2
1-2
4 R
eve
nu
e C
AG
R (
%)
FY24 EBITDA Margin (%)
123123

( 9 t h D e c 2 0 2 1 )
For any further query, please email us on [email protected]
ATL’s Financial Summary
Source: Company Reports & Ventura Research
Fig in INR Cr (unless specified) FY17 FY18 FY19 FY20 FY21 FY22E FY23E FY24E FY25E FY26E FY27E FY28E FY29E FY30E FY31E
Transmission Asset Base 12,940 12,940 13,160 16,430 17,510 19,580 28,970 41,560 56,560 66,560 78,560 92,560 1,08,560 1,26,560 1,45,560
YoY Growth (%) 141.9 0.0 1.7 24.8 6.6 11.8 48.0 43.5 36.1 17.7 18.0 17.8 17.3 16.6 15.0
Transmission Revenue 2,120 3,129 2,193 2,815 3,122 3,877 4,945 6,257 8,620 10,091 11,777 13,647 15,875 18,520 21,373
Transmission Revenue 0.0 0.0 -29.9 28.4 10.9 24.2 27.5 26.5 37.8 17.1 16.7 15.9 16.3 16.7 15.4
Avg Yiled on Asset Base (%) 16.4 24.2 16.7 17.1 17.8 19.8 17.1 15.1 15.2 15.2 15.0 14.7 14.6 14.6 14.7
No of Customers (nos mn) 0.00 0.00 3.03 3.05 3.06 3.07 3.17 3.27 3.37 3.47 3.57 3.67 3.77 3.87 3.97
Power Consumption (mn units) 0 0 6,022 8,434 7,169 8,311 9,193 10,301 11,458 12,666 13,923 15,231 16,588 17,996 19,453
Distribution Revenue 0 0 4,270 7,676 6,048 6,808 7,521 8,358 9,228 10,131 11,066 12,034 13,035 14,070 15,138
Trading Revenue 756 816 842 925 757 800 1,020 1,291 1,778 2,082 2,430 2,816 3,275 3,821 4,410
Revenue from operations 2,876 3,944 7,305 11,416 9,926 11,485 13,486 15,906 19,626 22,304 25,272 28,497 32,185 36,411 40,920
YoY Growth (%) 30.9 37.2 85.2 56.3 (13.0) 15.7 17.4 17.9 23.4 13.6 13.3 12.8 12.9 13.1 12.4
Power Exp & Material Cost 764 816 3,130 4,622 3,643 4,523 5,149 5,829 7,049 7,908 8,834 9,822 10,906 12,099 13,358
RM Cost to Sales (%) 26.6 20.7 42.8 40.5 36.7 39.4 38.2 36.6 35.9 35.5 35.0 34.5 33.9 33.2 32.6
Employee Cost 46 42 587 973 931 1,015 1,086 1,161 1,238 1,319 1,404 1,492 1,583 1,677 1,774
Employee Cost to Sales (%) 1.6 1.1 8.0 8.5 9.4 8.8 8.1 7.3 6.3 5.9 5.6 5.2 4.9 4.6 4.3
Other Expenses 83 261 826 1,567 819 765 901 1,025 1,100 1,282 1,455 1,610 1,805 2,058 2,341
Other Expenses to Sales (%) 2.9 6.6 11.3 13.7 8.3 6.7 6.7 6.4 5.6 5.7 5.8 5.7 5.6 5.7 5.7
EBITDA 1,983 2,826 2,762 4,254 4,533 5,182 6,350 7,892 10,239 11,795 13,579 15,573 17,892 20,577 23,447
EBITDA Margin (%) 69.0 71.6 37.8 37.3 45.7 45.1 47.1 49.6 52.2 52.9 53.7 54.6 55.6 56.5 57.3
Depreciation 569 579 882 1,174 1,329 1,482 1,857 2,361 2,961 3,361 3,841 4,401 5,041 5,761 6,521
PBIT 1,414 2,247 1,880 3,080 3,204 3,700 4,493 5,531 7,278 8,434 9,738 11,172 12,852 14,816 16,926
PBIT Margin (%) 49.2 57.0 25.7 27.0 32.3 32.2 33.3 34.8 37.1 37.8 38.5 39.2 39.9 40.7 41.4
Transmission EBIT 1,414 2,246 1,348 1,873 2,192 2,666 3,313 4,192 5,775 6,761 7,890 9,143 10,636 12,408 14,320
Transmission EBIT Margin (%) 66.7 71.8 61.5 66.5 70.2 68.8 67.0 67.0 67.0 67.0 67.0 67.0 67.0 67.0 67.0
Distribution EBIT 0 0 624 1,206 1,012 1,034 1,180 1,339 1,503 1,673 1,848 2,029 2,216 2,408 2,607
Distribution EBIT Margin (%) 0 0 14.6 15.7 16.7 15.2 15.7 16.0 16.3 16.5 16.7 16.9 17.0 17.1 17.2
Trading EBIT 0 0 -92 0 1 0 0 0 0 0 0 0 0 0 0
Other Income 22 111 351 265 533 458 548 781 911 1,097 1,223 1,359 1,485 1,639 1,904
Finance Cost 904 886 1,391 2,238 2,117 1,769 1,972 2,618 3,332 3,874 4,219 4,619 5,075 5,659 6,229
PBT 532 1,472 840 1,107 1,620 2,389 3,070 3,694 4,857 5,657 6,742 7,912 9,261 10,796 12,601
PBT Margin (%) 18.5 37.3 11.5 9.7 16.3 20.8 22.8 23.2 24.7 25.4 26.7 27.8 28.8 29.7 30.8
Tax Paid 116 329 281 400 330 561 773 930 1,222 1,424 1,697 1,991 2,331 2,717 3,172
Tax Rate (%) 21.7 22.3 33.4 36.2 20.4 23.5 25.2 25.2 25.2 25.2 25.2 25.2 25.2 25.2 25.2
Net Profit 416 1,143 559 742 1,224 1,814 2,297 2,764 3,634 4,233 5,045 5,920 6,930 8,079 9,430
Net Margin (%) 14.5 29.0 7.7 6.5 12.3 15.8 17.0 17.4 18.5 19.0 20.0 20.8 21.5 22.2 23.0
Adjusted EPS 4 10 5 7 11 16 21 25 33 38 46 54 63 73 86
P/E (X) 502.6 183.1 374.3 282.1 171.0 115.4 91.1 75.7 57.6 49.4 41.5 35.4 30.2 25.9 22.2
Adjusted BVPS 27 55 73 77 81 98 116 139 167 199 237 280 329 385 448
P/BV (X) 71.0 34.6 26.0 24.6 23.5 19.5 16.4 13.7 11.4 9.6 8.0 6.8 5.8 4.9 4.2
Enterprise Value 2,17,770 2,19,057 2,28,514 2,30,930 2,34,790 2,30,815 2,36,870 2,45,467 2,55,706 2,59,681 2,64,705 2,70,667 2,77,502 2,85,095 2,92,198
EV/EBITDA (X) 109.8 77.5 82.7 54.3 51.8 44.5 37.3 31.1 25.0 22.0 19.5 17.4 15.5 13.9 12.5
Net Worth 2,947 6,056 8,043 8,499 8,919 10,733 12,800 15,233 18,358 21,914 26,051 30,787 36,193 42,332 49,310
Return on Equity (%) 14.1 18.9 7.0 8.7 13.7 16.9 17.9 18.1 19.8 19.3 19.4 19.2 19.1 19.1 19.1
Capital Employed 11,921 16,485 28,180 32,745 35,880 34,319 45,548 57,295 71,501 79,464 89,049 99,769 1,12,223 1,27,989 1,41,628
Return on Capital Employed (%) 9.3 10.6 4.4 6.0 7.1 8.2 7.4 7.2 7.6 7.9 8.2 8.4 8.6 8.7 8.9
Invested Capital 11,423 15,819 27,263 30,135 34,416 32,254 40,376 51,406 64,771 72,301 81,462 92,160 1,04,401 1,18,133 1,32,214
Return on Invested Capital (%) 12.4 14.2 6.9 10.2 9.3 11.5 11.1 10.8 11.2 11.7 12.0 12.1 12.3 12.5 12.8
Cash Flow from Operations 2,189 2,198 2,591 5,437 3,784 4,345 5,591 7,008 8,702 10,649 12,183 13,928 15,864 18,119 20,699
Cash Flow from Investing -1,761 -3,211 -3,138 -5,643 -4,025 25 -9,686 -12,948 -15,550 -10,396 -12,439 -14,477 -16,546 -18,625 -19,667
Cash Flow from Financing -455 1,589 38 1,250 -745 -3,958 6,960 6,364 7,240 -144 321 179 449 2,028 -2,019
Net Cash Flow -27 577 -509 1,045 -986 411 2,865 424 392 109 65 -369 -232 1,522 -988
Free Cash Flow 311 1,310 1,359 482 -352 -911 -4,129 -6,116 -6,632 -356 -903 -1,273 -1,381 -1,196 140
FCF to Revenue (%) 10.8 33.2 18.6 4.2 (3.5) (7.9) (30.6) (38.5) (33.8) (1.6) (3.6) (4.5) (4.3) (3.3) 0.3
FCF to EBITDA (%) 15.7 46.4 49.2 11.3 (7.8) (17.6) (65.0) (77.5) (64.8) (3.0) (6.7) (8.2) (7.7) (5.8) 0.6
FCF to Net Profit (%) 74.7 114.6 243.0 64.9 (28.7) (50.2) (179.7) (221.3) (182.5) (8.4) (17.9) (21.5) (19.9) (14.8) 1.5
FCF to Net Worth (%) 10.6 21.6 16.9 5.7 (3.9) (8.5) (32.3) (40.1) (36.1) (1.6) (3.5) (4.1) (3.8) (2.8) 0.3
Total Debt 8,975 10,428 20,137 24,246 26,961 23,586 32,748 42,062 53,143 57,550 62,999 68,981 76,031 85,656 92,317
Net Debt 8,477 9,763 19,221 21,636 25,496 21,521 27,576 36,174 46,412 50,387 55,411 61,373 68,208 75,801 82,904
Net Debt to Equity (X) 2.9 1.6 2.4 2.5 2.9 2.0 2.2 2.4 2.5 2.3 2.1 2.0 1.9 1.8 1.7
Net Debt to EBITDA (X) 4.3 3.5 7.0 5.1 5.6 4.2 4.3 4.6 4.5 4.3 4.1 3.9 3.8 3.7 3.5
Interest Coverage Ratio (X) 1.6 2.5 1.4 1.4 1.5 2.1 2.3 2.1 2.2 2.2 2.3 2.4 2.5 2.6 2.7
124124
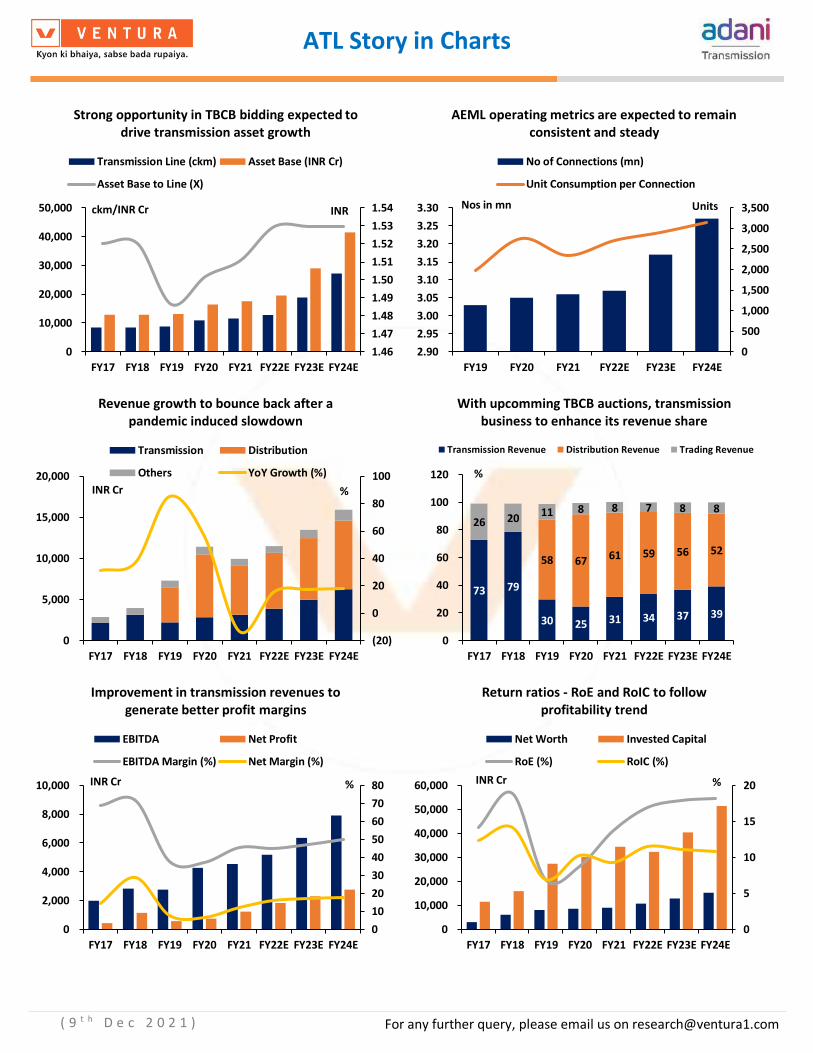
( 9 t h D e c 2 0 2 1 )
For any further query, please email us on [email protected]
1.46
1.47
1.48
1.49
1.50
1.51
1.52
1.53
1.54
0
10,000
20,000
30,000
40,000
50,000
FY17 FY18 FY19 FY20 FY21 FY22E FY23E FY24E
Strong opportunity in TBCB bidding expected to drive transmission asset growth
Transmission Line (ckm) Asset Base (INR Cr)
Asset Base to Line (X)
ckm/INR Cr INR
0
500
1,000
1,500
2,000
2,500
3,000
3,500
2.90
2.95
3.00
3.05
3.10
3.15
3.20
3.25
3.30
FY19 FY20 FY21 FY22E FY23E FY24E
AEML operating metrics are expected to remain consistent and steady
No of Connections (mn)
Unit Consumption per Connection
Nos in mn Units
(20)
0
20
40
60
80
100
0
5,000
10,000
15,000
20,000
FY17 FY18 FY19 FY20 FY21 FY22E FY23E FY24E
Revenue growth to bounce back after a pandemic induced slowdown
Transmission Distribution
Others YoY Growth (%)
INR Cr %
73 79
30 25 31 34 37 39
58 67 61 59 56 52
26 20 11 8 8 7 8 8
0
20
40
60
80
100
120
FY17 FY18 FY19 FY20 FY21 FY22E FY23E FY24E
With upcomming TBCB auctions, transmission business to enhance its revenue share
Transmission Revenue Distribution Revenue Trading Revenue
%
0
10
20
30
40
50
60
70
80
0
2,000
4,000
6,000
8,000
10,000
FY17 FY18 FY19 FY20 FY21 FY22E FY23E FY24E
Improvement in transmission revenues to generate better profit margins
EBITDA Net Profit
EBITDA Margin (%) Net Margin (%)
INR Cr %
0
5
10
15
20
0
10,000
20,000
30,000
40,000
50,000
60,000
FY17 FY18 FY19 FY20 FY21 FY22E FY23E FY24E
Return ratios - RoE and RoIC to follow profitability trend
Net Worth Invested Capital
RoE (%) RoIC (%)
INR Cr %
ATL Story in Charts
125125

( 9 t h D e c 2 0 2 1 )
For any further query, please email us on [email protected]
Source: Company Reports & Ventura Research
0
1
2
3
4
5
6
7
8
0
10,000
20,000
30,000
40,000
50,000
FY17 FY18 FY19 FY20 FY21 FY22E FY23E FY24E
Rise in asset base is expected to enhance absolute debt on balance sheet
Total Debt Net Debt
Net Debt to Equity (X) Net Debt to EBITDA (X)
INR Cr X
60
70
80
90
100
110
120
130
140
(8,000)
(6,000)
(4,000)
(2,000)
0
2,000
4,000
6,000
8,000
FY17 FY18 FY19 FY20 FY21 FY22E FY23E FY24E
Transmission capex cycle is expected to pickup strongly in the coming years
CFO FCF CFO to EBITDA (%)
INR Cr %
0.15
0.20
0.25
0.30
0.35
0.40
0.45
0.50
FY17 FY18 FY19 FY20 FY21 FY22E FY23E FY24E
Aggressive TBCB bidding to keep turnover ratios under pressure in the coming years
Fixed Asset Turnover Total Asset Turnover
Capital Turnover
X
(15)
(10)
(5)
0
5
10
15
20
25
30
0
10
20
30
40
50
60
70
FY17 FY18 FY19 FY20 FY21 FY22E FY23E FY24E
Working capital ratios to remain manageable at current levels
Payable Days Inventory Days
Receivable Days Net Working Days
Days %
126126

( 9 t h D e c 2 0 2 1 )
For any further query, please email us on [email protected]
Company Overview
ATL is the largest private transmission company and operates more than 13,000 ckm of
transmission lines and around 18,000 MVA of power transformation capacity. ATL has further
set an ambitious target to set up 20,000 ckm of transmission lines by 2022 by leveraging both
organic and inorganic growth opportunities.
ATL’s Holding Structure at a glance
Source: Company Reports
ATL’s Key Milestones
• India’s first private power sector player to secure an international investment grade
rating
• India’s first and only private HVDC transmission line
• First private company in India to execute 765 KV transmission lines and substations in
the state of Maharashtra
Adani Transmission
Contracted Assets in Transmission Business
Fixed Tariff TBCB Assets
(100%)
15 Operating Assets
9 Under Construction
Assets
ROA Assets in Transmission & Distribution Business
ROA Transmission Assets
(100%)
2 Operating and 1 Under
Construction HVDC Line
AEML
74.9% is with ATL
25.1% is with Qatar
Investment Authority
INR 1,220 cr of Equity
INR 2,000 cr of Subordinated
Debt
127127

( 9 t h D e c 2 0 2 1 )
For any further query, please email us on [email protected]
• The first company to have executed a typical π (Pi) shape tower at Sami substation
with 6 phases of Quad Moose strung on the same beam
• First private company to use a prefabricated steel structure valve hall in India
Performance so far – ATL rose like the phoenix in the last five years In the past 5 years, while the revenues of all leading power transmission (including EPC) and distribution companies have grown at a single-digit CAGR, ATL has soared like a phoenix with its revenues growing at 35.2% CAGR. Despite weak macroeconomic scenario in the past 5 years, ATL improved its business performance due to
• inorganic expansion in the transmission business
• aggressive bidding in TBCB auctions
• acquisition of Mumbai electricity distribution
However, its margins declined significantly due to the addition of the Mumbai electricity distribution business, where the profitability is typically lower than the transmission business.
ATL sustained asset turnover and maintained working capital at a comfortable level
Source: ACE Equity
ATL’s best in class receivable days and cash conversion cycle helped lower working capital. This enabled borrowing limits to be used for business expansion
Particulars FY17 FY18 FY19 FY20 FY215 yrs
CAGR (%)FY17 FY18 FY19 FY20 FY21
Adani Transmission 30.9 37.2 85.2 56.3 -13.0 35.2 69.0 71.6 37.8 37.3 45.7
Power Grid Corp of India 24.4 16.6 17.0 7.7 5.0 13.9 87.4 86.7 76.8 87.1 88.2
GE T&D 22.7 6.9 -2.6 -25.1 9.3 0.9 1.4 6.3 10.8 -6.2 5.0
Tata Power Co -6.5 -2.7 11.3 -2.5 11.4 1.9 19.8 8.6 10.3 18.2 18.1
NTPC 11.8 7.4 13.9 9.2 1.9 8.7 26.3 25.5 22.6 28.9 30.5
KEC International 0.8 17.1 9.4 8.8 9.6 9.0 10.6 10.9 11.2 11.1 9.5
Kalpataru Power 4.3 17.0 24.5 16.9 2.2 12.6 12.4 12.6 13.0 12.2 12.2
Torrent Power -14.7 15.6 14.2 3.7 -10.8 0.8 24.8 27.3 24.5 26.4 28.6
CESC -31.0 22.9 3.8 14.0 -4.3 -0.8 34.1 29.6 27.4 26.8 28.4
India Macro Factors
Power Consumption Growth (%) 4.1 6.1 5.2 1.3 -1.1 3.1
GDP Growth - Nominal (%) 11.8 11.0 10.5 7.8 -3.0 7.5
GDP Growth - Real (%) 8.3 6.8 6.5 4.0 -7.3 3.5
Core Sector Growth (%) 5.3 4.5 5.8 -8.6 12.6 0.0
Revenue Growth (%) EBITDA Margin (%)
128128

( 9 t h D e c 2 0 2 1 )
For any further query, please email us on [email protected]
ATL sustained asset turnover and maintained working capital at a comfortable level
Source: ACE Equity
➢ ATL’s Power Transmission business
ATL has a power transmission network of 18,336 ckm (13,720 ckm operational + 4,616 under
construction) and a transmission capacity of 33,141 MVA (20,405 MVA operational + 12,736
MVA under construction), making it India’s largest private sector power transmission company.
All its assets have regulatory approval and their weighted average life is 32 years. This provides
good long term visibility cash flow. ATL also has a strong operational track record of total
availability factor (TAF) of more than 99.5%.
ATL’s total availability factor in power transmission business
Source: Company Reports
During FY17-21, ATL’s power transmission line network expanded from 8,511 ckm to 11,588
ckm (CAGR of 8.0%), which was higher than the industry growth of 4.7%. It improved ATL’s
market share from 6.7% in FY17 to 7.6% in FY21 in the power transmission space. This also led
to an increase in its market share of the private TBCB transmission projects to 36.3% (+170)
over the same period.
Particulars FY17 FY18 FY19 FY20 FY21 FY17 FY18 FY19 FY20 FY21 FY17 FY18 FY19 FY20 FY21
Adani Transmission 0.3 0.4 0.3 0.5 0.4 24 24 36 32 37 26 23 -7 -7 0
Power Grid Corp of India 0.2 0.2 0.2 0.2 0.2 42 41 44 47 40 40 43 47 53 48
GE T&D 6.2 7.4 8.2 5.9 7.0 186 169 165 226 201 112 96 104 172 144
Tata Power Co 0.6 0.6 0.7 0.6 0.6 48 45 44 55 53 -11 -25 -17 -6 -8
NTPC 0.8 0.7 0.7 0.6 0.5 38 37 39 54 62 36 29 29 46 56
KEC International 7.5 9.0 9.3 8.9 9.4 185 166 164 157 150 92 83 68 47 37
Kalpataru Power 2.4 2.8 3.5 3.7 3.7 151 153 138 127 136 70 70 58 55 58
Torrent Power 0.6 0.6 0.7 0.8 0.7 37 33 33 34 40 19 19 23 19 18
CESC 0.3 0.4 0.5 0.5 0.5 39 55 56 54 65 15 42 49 47 54
Net Working Capital Days (nos)Net Fixed Asset Turnover (X) Receivable Days (nos)
99.4
99.7
99.9
99.8
100.0
99.8
FY16 FY17 FY18 FY19 FY20 FY21
129129

( 9 t h D e c 2 0 2 1 )
For any further query, please email us on [email protected]
ATL’s share in transmission lines has improved significantly
Source: Central Electricity Authority
The network growth and market share gain weres driven by the acquisition of strategic assets
from power transmission EPC companies and under-utilized state-owned transmission assets.
ATL’s power transmission inorganic growth story
Source: Company Reports
The Indian government is expected to open bidding for ~INR 10 trillion worth of power
transmission lines in the next 10 years, and in our opinion, the allocation would be
• ~INR 5 trillion to Power Grid Corp
• ~INR 2 trillion to state transmission companies
• ~INR 3 trillion to private transmission companies, where ATL has ~35% market share
Data in circuit kms FY1997 FY2002 FY2007 FY2012 FY2017 FY2018 FY2019 FY2020 FY2021FY2022
(till Sept)FY2022E
Transmission Line 1,17,376 1,52,269 1,96,123 2,57,481 3,67,851 3,90,970 4,13,407 4,25,071 4,41,821 4,50,552 4,75,000
5 years CAGR (%) 5.3 5.2 5.6 7.4 5.2
Center 31,199 42,017 64,295 91,950 1,41,033 1,50,243 1,58,833 1,63,322 1,70,488 1,74,792 1,84,277
State 86,177 1,10,252 1,31,828 1,57,116 2,02,197 2,13,799 2,23,806 2,30,113 2,37,770 2,41,711 2,54,827
Private 0 0 0 8,415 24,621 26,928 30,768 31,636 33,563 34,049 35,897
Share of Private Players (%) 0.0 0.0 0.0 3.3 6.7 6.9 7.4 7.4 7.6 7.6 7.6
ATL Transmission Line 8,511 8,511 8,854 10,938 11,588 12,361 12,799
ATL's share in Industry (%) 2.3 2.2 2.1 2.6 2.6 2.7 2.7
ATL's share in Private Lines (%) 34.6 31.6 28.8 34.6 34.5 36.3 35.7
2016: WTPL and WTGL Transmission (3,063)
Maru & Aravali Transmission (397 ckm)
2019: Bikaner-Sikar Transmission (343 ckm)
2020: Waroral-Kurnoo (1,060 ckm) and Alipurdaur Transmission (650 ckm)
130130

( 9 t h D e c 2 0 2 1 )
For any further query, please email us on [email protected]
India’s Power Transmission Line growth
Source: Company Reports
The increase in allocation can be attributed to the fact that India’s electricity demand is
expected to surge 2.3X by 2030. As per an independent think tank Council on Energy,
Environment and Water (CEEW), for net zero emissions by 2070 we would need to put up 5630
GW (or ~14.5X the current installed capapcity of 388 GW). This demand is being driven by
• India despite being the 3rd largest energy consumer, has the lowest per capita spend
leading to multi-year growth prospects.
India’s per capita electricity consumption is one of the lowest
Source: ATL’s Annual Report, Industry Reports & Ventura Research
• Penetration of electric consumer durable devices in Indian households is at an
inflection point. Despite a consumption driven economy, the penetration of consumer
3,67,851 3,90,970 4,13,407 4,25,071 4,41,821
4,75,000
8,28,000
FY17 FY18 FY19 FY20 FY21 FY22E FY34E
Data in ckm
1,149
2,395
3,492 3,600 3,991
6,445
7,499
9,803
11,730
India Brazil S Africa Global Avg China Germany Japan S Korea USA
Data in KWh units
131131

( 9 t h D e c 2 0 2 1 )
For any further query, please email us on [email protected]
durables in India is significantly lower than that of US and China. Share of households
equipped with
o Air-conditioners – 90% in the US, 60% in China and 5% in India
o Washing machines – 85% in the US, 80% in China and 11% in India
o Refrigerators – 99.8% in the US, 90% in China and 29% in India
o Laptops/computers – 87% in the US, 53.2% in China and 11% in India.
Over the past 5 -7 years, Indian consumers have shown a big apettite for embracing
technology as indicated by the swift growth of the domestic smartphone market,
usage of online services and rising EV penetration. The technologically advanced
futuristic lifestyle will depend on the seamless and sustainable flow of electricity,
which requires a stable GT&D infrastructure.
• India is expected to install 450 GW of renewable energy capacity by 2030 and 80% of
this new capacity is expected to be installed over the next 5 years. These new
renewable energy centres would mean an entirely virgin transmission network to be
the put in place.
India’s Renewable Energy Capacities
Source: IBEF & Company Reports
• Nearly 65.5% of India’s energy demand emerges from Tier-II/III/IV cities and towns.
Unlike cosmopolitan and Tier-I cities, which have a mature power consumption profile,
the new consumption centres have an upward trajectory in demand which should play
out for years, as the affordability and per capita income expand.
• There are brownfield expansion/acquisition opportunities, especially where
competing transmission assets are sub-optimally utilized or operated at a cost higher
46 57 69 78 87 94
150 175
450
FY16 FY17 FY18 FY19 FY20 FY21 Nov 2021 FY22 FY30
Data in GW
132132

( 9 t h D e c 2 0 2 1 )
For any further query, please email us on [email protected]
than sectoral standards. Also, a large portion of the transmission infrastructure is up
for replacement given the outdated technology and/or expiry of useful life.
• India has proposed One Sun, One World, One Grid (OSOWOG), a transnational solar
power grid, that will be laid all over the globe to transmit solar power generated across
the globe to different load centres. It will be a significant opportunity for Indian
transmission companies to lay HVDC lines, which are useful in renewable power
transmission.
• Increasing demand for higher voltage power transmission lines, which is to
benefit experienced players like ATL
There has been substantial growth in the transmission system of higher voltage grdaes
(above 220 KV) due to the increased requirement of the transmission network to
transmit power over longer distances. It minimizes the distribution losses and
improves grid reliability, which enhances the profitability of transmission companies.
In the past 10 years, India’s power transmission network has expanded at a CAGR of
5.8% to 450,552 ckm, however, the mix of KV lines has significantly changed. The share
of 220 KV lines has declined from 52.8% in FY12 to 42.1% in FY22 (till Oct 2021), while
the share of 765 KV lines has increased from 2.0% to 10.8% over the same period.
Strong growth in the length of high voltage transmission line (above 220 KV)
Source: Central Electricity Authority
To reduce power loss, higher voltage KV lines and HVDC lines are used to transmit
power from remote power plants and renewable capacities (mostly located far away
from load centres). ATL has experience of operating Asia’s longest and India’s 1st
private HVDC line between Mundra to Mohindergarh (990 ckm), which the company
could be utilized as an advantage in high voltage or HVDC TBCB bidding.
Data in circuit kms FY1997 FY2002 FY2007 FY2012 FY2017 FY2018 FY2019 FY2020 FY2021FY2022
(till Oct)
220 KV AC Line 79,600 96,993 1,14,629 1,35,980 1,63,268 1,68,755 1,75,296 1,80,141 1,86,446 1,89,783
Share of 220 KV AC Line (%) 67.8 63.7 58.4 52.8 44.4 43.2 42.4 42.4 42.2 42.1
400 KV AC Line 36,142 49,378 73,438 1,06,819 1,57,787 1,71,600 1,80,746 1,84,521 1,89,910 1,92,605
Share of 400 KV AC Line (%) 30.8 32.4 37.4 41.5 42.9 43.9 43.7 43.4 43.0 42.7
765 KV AC Line 0 1,160 2,184 5,250 31,240 35,059 41,809 44,853 46,090 48,789
Share of 765 KV AC Line (%) 0.0 0.8 1.1 2.0 8.5 9.0 10.1 10.6 10.4 10.8
320 KV HVDC Line 0 0 0 0 0 0 0 0 288 288
Share of 320 KV HVDC Line (%) 0.0 0.0 0.0 0.0 0.0 0.0 0.0 0.0 0.1 0.1
500 KV HVDC Line 1,634 4,738 5,872 9,432 9,432 9,432 9,432 9,432 9,432 9,432
Share of 500 KV HVDC Line (%) 1.4 3.1 3.0 3.7 2.6 2.4 2.3 2.2 2.1 2.1
800 KV HVDC Line 0 0 0 0 6,124 6,124 6,124 6,124 9,655 9,655
Share of 800 KV HVDC Line (%) 0.0 0.0 0.0 0.0 1.7 1.6 1.5 1.4 2.2 2.1
133133

( 9 t h D e c 2 0 2 1 )
For any further query, please email us on [email protected]
• MVA to MW ratio is one of the lowest in India. Improvement in this ratio
requires new transformation capacities and additional transmission lines
To ensure an uninterrupted flow of power, every MW of new generation capacity needs
a certain transformation capacity added to the system. In the Indian context, grades
220 kV and above, the transformation to generation ratio (MVA:MW) has remained low
over the years. The ratio has improved from 1.1X in FY92 to 2.6X in FY20 and is expected
to reach 2.8X by FY25. However, it is still lower than the average of 8-10X of the
developed countries
Outlook on Transformation Capacity Addition
Source: CEA and PFC
We are expecting a double-barrel growth of rise in ckm transmission line length along
with a higher transformation to generation ratio. This will enhance power density,
reduce losses and efficiently deliver bulk power. It also reduces the requirement of the
right of way, a key challenge facing the transmission sector and delivers better
profitability.
• Government has launched various schemes and policies to strengthen transmission &
distribution industry, which will remain independent of ruling political parties. A brief
snippet of schemes are:
o Integrated Power Development Scheme (IPDS):
The Government approved the scheme in Nov 2014 having a total outlay of INR
32,612 cr with the following objectives:
➢ Strengthening of sub-transmission and distribution networks in the urban
areas
➢ Metering of distribution transformers / feeders / consumers in the urban area.
1.1
1.7
2.12.2
2.62.8
0.0
0.5
1.0
1.5
2.0
2.5
3.0
0
200
400
600
800
1,000
1,200
1,400
FY1992 FY2002 FY2012 FY2015 FY2020 FY2025
Generation Capacity (GW) Transformation Capacity (GVA)
Trans to Gen Ratio (MVA:MW)
134134

( 9 t h D e c 2 0 2 1 )
For any further query, please email us on [email protected]
The component of IT enablement and strengthening of distribution network
approved in June, 2013 in the form of RAPDRP for 12th and 13th Plans got
subsumed in this scheme and approved the scheme outlay of C 44,011 Crore under
the new IPDS scheme.
o Deendayal Upadhyaya Gram Jyoti Yojana (DDUGJY):
The Government approved the Scheme in Nov 2014 having a total outlay of INR
44,033 Crore with the following objectives:
➢ Separation of agriculture and non-agriculture feeders
➢ Strengthening of sub-transmission and distribution networks in the rural
areas;
➢ Metering of distribution transformers / feeders / consumers in the rural area.
➢ Rural Electrification
The component of Rural Electrification approved in the form of RGGVY for 12th
and 13th Plans got subsumed in this scheme.
o National Electricity Fund
To promote investment in the distribution sector, government has set up National
Electricity Fund in Mar 2012 to provide interest subsidy on loans disbursed to the
discoms – both in public and private sector, to improve the distribution network
for areas not covered by RGGVY and R-APDRP project areas.
o Ujwal DISCOM Assurance Yojana (UDAY)
The financial health of discoms has always been a grave concern for providing 24X7
quality, reliable and affordable power supply to the end consumers. To combat
this issue, the Ministry of Power, launched UDAY in Nov 2015 under which States
have taken over 75% of the discom debt. In lieu of that, States issued bonds with
maturity period of 10-15 years. The scheme envisages the following benefits:
➢ Financial Turnaround through elimination of ACS-ARR gap
➢ Operational improvement through reduction in AT&C losses enabled by
metering at all levels
➢ Reduction of Power generation cost enabled by increased domestic coal
supply, allocation of coal linkages at notified prices, coal linkage
rationalization, allowing coal swaps, supply of washed and crushed coal etc.
➢ Development of Renewable Energy
➢ Energy efficiency & conservation
The UDAY Scheme has yielded some short term benefits in terms of reduction in
interest burden.
135135

( 9 t h D e c 2 0 2 1 )
For any further query, please email us on [email protected]
Given the gargantuan opportunity, ATL has been the most aggressive private player and it is
expected to be the biggest beneficiary. We expect ATL’s ckm to reach 82,729 by FY30 (CAGR
of 24.4%) leading to ATL’s transmission asset portfolio growing by 24.6% CAGR to INR
1,26,560 cr. Given its successful track record of blitzkrieg operational asset creation, we
believe that this is not a daunting task.
ATLs Power transmission asset base to grow by leaps and bounds
Source: Company Reports & Ventura Research
ATL operates its power transmission assets across two revenue models:
• Regulated transmission tariff
The revenue recognition is based on the annual revision of operations & maintenance
(O&M) cost and interest expense. It provides flexibility against interest rate volatility
and O&M variability. However, it carries the risk of uncertain future cash flows.
ATL’s regulated transmission tariff assets
o ATIL (Mundra – Dehgam, Mundra – Mohindergarh and Tiroda – Warora)
o MEGPTCL (Tiroda – Aurangabad)
Power transmission regulated tariff methodologies
Source: Company Reports & Ventura Research
1,26
,560
82,7
29
136136

( 9 t h D e c 2 0 2 1 )
For any further query, please email us on [email protected]
• Fixed transmission tariff
It’s an annuity-based business model where the transmission company gets a fixed
payment for its asset for its entire residual life. Benefits of fixed transmission tariffs:
o Fixed and predictable cash flow
o Payment through pooling mechanism (no counterparty risk)
ATL’s fixed transmission tariff assets
o Maru & Aravali
o WTPL & WTGL - Gujarat & Maharashtra
o Bikaner - Sikar (Acquired from KEC International)
o Alipurduar (acquired from Kalpataru Power Transmission)
o Suratgadh - Sikar - ATRL
o Raipur - Rajnandgaon - Warora
o Chhatisgarh
o Sipat - Rajnandgaon
o Hadoti - Barmer - Thar
o Fatehgarh - Bhadia
o Bikaner - Khetri
ATL’s operational asset portfolio
Source: Company Reports & Ventura Research
137137

( 9 t h D e c 2 0 2 1 )
For any further query, please email us on [email protected]
ATL’s under construction asset portfolio
Source: Company Reports & Ventura Research
ATL’s Power Transmission Network
Source: Company Reports
138138

( 9 t h D e c 2 0 2 1 )
For any further query, please email us on [email protected]
Financial Analysis & Projections for Power Transmission business
During FY16-21, the power transmission line length and asset base of operational projects
increased to 13,027 ckm (from 4,231 ckm) and INR 17,510 cr (from INR 5,350 cr), respectively.
Over the same period, segmental revenue and EBIT grew at a CAGR of 8.8% to INR 3,122 cr and
9.9% to INR 2,192 cr, respectively.
Power Transmission Performance
Source: Company Reports & Ventura Research
During H1FY22, power transmission line length and asset base of operational projects
increased to 13,720 ckm (from 13,027 ckm in FY21) and INR 18,910 cr (from INR 17,510 cr in
FY21), respectively. Over the same period, segmental revenue and EBIT grew at a YoY rate of
8.0% to INR 1,834 cr and 7.0% to INR 1,338 cr, respectively, while EBIT margin improved from
66.7% to 70.2% (+348bps) over the same period.
Over the period of FY21-24E, we expect the operational asset base of the power transmission
business to grow at a CAGR of 33.4% to INR 41,560 cr, due to the improving share of private
players in upcoming TBCB bidding. It would result in a revenue CAGR of 25.4% to INR 6,155 cr
over the same period. The company is bidding for only ‘fixed tariff’ transmission projects where
the revenues are fixed for 35 years, compared to volatile cash flow in ‘regulated return’
projects.
ATL enjoys strong contractual protection from discoms and gets paid through
a pooling mechanism In interstate transmission projects, the counterparty risk is largely mitigated through the point
of connection (POC) mechanism, under which, transmission charges are pooled and distributed
among transmission companies in proportion to their annual transmission charges, which
ensures 100% protection of their tariffs. The involvement of a central transmission utility (CTU)
0
5,000
10,000
15,000
20,000
25,000
30,000
35,000
40,000
45,000
FY16 FY17 FY18 FY19 FY20 FY21 FY22E FY23E FY24E
Growth in transmission assets to remain robust in the current decade
Transmission Length (ckm) Asset Base (INR Cr)
55
60
65
70
75
0
1,000
2,000
3,000
4,000
5,000
6,000
7,000
FY16 FY17 FY18 FY19 FY20 FY21 FY22E FY23E FY24E
Revenue growth and profitability to follow business performance
Transmission Revenue Transmission EBIT
EBIT Margin (%)
139139

( 9 t h D e c 2 0 2 1 )
For any further query, please email us on [email protected]
in billing, collection and disbursement of transmission charges among transmission companies
further reduces risk. Currently, Power Grid Corpplays the role of CTU
Procedure for payment pooling mechanism
Source: Company Reports
Comparison of power transmission assets with other power segments
Source: Industry Reports & Ventura Research
Customers
•State Discoms
•Power Generation Companies
Central Payment Pool (Escrow account
•Managed and Guaranteed by Power Grid Corp of India
•Collects payment on monthly basis
Transmission Service Providers
•State Transmission Companies
•Private Transmission Companies
Power TransmissionConventional Power
GenerationSolar Power Generation
Wind Power
Generation
100 50 100 100Payments through
pooling mechanism
Offtake & Cost of Fuel Driven by long term
aggrements
Driven by long term
aggrements
75 50 75 75Faster clearence to
payments
Direct exposure to debt
laden SEBs
Faster clearence to
payments
Faster clearence to
payments
100 50 100 75Limited O&M
requirements
Substantial periodic
maintenance needs
Moderate O&M
requirements
High O&M requirements
100 50 100 100High growth potential Moderate potential
from baseload demand
High growth potential High growth potential
100 50 50 50Few credible players High competitiveness
given multiple players
High competitiveness
given multiple players
High competitiveness
given multiple players
Certainty of Cash Flow
Counterparty Risk
Operational Risk
Future Growth
Potential
Competitive
Environment
140140

( 9 t h D e c 2 0 2 1 )
For any further query, please email us on [email protected]
Debt restructuring and extended maturities to improve future cash flow visibility on
ATL’s power transmission and distribution assets
Power transmission and distribution is a capital-intensive business, which requires long term
debt for project funding. The longer is the repayment tenure of the debt, the better is the
operating cash flow.
In FY21, the company raised USD 2.3 bn from the international debt markets across several
transactions to secure and strengthen its cash flow. Below are the details:
• Concluded its maiden US private placement (USPP) of a 30-year paper worth USD 400
mn, the first of its kind in India’s power transmission sector.
• AEML raised the first USD bond issuance of USD 1 bn. It also secured funding lines for
the capex plans drawn up, in addition to a rolling capex facility of USD 400 mn.
• Raised USD 500 mn, amortized over 17 years in the second tranche, to eliminate short-
term refinance risks.
USD denominated long term debt has reduced interest burden on cash flows
Source: Company Reports
With this debt raising activity, the company mobilized 10-years, 17-years and 30-years global
debt paper and extended the maturity of its debt to strengthen future cash flows. The average
long term debt maturity of ATL improved from 68 months in FY16 to 116 months in FY21.
141141

( 9 t h D e c 2 0 2 1 )
For any further query, please email us on [email protected]
US denominated long term debt obtained at the sovereign rating has reduced interest burden
Source: ACE Equity
Over the past 5 years, ATL changed its borrowing mix and raised the debt instruments of longer
maturities.
The maturity profile of ATL’s outstanding debt
Source: Company Reports
0
1
2
3
4
5
6
7
8
0
10,000
20,000
30,000
40,000
50,000
FY17 FY18 FY19 FY20 FY21 FY22E FY23E FY24E
Rise in asset base is expected to enhance absolute debt on balance sheet
Total Debt Net Debt
Net Debt to Equity (X) Net Debt to EBITDA (X)
INR Cr X
(4)
(2)
0
2
4
6
8
(8,000)
(6,000)
(4,000)
(2,000)
0
2,000
4,000
6,000
8,000
FY17 FY18 FY19 FY20 FY21 FY22E FY23E FY24E
Transmission capex cycle is expected to pickup strongly in the coming years
CFO FCF NWC to Sales (%)
INR Cr %
Fig in INR Cr FY16 FY17 FY18 FY19 FY20 FY21
Less than 1 year 3,491.2 1,245.7 1,833.8 3,832.9 3,198.1 4,637.5
Share of less than 1 year in Total Debt (%) 40.7 13.9 17.6 19.0 8.8 12.0
1-5 years 4,490.5 4,566.2 3,623.3 5,300.3 7,237.1 7,927.1
Share of 1-5 years in Total Debt (%) 52.3 50.9 34.7 26.3 19.9 20.5
Over 5 years 603.3 3,162.9 4,971.2 11,003.9 25,863.2 26,166.3
Share of more than 5 years in Total Debt (%) 7.0 35.2 47.7 54.6 71.3 67.6
142142

( 9 t h D e c 2 0 2 1 )
For any further query, please email us on [email protected]
➢ ATL’s Power Distribution – AEML
In Dec 2017, ATL signed a share purchase agreement for the acquisition of the Mumbai T&D
business from Reliance Infrastructure. In Mar 2018, the shareholders of Reliance Infrastructure
approved the sale of its power business for INR 13,251 cr. This resulted in the founding of
AEML, a 100% wholly-owned subsidiary of ATL in FY19. In Feb 2020, Qatar Investment
Authority acquired a 25.1% stake in AEML for INR 1,220 cr (along with subordinated debt of
INR 2,000 cr. AEML serves more than 3.0 mn consumers across a license area of approximately
400 sq km in the city of Mumbai.
Power Distribution regulated tariff methodologies
Source: Company Reports
After considering return on equity (RoE, 15.5% of equity involved in the business), interest
expense, depreciation costs, O&M and power purchase expenses, AEML derive its aggregate
revenue. While it provides flexibility against cost variability, it carries the risk of uncertain
future cash flows. However, operating profit is insulated from any cash flow mismatch which
may arise in exceptional cases as the business is based on the rate of return model with the
majority of the costs being pass-through. Any shortfall or excess cash collection get adjusted
in mid-year review with MERC through true-up mechanism.
In addition, the business also protects the RoE of the company even in the decline in
throughput. Equity covers ~30% of the annual capex while the rest ~70% is funded through
debt (payable in 13 years). The higher the equity involvement of the company, the higher
would be the assured return and profitability.
AEML is planning to incur a capex of INR 9,600 cr during FY21-25E, which is expected to
increase the asset base to INR 15,800 cr (from the current INR 6,915 cr).
143143

( 9 t h D e c 2 0 2 1 )
For any further query, please email us on [email protected]
Equity involvement in AEML improves the share of fixed returns in revenue and improve profits
Source: Ventura Research
Units sold & per unit realization, distribution loss, collection efficiency, online payment
Source: Company Reports
Particulars FY22E FY23E FY24E FY25E FY26E FY27E FY28E FY29E FY30E FY31E
Asset Base (INR Cr) 6,915 8,915 10,975 13,097 15,282 17,533 19,852 22,240 24,700 27,233
Equity (INR Cr) 3,212 3,812 4,430 5,067 5,722 6,398 7,093 7,810 8,548 9,308
Return on Equity (%) 15.5 15.5 15.5 15.5 15.5 15.5 15.5 15.5 15.5 15.5
Return on Equity (INR Cr) 498 591 687 785 887 992 1,099 1,210 1,325 1,443
Debt (INR Cr) 3,703 5,103 6,545 8,030 9,560 11,136 12,759 14,430 16,152 17,926
Revenue (INR Cr) 6,808 7,521 8,358 9,228 10,131 11,066 12,034 13,035 14,070 15,138
Share of RoE in Revenue (%) 7.3 7.9 8.2 8.5 8.8 9.0 9.1 9.3 9.4 9.5
EBIT 1,034 1,180 1,339 1,503 1,673 1,848 2,029 2,216 2,408 2,607
EBIT Margin (%) 15.2 15.7 16.0 16.3 16.5 16.7 16.9 17.0 17.1 17.2
-40
-30
-20
-10
0
10
20
30
0
500
1,000
1,500
2,000
2,500
3,000
AEML's electricity volume in Mumbai
Units Sold (mn units) YoY Growth (%)
8.397.53 7.85 7.78 8.18 8.69
5.58
13.47
3.19
6.707.56
6.887.64
0
2
4
6
8
10
12
14
16
Distribution Loss (%)
Distribution Loss (%)
144144

( 9 t h D e c 2 0 2 1 )
For any further query, please email us on [email protected]
AEML servicing 85% of Mumbai’s geography
Source: Company Reports
Multiple triggers for power demand in place
We are expecting a surge in power demand in the coming years due to the rapid urbanization
and development of Smart Cities, which will also increase the usage of electronic gadgets.
Triggers for power demand from various sectors
Source: Industry Reports & Ventura Research
•Area: 400 sq km
•Households: 3.1 mn
•Population: 12 mn
•Demand: 1,964 MW
Adani Transmission
•Area: 210 sq kim
•Households: 1.5 mn
•Population: 13 mn
•Demand: 1,500 MW
Other Distributors
Smart Cities, Housing for all and Rural Electrification
Under PMAY, 8 mn urban and 10 mn rural houses to be consctructed in cities and rural areas by FY25
Rapid urbanization and rising disposable income to increase the usage of
electronic gadgets
Significantly improve the per capita power
consumption
Make in India, China+1 and New
Capital Goods Policy
GOI is targeting to increase the share of manufacturing in GDP
from 18% to 25%
GOI is aiming to increase the export of capital goods from 25% of production to
40%
Support electricity consumption by industrial
and allied segments
Infrastructure Developement, DFCs
and Metro lines
Eastern & Western DFC with planned capital outlay of INR 735 bn
Railway electrificationa and Metro rail projects in
cities across India
Significantly increase the power demand from railways and metros
145145

( 9 t h D e c 2 0 2 1 )
For any further query, please email us on [email protected]
Power Distribution – Growth opportunities from unregulated segments
AEML is planning to enhance its product offerings in Mumbai. The focus would be on high
margin consumer durables and services to diversify its business, which is completely
unregulated today.
ATL’s Unregulated Business Plan
Source: Company Reports
Financial Analysis & Projections for Power Distribution business
During FY21, ATL sold 7,169 mn units of power (YoY decline of 15.0% over FY20) and clocked a
revenue of INR 6,048 cr. FY20 and FY21 financial numbers are not comparable as AEML sold a
25% stake to QIA and adjusted its revenue under IND AS 18. Segmental EBIT stood at INR 1,012
cr and EBIT margin was at 16.7%.
Power Distribution Performance
Source: ACE Equity
• Energy management solutions to optimize power consumption and cost reduction
Efficient Appliances & Demand Side Management (DMS)
• Smart home solutions to integerate smart home devices and optimize power cost
Smart Home Products
• DTH services with a complete entertainment package
E-Security & Entertainment on Demand
• Broadband home internet connectionFiber to Home
0
500
1,000
1,500
2,000
2,500
3,000
3,500
0
2,000
4,000
6,000
8,000
10,000
12,000
FY19 FY20 FY21 FY22E FY23E FY24E
Expecting a sustainable growth in power consumption
Unit Sold (nos mn)
Power Consumption per Household (nos)
13.5
14.0
14.5
15.0
15.5
16.0
16.5
17.0
0
2,000
4,000
6,000
8,000
10,000
FY19 FY20 FY21 FY22E FY23E FY24E
Distribution business generates a sustainable midteen EBIT margins
Distribution Revenue Distribution EBIT
EBIT Margin (%)
146146
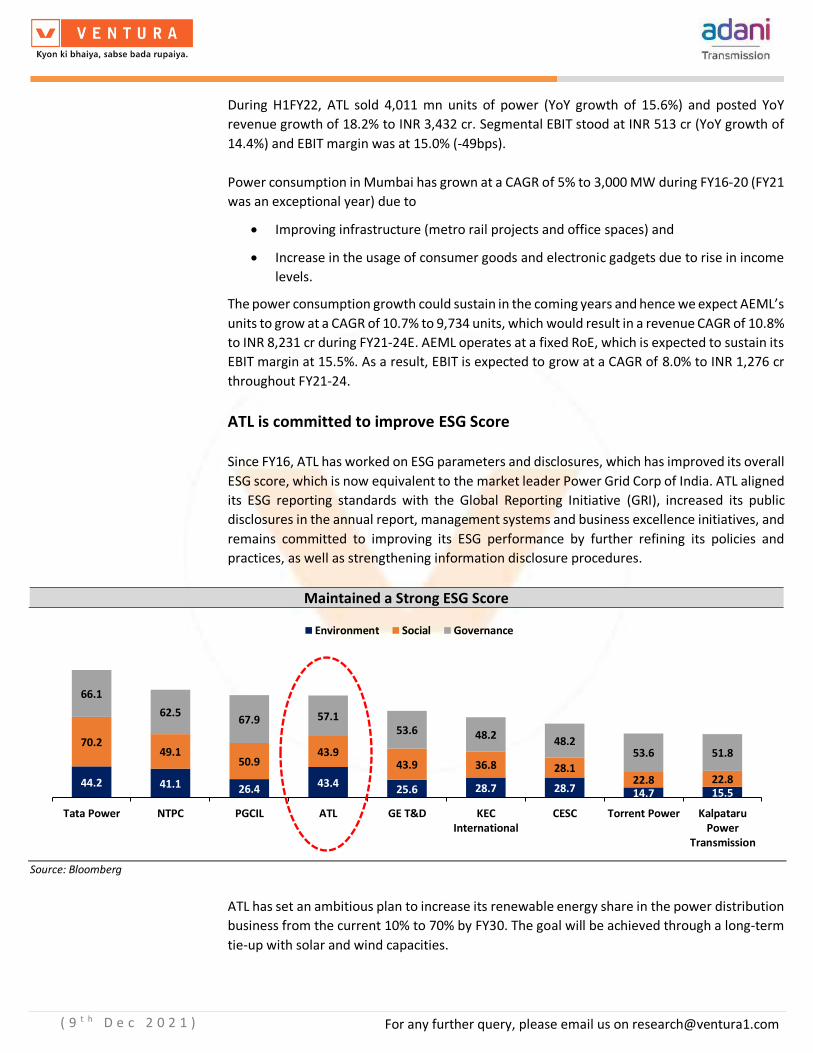
( 9 t h D e c 2 0 2 1 )
For any further query, please email us on [email protected]
During H1FY22, ATL sold 4,011 mn units of power (YoY growth of 15.6%) and posted YoY
revenue growth of 18.2% to INR 3,432 cr. Segmental EBIT stood at INR 513 cr (YoY growth of
14.4%) and EBIT margin was at 15.0% (-49bps).
Power consumption in Mumbai has grown at a CAGR of 5% to 3,000 MW during FY16-20 (FY21
was an exceptional year) due to
• Improving infrastructure (metro rail projects and office spaces) and
• Increase in the usage of consumer goods and electronic gadgets due to rise in income
levels.
The power consumption growth could sustain in the coming years and hence we expect AEML’s
units to grow at a CAGR of 10.7% to 9,734 units, which would result in a revenue CAGR of 10.8%
to INR 8,231 cr during FY21-24E. AEML operates at a fixed RoE, which is expected to sustain its
EBIT margin at 15.5%. As a result, EBIT is expected to grow at a CAGR of 8.0% to INR 1,276 cr
throughout FY21-24.
ATL is committed to improve ESG Score
Since FY16, ATL has worked on ESG parameters and disclosures, which has improved its overall
ESG score, which is now equivalent to the market leader Power Grid Corp of India. ATL aligned
its ESG reporting standards with the Global Reporting Initiative (GRI), increased its public
disclosures in the annual report, management systems and business excellence initiatives, and
remains committed to improving its ESG performance by further refining its policies and
practices, as well as strengthening information disclosure procedures.
Maintained a Strong ESG Score
Source: Bloomberg
ATL has set an ambitious plan to increase its renewable energy share in the power distribution
business from the current 10% to 70% by FY30. The goal will be achieved through a long-term
tie-up with solar and wind capacities.
44.2 41.1 26.4 43.425.6 28.7 28.7 14.7 15.5
70.249.1
50.943.9
43.9 36.8 28.122.8 22.8
66.1
62.567.9 57.1
53.6 48.248.2
53.6 51.8
Tata Power NTPC PGCIL ATL GE T&D KECInternational
CESC Torrent Power KalpataruPower
Transmission
Environment Social Governance
147147

( 9 t h D e c 2 0 2 1 )
For any further query, please email us on [email protected]
AEML’s ambitious plan to increase the share of renewable energy to 70% by FY30
Source: Company Reports
ATL’s Environmental Commitments
Source: Company Reports
10
30
40
60
70
FY21 FY23E FY25E FY27E FY30E
Data in %
148148

( 9 t h D e c 2 0 2 1 )
For any further query, please email us on [email protected]
ATL’s Social Philosophy
Source: Company Reports
ATL’s Governance Philosophy
Source: Company Reports
149149

( 9 t h D e c 2 0 2 1 )
For any further query, please email us on [email protected]
Ventura Business Quality Score
Key Criteria Score Risk Comments
Management & Leadership
Management Quality 8 Low The management is of high quality, it has been able to deliver on stated guidance; investor-friendly with timely updates on developments
Promoters Holding Pledge 7 Low The promoter holding is 74.92% and it has a pledge of 6.12% (declined from 40.18% as on 31st Mar 2020) as on 30th Sept 2021
Board of Directors Profile 7 Low The average experience of directors is >27 years with significant experience in manufacturing, accounts/finance, strategic planning and operations
Industry Consideration
Industry Growth 10 Low Private players have only a 7.5% share in India’s power T&D space, which provides a significant opportunity for them to grow in the coming years
Regulatory Environment or Risk 3 High Highly regulated market with government intervention
Entry Barriers / Competition 8 Low The entry of a new company in the power T&D space would require a strong capital base and a huge investment.
Business Prospects
New Business / Client Potential 8 Low ATL has been very aggressive in TBCB bidding and maintained >35% market share in TBCB auctions. We are expecting this trend to sustain in the coming years.
Business Diversification 8 Low ATL has a significant presence in the power transmission business. However, planning to diversify its business in power distribution and unregulated products such as electric appliances, smart home products, etc
Market Share Potential 10 Low ATL has a 35% stake in private power transmission space, which has been growing in the past 4-5 years.
Margin Expansion Potential 8 Low India is gradually improving its transmission lines to high voltage lines, where the power losses are low, which eventually generates better margins
Earnings Growth 8 Low High voltage lines along with expansion in power transmission network provide significant scope for earnings growth
Valuation and Risk
Balance Sheet Strength 3 High Power T&D is a capital intensive business that requires huge debt to fund capex and project execution, which impacts balance sheet health
Debt Profile 3 High ATL has INR 30,000 cr of total debt which is expected to grow at a CAGR of ~10% in the next 2-3 years.
FCF Generation 3 High ATL is in a growth phase, hence the capex is expected to remain high for the next 10 years, which could impact FCF
Dividend Policy 3 High The company has never paid a dividend in the past and its fund requirements are expected to remain high in the coming years
Total Score
Ventura Score (%)
97
65 Low
The overall risk profile of the company is good and we consider it as a LOW risk company for investments
Source: Company Reports & Ventura Research
150150

( 9 t h D e c 2 0 2 1 )
For any further query, please email us on [email protected]
Annual Report Takeaways
We analyzed the FY21 annual report of ATL and our key observations are as follows:
Key Takeaways
• Transmission network expansion: ATL’s transmission network expanded from 14,740
ckm in FY20 to 18,336 ckm in FY21, while network availability increased from 99.76%
to 99.87% during the period.
• Acquired two transmission lines: ATL made two acquisitions – Alipurdaur
Transmission Ltd (length of 650 ckm and an asset base of INR 1,080 cr) and Warora
Kurnool Transmission Ltd (length of 1,060 ckm and an asset base of INR 1,200 cr) – in
FY21. Alipurdaur Transmission is operational, while the Warora Kurnool Transmission
line will become operational by FY23.
• One time impact on Mumbai power distribution: AEML power distribution volumes
in Mumbai declined by 15% in FY21, due to pandemic and an unprecedented power
outage on 12th Oct 2020. The snapping of a conductor in MSETCL’s Kalwa-Padhage
Line-2 and manual tripping of the Talegon-Kharghar Line by the operator resulted in a
partial grid failure. As a result, ~3,500 MW of load was affected in Maharashtra; 2,200
MW was affected in Mumbai alone.
• Inorganic growth opportunities: ATL believes that there are significant inorganic
growth opportunities in India’s power transmission space, especially where competing
transmission assets are being sub-optimally utilised or are being operated at costs
higher than the sectorial standard.
• Debt restructuring: ATL raised USD 2.3 bn from the international debt market with
extended maturities. Below are the details:
o Concluded its maiden US private placement (USPP) of a 30-year paper worth
USD 400 mn, the first of its kind in India's power transmission sector.
o Completed the first USD bond issuance of USD 1 bn through AEML. It also
secured funding lines for the capex plans drawn up by AEML, in addition to a
rolling capex facility of USD 400 mn.
o Raised USD 500 mn, amortized over 17 years in the second tranche, to
eliminate short-term refinance risks.
Auditors qualifications and significant notes to accounts
Deloitte Haskins & Sells LLP is the auditor and there were no qualifications/emphasis of
matters highlighted by them in the FY21 Annual Report.
Royalty Payments
ATL is not paying royalty to any organization or company
151151

( 9 t h D e c 2 0 2 1 )
For any further query, please email us on [email protected]
Board of Directors
ATL has a stable team in place and no one left the board in the past 4 years, which reflects the
leadership stability in the company.
Details of Board of Directors
Source: Company Reports
Related Party Transactions and Balances
Related party transactions remained stable in the past 3 years and have not increased with the
business.
Related Party Balances with Subsidiaries and Group Companies
Source: Company Reports
Contingent Liabilities
Contingent Liabilities of the company are very high compared to the net worth and revenue of
the company. Most of the elements are related to disputes with government and regulatory
authorities which is a major risk to the company.
Particulars FY18 FY19 FY20 FY21
Gautam S Adani C C C C
Anil Sardana MD MD MD MD
Rajesh S Adani ED ED ED ED
K Jairaj NEID NEID NEID NEID
Ravindra H Dholakia NEID NEID NEID NEID
Meera Shankar NEID NEID NEID NEID
Jaladhi Shukla CS CS CS CS
C - Chairman MD - Managing Director
ED - Executive Director NEID - Non Executive Independent Director
Balances with Subsidiaries FY18 FY19 FY20 FY21 Balances with Group Companies FY18 FY19 FY20 FY21
Loans Payable 0.0 0.0 0.0 33.3 Loans Payable 319.2 35.8 0.0 350.8
Loans Receivables 4,674.0 5,320.9 4,952.9 4,818.0 Loans Receivables 0.0 0.0 0.0 0.0
Interest Accrued but not due 0.0 0.0 0.0 0.0 Interest Accrued but not due 25.4 2.4 0.0 0.0
Interest Receivables 512.0 296.4 234.1 252.7 Interest Receivables 0.0 0.0 0.0 0.0
Interest Payables 0.0 0.0 0.0 1.6 Interest Payables 0.0 0.0 0.0 0.0
Account Payable 3.6 0.1 23.1 0.0 Account Payable 0.0 24.0 0.1 0.0
Account Receivables 27.7 0.0 3.3 8.2 Account Receivables 0.4 0.3 0.1 0.0
Compulsorily Convertible Debentures 639.6 639.6 31.6 81.6 Compulsorily Convertible Debentures 0.0 0.0 0.0 0.0
Share Application pending allotment 4.0 0.0 0.0 0.0 Share Application pending allotment 0.0 0.0 0.0 0.0
Bank Guarantee 0.0 232.3 352.0 361.8 Bank Guarantee 0.0 0.0 0.0 0.0
Unsecured Perpetual Equity Instrument 0.0 0.0 0.0 0.0 Unsecured Perpetual Equity Instrument 1,848.6 3,408.0 3,279.4 2,829.7
152152

( 9 t h D e c 2 0 2 1 )
For any further query, please email us on [email protected]
Contingent Liabilities
Source: Company Reports
Particulars FY18 FY19 FY20 FY21
Direct Tax 1.0 1.0 1.1 0.9
VAT & Entry Tax 9.5 9.5 9.5 14.4
Demand disputed by the Group relating to Service tax on street light
Maintenance, wheeling charges and cross subsidy surcharges0.0 353.6 353.6 353.6
Claims raised by the Government authorities towards unearned income arising on
alleged transfer of certain land parcels0.0 127.7 127.7 127.7
Demand towards fixed charges payable in respect of power drawn from the state
pool0.0 124.6 99.7 0.0
Claims raised by Vidarbha Industries Power Limited (VIPL) in respect of increase in
fuel cost for the financial year ended 31st March, 20190.0 1,381.3 1,381.3 1,381.3
Way Leave fees claims disputed by the Group relating to rates charged 0.0 20.6 28.4 28.4
Other claims against the Group not acknowledged as debts 0.0 2.1 36.0 36.0
Property related disputes 0.0 2.6 0.0 0.0
Stamp duty payment 0.0 27.8 0.0 0.0
Total Reserves 6,056.5 4,634.9 5,219.5 6,089.6
Contingent Liabilities to Total Reserves (%) 0.2 44.2 39.0 31.9
Total Revenue 3,944.5 7,305.5 11,416.0 9,926.3
Contingent Liabilities to Total Revenue (%) 0.3 28.1 17.8 19.6
153153

( 9 t h D e c 2 0 2 1 )
For any further query, please email us on [email protected]
Management Team
Source: Company Reports
Key Risks & Concerns
• ATL has 10 under construction power transmission projects (9 TBCB fixed tariff and 1
HVDC RoA project). Such projects typically require substantial capex and a long
gestation period of 18 – 60 months before the commencement of commercial
operation. The cash flow starts after the commencement of commercial operation.
Any delay due to various reasons could impact future cash flows.
• Private participation in TBCB based bidding picked up since FY16, which is attracting
more private players in annuity based fixed tariff model. Increased competitive
pressure could adversely affect the pricing and ability of ATL to successfully bid for
projects and execute the growth story
• Power transmission business is subject to extensive regulatory risk which includes a
wide variety of laws, rules, directives, standards and codes issued by the government
and relevant regulatory authorities. To conduct transmission business, companies
must obtain various licenses, permits and approvals. Even when they get the required
licenses, permits and approvals, the operations are subject to continued review and
the governing regulations.
Key Person Designation Details
Mr Anil SardanaMD & CEO - Adani
Transmission
He holds a degree of Bachelors in Engineering from Delhi College of Engineering.
He also holds a Post-Graduate degree in Cost Accountancy (ICWAI) and a PGDBM
and has attended Top Management Program at the IIM Ahmedabad. He has more
than 40 years of experience in the infrastructure space, particularly in the Energy
and Telecom sectors having managed complex transitions, developments &
operations as well as EPC assignments. He has worked with NTPC (for 7 years),
BSES (for 14 years) and Tata Power (for 18 years).
Mr Kandarp Patel MD & CEO AEML
He graduated with Bachelor’s Degree in Electrical Engineering from Birla
Viswakarma Mahavidhyalaya Engineering College in 1994 and an MBA in Finance
from G.H. Patel PG Institute of Business Management in 1997. He has more than
two decades of multi-faceted experience in the areas of Power Trading, Fuel
Management, Legal and Regulatory and Commercial aspects of the Power
Business.
Mr Vivek SinglaPresident - Transmission &
Distribution
He has a Bachelor of Engineering degree in Electronics from Delhi University, a
Management degree in Finance from FMS, Delhi University and completed one
year course on Sr. Leadership from ISB, Hyderabad. He has worked with various
capacities in Tata Power, Uttaranchal Jal Vidyut Nigam, BSES, Siemens and BHEL.
Mr Rohit Soni CFO
He is a Chartered Accountant and Alumni of Harvard Business School, Boston, USA
(General Management Program GMP). He has over 19 years of rich experience in
managing complex businesses in Metal & Mining industry, both in India & overseas.
154154

( 9 t h D e c 2 0 2 1 )
For any further query, please email us on [email protected]
• Due to the long construction periods of power transmission systems and substation
projects, the O&M costs of projects may change significantly after the commissioning
of the assets. As the terms and conditions, including the tariff structure, are generally
fixed (in annuity-based projects), ATL may not be able to offset increases in costs.
• ATL has a substantial amount of outstanding gross debt (INR 23,663 cr) and intends to
finance the majority of the cost of future transmission projects through debt therefore
expecting to incur substantial additional borrowings in the future. It will require a
sustainable cash flow to service the debt in future and any interruption in annual cash
could impact debt servicing. Any significant change in interest rates could also impact
the profitability of the project.
• Opposition from local communities and other parties may adversely affect the project
execution and financial condition of the company.
• The company has very high contingent liabilities, which are more than 30% of its net
worth. Any adverse judgement could significantly impact the financial health of the
company.
• ATL raised USD 2.3 billion in loans with long term maturity. Volatility in the USD INR
rate and significant depreciation in INR could impact the balance sheet health of the
company.
155155

( 9 t h D e c 2 0 2 1 )
For any further query, please email us on [email protected]
Quarterly and Annual Performance
Source: Company Reports & Ventura Research
Fig in INR Cr (unless specified) FY19 FY20 Q1FY21 Q2FY21 Q3FY21 Q4FY21 FY21 Q1FY22 Q2FY22 Q3FY22E Q4FY22E FY22E FY23E FY24E
Transmission Asset Base 13,160 16,430 16,430 16,430 17,510 17,510 17,510 17,510 18,910 18,910 18,910 19,580 28,970 41,560
Transmission Revenue 2,193 2,815 1,009 688 704 720 3,122 1,045 789 973 973 3,779 4,826 6,155
Avg Yiled on Asset Base (%) 16.7 17.1 6.1 4.2 4.0 4.1 17.8 6.0 4.2 5.1 5.1 19.3 16.7 14.8
No of Customers (nos mn) 3.03 3.05 3.05 3.05 3.06 3.06 3.06 3.06 3.06 3.07 3.07 3.07 3.08 3.09
Power Consumption (mn units) 6,022 8,434 1,728 1,741 1,874 1,826 7,169 2,036 1,975 2,100 2,200 8,311 8,932 9,734
Distribution Revenue 4,270 7,676 1,437 1,467 1,588 1,556 6,048 1,742 1,690 1,662 1,662 6,756 7,380 8,231
Trading Revenue 842 925 0 1 305 451 757 43 62 348 348 800 1,022 1,303
Revenue from operations 7,305 11,416 2,447 2,156 2,597 2,727 9,926 2,830 2,541 2,982 2,982 11,335 13,228 15,689
YoY Growth (%) 85.2 56.3 (14.4) (16.9) (6.5) (14.4) (13.0) 15.7 17.9 14.8 9.4 14.2 16.7 18.6
Power Exp & Material Cost 3,130 4,622 776 585 1,033 1,249 3,643 862 1,018 1,322 1,322 4,523 5,209 6,067
RM Cost to Sales (%) 42.8 40.5 31.7 27.1 39.8 45.8 36.7 30.5 40.0 44.3 44.3 39.9 39.4 38.7
Employee Cost 587 973 223 254 219 236 931 229 245 263 263 1,001 1,071 1,144
Employee Cost to Sales (%) 8.0 8.5 9.1 11.8 8.4 8.6 9.4 8.1 9.6 8.8 8.8 8.8 8.1 7.3
Other Expenses 826 1,567 53 322 230 215 819 348 123 114 114 699 713 717
Other Expenses to Sales (%) 11.3 13.7 2.2 14.9 8.9 7.9 8.3 12.3 4.8 3.8 3.8 6.2 5.4 4.6
EBITDA 2,762 4,254 1,395 996 1,115 1,027 4,533 1,390 1,156 1,283 1,283 5,112 6,235 7,760
EBITDA Margin (%) 37.8 37.3 57.0 46.2 43.0 37.7 45.7 49.1 45.5 43.0 43.0 45.1 47.1 49.5
Depreciation 882 1,174 378 314 325 312 1,329 342 353 393 393 1,482 1,857 2,361
PBIT 1,880 3,080 1,017 682 790 715 3,204 1,048 803 890 890 3,631 4,377 5,399
PBIT Margin (%) 25.7 27.0 41.6 31.6 30.4 26.2 32.3 37.0 31.6 29.8 29.8 32.0 33.1 34.4
Transmission EBIT 1,348 1,873 787 463 462 480 2,192 801 537 632 632 2,602 3,234 4,124
Transmission EBIT Margin (%) 61.5 66.5 78.0 67.2 65.6 66.6 70.2 76.6 68.1 65.0 65.0 68.9 67.0 67.0
Distribution EBIT 624 1,206 230 219 328 235 1,012 248 266 258 258 1,029 1,144 1,276
Distribution EBIT Margin (%) 14.6 15.7 16.0 14.9 20.7 15.1 16.7 14.2 15.7 15.5 15.5 15.2 15.5 15.5
Trading EBIT -92 0 0 0 0 1 1 0 0 0 0 0 0 0
Other Income 351 265 96 150 137 149 533 106 134 109 109 458 536 634
Finance Cost 1,391 2,238 631 536 455 494 2,117 614 540 406 406 1,967 2,084 2,647
PBT 840 1,107 482 296 472 370 1,620 540 396 592 592 2,121 2,829 3,387
PBT Margin (%) 11.5 9.7 19.7 13.7 18.2 13.6 16.3 19.1 15.6 19.9 19.9 18.7 21.4 21.6
Tax Paid 281 400 149 105 32 138 330 97 98 149 149 494 712 852
Tax Rate (%) 33.4 36.2 30.9 35.6 6.7 37.4 20.4 18.0 24.7 25.2 25.2 23.3 25.2 25.2
Net Profit 559 742 361 183 372 214 1,224 445 282 443 443 1,613 2,117 2,534
Net Margin (%) 7.7 6.5 14.8 8.5 14.3 7.8 12.3 15.7 11.1 14.9 14.9 14.2 16.0 16.2
Adjusted EPS 5.1 6.7 11.1 14.7 19.3 23.0
P/E (X) 374.3 282.1 171.0 129.7 98.9 82.6
Adjusted BVPS 42.1 47.5 55.4 70.0 87.4 107.6
P/BV (X) 45.2 40.1 34.4 27.2 21.8 17.7
Enterprise Value 2,31,922 2,34,209 2,37,620 2,33,793 2,39,981 2,48,795
EV/EBITDA (X) 84.0 55.1 52.4 45.7 38.5 32.1
Net Worth 4,635 5,220 6,090 7,703 9,608 11,839
Return on Equity (%) 12.1 14.2 20.1 20.9 22.0 21.4
Capital Employed 28,180 32,745 35,880 34,125 42,718 54,347
Return on Capital Employed (%) 4.4 6.0 7.1 8.2 7.7 7.4
Invested Capital 27,263 30,135 34,416 32,202 40,295 51,339
Return on Invested Capital (%) 6.9 10.2 9.3 11.3 10.9 10.5
Cash Flow from Operations 2,591 5,437 3,784 4,391 5,549 6,793
Cash Flow from Investing -3,138 -5,643 -4,025 47 -9,670 -12,954
Cash Flow from Financing 38 1,250 -745 -4,150 4,392 6,449
Net Cash Flow -509 1,045 -986 288 271 288
Free Cash Flow 1,359 482 -352 -954 -4,215 -6,215
FCF to Revenue (%) 18.6 4.2 (3.5) (8.4) (31.9) (39.6)
FCF to EBITDA (%) 49.2 11.3 (7.8) (18.7) (67.6) (80.1)
FCF to Net Profit (%) 243.0 64.9 (28.7) (59.1) (199.1) (245.2)
FCF to Net Worth (%) 29.3 9.2 (5.8) (12.4) (43.9) (52.5)
Total Debt 23,545 27,525 29,791 26,422 33,109 42,509
Net Debt 22,629 24,916 28,326 24,499 30,687 39,501
Net Debt to Equity (X) 4.9 4.8 4.7 3.2 3.2 3.3
Net Debt to EBITDA (X) 8.2 5.9 6.2 4.8 4.9 5.1
Interest Coverage Ratio (X) 1.4 1.4 1.5 1.8 2.1 2.0
156156

( 9 t h D e c 2 0 2 1 )
For any further query, please email us on [email protected]
Summary of Management Commentary and Quarterly Performance over last few quarters
Key Criteria View Comments Q3FY21
Business Performance POSITIVE
Operational transmission line length increased by 650 ckm to 11,588 ckm, while transmission assets increased from INR 16,430 cr in Q2FY21 to INR 17,510 cr in Q3FY21. Transmission revenue for the quarter stood at INR 704 cr (YoY growth of 3.8%). Segmental EBIT reported YoY growth of 1.6% to INR 462 cr.
AEML sold 1,874 mn units in Q3FY21, compared to 1,741 mn units in Q2FY21 and 2,068 mn units in Q3FY20. Distribution revenue and EBIT for the quarter stood at INR 1,588 cr and INR 328 cr (not comparable due to stake sale to QIA).
Acquired Alipurdaur Transmission line (line length: 650 ckm and asset base: INR 1,080 cr) from Kalpataru Power Transmission
Outlook & Strategy POSITIVE No revenue or capex guidance due to uncertain economic conditions. The company would continue to grow inorganically in future
Q4FY21
Business Performance NEGATIVE
Operational transmission line length and transmission assets remained the same at 11,588 ckm and INR 17,510 cr respectively in Q4FY21. Transmission revenue for the quarter stood at INR 720 cr (YoY decline of 9.3%). Segmental EBIT reported a YoY decline of 7.7% to INR 480 cr.
AEML sold 1,826 mn units in Q4FY21, compared to 1,874 mn units in Q3FY21 and 1,808 mn units in Q4FY20. Distribution revenue for the quarter stood at INR 1,742 cr (YoY growth of 21.2%). Segmental EBIT reported a YoY decline of 10.9% to INR 235 cr.
Outlook & Strategy POSITIVE Planning to raise long term maturity (10-20 years) global bonds to reduce the payment risk for the next 10 years.
Q1FY22
Business Performance POSITIVE
Operational transmission line length and transmission assets remained the same at 11,588 ckm and INR 17,510 cr respectively in Q1FY22. Transmission revenue for the quarter stood at INR 1,045 cr (YoY growth of 3.6%). Segmental EBIT reported YoY growth of 1.7% to INR 801 cr.
AEML sold 2,036 mn units in Q1FY22, compared to 1,826 mn units in Q4FY21 and 1,728 mn units in Q1FY21. Distribution revenue for the quarter stood at INR 1,742 cr (YoY growth of 21.2%). Segmental EBIT reported YoY growth of 7.8% to INR 248 cr.
AEML raised USD 300 mn through a global medium-term note of 10 years term. This is the first tranche of USD 2.0 bn of the fund raising plan.
Outlook & Strategy POSITIVE
AEML has slated to do a capex of INR 16,300 cr in the next 8-10 years. The overall capex in FY22 would be in the range of INR 5,000 cr, out of which INR 2,000 cr will be for AEML and the rest INR 3,000 cr will be for transmission business.
157157

( 9 t h D e c 2 0 2 1 )
For any further query, please email us on [email protected]
Q2FY22
Business Performance POSITIVE
Operational transmission line length increased by 773 ckm to 12,361 ckm, while transmission assets increased from INR 17,510 cr in Q1FY22 to INR 18,910 cr in Q2FY22. Transmission revenue for the quarter stood at INR 789 cr (YoY growth of 14.6%). Segmental EBIT reported YoY growth of 16.0% to INR 537 cr.
AEML sold 1,975 mn units in Q2FY22, compared to 2,036 mn units in Q1FY22 and 1,741 mn units in Q2FY21. Distribution revenue for the quarter stood at INR 1,690 cr (YoY growth of 15.2%). Segmental EBIT reported YoY growth of 21.3% to INR 266 cr.
RoE and RoIC increased to 21.6% (+1253bps YoY) and 10.1% (+9bps YoY) respecitvely
Commissioned two fixed tariff lines – Fatehgarh to Bhadia and Bikaner to Khetri. The annual revenues from both the projects would be INR 177 cr
Outlook & Strategy POSITIVE
The company got approval from NERC for the HVDC transmission line for Mumbai. The project has the potential to generate INR 1,400 cr revenue annually. The project is expected to start operations from FY25
The capex in FY22 would be in the range of INR 5,000 cr
Source: Company Reports & Ventura Research
158158

( 9 t h D e c 2 0 2 1 )
For any further query, please email us on [email protected]
Financial Analysis & Projections
Fig in INR Cr (unless specified) FY20 FY21 FY22E FY23E FY24E Fig in INR Cr (unless specified) FY20 FY21 FY22E FY23E FY24E
Income Statement Per share data & Yields
Revenue 11,416.0 9,926.3 11,485.1 13,486.2 15,906.0 Adjusted EPS (INR) 6.7 11.1 16.5 20.9 25.1
YoY Growth (%) 56.3 -13.0 15.7 17.4 17.9 Adjusted Cash EPS (INR) 17.4 23.2 30.0 37.8 46.6
Raw Material Cost & Power Cost 4,621.6 3,643.0 4,522.8 5,149.0 5,829.1 Adjusted BVPS (INR) 86.9 91.1 107.7 127.6 150.9
RM Cost to Sales (%) 40.5 36.7 39.4 38.2 36.6 Adjusted CFO per share (INR) 49.4 34.4 39.5 50.8 63.7
Employee Cost 973.2 930.8 1,015.1 1,086.1 1,160.5 CFO Yield (%) 2.7 1.9 2.1 2.7 3.4
Employee Cost to Sales (%) 8.5 9.4 8.8 8.1 7.3 Adjusted FCF per share (INR) 4.4 -3.2 -8.3 -37.5 -55.6
Other Expenses 1,567.3 819.4 765.2 900.8 1,024.8 FCF Yield (%) 0.2 -0.2 -0.4 -2.0 -3.0
Other Exp to Sales (%) 13.7 8.3 6.7 6.7 6.4
EBITDA 4,253.9 4,533.2 5,182.0 6,350.3 7,891.5 Solvency Ratio (X)
Margin (%) 37.3 45.7 45.1 47.1 49.6 Total Debt to Equity 2.5 2.7 2.0 2.3 2.5
YoY Growth (%) 54.0 6.6 14.3 22.5 24.3 Net Debt to Equity 2.3 2.5 1.8 2.0 2.2
Depreciation & Amortization 1,174.0 1,328.9 1,481.6 1,857.2 2,360.8 Net Debt to EBITDA 5.1 5.6 4.2 4.3 4.6
EBIT 3,079.8 3,204.3 3,700.4 4,493.1 5,530.7
Margin (%) 27.0 32.3 32.2 33.3 34.8 Return Ratios (%)
YoY Growth (%) 63.8 4.0 15.5 21.4 23.1 Return on Equity 8.7 13.7 16.9 17.9 18.1
Other Income 265.3 532.6 458.0 548.4 781.3 Return on Capital Employed 6.0 7.1 8.2 7.4 7.2
Finance Cost 2,238.5 2,117.0 1,769.2 1,971.7 2,618.4 Return on Invested Capital 10.2 9.3 11.5 11.1 10.8
Interest Coverage (X) 1.4 1.5 2.1 2.3 2.1
Exceptional Item 0.0 0.0 0.0 0.0 0.0 Working Capital Ratios
PBT 1,106.7 1,619.9 2,389.2 3,069.8 3,693.7 Payable Days (Nos) 56 46 37 36 35
Margin (%) 9.7 16.3 20.8 22.8 23.2 Inventory Days (Nos) 17 9 5 5 5
YoY Growth (%) 31.7 46.4 47.5 28.5 20.3 Receivable Days (Nos) 32 37 39 36 35
Tax Expense 400.2 330.3 561.4 772.7 929.7 Net Working Capital Days (Nos) -7 0 7 5 5
Tax Rate (%) 36.2 20.4 23.5 25.2 25.2 Net Working Capital to Sales (%) -1.8 0.1 1.9 1.4 1.4
PAT 706.5 1,289.6 1,827.8 2,297.1 2,764.0
Margin (%) 6.2 13.0 15.9 17.0 17.4 Valuation (X)
YoY Growth (%) 26.3 82.5 41.7 25.7 20.3 P/E 274.9 166.6 112.4 88.8 73.8
Min Int/Sh of Assoc 35.3 -65.5 -14.1 0.0 0.0 P/BV 21.3 20.3 17.2 14.5 12.3
Net Profit 741.8 1,224.0 1,813.7 2,297.1 2,764.0 EV/EBITDA 53.0 50.6 43.5 36.5 30.4
Margin (%) 6.5 12.3 15.8 17.0 17.4 EV/Sales 19.8 23.1 19.6 17.2 15.1
YoY Growth (%) 32.7 65.0 48.2 26.7 20.3
Cash Flow Statement
Balance Sheet PBT 1,106.7 1,619.9 2,389.2 3,069.8 3,693.7
Share Capital 1,099.8 1,099.8 1,099.8 1,099.8 1,099.8 Adjustments 4,661.8 2,708.5 2,726.3 3,251.6 4,268.9
Total Reserves 8,461.3 8,923.1 10,746.6 12,930.7 15,500.0 Change in Working Capital 68.9 -213.7 -209.0 42.0 -25.4
Shareholders Fund 9,561.1 10,022.9 11,846.5 14,030.5 16,599.8 Less: Tax Paid -400.2 -330.3 -561.4 -772.7 -929.7
Long Term Borrowings 22,289.7 23,808.8 21,500.0 30,500.0 39,500.0 Cash Flow from Operations 5,437.2 3,784.3 4,345.1 5,590.7 7,007.6
Deferred Tax Assets / Liabilities 971.4 1,186.4 1,186.4 1,186.4 1,186.4 Net Capital Expenditure -2,762.7 -3,952.3 -5,000.0 -9,390.0 -12,590.0
Other Long Term Liabilities 697.9 910.5 1,053.5 1,237.0 1,459.0 Change in Investments -2,880.2 -73.0 5,024.6 -296.0 -357.9
Long Term Trade Payables 29.4 31.9 36.9 43.4 51.2 Cash Flow from Investing -5,642.9 -4,025.3 24.6 -9,686.0 -12,947.9
Long Term Provisions 275.6 584.5 637.5 682.1 728.8 Change in Borrowings 3,488.9 1,372.3 -2,189.1 9,161.8 9,314.4
Total Liabilities 33,824.9 36,545.0 36,260.7 47,679.4 59,525.1 Less: Finance Cost -2,238.5 -2,117.0 -1,769.2 -1,971.7 -2,618.4
Net Block 24,924.2 26,986.6 30,505.0 38,037.8 48,267.0 Proceeds from Equity 0.0 0.0 0.0 0.0 0.0
Capital Work in Progress 2,209.0 5,239.7 0.0 0.0 0.0 Buyback of Shares 0.0 0.0 0.0 0.0 0.0
Intangible assets under development 3.3 15.4 0.0 0.0 0.0 Dividend Paid 0.0 0.0 0.0 -229.7 -331.7
Non Current Investments 0.0 267.2 309.2 363.1 428.2 Cash flow from Financing 1,250.4 -744.7 -3,958.2 6,960.3 6,364.4
Long Term Loans & Advances 757.1 2,023.1 2,340.8 2,748.6 3,241.8 Net Cash Flow 1,044.7 -985.6 411.5 2,865.1 424.1
Other Non Current Assets 3,132.2 3,702.1 4,283.4 5,029.7 5,932.2 Forex Effect 0.0 0.0 0.0 0.0 0.0
Net Current Assets 2,799.2 -1,689.2 -1,177.7 1,500.1 1,655.8 Opening Balance of Cash 188.3 1,249.3 263.7 675.1 3,540.2
Total Assets 33,824.9 36,545.0 36,260.7 47,679.4 59,525.1 Closing Balance of Cash 1,233.0 263.7 675.1 3,540.2 3,964.3
159159

( 9 t h D e c 2 0 2 1 )
For any further query, please email us on [email protected]
This page left intentionally blank
160160

( 9 t h D e c 2 1 )
For any further query, please email us on [email protected]
Adani Total Gas Ltd
Leapfrogging to become a pan India CGD player
161161

( 9 t h D e c 2 0 2 1 )
For any further query, please email us on [email protected]
Adani Total Gas Ltd (ATGL) has seen a sharp spurt in its stock price, outperforming
the broader index and its peers by a wide margin. Despite this outperformance, we
believe that there exists significant room for further upside. We initiate coverage
on ATGL with a BUY for a FY24 DCF based price target of INR 2,012 per share,
implying a 14.7% upside from the CMP of INR 1,754.
ATGL, a JV (equal stake of 37.4%) between Adani Group and French energy major
TotalEnergies (TOTAL), is India’s largest private-sector city gas distributor (CGD), with
19 standalone operational geographical areas (GAs). In addition, ATGLs equal stake
JV with Indian Oil Corporation (IOC) – IOAGPL houses another 19 GA thus enabling
ATGL to emerge as a true pan India CGD player. Both JV partners, Total (which has
operations in 108 countries) and IOC (parent of Petronet LNG), bring rich experience
in sourcing LNG at competitive prices besides ensuring availability.
We expect ATGL’s gas volumes (excluding IOAGPL) to grow at a CAGR of 41.3% to
1,451 mmscm over FY21-24E, while its revenue/ EBITDA/ net profit is expected to
record a CAGR growth of 45.6%/ 34.1%/ 38.7% to INR 5,238 cr/ INR 1,688 cr/ INR
1,228 cr, respectively, over the same period. Return ratios – RoE and RoIC – too are
expected to improve by 411bps (to 28.0%) and 217bps (to 28.8%) respectively by
FY24E
Our conviction is underpinned by:
• Strong traction in CNG and PNG industrial/commercial volumes as the rollout
objectives of the 9th & 10th rounds are quite aggressive.
• Adani Group’s superior execution skills will ensure faster than expected
rollout leading to early paybacks and advancing of cash flows
• Leader by far in operational efficiencies as ably demonstrated by its EBIDTA
per scm which is the highest among peers.
• New wins (if any) from the 11th round will be earnings and profitability
accretive as they are not factored in our estimates.
Key Financial Data (INR Cr, unless specified)
Net
Revenue Operating
EBITDA Net
Profit EBITDA
(%)
Net Profit
(%)
EPS (₹)
BVPS (₹)
RoE (%)
RoIC (%)
Debt to EBITDA
(X)
P/E (X)
P/BV (X)
EV/ EBITDA
(X)
FY20 1,874.6 594.8 436.3 31.7 23.3 4.0 13.4 29.7 30.5 0.5 424.7 126.0 312.1
FY21 1,695.6 704.3 462.8 41.5 27.3 4.2 17.6 23.9 26.6 0.7 400.4 95.8 263.8
FY22E 2,642.6 985.9 731.0 37.3 27.7 6.6 23.6 28.2 32.7 0.2 253.5 71.5 188.2
FY23E 3,965.2 1,312.1 971.1 33.1 24.5 8.8 31.1 28.4 29.3 0.4 190.8 54.2 141.7
FY24E 5,237.8 1,688.1 1,272.3 32.2 24.3 11.6 40.3 28.7 28.8 0.5 145.7 41.8 110.3
BUY @ CMP INR 1,754 Target: INR 2,012 in 24 months Upside Potential: 14.7%
Leapfrogging to become a pan India CGD player
Industry City Gas
Scrip Details
Face Value (INR) 10.0
Market Cap (INR Cr) 1,85,356
Price (INR) 1,754
No of Shares O/S (Cr) 109.98
3M Avg Vol (000) 74
52W High/Low (INR) 1,715/315
Dividend Yield (%) 0.02
Shareholding (%) Sept 2021
Promoter 74.8
Institution 22.5
Public 1.7
TOTAL 100.0
Price Chart
0
10,000
20,000
30,000
40,000
50,000
60,000
70,000
0
200
400
600
800
1,000
1,200
1,400
1,600
1,800
Nov-18 Nov-19 Nov-20 Nov-21
ATGL Sensex
Adani Total Gas Ltd
162162

( 9 t h D e c 2 0 2 1 )
For any further query, please email us on [email protected]
Source: Ventura Research
0
200
400
600
800
1,000
1,200
1,400
1,600
1,800
1 year forward EV/EBITDA
EV per sh 50.7x 60.7x
70.7x 80.7x 90.7x
0
50
100
150
200
250
Ap
r-19
Jun
-19
Au
g-19
Oct
-19
De
c-19
Feb
-20
Ap
r-20
Jun
-20
Au
g-20
Oct
-20
De
c-20
Feb
-21
Ap
r-21
Jun
-21
Au
g-21
Oct
-21
EV/EBITDA & Std Deviation
EV/EBITDA Average
Upper Band SD1 Upper Band SD2
Lower Band SD1 Lower Band SD2
-5
0
5
10
15
20
25
No
v-18
Feb
-19
May
-19
Au
g-19
No
v-19
Feb
-20
May
-20
Au
g-20
No
v-20
Feb
-21
May
-21
Au
g-21
No
v-21
Peer group price performance
ATGL IGL GGL MGL
Data in %
0
2
4
6
8
10
12
14
Ap
r-19
Jun
-19
Au
g-19
Oct
-19
De
c-1
9
Feb
-20
Ap
r-20
Jun
-20
Au
g-20
Oct
-20
De
c-2
0
Feb
-21
Ap
r-21
Jun
-21
Au
g-21
Oct
-21
ATGL commands permium valuation over IGL & GGL, which has significantly expanded in 1 year
ATGL to IGL ATGL to GGL Average
Despite substantial recent outperformance, attractive decadal outlook portends substantial room for growth
163163

( 9 t h D e c 2 0 2 1 )
For any further query, please email us on [email protected]
Valuation
ATGL is the largest private CGD player and second only to GGL in India. With the recently
acquired GAs in the 9th & 10th rounds of CGD auctions, ATGL is expected to grow its CGD
network aggressively. Further, with the ambitious target set by the government to increase
the share of natural gas in India’s energy basket, there is strong visibility of gas volume growth
in the coming years. In addition, the Adani Group’s execution skills and TOTAL’s operational
efficiency will lead to a faster rollout of the gas network at optimum cost, thereby increasing
profitability.
We have used the DCF model to value standalone ATGL (excluding IOAGPL) since its CGD
contracts throw up significant cash over the next 25 years (which is the typical life of a CGD
contract). We have discounted back the future cash flows to FY24 and value the company at
INR 2.012 per share, presenting an upside of 14.7% from the CMP of 1,754 (110X FY24
EV/EBIDTA).
DCF Valuation
Source: Ventura Research
Our Bear case valuation analysis (done overleaf) suggests a significant margin of safety from
the current market price.
Long Term Market Return 10.0%
Risk Free Rate 6.0%
Cost of Equity 7.9%
Interest Rate 7.0%
Tax Rate 25.2%
Cost of Debt 5.2%
WACC 7.8%
Terminal Value Growth 4.0%
Terminal Value 7,75,803
FY24E FY25E FY26E FY27E FY28E FY29E FY30E FY35E FY40E FY46E
FCFF 296 717 1,346 2,149 2,911 3,800 4,717 10,846 17,930 28,509
Discount Factor from FY24 0.93 0.86 0.80 0.74 0.69 0.64 0.59 0.41 0.28 0.18
Discounted FCFF from FY24 274 617 1,074 1,590 1,997 2,418 2,784 4,393 4,984 5,044
Total of Discounted FCFF FY24 84,839
FY24 PV of Terminal Value 1,37,247
FY24 Enterprise Value 2,22,086
FY24 Net Debt 807
FY24 Value of Equity 2,21,280
FY24 Value of Equity per share 2,012
164164

( 9 t h D e c 2 0 2 1 )
For any further query, please email us on [email protected]
Our Bull and Bear Case Scenarios
We have prepared a Bull and Bear case scenario based on ATGL’s terminal growth.
• Bull Case: With the acquisition of 15 GAs in the 9th and 10th rounds of CGD auctions,
ATGL has a significant opportunity to grow its business in the coming years. We have
assumed a terminal growth of 5%, which will result in a Bull case price target of INR
2,471 (upside of 47% from the CMP).
• Bear Case: We have assumed a terminal growth of 2%, which will result in a Bear case
price target of INR 1,568 (downside of 7% from the CMP). Our base case implies a
significant margin of safety for buying at the current price.
Bull & Bear Case Scenario
Investment Triggers
• ATGL’s target is to open over 501 CNG stations by 2025 and over 2.5 mn PNG
connections by 2028.
• Adani Group’s execution skills and TOTAL’s operational efficiencies will help in the
faster rollout of the network at an optimum cost, thereby improving profitability.
Catalysts
• Surge in gas consumption due to change in India’s energy mix. The government is
planning to raise the contribution of gas in the total energy mix from the current 7%
to 15% by FY30. There is strong traction in CNG and PNG industrial/commercial
volumes as the rollout objectives of the 9th & 10th rounds are quite aggressive. This is
expected to provide impetus to ATGL in its operational GAs, keeping in mind the clean
fuel policy of the government.
Bull Case Price
INR 2,471 per share
Target Price
INR 2,012 per share
Bear Case Price
INR 1,685 per share
Current Price
INR 1,754 per share
5% terminal value growth.
4% terminal value growth
2% terminal value growth
165165

( 9 t h D e c 2 1 )
For any further query, please email us on [email protected]
Valuation and Comparable Metric of Domestic and Global Gas Distribution Companies
Source: Ventura Research & Bloomberg
Company Name Mkt Cap PricePEG
20242022 2023 2024 2022 2023 2024 2022 2023 2024 2022 2023 2024 2022 2023 2024 2022 2023 2024 2022 2023 2024 2022 2023 2024
Domestic Peers (fig in INR cr, unless specified)
Adani Total Gas Ltd 1,85,316 1,685.0 3.9 253.5 190.8 145.7 71.5 54.2 41.8 188.2 141.7 110.3 28.2 28.4 28.7 32.7 29.3 28.8 2,643 3,965 5,238 37.3 33.1 32.2 27.7 24.5 24.3
Petronet LNG Ltd 33,907 226.0 1.1 11.6 10.1 9.7 2.6 2.3 2.1 6.7 5.9 4.9 22.5 22.9 21.3 39.8 39.6 48.7 35,382 25,980 38,472 12.8 19.6 14.3 8.3 12.9 9.1
Gujarat State Petronet Ltd 17,180 304.0 0.4 8.9 6.9 6.7 2.2 1.7 1.6 4.9 3.8 3.1 24.4 25.2 24.1 43.2 46.6 51.2 12,205 11,493 15,042 28.6 36.0 30.8 15.8 21.6 17.2
GAIL Ltd 59,346 133.7 0.3 6.6 6.7 6.3 1.0 0.9 0.9 5.5 5.8 5.7 15.6 14.0 13.8 15.1 12.6 12.0 72,355 57,152 80,722 16.6 20.7 15.4 12.4 15.6 11.7
Gujarat Gas Ltd 45,747 664.6 1.1 32.1 26.3 22.0 8.0 6.2 5.2 20.3 16.0 14.2 25.1 23.7 23.4 34.3 39.4 37.8 10,262 9,810 15,050 21.8 28.3 20.5 13.9 17.7 13.8
Indraprastha Gas Ltd 34,751 496.5 0.7 24.2 20.2 16.8 4.7 4.0 3.3 16.7 13.3 11.5 19.4 19.7 19.9 24.2 26.0 25.3 6,485 4,941 7,964 31.9 52.4 37.1 22.1 34.9 26.0
Mahanagar Gas Ltd 8,986 909.8 0.5 10.8 9.5 8.8 2.4 2.0 1.8 6.6 5.5 4.9 22.0 21.5 20.4 36.0 36.5 37.0 2,951 2,136 3,192 41.5 65.3 46.7 28.2 44.5 32.1
Global Peers (fig in USD mn, unless specified)
Kunlun Energy (China) 8,151 0.9 0.8 9.1 8.4 7.9 0.9 0.9 0.8 2.7 2.3 1.6 10.0 10.1 9.8 22.3 23.9 27.7 15,850 20,989 23,788 15.8 13.0 12.6 5.7 4.6 4.3
China Gas (China) 9,953 1.8 0.7 6.5 6.3 5.7 1.1 1.0 0.9 6.5 5.8 4.6 17.7 16.3 15.8 13.9 14.7 16.7 7,617 9,026 10,629 29.0 27.4 25.9 20.1 17.6 16.3
CR Gas (China) 11,974 5.2 1.3 13.5 12.3 11.6 2.1 1.9 1.7 6.7 6.2 5.6 15.5 15.4 14.9 26.8 25.9 25.8 7,203 8,972 10,097 23.7 20.7 20.2 12.3 10.9 10.3
ENN Energy (China) 21,213 18.8 1.0 16.8 14.6 13.3 3.3 2.8 2.6 10.1 8.9 8.1 19.6 19.4 19.4 23.5 24.0 24.4 10,390 14,011 16,320 21.5 18.0 17.0 12.1 10.3 9.8
Town Gas (China) 2,144 0.7 0.4 8.1 6.8 6.2 0.7 0.7 0.6 10.4 9.6 10.7 8.4 9.8 9.8 5.8 6.4 6.7 1,654 2,096 2,360 25.0 23.1 18.4 15.9 15.0 14.6
Tian Lun Gas (China) 960 1.0 0.4 5.3 4.8 4.3 1.0 0.8 0.8 4.4 4.0 3.6 18.2 17.8 17.8 18.9 19.2 19.8 934 1,192 1,347 36.4 31.4 30.5 19.2 16.9 16.5
Korea Gas (S Korea) 2,721 29.5 -0.7 5.6 5.3 10.5 0.4 0.4 0.5 8.9 8.6 10.1 6.7 6.6 4.4 4.2 4.4 3.8 17,689 21,201 24,405 14.3 12.0 9.3 2.7 2.4 1.1
Perusahaan Gas Negara (Indonesia) 2,539 0.1 10.0 10.0 9.4 8.6 0.9 0.8 0.8 4.4 4.4 4.0 9.3 8.9 8.9 10.9 10.2 10.5 2,886 3,068 3,289 31.6 29.5 30.3 8.8 8.8 9.0
EBITDA Margin (%) Net Margin (%)P/E Ratio P/B Ratio EV/EBITDA Ratio RoE (%) RoIC (%) Sales
For any further query, please email us on [email protected] 166166

( 9 t h D e c 2 1 )
For any further query, please email us on [email protected]
Upcoming growth opportunities justifies ATGL’s premium valuation
Source: Ventura Research, ACE Equity & Bloomberg
ATGL
Petronet LNGGSPL
GAIL
GGL
IGL
MGL
Kunlun Energy
China Gas
CR Gas
ENN Energy
Town Gas
Tian Lun Gas
PGN
0
10
20
30
40
50
60
0.0 0.5 1.0 1.5 2.0 2.5 3.0 3.5
FY24
Ro
IC (
%)
EV/EBITDA to FY21-24 EBITDA CAGR
ATGL
Petronet LNG
GSPL
GAIL
GGL
IGL
MGL
0
5
10
15
20
25
30
35
40
45
50
10 15 20 25 30 35 40 45 50
FY2
4 E
BIT
DA
Mar
gin
(%)
FY21-24 Revenue CAGR (%)
167167

( 9 t h D e c 2 0 2 1 )
For any further query, please email us on [email protected]
ATGL’s Financial Summary
Source: Company Reports & Ventura Research
Fig in INR Cr (unless specified) FY19 FY20 FY21 FY22E FY23E FY24E FY25E FY26E FY27E FY28E FY29E FY30E FY30E FY31E
CNG Stations (nos) 82 115 217 317 417 517 617 717 814 908 954 995 1,033 1,067
CNG Volume (mmscm) 276.0 292.0 226.0 381.2 602.8 801.1 1,014.1 1,241.6 1,480.9 1,728.5 2,038.9 2,312.0 2,590.8 2,874.4
YoY Growth (%) 5.8 (22.6) 68.7 58.1 32.9 26.6 22.4 19.3 16.7 18.0 13.4 12.1 10.9
Avg CNG volume per staion (scmd) 9,757.0 8,121.8 3,730.0 3,912.1 4,500.0 4,700.0 4,900.0 5,100.0 5,300.0 5,500.0 6,000.0 6,500.0 7,000.0 7,500.0
CNG Revenue 850.4 948.0 739.0 1,343.4 2,124.1 2,823.0 3,573.3 4,375.1 5,218.2 6,090.6 7,184.5 8,146.9 9,129.2 10,128.5
YoY Growth (%) 11.5 (22.0) 81.8 58.1 32.9 26.6 22.4 19.3 16.7 18.0 13.4 12.1 10.9
CNG Revenue per kg (INR) 40.5 42.7 43.0 46.4 46.4 46.4 46.4 46.4 46.4 46.4 46.4 46.4 46.4 46.4
PNG Domestic Connections (nos) 3.8 4.4 4.8 5.8 7.8 10.3 13.3 16.5 20.0 24.0 28.5 33.5 38.5 41.5
PNG Domestic Volume (mmscm) 44.1 51.8 56.9 60.6 98.7 148.0 214.6 271.7 333.2 401.7 479.2 565.9 657.2 730.2
YoY Growth (%) 17.5 9.9 6.5 62.8 49.9 45.0 26.6 22.7 20.5 19.3 18.1 16.1 11.1
Avg PNG domesitc volume per connection (scmd) 0.35 0.35 0.34 0.32 0.40 0.45 0.50 0.50 0.50 0.50 0.50 0.50 0.50 0.50
PNG Domestic Revenue 108.5 136.7 153.9 194.3 316.3 474.2 687.8 870.5 1,067.9 1,287.2 1,535.8 1,813.6 2,106.0 2,339.9
YoY Growth (%) 26.0 12.6 26.3 62.8 49.9 45.0 26.6 22.7 20.5 19.3 18.1 16.1 11.1
PNG Domestic Revenue per scm (INR) 24.6 26.4 27.0 32.0 32.0 32.0 32.0 32.0 32.0 32.0 32.0 32.0 32.0 32.0
PNG Commercial Connections (nos) 2,561 2,986 3,300 3,731 4,231 4,731 5,231 5,731 6,231 6,731 7,231 7,731 8,231 8,731
PNG Commercial Volume (mmscm) 15.6 16.7 9.6 16.3 24.0 27.2 30.4 33.6 36.9 40.2 43.6 47.0 50.4 53.9
YoY Growth (%) 6.4 (42.3) 69.3 47.4 13.2 11.8 10.7 9.8 9.0 8.3 7.8 7.3 6.9
Avg PNG commercial volume per connection (scmd) 17.6 16.5 8.4 12.7 16.5 16.6 16.7 16.8 16.9 17.0 17.1 17.2 17.3 17.4
PNG Commercial Revenue 74.2 80.5 50.0 97.7 144.0 163.0 182.3 201.8 221.5 241.5 261.6 282.0 302.6 323.4
YoY Growth (%) 8.6 (37.9) 95.4 47.4 13.2 11.8 10.7 9.8 9.0 8.3 7.8 7.3 6.9
PNG Commercial Revenue per scm (INR) 47.4 48.4 52.0 60.0 60.0 60.0 60.0 60.0 60.0 60.0 60.0 60.0 60.0 60.0
PNG Industrial Connections (nos) 1,287 1,480 1,666 1,863 2,163 2,563 3,163 3,863 4,663 5,563 6,563 7,593 8,653 9,743
PNG Industrial Volume (mmscm) 204.4 222.2 221.5 265.1 367.4 474.4 627.0 833.5 1,089.2 1,399.7 1,770.4 2,195.9 2,668.4 3,189.4
YoY Growth (%) 8.7 (0.3) 19.7 38.6 29.1 32.2 32.9 30.7 28.5 26.5 24.0 21.5 19.5
Avg PNG industrial volume per connection (scmd) 532.7 439.9 385.8 411.7 500.0 550.0 600.0 650.0 700.0 750.0 800.0 850.0 900.0 950.0
PNG Industrial Revenue 767.7 799.8 819.9 1,137.2 1,575.7 2,034.6 2,689.2 3,574.8 4,671.7 6,003.4 7,593.4 9,418.6 11,445.0 13,679.7
YoY Growth (%) 4.2 2.5 38.7 38.6 29.1 32.2 32.9 30.7 28.5 26.5 24.0 21.5 19.5
PNG Industrial Revenue per scm (INR) 37.6 36.0 37.0 42.9 42.9 42.9 42.9 42.9 42.9 42.9 42.9 42.9 42.9 42.9
Total Gas Volume (mmscm) 540.2 582.6 514.0 723.3 1,092.8 1,450.7 1,886.1 2,380.3 2,940.2 3,570.0 4,332.1 5,120.8 5,966.8 6,847.8
YoY Growth (%) 7.9 (11.8) 40.7 51.1 32.7 30.0 26.2 23.5 21.4 21.3 18.2 16.5 14.8
Blended Avg Realization (INR per scm) 33.3 33.7 34.3 38.3 38.1 37.9 37.8 37.9 38.0 38.2 38.3 38.4 38.5 38.7
Revenue from operations 1,719.0 1,874.6 1,695.6 2,642.6 3,965.2 5,237.8 6,799.0 8,600.0 10,655.8 12,984.4 15,798.3 18,738.9 21,904.2 25,228.4
YoY Growth (%) 25.1 9.1 (9.5) 55.8 50.1 32.1 29.8 26.5 23.9 21.9 21.7 18.6 16.9 15.2
Raw Material Cost 1,092.7 1,060.0 769.6 1,316.7 2,076.4 2,770.7 3,621.2 4,594.1 5,704.0 6,961.6 8,490.9 10,088.1 11,814.2 13,627.2
RM Cost to Sales (%) 63.6 56.5 45.4 49.8 52.4 52.9 53.3 53.4 53.5 53.6 53.7 53.8 53.9 54.0
Employee Cost 42.0 47.5 51.5 79.3 198.3 288.1 407.9 473.0 532.8 586.1 642.9 703.4 767.4 834.9
Employee Cost to Sales (%) 2.4 2.5 3.0 3.0 5.0 5.5 6.0 5.5 5.0 4.5 4.1 3.8 3.5 3.3
Other Expenses 129.7 172.4 170.1 260.7 378.4 490.8 613.9 644.3 683.2 731.1 817.1 935.5 1,060.7 1,189.8
Other Expenses to Sales (%) 7.5 9.2 10.0 9.9 9.5 9.4 9.0 7.5 6.4 5.6 5.2 5.0 4.8 4.7
EBITDA 454.6 594.8 704.3 985.9 1,312.1 1,688.1 2,156.0 2,888.6 3,735.8 4,705.7 5,847.3 7,012.0 8,262.0 9,576.6
EBITDA per scm (INR) 8.4 10.2 13.7 13.6 12.0 11.6 11.4 12.1 12.7 13.2 13.5 13.7 13.8 14.0
EBITDA Margin (%) 26.4 31.7 41.5 37.3 33.1 32.2 31.7 33.6 35.1 36.2 37.0 37.4 37.7 38.0
Net Profit 228.7 436.3 462.8 731.0 971.1 1,272.3 1,660.1 2,227.7 2,945.0 3,738.5 4,678.0 5,653.0 6,728.5 7,890.7
Net Profit per scm (INR) 4.2 7.5 9.0 10.1 8.9 8.8 8.8 9.4 10.0 10.5 10.8 11.0 11.3 11.5
Net Margin (%) 13.3 23.3 27.3 27.7 24.5 24.3 24.4 25.9 27.6 28.8 29.6 30.2 30.7 31.3
Adjusted EPS 2.1 4.0 4.2 6.6 8.8 11.6 15.1 20.3 26.8 34.0 42.5 51.4 61.2 71.7
P/E (X) 810.3 424.7 400.4 253.5 190.8 145.7 111.6 83.2 62.9 49.6 39.6 32.8 27.5 23.5
Adjusted BVPS 10.0 13.4 17.6 23.6 31.1 40.3 51.6 65.8 83.2 103.6 127.0 152.7 181.5 213.0
P/BV (X) 168.2 126.0 95.8 71.5 54.2 41.8 32.6 25.6 20.2 16.3 13.3 11.0 9.3 7.9
Enterprise Value 1,85,551 1,85,630 1,85,794 1,85,492 1,85,902 1,86,123 1,86,134 1,85,808 1,85,049 1,84,007 1,82,728 1,81,205 1,78,818 1,76,138
EV/EBITDA (X) 408.1 312.1 263.8 188.2 141.7 110.3 86.3 64.3 49.5 39.1 31.2 25.8 21.6 18.4
Net Worth 1,102.0 1,470.9 1,933.8 2,591.7 3,417.1 4,434.9 5,680.0 7,239.4 9,153.7 11,396.8 13,969.7 16,796.2 19,958.6 23,430.5
Return on Equity (%) 20.8 29.7 23.9 28.2 28.4 28.7 29.2 30.8 32.2 32.8 33.5 33.7 33.7 33.7
Capital Employed 1,495.9 1,873.9 2,422.1 2,953.2 4,084.4 5,305.9 6,566.8 7,802.2 9,153.7 11,396.8 13,969.7 16,796.2 19,958.6 23,430.5
Return on Capital Employed (%) 16.6 23.1 19.8 22.9 21.5 21.3 22.1 25.2 28.1 28.7 29.3 29.4 29.4 29.2
Invested Capital 1,336.2 1,784.4 2,411.2 2,767.0 4,002.5 5,241.5 6,497.9 7,730.7 8,886.1 10,087.8 11,381.3 12,685.3 13,460.1 14,252.1
Return on Invested Capital (%) 29.0 30.5 26.6 32.7 29.3 28.8 29.8 34.0 38.7 43.3 48.1 52.1 58.2 64.1
Cash Flow from Operations 356.1 492.4 653.5 892.4 1,207.4 1,565.7 2,017.1 2,603.5 3,320.9 4,129.9 5,117.5 6,134.0 7,232.7 8,417.0
Cash Flow from Investing 791.0 (461.0) (770.5) (537.0) (1,426.0) (1,463.7) (1,534.8) (1,544.0) (1,506.8) (1,594.0) (1,734.0) (1,786.1) (1,280.3) (1,319.4)
Cash Flow from Financing (1,077.1) (102.0) 38.6 (180.5) 113.8 (120.0) (478.3) (1,057.6) (1,618.9) (1,495.4) (2,105.1) (2,826.5) (3,566.1) (4,418.8)
Net Cash Flow 70.0 (70.6) (78.4) 175.0 (104.8) (18.0) 3.9 2.0 195.3 1,040.5 1,278.3 1,521.4 2,386.4 2,678.7
Free Cash Flow 80.6 45.9 (104.2) (185.0) (6.4) 295.8 717.3 1,346.2 2,149.4 2,910.6 3,799.9 4,716.7 6,284.2 7,343.7
FCF to Net Profit (%) 35.3 10.5 (22.5) (25.3) (0.7) 23.2 43.2 60.4 73.0 77.9 81.2 83.4 93.4 93.1
FCF to Net Worth (%) 7.3 3.1 (5.4) (7.1) (0.2) 6.7 12.6 18.6 23.5 25.5 27.2 28.1 31.5 31.3
Total Debt 394.0 403.0 488.3 361.5 667.3 871.0 886.8 562.8 0.0 0.0 0.0 0.0 0.0 0.0
Net Debt 234.2 313.6 477.4 175.3 585.4 806.6 817.9 491.3 (267.6) (1,309.0) (2,588.4) (4,110.9) (6,498.5) (9,178.4)
Net Debt to Equity (X) 0.2 0.2 0.2 0.1 0.2 0.2 0.1 0.1 (0.0) (0.1) (0.2) (0.2) (0.3) (0.4)
Net Debt to EBITDA (X) 0.5 0.5 0.7 0.2 0.4 0.5 0.4 0.2 (0.1) (0.3) (0.4) (0.6) (0.8) (1.0)
Interest Coverage Ratio (X) 4.3 13.3 15.9 23.6 25.4 21.8 24.5 40.3 135.8 NA NA NA NA NA
168168

( 9 t h D e c 2 0 2 1 )
For any further query, please email us on [email protected]
(20)
(10)
0
10
20
30
40
50
60
0
200
400
600
800
1,000
1,200
1,400
1,600
FY19 FY20 FY21 FY22E FY23E FY24E
Network rollout in new GAs to improve gas volumes
Total Gas Volume YoY Growth (%)
Vol in mmscm %
51 50 44 53 55 55
38 38 43 37 34 33
8 9 11 8 9 10 3 3 2 2 2 2
FY19 FY20 FY21 FY22E FY23E FY24E
Steady volume mix to persis
CNG PNG Industrial PNG Domestic PNG Commercial
Vol share data in %
(20)
(10)
0
10
20
30
40
50
60
70
0
1,000
2,000
3,000
4,000
5,000
6,000
FY19 FY20 FY21 FY22E FY23E FY24E
Higher volumes to drive the revenue performance
Revenue YoY Growth (%)
INR Cr %
47 48 42 48 51 51
43 41 47 41 38 37
6 7 9 7 8 9 4 4 3 4 3 3
FY19 FY20 FY21 FY22E FY23E FY24E
Steady revenue mix to persist
CNG PNG Industrial PNG Domestic PNG Commercial
Revenue share data in %
0
10
20
30
40
50
0
500
1,000
1,500
2,000
FY19 FY20 FY21 FY22E FY23E FY24E
Infrastructure rollout in new GAs to increase opex for the next 4 years
EBITDA Net Profit
EBITDA Margin (%) Net Margin (%)
INR Cr %
15
20
25
30
35
0
1,000
2,000
3,000
4,000
5,000
6,000
FY19 FY20 FY21 FY22E FY23E FY24E
Return ratios to remain stable in the range of 25-30%
Net Worth Invested Capital
RoE (%) RoIC (%)
INR Cr %
ATGL Story in Charts
169169

( 9 t h D e c 2 0 2 1 )
For any further query, please email us on [email protected]
Source: Company Reports & Ventura Research
0
2
4
6
8
10
12
14
16
0
500
1,000
1,500
2,000
FY19 FY20 FY21 FY22E FY23E FY24E
Expansion in new GAs would be partly funded by external debt
EBITDA PAT
EBITDA per scm (INR) Net per scm (INR)
INR Cr X
(40)
(20)
0
20
40
60
80
100
120
(400)
(200)
0
200
400
600
800
1,000
1,200
1,400
1,600
1,800
FY19 FY20 FY21 FY22E FY23E FY24E
Free cash flow generation to kick in from FY24
CFO FCF
CFO to EBITDA (%) FCF to Net Profit (%)
Days %
0.4
0.6
0.8
1.0
1.2
1.4
1.6
1.8
2.0
FY19 FY20 FY21 FY22E FY23E FY24E
Higher capital requirement and asset base to drop turnover ratios
Fixed Asset Turnover Total Asset Turnover
Capital Turnover
X
0.0
0.5
1.0
1.5
2.0
2.5
0
5
10
15
20
25
30
FY19 FY20 FY21 FY22E FY23E FY24E
Working capital to remain stable
Payable Days Inventory Days
Receivable Days Net Working to Sales (%)
Days %
170170

( 9 t h D e c 2 0 2 1 )
For any further query, please email us on [email protected]
Company Overview
ATGL, incorporated in 2005, is a JV between the Adani Group and French energy major TOTAL
(equal stakes of 37.4%). It is India’s largest private-sector CGD, with 19 standalone operational
GAs, 244 CNG stations, 5.1 lakhs PNG domestic connections, 5,264 PNG industrial/commercial
connections and a pipeline network of more than 5,669 km (850 km steel pipeline and 4,819
km PE pipeline) across India.
ATGL won 15 GAs in the 9th and 10th rounds of CGD auctions and committed to open 501 CNG
stations and connect 25.5 lakh households by 2027. ATGL also has a 50:50 JV with Indian Oil
Corp – IOAGPL. This JV acquired 10 GAs and committed to open 876 CNG stations and connect
23.2 lakh households over the same period.
ATGL’s Business Structure
Source: Company Reports
171171

( 9 t h D e c 2 0 2 1 )
For any further query, please email us on [email protected]
Diversified Geographical Presence ATGL
Source: ACE Equity
Four key drivers for ATGL – Growth, Financial Strength, Execution and Efficiency
ATGL has four key drivers which are making it a unique play in India’s CGD space.
• Significant growth opportunity from the 9th & 10th round of CGD biddings,
• Strong balance sheet health,
• Demonstrated unparalleled execution skills of the Adani Group to expedite gas network roll out in 15 GAs in less than 7 years, and
• Superior operating efficiency which generates healthy cash flow.
Diversified Geographical Presence ATGL
Source: ACE Equity
Growth
•Govt's push to increase the share of natural gas in the total energy mix from current 7% to 15% by FY30
•ATGL's gas volumes to grow 9.4X in 10 years on account of network rollout in 15 new GAs acquired in recent biddings
Execution
•Adani Group is known for its superior project execution in various areas in infrastructure space, such as power, ports, logistics, etc
•We believe that gas network rollout will be faster in 15 GAs. ATGL is targeting to open 500 CNG stations by FY25 and 2.5 mn PNG connection by FY28
Financial Strength
•ATGL's net debt to equity is 0.2X and net debt to EBITDA is 0.7X, provides sufficient room to raise debt to fund the estimated capex of INR 9,000 cr in the next 10 years.
•ATGL generates INR 600-700 cr of CFO annually, which will increase with the network rollout in the new GAs. It accounts for 60-70% of annual capex requirement
Efficiency
•Expertise of Total Gas SE is helping the company in improving its operational efficiency
•ATGL is one of the most profitable CGD player in India and despite a fair mix of gas volumes it has sustained EBITDA per scm of >INR 12, which is higher than INR 7-8 of IGL and INR 4-5 of GGL.
172172

( 9 t h D e c 2 0 2 1 )
For any further query, please email us on [email protected]
Significant growth opportunities from newly acquired GAs Aggressive wins in the recent bidding rounds of PNGRB have paved the way for ATGL to become one of the leading pan-India CGD players. It is expected to significantly boost ATGL’s gas volumes in the next 10 years at a 29.6% CAGR to 6,848 mmscm by FY31 from 514 mmscm in FY21. As per the minimum work program (MWP) of the recent bidding, ATGL has to set up 501 CNG stations and 25.5 lakhs PNG household connections by FY27.
ATGL in 9th & 10th round of CGD bidding
Source: PNGRB
CNG business will be the early kicker Given the shortcomings of the EV infrastructure in India and the rise in the retail price of diesel & petrol, CNG powered vehicles are expected to be a better alternative in terms of running cost and emission control. Not just passenger vehicles, sales of CNG-based commercial vehicles (CVs) are rising and the trend is likely to continue. The recent rise in the retail price of diesel has also prompted a lot of transporters to shift to CNG from diesel.
Emission, mileage & price of a compact sedan in India
Source: PNGRB & Ventura Research
YearCNG Station
Progress (%)
Cummulative
CNG Stations
(nos)
PNG
Connection
Progress (%)
Cummulative
PNG Network
(nos)
Steel Pipeline
(km)
Cummulative
Steel Pipeline
(km)
FY20 0 0 0 0 5 671
FY21 15 75 10 2,54,968 20 2,682
FY22 30 150 20 5,09,935 40 5,365
FY23 45 225 30 7,64,903 60 8,047
FY24 60 301 40 10,19,870 70 9,388
FY25 75 376 60 15,29,806 80 10,730
FY26 90 451 80 20,39,741 90 12,071
FY27 100 501 100 25,49,676 100 13,412
Particulars LPG Diesel CNG Petrol
Carbon Dioxide (g/km) 61.7 70.2 53.1 48.3
Nitrogen Oxide (g/km) 0.3 0.6 0.1 0.4
Soot-PM10 (g/km) 0.015 0.025 0.010 0.005
Price - INR/ltr or INR/kg 37.3 101.4 49.4 111.3
Mileage - Km/ltr or Km/kg 21.0 20.0 21.0 16.0
Fule cost for 10,000 kms a year (INR) 17,762 50,700 23,524 69,563
Car Price (INR Lacs) 8.1 9.0 8.4 7.5
Cost of car + Running cost after 8 years (INR Lacs) 9.5 13.1 10.3 13.1
173173

( 9 t h D e c 2 0 2 1 )
For any further query, please email us on [email protected]
The management has anticipated the CNG opportunity and has preponed its timeline to achieve a complete rollout of the 501 CNG stations as early as possible, which will take its overall CNG network to over 720 stations. This will facilitate early pay back and faster cash flow generation.
ATGL’s CNG rollout in the next 7 years
Source: Annual Reports & Ventura Research
India has around 2.5-3.0 mn CNG vehicles, out of an estimated on-road vehicle population of 25-30 mn vehicles (3Ws, PVs and Buses), representing a penetration level of only 10%.
CNG penetration in PVs and buses is significantly lower than 3Ws, presenting a strong growth opportunity
Source: Vahan Parivahan (*Data updated till Nov 2021)
Fig in INR Cr (unless specified) FY19 FY20 FY21 FY22E FY23E FY24E FY25E FY26E FY27E FY28E
CNG Stations (nos) 82 115 217 317 417 517 617 717 814 908
CNG Volume (mmscm) 276.0 292.0 226.0 381.2 602.8 801.1 1,014.1 1,241.6 1,480.9 1,728.5
YoY Growth (%) 5.8 (22.6) 68.7 58.1 32.9 26.6 22.4 19.3 16.7
Avg CNG volume per staion (scmd) 9,757.0 8,121.8 3,730.0 3,912.1 4,500.0 4,700.0 4,900.0 5,100.0 5,300.0 5,500.0
CNG Revenue 850.4 948.0 739.0 1,343.4 2,124.1 2,823.0 3,573.3 4,375.1 5,218.2 6,090.6
YoY Growth (%) 11.5 (22.0) 81.8 58.1 32.9 26.6 22.4 19.3 16.7
CNG Revenue per kg (INR) 40.5 42.7 43.0 46.4 46.4 46.4 46.4 46.4 46.4 46.4
3 Wheelers FY15 FY16 FY17 FY18 FY19 FY20 FY21 FY22*
CNG ONLY 12,760 13,424 10,154 3,632 137 2,799 34,570 57,529
DIESEL 2,37,825 2,30,611 2,21,135 2,18,664 2,51,421 2,90,185 91,099 41,800
EV 43 2,510 3,097 3,577 6,034 1,488 1,888 5,008
LPG ONLY 1,819 4,124 1,778 3,568 4,533 3,871 10,827 9,282
PETROL 28,939 24,082 23,136 22,081 23,807 18,843 9,184 5,185
PETROL+CNG 86,037 85,876 96,385 1,66,931 1,89,846 1,71,865 13,757 6,963
PETROL+LPG 38,280 36,734 46,408 61,893 93,189 90,634 10,289 2,878
Total 4,05,703 3,97,361 4,02,093 4,80,346 5,68,967 5,79,685 1,71,614 1,28,645
CNG Share (%) 24.4 25.0 26.5 35.5 33.4 30.1 28.2 50.1
4 Wheelers FY15 FY16 FY17 FY18 FY19 FY20 FY21 FY22*
CNG ONLY 2,456 2,823 1,583 1,062 719 317 46 10
DIESEL 11,40,651 10,86,718 10,50,418 10,68,987 9,76,643 8,22,686 3,84,085 3,09,148
DIESEL/HYBRID 13 1,756 18,914 51,214 59,800 19,807 164 15
EV 589 788 765 1,169 1,448 2,238 4,968 7,778
LPG ONLY 116 139 205 146 75 46 8 1
NOT APPLICABLE 2,603 4,525 4,228 3,567 1,845 475 21 2
PETROL 10,79,402 12,33,280 13,97,550 15,93,996 16,14,266 15,91,067 17,01,391 11,66,267
PETROL/CNG 1,41,230 1,55,878 2,01,743 1,78,868 2,05,790 1,92,260 1,72,101 1,31,205
PETROL/HYBRID 4 168 645 633 29,640 76,024 1,00,650 77,183
PETROL/LPG 32,817 24,564 23,978 19,123 16,537 11,374 6,166 1,559
Total 23,99,881 25,10,639 27,00,029 29,18,765 29,06,763 27,16,294 23,69,600 16,93,168
CNG Share (%) 6.0 6.3 7.5 6.2 7.1 7.1 7.3 7.7
Bus FY15 FY16 FY17 FY18 FY19 FY20 FY21 FY22*
CNG ONLY 1,430 1,408 2,386 2,149 2,020 4,679 779 597
DIESEL 37,919 46,042 52,757 40,108 39,223 50,069 6,743 5,537
EV 0 4 1 35 75 443 373 635
PETROL 32 42 58 36 24 7 17 14
Total 39,381 47,496 55,202 42,328 41,342 55,198 7,912 6,783
CNG Share (%) 3.6 3.0 4.3 5.1 4.9 8.5 9.8 8.8
174174

( 9 t h D e c 2 0 2 1 )
For any further query, please email us on [email protected]
As the number of CNG filling stations increase, the number of vehicles shifting from conventional fuels to gas is expected to accelerate. As a result, we are expecting CNG volumes to grow at a CAGR of 52.5% to 801 mmscm by FY24, leading to CNG revenues to record a CAGR growth of 56.3% to INR 2,823 cr.
A strong boost is expected in PNG industrial Regulatory intervention from the National Green Tribunal (NGT) in various industrial clusters is leading to a shift from traditional fuels such as coal and diesel to cleaner alternatives such as natural gas, wind and solar. Solar and wind alone are insufficient to cater to the energy needs of energy clusters, therefore, in the absence of any other alternative, natural gas is the only ‘green’ option available. The central pollution control board (PCB) and NGT have identified 100 polluted industrial areas across India. NGT has given strict orders to state PCBs and CPCB to implement their action plans to prohibit pollution-causing industrial activities in the 100 industrial areas. COVID has delayed this implementation, however, we are expecting strong action by state PCBs in the next 2-3 years.
ATGL has wisely selected its GAs, which are placed across key industrial corridors
Source: Company Reports
Strict NGT orders inevitably mean industries switching from coal/diesel to natural gas with immediate effect. This could significantly boost ATGL’s industrial gas demand, as all the acquired GAs are placed along major industrial corridors. As a result, we are expecting PNG industrial volumes to grow at a CAGR of 28.9% to 474 mmscm by FY24, while PNG industrial revenues are expected to record a CAGR growth of 35.4% to INR 2,035 cr.
175175

( 9 t h D e c 2 0 2 1 )
For any further query, please email us on [email protected]
ATGL’s PNG industrial rollout in the next 7 years
Source: Annual Reports & Ventura Research
PNG domestic to provide stability to gas volumes
PNG domestic is a household gas consumption segment which is used for cooking and heating.
Therefore, irrespective of economic conditions, PNG domestic gas volumes largely remain
stable. The government is targeting to expand PNG domestic connections to 100 lakhs
households by the end of 2022. This target is 22% higher than the current base of 82.2 lakh (as
on 30th Sept 2021).
Most of the cities in recent CGD auctions are of Tier II & III levels, where the families prefer to
eat home cooked food rather than dine out. This is expected to substantially improve gas
demand in the PNG domestic segment. As a result, we are expecting PNG domestic volumes
to grow at a CAGR of 37.5% to 148 mmscm by FY24, while PNG domestic revenues to record
a CAGR growth of 45.5% to INR 474 cr.
ATGL’s PNG domestic rollout in the next 7 years
Source: Annual Reports & Ventura Research
Both CNG and PNG domestic networks have access to APM gas. However, the capex
requirement in PNG domestic is significantly higher (over 15X to CNG) for the similar
throughput gas volumes. Thus, we believe that irrespective of stable gas volumes, PNG
domestic will continue to remain RoE dilutive and therefore, ATGL is focusing on the faster
rollout of CNG stations and will gradually expand its PNG domestic connections.
Fig in INR Cr (unless specified) FY19 FY20 FY21 FY22E FY23E FY24E FY25E FY26E FY27E FY28E
PNG Industrial Connections (nos) 1,287 1,480 1,666 1,863 2,163 2,563 3,163 3,863 4,663 5,563
PNG Industrial Volume (mmscm) 204.4 222.2 221.5 265.1 367.4 474.4 627.0 833.5 1,089.2 1,399.7
YoY Growth (%) 8.7 (0.3) 19.7 38.6 29.1 32.2 32.9 30.7 28.5
Avg PNG industrial volume per connection (scmd) 532.7 439.9 385.8 411.7 500.0 550.0 600.0 650.0 700.0 750.0
PNG Industrial Revenue 767.7 799.8 819.9 1,137.2 1,575.7 2,034.6 2,689.2 3,574.8 4,671.7 6,003.4
YoY Growth (%) 4.2 2.5 38.7 38.6 29.1 32.2 32.9 30.7 28.5
PNG Industrial Revenue per scm (INR) 37.6 36.0 37.0 42.9 42.9 42.9 42.9 42.9 42.9 42.9
Fig in INR Cr (unless specified) FY19 FY20 FY21 FY22E FY23E FY24E FY25E FY26E FY27E FY28E
PNG Domestic Connections (nos) 3.8 4.4 4.8 5.8 7.8 10.3 13.3 16.5 20.0 24.0
PNG Domestic Volume (mmscm) 44.1 51.8 56.9 60.6 98.7 148.0 214.6 271.7 333.2 401.7
YoY Growth (%) 17.5 9.9 6.5 62.8 49.9 45.0 26.6 22.7 20.5
Avg PNG domesitc volume per connection (scmd) 0.35 0.35 0.34 0.32 0.40 0.45 0.50 0.50 0.50 0.50
PNG Domestic Revenue 108.5 136.7 153.9 194.3 316.3 474.2 687.8 870.5 1,067.9 1,287.2
YoY Growth (%) 26.0 12.6 26.3 62.8 49.9 45.0 26.6 22.7 20.5
PNG Domestic Revenue per scm (INR) 24.6 26.4 27.0 32.0 32.0 32.0 32.0 32.0 32.0 32.0
176176

( 9 t h D e c 2 0 2 1 )
For any further query, please email us on [email protected]
PNG commercial – No near-term trigger in Tier II & III cities
PNG commercial gas is used in restaurants, office spaces and hotels. Most of the cities in recent
CGD auctions are of Tier II & III levels, where the families prefer to eat home-cooked food
rather than dine out (compared to metro cities). Therefore, we are expecting comparatively
slower growth in the PNG commercial segment than CNG, PNG Industrial and PNG domestic.
ATGL’s PNG commercial rollout in the next 7 years
Source: Annual Reports & Ventura Research
As a result, we are expecting PNG commercial volumes to grow at a CAGR of 41.4% to 27
mmscm by FY24, while PNG commercial revenues are expected to record a CAGR growth of
48.3% to INR 163 cr.
Network rollout in 15 GAs is a challenge that ATGL can easily surmount
PNGRB has awarded 132 GAs in the 9th & 10th rounds of auction, compared to 50 GAs awarded
in the first 8 rounds. Out of the 132 GAs on auction, 15 GAs (~11-12% of 132 GAs) have been
acquired by ATGL (excluding IOAGL JV), making it the highest bidder in the auction.
Adani Group (promoter of ATGL) operates on a model of scale, growth and sustainability. It has
significant experience in the execution of complex infrastructure projects such as power plants,
transmission lines, ports, multimodal logistics, etc., which requires multiple statutory
approvals from several civic and governmental agencies.
Adani Group strength and expertise
Source: Company Reports
Fig in INR Cr (unless specified) FY19 FY20 FY21 FY22E FY23E FY24E FY25E FY26E FY27E FY28E
PNG Commercial Connections (nos) 2,561 2,986 3,300 3,731 4,231 4,731 5,231 5,731 6,231 6,731
PNG Commercial Volume (mmscm) 15.6 16.7 9.6 16.3 24.0 27.2 30.4 33.6 36.9 40.2
YoY Growth (%) 6.4 (42.3) 69.3 47.4 13.2 11.8 10.7 9.8 9.0
Avg PNG commercial volume per connection (scmd) 17.6 16.5 8.4 12.7 16.5 16.6 16.7 16.8 16.9 17.0
PNG Commercial Revenue 74.2 80.5 50.0 97.7 144.0 163.0 182.3 201.8 221.5 241.5
YoY Growth (%) 8.6 (37.9) 95.4 47.4 13.2 11.8 10.7 9.8 9.0
PNG Commercial Revenue per scm (INR) 47.4 48.4 52.0 60.0 60.0 60.0 60.0 60.0 60.0 60.0
The Scale
Most of the Adani Group’s businesses are among the largest in India, generating attractive economies of scale.
The Positioning
Adani group has focused on sizable infrastructure development in India with O&M benchmarked to global standards
The Credibility
Adani group is the only infrastructure investment grade bond issuer from India
177177

( 9 t h D e c 2 0 2 1 )
For any further query, please email us on [email protected]
Therefore, we believe that the CGD infrastructure rollout in a period of 8 years is an achievable
task for the Adani Group.
Healthy balance sheet and strong cash flows to ease capex pressure
ATGL's net debt to equity is 0.2X and net debt to EBITDA is 0.7X, providing sufficient room to
raise debt to fund the estimated capex of INR 9,000 cr in the next 10 years.
In addition, ATGL generates INR 600-700 cr of cash flow from operations (CFO) annually, which
accounts for 60-70% of the annual capex requirement. This cash flow will only further increase
with the network rollout and rise in gas consumption in the new GAs. We do not foresee any
significant impact on balance sheet health due to the upcoming capex of INR 9,000 cr in the
next 10 years.
Strong balance sheet and healthy cash flows to sustain ATGL’s financial health
Source: Company Reports & Ventura Research
Efficiency and Cost Optimization – Advantage ATGL
ATGL has a well-diversified natural gas mix and supply chain compared to its peers. This helps
it in generating one of the best EBITDA per scm in the industry.
• GGL has the highest volumes in the industrial segment, however its CNG and PNG
domestic volumes are low
• IGL and MGL are strong in the CNG space, however, their PNG domestic and industrial
volumes are low.
• ATGL is the only listed company with strong volumes in CNG and PNG industrial
segments, while its PNG domestic (high-cost segment) has a comparatively lower share
in total volume.
-0.4
-0.2
0.0
0.2
0.4
0.6
0.8
(1,500)
(1,000)
(500)
0
500
1,000
1,500
2,000
2,500
Expansion in new GAs would be partly funded by external debt
Total Debt Net Debt
Net Debt to Equity (X) Net Debt to EBITDA (X)
INR Cr X
(40)
(20)
0
20
40
60
80
100
120
(500)
0
500
1,000
1,500
2,000
2,500
3,000
3,500
4,000
4,500
CFO to remain strong; FCF to take capex hit
CFO FCF
CFO to EBITDA (%) FCF to Net Profit (%)
INR Cr %
178178

( 9 t h D e c 2 0 2 1 )
For any further query, please email us on [email protected]
ATGL has a fair mix of CNG & PNG
Source: Company Reports
On comparing the unit cost of peers with ATGL, we find that ATGL has the lowest OPEX cost
per scm amongst peers. This is a function of higher CNG and PNG industrial volume throughput
and better asset utilization ratio.
ATGL has the best EBITDA per scm in the industry
Source: Company Reports, Industry Reports and Ventura Research
In addition, the JV with TOTAL would be a game-changer in the coming years. TOTAL has
expertise in
• LNG business – TOTAL is the second-largest LNG player in the world. This would stand
in good stead for ATGL to source LNG at competitive rates.
• Fuel retailing – TOTAL is helping ATGL in CNG station rollout, which requires extensive
market research and demand-supply analysis, to optimize volume throughput.
Particulars ATGL GGL IGL MGL
FY21 Gas Volume (mmscm) 584 3,454 2,357 1,080
CNG Volume Share (%) 50.0 15.7 73.7 72.6
PNG Domestic Volume Share (%) 8.9 6.0 6.0 13.7
PNG Industrial/Commercial Volume Share (%) 41.1 78.3 20.3 13.7
2
4
6
8
10
12
14
16
FY18 FY19 FY20 FY21
ATGL IGL GGL MGL
INR per scm
179179

( 9 t h D e c 2 0 2 1 )
For any further query, please email us on [email protected]
IOAGPL JV – Massive volume scale up in the coming years
Indian Oil Adani Gas Pvt Ltd (IOAGPL), incorporated in Oct 2013, is an equal JV of Indian Oil
Corporation and ATGL. IOAGPL acquired the following geographies of
• Allahabad and Chandigarh GAs in the 2nd round of bidding
• Ernakulam, Panipat and Daman in the 4th round of bidding
• Dharwad and Udham Singh Nagar in the 5th round of bidding
• South Goa and Bulandshahr in the 8th round of bidding
• 9 GAs in the 9th round of bidding, and
• Jaunpur/Ghazipur (1 GA) in the 10th round of bidding
9 GAs acquired by IOAGPL in the 9th round of bidding
Source: PNGRB
As on 31st Mar 2021, the JV was operating 114 CNG stations and supplying PNG gas to 2.4 lakh
households, 158 commercial setups and 120 industrial units. ATGL consolidates 50% of
IOAGPL’s net profit with its PAT.
As per the MWP committed by IOAGPL in the recent bidding, the company has to open 876 CNG stations and 23.2 lakhs PNG connections by FY27.
IOAGPL commitment in 9th & 10th round of CGD bidding
Source: PNGRB
The JV will benefit from gaining access to IOCL's retail outlets on commercial terms. In addition,
IOCL's equity stake in Petronet LNG’s Dahej and Kochi terminals, will enable assured sourcing
of gas at competitive rates. ATGL has also offered technical expertise backed by experience in
operating CGD projects and execution skills in network rollout.
Palakkad & Thrissur Districts
(Kerala)
Kannur, Kasargod & Mahe
Districts (Kerala & Pudduchery)
Gaya & Nalanda Districts
(Bihar)
Kozhikode & Wayanad
Districts (Kerala)
Burdwan District (West
Bengal)
Panchkula, Sirmaur, Shimla &
Solan Districts (Haryana & HP)
Malappuram Districts (Kerala)Bulandshahr, Aligarh & Hathras
(UP)
Allahabad, Bhadohi &
Kausambi Districts (UP)
YearCNG Station
Progress (%)
Cummulative
CNG Stations
(nos)
PNG
Connection
Progress (%)
Cummulative
PNG Network
(nos)
Steel Pipeline
(km)
Cummulative
Steel Pipeline
(km)
FY20 0 0 0 0 5 629
FY21 15 131 10 2,32,387 20 2,516
FY22 30 263 20 4,64,774 40 5,031
FY23 45 394 30 6,97,161 60 7,547
FY24 60 526 40 9,29,548 70 8,805
FY25 75 657 60 13,94,321 80 10,062
FY26 90 788 80 18,59,095 90 11,320
FY27 100 876 100 23,23,869 100 12,578
180180

( 9 t h D e c 2 0 2 1 )
For any further query, please email us on [email protected]
PNGRB’s 11th bidding round – Target to cover India entirely under CGD
coverage
The 9th & 10th bidding rounds have increased the coverage of the network from ~20% of
population before such rounds to ~70% post completion. Recently the PNGRB announced the
11th round of CGD auction, which will add 65 GAs (covering 208 districts) to India’s current CGD
network of 226 GAs (covering 404 districts). After the completion of the 11th round, 96% of
India’s population and 86% of the country’s area would have access to the CGD network.
While ATGL was not aggressive in bidding for the 9th and 10th round, we expect them to bid to
win more aggressively in the 11th round. The incremental wins will only be growth and
profitability accretive.
CGD coverage to span across 86% of India
Source: PNGRB
CGD areas to be auctioned in the 11th round of bidding
Source: PNGRB
FY22
FY19 11th round
FY18 10th round 65 GAs
FY09-17 9th round 50 GAs
Pre-FY16 1st-8th rounds 84 GAs
Pre PNGRB 56 GAs
36 GAs
Total number
of GAs - 291
Geographical Area State Geographical Area State
Kurnool, Guntur, & Prakasam Andhra Pradesh Alirajpur, N&urbar & Barwani Maharashtra & MP
Nagaon, Morigaon, Hojai, Karbi Anglong & West Karbi Anglong Assam Koraput, Malkangiri, & Nabarangpur Odisha
Lakhimpur, Dhemaji , Darrang, Udalgiri, Sonitpur & Biswanath Chariali Assam Gajapati, K&hamal, Boudh & Sonepur Odisha
Kokrajhar & Dhubri Assam Rayagada, Kalah&i, Bolangir & Nuapada Odisha
Baksa, Barpeta, Bongaigaon, Chirang & Nalbari Assam Pathankot district Punjab
Darbhanga, Madhubani, Supaul, Sitamarhi & Sheohar Bihar Tarn Taran district Punjab
Gopalganj, Siwan, West Champaran, East Champaran & Deoria Bihar & UP Fazilka (except area already authorized), Ganganagar & Hanumangarh Punjab & Rajasthan
Baloda Bazar, Gariyab& & Raipur Chhattisgarh Bikaner & Churu Rajasthan
Kabirdham, Raj N&gaon & Kanker Chhattisgarh Jhunjhunu, Sikar & Nagaur Rajasthan
Mungeli, Bemetara, Durg, Balod & Dhamtari Chhattisgarh Dausa, Karauli, Sawai Madhopur & Tonk Rajasthan
Jashpur, Raigarh, Janjgir-Champa & Mahasamund Chhattisgarh Dharmapuri & Krishnagiri Tamil Nadu
Koriya & Surajpur Chhattisgarh Tiruvannamalai & Villupuram Tamil Nadu
Balrampur & Surguja Chhattisgarh Ariyalur & Perambalur Tamil Nadu
Kondagaon, Bastar & Sukma Chhattisgarh Namakkal & Tiruchirapalli Tamil Nadu
Narayanpur, Bijapur & Dantewada Chhattisgarh Pudukottai, Sivaganga & Thanjavur Tamil Nadu
M&i, Kullu, Kinnaur & Lahaul & Spiti Himachal Pradesh Madurai, Theni & Virudhnagar Tamil Nadu
Kangra & Chamba Himachal Pradesh Kanyakumari, Thoothukudi & Tiruneveli Kattabo Tamil Nadu
Gumla, Latehar, Lohardaga, Simdega, Garhwa & Khunti Jharkhand Dindigul & Karur Tamil Nadu
Chikkaballapur district Karnataka The Nilgiris & Erode Tamil Nadu
Idukki, Kottayam & Pathanamthitta Kerala Nizamabad, Adilabad, Nirmal, Mancherial & Kumuram Bheem Asifabad Telangana
Burhanpur, Kh&wa, Khargone & Harda MP Jogulamba Gadwal, Nagarkurnool, Mahabubnagar, Narayanpet, Telangana & Karnataka
Tikamgarh, Niwari, Chattarpur & Panna MP South Tripura & Sepahijala district Tripura
Betul, Chhindwara, Seoni & Balaghat MP Dhalai, North Tripura, Unakoti & Khowai Tripura
Damoh, Jabalpur, Katni, M&la, Umaria & Dindori MP Jammu, Udhampur, Reasi, Samba & Kathua UT of J&K
Hoshangabad, Narsinghpur, Sagar & Vidisha MP Amroha & Sambhal (except area already authorized) UP
Agar Malwa, Neemuch, M&saur & Jhalawar MP & Rajasthan Kasganj district UP
Buldana, N&ed & Parbhani Maharashtra B&a, Chitrakoot & Mahoba UP
Beed, Jalgaon & Jalna Maharashtra Pauri Garhwal, Uttarkashi, Rudraprayag & Tehri Garhwal Uttarakhand
Akola, Hingoli & Washim Maharashtra Pithoragarh, Champawat, Almora, Chamoli & Bageshwar Uttarakhand
Amravati & Yavatmal Maharashtra Purulia & Bankura West Bengal
Ch&rapur & Wardha Maharashtra East Mednipore, West Mednipore & Jhargram West Bengal
Nagpur district Maharashtra Alipurduar & Koch Bihar West Bengal
Bh&ara, Gondiya & Garchiroli Maharashtra
181181

( 9 t h D e c 2 0 2 1 )
For any further query, please email us on [email protected]
Financial Analysis & Projections
During FY19-21, ATGL’s gas volumes and revenues declined at a CAGR of 2.5% to 514 mmscm
and 0.7% to INR 1,696 cr, respectively, contributed by
• CNG volumes and revenue CAGR decline of 9.5% to 226 mmscm and 6.8% to INR 739
cr, respectively
• PNG industrial volumes and revenue CAGR of 4.1% to 222 mmscm and 3.3% to INR 820
cr, respectively
• PNG domestic volumes and revenue CAGR of 13.6% to 57 mmscm and 19.1% to INR
154 cr, respectively
• PNG commercial volumes and revenue CAGR decline of 21.6% to 10 mmscm and 17.9%
to INR 50 cr, respectively
Over the same period, the company’s EBITDA and PAT grew at a CAGR of 24.5% to INR 704 cr
and 42.3% to INR 463 cr respectively, while per scm EBITDA and PAT improved from INR 8.4
and INR 4.2 in FY19 to INR 13.7 and INR 9.0 respectively in FY21. As a result, RoE improved by
318bps (to 23.9%), however, capex in new GAs impacted RoIC, which contracted by 237bps (to
26.6%) respectively.
ATGL’s Financial Performance
(20)
(10)
0
10
20
30
40
50
60
0
200
400
600
800
1,000
1,200
1,400
1,600
FY19 FY20 FY21 FY22E FY23E FY24E
Network rollout in new GAs to improve gas volumes
Total Gas Volume YoY Growth (%)
Vol in mmscm %
51 50 44 53 55 55
38 38 43 37 34 33
8 9 11 8 9 10 3 3 2 2 2 2
FY19 FY20 FY21 FY22E FY23E FY24E
CNG proportion in volumes to remain high in the coming years
CNG PNG Industrial PNG Domestic PNG Commercial
(20)
(10)
0
10
20
30
40
50
60
70
0
1,000
2,000
3,000
4,000
5,000
6,000
FY19 FY20 FY21 FY22E FY23E FY24E
Higher volumes to drive the revenue performance
Revenue YoY Growth (%)
INR Cr %
47 48 42 48 51 51
43 41 47 41 38 37
6 7 9 7 8 9 4 4 3 4 3 3
FY19 FY20 FY21 FY22E FY23E FY24E
Volume mix to replicate in revenue bifurcation
CNG PNG Industrial PNG Domestic PNG Commercial
182182

( 9 t h D e c 2 0 2 1 )
For any further query, please email us on [email protected]
Source: ACE Equity
During H1FY22, ATGL’s gas volumes and revenues grew at a YoY rate of 61.5% to 315 mmscm
and 85.8% to INR 1,143 cr, respectively, driven by
• CNG volumes and revenue YoY growth of 91.6% to 159 mmscm and 106.3% to INR 557
cr, respectively
• PNG industrial volumes and revenue YoY growth of 51.8% to 124 mmscm and 85.5%
to INR 521 cr, respectively
• PNG domestic volumes declined at a YoY rate of 2.6% to 26 mmscm, while the
segment’s revenue grew at a YoY rate of 17.0% to INR 84 cr, respectively
• PNG commercial volumes and revenue YoY growth of 78.8% to 6 mmscm and 109.4%
to INR 36 cr, respectively
Over the same period, the company’s EBITDA and PAT grew at a YoY rate of 52.9% to INR 439
cr and 63.3% to INR 297 cr respectively, while per scm EBITDA and PAT improved to INR 13.9
and INR 9.4 respectively.
Over the forecasted period of FY21-24E, we are expecting the gas volumes and revenues to
grow at a CAGR of 41.3% to 1,451 mmscm and 45.6% to INR 5,238 cr, respectively, driven by
• CNG volumes and revenue growing at a CAGR of 52.5% to 801 mmscm and 56.3% to
INR 2,823 cr, respectively
• PNG industrial volumes and revenue growing at a CAGR of 28.9% to 474 mmscm and
35.4% to INR 2,035 cr, respectively
• PNG domestic volumes and revenue growing at a CAGR of 37.5% to 148 mmscm and
45.5% to INR 474 cr, respectively
• PNG commercial volumes and revenue growing at a CAGR of 41.4% to 27 mmscm and
48.3% to INR 163 cr, respectively
Over the same period, we are expecting EBITDA and PAT to grow at a CAGR of 33.8% to INR
1,688 cr and 38.4% to INR 1,228 cr, respectively, however, per scm EBITDA and PAT declining
to INR 11.6 and INR 8.5, respectively, by FY24. Subsequently, return ratios – RoE and RoIC will
improve by 411bps (to 28.0%) and 217bps (to 28.8%) respectively by FY24E.
0
5
10
15
0
500
1,000
1,500
2,000
FY19 FY20 FY21 FY22E FY23E FY24E
Infrastructure rollout in new GAs to increase opex for the next 4 years and impact margins
EBITDA PAT
EBITDA per scm (INR) Net per scm (INR)
INR Cr %
15
20
25
30
35
0
1,000
2,000
3,000
4,000
5,000
6,000
FY19 FY20 FY21 FY22E FY23E FY24E
Return ratios to remain subdued due to lower margins
Net Worth Invested Capital
RoE (%) RoIC (%)
INR Cr %
183183

( 9 t h D e c 2 0 2 1 )
For any further query, please email us on [email protected]
ATGL is committed to improving ESG Score
Since FY18, ATGL has worked on ESG parameters and disclosures, which has improved its
overall ESG score. The company aligned its ESG reporting standards with the Global Reporting
Initiative (GRI), increased its public disclosures, management systems and business excellence
initiatives, and remains committed to improving its ESG performance by further refining its
policies and practices, as well as strengthening information disclosure procedures.
ATGL’s Environmental Philosophy
Source: Company Reports
ATGL’s Social Philosophy
Source: Company Reports
184184

( 9 t h D e c 2 0 2 1 )
For any further query, please email us on [email protected]
ATGL’s Governance Philosophy
Source: Company Reports
185185

( 9 t h D e c 2 0 2 1 )
For any further query, please email us on [email protected]
Ventura Business Quality Score
Key Criteria Score Risk Comments
Management & Leadership
Management Quality 8 Low The management is of high quality. It has been able to deliver on guidance; investor-friendly with timely updates on developments
Promoters Holding Pledge 7 Low The promoter holding is 74.8% and there is no pledge by promoters as on 30th Sept 2021
Board of Directors Profile 7 Low The average experience of directors is >20 years with significant experience in the their respective sectors and expert areas
Industry Consideration
Industry Growth 10 Low
The PNGRB has opened 132 GAs in 9th & 10th rounds of CGD auctions, which took the total GA count under CGD to 184. The regulator has recently announced the 11th round to open 65 more GAs, which will significantly boost the opportunities for CGD sector in the coming years
Regulatory Environment or Risk 5 Medium CGD is a semi regulated market due to the restriction on gas sourcing. However, there are no regulations on pricing
Entry Barriers / Competition 8 Low CGD players get 8 years of marketing exclusivity and 25 years of infrastructure exclusivity for acquired GAs which creates strong entry barriers for other players.
Business Prospects
New Business / Client Potential 8 Low ATGL has been very aggressive in the 9th & 10th rounds of CGD auctions and acquired the highest number of GAs.
Business Diversification 8 Low ATGL has four products to market in newly acquired GAs – CNG, PNG domestic, PNG industrial and PNG commercial, which is providing sufficient room for business diversification
Market Share Potential 10 Low Post the rollout of CGD network in newly acquired GAs, ATGL will become the only pan-India CGD company and will have significant market share
Margin Expansion Potential 8 Low Focus on CNG and LNG sourcing from TOTAL at a competitive rate is the key trigger for margin expansion
Earnings Growth 8 Low Efficient rollout of CGD network in new GAs will significantly boost gas volumes and trigger the overall earnings growth momentum
Valuation and Risk
Balance Sheet Strength 8 Low ATGL’s RoIC is more than 30% and its working capital cycle is negative, which showcase strong balance sheet health
Debt Profile 5 Medium ATGL's net debt to equity is 0.2X and net debt to EBITDA is 0.7X, providing sufficient room to raise debt to fund the estimated capex of INR 9,000 cr
FCF Generation 5 Medium ATGL is in a growth phase, hence the capex is expected to remain high for the next 5 years, which could impact FCF
Dividend Policy 3 High The company has never paid a dividend in the past and its fund requirements are expected to remain high in the coming years
Total Score
Ventura Score (%)
108
72 Low
The overall risk profile of the company is good and we consider it as a LOW risk company for investments
Source: Company Reports & Ventura Research
186186

( 9 t h D e c 2 0 2 1 )
For any further query, please email us on [email protected]
Annual Report Takeaways
We analyzed the FY21 annual report of ATGL and our key observations are as follows:
Key Takeaways
• CNG network expansion – Added 102 stations (90 in new geographies), taking the total
number to 217.
• Reported a sales volume of 515.13 mmscm and achieved 2.0 mmscmd of gas volume
and crossed 2,250-inch km of steel pipe laying.
• PNG domestic connections increased by 40,939 to 0.48 million. PNG industrial and
commercial customer base expanded to 1,666 and 3300 respectively.
• Launched MyAdaniGas mobile app, which provides customers with a range of services
that can be executed at their fingertips – such as registration for a new connection,
paying bills and analysing gas consumption. Further, the billing solution is integrated
with WhatsApp. Digital payment accounted for 92% of the total number of payments
and 82% of total gas volume.
Auditor’s qualifications and significant notes to accounts
Shah Dhandaria & Co LLP is the auditor and there was no qualifications/emphasis of matters
highlighted by them in the FY21 Annual Report.
Board of Directors
ATGL has a stable team in place and no one left the board in the past 4 years, which reflects
the leadership stability in the company.
Details of Board of Directors
Source: Company Reports (Alexis Thelemaque resigned in Oct 2021)
Board Members FY18 FY19 FY20 FY21
Gautam S Adani C C C C
Jose Ignacio Sanz Saiz NEID
Maheswar Sahu NEID NEID NEID NEID
Naresh Kumar Nayyar NEID NEID NEID NEID
Chandra Iyengar NEID NEID NEID NEID
Gauri Trivedi NEID
Pranav V Adani P & ED P & ED P & ED P & NED
Alexis Thelemaque NEID NEID ED
Suresh Prakash Manglani ED ED
C - Chairman, P - Promoter
NED - Non Executive Director, ED - Executive Director
NEID - Non Exec Independent Director
187187

( 9 t h D e c 2 0 2 1 )
For any further query, please email us on [email protected]
Royalty Payments
ATGL is not paying royalty to any organization or company.
Related Party Transactions and Balances
Related party transactions remained stable in the past 3 years and have not increased with the
business.
ATGL’s Related Party Balances with Adani Group and JV Companies
Source: Annual Reports
Contingent Liabilities
Contingent Liabilities of the company are very low compared to the net worth of the company.
Most of the elements are related to minor disputes or cases with government and regulatory
authorities.
ATGL’s Contingent Liabilities
Source: Annual Reports
Related Party Balances FY18 FY19 FY20 FY21
Trade Payables 72.6 4.8 3.3 31.0
Other Current Financial Assets 3.7 3.9 15.0 9.9
Current Loans 358.9 359.0 311.2 0.0
Other Non Current Assets 10.0 0.0 4.6 1.5
Corporate Guarantee (IOAGPL) 2,471.4 3,471.9 3,533.5 3,533.5
Total 2,916.6 3,839.7 3,867.5 3,575.8
Contingent Liabilities FY18 FY19 FY20 FY21
Pending labour matters contested in various courts 0.7 1.0 1.0 1.0
Cases pending in Consumer Forums 0.0 0.0 0.0 0.8
Cases pending in MACT 0.1 0.1 0.1 0.1
In respect of Service tax, Excise Duty and VAT 53.0 59.6 27.3 29.3
In respect of Income Tax 3.5 2.2 2.2 2.7
Special Civil Suits 0.3 0.3 0.3 0.3
Case Pending in CCI 25.7 25.7 0.0 0.0
Property Tax 0.0 0.0 0.0 11.7
Stamp Duty under Gujarat Stamp Act 0.0 0.0 0.0 0.4
Total 83.2 88.8 30.9 46.2
Continget Liabilities to Net Worth (%) 9.6 8.1 2.1 2.4
188188

( 9 t h D e c 2 0 2 1 )
For any further query, please email us on [email protected]
Management Team
Source: Company Reports
Key Risks & Concerns
• A key driver for healthy margins in the CNG business is the cheaper sourcing of
domestic gas. Policy change and a decline in domestic gas allocation could impact
operating margins and cash flow.
• A delay in execution in network development and CGD infrastructure rollout could
extend the payback period for capex incurred and impact the operating cash flow and
balance sheet health
• Infrastructure bottlenecks for CNG stations due to legal issues related to land
acquisition could restrict CNG rollout and volumes. This could significantly affect the
operating performance as CNG has the highest profitability.
• Delay in infrastructure development, especially industrial corridors and highways
could restrict the volume growth in both PNG industrial gas and CNG.
• Faster EV rollout in India on the lines of China could significantly impact the long term
CNG story, on which most of the assumptions are based.
Key Person Designation Details
Mr Suresh P
ManglaniCEO
He has 29 years of varied experience in Oil & Gas projects & major specialization in conceptualizing,
negotiating, forming & successfully operating City Gas Distribution businesses and JVs. He started his
career with Kelvinator (now Whirlpool India) and subsequently worked with GAIL, Mahanagar Gas
and India Gas Solutions (JV of RIL and BP). Prior to joining ATGL, Suresh was working with Reliance
Industries ltd. as Sr. Vice President & Head of Commercial of petroleum retail business.
Mr Parag Parikh CFO
He has Masters degree in Commerce from Mumbai University and MBA degree from MET. He has an
experience of 22 years in the areas in infrastructure and energy. Prior to joining ATGL, he has worked
with Gammon Infrastructure Projects and GMR Group
189189

( 9 t h D e c 2 0 2 1 )
For any further query, please email us on [email protected]
Quarterly and Annual Performance
Source: Company Reports & Ventura Research
Fig in INR Cr (unless specified) FY19 FY20 Q1FY21 Q2FY21 Q3FY21 Q4FY21 FY21 Q1FY22 Q2FY22 Q3FY22E Q4FY22E FY22E FY23E FY24E
CNG Stations (nos) 82 115 115 134 151 217 217 224 244 281 317 317 417 517
CNG Volume (mmscm) 276.0 292.0 24.0 59.0 68.0 75.0 226.0 68.0 91.0 103.8 118.4 381.2 602.8 801.1
YoY Growth (%) 5.8 (66.2) (21.3) (9.3) 5.6 (22.6) 183.3 54.2 52.7 57.9 68.7 58.1 32.9
Avg CNG volume per staion (scmd) 9,757.0 8,121.8 2,293.4 5,151.0 5,186.9 4,529.0 3,730.0 3,388.9 4,227.1 4,300.0 4,400.0 3,912.1 4,500.0 4,700.0
CNG Revenue 850.4 948.0 77.0 193.0 218.0 251.0 739.0 235.0 322.0 367.5 419.0 1,343.4 2,124.1 2,823.0
YoY Growth (%) 11.5 (66.7) (21.5) (9.5) 9.6 (22.0) 205.2 66.8 68.6 66.9 81.8 58.1 32.9
CNG Revenue per kg (INR) 40.5 42.7 42.2 43.0 42.2 44.0 43.0 45.5 46.6 46.6 46.6 46.4 46.4 46.4
PNG Domestic Connections (nos) 3.8 4.4 4.4 4.5 4.6 4.8 4.8 4.9 5.1 5.4 5.8 5.8 7.8 10.3
PNG Domestic Volume (mmscm) 44.1 51.8 13.8 13.2 14.1 15.8 56.9 13.6 12.8 16.8 17.5 60.6 98.7 148.0
YoY Growth (%) 17.5 17.6 10.7 3.8 8.7 9.9 (2.0) (3.2) 19.3 10.7 6.5 62.8 49.9
Avg PNG domesitc volume per connection (scmd) 0.35 0.35 0.35 0.32 0.34 0.38 0.34 0.31 0.28 0.35 0.35 0.32 0.40 0.45
PNG Domestic Revenue 108.5 136.7 37.1 34.4 37.4 44.9 153.9 42.5 41.2 54.1 56.5 194.3 316.3 474.2
YoY Growth (%) 26.0 20.2 8.3 5.4 16.6 12.6 14.5 19.6 44.6 25.8 26.3 62.8 49.9
PNG Domestic Revenue per scm (INR) 24.6 26.4 26.8 26.1 26.6 28.4 27.0 31.3 32.3 32.3 32.3 32.0 32.0 32.0
PNG Commercial Connections (nos) 2,561 2,986 3,300 3,383 3,531 3,631 3,731 3,731 4,231 4,731
PNG Commercial Volume (mmscm) 15.6 16.7 1.2 2.2 2.9 3.3 9.6 2.4 3.6 4.9 5.3 16.3 24.0 27.2
YoY Growth (%) 6.4 (69.0) (47.8) (34.9) (20.1) (42.3) 99.7 67.3 69.6 59.5 69.3 47.4 13.2
Avg PNG commercial volume per connection (scmd) 17.6 16.5 0.0 0.0 0.0 0.0 8.4 7.8 11.5 15.0 16.0 12.7 16.5 16.6
PNG Commercial Revenue 74.2 80.5 6.0 11.1 14.7 18.2 50.0 13.6 22.1 29.9 32.1 97.7 144.0 163.0
YoY Growth (%) 8.6 (68.4) (45.6) (30.6) (8.9) (37.9) 127.3 99.6 103.0 76.3 95.4 47.4 13.2
PNG Commercial Revenue per scm (INR) 47.4 48.4 50.3 50.7 50.6 54.8 52.0 57.3 60.5 60.5 60.5 60.0 60.0 60.0
PNG Industrial Connections (nos) 1,287 1,480 1,666 1,682 1,733 1,793 1,863 1,863 2,163 2,563
PNG Industrial Volume (mmscm) 204.4 222.2 25.1 56.7 68.2 71.5 221.5 56.4 67.7 69.0 72.0 265.1 367.4 474.4
YoY Growth (%) 8.7 (50.8) 4.2 12.3 27.7 (0.3) 125.0 19.4 1.2 0.6 19.7 38.6 29.1
Avg PNG industrial volume per connection (scmd) 532.7 439.9 0.0 0.0 0.0 0.0 385.8 370.5 431.0 450.0 500.0 411.7 500.0 550.0
PNG Industrial Revenue 767.7 799.8 83.0 197.7 244.7 294.5 819.9 224.9 295.9 301.6 314.7 1,137.2 1,575.7 2,034.6
YoY Growth (%) 4.2 (56.5) (0.5) 14.4 50.1 2.5 170.8 49.7 23.3 6.9 38.7 38.6 29.1
PNG Industrial Revenue per scm (INR) 37.6 36.0 33.1 34.9 35.9 41.2 37.0 39.9 43.7 43.7 43.7 42.9 42.9 42.9
Total Gas Volume (mmscm) 540.2 582.6 64.1 131.1 153.1 165.7 514.0 140.4 175.1 194.6 213.2 723.3 1,092.8 1,450.7
YoY Growth (%) 7.9 (53.6) (10.3) (0.6) 13.7 (11.8) 119.0 33.6 27.1 28.7 40.7 51.1 32.7
Blended Avg Realization (INR per scm) 33.3 33.7 31.7 33.3 33.6 36.7 34.3 36.8 38.9 38.7 38.6 38.3 38.1 37.9
Revenue from operations 1,719.0 1,874.6 197.2 417.9 496.1 584.5 1,695.6 494.3 648.2 717.3 782.7 2,642.6 3,965.2 5,237.8
YoY Growth (%) 25.1 9.1 (56.2) (11.6) 1.4 26.4 (9.5) 150.7 55.1 44.6 33.9 55.8 50.1 32.1
Raw Material Cost 1,092.7 1,060.0 75.5 157.2 234.0 302.9 769.6 216.8 325.1 369.7 405.1 1,316.7 2,076.4 2,770.7
RM Cost to Sales (%) 63.6 56.5 38.3 37.6 47.2 51.8 45.4 43.9 50.2 51.5 51.8 49.8 52.4 52.9
Employee Cost 42.0 47.5 13.4 12.4 11.2 14.5 51.5 11.7 11.9 27.8 27.8 79.3 198.3 288.1
Employee Cost to Sales (%) 2.4 2.5 6.8 3.0 2.3 2.5 3.0 2.4 1.8 3.9 3.6 3.0 5.0 5.5
Other Expenses 129.7 172.4 31.0 38.7 38.1 62.4 170.1 58.7 79.7 61.1 61.1 260.7 378.4 490.8
Other Expenses to Sales (%) 7.5 9.2 15.7 9.3 7.7 10.7 10.0 11.9 12.3 8.5 7.8 9.9 9.5 9.4
EBITDA 454.6 594.8 77.4 209.5 212.8 204.7 704.3 207.1 231.4 258.7 288.6 985.9 1,312.1 1,688.1
EBITDA per scm (INR) 8.4 10.2 12.1 16.0 13.9 12.4 13.7 14.8 13.2 13.3 13.5 13.6 12.0 11.6
EBITDA Margin (%) 26.4 31.7 39.2 50.1 42.9 35.0 41.5 41.9 35.7 36.1 36.9 37.3 33.1 32.2
Net Profit 228.7 436.3 38.9 134.3 145.9 143.7 462.8 142.6 158.1 203.9 226.3 731.0 971.1 1,272.3
Net Profit per scm (INR) 4.2 7.5 6.1 10.2 9.5 8.7 9.0 10.2 9.0 10.5 10.6 10.1 8.9 8.8
Net Margin (%) 13.3 23.3 19.7 32.1 29.4 24.6 27.3 28.8 24.4 28.4 28.9 27.7 24.5 24.3
Adjusted EPS 2.1 4.0 0.4 1.2 1.3 1.3 4.2 1.3 1.4 1.9 2.1 6.6 8.8 11.6
P/E (X) 810.3 424.7 400.4 253.5 190.8 145.7
Adjusted BVPS 10.0 13.4 17.6 23.6 31.1 40.3
P/BV (X) 168.2 126.0 95.8 71.5 54.2 41.8
Enterprise Value 1,85,551 1,85,630 1,85,794 1,85,492 1,85,902 1,86,123
EV/EBITDA (X) 408.1 312.1 263.8 188.2 141.7 110.3
Net Worth 1,102.0 1,470.9 1,933.8 2,591.7 3,417.1 4,434.9
Return on Equity (%) 20.8 29.7 23.9 28.2 28.4 28.7
Capital Employed 1,495.9 1,873.9 2,422.1 2,953.2 4,084.4 5,305.9
Return on Capital Employed (%) 16.6 23.1 19.8 22.9 21.5 21.3
Invested Capital 1,336.2 1,784.4 2,411.2 2,767.0 4,002.5 5,241.5
Return on Invested Capital (%) 29.0 30.5 26.6 32.7 29.3 28.8
Cash Flow from Operations 356.1 492.4 653.5 892.4 1,207.4 1,565.7
Cash Flow from Investing 791.0 (461.0) (770.5) (537.0) (1,426.0) (1,463.7)
Cash Flow from Financing (1,077.1) (102.0) 38.6 (180.5) 113.8 (120.0)
Net Cash Flow 70.0 (70.6) (78.4) 175.0 (104.8) (18.0)
Free Cash Flow 80.6 45.9 (104.2) (185.0) (6.4) 295.8
FCF to Net Profit (%) 35.3 10.5 (22.5) (25.3) (0.7) 23.2
FCF to Net Worth (%) 7.3 3.1 (5.4) (7.1) (0.2) 6.7
Total Debt 394.0 403.0 488.3 361.5 667.3 871.0
Net Debt 234.2 313.6 477.4 175.3 585.4 806.6
Net Debt to Equity (X) 0.2 0.2 0.2 0.1 0.2 0.2
Net Debt to EBITDA (X) 0.5 0.5 0.7 0.2 0.4 0.5
Interest Coverage Ratio (X) 4.3 13.3 15.9 23.6 25.4 21.8
190190

( 9 t h D e c 2 0 2 1 )
For any further query, please email us on [email protected]
Summary of Management Commentary and Quarterly Performance over last few quarters
Key Criteria View Comments Q3FY21
Business Performance POSITIVE
CNG volumes and reveneue declined at a YoY rate of 9.3% to 68 mmscm and 9.5% to INR 218 cr respectively. CNG station count stood at 151 (openned 7 stations during the quarter)
PNG industrial volumes and reveneue grew at a YoY rate of 12.3% to 68 mmscm and 14.4% to INR 245 cr respectively
PNG domestic volumes and reveneue grew at a YoY rate of 3.8% to 14 mmscm and 5.4% to INR 37 cr respectively. Total connections stood 4.6 lakhs (connected 0.1 lakh households during the quarter)
PNG commercial volumes and reveneus declined at a YoY rate of 34.9% to 2.9 mmscm and 30.6% to INR 15 cr respectively.
Total volumes declined at a YoY rate of 0.6% to 153 mmscm, while revenue grew at a YoY rate of 1.4% to INR 496 cr respectively. EBITDA and PAT grew at a YoY rate of 36.3% to INR 213 cr and 26.8% to INR 146 cr, while per scm EBITDA and PAT sood at INR 13.9 and INR 9.5 resepctively
Outlook & Strategy POSITIVE Annual capex for ATGL would be in the range of INR 1,000 cr for the expansion in new GAs. A similar capex is expected in IOAGPL. The CGD rollout in new geographies has started and the focus is on the faster rollout of CNG
Q4FY21
Business Performance POSITIVE
CNG volumes and reveneus grew at a YoY rate of 5.6% to 75 mmscm and 9.6% to INR 251 cr respectively. CNG station count stood at 217 (openned 66 stations during the quarter)
PNG industrial volumes and reveneue grew at a YoY rate of 27.7% to 72 mmscm and 50.1% to INR 295 cr respectively
PNG domestic volumes and reveneue grew at a YoY rate of 8,7% to 16 mmscm and 16.6% to INR 45 cr respectively. Total connections stood 4.8 lakhs (connected 0.2 lakh households during the quarter)
PNG commercial volumes and reveneue declined at a YoY rate of 20.1% to 3 mmscm and 8.9% to INR 18 cr respectively.
Total volumes and reveneue grew at a YoY rate of 13.7% to 166 mmscm and 26.4% to INR 585 cr respectively. EBITDA and PAT grew at a YoY rate of 21.9% to INR 205 cr and 18.6% to INR 144 cr, while per scm EBITDA and PAT sood at INR 12.4 and INR 8.7 resepctively
Outlook & Strategy POSITIVE Annual capex for ATGL would be in the range of INR 1,000-1,200 cr for the expansion in new GAs. A similar capex is expected in IOAGPL. Company added 102 stations (90 in new geographies), taking the total number to 217. Targeting to open 100 stations annually.
Q1FY22
Business Performance POSITIVE
CNG volumes and reveneue grew at a YoY rate of 183.3% to 68 mmscm and 205.2% to INR 235 cr respectively. CNG station count stood at 224 (openned 7 stations during the quarter)
PNG industrial volumes and reveneue grew at a YoY rate of 125.0% to 56 mmscm and 170.8% to INR 225 cr respectively
PNG domestic volumes declined at a YoY rate of 2.0% to 14 mmscm, segment’s revenue grew at a YoY rate of 14.5% to INR 43 cr respectively. Total connections stood 4.9 lakhs (connected 0.1 lakh households during the quarter)
PNG commercial volumes and reveneue grew at a YoY rate of 99.7% to 2 mmscm and 127.3% to INR 14 cr respectively.
Total volumes and reveneue grew at a YoY rate of 119.0% to 140 mmscm and 150.7% to INR 494 cr respectively. EBITDA and PAT grew at a YoY rate of 167.7% to INR 207 cr and
191191

( 9 t h D e c 2 0 2 1 )
For any further query, please email us on [email protected]
198.7% to INR 143 cr, while per scm EBITDA and PAT sood at INR 14.8 and INR 10.2 resepctively
Outlook & Strategy POSITIVE Annual capex for ATGL would be in the range of INR 1,000-1,200 cr for the expansion in new GAs. A similar capex is expected in IOAGPL
Q2FY22
Business Performance POSITIVE
CNG volumes and reveneue grew at a YoY rate of 54.2% to 91 mmscm and 66.8% to INR 322 cr respectively. CNG station count stood at 244 (openned 20 stations during the quarter)
PNG industrial volumes and reveneue grew at a YoY rate of 19.4% to 68 mmscm and 49.7% to INR 296 cr respectively
PNG domestic volumes declined at a YoY rate of 3.2% to 13 mmscm, while the segment’s revenue grew at a YoY rate of 19.6% to INR 41 cr. Total connections stood 5.1 lakhs (connected o,1 lakh households during the quarter)
PNG commercial volumes and reveneue grew at a YoY rate of 19.4% to 68 mmscm and 49.7% to INR 296 cr respectively.
Total volumes and reveneue grew at a YoY rate of 33.6% to 175 mmscm and 55.1% to INR 648 cr respectively. EBITDA and PAT grew at a YoY rate of 10.5% to INR 231 cr and 17.1% to INR 158 cr, while per scm EBITDA and PAT sood at INR 13.2 and INR 9.9 resepctively
Outlook & Strategy POSITIVE Annual capex for ATGL would be in the range of INR 1,000-1,200 cr for the expansion in new GAs. A similar capex is expected in IOAGPL
Source: Company Reports & Ventura Research
192192

( 9 t h D e c 2 0 2 1 )
For any further query, please email us on [email protected]
Financial Analysis & Projections
Fig in INR Cr (unless specified) FY20 FY21 FY22E FY23E FY24E Fig in INR Cr (unless specified) FY20 FY21 FY22E FY23E FY24E
Income Statement Per share data & Yields
Revenue 1,874.6 1,695.6 2,642.6 3,965.2 5,237.8 Adjusted EPS (INR) 4.0 4.2 6.6 8.8 11.6
YoY Growth (%) 9.1 (9.5) 55.8 50.1 32.1 Adjusted Cash EPS (INR) 4.4 4.8 7.4 10.1 13.2
Raw Material Cost 1,060.0 769.6 1,316.7 2,076.4 2,770.7 Adjusted BVPS (INR) 13.4 17.6 23.6 31.1 40.3
RM Cost to Sales (%) 56.5 45.4 49.8 52.4 52.9 Adjusted CFO per share (INR) 4.5 5.9 8.1 11.0 14.2
Employee Cost 47.5 51.5 79.3 198.3 288.1 CFO Yield (%) 0.3 0.4 0.5 0.7 0.8
Employee Cost to Sales (%) 2.5 3.0 3.0 5.0 5.5 Adjusted FCF per share (INR) 0.4 (0.9) (1.7) (0.1) 2.7
Other Expenses 172.4 170.1 260.7 378.4 490.8 FCF Yield (%) 0.0 (0.1) (0.1) (0.0) 0.2
Other Exp to Sales (%) 9.2 10.0 9.9 9.5 9.4
EBITDA 594.8 704.3 985.9 1,312.1 1,688.1 Solvency Ratio (X)
Margin (%) 31.7 41.5 37.3 33.1 32.2 Total Debt to Equity 0.3 0.3 0.1 0.2 0.2
YoY Growth (%) 30.8 18.4 40.0 33.1 28.7 Net Debt to Equity 0.2 0.2 0.1 0.2 0.2
Depreciation & Amortization 50.7 62.5 81.8 137.8 179.2 Net Debt to EBITDA 0.5 0.7 0.2 0.4 0.5
EBIT 544.1 641.8 904.0 1,174.3 1,508.9
Margin (%) 29.0 37.9 34.2 29.6 28.8 Return Ratios (%)
YoY Growth (%) 40.5 18.0 40.9 29.9 28.5 Return on Equity 29.7 23.9 28.2 28.4 28.7
Other Income 44.4 44.4 39.3 41.8 52.9 Return on Capital Employed 23.1 19.8 22.9 21.5 21.3
Finance Cost 41.1 40.5 38.2 46.3 69.2 Return on Invested Capital 30.5 26.6 32.7 29.3 28.8
Interest Coverage (X) 13.3 15.9 23.6 25.4 21.8
Exceptional Item 0.0 (14.5) 0.0 0.0 0.0 Working Capital Ratios
PBT 547.4 631.2 905.1 1,169.8 1,492.6 Payable Days (Nos) 16 25 25 25 25
Margin (%) 29.2 37.2 34.3 29.5 28.5 Inventory Days (Nos) 8 11 10 10 10
YoY Growth (%) 53.5 15.3 43.4 29.2 27.6 Receivable Days (Nos) 12 22 20 20 20
Tax Expense 111.2 159.3 228.8 294.4 375.7 Net Working Capital Days (Nos) 4 9 5 5 5
Tax Rate (%) 20.3 25.2 25.3 25.2 25.2 Net Working Capital to Sales (%) 1.1 2.4 1.4 1.4 1.4
PAT 436.2 472.0 676.3 875.4 1,116.9
Margin (%) 23.3 27.8 25.6 22.1 21.3 Valuation (X)
YoY Growth (%) 90.7 8.2 43.3 29.4 27.6 P/E 424.7 400.4 253.5 190.8 145.7
Min Int/Sh of Assoc 0.1 (9.1) 54.6 95.7 155.4 P/BV 126.0 95.8 71.5 54.2 41.8
Net Profit 436.3 462.8 731.0 971.1 1,272.3 EV/EBITDA 312.1 263.8 188.2 141.7 110.3
Margin (%) 23.3 27.3 27.7 24.5 24.3 EV/Sales 99.0 109.6 70.2 46.9 35.5
YoY Growth (%) 90.8 6.1 57.9 32.8 31.0
Cash Flow Statement
Balance Sheet PBT 547.4 631.2 905.1 1,169.8 1,492.6
Share Capital 110.0 110.0 110.0 110.0 110.0 Adjustments 53.1 201.9 213.1 350.6 466.6
Total Reserves 1,360.9 1,823.8 2,481.7 3,307.1 4,324.9 Change in Working Capital 3.0 (20.3) 3.0 (18.6) (17.9)
Shareholders Fund 1,470.9 1,933.8 2,591.7 3,417.1 4,434.9 Less: Tax Paid (111.2) (159.3) (228.8) (294.4) (375.7)
Long Term Borrowings 297.6 307.9 250.0 500.0 650.0 Cash Flow from Operations 492.4 653.5 892.4 1,207.4 1,565.7
Deferred Tax Assets / Liabilities 90.3 110.5 110.5 110.5 110.5 Net Capital Expenditure (441.5) (606.3) (1,000.0) (1,100.0) (1,150.0)
Other Long Term Liabilities 22.4 38.6 60.1 90.2 119.2 Change in Investments (19.5) (164.2) 463.0 (326.0) (313.7)
Long Term Trade Payables 0.0 0.0 0.0 0.0 0.0 Cash Flow from Investing (461.0) (770.5) (537.0) (1,426.0) (1,463.7)
Long Term Provisions 4.2 4.6 7.0 17.6 25.6 Change in Borrowings 5.3 79.1 (69.2) 305.8 203.7
Total Liabilities 1,885.2 2,395.4 3,019.4 4,135.4 5,340.2 Less: Finance Cost (41.1) (40.5) (38.2) (46.3) (69.2)
Net Block 1,198.0 1,379.3 2,297.5 3,259.7 4,230.5 Proceeds from Equity 0.0 0.0 0.0 0.0 0.0
Capital Work in Progress 342.1 696.5 0.0 0.0 0.0 Buyback of Shares 0.0 0.0 0.0 0.0 0.0
Intangible assets under development 0.0 0.0 0.0 0.0 0.0 Dividend Paid (66.3) 0.0 (73.1) (145.7) (254.5)
Non Current Investments 281.6 417.3 650.4 975.9 1,289.1 Cash flow from Financing (102.0) 38.6 (180.5) 113.8 (120.0)
Long Term Loans & Advances 96.6 132.1 205.9 309.0 408.1 Net Cash Flow (70.6) (78.4) 175.0 (104.8) (18.0)
Other Non Current Assets 0.0 355.1 553.4 830.4 1,096.9 Forex Effect 0.0 0.0 0.0 0.0 0.0
Net Current Assets (33.0) (584.9) (687.8) (1,239.5) (1,684.4) Opening Balance of Cash 159.3 88.6 10.2 185.2 80.4
Total Assets 1,885.2 2,395.4 3,019.4 4,135.4 5,340.2 Closing Balance of Cash 88.6 10.2 185.2 80.4 62.4
193193

( 9 t h D e c 2 0 2 1 )
For any further query, please email us on [email protected]
This page left intentionally blank
194194

( 9 t h D e c 2 1 )
For any further query, please email us on [email protected]
Adani Enterprises Limited
A goose that lays golden eggs
195195

( 9 t h D e c 2 0 2 1 )
For any further query, please email us on [email protected]
AEL stands among the few listed company to have generated >30% CAGR in wealth for
its investors Over the years, AEL has incubated various businesses of the group like
transmission, renewable energy, city gas distribution etc which have themselves gone
on to become big business themselves. In its 2nd phase, AEL is currently incubating
several new businesses like airports, data centres, solar manufacturing, roads, defence
& green businesses. Adani Wilmar a JV company is on the verge of unlocking value
through its proposed IPO.
With most of the business verticals in the investment phase, profit metrics are in the
nascent stage and do not reflect steady state run-rates. Hence the valuations do not
capture the true long term potential of these incubated businesses. We initiate
coverage on AEL with a BUY rating for long term given high valuations. We remain
confident of the company’s ability to turn its new set of businesses into giants and
unlock value from them either through a stake sale to a strategic investor or through
direct listing once they cross the threshold of steady state run rates.
Over FY21-24, we expect AEL’s total revenues to grow at a CAGR of 20.6% to INR
69,413.2 cr over FY21-24E owing to:
• 62.8% CAGR growth in revenues of mining business
• 10.9% CAGR growth in revenues of IRM business
• 44.5% CAGR growth in revenues of solar business
• 5.5% CAGR growth in revenues of others segment (consisting of defence, roads,
agro products etc).
• Airports revenues to touch INR 8,100 cr by FY24.
AEL’s data centre and edible oil business are housed in separate JV’s with EdgeConneX
and Wilmar group respectively with 50% stake in each. EBITDA is expected to grow by
54.5% CAGR in FY21-24 to INR 9,235.1 cr with margins at 13.3% in FY24 (+697bps over
FY21). However, most of the new businesses are still in investment phase & hence net
earnings are expected to grow by 10.0% CAGR to INR 1,227.1 cr over the same period.
Key Financial Data (INR Cr, unless specified)
Revenue EBITDA
Net Profit
EBITDA (%)
Net Profit
(%) EPS (₹)
BVPS (₹)
RoE (%)
RoIC (%)
P/E (X) P/BV
(X)
EV/ EBITDA
(X)
FY20 43,403 2,284 1,138 5.3 2.6 10.3 154.1 6.7 7.2 166.5 11.2 86.6
FY21 39,537 2,505 923 6.3 2.3 8.4 156.0 5.4 6.4 205.4 11.0 81.0
FY22E 54,207 3,564 835 6.6 1.5 7.6 172.3 4.4 4.7 227.0 10.0 62.9
FY23E 64,877 7,173 1,020 11.1 1.6 9.3 181.6 5.1 7.5 185.8 9.5 34.0
FY24E 69,413 9,235 1,227 13.3 1.8 11.2 192.8 5.8 8.6 154.4 8.9 27.4
CMP INR 1,723 Target: INR 1,889 in 24 months Upside potential: 10%
A goose that lays golden eggs
Industry Diversified
Scrip Details
Face Value (INR) 1.0
Market Cap (INR Cr) 189,159
Price (INR) 1,723
No of Shares O/S (Cr) 109.98
3M Avg Vol (000) 3,355.00
52W High/Low (INR) 1,788/409
Dividend Yield (%) 0.0
Shareholding (%) Sept 2021
Promoter 74.9
Institution 21.9
Public 3.2
TOTAL 100.0
Price Chart
-
500
1,000
1,500
2,000
- 10,000 20,000 30,000 40,000 50,000 60,000 70,000
De
c-15
De
c-17
De
c-19
De
c-21
SENSEX- LHS AEL
Adani Enterprises Ltd
196196
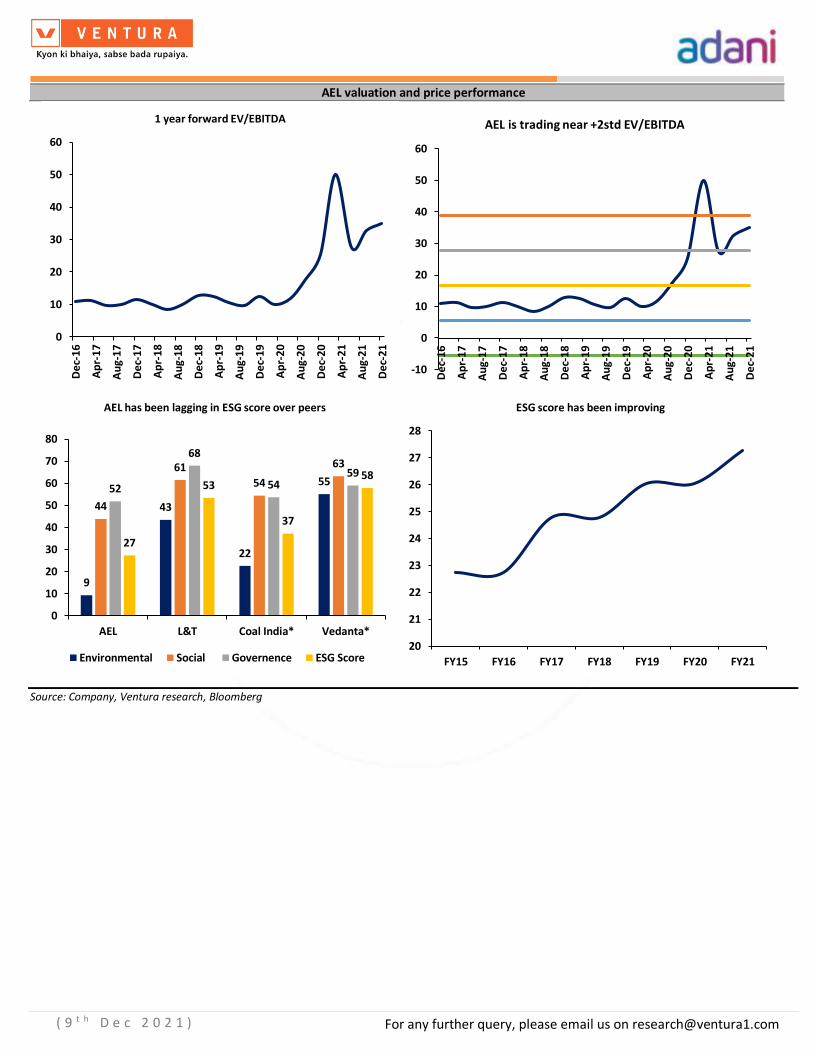
( 9 t h D e c 2 0 2 1 )
For any further query, please email us on [email protected]
AEL valuation and price performance
Source: Company, Ventura research, Bloomberg
0
10
20
30
40
50
60
De
c-16
Ap
r-1
7
Au
g-17
De
c-17
Ap
r-1
8
Au
g-18
De
c-18
Ap
r-1
9
Au
g-19
De
c-19
Ap
r-2
0
Au
g-20
De
c-20
Ap
r-2
1
Au
g-21
De
c-21
1 year forward EV/EBITDA
-10
0
10
20
30
40
50
60
De
c-16
Ap
r-17
Au
g-17
De
c-17
Ap
r-18
Au
g-18
De
c-18
Ap
r-19
Au
g-19
De
c-19
Ap
r-20
Au
g-20
De
c-20
Ap
r-21
Au
g-21
De
c-21
AEL is trading near +2std EV/EBITDA
9
43
22
55
44
61
54
63
52
68
5459
27
53
37
58
0
10
20
30
40
50
60
70
80
AEL L&T Coal India* Vedanta*
AEL has been lagging in ESG score over peers
Environmental Social Governence ESG Score20
21
22
23
24
25
26
27
28
FY15 FY16 FY17 FY18 FY19 FY20 FY21
ESG score has been improving
197197

( 9 t h D e c 2 0 2 1 )
For any further query, please email us on [email protected]
Valuation
AEL is a combination of various businesses with its own set of scalability, maturity phase
and challenges. Hence, we have used a SOTP method to value the various businesses of the
group. Also, unlike traditional holding companies which have never looked at value
unlocking actively, AEL has a history of demergers and subsequent listing of those
businesses (once they reach a given scale and threshold) and hence we have not applied
any holding company discount in our valuation methodology.
Fair value of AEL based on existing businesses
Stake FY24 EBIT
INR cr EV/EBIT
(x) FY24 PAT
INR cr PE (x)
Implied value INR
cr Attributable value INR cr
Mining 100% 1,303 25 32,581 32,581
IRM 100% 890 15 13,344 13,344
Airports without MIAL* *75% 1,074 50 53,696 40,272
MIAL* *51% 1,356 55 74,584 38,038
Solar 74% 2,214 45 99,648 73,740 Roads, Water, Agro, Defence 100% 441 35 15,441 15,441
Less Net debt FY24* (31,831)
Attributable Market value of standalone and subsidiaries 181,586
Data Centre 50% 221 35 7,735 3,868
AWL 50% 1,438 31 44,524 22,262
Fair value of all businesses in INR cr 207,715
No of shares in cr 110
Value per share in INR 1,889
Source: Ventura Research
*We believe that there are multiple opportunities for maximizing non aero revenues
available to the airport business which include hospital and wellness chains, hoteling and
exhibition and convention centres and gaming/leisure. With a view to providing world class
services, we believe that the airport vertical would enter into JVs with specialty firms
and offer promising value unlocking potential over the medium to long term.
198198

( 9 t h D e c 2 1 )
For any further query, please email us on [email protected]
Valuation and Comparable Metric of Domestic and Global companies
Source: Company, Ventura research
PEG
Company Name Mkt Cap Price FY24 2022 2023 2024 2022 2023 2024 2022 2023 2024 2022 2023 2024 2022 2023 2024 2022 2023 2024 2020 2021 2022 2023 2024 2022 2023 2024 2022 2023 2024
Domestic Peers in cr INR
AEL 183,447 1,668 15.0 4.0 3.7 3.6 61.2 33.2 26.8 87.2 42.5 34.0 219.8 179.8 149.5 4.4 5.1 5.8 4.7 7.5 8.6 43,403 39,537 54,208 64,877 69,413 6.6 11.1 13.3 1.5 1.6 1.8
Larsen & Toubro 250,904 1,778 2.2 2.3 2.1 1.8 19.5 16.4 14.3 22.5 19.1 16.3 24.8 19.8 17.2 12.3 13.9 14.4 8.4 9.4 10.4 144,308 135,979 156,330 174,937 202,684 11.8 12.6 12.6 6.5 7.2 7.2
KNR Infra 7,685 274 2.3 2.2 1.8 1.6 11.5 9.2 8.6 15.2 12.3 10.3 24.6 11.0 15.5 12.9 24.9 15.4 23.3 24.1 25.4 2,380 2,904 3,338 4,053 4,435 19.2 19.7 18.9 9.4 17.2 11.2
PNC Infratech 7,674 301 0.8 1.2 1.0 1.0 9.0 7.4 7.4 9.5 7.9 8.4 18.0 15.3 10.8 12.6 12.6 17.0 25.2 25.7 21.1 5,391 5,788 6,060 7,175 7,701 13.5 13.7 13.9 7.0 7.0 9.3
Ashoka Buildcon 2,699 96 5.5 0.5 0.4 0.4 1.8 1.5 1.5 2.1 1.8 4.9 11.7 8.5 9.3 15.3 17.1 6.8 80.3 80.2 13.3 4,774 4,992 5,739 6,363 6,917 28.0 28.0 27.8 4.0 5.0 4.2
Dilip Buildcon 7,753 530 0.2 0.9 0.7 0.6 6.5 5.1 3.7 9.3 6.8 5.1 15.7 10.7 8.5 9.5 12.3 14.8 14.3 18.1 24.1 9,274 10,168 11,050 13,040 15,000 14.1 14.7 15.0 4.5 5.6 6.1
HUL 551,014 2,349 3.1 10.6 9.4 8.5 42.6 36.6 32.1 46.2 39.3 34.1 61.0 51.8 45.6 18.6 21.2 23.5 28.9 35.0 41.0 39,238 47,028 51,306 57,210 63,436 24.8 25.8 26.4 17.6 18.6 19.0
Marico 67,853 527 2.7 7.1 6.4 5.8 37.2 31.7 27.8 40.2 34.1 29.8 51.4 43.9 38.7 36.2 38.3 39.1 59.9 67.0 67.7 7,254 8,048 9,446 10,413 11,584 19.0 20.2 20.7 14.0 14.9 15.1
ITC 273,495 221 1.3 4.9 4.4 4.2 13.4 11.7 11.2 14.3 12.3 11.7 17.8 15.9 14.9 24.7 20.5 27.8 32.4 29.5 38.1 48,979 53,155 55,076 59,905 64,177 36.4 37.4 37.2 27.9 28.8 28.5
HAL 43,619 1,311 1.1 1.4 1.2 1.0 6.0 5.0 4.3 7.8 6.5 5.6 12.4 11.1 10.2 19.9 19.4 18.2 53.7 61.5 59.1 21,438 22,755 24,294 25,935 28,792 23.2 23.8 23.6 14.5 15.2 14.8
Cochin Shipyard Ltd. 4,488 341 1.6 0.6 0.7 0.7 2.9 3.5 3.7 2.7 3.6 4.0 6.9 6.6 6.5 14.6 14.0 12.3 37.7 24.4 18.1 3,422 2,819 3,612 4,075 3,929 21.8 20.8 19.5 17.9 16.6 17.4
Bharat Dynamics 7,556 412 0.2 1.9 1.5 1.3 9.1 6.5 5.5 12.3 8.1 6.6 15.7 11.6 10.1 15.5 17.7 16.6 37.2 40.3 35.3 2,985 1,914 2,984 3,772 4,153 20.9 22.7 23.5 16.1 17.2 18.0
BEL 50,206 205 1.0 2.9 2.6 2.1 13.3 11.6 9.1 14.8 12.5 10.2 20.7 18.3 15.6 19.4 19.4 20.1 34.6 36.4 44.9 12,637 14,109 16,093 18,129 21,004 21.9 22.0 23.0 15.1 15.1 15.3
Vedanta 129,098 344 0.7 1.3 1.3 1.3 3.5 3.4 3.6 4.5 4.2 4.8 7.1 7.4 7.9 25.6 22.0 18.4 37.3 36.6 29.6 83,545 88,021 110,107 110,796 108,000 37.5 37.0 36.4 16.5 15.8 15.1
NMDC 40,369 137 (5.0) 1.4 1.6 1.6 3.0 4.0 4.0 3.1 4.2 5.0 4.5 6.3 6.7 25.7 16.6 14.9 37.6 25.1 20.1 11,699 15,370 25,520 21,695 18,327 47.9 40.6 39.3 35.5 29.6 32.9
Tata power 71,959 221 0.7 2.6 2.4 2.1 13.7 12.0 9.8 20.3 16.8 15.1 38.2 30.8 24.9 8.5 9.7 11.4 9.0 10.5 11.5 29,136 32,468 42,208 45,983 52,298 19.1 20.0 21.2 4.5 5.1 5.5
Thermax 20,551 1,717 1.0 3.2 2.8 2.4 38.9 30.4 25.6 50.7 37.9 30.9 56.6 44.6 37.6 10.0 11.6 12.3 20.5 25.5 27.2 5,731 4,791 5,798 6,706 7,467 8.3 9.1 9.6 6.3 6.9 7.3
KEC International 10,998 427 0.5 0.9 0.8 0.7 9.9 7.7 6.5 11.4 8.7 7.2 17.5 13.2 11.1 16.3 18.3 18.3 20.6 24.4 26.5 11,765 13,114 14,573 16,231 17,730 8.6 9.7 10.1 4.3 5.1 5.6
Global Peers in mn US $
Ferrovial SA 21,482 29 0.6 3.3 3.2 3.0 32.2 27.3 23.2 46.9 38.3 29.9 86.3 51.6 33.0 7.2 12.2 21.4 7.9 9.6 13.9 7,240 7,352 7,602 7,792 8,046 10.1 11.7 13.0 3.3 5.3 8.1
Skanska AB 9,924 24 11.5 0.6 0.5 0.5 8.6 7.7 7.5 10.4 9.7 8.7 13.0 12.6 11.2 14.1 13.6 14.2 17.8 17.9 17.6 17,480 16,811 17,813 18,496 19,425 6.4 6.8 7.3 4.3 4.2 4.4
Sumitomo Corp 17,197 14 0.5 0.8 0.8 0.7 13.0 14.6 14.5 20.4 24.7 23.1 6.1 6.5 6.6 11.7 10.3 9.4 4.1 3.3 3.3 48,752 43,817 46,683 47,241 48,476 6.1 5.2 5.0 6.1 5.6 5.4
WSP Global Inc 16,274 138 2.2 2.5 2.4 2.3 14.8 13.8 13.2 21.6 21.7 20.9 32.3 29.0 27.3 12.1 12.1 12.4 16.0 14.4 13.3 6,571 6,205 6,873 7,174 7,507 16.7 17.3 16.9 7.3 7.8 8.2
Mastec Inc 6,701 90 1.6 0.9 0.8 0.7 8.1 6.9 6.3 14.3 11.3 9.4 15.9 13.9 13.0 15.4 15.7 17.4 14.9 18.1 23.9 6,321 8,030 8,640 9,389 9,841 10.8 11.0 10.9 4.9 5.1 5.2
Construction Partners 1,818 35 0.5 1.8 1.6 1.5 15.5 12.9 12.1 34.3 25.8 19.5 44.5 33.8 25.8 8.8 10.4 11.9 9.1 11.7 13.8 786 911 1,125 1,249 1,339 11.4 12.0 12.5 3.6 4.3 5.3
China Telecom Corp 57,192 0 1.0 0.8 0.8 1.5 2.9 2.8 3.1 10.8 10.0 8.5 13.2 12.1 10.5 3.4 3.6 4.0 4.2 4.5 5.0 56,573 68,324 73,126 77,568 81,814 28.6 27.9 27.6 5.9 6.1 6.7
Equinix Inc 71,908 799 2.7 11.9 11.2 1.5 25.3 23.4 22.0 68.2 61.1 48.6 98.9 81.6 69.7 6.9 8.4 9.4 5.2 5.7 12.7 5,999 6,628 7,168 7,737 8,337 47.2 47.7 47.6 10.1 11.4 12.4
KDDI America 66,337 29 13.6 1.5 1.5 1.5 4.4 4.4 4.2 7.5 7.5 6.9 11.2 10.9 10.5 13.0 12.7 12.2 19.2 18.0 18.7 48,176 50,114 47,818 48,126 48,692 33.4 33.2 33.2 12.4 12.7 12.9
Sydney airport 15,969 6 (0.2) 27.5 19.7 1.5 36.0 24.0 20.1 70.1 37.8 23.1 298.7 59.1 44.4 11.1 123.7 110.0 5.0 9.5 98.2 555 429 787 1,105 1,296 76.5 82.1 84.9 6.8 24.5 27.8
Auckland International Airport 7,802 5 (2.5) 37.8 21.4 1.5 71.9 30.6 22.7 217.9 47.0 27.5 4,557.3 66.5 40.9 0.0 2.1 3.5 0.6 2.9 5.1 360 192 233 415 535 52.5 69.9 74.6 0.7 28.3 35.7
Hainan Meilan International airport1,530 3 0.6 5.3 4.1 1.5 9.5 7.1 7.2 15.3 9.5 6.3 14.2 10.4 9.4 13.4 15.7 15.2 10.2 15.5 22.1 197 294 384 452 533 56.2 57.5 63.3 28.0 32.7 30.6
EV/Sales (X) Sales EBITDA Margin (%) Net Margin (%)RoIC (%)EV/EBIT (X) RoE (%)P/E (X)EV/EBITDA (X)
199199

( 9 t h D e c 2 1 )
For any further query, please email us on [email protected]
AEL valuations need to be seen in the context with the growth potential that it offers
Source: Ventura Research, ACE Equity & Bloomberg, Size of bubble indicates revenue size
AEL L&T
KNR
Ashoka
DBLKEC
HUL
Marico
ITC
HAL
Cochin
Bharat Dynamics
BEL
0
10
20
30
40
50
60
70
80
0.0 0.5 1.0 1.5 2.0 2.5 3.0 3.5 4.0 4.5 5.0
FY24
Ro
IC %
FY24 EV/EBITDA/ (EBITDA CAGR)
AEL
L&T
KNR
PNCAshoka
DBL
KECHUL
Marico
ITCHAL
Cochin
Bharat Dynamics
BEL
0
5
10
15
20
25
30
35
0 5 10 15 20 25 30 35 40 45
FY24
rev
en
ue
CA
GR
%
EBIT margin %
200200

( 9 t h D e c 2 0 2 1 )
For any further query, please email us on [email protected]
Source- Company, Ventura research, Airports is merged in other segments till FY21 post which it has been given as a separate segment
(20)
(10)
0
10
20
30
40
0
10,000
20,000
30,000
40,000
50,000
60,000
70,000
80,000
FY20 FY21 FY22E FY23E FY24E
Reveneus are expected to grow at 20.6% over FY21-24E
Integrated resource mgmt Mining except Carmichael)
Solar manufacturing Others*
Airports* YoY Growth (%)
68%57% 55% 47% 44%
4%5% 9%
12% 12%
5%7% 7% 11% 12%
22% 31% 25% 22% 21%
0% 0% 4% 9% 11%
0%
20%
40%
60%
80%
100%
FY20 FY21 FY22E FY23E FY24E
Share of new age business like airports, solar, defence is expected to increase going forward
Integrated resource mgmt Mining except Carmichael)
Solar manufacturing Others*
Airports*
0
2
4
6
8
10
12
14
0
1,000
2,000
3,000
4,000
5,000
6,000
7,000
8,000
9,000
10,000
FY20 FY21 FY22E FY23E FY24E
EBITDA/Net profit is expected to grow at 54.5%/10.0% CAGR over FY21-24
EBITDA- LHS Net Profit- LHS
EBITDA Margin (%) Net Margin (%)
0
1
2
3
4
5
6
7
8
9
0
10,000
20,000
30,000
40,000
50,000
60,000
70,000
80,000
90,000
FY20 FY21 FY22E FY23E FY24E
Return ratios are expected to remain subdued due to high capex over next 3 years
Net Worth- LHS Invested Capital- LHS
RoE (%) RoIC (%)
0
2
4
6
8
10
12
0
10,000
20,000
30,000
40,000
50,000
60,000
70,000
80,000
FY20 FY21 FY22E FY23E FY24E
Net debt to EBITDA is expected to inch higher to 6.8x in FY24 due to high capex which is expected to be funded
from borrowings
Total Debt- LHS Net Debt- LHS
Net Debt to Equity (X) Net Debt to EBITDA (X)
(2,000)
(1,500)
(1,000)
(500)
0
500
(20,000)
(15,000)
(10,000)
(5,000)
0
5,000
10,000
FY20 FY21 FY22E FY23E FY24E
High capex will result in negative FCF
CFO-LHS FCF-LHS
CFO to EBITDA (%) FCF to Net Profit (%)
Story in Charts
INR cr
INR cr INR cr
INR cr INR cr
201201

( 9 t h D e c 2 0 2 1 )
For any further query, please email us on [email protected]
Source: Company, Ventura research
0%
20%
40%
60%
80%
100%
120%
140%
160%
180%
0
2,000
4,000
6,000
8,000
10,000
FY20 FY21 FY22E FY23E FY24E
Mining revenues are expected to grow at 62.8% CAGR over FY21-24
Mining Revenues-LHS Growth
0%
5%
10%
15%
20%
25%
0
200
400
600
800
1,000
1,200
1,400
1,600
FY20 FY21 FY22E FY23E FY24E
Mining EBIT is expected to grow at 51.7% CAGR over FY21-24
Mining EBIT-LHS Margins
-25%
-20%
-15%
-10%
-5%
0%
5%
10%
0
5,000
10,000
15,000
20,000
25,000
30,000
35,000
FY20 FY21 FY22E FY23E FY24E
IRM revenues are expected to grow at 10.9% CAGR over FY21-24
IRM Revenues-LHS Growth
0%
1%
2%
3%
4%
5%
0
200
400
600
800
1,000
1,200
1,400
1,600
FY20 FY21 FY22E FY23E FY24E
IRM EBIT is expected to grow at 1.7% CAGR over FY21-24
IRM EBIT-LHS Margins
0%
10%
20%
30%
40%
50%
60%
70%
80%
90%
100%
0
1,000
2,000
3,000
4,000
5,000
6,000
7,000
8,000
9,000
10,000
FY20 FY21 FY22E FY23E FY24E
Solar revenues are expected to grow at 44.5% CAGR over FY21-24
Solar Revenues-LHS Growth
0%
5%
10%
15%
20%
25%
30%
0
500
1,000
1,500
2,000
2,500
FY20 FY21 FY22E FY23E FY24E
Solar EBIT is expected to grow at 48.3% CAGR over FY21-24
Solar EBIT-LHS Margins
INR cr INR cr
INR cr INR cr
INR cr INR cr
202202
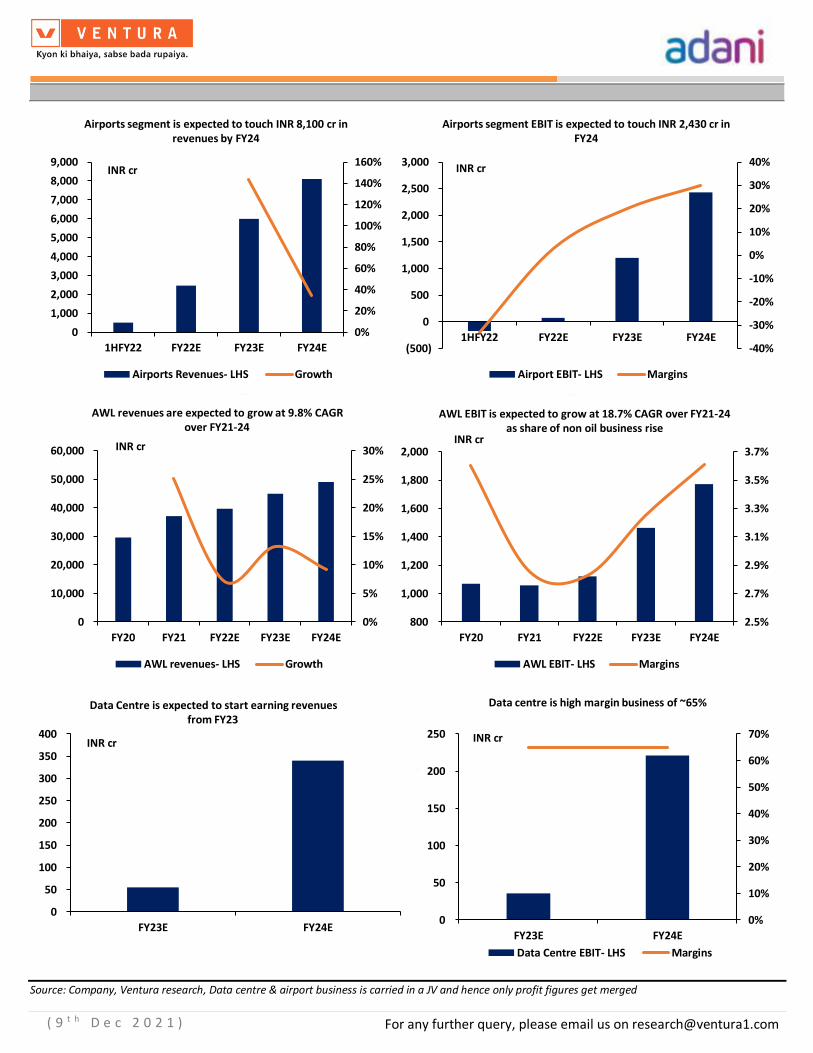
( 9 t h D e c 2 0 2 1 )
For any further query, please email us on [email protected]
Source: Company, Ventura research, Data centre & airport business is carried in a JV and hence only profit figures get merged
0%
20%
40%
60%
80%
100%
120%
140%
160%
0
1,000
2,000
3,000
4,000
5,000
6,000
7,000
8,000
9,000
1HFY22 FY22E FY23E FY24E
Airports segment is expected to touch INR 8,100 cr in revenues by FY24
Airports Revenues- LHS Growth
-40%
-30%
-20%
-10%
0%
10%
20%
30%
40%
(500)
0
500
1,000
1,500
2,000
2,500
3,000
1HFY22 FY22E FY23E FY24E
Airports segment EBIT is expected to touch INR 2,430 cr in FY24
Airport EBIT- LHS Margins
0%
5%
10%
15%
20%
25%
30%
0
10,000
20,000
30,000
40,000
50,000
60,000
FY20 FY21 FY22E FY23E FY24E
AWL revenues are expected to grow at 9.8% CAGR over FY21-24
AWL revenues- LHS Growth
2.5%
2.7%
2.9%
3.1%
3.3%
3.5%
3.7%
800
1,000
1,200
1,400
1,600
1,800
2,000
FY20 FY21 FY22E FY23E FY24E
AWL EBIT is expected to grow at 18.7% CAGR over FY21-24 as share of non oil business rise
AWL EBIT- LHS Margins
0
50
100
150
200
250
300
350
400
FY23E FY24E
Data Centre is expected to start earning revenues from FY23
0%
10%
20%
30%
40%
50%
60%
70%
0
50
100
150
200
250
FY23E FY24E
Data centre is high margin business of ~65%
Data Centre EBIT- LHS Margins
INR cr INR cr
INR cr INR cr
INR cr INR cr
203203

( 9 t h D e c 2 0 2 1 )
For any further query, please email us on [email protected]
3
Source: Company, Ventura research, Other segment consists of airports also in FY21
0%
5%
10%
15%
20%
25%
30%
0
2,000
4,000
6,000
8,000
10,000
12,000
14,000
16,000
FY20 FY21 FY22E FY23E FY24E
Other segment revenues are expected to grow at 5.5% CAGR over FY21-24
Others Revenues- LHS Growth
-5%
0%
5%
10%
15%
20%
(500)
0
500
1,000
1,500
2,000
2,500
3,000
3,500
FY20 FY21 FY22E FY23E FY24E
Other segment EBIT is expected to become postitive from hereon
Others EBIT- LHS Margins
INR cr INR cr
204204

( 9 t h D e c 2 0 2 1 )
For any further query, please email us on [email protected]
Financial Analysis and Projections
Going forward, we expect AEL’s total revenues to grow at a CAGR of 20.6% to INR 69,413.2
cr over FY21-24E. In terms of segmental breakup, mining/IRM/solar manufacturing/others
are expected to grow at 62.8/10.9/44.5/5.5% CAGR over the same period while airport
revenues are expected to clock INR 8,100 cr by FY24. EBITDA is expected to grow by 54.5%
CAGR to INR 9,235.1 cr with margins at 13.3% in FY24 (+697bps over FY21). Net income is
expected to grow by 10.0% CAGR to INR 1,227.1 cr over FY21-24 while PAT margins are
expected to fall by 57 bps to 1.8% in FY24. The return ratios, RoE and RoIC are expected to
remain in single digits as most of the AEL’s business verticals are still in the investment
phase. Net debt to EBITDA is expected to increase to 6.9x in FY24 from 5.4x in FY21.
However, as a group philosophy, AEL keeps on looking for strategic investors for its various
incubating businesses to unlock value and bring down debt levels and it does not expect
debt to EBITDA to breach 6x in the long run.
Financial Summary
Source: Company Reports & Ventura Research
Fig in INR Cr (unless specified) FY20 FY21 FY22E FY23E FY24E FY25E FY26E FY27E FY28E FY29E FY30E
Revenue from operations 43,402.6 39,537.1 54,207.5 64,877.4 69,413.2 70,776.5 72,147.9 73,582.2 74,921.4 76,310.4 77,751.3
YoY Growth (%) 5.7 (8.9) 37.1 19.7 7.0 2.0 1.9 2.0 1.8 1.9 1.9
Raw Material Cost 34,660.3 30,247.8 40,791.1 48,495.9 51,539.3 52,197.7 52,848.4 53,531.0 54,130.7 54,752.7 55,397.8
RM Cost to Sales (%) 79.9 76.5 75.3 74.8 74.3 73.8 73.3 72.8 72.3 71.8 71.3
Employee Cost 682.5 829.3 1,192.6 1,362.4 1,388.3 1,344.8 1,298.7 1,250.9 1,198.7 1,144.7 1,088.5
Employee Cost to Sales (%) 1.6 2.1 2.2 2.1 2.0 1.9 1.8 1.7 1.6 1.5 1.4
Other Expenses 5,775.4 5,954.9 8,659.9 7,846.7 7,250.5 7,759.8 7,880.7 7,559.5 8,000.1 7,905.2 8,156.7
Other Expenses to Sales (%) 13.3 15.1 16.0 12.1 10.4 11.0 10.9 10.3 10.7 10.4 10.5
EBITDA 2,284.3 2,505.1 3,563.8 7,172.5 9,235.1 9,474.3 10,120.2 11,240.8 11,591.8 12,507.8 13,108.3
EBITDA Margin (%) 5.3 6.3 6.6 11.1 13.3 13.4 14.0 15.3 15.5 16.4 16.9
Net Profit 1,138.2 922.6 834.7 1,020.1 1,227.1 1,298.0 1,748.5 3,109.6 4,168.2 5,208.3 6,214.4
Net Margin (%) 2.6 2.3 1.5 1.6 1.8 1.8 2.4 4.2 5.6 6.8 8.0
Adjusted EPS 10.3 8.4 7.6 9.3 11.2 11.8 15.9 28.3 37.9 47.4 56.5
P/E (X) 166.5 205.4 227.0 185.8 154.4 146.0 108.4 60.9 45.5 36.4 30.5
Adjusted BVPS 154.1 156.0 172.3 181.6 192.8 204.6 220.5 248.7 286.6 334.0 390.5
P/BV (X) 11.2 11.0 10.0 9.5 8.9 8.4 7.8 6.9 6.0 5.2 4.4
Enterprise Value 197,716.6 202,948.5 224,244.0 244,041.7 253,304.8 253,842.7 253,877.8 252,403.1 250,234.8 247,118.9 243,357.6
EV/EBITDA (X) 86.6 81.0 62.9 34.0 27.4 26.8 25.1 22.5 21.6 19.8 18.6
Net Worth 16,946.6 17,158.6 18,953.1 19,973.2 21,200.4 22,498.3 24,246.8 27,356.4 31,524.6 36,732.9 42,947.3
Return on Equity (%) 6.7 5.4 4.4 5.1 5.8 5.8 7.2 11.4 13.2 14.2 14.5
Capital Employed 28,599.2 32,451.9 56,857.6 77,558.4 88,120.6 89,609.4 91,549.9 93,860.3 95,515.9 97,918.7 100,334.8
Return on Capital Employed (%) 4.5 4.2 3.3 5.4 6.2 6.3 6.3 6.6 6.7 7.0 7.2
Invested Capital 25,167.6 30,611.6 53,701.6 74,519.5 85,009.7 86,845.5 88,629.0 90,264.0 92,263.8 94,356.3 96,809.3
Return on Invested Capital (%) 7.2 6.4 4.7 7.5 8.6 8.6 8.7 9.2 9.3 9.7 10.0
Cash Flow from Operations 2,453.6 4,093.5 1,514.2 5,470.3 8,295.4 8,992.2 9,552.4 10,276.9 10,368.4 11,004.4 11,333.5
Cash Flow from Investing (2,323.0) (7,902.4) (11,726.6) (20,256.5) (11,148.1) (2,763.1) (2,935.8) (3,117.4) (3,308.4) (3,509.4) (3,720.7)
Cash Flow from Financing (220.9) 3,058.6 11,342.9 14,667.5 2,923.0 (6,577.7) (6,461.5) (6,486.0) (7,406.1) (7,186.7) (7,651.9)
Net Cash Flow (90.3) (750.3) 1,130.5 (118.6) 70.3 (348.7) 155.1 673.5 (346.1) 308.2 (39.1)
Free Cash Flow 612.5 440.9 (6,996.8) (16,398.9) (5,022.7) 4,033.0 4,631.2 5,609.2 5,939.6 6,713.7 7,166.4
FCF to Revenue (%) 1.4 1.1 (12.9) (25.3) (7.2) 5.7 6.4 7.6 7.9 8.8 9.2
FCF to EBITDA (%) 26.8 17.6 (196.3) (228.6) (54.4) 42.6 45.8 49.9 51.2 53.7 54.7
FCF to Net Profit (%) 53.8 47.8 (838.2) (1,607.5) (409.3) 310.7 264.9 180.4 142.5 128.9 115.3
FCF to Net Worth (%) 3.6 2.6 (36.9) (82.1) (23.7) 17.9 19.1 20.5 18.8 18.3 16.7
Total Debt 11,652.7 15,293.3 37,904.5 57,585.2 66,920.2 67,111.0 67,303.0 66,503.8 63,991.3 61,185.8 57,387.5
Net Debt 8,221.0 13,453.0 34,748.4 54,546.2 63,809.3 64,347.1 64,382.2 62,907.6 60,739.2 57,623.4 53,862.0
Net Debt to Equity (X) 0.5 0.8 1.8 2.7 3.0 2.9 2.7 2.3 1.9 1.6 1.3
Net Debt to EBITDA (X) 3.6 5.4 9.8 7.6 6.9 6.8 6.4 5.6 5.2 4.6 4.1
Interest Coverage Ratio (X) 1.2 1.4 0.9 1.1 1.1 1.1 1.2 1.5 1.8 2.1 2.5
205205
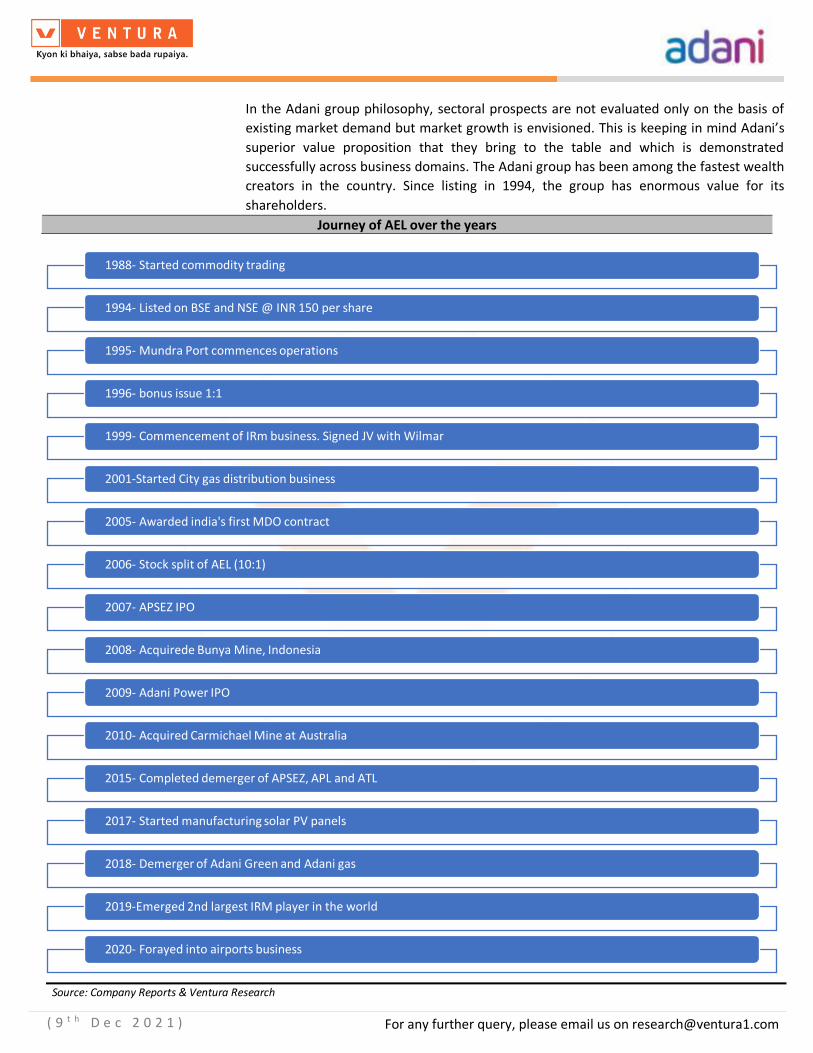
( 9 t h D e c 2 0 2 1 )
For any further query, please email us on [email protected]
In the Adani group philosophy, sectoral prospects are not evaluated only on the basis of
existing market demand but market growth is envisioned. This is keeping in mind Adani’s
superior value proposition that they bring to the table and which is demonstrated
successfully across business domains. The Adani group has been among the fastest wealth
creators in the country. Since listing in 1994, the group has enormous value for its
shareholders.
Journey of AEL over the years
Source: Company Reports & Ventura Research
1988- Started commodity trading
1994- Listed on BSE and NSE @ INR 150 per share
1995- Mundra Port commences operations
1996- bonus issue 1:1
1999- Commencement of IRm business. Signed JV with Wilmar
2001-Started City gas distribution business
2005- Awarded india's first MDO contract
2006- Stock split of AEL (10:1)
2007- APSEZ IPO
2008- Acquirede Bunya Mine, Indonesia
2009- Adani Power IPO
2010- Acquired Carmichael Mine at Australia
2015- Completed demerger of APSEZ, APL and ATL
2017- Started manufacturing solar PV panels
2018- Demerger of Adani Green and Adani gas
2019-Emerged 2nd largest IRM player in the world
2020- Forayed into airports business
206206

( 9 t h D e c 2 0 2 1 )
For any further query, please email us on [email protected]
AEL’s business model
AEL acts mainly as an incubator for various businesses in the group. The quality of AEL’s
incubation has been reflected in the speed of maturing without comprising the robustness
of the demerged entity to emerge as a sectoral benchmark and maximise stakeholder value.
Some of the companies also attracted global strategic stake holders (Total etc) and
institutional investors (Indian and global) post demerger. Besides, these companies also
attracted the highest credit ratings accorded to Indian infrastructure companies by some of
the most demanding international appraising agencies.
Adani group structure
Source: Company Reports & Ventura Research, Value as on 14th Oct
AEL believes that the ability to convert a small business segment into a large and profitable
business is derived from a broad-based competitive advantage that is not dependent on
any one factor but is a combination of varied factors like:
• Timely project implementation
• Ability to commission projects faster than the sectorial curve
• Competence to do so at a cost lower than the industry average
• Foresight to not merely service the market but to grow it
• Establish a decisive sustainable leadership and
• Evolve the Company’s position into a generic name within the sector of its
presence.
207207

( 9 t h D e c 2 0 2 1 )
For any further query, please email us on [email protected]
How AEL has been consistently able to transform smaller segments into giant businesses
Source: Company Reports & Ventura Research
Incubation lifecycle of AEL
Source: Company Reports & Ventura Research
AEL holds a portfolio of large businesses within itself
Source: Company Reports & Ventura Research
Betting on India
Focus on big picture
Making outsized
investments at
competitive cost of capital
Focus on fater
commissioning/execution
Creating long term revenue
visibility
Reinforcing margins
DemergeHoldDevelopFundConceive
208208

( 9 t h D e c 2 0 2 1 )
For any further query, please email us on [email protected]
A snapshot of activities carried under each business
Source: Company Reports & Ventura Research
Mining
Adani Enterprises entered the Mine Developer and Operator (MDO) business in 2008. It
dispatched its first rake from the PEKB mine to Rajasthan Rajya Vidyut Utpadan Nigam
Limited (RRVUNL) Power Stations in March 2013.
Within a decade, AEL has emerged as one of the largest developers and operators of coal
mines in India in addition to footprints in Indonesia and Australia.
209209

( 9 t h D e c 2 0 2 1 )
For any further query, please email us on [email protected]
Fully explored mines capacity
Status Block name Project Capacity MMTPA
Operational Parsa East Kante Coal mining service 15.0 Talabira II & III Coal mining service 20.0
Gare Palma III Coal mining service 5.0 Kurmitar Iron ore mining service 6.0
Under development Parsa Coal mining service 5.0
Kente Extension Coal mining service 7.0 Gidhmuri Paturia Coal mining service 6.0
Suliyari Coal mining service 5.0
Gare palma II Coal mining service 23.0
Bailadila Iron ore mining service 10.0
Gondulpara Commercial mining 4.0
Dhirauli Commercial mining 5.0
Jhigador Commercial mining NA
Khargaon Commercial mining NA
LOI received Gare Palma I Coal mining service 15.0
Total 126.0
Source: Company websites & Ventura Research
AEL has ~50% market share in mining business
Source: Company websites & Ventura Research
210210

( 9 t h D e c 2 0 2 1 )
For any further query, please email us on [email protected]
AEL has also got a wholly-owned step-down subsidiary in Australia which owns a 100%
interest in the Carmichael mine in the Galilee Basin in Queensland, Australia.
Brief history of Carmichael mine project
• Carmichael is a thermal coal mine under construction in the Galilee Basin in Central
Queensland, which has been approved by the Queensland and federal
governments.
• AEL had initially planned the project in 2010 with an investment of A$16.5 billion
but later scaled it down to A$2 billion. This was one of the biggest investments by
an Indian company in Australia.
• The project had faced protests from a section of the population claiming that if
Carmichael goes ahead, it will destroy the ancestral lands, waters and cultures of
Indigenous people without their consent, increase shipping traffic through the
Great Barrier Reef heritage area and add around 4.7bn tonnes of carbon pollution
to the atmosphere over its 60-year lifespan.
• The opposition grew so strong that over the years several banks refused to fund it.
• The group, however, went ahead with the project which included construction of a
brand new railway line connecting an Australian port to the mine -- situated 300
kilometers away in Queensland.
• The project was given the final approvals in June 2019, and construction began later
that year and the first cargo dispatch is expected in Dec, 2021.
• As per AEL, Carmichael will produce 11 million tonnes of thermal coal per annum at
peak capacity.
Carmichael mine project
Source: Company Reports & Ventura Research
211211

( 9 t h D e c 2 0 2 1 )
For any further query, please email us on [email protected]
How AEL has derisked its mining business economically:
Economically
• Diversified portfolio- The mining business has a presence in 70% of India’s mineral
belt with a wide exposure across MDO coal, MDO iron ore, washery and commercial
coal functions.
• 100% contracted capacity: Contractual mechanism for life-long tariff escalation
across mining agreements of 30 years.
• Robust counter-party profile: Addressing customers of AAA and AA categories
(57%) and A and Unrated category (43%).
• Engagement stability: Engaged across multi-decade contracts with sovereign/ sub-
sovereign entities and State- and Central Government-backed counterparties.
• Volumes: No volume risk due to a confirmed annual offtake of the entire contacted
quantity leading to predictable long-term cash flows, on the basis of fixed and cost
pass-through agreements.
Over FY21-24, revenues from the mining vertical are expected to grow at 62.8% CAGR
mainly due to commencement of operations of Carmichael mines & increase in demand for
coal. The operating profits are expected to grow at a 51.7% CAGR over the same period with
margins expected to hover around 14-17%. Keeping the consequences of climate change
in mind, the management has discontinued any further fresh investments in this vertical
and projects will be allowed to run off with their contract period expiring (the furthermost
being in FY2041.
Mining revenues and EBIT profile
Source: Company Reports & Ventura Research
0%
20%
40%
60%
80%
100%
120%
140%
160%
180%
0
1,000
2,000
3,000
4,000
5,000
6,000
7,000
8,000
9,000
10,000
FY20 FY21 FY22E FY23E FY24E
Mining revenues are expected to grow at 62.8% CAGR over FY21-24
Mining Revenues-LHS Growth
INR cr
0%
5%
10%
15%
20%
25%
0
200
400
600
800
1,000
1,200
1,400
1,600
FY20 FY21 FY22E FY23E FY24E
Mining EBIT is expected to grow at 51.7% CAGR over FY21-24
Mining EBIT-LHS Margins
INR cr
212212

( 9 t h D e c 2 0 2 1 )
For any further query, please email us on [email protected]
Peer comparison
Revenue growth
EBIT growth EV/EBIT(x)
FY21-24E FY21-24E FY23E FY24E
AEL 63% 52%
Vedanta 7% 14% 4.2 4.8
NMDC 6% -12% 4.2 5.0
Source: Company websites & Ventura Research, Bloomberg
Integrated resource management (IRM)
AEL ventured into coal management in 1999 to address the gap in the requirement of coal
at thermal power plants. The company is the largest coal supplier in India and a major
supplier of important minerals worldwide. AEL is also the largest coal importer in Indonesia
& India’s largest non-coking coal off-taker in Indonesia, South Africa and USA. The company
is also present in the growing coal markets of Sri Lanka, Thailand, Vietnam, China and Dubai.
Under this division, AEL provides a door-to-door resource delivery model which includes:
• Sourcing resources from suppliers
• Managing sea-borne logistics
• Providing an intermediate holding facility at discharge ports
• Delivering resources to customers.
While the primary customers for the IRM business consists of States or Central owned
Electricity Boards, AEL has over the years diversified to other businesses like steel, cement
and other metals to derisk its dependence. Currently, the IRM business has more than 600
customers across various downstream industries and is a market leader.
We expect IRM revenues to grow at 10.9% CAGR over FY21-24 to touch INR 32,662.2cr given
the business is more or less in a mature phase. In terms of operating profits, we expect the
same to grow at 1.7% CAGR with FY22 margins at >4% and then fall to a normalized 2-3 %
range in FY23 and FY24.
213213

( 9 t h D e c 2 0 2 1 )
For any further query, please email us on [email protected]
IRM revenues and EBIT profile
Source: Company Reports & Ventura Research
Solar manufacturing
The emergence of solar energy as a preferred renewable energy option has created a
backend demand for solar photo-voltaic cells and modules. India has emerged as one of the
most aggressive investors in solar energy, creating an unprecedented appetite for solar
energy products. To capitalize on this opportunity, Mundra Solar Photo Voltaics Limited
(MSPVL) (constituent of AEL) was commissioned in 2017 and has sold > 3 GW (till March
2021) of modules, addressing Indian and global demand.
MSPVL is the first and the largest GW scale integrated cell and module manufacturer in India
with backward integration through ancillaries in ethylene vinyl acetate (EVA), back sheet
and aluminium frames. Besides manufacturing, the solar business also comprises an EPC
business in Mundra Special Economic Zone (SEZ). MSPVL enjoys a pan-India presence
through 11 channel partners and their associated distributors to address residential and
commercial & institutional rooftop demand. Under the KUSUM scheme, MSPVL modules
have been supplied for solar pump installations in the state of Punjab, Haryana, Uttar
Pradesh, Rajasthan, Gujarat, Madhya Pradesh and Maharashtra and accounts for ~52% of
the total modules installed in the scheme as of Feb, 2021.
-25%
-20%
-15%
-10%
-5%
0%
5%
10%
0
5,000
10,000
15,000
20,000
25,000
30,000
35,000
FY20 FY21 FY22E FY23E FY24E
IRM revenues are expected to grow at 10.9% CAGR over FY21-24
IRM Revenues-LHS Growth
INR cr
0%
1%
2%
3%
4%
5%
0
200
400
600
800
1,000
1,200
1,400
1,600
FY20 FY21 FY22E FY23E FY24E
IRM EBIT margins are expected to be at normalised levels in FY23 & FY24
IRM EBIT-LHS Margins
INR cr
214214

( 9 t h D e c 2 0 2 1 )
For any further query, please email us on [email protected]
MSPVL is expected to benefit from the domestic thrust on solar energy
Source: Company websites & Ventura Research
MSPVL also undertakes EPC projects besides manufacturing modules and cells
Hyundia, Chennai Indore Airport Andaman and Nicobar
Source: Company Reports & Ventura Research
Mundra Solar Photo Voltaics Ltd
(MSPVL)
Largest Solar energy
products company in
India
10.3% share of solar power in
total power capacity in
2020
13x increase in solar capacity in last 6 years
41% share of solar energy in renewable mix
215215

( 9 t h D e c 2 0 2 1 )
For any further query, please email us on [email protected]
AEL is the largest solar panel manufacturer
________________________________________________________________________
Source: Ventura Research
The solar business is also expected to benefit from various policies of the government like:
PM-KUSUM scheme
The Pradhan Mantri Kisan Urja Suraksha evam Utthaan Mahabhiyan (PM-KUSUM) scheme
was launched in July 2019. The scheme initially targeted to set up decentralised solar power
capacity of 26 GW by 2022. However, the MNRE has increased the aggregate target to 31
GW from 26 GW by FY23.
The scheme has the following three components
• setting up of 10,000MW of decentralised ground/stilt-mounted grid-connected
solar or other renewable energy-based power plants
• installation of 1.75 million standalone solar agriculture pumps.
• solarisation of 1 million grid connected solar agriculture pumps.
Production Linked Incentive (PLI) Scheme
The Cabinet on Nov, 2020 approved a INR ~1.5 lakh crore (US$20bn) production-linked
incentive (PLI) scheme for 10 sectors to attract investments and boost domestic
manufacturing. As part of this, INR 45bn (US$616m) is allocated for the solar PV sector.
Expenses incurred on plant, machinery, equipment, R&D and technology transfer would be
eligible for the incentive scheme. The scheme shall also extend an incentive of 4-6% on
incremental sales (over the base year) of products manufactured in domestic facilities and
covered under target segments, to eligible companies, for a period of 5 years subsequent
to the base year.
0
200
400
600
800
1000
1200
1400
1600
Adani Solar Indosolar Jupiter solar Tata powersolar
Websolenergy
Moser Baer RenewSys BHEL
MW
216216

( 9 t h D e c 2 0 2 1 )
For any further query, please email us on [email protected]
Basic Custom Duties (BCD) To Be Introduced
In order to make imported cells and modules more expensive, the government had
proposed the implementation of a new tariff scheme, the Basic Custom Duties, on solar
cells, modules and inverters, starting from 2021. But, recently, in supersession to the
previous announcements, now, the finance ministry will be issuing an order for imposing
40% and 25% BCD on the import of solar modules and solar cells respectively. The new
tariffs shall be imposed from 1st April 2022. It would replace the current SGD regime on the
concerned solar equipment.
How AEL has built and derisked its solar manufacturing business:
Scale: The Company possesses India’s largest integrated cell & module manufacturing
capacity (1,400 MW). With its multi-level infrastructure, the manufacturing facility is being
scaled to 3.5 GW of modules and cells under a single roof.
Operations: MSPVL has widened its technology offering through cutting-edge research
and development. It offers a range of multi (315Wp to 345Wp), mono (340 Wp to 375Wp)
and bifacial (350Wp to 425Wp) solar modules.
Knowledge capital: The Company possesses a strong and experienced team of 3500+
employees to ensure process sustenance with two PhDs working on product development
and research.
Technology: Investment in best-in-class systems and processes (automation, ecosystem
development and quality assurance).
De-risking: MSPVL collateralizes more than 80% of its diversified order book, enhancing the
certainty of cash flows.
De-leveraged: MSPVL strengthened its capital management, moderating long term debt
from INR 1,385 cr in FY18 to INR 924 cr in FY21. However, with expansion kicking in we
expect leverage to go up.
We expect solar manufacturing revenues to grow at 44.5% CAGR over FY21-24 to touch INR
8,857.6 cr as the new capacity of 3.5GW is expected to commence operations (cell line from
Dec, 21 and module line from next year). We expect the operating profit to grow at 48.3%
CAGR with margins expected to see a sharp fall in FY22 (module prices have increased
recently which will affect the existing contracts) and then bounce back to ~25% in FY23 and
FY24.
217217

( 9 t h D e c 2 0 2 1 )
For any further query, please email us on [email protected]
Solar revenues and EBIT profile
Source: Company Reports & Ventura Research
Peer comparison
Revenue growth
EBIT growth EV/EBIT(x)
FY21-24E FY21-24E FY23E FY24E
AEL 45% 48%
Tata Power 17% 19% 16.8 15.1
Thermax 16% 42% 37.9 30.9
KEC 11% 18% 8.7 7.2
Source: Company websites & Ventura Research, Bloomberg
Airports business
Adani Airports Holdings Limited won the mandate to modernize and operate six airports in
2019 – Ahmedabad, Lucknow, Mangaluru, Jaipur, Guwahati and Thiruvananthapuram –
through the Airports Authority of India’s globally competitive tendering process. Adani
Airports will operate, manage and develop all the six airports for 50 years. The company
commenced operations in Ahmedabad, Lucknow and Mangaluru airports while the
commencement of operations in Jaipur, Guwahati and Thiruvanthapuram took place by
Oct, 21.
Besides above airports, the company has acquired a 74% stake in Mumbai International
Airport Limited (MIAL), a joint venture with the Airports Authority of India by acquiring
50.5% stake from GVK group, 10% stake from Airport company of South Africa and 13.5%
stake from Bidvest. Further, by acquiring majority stake in MIAL, the company has gained
direct control of upcoming Navi Mumbai airport as MIAL holds a 74% stake in the same.
0%
10%
20%
30%
40%
50%
60%
70%
80%
90%
100%
0
1,000
2,000
3,000
4,000
5,000
6,000
7,000
8,000
9,000
10,000
FY20 FY21 FY22E FY23E FY24E
Solar revenues are expected to grow at 44.5% CAGR over FY21-24
Solar Revenues-LHS Growth
INR cr
0%
5%
10%
15%
20%
25%
30%
0
500
1,000
1,500
2,000
2,500
FY20 FY21 FY22E FY23E FY24E
Solar EBIT is expected to grow at 48.3% CAGR over FY21-24
Solar EBIT-LHS Margins
INR cr
218218

( 9 t h D e c 2 0 2 1 )
For any further query, please email us on [email protected]
AEL intends to design revolutionary airports that offer seamless processes and facilitate
touch-less operations – especially in the post COVID-19 era, when social distancing will be
the new norm. Over longer term, the management envisages to convert the airport
business from B2B currently to B2C in lines of Changi airport which houses several fancy
shopping malls, restaurants & world’s largest indoor waterfall. It is to be noted that the 7
airports (Navi Mumbai excluded) touch ~25% of total India’s air traffic consumer base of
>300 mn people.
Regional connectivity scheme (UDAN) can provide a big boost to airports business
Under Regional connectivity scheme, government plans to connect the underserved
airports to key airports through flights that will cost Rs 2,500 for per hour flight. The goal is
to make air travel affordable and widespread and to boost air transport infrastructure
development. The scheme will be jointly funded by the central government and state
governments with several states having come on board by signing the "Memorandum of
Understanding" with the union government.
The 7 airports handle ~25% of India’s air traffic consumer base of >30 cr
Source: Company websites & Ventura Research
AAHL plans to increase passenger footfalls and provide network effect in the following
ways:
• Establishing first rate infrastructure on the air and land sides of the airport to
enhance quality travel time for passengers.
• Creating locally relevant architecture in and around airports to attract foreign
tourists and domestic passengers.
• Developing entertainment destinations (aerotropolis, airport village, hotels and
malls, among others).
• Enhancing domestic airline connectivity with new and under- prioritised locations.
• Raise the number of international flights; reducing the delay between two flights.
45.9
11.4
5.5 5.43.9
1.95.0
0.0
5.0
10.0
15.0
20.0
25.0
30.0
35.0
40.0
45.0
50.0
Mumbai Ahmedabad Guwahati Lucknow Trivandram Mangaluru Jaipur
Passenger footfalls in mn in FY20
219219

( 9 t h D e c 2 0 2 1 )
For any further query, please email us on [email protected]
Further, the outlook for the airport infrastructure business is positive on account of the
government’s decision to progressively divest ownership stakes in Indian airports in favour
of private operators. The divestment is expected to accelerate the modernization of
infrastructure and turn them at par with global airports.
We expect the airport business to clock INR 2,463 cr in revenues in FY22 and thereafter
grow at 81.4% CAGR in FY23 and FY24 once COVID is behind us. We expect only breakeven
profits in FY22 and have built 20% and 30% in margins in FY23 and FY24 respectively leading
to total operating profit touching INR 2,430 cr in FY24.
Solar revenues and EBIT profile
Source: Company Reports & Ventura Research
Peer comparison
Revenue growth
EBIT growth EV/EBIT(x)
FY22-24E FY22-24E FY23E FY24E
AEL 81% 474%
Sydney airport 18% 50% 37.8 23.1
Auckland Intl 32% 167% 47.0 27.5
Hainan Meilan 12% 41% 9.5 6.3
Source: Company websites & Ventura Research, Bloomberg
Roads and Highway construction business
Adani Enterprises entered this business in 2018 and has since emerged as one of its fastest
growing business unit. In this business. the company will focus on pan- India projects
launched by the National Highways Authority of India (NHAI) and Ministry of Road Transport
and Highways (MORTH), Ministry of Railways and metro corporations under numerous
states and all related projects under the purview of Central or State authorities or agencies.
0%
20%
40%
60%
80%
100%
120%
140%
160%
0
1,000
2,000
3,000
4,000
5,000
6,000
7,000
8,000
9,000
1HFY22 FY22E FY23E FY24E
Airport revenues are expected to touch INR 8,100 cr by FY24
Airports Revenues- LHS Growth
INR cr
-40%
-30%
-20%
-10%
0%
10%
20%
30%
40%
(500)
0
500
1,000
1,500
2,000
2,500
3,000
1HFY22 FY22E FY23E FY24E
Airport EBIT is expected to be >INR 2,000 cr by FY24
Airport EBIT- LHS Margins
INR cr
220220

( 9 t h D e c 2 0 2 1 )
For any further query, please email us on [email protected]
The business enjoys a pan-India presence (Chhattisgarh, Telangana, Andhra Pradesh,
Kerala, Orissa, Gujarat and West Bengal) with an awarded project length of around 2,300
lane km. As a developer, AEL will primarily target PPP projects structured in Build-Operate-
Transfer (BOT), Toll-Operate- Transfer (TOT) & Hybrid-Annuity Mode (HAM) models while
on the EPC side AEL will only take those projects that can offer scale and complexity, marked
by relatively low competition.
Bharatmala Project can provide a big boost to road construction
The program of Bharatmala focusses on
1. Enhancing effectiveness of already built infrastructure
2. Bridging infrastructure gaps for seamless movement and
3. Integrating National and Economic Corridors.
The program was conceptualized to attain optimal resource allocation for a holistic highway
development & improvement. The Bharatmala Pariyojana, once implemented, is expected
to result in connecting 550 Districts in the country through NH linkages.
The six features of the Bharatmala project are:
• Economic Corridors: Integrating the economic corridors facilitates larger
connectedness between economically important production and consumption
centers.
• Inter-corridor and Feeder routes: Inter corridor connectivity would ensure first mile
and last mile connectivity.
• National Corridor Efficiency Improvement: Through this, the greater actionable goal
is to undertake lane expansion and decongestion of existing National Corridors.
• Border and International connectivity Roads: Better border road infrastructure
would ensure greater maneuverability, while also boosting trade with neighboring
countries.
• Coastal and Port connectivity roads: Portled economic development is further
boosted through connectivity to coastal areas, encouraging both, tourism and
industrial development.
• Green-field Expressways: Expressways with higher traffic congestion and choke
points would benefit from green field expressways.
221221

( 9 t h D e c 2 0 2 1 )
For any further query, please email us on [email protected]
Bharatmala Yojna Phase I
Before Bharatmala After Bharatmala
Six corridors Fifty corridors
40% freight on national highways 70-80% freight on national highways
300 districts connected by 4+ lane highways
550 districts connected by 4+ lane highways
Source: Company websites & Ventura Research
The roads and highway business of AEL is expected to benefit from Bharatmala Pariyojana
Phase I as per which 24,800 kms of national highways and 10,000 kms of residual road works
under National Highways Development Project (NHDP).
Bharatmala Yojna Phase I
Scheme Length kms Cost in INR cr
Economic corridors 9,000 120,000
Inter corridors and feeder roads 6,000 80,000
National corridor effeciency improvement 5,000 100,000
Border/International connectivity 2,000 25,000
Coastal and port connectivity 2,000 20,000
Expressways 800 40,000
Ongoing projects including NHDP 10,000 150,000
Total 34,800 535,000
Source: Company websites & Ventura Research
AEL expects portfolio of 12,000 lane Kms by 2026 from 450+kms currently
Source: Company websites & Ventura Research
222222

( 9 t h D e c 2 0 2 1 )
For any further query, please email us on [email protected]
AEL is also open to grow its business through the inorganic route & as per various media
reports, it is already in talks to acquire 49% stake in Maharashtra Border Checkpost Network
Ltd (MBCPNL) from Sadbhav Infrastructure Project Ltd. at an enterprise value of INR.1,680
cr (7x EBITDA). While initially the acquisition will be of 49% stake in MBCPNL, there will be
an option to acquire additional stake, subject to approvals. With this acquisition, AEL will
get exclusive fee-collection rights from commercial vehicles at 24 entry points to
Maharashtra.
18 check posts are operational, 4 near operational, 1 near completion & 1 under construction
Source: Company websites & Ventura Research
National asset monetization can accelerate the growth prospects for Road/Highways and
airports business
The government announced National asset monetization program (NMP) under which the
strategic objective is to unlock the value of investments in brownfield public sector assets
by tapping institutional and long-term patient capital, which can thereafter be leveraged
for further public investments. It is to be noted that under NMP only rights over asset will
be transferred while ownership will rest with the government only and thus the asset will
be handed back to the government at the end of the transaction life.
Concessions are long term
till at least 2033 & have
inflation protection (5% per
annum & compounded
every 3 years)
223223

( 9 t h D e c 2 0 2 1 )
For any further query, please email us on [email protected]
NMP framework
Source: PIB & Ventura Research
The aggregate asset pipeline under NMP over FY22-25 is valued at INR 6.0 lakh cr of which
roads will constitute ~27% at INR 1.6 lakh cr while airports constitute ~3.5% at INR 0.2 lakh
crore. The monetization includes more than 20 asset classes totally besides roads & airports
like ports, railways, warehousing, gas & product pipeline, power generation and
transmission, mining, telecom, stadium, hospitality and housing.
NMP envisages monetization of assets worth INR 6 lakh crore
Source: PIB & Ventura Research
The assets under the NMP are expected to be rolled out through public private partnership
concessions as well as capital market instruments such as InvITs. The choice of instrument
will be determined by the sector, nature of asset, timing of transactions (including market
224224

( 9 t h D e c 2 0 2 1 )
For any further query, please email us on [email protected]
considerations), target investor profile and the level of operational/investment control
envisaged to be retained by the asset owner etc.
NMP envisages monetization of assets worth INR 6 lakh crore
Source: PIB & Ventura Research
Water management
AEL entered this business in 2019. It bagged the prestigious waste water treatment project
in Prayagraj under the National Mission for Clean Ganga Framework, which comprised the
construction of three sewage treatment plants of 72 MLD capacity and rehabilitation of six
sewage treatment plants of cumulative 254 MLD capacity. For the execution of these
projects, a Special Purpose Vehicle (SPV) called Prayagraj Water Pvt. Ltd. was formed. The
project was 60% complete FY21.
The water management business is expected to benefit from following programs of the
government:
• National Mission for Clean Ganga and National River Conservation for pollution
abatement of Ganga & Other Rivers.
• Pradhan Mantri Krishi Sinchayee Yojana for extending coverage of irrigation with
improved efficiency of micro-irrigation.
• Jal Jeevan Mission for providing piped water connections to 14.6 cr rural
households by 2024.
• Jal Shakti Abhiyaan to stimulate rainwater harvesting and water conservation.
• National River Linking projects to connect 37 rivers across the nation to ensure
adequate water through the year in all regions.
88,190
1,62,422
1,79,544 1,67,345
-
20,000
40,000
60,000
80,000
1,00,000
1,20,000
1,40,000
1,60,000
1,80,000
2,00,000
FY22 FY23 FY24 FY25
Monetisation pipelineINR cr
225225

( 9 t h D e c 2 0 2 1 )
For any further query, please email us on [email protected]
Rising population is accentuating water problems in India
Source: World Bank, Ventura research
Further, increasing urbanization & industrial activities has resulted in a significant increase
in sewage generation in India. During FY11-20, the total sewage generated by Tier I & II
cities increased from 41 bn litres per day (BLD) to 75 BLD, while the sewage treatment
capacity increased from 11 BLD to 26 BLD, indicating that only 30-35% of the total volume
of sewage generated gets treated. The conditions in Tier III cities is far worse off.
The water division is also expected to benefit from various policies of the government like:
AMRUT Mission (launched in June 2015):
The key objectives of the mission are
• To ensure that every household has access to a tap with the assured supply of water
and a sewerage connection.
• To increase the amenity value of cities by developing greenery and well maintained
open spaces (e.g. parks).
• To reduce pollution by switching to public transport or constructing facilities for
non-motorized transport (e.g. walking and cycling).
2nd phase of AMRUT Scheme
It is the continuation of the AMRUT mission launched in June 2015
The key objectives of the phase 2 are:
• It will build upon the progress of AMRUT to address water needs, rejuvenate water
bodies, better manage aquifers, reuse treated wastewater, thereby promoting a
circular economy of water.
4
67
15
18
5
20
3
India USA China Brazil
Share of Water Share of Population
In %
226226

( 9 t h D e c 2 0 2 1 )
For any further query, please email us on [email protected]
• It will provide 100% coverage of sewerage and septage in 500 AMRUT cities.
• Recycling and reuse of treated wastewater is expected to cater to 20% of total
water needs of the cities and 40% of industrial demand. Under the Mission, fresh
water bodies will be protected from getting polluted to make natural resources
sustainable.
• Pey Jal Survekshan will be conducted in cities to ascertain equitable distribution of
water, reuse of wastewater and mapping of water bodies.
Jal Jeevan Mission
Jal Jeevan Mission (JJM) envisages supply of 55 litres of water per person per day to every
rural household through Functional Household Tap Connections (FHTC) by 2024. Salient
features of the mission:
• JJM focuses on integrated demand and supply-side management of water at the
local level.
• Creation of local infrastructure for source sustainability measures as mandatory
elements, like rainwater harvesting, groundwater recharge and management of
household wastewater for reuse, would be undertaken in convergence with other
government programmes/schemes.
• The Mission is based on a community approach to water and includes extensive
Information, Education and Communication as a key component of the mission.
• JJM looks to create a jan andolan for water, thereby making it everyone’s priority.
Funding Pattern: The fund sharing pattern between the Centre and states is 90:10 for
Himalayan and North-Eastern States, 50:50 for other states, and 100% for Union Territories.
The total allocation to the scheme is over INR 3 lakh crore.
Jal Shakti Ministry
The government has created a new ministry called ‘Jal Shakti’ after merging Ministries of
Water Resources, River Development & Ganga Rejuvenation along with Drinking Water and
Sanitation.
Both AMRUT and JJL are expected to offer significant opportunity for water treatment for
EPC and O&M players in the space. There are very few focused Indian companies in this
space and AEL is one of the largest.
227227

( 9 t h D e c 2 0 2 1 )
For any further query, please email us on [email protected]
Agro products business
The Adani Group through Adani Agri Fresh Limited (AAFL) emerged as the first company to
engage in organised apple purchase, storage and marketing in 2006. Subsequently, AAFL
created state-of-the-art controlled atmosphere facilities of 22,400 MT capacity in Shimla
district.
AAFL possesses the largest integrated apple supply chain with ultra-modern storage
infrastructure (> 40% of the total storage capacity of Himachal Pradesh apples) and is the
largest player in India in the area of fresh apples and other fruit. AAFL markets Indian fruits
under the Farm-Pik brand, while it also imports apples, pears, kiwis, oranges and grapes
from various countries for onward sale.
AAFL has tied up with major fruit exporters around the world
Source: Company DRHP & Ventura Research
228228

( 9 t h D e c 2 0 2 1 )
For any further query, please email us on [email protected]
AAFL is expected to benefit from high industry growth rates
Source: Company reports & Ventura Research
Defence sector business
Adani Defence and Aerospace is developing Tier-1 capabilities in avionics and systems,
opto-electronics, aero-structure and precision components, aerospace composites as well
as radar and electronic warfare systems. The company addresses the widening needs of
customer segment comprising DRDO, ISRO, HAL, BEL and the Israel-based Elbit Systems.
AEL enjoys a first mover advantage in the following areas in defence:
• India’s first private sector UAV (Unmanned aerial vehicle) manufacturer-exporter.
• India’s first and only private small arms manufacturing facility.
• India’s first company to implement counter-drone systems for airports.
• India’s first comprehensive aircraft services being built.
41
94
188
0
20
40
60
80
100
120
140
160
180
200
2015 2020 2025E
Organised retailUS $ bn
8
24
63
0
10
20
30
40
50
60
70
2015 2020 2025E
Food & groceryUS $ bn
229229

( 9 t h D e c 2 0 2 1 )
For any further query, please email us on [email protected]
Capital outlay on defence has increased by 18.8% for FY22
Source: Company Reports & Ventura Research
Some of the contracts won by AEL in FY21 in defence:
• Operations and maintenance of training simulators for Mi17 helicopters and MiG29
aircraft for the Indian Air Force on a BOM (Build Operate Maintain) basis for 20
years worth ~INR 2,200 cr.
• Upgrade of 16 Pechora Air Defence Missile Systems for the Indian Air Force for INR
591 cr.
AEL is present in manufacture of small arms and ammunition, aircraft and tank simulators
Source: Company Reports & Ventura Research
2.7% 2.8% 2.8% 2.9% 3.0%
3.5% 3.6%
0.0%
0.5%
1.0%
1.5%
2.0%
2.5%
3.0%
3.5%
4.0%
FY16 FY17 FY18 FY19 FY20 FY21E FY25E
Defence expenditure as a % of GDP
0
2
4
6
8
10
12
14
16
18
20
-
20,000
40,000
60,000
80,000
1,00,000
1,20,000
1,40,000
1,60,000
FY20 FY21 FY22
Capital outlay on defence in cr LHS Growth %
230230

( 9 t h D e c 2 0 2 1 )
For any further query, please email us on [email protected]
The defence business is expected to get boost from the various policies and initiatives like:
Focus on “Atmanirbhar Bharat”
Government of India has announced total embargo on 101 defence items progressively
beyond the year 2025. 101 Defence Products are declared in negative list for imports, thus
encouraging domestic manufacture and eliminating import of these products.
Subsequently, another of 108 items was also announced by MoD for embargo on imports
progressively upto 2025. The defence ministry estimates potential contract worth ~ INR 4
lakh crore (US$ 57.2 billion) for the domestic industry in the next 5-7 years (2025-2027).
Defence Procurement Procedure has been modified to further give priority to IDDM
(Indigenously Designed, Developed and Manufactured) to encourage indigenous design and
manufacture of defence equipment.
It is to be noted that AEL currently classifies revenues from roads, water, agro products,
defence & other ancillary businesses (like power trading, renewable plant in Australia etc)
in “other segment”. We have modelled the revenues from others segment to grow at 5.5%
CAGR over FY21-24. We expect the operating profits from others segments to touch INR
441.2 cr in FY24, assuming a combined operating margin of 2.9%.
Other segment revenues and EBIT profile
Source: Company Reports & Ventura Research
0%
5%
10%
15%
20%
25%
30%
0
2,000
4,000
6,000
8,000
10,000
12,000
14,000
16,000
FY20 FY21 FY22E FY23E FY24E
Other segment revenues are expected to grow at 5.5% CAGR over FY21-24
Others Revenues- LHS Growth
INR cr
-5%
0%
5%
10%
15%
20%
(500)
0
500
1,000
1,500
2,000
2,500
3,000
3,500
FY20 FY21 FY22E FY23E FY24E
Other segment EBIT are expected to reboun as roads, water, defence scale up
Others EBIT- LHS Margins
INR cr
231231

( 9 t h D e c 2 0 2 1 )
For any further query, please email us on [email protected]
Peer comparison
Revenue growth
EBIT growth EV/EBIT(x)
FY21-24E FY21-24E FY23E FY24E
AEL 5% -233%
Larsen & Toubro 14% 3% 19.1 16.3
KNR Infra 15% 12% 12.3 10.3
PNC Infratech 10% 8% 7.9 8.4
Dilip Buildcon 14% 14% 6.8 5.1
HAL 8% 5% 6.5 5.6
Cochin Shipyard Ltd. 12% 2% 3.6 4.0
Bharat Dynamics 29% 48% 8.1 6.6
BEL 14% 15% 12.5 10.2
Source: Company websites & Ventura Research, Bloomberg
Data Centres
To extend beyond pure B2B businesses to B2C, aggregation of data and a deeper
understanding of consumers is critical for long term success. In view of this, AEL entered
into the data centre business in a JV with EdgeConneX, a company with a decade’s
experience of serving global cloud service providers in mature markets to leverage the vast
quantum of data being generated by the company’s various consumer facing businesses –
airports, edible oils etc. – that interface every single day with millions of consumers and are
expected to cover an estimated 500 Mn consumers by 2025.
AEL entered the space for the following reasons:
• Adjacent to multiple Adani sectors like power, real estate and ports with the
potential to create a strong value proposition.
• Represents critical infrastructure for India in the modern world.
• Sunrise sector with rapid projected growth but insufficient capacity.
• Fragmented market, multiple players, sub-scale assets and small sectorial footprint.
• Government policy rapidly evolving, based on technology changes and recognition
of national security challenges.
• Capacity expected to treble in five years as Data Protection Bill indicates that all
internet companies will need to mandatorily store critical data of individuals within
the country.
Initially, the plan is to build data centers in the National Capital Region, Mumbai, Chennai,
Vizag & Hyderabad.
232232

( 9 t h D e c 2 0 2 1 )
For any further query, please email us on [email protected]
The JV with EdgeConneX is expected to build data centers all around India
Source: Company websites & Ventura Research
The data centre industry’s capacity in India is expected to double and exceed 1 GW by 2023
due to the increased use of data consumption and internet bandwidth in India is driven by:
• Increased reach of social media through Facebook, Twitter, LinkedIn, Instagram,
Youtube, etc.
• Extensive use of messaging services like WhatsApp, Telegram, etc.
• Increased use of smart devices like smartphones, tablets, smart home solutions,
etc.
• Increased adoption of IoT and cloud services by corporates. Make in India and
China+1 will attract more corporates to set up facilities in India, which is expected
to improve demand for IoT and cloud services
233233

( 9 t h D e c 2 0 2 1 )
For any further query, please email us on [email protected]
Significant jump in data consumption raised the demand for data localization
Source: TRAI Reports
COVID19-led travel restrictions and work from home has accelerated the data usage
resulting in increased demand for bandwidth as well as storage capacities. Although India
has emerged as one of the largest data consumers in the world, the number of data centres
and their capacities are significantly lower than in the US and China.
India’s data center market size compared with US and APAC
Source: Gartner, IDC & Cyber Media Research
Data localization will reduce latency and increase the response speed of apps and other
online programs. This will benefit the end consumers and improve internet usage.
Data centres consume significant power and other resources and therefore, many countries
have paused the new construction of data centres to divert power supply for other basic
141 152
178
200
30 37 44 55
2 3 5 7
CY14 CY16 CY18 CY20
India's data center market size (USD Bn)
Global APAC India
234234

( 9 t h D e c 2 0 2 1 )
For any further query, please email us on [email protected]
needs, and to focus on environmental sustainability. India is a natural fit for global data
centre operators looking at their expansion due to
• The large domestic consumer base
• Significant scaling up of renewable power capacities, which will reduce the reliance
on thermal power for data centres.
Key technical criteria for setting up data centres
• Minimal risk of natural disasters
• Proximity to power sub-stations
• Connectivity with national optical fibre network
• Distance from oil terminals and mass rapid transport systems
• Distance from residential societies or areas
Major investments announced in 2020 & 2021
• Carlyle bought a 25% stake in Extra Data (a wholly-owned subsidiary of Airtel) for
the USD 235 mn in July 2020.
• Equinix announced the acquisition of the India business of GPX Global Systems for
USD 161 mn in August 2020.
• Iron Mountain agreed to form a joint venture with Indian colocation Data Centre
provider WebWerks. Iron Mountain expects to invest USD 150 million over the next
two years.
Data centre operators are adopting large land acquisition strategies to fulfil the long term
requirements of large cloud players and occupiers with massive computing requirements.
AEL has expertise in the execution of large and complex infrastructure projects which
includes land acquisition and requires multiple statutory approvals from several civic and
governmental agencies. Hence arranging the land parcel and creating conducive
infrastructure for data centres would not be an issue for AEL.
Going forward, the JV is attractively placed to capture the high growth data centre market
due to following reasons:
• Complete ownership of large land parcels pan-India.
• Validated project management capabilities.
• End-to-end power value chain (generation, transmission and distribution) in a
business warranting the intensive use of electricity.
• Fiber connectivity and strong network connectivity.
• Captive renewable power generation to ensure sustainability.
We expect the data centre business to start earning revenues only from FY23 and have built
revenues of INR 55 cr and INR 340 cr in FY23 and FY24 with operating margins at 65%.
235235

( 9 t h D e c 2 0 2 1 )
For any further query, please email us on [email protected]
Data Centre segment revenues and EBIT profile
Source: Company Reports & Ventura Research
Peer comparison
Revenue growth
EBIT growth EV/EBIT(x)
FY24E FY24E FY23E FY24E
AEL 518% 518%
China Telecom Corp 5% 13% 10.0 8.5
Equinix Inc 8% 5% 61.1 48.6
KDDI America 1% 1% 7.5 6.9
Source: Company websites & Ventura Research, Bloomberg
Edible oil and Packaged food business
AEL entered into a JV in 1999 with Wilmar Group (Singapore), Asia’s leading agri-business
group to form Adani Wilmar Limited (AWL). The company is currently India’s leading
consumer edible oil company and one of the fastest growing FMCG companies in India. The
Company provides the largest range of edible oils (drawn from soya, sunflower, mustard,
rice bran, groundnut, cotton seed and others). Recently, AWL has ventured into the wider
foods categories comprising packed basmati rice, pulses, soya chunks, besan, atta and
khichdi. AWL products portfolio comprises prominent brands like Fortune, King’s, Bullet,
Raag, Avsar, Pilaf, Jubilee, Fryola, Alpha, Alife and Aadhar. AWL owns and manages more
than 25 units at various strategic locations across India and has emerged as one of the
leading exporters of castor oil, oleo-value added products and de-oiled cakes.
We expect revenues of AWL to grow at 9.8% CAGR over FY21-24 to INR 49,088 cr with the
edible oil business growing at 7.0% CAGR over the same period while the FMCG business
and industry essentials are expected to grow at a faster rate. We have modelled a gradual
0
50
100
150
200
250
300
350
400
FY23E FY24E
Data Centre revenues are expected from FY23 onwards
INR cr
0%
10%
20%
30%
40%
50%
60%
70%
0
50
100
150
200
250
FY23E FY24E
We expect EBIT margins of 65% given rental business
Data Centre EBIT- LHS Margins
INR cr
236236

( 9 t h D e c 2 0 2 1 )
For any further query, please email us on [email protected]
increase in operating margins from 2.9% in FY21 to 3.6% in FY24 leading to operating profits
growing at a 18.7% CAGR to INR 1,771 cr in FY24.
India’s edible oil consumption is expected to grow at 3.5% CAGR over the next 5 years
Source: Company DRHP & Ventura Research, OY is oil year from November to October
19
2221
25
0
5
10
15
20
25
30
OY14 OY19 OY20 OY25
India's edible oil consumptionMn MT
3,76,000
6,02,000
10,13,000
-
2,00,000
4,00,000
6,00,000
8,00,000
10,00,000
12,00,000
FY15 FY20 FY25E
Packaged Food retail market in IndiaINR Cr
87%
13%
Share in Indian edible oil in FY20. Total market size is INR 1,79,500 cr
Branded Unbranded
90%
10%
Share in Indian edible oil in FY25. Total market size is INR 2,38,000 cr
Branded Unbranded
237237

( 9 t h D e c 2 0 2 1 )
For any further query, please email us on [email protected]
AWL is present across all essential kitchen commodities
Source: Company DRHP & Ventura Research
AWL is present in all types of oil
Company Palm Soyabean Mustard Sunflower Cotton Groundnut Rice Bran Blended Vanaspati
AWL ✓ ✓ ✓ ✓ ✓ ✓ ✓ ✓ ✓
Ruchi Soya ✓ ✓ ✓ ✓ ✓ ✓ ✓
Emami ✓ ✓ ✓ ✓ ✓ ✓ ✓
Cargill ✓ ✓ ✓ ✓ ✓
Bunge ✓ ✓ ✓ ✓ ✓ ✓ ✓
Marico ✓
Gemini ✓ ✓ ✓ ✓ ✓
Agro tech ✓ ✓
Source: Company DRHP & Ventura Research
FMCG companies Edible oils Wheat flour Rice Pulses Sugar Dairy
Adani Wilmar ✓ ✓ ✓ ✓ ✓
HUL ✓
Dabur
ITC ✓ ✓
Nestle
Britannia
Godrej
Marico ✓
Parle
Pepsi Co
Ruchi Soya ✓ ✓
Patanjali ✓ ✓ ✓ ✓ ✓
Emami Agrotech ✓
238238

( 9 t h D e c 2 0 2 1 )
For any further query, please email us on [email protected]
AWL has the largest market share as of FY20 in edible oil
Source: Company DRHP & Ventura Research
Company wise edible oil brands
Source: Company Reports & Ventura Research
17%
8%
6%
4%
3%
1%
60%
Adani Wilmar Ruchi Soya Emami Cargill Bunge Marico Others
239239

( 9 t h D e c 2 0 2 1 )
For any further query, please email us on [email protected]
Adani Wilmar revenues and EBIT profile
Source: Company Reports & Ventura Research
Peer comparison
Revenue growth
EBIT growth EV/EBIT(x) EV/sales
FY21-24E FY21-24E FY23E FY24E FY23E FY24E
AEL 10% 19%
HUL 10% 14% 39.3 34.1 9.4 8.5
Marico 13% 15% 34.1 29.8 6.4 5.8
ITC 6% 14% 12.3 11.7 4.4 4.2
Source: Company websites & Ventura Research, Bloomberg
0%
5%
10%
15%
20%
25%
30%
0
10,000
20,000
30,000
40,000
50,000
60,000
FY20 FY21 FY22E FY23E FY24E
AWL revenues are expected to grow at 9.8% CAGR over FY21-24
AWL revenues- LHS Growth
INR cr
2.5%
2.7%
2.9%
3.1%
3.3%
3.5%
3.7%
800
1,000
1,200
1,400
1,600
1,800
2,000
FY20 FY21 FY22E FY23E FY24E
AWL EBIT is expected to slowly inch upwards as non edible oil segment revenue scales up
AWL EBIT- LHS Margins
INR cr
240240

( 9 t h D e c 2 0 2 1 )
For any further query, please email us on [email protected]
Business Quality Score
Key Criteria Score Risk Comments
Management & Leadership
Management Quality 7 Low All the businesses have their own CEOs who are responsible for driving the business operations and achieving the desired targets.
Promoters Holding Pledge 6 Low The promoter holding is 74.9% and promoter pledging as of 30th Sept, 2021 is 4.5%.
Board of Directors Profile 8 Low The board consists of 8 directors with 4 of them being independent.
Industry Consideration
Industry Growth 8 Low Except mining and IRM, which are more or less matured industries, all the other businesses have high growth potential
Regulatory Environment or Risk 4 High The airport, mining and solar businesses are dependent on government regulations while other businesses are comparatively less dependent on government policies.
Entry Barriers / Competition 6 Low Entry barriers are access to capital, technical know-how.
Business Prospects
New Business / Client Potential 8 Low
AEL is an incubator of various businesses and has a successful track record of demerging businesses and creating shareholder value once they are big enough to stand on their own.
Market Share Potential 8 Low Market share for new businesses are expected to increase in future. Mature businesses are already more or less industry leaders in their respective segment.
Margin Expansion Potential 6 Low Once businesses reach a threshold, margin expansion is expected. Till then, the focus will be on growth and expansion.
Earnings Growth 8 Low Earnings are expected to remain strong given the huge investments in new age infra businesses.
Valuation and Risk
Balance Sheet Strength 4 High AEL is expected to embark on huge capex over the next 3-4 years and hence net debt to EBITDA is expected to deteriorate.
Debt Profile 4 High As already discussed above, net debt is expected to remain high.
FCF Generation 4 High We do not expect free cash flow generation due to high capex.
Dividend Policy 3 High Dividend yield is negligible.
Total Score 98 Medium
The overall risk profile of the company is good and we consider it as a medium risk company for investments Ventura score (%) 60
Source: Company Reports & Ventura Research, Total score >=75 = low risk, between 50-74 = medium risk, less than 50= high risk
241241

( 9 t h D e c 2 0 2 1 )
For any further query, please email us on [email protected]
Annual Report Analysis
We analyzed the FY21 annual report of USL and our key observations are as follows:
Key takeaways & outlook on various businesses:
• Mining- Intends to emerge as one of the largest and most diversified mining groups
in the world. It is expected that the Carmichael mine in Australia could commence
operations in FY22. AEL will operationalise at least three mines in India in FY22.
• Solar- AEL is in line to expand its installed capacity to 3.5 GW per annum with a
probable backward integration into the manufacture of ingots, wafers and polysilicon.
The Company will focus on the development of ancillaries in the EMC cluster for
ensuring the timely localisation of key raw materials & will align with the government
focus on the solarisation of agricultural pumps and increasing rooftop solar
installations across the country.
• Airports- The outlook for the airport infrastructure business is positive on account of
the government’s decision to progressively divest ownership stakes in Indian airports
in favour of private operators. The Company intends to re-define India’s airports
infrastructure sector through gateway development, regional footprint growth, focus
on consumers and non-passengers and deeper investment in digital technology
interventions.
• Roads/Highways- Will seek mergers and acquisitions that enhance access to
superior assets that maximise cash flows.
• Water- Scope of big players like AEL is widened given India’s water infrastructure
sector is marked by a larger number of projects coupled with a higher value of most
projects.
• Data centres- India’s digital economy is expected to touch USD 1 Trn by 2025. India
possesses one of the world’s largest data subscriber populations. There is a growing
appetite for reliable infrastructure to support Cloud, Content, Network, IoT, 5G, AI and
enterprise requirements. India’s Data Centre Policy encourages companies to build
data centre parks (providing infrastructure status) through incentives.
• Packaged food and edible oil- Adani Wilmar intends to widen its foods platform
across different segments addressing the needs of a growing India. The growing
optimism with regard to the consumption of hygienic, branded and packages food
products, a trend that has deepened following the pandemic, is now being viewed as
irreversible and holds out attractive multi-year prospects.
242242

( 9 t h D e c 2 0 2 1 )
For any further query, please email us on [email protected]
• Agro products- The share of the organized retail (market size INR 7,050 Bn) at 11.9%
provides a large headroom for multi-decade growth. Interestingly, the organised share
of the food & grocery space is only 4.50% and projected to grow at 22% annually to
around 9% retail penetration by 2025.
• Defence- AEL plans to create a tiered vendor base to catalyse indigenisation and
localization. Further, it seeks to commission a final assembly and integration line
including MRO facilities by incorporating technology transfer to support products
during their lifecycle.
Board meetings
During the financial year 2020-21 the Board of Directors met 4 times on 6th May, 2020, 6th
August, 2020, 4th November, 2020 and 3rd February, 2021 and the gap between any two
Board Meetings did not exceed 120 days as required by the Companies Act. The attendance of
all the members was satisfactory.
Board member attendance has been excellent
Name of director Board
meetings Meetings attended % attendance
Gautam Adani 4 7 100% Rajesh Adani 4 4 100% Pranav Adani 4 4 100% Vinay Prakash 4 4 100% Hemant Nerurkar 4 4 100% V Subramanian 4 4 100% Vijaylakshmi Joshi 4 4 100% Narendra Mairpady 4 4 100% Total attendance 32 32 100%
Source: Company Reports & Ventura Research
Remuneration to KMP
The remuneration is commensurate with the size of the company and operating performance.
However, remuneration of independent directors is miniscule given the size of the company.
Remuneration of top management has more or less followed performance
FY19 FY20 FY21
Chairman 2.1 2.2 2.2
As a % of PBT 0.4% 0.2% 0.2%
MD 4.2 4.3 4.5
As a % of PBT 0.8% 0.4% 0.4%
Executive Directors 18.8 18.7 25.3
As a % of PBT 3.7% 1.7% 2.3%
Independent Directors 0.7 0.8 1.0
As a % of PBT 0.1% 0.1% 0.1%
Total 25.8 25.9 33.1
As a % of PBT 5.1% 2.3% 3.0%
Source: Company Reports & Ventura Research
243243

( 9 t h D e c 2 0 2 1 )
For any further query, please email us on [email protected]
Auditor qualifications
Shah Dhandharia & Co LLP is the auditor. However, given the size of the company, appointment
of a bigger audit firm would have provided more comfort. No audit qualifications have been
given on financial statements.
Related Party Transactions
Related party transactions are high given the complex business structure and multiple
businesses.
Due to the very nature of business, related party transactions are too high
Source: Company & Ventura Research
Contingent Liabilities
Contingent liabilities as a % of networth are 38.8% of total networth as on FY21 However, 74%
of the same is on account of guarantees and LCs.
Contingent liabilities are high but consists mostly of guarantees
Source: Company Reports & Ventura research
INR cr
FY20 FY21 FY20 FY21 FY20 FY21 FY20 FY21 FY20 FY21
Sale of goods 29.7 1,218.6 267.9 - 4,004.2 2,399.1 - - 4,301.8 3,617.7
As a % of revenue 0.1% 3.1% 0.6% 0.0% 9.2% 6.1% 0.0% 0.0% 9.9% 9.2%
Purchase of goods 0.0 0.0 - - 2,275.9 3,243.9 - - 2,276.0 3,243.9
As a % of RM cost 0.0% 0.0% 0.0% 0.0% 6.6% 10.7% 0.0% 0.0% 6.6% 10.7%
Loans given 1,096.4 5,379.1 255.5 76.4 4,308.9 7,155.8 - - 5,660.8 12,611.4
As a % of total assets 4.7% 17.9% 1.1% 0.3% 18.5% 23.8% 0.0% 0.0% 24.3% 41.9%
Loans taken 1,611.0 2,621.9 50.3 151.4 6,292.8 10,213.1 - - 7,954.1 12,986.4
As a % of total assets 6.9% 8.7% 0.2% 0.5% 27.0% 33.9% 0.0% 0.0% 34.1% 43.2%
Others 1,110.9 96.6 2.7 2.6 1,599.8 2,102.1 40.3 59.6 2,753.7 2,261.0
As a % of revenue 2.6% 0.2% 0.0% 0.0% 3.7% 5.3% 0.1% 0.2% 6.3% 5.7%
Jointly controlled
entities Associates Other related parties KMP Total
INR cr FY20 FY21
Claims 4.0 4.3
Tax 1,776.3 1,739.7
Guarantee 3,925.8 3,843.0
LC 696.2 1,062.2
Total 6,402.2 6,649.1
As a % of networth 37.8% 38.8%
244244

( 9 t h D e c 2 0 2 1 )
For any further query, please email us on [email protected]
Board of Directors details
Board consists of 50% independent directors
Key Person Designation Details
Gautam Adani Chairman He has > 33 years of business experience. Under his leadership, Adani Group has emerged as a global integrated infrastructure player with interest across Resources, Logistics and Energy verticals.
Rajesh Adani MD He has been associated with Adani Group since its inception. He is in charge of the operations of the Group and has been responsible for developing its business relationships.
Pranav Adani Director He has been active in the group since 1999. He has spearheaded the JV with the Wilmar Group of Singapore and transformed it from a single refinery edible oil business into a pan India Food Company.
Vinay Prakash Director
He has nurtured the Natural Resources business of the Adani Group since its inception and oversees its diversification and expansion in India and abroad. Natural Resources division comprises of Integrated Coal Management, Iron Ore, Minerals, Bunkering, Mining, Cement & Aggregate Businesses.
Hemant Nerurkar Independent and Non-
Executive Director
He has over 35 years of experience in steel industry in various functions. Mr. Nerurkar is an executive with multifaceted experience ranging from Project Execution, Manufacturing, Quality Control, Supply Chain and Marketing.
V. Subramanian Independent and Non-
Executive Director
He was the Secretary to the Government of India with the Ministry of New and Renewable Energy (MNRE) where he pioneered important initiatives for reforms and development of the renewable energy sector, including the introduction of the "Feed-in Tariff" concept.
Vijaylaxmi Joshi Independent and Non-
Executive Director
She is a 1980 batch IAS officer of the Gujarat cadre. She had served in various posts in the State and in the Centre. She had been Joint and Additional secretary in the Commerce Ministry between 2011 to 2014.
Narendra Mairpady
Independent and Non-Executive Director
He is an eminent banking professional having more than 40 years of wide experience and exposure. He was appointed as Chairman and Managing Director of Indian Overseas Bank in 2010 and retired as CMD in 2014.
Source: Company, Ventura Research
245245

( 9 t h D e c 2 0 2 1 )
For any further query, please email us on [email protected]
Key Risks & Concerns
• Issue of Carmichael mine: While Carmichael mine project is finally expected to see the
light of the day, the controversy surrounding its effect on nearby flora and fauna still
remains. Any major protest ahead for the same can negatively affect the company’s
financials going forward.
• Low ESG score: While AEL has put in place definite ESG targets, the company’s ESG
score remains low due to the very nature of the mining business. This can affect the
investments into other businesses of the company by global funds/ strategic partners
who are now required to invest only in strict ESG compliant companies.
• Foreign Exchange Risk: AEL is exposed to risks resulting from exchange rate fluctuation
and interest rate movements. It manages its exposure to these risks through derivative
financial instruments.
• Commodity price risk: Being in infrastructure business, the rise in price of commodities
always affect margins as not all costs are pass through.
• Debt: AEL is expected to embark on a huge capex over the next 3-4 years and hence
net debt is expected to increase considerably.
246246

( 9 t h D e c 2 0 2 1 )
For any further query, please email us on [email protected]
Quarterly and Annual Performance
Source: Company Reports & Ventura Research
Fig in INR Cr (unless specified) Q1FY20 Q2FY20 Q3FY20 Q4FY20 FY20 Q1FY21 Q2FY21 Q3FY21 Q4FY21 FY21 Q1FY22 Q2FY22 FY22E FY23E FY24E
Revenue from operations 10,561.4 8,464.2 10,948.2 13,428.8 43,402.6 5,265.2 9,126.4 11,620.5 13,525.1 39,537.1 12,578.8 13,218.0 54,207.5 64,877.4 69,413.2
YoY Growth (%) 5.7 (50.1) 7.8 6.1 0.7 (8.9) 138.9 44.8 37.1 19.7 7.0
Raw Material Cost 8,413.9 6,834.8 8,717.4 10,694.2 34,660.3 4,199.9 6,888.3 8,835.1 10,324.6 30,247.8 9,245.2 9,897.7 40,791.1 48,495.9 51,539.3
RM Cost to Sales (%) 79.7 80.7 79.6 79.6 79.9 79.8 75.5 76.0 76.3 76.5 73.5 74.9 75.3 74.8 74.3
Employee Cost 165.3 171.7 184.2 161.3 682.5 205.6 203.1 220.5 200.1 829.3 228.9 289.7 1,192.6 1,362.4 1,388.3
Employee Cost to Sales (%) 1.6 2.0 1.7 1.2 1.6 3.9 2.2 1.9 1.5 2.1 1.8 2.2 2.2 2.1 2.0
Other Expenses 1,210.6 1,080.0 1,289.3 2,195.5 5,775.4 795.8 1,283.9 1,796.3 2,096.7 5,954.9 2,308.2 2,148.1 8,659.9 7,846.7 7,250.5
Other Expenses to Sales (%) 11.5 12.8 11.8 16.3 13.3 15.1 14.1 15.5 15.5 15.1 18.3 16.3 16.0 12.1 10.4
EBITDA 771.5 377.7 757.3 377.7 2,284.3 64.0 751.2 768.5 903.7 2,505.1 796.4 882.6 3,563.8 7,172.5 9,235.1
EBITDA Margin (%) 7.3 4.5 6.9 2.8 5.3 1.2 8.2 6.6 6.7 6.3 6.3 6.7 6.6 11.1 13.3
Net Profit 601.2 49.5 426.3 61.2 1,138.2 29.8 362.4 296.8 234.0 922.6 271.5 212.4 834.7 1,020.1 1,227.1
Net Margin (%) 5.7 0.6 3.9 0.5 2.6 0.6 4.0 2.6 1.7 2.3 2.2 1.6 1.5 1.6 1.8
Adjusted EPS 5.5 0.5 3.9 0.6 10.3 0.3 3.3 2.7 2.1 8.4 2.5 1.9 7.6 9.3 11.2
P/E (X) 166.5 205.4 227.0 185.8 154.4
Adjusted BVPS 154.1 156.0 172.3 181.6 192.8
P/BV (X) 11.2 11.0 10.0 9.5 8.9
Enterprise Value 197,716.6 202,948.5 224,244.0 244,041.7 253,304.8
EV/EBITDA (X) 86.6 81.0 62.9 34.0 27.4
Net Worth 16,946.6 17,158.6 18,953.1 19,973.2 21,200.4
Return on Equity (%) 6.7 5.4 4.4 5.1 5.8
Capital Employed 28,599.2 32,451.9 56,857.6 77,558.4 88,120.6
Return on Capital Employed (%) 4.5 4.2 3.3 5.4 6.2
Invested Capital 25,167.6 30,611.6 53,701.6 74,519.5 85,009.7
Return on Invested Capital (%) 7.2 6.4 4.7 7.5 8.6
Cash Flow from Operations 2,453.6 4,093.5 1,514.2 5,470.3 8,295.4
Cash Flow from Investing (2,323.0) (7,902.4) (11,726.6) (20,256.5) (11,148.1)
Cash Flow from Financing (220.9) 3,058.6 11,342.9 14,667.5 2,923.0
Net Cash Flow (90.3) (750.3) 1,130.5 (118.6) 70.3
Free Cash Flow 612.5 440.9 (6,996.8) (16,398.9) (5,022.7)
FCF to Revenue (%) 1.4 1.1 (12.9) (25.3) (7.2)
FCF to EBITDA (%) 26.8 17.6 (196.3) (228.6) (54.4)
FCF to Net Profit (%) 53.8 47.8 (838.2) (1,607.5) (409.3)
FCF to Net Worth (%) 3.6 2.6 (36.9) (82.1) (23.7)
Total Debt 11,652.7 15,293.3 37,904.5 57,585.2 66,920.2
Net Debt 8,221.0 13,453.0 34,748.4 54,546.2 63,809.3
Net Debt to Equity (X) 0.5 0.8 1.8 2.7 3.0
Net Debt to EBITDA (X) 3.6 5.4 9.8 7.6 6.9
Interest Coverage Ratio (X) 1.2 1.4 0.9 1.1 1.1
247247

( 9 t h D e c 2 0 2 1 )
For any further query, please email us on [email protected]
Summary of qualitative management commentary over the last few quarters
Key Criteria View Comments
Q3FY21
Business Performance NEUTRAL
• Revenues up 6.1% YoY, EBITDA up 1.5% YoY, PAT down 30.4% YoY.
• Taken over operations, management and development of Mangaluru, Lucknow and
Ahmedabad airports during Q3FY21.
Outlook and strategy
POSITIVE
• Commercial mining capex expected at INR 7,000- 8,000 cr over next 3 years.
Q4FY21
Business Performance POSITIVE
• Revenues up 0.7% YoY, EBITDA up 139.2% YoY, PAT up 282.2% YoY.
• The rise in EBITDA was predominantly driven by solar manufacturing on account of
increase in sales to DCR segment in the sales mix.
Outlook and strategy POSITIVE
• Airport capex pegged at INR 12,000 cr in next 1-2 years.
Q1FY22
Business Performance POSITIVE
• On a lower base, revenues up 138.9% YoY, EBITDA up 1,145.4% YoY,PAT up 811.2% YoY.
• AEL operationalized Kurmitar Iron Ore mine in Orissa in Q1FY22.
Outlook and strategy POSITIVE
• Airports business is looked at more of a B2C business and idea is to increase non aero revenues rather than aero revenues.
Q2FY22 Business Performance
POSITIVE
• Revenues up 44.8% YoY, EBITDA up 17.5% YoY, PAT down 41.4% YoY.
• In H1 FY22 the mining production volume increased by 91% at 10.9 million metric ton on
YoY basis.
• Mining dispatch increased by 77% at 9.9 million metric ton on YoY basis.
Outlook and strategy
POSITIVE
• Board of Directors have approved formation of corporate responsibility committee with
100% independent directors.
• The committee’s primary objective is to provide assurance towards ESG commitments.
Source: Company Reports & Ventura
248248

( 9 t h D e c 2 0 2 1 )
For any further query, please email us on [email protected]
Financial Analysis & Projections
Source: Company Reports & Ventura Research
Fig in INR Cr (unless specified) FY20 FY21 FY22E FY23E FY24E Fig in INR Cr (unless specified) FY20 FY21 FY22E FY23E FY24E
Income Statement Per share data & Yields
Revenue 43,402.6 39,537.1 54,207.5 64,877.4 69,413.2 Adjusted EPS (INR) 10.3 8.4 7.6 9.3 11.2
YoY Growth (%) 5.7 (8.9) 37.1 19.7 7.0 Adjusted Cash EPS (INR) 14.6 13.3 17.3 23.6 28.9
Raw Material Cost 34,660.3 30,247.8 40,791.1 48,495.9 51,539.3 Adjusted BVPS (INR) 154.1 156.0 172.3 181.6 192.8
RM Cost to Sales (%) 79.9 76.5 75.3 74.8 74.3 Adjusted CFO per share (INR) 22.3 37.2 13.8 49.7 75.4
Employee Cost 682.5 829.3 1,192.6 1,362.4 1,388.3 CFO Yield (%) 1.3 2.2 0.8 2.9 4.4
Employee Cost to Sales (%) 1.6 2.1 2.2 2.1 2.0 Adjusted FCF per share (INR) 5.6 4.0 (63.6) (149.1) (45.7)
Other Expenses 5,775.4 5,954.9 8,659.9 7,846.7 7,250.5 FCF Yield (%) 0.3 0.2 (3.7) (8.7) (2.7)
Other Exp to Sales (%) 13.3 15.1 16.0 12.1 10.4
EBITDA 2,284.3 2,505.1 3,563.8 7,172.5 9,235.1 Solvency Ratio (X)
Margin (%) 5.3 6.3 6.6 11.1 13.3 Total Debt to Equity 0.7 0.9 2.0 2.9 3.2
YoY Growth (%) 6.6 9.7 42.3 101.3 28.8 Net Debt to Equity 0.5 0.8 1.8 2.7 3.0
Depreciation & Amortization 472.1 537.1 1,063.0 1,572.2 1,956.7 Net Debt to EBITDA 3.6 5.4 9.8 7.6 6.9
EBIT 1,812.3 1,967.9 2,500.9 5,600.3 7,278.4
Margin (%) 4.2 5.0 4.6 8.6 10.5 Return Ratios (%)
YoY Growth (%) 5.0 8.6 27.1 123.9 30.0 Return on Equity 6.7 5.4 4.4 5.1 5.8
Other Income 683.7 753.8 836.7 845.1 853.5 Return on Capital Employed 4.5 4.2 3.3 5.4 6.2
Finance Cost 1,572.3 1,376.9 2,659.9 5,013.2 6,412.0 Return on Invested Capital 7.2 6.4 4.7 7.5 8.6
Interest Coverage (X) 1.2 1.4 0.9 1.1 1.1
Exceptional Item 198.8 (258.9) 0.0 0.0 0.0 Working Capital Ratios
PBT 1,122.3 1,086.0 677.7 1,432.1 1,720.0 Payable Days (Nos) 99 109 95 93 91
Margin (%) 2.6 2.7 1.3 2.2 2.5 Inventory Days (Nos) 22 16 24 24 23
YoY Growth (%) 119.7 (3.2) (37.6) 111.3 20.1 Receivable Days (Nos) 111 111 85 83 81
Tax Expense 324.3 339.7 170.6 360.5 432.9 Net Working Capital Days (Nos) 33 18 14 14 13
Tax Rate (%) 28.9 31.3 25.2 25.2 25.2 Net Working Capital to Sales (%) 9.0 5.0 3.8 3.7 3.6
PAT 798.0 746.3 507.1 1,071.7 1,287.0
Margin (%) 1.8 1.9 0.9 1.7 1.9 Valuation (X)
YoY Growth (%) 152.1 (6.5) (32.1) 111.3 20.1 P/E 166.5 205.4 227.0 185.8 154.4
Min Int/Sh of Assoc 340.2 176.3 327.6 (51.5) (59.9) P/BV 11.2 11.0 10.0 9.5 8.9
Net Profit 1,138.2 922.6 834.7 1,020.1 1,227.1 EV/EBITDA 86.6 81.0 62.9 34.0 27.4
Margin (%) 2.6 2.3 1.5 1.6 1.8 EV/Sales 4.6 5.1 4.1 3.8 3.6
YoY Growth (%) 58.7 (18.9) (9.5) 22.2 20.3 M.cap/Sales 4.4 4.8 3.5 2.9 2.7
Balance Sheet Cash Flow Statement
Share Capital 110.0 110.0 110.0 110.0 110.0 PBT 1,122.3 1,086.0 677.7 1,432.1 1,720.0
Total Reserves 16,836.6 17,048.6 18,843.1 19,863.3 21,090.4 Adjustments 563.7 1,435.3 2,539.0 5,409.0 7,374.3
Shareholders Fund 16,946.6 17,158.6 18,953.1 19,973.2 21,200.4 Change in Working Capital 1,091.9 1,911.9 (1,721.2) (1,010.3) (365.9)
Minority Interest 1,263.4 1,751.4 4,581.4 5,229.5 6,078.5 Less: Tax Paid (324.3) (339.7) 18.6 (360.5) (432.9)
Deferred Tax Assets / Liabilities (249.5) (50.4) 2,624.8 2,624.8 2,624.8 Cash Flow from Operations 2,453.6 4,093.5 1,514.2 5,470.3 8,295.4
Other Long Term Liabilities 1,797.4 1,623.5 7,860.1 9,407.2 10,064.9 Net Capital Expenditure (2,721.5) (3,359.0) (8,537.6) (21,100.0) (12,000.0)
Long Term Borrowings 3,515.8 9,523.3 29,502.3 48,502.3 57,202.3 Change in Investments 398.5 (4,543.4) (3,189.0) 843.5 851.9
Long Term Provisions 63.0 76.8 105.3 126.1 134.9 Cash Flow from Investing (2,323.0) (7,902.4) (11,726.6) (20,256.5) (11,148.1)
Total Liabilities 23,336.7 30,083.2 63,627.0 85,863.2 97,305.8 Change in Borrowings 3,274.1 7,520.1 13,667.3 19,680.7 9,335.0
Net Block 10,592.5 10,976.8 31,035.0 50,562.8 60,606.1 Other financial activities 317.0 (152.5) (42.9) 0.0 0.0
Capital Work in Progress 7,231.1 8,686.3 19,880.0 19,880.0 19,880.0 Interest Paid (1,532.2) (1,211.7) (2,281.5) (5,013.2) (6,412.0)
Non Current Investments 1,897.5 5,473.4 2,725.2 3,321.9 4,111.0 Cash flow from Financing (220.9) 3,058.6 11,342.9 14,667.5 2,923.0
Long Term Loans & Advances 2,383.7 5,201.5 5,095.5 6,098.5 6,524.8 Net Cash Flow (90.3) (750.3) 1,130.5 (118.6) 70.3
Other Non Current Assets 338.2 1,265.1 4,553.4 5,449.7 5,830.7 Forex Effect/Merger 1,241.1 (708.3) 183.8 0.0 0.0
Net Current Assets 894.1 (1,519.7) 338.0 550.5 353.4 Opening Balance of Cash 973.9 2,124.7 666.2 1,980.4 1,861.7
Total Assets 23,336.7 30,083.2 63,627.0 85,863.2 97,305.8 Closing Balance of Cash 2,124.7 666.2 1,980.4 1,861.7 1,932.0
249249

( 9 t h D e c 2 0 2 1 )
For any further query, please email us on [email protected]
Disclosures and Disclaimer
Ventura Securities Limited (VSL) is a SEBI registered intermediary offering broking, depository and portfolio management services to clients. VSL is member of BSE, NSE
and MCX-SX. VSL is a depository participant of NSDL. VSL states that no disciplinary action whatsoever has been taken by SEBI against it in last five years except
administrative warning issued in connection with technical and venial lapses observed while inspection of books of accounts and records. Ventura Commodities Limited,
Ventura Guaranty Limited, Ventura Insurance Brokers Limited and Ventura Allied Services Private Limited are associates of VSL. Research Anal yst (RA) involved in the
preparation of this research report and VSL disclose that neither RA nor VSL nor its associates (i) have any financial interest in the company which is the subject matter
of this research report (ii) holds ownership of one percent or more in the securities of subject company (iii) have any material conflict of interest at the time of
publication of this research report (iv) have received any compensation from the subject company in the past twelve months (v) have managed or co-managed public
offering of securities for the subject company in past twelve months (vi) have received any compensation for investment banking merchant banking or brokerage
services from the subject company in the past twelve months (vii) have received any compensation for product or services from the subject company in the past twelve
months (viii) have received any compensation or other benefits from the subject company or third party in connection with the research report. RA involved in the
preparation of this research report discloses that he / she has not served as an officer, director or employee of the subject company. RA involved in the preparation of
this research report and VSL discloses that they have not been engaged in the market making activity for the subject company. Our sales people, dealers, traders and
other professionals may provide oral or written market commentary or trading strategies to our clients that reflect opinions that are contrary to the opinions expressed
herein. We may have earlier issued or may issue in future reports on the companies covered herein with recommendations/ information inconsistent or different those
made in this report. In reviewing this document, you should be aware that any or all of the foregoing, among other things, may give rise to or potential conflicts of
interest. We may rely on information barriers, such as "Chinese Walls" to control the flow of information contained in one or more areas within us, or other areas, units,
groups or affiliates of VSL. This report is for information purposes only and this document/material should not be construed as an offer to sell or the solicitation of an
offer to buy, purchase or subscribe to any securities, and neither this document nor anything contained herein shall form the basis of or be relied upon in connection
with any contract or commitment whatsoever. This document does not solicit any action based on the material contained herein. It is for the general information of the
clients / prospective clients of VSL. VSL will not treat recipients as clients by virtue of their receiving this report. It does not constitute a personal recommendation or
take into account the particular investment objectives, financial situations, or needs of clients / prospective clients. Similarly, this document does not have regard to
the specific investment objectives, financial situation/circumstances and the particular needs of any specific person who may receive this document. The securities
discussed in this report may not be suitable for all investors. The appropriateness of a particular investment or strategy wi ll depend on an investor's individual
circumstances and objectives. Persons who may receive this document should consider and independently evaluate whether it is suitable for his/ her/their particular
circumstances and, if necessary, seek professional/financial advice. And such person shall be responsible for conducting his/her/their own investigation and analysis of
the information contained or referred to in this document and of evaluating the merits and risks involved in the securities forming the subject matter of this document.
The projections and forecasts described in this report were based upon a number of estimates and assumptions and are inherently subject to significant uncertainties
and contingencies. Projections and forecasts are necessarily speculative in nature, and it can be expected that one or more of the estimates on which the projections
and forecasts were based will not materialize or will vary significantly from actual results, and such variances will likely increase over time. All projections and forecasts
described in this report have been prepared solely by the authors of this report independently of the Company. These projections and forecasts were not prepared with
a view toward compliance with published guidelines or generally accepted accounting principles. No independent accountants have expressed an opinion or any other
form of assurance on these projections or forecasts. You should not regard the inclusion of the projections and forecasts des cribed herein as a representation or
warranty by VSL, its associates, the authors of this report or any other person that these projections or forecasts or their underlying assumptions will be achieved. For
these reasons, you should only consider the projections and forecasts described in this report after carefully evaluating all of the information in this report, including
the assumptions underlying such projections and forecasts. The price and value of the investments referred to in this document/material and the income from them
may go down as well as up, and investors may realize losses on any investments. Past performance is not a guide for future performance. Future returns are not
guaranteed and a loss of original capital may occur. Actual results may differ materially from those set forth in projections . Forward-looking statements are not
predictions and may be subject to change without notice. We do not provide tax advice to our clients, and all investors are s trongly advised to consult regarding any
potential investment. VSL, the RA involved in the preparation of this research report and its associates accept no liabilities for any loss or damage of any kind arising out
of the use of this report. This report/document has been prepared by VSL, based upon information available to the public and sources, believed to be reliable. No
representation or warranty, express or implied is made that it is accurate or complete. VSL has reviewed the report and, in so far as it includes current or historical
information, it is believed to be reliable, although its accuracy and completeness cannot be guaranteed. The opinions expressed in this document/material are subject
to change without notice and have no obligation to tell you when opinions or information in this report change. This report or recommendations or information
contained herein do/does not constitute or purport to constitute investment advice in publicly accessible media and should not be reproduced, transmitted or published
by the recipient. The report is for the use and consumption of the recipient only. This publication may not be distributed to the public used by the public media without
the express written consent of VSL. This report or any portion hereof may not be printed, sold or distributed without the wri tten consent of VSL. This document does
not constitute an offer or invitation to subscribe for or purchase or deal in any securities and neither this document nor anything contained herein shall form the basis
of any contract or commitment whatsoever. This document is strictly confidential and is being furnished to you solely for your information, may not be distributed to
the press or other media and may not be reproduced or redistributed to any other person. The opinions and projections express ed herein are entirely those of the
author and are given as part of the normal research activity of VSL and are given as of this date and are subject to change without notice. Any opinion estimate or
projection herein constitutes a view as of the date of this report and there can be no assurance that future results or events will be consistent with any such opinions,
estimate or projection. This document has not been prepared by or in conjunction with or on behalf of or at the instigation of, or by arrangement with the company or
any of its directors or any other person. Information in this document must not be relied upon as having been authorized or approved by the company or its directors
or any other person. Any opinions and projections contained herein are entirely those of the authors. None of the company or its directors or any other person accepts
any liability whatsoever for any loss arising from any use of this document or its contents or otherwise arising in connection therewith. The information contained herein
is not intended for publication or distribution or circulation in any manner whatsoever and any unauthorized reading, dissemination, distribution or copying of this
communication is prohibited unless otherwise expressly authorized. Please ensure that you have read “Risk Disclosure Document for Capital Market and Derivatives
Segments” as prescribed by Securities and Exchange Board of India before investing in Securities Market.
Ventura Securities Limited - SEBI Registration No.: INH000001634
Corporate Office: I-Think Techno Campus, 8th Floor, ‘B’ Wing, Off Pokhran Road No 2, Eastern Express Highway, Thane (W) – 400608
250250