Glucose hypometabolism of hypothalamus and thalamus in narcolepsy
29
Novel PINK1 Mutations in Early-Onset Parkinsonism Yasuko Hatano, MD, 1 Yuanzhe Li, MD, 1 Kenichi Sato, MD, PhD, 1 Shuichi Asakawa, PhD, 2 Yasuhiro Yamamura, MD, 3 Hiroyuki Tomiyama, MD, 1 Hiroyo Yoshino, BS, 1 Masato Asahina, MD, 4 Susumu Kobayashi, MD, 5 Sharon Hassin-Baer, MD, 6 Chin-Song Lu, MD, 7 Arlene R. Ng, MD, 8 Raymond L. Rosales, MD, PhD, 9 Nobuyoshi Shimizu, PhD, 2 Tatsushi Toda, MD, PhD, 10,11 Yoshikuni Mizuno, MD, 1 and Nobutaka Hattori, MD, PhD 1,11 PINK1 was recently found to be associated with PARK6 as the causative gene. We performed mutation analysis in eight inbred families whose haplotypes link to the PARK6 region. We identified six pathogenic mutations (R246X, H271Q, E417G, L347P, and Q239X/R492X) in six unrelated families. All sites of mutations were novel, suggesting that PINK1 may be the second most common causative gene next to parkin in parkinsonism with the recessive mode of inheritance. Ann Neurol 2004;56:424 – 427 The primary cause of Parkinson’s disease (PD) is still unknown despite recent progress in research on the molecular mechanism of loss of dopaminergic neurons. Although most patients with PD are sporadic, identi- fication of causative genes of the rare monogenic forms of PD or parkinsonism could provide important in- sights into the understanding of disease pathogenesis. To date, four genes have been identified as the caus- ative genes for familial parkinsonism: mutations of -synuclein and UCH-L1 in autosomal dominant forms of parkinsonism and mutations of parkin and DJ-1 in autosomal recessive forms. Among the monogenic forms of parkinsonism, mutations of parkin have been detected in approximately 50% of cases with autosomal recessive early-onset parkinsonism (AREP). 1 Although DJ-1 mutations responsible for PARK7 were reported to cause another type of AREP, 2 it is unlikely to be of numerical significance in clinical practice. 3 Thus, it is possible that other loci are responsible in the remaining patients with AREP. Recently, mutations of PINK1 were detected as the causative gene for PARK6. 4 We also performed linkage analysis in 39 families with AREP who were negative for parkin and DJ-1 mutations. Eight of these families showed evidence of linkage with PARK6. PINK1 is lo- cated only 324kb from the D1S2732 at which we ob- tained multipoint log of the odds score of 9.88. 5 To define the genotype–phenotype relationship, we per- formed mutation analysis for PINK1 in these families. Patients and Methods Eight families were chosen for PINK1 mutation screening. Three families were Japanese; two Taiwanese; and one each from Israel, Turkey, and the Philippines. Families A, B, C, D, and E showed homozygosity at the PARK6 region, whereas compound heterozygosity was suggested in Fami- lies F, G, and H in our linkage analysis. 5 The clinical char- acteristics of affected subjects are described in the previous study (mean age at onset SD, 30 10.7 years; range, 18 –33 years). 5 The study was approved by the ethics re- view committee of Juntendo University. After obtaining in- formed consent, we performed mutation analysis of PINK1 by direct sequencing of the polymerase chain reaction prod- ucts using the following primers: Ex2 forward 5-CTGACCTCTCAGATCATTGAGTATTGT-3, Ex2 reverse 5- AATCTGTCTTTTCCTACCTACTTCCTG- 3 , Ex3 forward 5 -GTTAAGACAGGTCATCTT- ATCTCGAAG-3 , Ex3 reverse 5 -CTACTGTCATA- TCAGACACTGTACCAGG-3 , Ex4 forward 5 - GTACAGTACCTGGCACATAGCAAATCTA-3 , Ex4 reverse 5 - CACTATAGCAAAGTTAGGGGATACA- GAG-3 , Ex5 forward 5 - CTCTTACTTCCTAATT- TGAGGATGGTG-3, Ex5 reverse 5- ACTTAGAACA- CAAAACCAGAGAGGAC-3, Ex6 forward 5- AAAT- CAAAGTCTCCTGGGGTATAAG-3 , Ex6 reverse 5- GTTTATGTGACAGGACTTGCATTCT-3, Ex7 for- ward 5- AGAATGCAAGTCCTGTCACATAAAC-3, Ex7 reverse 5- GTAACTAGCCTTTACCTTCCTAACACAG- 3 , Ex8 forward 5 - ATAGAGGAGACTACTTACCT- GGTTCAAG-3, and Ex8 reverse 5- AGACTGAACTCT- CACTCAAGTTCTTCC. Primers for exon 1 were used as reported previously. 4 Dideoxy cycle sequencing was per- formed with Big Dye Terminator Chemistry (Applied Bio- systems, Foster City, CA). This was followed by exon se- quencing on ABI377 and 310 automated DNA sequence analyzers (Applied Biosystems). Although the haplotypes of From the 1 Department of Neurology, Juntendo University School of Medicine; 2 Department of Molecular Biology, Keio University School of Medicine, Tokyo; 3 Institute of Health Science, Hiroshima University School of Medicine, Hiroshima; 4 Department of Neurol- ogy, Chiba University Graduate School of Medicine, Chiba; 5 De- partment of Neurology, Kitano Hospital, The Tazuke Kofukai Medical Research Institute, Osaka, Japan; 6 Parkinson’s Disease and Movement Disorders Clinic, Department of Neurology, Chaim Sheba Medical Centre, Tel Hashomer, Israel; 7 Movement Disorder Unit, First Department of Neurology, Chang Gung Memorial Hos- pital, Taipei, Taiwan; 8 Third Department of Internal Medicine, Ka- goshima University School of Medicine, Kagoshima, Japan; 9 De- partment of Neurology and Psychiatry, University of Santo Tomas Faculty of Medicine and Surgery; Manila, Philippines; 10 Division of Functional Genomics, Osaka University Graduate School of Medi- cine, Suita; and 11 CREST, Japan Science and Technology Corpo- ration, Kawaguchi, Saitama, Japan. Received Jun 8, 2004, and in revised form Jul 14. Accepted for publication Jul 23, 2004. Published online Aug 31, 2004, in Wiley InterScience (www.interscience.wiley.com). DOI: 10.1002/ana.20251 Address correspondence to Dr Hattori, Department of Neurology, Juntendo University School of Medicine, 2-1-1 Hongo, Bunkyo, Tokyo 113-0033, Japan. E-mail: [email protected] BRIEF COMMUNICATIONS 424 © 2004 American Neurological Association Published by Wiley-Liss, Inc., through Wiley Subscription Services
Transcript of Glucose hypometabolism of hypothalamus and thalamus in narcolepsy

Novel PINK1 Mutations inEarly-Onset ParkinsonismYasuko Hatano, MD,1 Yuanzhe Li, MD,1
Kenichi Sato, MD, PhD,1 Shuichi Asakawa, PhD,2
Yasuhiro Yamamura, MD,3 Hiroyuki Tomiyama, MD,1
Hiroyo Yoshino, BS,1 Masato Asahina, MD,4
Susumu Kobayashi, MD,5 Sharon Hassin-Baer, MD,6
Chin-Song Lu, MD,7 Arlene R. Ng, MD,8
Raymond L. Rosales, MD, PhD,9
Nobuyoshi Shimizu, PhD,2 Tatsushi Toda, MD, PhD,10,11
Yoshikuni Mizuno, MD,1 andNobutaka Hattori, MD, PhD1,11
PINK1 was recently found to be associated with PARK6as the causative gene. We performed mutation analysis ineight inbred families whose haplotypes link to thePARK6 region. We identified six pathogenic mutations(R246X, H271Q, E417G, L347P, and Q239X/R492X) insix unrelated families. All sites of mutations were novel,suggesting that PINK1 may be the second most commoncausative gene next to parkin in parkinsonism with therecessive mode of inheritance.
Ann Neurol 2004;56:424–427
The primary cause of Parkinson’s disease (PD) is stillunknown despite recent progress in research on themolecular mechanism of loss of dopaminergic neurons.Although most patients with PD are sporadic, identi-fication of causative genes of the rare monogenic formsof PD or parkinsonism could provide important in-sights into the understanding of disease pathogenesis.To date, four genes have been identified as the caus-
ative genes for familial parkinsonism: mutations of�-synuclein and UCH-L1 in autosomal dominant formsof parkinsonism and mutations of parkin and DJ-1 inautosomal recessive forms. Among the monogenicforms of parkinsonism, mutations of parkin have beendetected in approximately 50% of cases with autosomalrecessive early-onset parkinsonism (AREP).1 AlthoughDJ-1 mutations responsible for PARK7 were reportedto cause another type of AREP,2 it is unlikely to be ofnumerical significance in clinical practice.3 Thus, it ispossible that other loci are responsible in the remainingpatients with AREP.
Recently, mutations of PINK1 were detected as thecausative gene for PARK6.4 We also performed linkageanalysis in 39 families with AREP who were negativefor parkin and DJ-1 mutations. Eight of these familiesshowed evidence of linkage with PARK6. PINK1 is lo-cated only 324kb from the D1S2732 at which we ob-tained multipoint log of the odds score of 9.88.5 Todefine the genotype–phenotype relationship, we per-formed mutation analysis for PINK1 in these families.
Patients and MethodsEight families were chosen for PINK1 mutation screening.Three families were Japanese; two Taiwanese; and one eachfrom Israel, Turkey, and the Philippines. Families A, B, C,D, and E showed homozygosity at the PARK6 region,whereas compound heterozygosity was suggested in Fami-lies F, G, and H in our linkage analysis.5 The clinical char-acteristics of affected subjects are described in the previousstudy (mean age at onset �SD, 30 � 10.7 years; range,18 –33 years).5 The study was approved by the ethics re-view committee of Juntendo University. After obtaining in-formed consent, we performed mutation analysis of PINK1by direct sequencing of the polymerase chain reaction prod-ucts using the following primers: Ex2 forward5�-CTGACCTCTCAGATCATTGAGTATTGT-3�, Ex2reverse 5�- AATCTGTCTTTTCCTACCTACTTCCTG-3�, Ex3 forward 5�-GTTAAGACAGGTCATCTT-ATCTCGAAG-3�, Ex3 reverse 5�-CTACTGTCATA-TCAGACACTGTACCAGG-3�, Ex4 forward 5�-GTACAGTACCTGGCACATAGCAAATCTA-3�, Ex4reverse 5�- CACTATAGCAAAGTTAGGGGATACA-GAG-3�, Ex5 forward 5�- CTCTTACTTCCTAATT-TGAGGATGGTG-3�, Ex5 reverse 5�- ACTTAGAACA-CAAAACCAGAGAGGAC-3�, Ex6 forward 5�- AAAT-CAAAGTCTCCTGGGGTATAAG-3�, Ex6 reverse5�- GTTTATGTGACAGGACTTGCATTCT-3�, Ex7 for-ward 5�- AGAATGCAAGTCCTGTCACATAAAC-3�, Ex7reverse 5�- GTAACTAGCCTTTACCTTCCTAACACAG-3�, Ex8 forward 5�- ATAGAGGAGACTACTTACCT-GGTTCAAG-3�, and Ex8 reverse 5�- AGACTGAACTCT-CACTCAAGTTCTTCC. Primers for exon 1 were used asreported previously.4 Dideoxy cycle sequencing was per-formed with Big Dye Terminator Chemistry (Applied Bio-systems, Foster City, CA). This was followed by exon se-quencing on ABI377 and 310 automated DNA sequenceanalyzers (Applied Biosystems). Although the haplotypes of
From the 1Department of Neurology, Juntendo University Schoolof Medicine; 2Department of Molecular Biology, Keio UniversitySchool of Medicine, Tokyo; 3Institute of Health Science, HiroshimaUniversity School of Medicine, Hiroshima; 4Department of Neurol-ogy, Chiba University Graduate School of Medicine, Chiba; 5De-partment of Neurology, Kitano Hospital, The Tazuke KofukaiMedical Research Institute, Osaka, Japan; 6Parkinson’s Disease andMovement Disorders Clinic, Department of Neurology, ChaimSheba Medical Centre, Tel Hashomer, Israel; 7Movement DisorderUnit, First Department of Neurology, Chang Gung Memorial Hos-pital, Taipei, Taiwan; 8Third Department of Internal Medicine, Ka-goshima University School of Medicine, Kagoshima, Japan; 9De-partment of Neurology and Psychiatry, University of Santo TomasFaculty of Medicine and Surgery; Manila, Philippines; 10Division ofFunctional Genomics, Osaka University Graduate School of Medi-cine, Suita; and 11CREST, Japan Science and Technology Corpo-ration, Kawaguchi, Saitama, Japan.
Received Jun 8, 2004, and in revised form Jul 14. Accepted forpublication Jul 23, 2004.
Published online Aug 31, 2004, in Wiley InterScience(www.interscience.wiley.com). DOI: 10.1002/ana.20251
Address correspondence to Dr Hattori, Department of Neurology,Juntendo University School of Medicine, 2-1-1 Hongo, Bunkyo,Tokyo 113-0033, Japan. E-mail: [email protected]
BRIEF COMMUNICATIONS
424 © 2004 American Neurological AssociationPublished by Wiley-Liss, Inc., through Wiley Subscription Services

the affected members of Family F showed compound het-erozygotes, we identified a homozygous point mutation inexon 5. Considering this finding, it is possible that an ex-onic deletion in the same exon takes place in other allelesof the affected members of this family. Therefore, we per-formed gene dosage assay in Family F to exclude this pos-sibility using TaqMan real-time quantitative polymerasechain reaction. Primers and probes were designed by Assay-by-Design Service (Applied Biosystems). Sequences ofprimers and probes and the protocols are available uponrequest.
ResultsWe identified four types of homozygous point muta-tions (R246X, H271Q, E417G, and L347P) involvingexons 3, 4, 5, and 6 in PINK1 of patients from fiveunrelated families (Fig 1). We also detected two non-sense mutations (Q239X and R492X) as a compoundheterozygote in a Taiwanese family (Family G) (Table).All mutations cosegregated with the disease phenotype.In addition, the mutations were not found in 200 nor-mal Japanese chromosomes.
The site of nonsense mutation (c.736 C-to-T tran-sition) was not identical to that reported recently,4 sug-gesting a novel mutation site. In addition, although thesame mutation was detected in different ethnic groups
(one in a Japanese and the other in an Israeli), thesefamilies did not share a common haplotype, thus ex-cluding the possibility of a single founder effect. Thisfinding indicates that the point mutation (R246X) maybe a hot spot in PINK1 mutations. Premature termi-nation by this mutation could lead to a truncated pro-tein that lacks 336 amino acids, including a highlyconserved protein kinase domain. Two Japanese andone Filipino families carried missense mutations (c.813C-to-A transversion, c.1040 T-to-C transition, andc.1250 A-to-G transition) in exons 4, 5, and 6 result-ing in the substitution of highly conserved amino acidsin the putative kinase domain, suggesting that this do-main is of functional importance (Fig 2).
Although the affected members of Family F werecompound heterozygous, we identified a homozygousmissense mutation (c.1040 T-to-C). This finding sug-gests that the affected members of this family are com-pound heterozygotes with both a missense and an ex-onic deletion in the same exon 5. However, we couldexclude this possibility because we could not detect theheterozygous exonic deletion in exon 5 using the genedosage technique. Thus, we conclude that the affectedmembers of this family had a homozygous mutation.For this mutation, we could not exclude the possibility
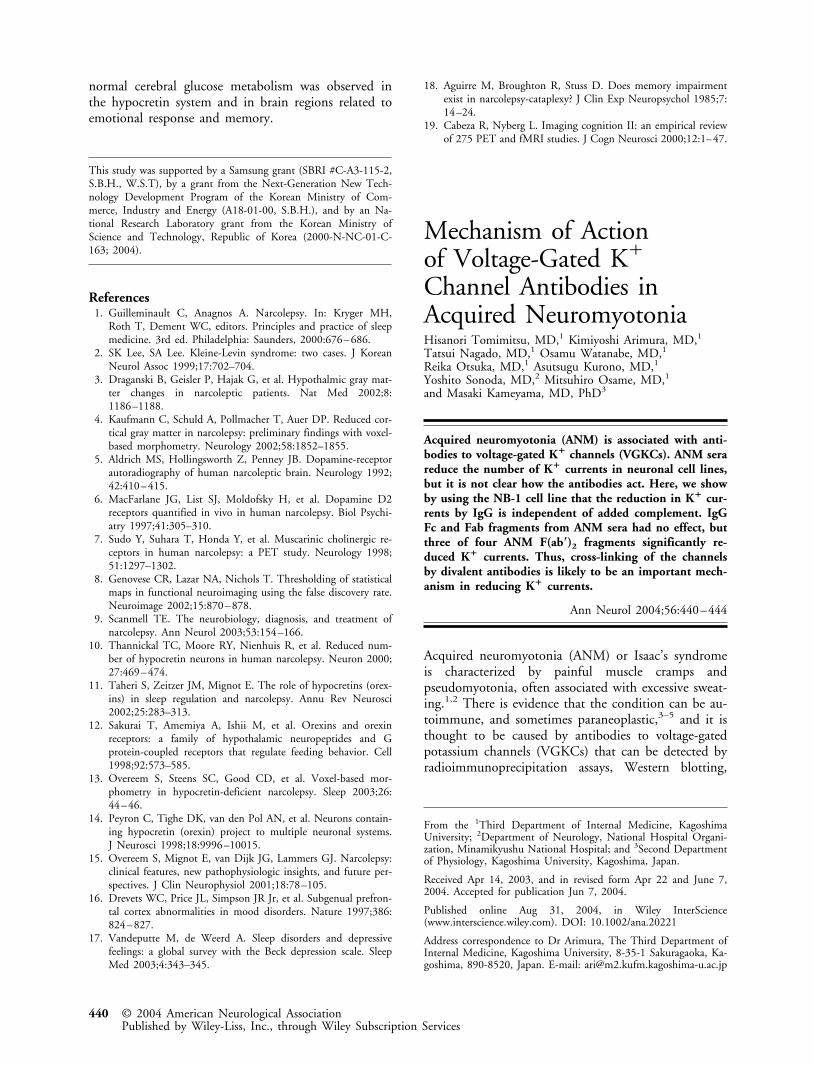
Fig 1. Pedigree and chromatograms illustrating nonsense, missense, and compound heterozygote mutations. Homozygous nonsensemutations (R246X) in exon 3 of affected members (A1, E1, and E2). Homozygous missense mutations (H271Q, E417G, andL347P) in exons 4, 5, and 6 from Families B, D, and F. Compound heterozygote mutation (Q239X/R492X) in exons 3 and 7 ofaffected members (G1 and G2). Heterozygote states were identified in healthy individuals in Families E (E3), B (B2), and F (F4).One of the unaffected members in Family G (G3) had only a heterozygote mutation (Q239X). (circles) Women; (squares) men;(solid symbols) homozygous affected individuals; (open symbols) healthy individuals. (asterisk) Complementary sequences are pre-sented in exons 5, 6, and 7.
Hatano et al: Novel PINK1 Mutations 425

that this alteration is a rare polymorphism because wecould not screen for the mutation among the sameraces such as normal Filipino controls. However, weconsider this mutation to be pathogenic because of thesignificance linkage to PARK6 of this family,5 absenceof its mutation in 100 normal Japanese controls, andthe alteration of highly conserved amino acid amongseveral species.
Several polymorphic variants were identified in nor-mal Japanese controls. In exon 5, a homozygousc.1018G3A substitution (frequency: 10%, n � 100)and a heterozygous c.1018G3A substitution (fre-quency: 44%, n � 100) were found. Another variant,
a C3T homozygous substitution (c.914C3T,P305L), was found in all Japanese controls (frequency:100%, n � 100) and IVS4-5 G3A was found as ho-mozygous (frequency: 68%, n � 100) and heterozy-gous (frequency: 29%, n � 100).
All patients with PINK1 mutations showed early ageat onset (mean age at onset �SD, 26.7�5.9 years;range, 18–33 years), long disease duration (mean, 18.4�4.67 years), and good response to L-dopa.5 Therewere no distinct clinical signs that could distinguishpatients of homozygous mutation from those withcompound heterozygous mutation.
DiscussionOur results indicate that pathogenic mutations inPINK1-positive AREP are not limited to Europeansbut occur also in Asians, suggesting that PINK1 mu-tation is the second most frequent next to parkin.Different point mutations seem to be more frequentlyresponsible for the disease phenotype than are dele-tions.
A homozygous mutation (L347P) was detected inthe affected members of the Filipino family of whichhaplotypes at the PARK6 region showed compoundheterozygotes, indicating that the frequency of PINK1mutations could be high next to the parkin muta-tions.5
In this study, we could not identify the PINK1 mu-tation in the protein coding regions including thesplicing sites in a Turkish (Family C) and the otherTaiwanese families (Family H). Although we cannotexclude the possibility that the patients may have ho-mozygous mutation in the regulatory regions or intronsequences that cause exon skipping, these families maybe linked to other loci. Indeed, homozygosity in thePINK1-negative families spanned the PARK6 and 9 re-gions. Thus, these families may have an allelic disorderin the PARK9 gene because the clinical phenotype ofPARK9 is a distinct entity from PARK6. We found,based on the comparison between the PINK1-positiveand -negative families, that the clinical features are very
Fig 2. Alignment of PINK1 homologs showing the conservedamino acid mutated in Families B, D, and F.
Table. Mutations in the PINK1 gene
OriginNucleotide
changeamino acid
change Exon Zygosity Mutation type AAO DD
Family A Japan c.736 C-to-T R246X 3 homo nonsense 30 17Family B Japan c.813 C-to-A H271Q 4 homo missense 23 15Family D Japan c.1250 A-to-G E417G 6 homo missense 33 8Family E Israel c.736 C-to-T R246X 3 homo nonsense 25,33 17,21Family F Philippines c.1040 T-to-C L347P 5 homo missense 27,27,32 18,19,23Family G Taiwan c.715 C-to-T/
c.1474 C-to-TQ239X/R492X 3/7 com/hetero nonsense/
nonsense18,19 22,24
homo � homozygous; com/hetero � compound heterozygote; AAO � age at onset (years); DD � disease duration (years)
426 Annals of Neurology Vol 56 No 3 September 2004

similar. It is difficult to distinguish PINK1-positiveAREP from the PINK1-negative one. In this regard,the discovery of PINK1 helps us to provide key clinicalinformation based on the differential diagnosis ofAREP. The characteristic clinical features of ourPINK1-positive families included slow progression andlack of dystonia at onset except for two patients (D1and G2), indicating similarity to the Italian familiesdescribed in the original report.4 Although furtherstudies are needed to determine the frequency of dys-tonia in PINK1-positive AREP, the lack of dystoniamight be a distinct clinical sign for differentiating thisform from parkin- or DJ-1–positive AREP. Further-more, two affected members of Family E showed somepsychiatric problems at the onset of the disease. Thedisease onset is slightly earlier than in patients of theoriginal report, indicating phenotypic variability.
Although PINK1 function is unknown, it originallywas reported to be upregulated by the tumor suppres-sor gene, PTEN, in cancer cells.6 Preliminary resultsshowed that the loss-of-function effect of PINK1might be associated with mitochondrial dysfunction.There has been considerable progress in our under-standing of the molecular mechanisms of nigral degen-eration; mitochondrial respiratory failure and oxidativestress appear to play important roles in the progressionof the disease.7 DJ-1 acts as an antioxidant protein,and oxidative stress can damage the 26S proteasome inwhich parkin acts as an ubiquitin ligase. Thus, all thegene products in AREP may form a common cascade.In summary, the novel mutations identified in thisstudy indicate that PINK1 is a pathogenic gene inAREP.
This study was supported by the Ministry of Education, Science,Sports, and Culture of Japan, by the Fund for “Research for theFuture” Program from the Japan Society for the Promotion of Sci-ence.
We are grateful to the patients and their families. We thank J. Fu-kae, T. Shimazaki, and A. Shimizu for their assistance with the mu-tation analysis; H. Shinotoh, B. Elibol, F. Belgin ATAc, H. C.Chang, Y. H. Wu-Chou, and Y. Shinar for obtaining the clinicalsamples; and E. M. Valente and coworkers for exchanging manu-scripts prior to publication.
References1. Lucking CB, Durr A, Bonifati V, et al. Association between
early-onset Parkinson’s disease and mutations in the parkin gene.N Engl J Med 2000;342:1560–1567.
2. Bonifati V, Rizzu P, van Baren M, et al. Mutations in the DJ-1gene associated with autosomal recessive early-onset parkinson-ism. Science 2003;299:256–259.
3. Hedrich K, Djarmati A, Schafer N, et al. DJ-1 (PARK7) muta-tions are less frequent than Parkin (PARK2) mutations in early-onset Parkinson disease. Neurology 2004;62:389–394.
4. Valente EM, Abou-Sleiman PM, Caputo V, et al. Hereditaryearly-onset Parkinson’s disease caused by mutations in PINK1.Science 2004;304:1158–1160.
5. Hatano Y, Sato K, Elibol B, et al. PARK6-linked autosomal re-cessive early-onset parkinsonism in Asian populations. Neurology(in press).
6. Unoki M, Nakamura Y. Growth-suppressive effects of BPOZand EGR2, two genes involved in the PTEN signaling pathway.Oncogene 2001;20:4457–4465.
7. Jenner P. Oxidative stress in Parkinson’s disease. Ann Neurol2003;53:S26–S38.
Homozygous PINK1C-Terminus MutationCausing Early-OnsetParkinsonismChristan F. Rohe,1 Pasquale Montagna, MD,2
Guido Breedveld,1 Pietro Cortelli, MD, PhD,2
Ben A. Oostra, PhD,1 and Vincenzo Bonifati, MD, PhD1,3
Two homozygous mutations in the PINK1 gene, encodinga mitochondrial putative protein kinase, recently havebeen identified in families with PARK6-linked, autosomalrecessive early-onset parkinsonism (AREP). Here, we de-scribe a novel homozygous mutation (1573_1574 insT-TAG) identified in an AREP patient, which causes aframeshift and truncation at the C-terminus of the PINK1protein, outside the kinase catalytic domain. The clinicalphenotype includes early-onset (28 years) parkinsonism,foot dystonia at onset, good levodopa response, slow pro-gression, early levodopa-induced dyskinesias, and sleepbenefit, thereby resembling closely parkin-related disease.These findings confirm that recessive mutations in PINK1cause early-onset parkinsonism and expand the associatedclinical phenotype.
Ann Neurol 2004;56:427–431
A growing body of evidence indicates the importanceof autosomal recessive inheritance in the cause of early-onset degenerative parkinsonism (defined as cases withonset before age of 50).1,2
From the 1Department of Clinical Genetics, Erasmus MC Rotter-dam, The Netherlands; 2Department of Neurological Sciences, Uni-versity of Bologna, Bologna; and 3Department of Neurological Sci-ences, “La Sapienza” University, Rome, Italy.
Received May 20, 2004, and in revised form June 10. Accepted forpublication Jul 2, 2004.
Published online Aug 31, 2004, in Wiley InterScience(www.interscience.wiley.com). DOI: 10.1002/ana.20247
Address correspondence to Dr Bonifati, Department of Clinical Ge-netics, Room Ee-975, Erasmus MC Rotterdam, P.O. Box 1738,3000 DR Rotterdam, The Netherlands.E-mail: [email protected]
© 2004 American Neurological Association 427Published by Wiley-Liss, Inc., through Wiley Subscription Services

Mutations in the parkin gene (at the PARK2 locus)are the most frequent cause of autosomal recessive,early-onset parkinsonism (AREP), being found in ap-proximately 50% of early-onset cases with a familialpattern consistent with autosomal recessive inheritance,and in approximately 15 to 20% of the sporadic early-onset cases.3,4 Mutations in the DJ-1 gene (at thePARK7 locus) are a second cause of AREP, found inapproximately 1 to 2% of early-onset cases.5–8
Recently, two mutations in a third gene, PINK1(PTEN-induced kinase 1, at the PARK6 locus), havebeen identified in AREP families.9 The PINK1 geneencodes a 581–amino acid protein, which contains astrong mitochondrial targeting peptide at theN-terminus, and a putative Ser/Thr protein kinase cat-alytic domain spanning residues 156 to 509. Accord-ingly, in overexpression cell systems, the PINK1 pro-tein has been shown to localize to the mitochondria.9
One homozygous truncating mutation (W437X) wasfound in two Italian consanguineous AREP families. Inaddition, one homozygous missense mutation(G309D), replacing a conserved residue in the putativekinase domain, was found in a third consanguineousSpanish family. Taken as a whole, these findings sug-gest that the loss of the PINK1 function causes thisform (PARK6), providing a first direct link between amitochondrial defect and the pathogenesis of parkin-sonism.9 We describe here a different homozygous mu-tation in the PINK1 gene found in an Italian patientwith early-onset parkinsonism. The mutation is locatedoutside the putative kinase domain, causing a frame-shift and truncation at the C-terminus of the PINK1protein. Our findings provide the first, independentconfirmation that recessive mutations in PINK1 are acause of early-onset parkinsonism. Furthermore, theclinical features in the case described here resembleclosely the phenotype associated with parkin gene mu-tations, indicating the importance of gene testing foran accurate molecular diagnosis and for the distinctionbetween the different AREP forms.
Subjects and MethodsInformed consent was obtained from the participating sub-jects. Genomic DNA was isolated from peripheral blood us-ing standard protocols.10
For haplotype analysis, we typed short tandem repeat(STR) markers from the PARK2 (parkin), PARK6 (PINK1),and PARK7 (DJ-1) regions, by polymerase chain reaction(PCR) using fluorescently labeled primers and an ABI3100automatic DNA analyzer, according to conditions reportedpreviously.11 Haplotypes were constructed based on the min-imum number of recombinations.
For the mutation analysis, the eight exons of the PINK1gene were amplified by PCR. Reactions were performed in25�l containing 1 � Invitrogen PCR buffer, 1.5mMMgCl2, 0.01% W-1, 250�M of each dNTP, 0.4�M for-ward primer, 0.4�M reverse primer, 2.5 units of Taq DNA
polymerase (Invitrogen, La Jolla, CA), and 50ng genomicDNA. Cycle conditions and primers are available on request.Direct sequencing of both strands was performed using BigDye Terminator chemistry version 3.1 (Applied Biosystems,Foster City, CA). Fragments were loaded on an ABI3100automated sequencer and analyzed with DNA SequencingAnalysis (version 3.7) and SeqScape (version 2.1) software(Applied Biosystems). The consequences of the mutation atthe protein level were predicted according to the PINK1mRNA sequence (accession number NM_032409).
Family ReportThe index case reported episodes at age 9 years, characterizedby fear, claustrophobia, and a feeling of derealization, inter-preted as panic attacks and subsiding spontaneously after 1year. Abnormal postures in the left foot were first noted atage 28 years, followed after few months by tremor and mus-cular rigidity in the four limbs, walking difficulties, and ab-normal postures in the limbs and trunk, even causing back-ward falls. Symptoms showed slow progression over thesubsequent years. Marked diurnal fluctuations and particu-larly amelioration after nocturnal sleep (sleep benefit) evenafter an afternoon nap were noticed. In addition, anxiousand depressive symptoms and panic attacks were present, re-quiring medication with benzodiazepines and tricyclic anti-depressants. At age 35 years, examination disclosed slight hy-pomimia, flexed posture of limbs and trunk, cogwheelrigidity and bradykinesia, resting and postural arm tremor,especially on the right side and a slow, hesitating gait withdystonic leg postures, especially on the left side. Symptomswere markedly worsened by emotion and anxiety. Hoehn–Yahr stage was III. L-Dopa therapy was initiated (100mgthree times daily), with a marked positive response, and shereceived a clinical diagnosis of early-onset Parkinson’s disease(PD); L-dopa–induced motor fluctuations and ON-perioddyskinesias developed 3 months later. At the last examination(March 2004), in ON condition the Hoehn–Yahr stage wasI and United Parkinson’s Disease Rating Scale motor scorewas 9. Therapy included L-dopa 100mg four times daily,pramipexole 0.25mg twice a day, and, when needed, alpra-zolam 0.25mg/day. Cognitive functions were normal, andbrain magnetic resonance imaging was unremarkable.
Neurological examinations of the father, mother, andbrother of the index case, respectively aged 72, 71, and 42years, were normal. Anxious/depressive symptoms were presentin the mother. One paternal, avuncular relative was diagnosedwith late-onset PD (onset age 65 years) and died after age of80 (Fig.). DNA was not available from this last patient. Therewas no report of consanguinity in the family, but the parentsof the index case originate from very close areas in Italy.
ResultsHaplotype analysis showed an extended region of ho-mozygosity spanning the whole PARK6 region in theindex case but not in the unaffected relatives (brotherand parents; see Fig, A). In the index case, homozygos-ity was also observed for markers of the PARK2 butnot the PARK7 region (data not shown).
The analysis of the parkin and DJ-1 gene in the in-dex case, including genomic sequencing of the coding
428 Annals of Neurology Vol 56 No 3 September 2004
region and gene copy dosage, had been previously per-formed and identified no mutations (Bonifati et al.,unpublished observations).
Sequencing of the PINK1 gene in the index caseshowed a homozygous four-base insertion in exon 8(1573_1574insTTAG, numbered from the A of the
ATG-translation initiation codon; see Fig, B). Thismutation introduces a frameshift leading to amino acidreplacement from the residue Asp525 onward, and astop codon (TAA) at position 562, thereby truncatingthe last 20 C-terminal amino acids of the PINK1 pro-tein (D525fsX562; see Fig, C). In agreement with the
Fig. (A) Simplified pedigree and haplotypes of the PARK6 region. Filled symbols indicate individuals affected by parkinsonism. (B)Electropherograms of part of PINK1 exon 8 and the encoded amino acids. The index case (BO-22) carries a homozygous insertionof four bases, 1573_1574insTTAG (boxed), introducing a frameshift and amino acid replacement from the residue 525 onward(arrow). The wild-type pattern is shown below for BO-23. The parents (BO-24 and BO-25) are heterozygous carriers of the muta-tion (see the “double sequence” effect). The A1562C polymorphism (N521T) in BO-23 and BO-24 is also indicated (arrowheads).(C) Primary structure of wild-type and D525fsX562mutant PINK1 protein. The known functional domains and the location of twopreviously identified mutations are shown.
Rohe et al: PINK1 in Early-Onset Parkinsonism 429

results of the haplotype analysis, the 1573_1574insT-TAG mutation was present in the heterozygous state inboth parents and absent in the unaffected brother, whoinherited the unaffected chromosome from each parent(see Fig, A, B). The index case is also a homozygouscarrier of the IVS1-65C3G change (not shown). Thisvariant (IVS1-65G) is a known intronic polymor-phism, present in approximately 22% of control chro-mosomes (single nucleotide polymorphism [SNP] da-tabase ID: rs2298297) (http://www.ncbi.nlm.nih.gov/SNP). No other sequence variants were identified inthe index case. The mother was also a heterozygouscarrier of the A1562C variant in exon 8 (leading to theAsn521Thr change in the protein); this variant wastransmitted to the healthy child (see Fig, B). Thr521 isa frequent polymorphism, present in approximately 34to 39% of control chromosomes (SNP database ID:rs1043424, and data from Valente and colleagues9).
DiscussionWe have identified a novel homozygous PINK1 genemutation in a patient with early-onset L-dopa–respon-sive parkinsonism. To our knowledge, this is the first,independent confirmation that mutations in PINK1cause this disease. The 1573_1574insTTAG mutationis clearly pathogenic because it drastically affects theprimary structure of the encoded protein, replacing 33of the 37 amino acids in the frameshift region, andtruncating the last 20 residues.
This mutation is also interesting because of its loca-tion outside the known functional domain in thePINK1 protein (the Ser/Thr protein kinase domain,spanning residues 156 to 509; see Fig, C). It is likelythat the mutant D525fsX562PINK1 protein is misfoldedand/or unstable and rapidly degraded, as often ob-served in genetic diseases12 including the case of theL166P mutation in DJ-1.13 On the other hand, themutant protein might be stable, but its functionalproperties might be lost because of the mutation. Thissuggests the possibility that the C-terminus of thePINK1 protein bears an unknown important func-tional domain, or a critical residue for posttranslationalmodification. A bioinformatic search for conserved do-mains within the C-terminus of PINK1 was negative,whereas a potential phosphorylation site at positionThr545 was predicted using the NetPhos 2.0 server.14
Further experiments are required to investigate the ef-fects of the 1573_1574insTTAG mutation on the bi-ology of the PINK1 protein.
The clinical phenotype in the previously reported,PARK6-linked families is characterized by early-onset(average, 38.6 years; range, 24–48 years) and no atypi-cal features9,15; in particular, dystonia at onset, sleepbenefit, and psychiatric disturbances seem to be rare orabsent in this form.9,15 The clinical picture in the pa-tient described here includes very early onset, foot dys-
tonia at onset, and sleep benefit, therefore resemblingclosely the phenotype associated with parkin (and DJ-1)gene mutations.16,17 Our findings therefore expand thephenotypical spectrum associated with PINK1 mutationsand the clinical overlap between these three recessiveforms of early-onset parkinsonism, highlighting the im-portance of genetic testing for an accurate diagnosis. Theidentification of 1573_1574 insTTAG and of additionalpathogenic mutations in PINK1 will help understandingof the cellular function of the PINK1 protein that, whenlost, causes neurodegeneration.
This work was supported by the Parkinson Disease Foundation/Na-tional Parkinson Foundation (V.B.).
We thank the members of the family for their contribution, Drs A.Bertoli-Avella and C. Klein for the analysis of parkin and DJ-1 genedosage in the index case, and T. de Vries Lentsch for artwork.
References1. Dawson TM, Dawson VL. Molecular pathways of neurodegen-
eration in Parkinson’s disease. Science 2003;302:819–822.2. Marder K, Levy G, Louis ED, et al. Familial aggregation of
early- and late-onset Parkinson’s disease. Ann Neurol 2003;54:507-513.
3. Kitada T, Asakawa S, Hattori N, et al. Mutations in the parkingene cause autosomal recessive juvenile parkinsonism. Nature1998;392:605-608.
4. Lucking CB, Durr A, Bonifati V, et al. Association betweenearly-onset Parkinson’s disease and mutations in the parkingene. N Engl J Med 2000;342:1560-1567.
5. Bonifati V, Rizzu P, van Baren MJ, et al. Mutations in theDJ-1 gene associated with autosomal recessive early-onset par-kinsonism. Science 2003;299:256–259.
6. Abou-Sleiman PM, Healy DG, Quinn N, et al. The role ofpathogenic DJ-1 mutations in Parkinson’s disease. Ann Neurol2003;54:283–286.
7. Hague S, Rogaeva E, Hernandez D, et al. Early-onset Parkin-son’s disease caused by a compound heterozygous DJ-1 muta-tion. Ann Neurol 2003;54:271–274.
8. Hedrich K, Djarmati A, Schafer N, et al. DJ-1 (PARK7) mu-tations are less frequent than Parkin (PARK2) mutations inearly-onset Parkinson disease. Neurology 2004;62:389–394.
9. Valente EM, Abou-Sleiman PM, Caputo V, et al. Hereditaryearly-onset Parkinson’s disease caused by mutations in PINK1.Science 2004;304:1158–1160.
10. Miller SA, Dykes DD, Polesky HF. A simple salting out pro-cedure for extracting DNA from human nucleated cells. Nu-cleic Acids Res 1988;16:1215.
11. Bonifati V, Breedveld GJ, Squitieri F, et al. Localization of au-tosomal recessive early-onset parkinsonism to chromosome1p36 (PARK7) in an independent dataset. Ann Neurol 2002;51:253–256.
12. Gregersen N, Bross P, Jorgensen MM, et al. Defective foldingand rapid degradation of mutant proteins is a common diseasemechanism in genetic disorders. J Inherit Metab Dis 2000;23:441–447.
13. Macedo MG, Anar B, Bronner IF, et al. The DJ-1L166P mu-tant protein associated with early onset Parkinson’s disease isunstable and forms higher-order protein complexes. Hum MolGenet 2003;12:2807–2816.
14. Blom N, Gammeltoft S, Brunak S. Sequence- and structure-based prediction of eukaryotic protein phosphorylation sites. JMol Biol 1999;294:1351–1362.
430 Annals of Neurology Vol 56 No 3 September 2004

15. Bentivoglio AR, Cortelli P, Valente EM, et al. Phenotypic char-acterisation of autosomal recessive PARK6-linked parkinsonismin three unrelated Italian families. Mov Disord 2001;16:999–1006.
16. Lohmann E, Periquet M, Bonifati V, et al. How much pheno-typic variation can be attributed to parkin genotype? Ann Neu-rol 2003;54:176–185.
17. Bonifati V, Oostra BA, Heutink P. Linking DJ-1 to neurode-generation offers novel insights for understanding the pathogen-esis of Parkinson’s disease. J Mol Med 2004;82:163–174.
Frequency of CatamenialSeizure Exacerbation inWomen with Localization-Related EpilepsyAndrew G. Herzog, MD, MSc,1 Cynthia L. Harden, MD,2
Joyce Liporace, MD,3 Page Pennell, MD,4
Donald L. Schomer, MD,1 Michael Sperling, MD,3
Kristen Fowler, BA,1 Blagovast Nikolov, MD,2
Sevie Shuman, BA,3 and Melanee Newman, RN4
This investigation assessed the frequency of catamenialepilepsy in 87 women who charted seizures and mensesduring three cycles. Catamenial epilepsy designation wasmade if two of three cycles showed at least one of threepreviously defined catamenial patterns. Among ovulatorycycles, average daily seizure frequency was significantlygreater during the perimenstrual and preovulatoryphases. Among anovulatory cycles, average daily seizurefrequency was substantially less during the midfollicularphase than during the remainder of the cycle. Overall,39.1% of the women had catamenial epilepsy.
Ann Neurol 2004;56:431–434
Seizures do not occur randomly in most men andwomen with epilepsy.1 They tend to cluster in morethan 50% of cases.1 Seizure clusters, in turn, may oc-
cur with temporal rhythmicity in a significant propor-tion of men (29%) and women (35%) with epilepsy.2
When the rhythmicity in women approximates that ofthe menstrual cycle, it is commonly known as catame-nial epilepsy.3–5 Catamenial epilepsy may be attribut-able to the neuroactive properties of steroid hormonesand the cyclic variation of their serum levels.6–8
Herzog and colleagues6 provided statistical evidenceto support the concept of catamenial epilepsy and theoccurrence of at least three distinct patterns of seizureexacerbation: C1 � perimenstrual (days �3 to 3) andC2 � periovulatory (days 10 to �13) in normal cycles,and C3 � luteal (days 10 to 3) in inadequate lutealphase (ILP) cycles. In these cycles, day 1 is the first dayof menstrual flow and ovulation is presumed to occur14 days before the subsequent onset of menses (day�14). These three patterns were demonstrated simplyby charting menses and seizures and obtaining a mid-luteal phase serum progesterone level to distinguish be-tween normal and ILP cycles.
Estimates of the proportion of women who havecatamenial seizure exacerbation have varied consider-ably because there has been no single generally useddefinition of catamenial epilepsy.6 Herzog and col-leagues6 found reverse S-shaped curves when plottingthe distributions of the women with each of the cata-menial seizure patterns versus the severity of the exac-erbation in terms of multiples of baseline seizure fre-quency. The points of inflection of these curves thenprovide a mathematically based level of seizure exacer-bation to optimally distinguish between the propor-tions of women with weak versus strong tendencies forcatamenial exacerbation. These distinguishing levels ofseizure exacerbation thus were identified for each of thethree patterns and proposed as defining parameters.The aims of this investigation were to conduct a pro-spective multicenter investigation over three menstrualcycles to determine the proportion of women who havea pattern of catamenial seizure exacerbation using theseparameters and to assess the effects of seizure type, lat-erality, and various antiepileptic drugs. This interim re-port deals only with the overall frequency of catamenialseizure exacerbation and qualifies that the data are ob-tained from the baseline phase of a clinical trial thatoffers hormonal treatment for intractable seizures.
Subjects and MethodsSubjectsThe subjects were the first 100 women who were recruited toparticipate in a large multicenter investigation of cyclic ad-junctive progesterone therapy for women with intractablelocalization-related epilepsy. The women were between 13and 45 years of age and had clinical and electroencephalo-gram features of localization-related epilepsy. The womenhad intractable seizures despite trials of at least two first-lineantiepileptic drugs and had at least two seizures each month.
From 1Harvard Neuroendocrine Unit, Beth Israel Deaconess Med-ical Center, Boston, MA 02215; 2Weill Medical College of CornellUniversity, Comprehensive Epilepsy Center, New York, NY; 3Com-prehensive Epilepsy Center, Thomas Jefferson University Hospital,Philadelphia, PA; and 4Emory University School of Medicine, De-partment of Neurology, Atlanta, GA.
Received Mar 5, 2004, and in revised form Jun 1. Accepted forpublication Jun 1, 2004.
Published online Aug 31, 2004, in Wiley InterScience(www.interscience.wiley.com). DOI: 10.1002/ana.20214
Address correspondence to Dr. Herzog, Harvard NeuroendocrineUnit, Beth Israel Deaconess Medical Center, 330 Brookline Avenue,Boston, MA 02215. E-mail: [email protected].
© 2004 American Neurological Association 431Published by Wiley-Liss, Inc., through Wiley Subscription Services

Seizures could be simple partial, complex partial, or second-ary generalized. They remained on a stable optimal antiepi-leptic drug regimen throughout the study. All of the womenhad menstrual cycle intervals between 23 and 35 days. Noneof the women took hormones or psychotropic medicationsduring the preceding 3 months. Catamenial seizure exacer-bation was not a stated selection criterion.
MethodsEach subject participated in a 3-month baseline phase duringwhich time she recorded seizures and menstrual onset on acalendar. A midluteal phase serum progesterone level was ob-tained between days 20 and 24 of the cycle and alwayswithin 3 to 11 days before menses. A level below 5ng/ml wasused to designate ILP cycles. At the time of this interim anal-ysis, 87 of the 100 women completed the 3-month baselinephase. Reasons for termination of participation includedchanges in medication in four, compliance failure in four,abnormal menstrual cycle interval (�23 or �35 days) infour, and too few seizures (less than two per month) in one.
Each subject was considered to have catamenial seizure ex-acerbation if two of three cycles displayed one of the cata-menial patterns defined below.
AnalysisThe menstrual cycle was divided into four phases, with an ad-justment for variable cycle intervals: menstrual (M) � �3 to3, follicular (F) � 4 to 9, ovulatory (O) � 10 to �13, andluteal (L) � �12 to �4 (Fig 1). The onset of menstruationwas considered to be day 1 and ovulation day �14. The latterdesignation was used because ovulation generally occurs 14days before the onset of menstruation regardless of cycle inter-val. Variable cycle intervals were adjusted for statistical consid-eration by counting days forward from the onset of menstru-ation to the day before ovulation and backward from the onsetof the next menstruation to the day of previous ovulation, day�14, thereby reflecting the physiological variability of follicu-lar phase duration. The previously determined cutoff levels formultiples of seizure exacerbation for each pattern were used todesignate the occurrence of one or more patterns of catamenialepilepsy in any cycle: C1 � 1.69, C2 � 1.83, C3 � 1.62.6
The three patterns of catamenial epilepsy were defined as fol-lows: catamenial pattern 1: the ratio of average daily seizurefrequency during the M phase relative to the F and L phasesin ovulatory cycles equaled or exceeded 1.69; catamenial pat-tern 2: the ratio of the average daily seizure frequency duringthe O phase relative to the F and L phases in ovulatory cyclesequaled or exceeded 1.83; and catamenial pattern 3: the ratioof the average daily seizure frequency during the O, L, and Mphases relative to the F phase in inadequate luteal phase cyclesequaled or exceeded 1.62.
Average daily seizure frequency for each phase was calcu-lated and compared among phases according to the threeproposed patterns of catamenial exacerbation by repeatedmeasures analysis of variance (ANOVA) and Student-Newman-Keuls tests. Comparisons were conducted sepa-rately for normal and inadequate luteal phase cycles.
ResultsAmong the 87 women who completed the 3-monthbaseline phase at the time of this analysis, data were
available for 249 menstrual cycles. Of these, 208(83.5%) were ovulatory and 41 (16.5%) were anovu-latory or ILP cycles (progesterone �5ng/ml). Consid-ering ovulatory and anovulatory cycles separately, thedistribution of seizures among the four phases of ovu-latory menstrual cycles was not uniform (ANOVA:p � 0.0016). Among ovulatory cycles, average dailyseizure frequency was significantly greater during theM phase (M: 0.52 � 0.86) than during any otherphase (F: 0.30 � 0.45, p � 0.001; O: 0.40 � 0.40,p � 0.05; L: 0.29 � 0.37, p � 0.001; Fig 2). Averagedaily seizure frequency was also greater during the O
Fig 1. The menstrual cycle is divided into four phases, withan adjustment for variable cycle intervals: menstrual (M) �days �3 to 3, follicular (F) � days 4 to 9, ovulatory(O) � days 10 to �13, and luteal (L) � days �12 to �4.The onset of menstruation is considered to be day 1 and ovu-lation day �14. The three patterns of catamenial epilepsy aredefined as follows: catamenial pattern 1: the ratio of averagedaily seizure frequency during the M phase relative to the Fand L phases in ovulatory cycles equaled or exceeded the previ-ously determined cutoff level of 1.696; catamenial pattern 2:the ratio of the average daily seizure frequency during the Ophase relative to the F and L phases in ovulatory cyclesequaled or exceeded 1.836; and catamenial pattern 3: the ra-tio of the average daily seizure frequency during the O, L,and M phases relative to the F phase in inadequate lutealphase cycles equaled or exceeded 1.62.6
432 Annals of Neurology Vol 56 No 3 September 2004

phase than during the F (p � 0.03) or L (p � 0.02)phase. Among anovulatory cycles, a comparison of sei-zure frequencies among phases using ANOVA was notsignificant. However, average daily seizure frequencywas substantially lower (p � 0.08) during the F phase(0.27 � 0.40) than during the remainder of the cycle(0.49 � 1.05; see Fig 2). Of the 208 ovulatory cyclesunder consideration, 46 of 208 (22.1%) exhibited onlythe C1 pattern, 22 of 208 (10.6%) exhibited only theC2 pattern, and an additional 22 of 208 (10.6%) ofthe subjects experienced both the C1 and C2 patternsin the same cycle. Overall, 90 of 208 (43.3%) ovula-tory cycles showed a catamenial pattern of seizure ex-acerbation. Of the 41 ILP cycles, 16 of 41 (39.0%)displayed the C3 pattern. Among the 87 women underconsideration, 34 (39.1%) showed a catamenial patternof exacerbation in at least two of three baseline phasecycles and were classified as having catamenial epilepsy.
DiscussionThe interim findings of this prospective multicenter in-vestigation lend support for the existence of (1) cata-menial seizure exacerbation, (2) multiple patterns of
catamenial seizure exacerbation, (3) different patternswith ovulatory and anovulatory cycles, and (4) the fre-quent occurrence of catamenial epilepsy, that is, in ap-proximately one of three of women with epilepsy.These findings are similar to results that one of ourcenters obtained previously.6 This study differs, how-ever, in that it was (1) a multicenter investigation and(2) extended over three cycles. Although selection biascannot be entirely eliminated when a study offers a re-productive hormone supplement as a treatment, thefindings, at a minimum, argue against the notion thatcatamenial seizure exacerbation does not exist or israre. Moreover, this finding is similar to that of theprevious report6 in which hormonal treatment was notoffered. The frequency of anovulatory cycles is substan-tially lower in this investigation than in previouslypublished studies6,9–11 because it excluded women whohad the highest likelihood of having anovulatory cycles,that is, women with less than 23 or greater than 35-day cycle intervals.9 Their inclusion might have addedanother 15 to 20%9 to the finding of 16.5% anovula-tory cycles in this investigation. This value, neverthe-less, is still higher than the frequencies quoted for thegeneral population (8.0–10.9%).10,11
The significance of the findings is that they offer anadditional perspective regarding factors that can influ-ence the occurrence and possibly the treatment of sei-zures. Because reproductive steroids have neuroactiveproperties and some regions of the brain show highlysensitive electrophysiological responses to reproductivesteroids, catamenial epilepsy may relate to particularcharacteristics of the (1) reproductive hormones, (2)brain, (3) epilepsy, or, most likely, (4) a combination.If hormones may play a role in pathogenesis, there mayalso be a role for hormones in therapy.7,8 Identificationof a cohort of women whose seizures occur in relationto reproductive hormone changes, that is, women withcatamenial epilepsy, also may identify the women whomay respond most notably to adjunctive hormonaltherapy. The investigation of progesterone supplementin the treatment of women with epilepsy, both catame-nial and noncatamenial, is currently under way.
This work was supported by NINDS NIH (NIH RO1 NS39466)and an NIH General Clinical Research Center grant (MO1-RR01032).
References1. Tauboll E, Lundervold A, Gjerstad L. Temporal distribution of
seizures in epilepsy. Epilepsy Res 1991;8:153–165.2. Almqvist R. The rhythm of epileptic attacks and its relationship
to the menstrual cycle. Acta Psychiatr Neurol Scand 1955;30(suppl 105):1–116.
3. Laidlaw J. Catamenial epilepsy. Lancet 1956;271:1235–1237.4. Backstrom T. Epileptic seizures in women related to plasma
estrogen and progesterone during the menstrual cycle. ActaNeurol Scand 1976;54:321–347.
Fig 2. Comparison of average daily seizure frequency amongphases of the menstrual cycle in ovulatory and anovulatorycycles: M � menstrual, days �3 to 3; F � follicular, days4 to 9; O � ovulatory, days 10 to �13; and L � luteal,days �12 to �4.
Herzog et al: Catamenial Seizure Exacerbation 433

5. Helmchen H, Kunkel H, Selbach H. Periodic influences on theindividual frequency of epileptic seizures. Arch Psychiatr Ner-venkr 1964;206:293–308.
6. Herzog AG, Klein P, Ransil BJ. Three patterns of catamenialepilepsy. Epilepsia 1997;38:1082–1088.
7. Herzog AG. Progesterone therapy in women with complex par-tial and secondary generalized seizures. Neurology 1995;45:1660–1662.
8. Herzog AG. Progesterone therapy in women with epilepsy: a3-year follow-up. Neurology 1999;52:1917–1918.
9. Herzog AG, Friedman MN. Menstrual cycle interval and ovu-lation in women with localization-related epilepsy. Neurology2002;57:2133–2135.
10. Cummings LN, Giudice L, Morrell MJ. Ovulatory function inepilepsy. Epilepsia 1995;36:353–357.
11. Morrell MJ, Giudice L, Flynn KL, et al. Predictors of ovulatoryfailure in women with epilepsy. Ann Neurol 2002;52:704–711.
Hemispheric Mediation ofSpatial Attention:Pseudoneglect after CallosalStrokeDavid A. Wolk, MD1,2 and H. Branch Coslett, MD3
Study of patients with callosal lesions can provide insightinto the mediation of spatial attention-intention by eachhemisphere. Two patients with anterior callosal strokesbisected lines to the left of midline with the left hand andto the right of midline with the right in both a visual andtactile bisection task. The patients demonstrated a similarpattern of performance on pointing to body-midline inspace. These results are consistent with the notion thateach hemisphere supports spatial attention-intention to-ward contralateral space and that the corpus callosum iscritical in the integration of such information.
Ann Neurol 2004;56:434–436
In 1980, Bowers and Heilman1 reported that normalsubjects tend to bisect visually presented lines to the
left of the midline. They termed this pattern of perfor-mance pseudoneglect. Although there has been substan-tial variability in subsequent studies, Jewell and Mc-Court2 recently reported a meta-analysis of theextensive literature in normal subjects confirming theoriginal observations of Bowers and Heilman.1 Bowersand Heilman proposed that both hemispheres mediateattention-intention for the contralateral hemispace, butthat the right hemisphere is dominant for attention.Consistent with this claim, Heilman and colleagues3
described a patient with partial callosal disconnectionwhose performance on a line bisection task differed asfunction of hand use. When bisecting lines with theright hand, the subject erred to the right, whereaswhen bisecting lines with the left hand, she erred tothe left. The findings of Heilman and colleagues3 havebeen replicated by some,4–6 but not others.7,8
We present two cases of patients with callosal dam-age secondary to anterior cerebral artery territory strokethat confirm and extend the findings of Heilman andcolleagues3 and have important implications for theneural basis of attention-intention.
Subjects and MethodsThe first patient (Patient 1) was a 59-year-old, right-handedwoman evaluated for difficulty walking and mild left legweakness. She stated that her left hand “wanders” and that“it (her hand) gets in the way.” In the first week after stroke,she noted that her left hand would interfere with activities ofthe right hand; for example, her left hand knocked a spoonfrom her right hand on one occasion.
Abnormalities on the neurological examination included aleft grasp and trace weakness of the left leg. She named ob-jects from palpation with the right, but not left hand; withher left hand she reliably pointed to the palpated object in anarray of four objects. She named letters or numbers traced onthe palm of the right, but not left hand. She gestured tocommand with the right, but not left hand. Computed to-mography scan obtained 1 day after the stroke showed aninfarction involving the mesial frontal lobe on the right, aswell as the anterior third of the corpus callosum.
The second patient (Patient 2) was a 66-year-old, right-handed man evaluated for weakness of the left leg. Patient 2noted that his left hand had “a mind of its own.” His lefthand sometimes performed acts that he felt to be inappro-priate or embarrassing.
Abnormalities on the neurological examination includedinability to name palpated objects or to gesture to commandwith the left, but not right hand, and inability to identifynumbers and letters traced on the left hand. His left leg wasmoderately weak. Computed tomography scan showed anacute infarct involving the right mesial frontal region and theanterior third of the corpus callosum.
To explore the neural basis of attention-intention, we ad-ministered three tasks to Patients 1 and 2 and five age-matched controls.
From 1Harvard Medical School, 2Division of Cognitive and Behav-ioral Neurology, Department of Neurology, Brigham and Women’sHospital, Boston, MA; and 3Department of Neurology, Hospital ofthe University of Pennsylvania, Philadelphia, PA.
Received Apr 8, 2004, and in revised form Jun 1. Accepted forpublication Jun 1, 2004.
Published online Aug 9, 2004, in Wiley InterScience(www.interscience.wiley.com). DOI: 10.1002/ana.20213
Address correspondence to Dr Wolk, Department of Neurology,Brigham and Women’s Hospital, 1620 Tremont Street, Boston MA02120. E-mail: [email protected]
434 © 2004 American Neurological AssociationPublished by Wiley-Liss, Inc., through Wiley Subscription Services

ResultsTask 1: Line Bisection with the Rightand Left HandsSubjects were asked to bisect visualized 8, 16, 24, or32cm lines presented in the head and body midlinewith the right and left hands. Subjects bisected 32lines, four of each length with each hand. The distancebetween the subject’s mark and the middle of the linewas measured to the nearest millimeter. Errors to theleft of the midline were scored as minus, whereas errorsto the right were scored as plus.
As indicated in the Table, Patients 1 and 2 erred tothe left when bisecting lines with the left hand, but tothe right when bisecting lines with the right hand. Asnoted in most previous studies,2 controls erred slightlyto the left with both the right and left hands. Patients1 and 2 differed from controls in several respects. First,both subjects performed less accurately than controlswith both the right and left hands, falling well outsidethe range of normal performance as defined by thecontrol mean � 2 standard deviations. Second, unlikecontrols whose performance with the right and lefthands did not differ (F � 0.23), Patients 1 and 2 ex-hibited striking differences in performance between theright and left hands; to determine if the right and lefthands differed for the magnitude of their deviationfrom the midline, we compared the absolute value ofthe responses for each hand with a Mann–Whitney Utest. Both subjects exhibited significantly greater devi-ation from the midline with the left hand (p � 0.05for both).
Task 2: Tactile Line Bisection with the Right andLeft HandsA second line bisection task was performed in whichsubjects were asked to indicate the midline of balsawood rods of 16, 24, 32, or 40cm in length based onpalpation. Subjects were blindfolded and, for each trial,ran their hands along the entire length of the rod untilthey reached the end (half the trials starting on theright side of the rod and half the left); they indicatedthe center of the line with their index finger. Therewere eight trials with each of the four rods for a totalof 32 trials with each hand.
Controls exhibited a slight tendency to err to the leftwith both the right and left hands. Once again, Pa-tients 1 and 2 exhibited substantially greater errorsthan controls, deviating to the left with the left handand to the right with the right hand. The performanceof both subjects was well outside the range of normalperformance with both hands. For Patient 1, but notPatient 2, the magnitude of the error was greater forthe left as compared with the right hand (p � 0.05).
Task 3: Pointing to the Body Midline in SpaceA third task was administered in which subjects closedtheir eyes and fully extended their arm so that the tipof the index finger was in the body midline. Therewere a total of 20 trials with each hand.
Controls deviated slightly to the left with both theright and left hands. For Patients 1 and 2, the lefthand deviated substantially to the left, whereas theright hand deviated substantially to the right. As in theprevious investigations, the performance of both sub-jects was far outside the reference range. For both sub-jects, the magnitude of the error with the left hand wassignificantly greater than that of the right hand (Mann–Whitney p � 0.05 for both).
DiscussionPatients 1 and 2 exhibited a consistent pattern of ab-normal performance across three tasks, including onetest (midline pointing) not previously administered topatients with callosal lesions. These data support theview that each hemisphere mediates attention-intentionfor the contralateral hemispace and that the anteriorcorpus callosum is crucial for the integration of theseattentional-intentional systems. Attribution of the def-icits to a lack of access to a particular modality of ip-silateral sensory information is unlikely, because thesame pattern of errors was observed across tasks thatvaried for the nature of the sensory information medi-ating performance (visual, tactile, representation ofbody in space). Thus, it would seem likely that thedeficit is a result of disruption of the interhemispherictransfer of information related to contralateral spatialattention or the directing of an action into or toward
Table. Mean Performance (mm) and Standard Deviation on Tasks 1–3 as a Function of Hand
Subject
Task 1 Task 2 Task 3
Left Hand Right Hand Left Hand Right Hand Left Hand Right Hand
Patient 1 �64.4 � 31.1 36 � 16.7 �39.7 � 24.9 23.7 � 12.0 �188 � 23 73 � 37Patient 2 �49.5 � 28.8 38.3 � 19.9 �43.5 � 20.8 34.5 � 13.6 �154 � 31 95 � 27Controls �2.1 � 8.9 �1.7 � 9.7 �3.2 � 11.6 �2.9 � 8.7 �1.8 � 7.2 �0.8 � 9.4
Note: Negative values indicate deviation to the left.
Wolk and Coslett: Pseudoneglect after Stroke 435

the contralateral hemispace (ie, directional hypokine-sia9).
The hypothesis that the patients’ deficits are attrib-utable to the callosal lesion is supported by a recentstudy of pseudoneglect in development. Hausmannand colleagues10 demonstrated that children (10–12years old) had bisection biases very similar to Patients 1and 2. With age and, presumably, greater myelinationand development of the corpus callosum,11 the differ-ence between hands dissipates and the normal patternof pseudoneglect emerges.
We also observed an effect not previously reportedin patients with callosal lesions; both Patients 1 and 2produced greater deviation with the left as comparedwith right hand. Kinsbourne’s cognitive activationmodel12 may be relevant to this finding. On this ac-count, differences in performance between the twohands may be attributed to the degree to which per-formance of a task recruits the resources of the hemi-sphere controlling the responding hand. Because all ofthe tasks studied in our two patients are spatial in na-ture, one would expect them to activate the right ascompared with left hemisphere. If hemisphere activa-tion is graded, this could result in a greater degree oferror with the left hand, because its use would result inactivation of the right hemisphere because of both thespatial nature and motor control of the task. Withright hand bisection, activation of the left hemispherewould be limited to that produced by motor perfor-mance. A patient reported by Goldenberg is consistentwith this account, because she exhibited left neglect forverbal tasks, but a right neglect with left-hand line bi-section.5 Finally, we cannot exclude the possibility thatthe asymmetry demonstrated by Patients 1 and 2 isattributable to their right mesial frontal lesions. Suchlesions have been proposed to produce a visual, or in-tentional, grasp for the contralateral hemispace result-ing in an ipsilesional neglect syndrome.13
This work was supported by the NIH (National Institute of MentalHealth, F32 MH068936-01, D.A.W; National Institute on Deaf-ness and Other Communication Disorders, R01 DC 02754,H.B.C).
References1. Bowers D, Heilman KM. Pseudoneglect effects of hemispace on
a tactile line bisection task. Neuropsychologia 1980;18:491–498.
2. Jewell G, McCourt ME. Pseudoneglect: a review and meta-analysis of performance factors in line bisection task. Neuropsy-chologia 2000;38:93–110.
3. Heilman KM, Bowers D, Watson R. Pseudoneglect in a patientwith partial callosal disconnection. Brain 1984;107:519–532.
4. Hausmann M, Corballis MC, Fabri M. Line bisection in thesplit brain. Neuropsychology 2003;17:602–609.
5. Goldenberg G. Neglect in a patient with partial callosal discon-nection. Neuropsychologia 1986;24:397–403.
6. Kashiwagi A, Kashiwagi T, Nishikawa T, et al. Hemispatial ne-glect in a patient with callosal infarction. Brain 1990;113:1005–1023.
7. Corballis MC. Line bisection in a man with complete forebraincommissurotomy. Neuropsychology 1995;9:147–156.
8. Plourde G, Sperry RW. Left hemisphere involvement in leftspatial neglect from right-sided lesions. Brain 1984;107:95–106.
9. Coslett HB, Bowers D, Fitzpatrick E, et al. Directional hypo-kinesia and hemispatial inattention in neglect. Brain 1990;113:475–486.
10. Hausmann M, Waldie KE, Corballis MC. Developmentalchanges in line bisection: a result of callosal maturation? Neu-ropsychology 2003;17:155–160.
11. Giedd JN, Rumsey JM, Castellanos FX, et al. A quantitativeMRI study of the corpus callosum in children and adolescents.Dev Brain Res 1996;91:274–280.
12. Kinsbourne M. The cerebral basis of lateral asymmetries in at-tention. Acta Psychol 1970;33:193–201.
13. Kwon SE, Heilman KM. Ipsilateral neglect in a patient follow-ing a unilateral frontal lesion. Neurology 1991;41:2001–2004.
436 Annals of Neurology Vol 56 No 3 September 2004
Glucose Hypometabolism ofHypothalamus andThalamus in NarcolepsyEun Yeon Joo, MD1 Woo Suk Tae, MS1
Jee Hyun Kim, MD1 Byung Tae Kim, MD2
and Seung Bong Hong MD1
It has been hypothesized that hypothalamus is involvedin narcolepsy. The relative difference between cerebralglucose metabolism of 24 narcoleptic patients and 24normal controls was studied using 18F-fluorodeoxy glu-cose positron emission tomography. Patients with narco-lepsy showed significantly reduced cerebral glucose me-tabolism in bilateral rectal and subcallosal gyri, themedial convexity of right superior frontal gyrus, bilateralprecuneus, right inferior parietal lobule, and in left su-pramarginal gyrus (uncorrected p < 0.001). Bilateralposterior hypothalami and mediodorsal thalamic nucleishowed hypometabolism with significance at the level ofcorrected p < 0.05, with small volume correction. Thisstudy showed cerebral glucose hypometabolism of thehypothalamus-thalamus-orbitofrontal pathways in thenarcoleptic brain.
Ann Neurol 2004;56:437–440
Narcolepsy is a sleep disorder showing excessive day-time sleepiness1,2 and is generally associated with cata-plexy and other rapid eye movement (REM) sleep phe-nomena such as sleep paralysis and hypnagogichallucination.
Numerous studies, including neuroimaging studies,have been performed to characterize the pathophysiol-ogy of narcolepsy. One previous study, which usedvoxel-based morphometry (VBM), reported a reduc-tion in the gray matter concentration in the hypothal-amus and nucleus accumbens in the narcoleptic brain.3
A reduction of bilateral cortical gray matter, predomi-nantly in the inferior temporal and inferior frontal re-gion, has been reported in another study.4 Moreover, itis well known that dopaminergic signaling may be in-
volved in wakefulness, and that muscarinic neuraltransmission serves as the main executive system inREM sleep.
A quantitative autoradiography study of narcolepticpatients at autopsy reported increased dopamine D2
binding.5 However, positron emission tomography(PET) studies of living narcoleptic patients showed nosignificant variations in dopamine D2 binding6 andshowed no increase in the muscarinic cholinergic re-ceptor.7
The cerebral glucose metabolism of narcoleptic pa-tients has not been investigated. Thus, we examinedwhether the cerebral glucose metabolism in the narco-lepsy differs from that in normal controls by perform-ing the statistical parametric mapping (SPM) analysisof 18F-fluorodeoxy glucose PET (FDG-PET) findings.
Materials and MethodsTwenty-four patients with narcolepsy and 24 normal age-and sex-matched controls were enrolled in the study. Themean age was 32 years both in patients and controls (rangedfrom 14 to 56 years for the patients and from 15 to 59 yearsfor the controls). Both groups consisted of 16 male and 8female subjects. Narcoleptic patients were selected based onclinical symptoms and sleep studies by applying the criteriaof the International Classification of Sleep Disorders.
18F-fluorodeoxy glucose PositronEmission TomographyPET images were obtained using a GE Advance PET scanner(GE Medical System, Milwaukee, WI). Patients fasted for 4or more hours and then received an intravenous bolus injec-tion of 7 to 10mCi FDG. PET scans were performed whilepatients were awake between 09:40 and 13:30. PET studieswere performed before stimulants or antidepressant medica-tions were started. For four patients who already had takenstimulants or antidepressants (three methylphenidate, onemodafinil, two clomipramine), PET scans were performedafter stopping medication for more than 5 days.
Statistical Parametric Mapping AnalysisSPM 99 (Wellcome Department of Cognitive Neurology,Institute of Neurology, London, UK) implanted in MAT-LAB 5.2 (MathWorks, Natick, MA) was used for the statis-tical analysis. All images of the 24 patients and the 24 con-trols were spatially normalized into a standard PET templateusing 12-parameter affine transformations and nonlineartransformations. Spatially normalized images were smoothedby convolution using an isotropic Gaussian kernel with a14mm full-width at half-maximum to increase the signal tonoise ratio. To remove the effect of global metabolism, wenormalized relative activity in each voxel to the total braincount by proportional scaling. The Student’s t test was usedto compare the narcoleptic and normal control groups. Sig-nificance level was set to a false discovery rate (FDR) cor-rected p � 0.05, and extent threshold was set at k � 50.8
From the Departments of 1Neurology and 2Nuclear Medicine, Sam-sung Medical Center and Center for Clinical Research, SBRI,Sungkyunkwan University School of Medicine, Seoul, Korea.
Received Mar 4, 2004, and in revised form May 6 and Jun 2. Ac-cepted for publication Jun 2, 2004.
Published online Aug 9, 2004, in Wiley InterScience(www.interscience.wiley.com). DOI: 10.1002/ana.20212
Address correspondence to Dr Hong, Department of Neurology,Samsung Medical Center, Sungkyunkwan University School ofMedicine, 50 Irwon-Dong, Gangnam-Gu, Seoul, 135-710, Korea.E-mail: [email protected]
© 2004 American Neurological Association 437Published by Wiley-Liss, Inc., through Wiley Subscription Services
ResultsPatients’ CharacteristicsAll patients had excessive daytime sleepiness (EDS),and 21 patients had cataplexy (21/24, 87%). Five pa-tients experienced hypnagogic hallucination and sleepparalysis. The mean age of onset of the narcolepticsymptoms was 22 years, ranging from 6 to 45 years,and the mean duration of the narcolepsy was 9.3 years,from 1 to 30 years. The mean Epworth sleepiness scalewas 16.2 � 3.8 and the mean Stanford sleepiness scalewas 3.4 � 1.1, which suggests moderate to severeEDS.
Night Polysomnography and MultipleSleep Latency TestSleep studies were performed in all patients. In thenight polysomnography, mean sleep latency was 6.7 �11.0 minutes, and mean REM sleep latency was49.1 � 49.4 seconds. The mean apnea-hypopnea indexwas 1.9 � 1.5 per hour of sleep, ranging from 0 to4.5. The mean arousal index was 18.2 � 7.0 per hour,ranging from 8.4 to 34.1. Most nocturnal arousalswere caused by an unknown cause.
Multiple Sleep Latency Test was performed on theday after night polysomnography. In the MultipleSleep Latency Test, mean sleep latency was 1.5 � 1.2minutes (0.6–4.1 minutes) and mean REM sleep la-tency was 4.2 � 3.7 minutes (1.0–7.4 minutes). Thenumber of sleep-onset REM periods in each patientwas two to five in five trials of daytime nap.
Abnormality of Cerebral Glucose Metabolism inNarcoleptic PatientsFDG-PET hypometabolism was detected in the bilat-eral rectal and subcallosal gyri, right superior frontalgyrus, the medial convexity of the right superior frontalgyrus, bilateral precuneus, right inferior parietal lobule,and left supramarginal gyrus (uncorrected p � 0.001).
These areas showed marginal significance at the FDRcorrected p level (whole-brain extent threshold)(0.05 � p � 0.07) for the multiple comparison prob-lem (Table). The bilateral posterior hypothalami andthe mediodorsal thalamic nuclei showed significant hy-pometabolism at corrected p � 0.05, with small vol-ume correction under the prior hypothesis of the hy-pothalamus being involved in narcolepsy (Fig.).3
DiscussionSeveral studies have shown that narcolepsy is caused bya deficiency in the hypothalamic peptide hypocre-tin.9,10 The hypocretin system is involved in variousfunctions such as sleep/arousal, mood/emotion, andmotor control.11 Neurons containing hypocretin arelocated mainly in the posterior hypothalamus.12 Onemagnetic resonance imaging study showed an anatom-ical abnormality related to the dysfunction ofhypocretin-producing cells, namely, reduced gray mat-ter concentrations in the hypothalamus and nucleus ac-cumbens of the narcoleptic brain.3 However, otherswere unable to detect similar changes in brain struc-tures, such as the abnormality of hypothalamus.4,13
The neurons containing hypocretin project through-out the central nervous system and innervate aminergicand cholinergic regions that promote wakefulness.14
Aminergic neurons project diffusely throughout theforebrain, and cholinergic neurons innervate the thala-mus, which promotes the flow of information to andfrom the cortex. However, PET studies of dopaminer-gic and muscarinic receptors failed to show relevant ab-normal findings in arousal regions in narcoleptic pa-tients.6,7 Studies of the cerebral glucose metabolism areanticipated to be useful to investigate the biochemicalcause of narcolepsy, because hypocretin neurons areglucose sensitive.15
Our study demonstrates a significantly reduced glu-cose metabolism in bilateral posterior hypothalami and
Table. SPM Result of Brain Regions Showing Hypometabolism in Narcoleptic Patients
Voxel LevelTalairach Coordinate
x,y,z (mm) Anatomic Region BApFWE-corr pFDR-corr Peak Z puncorrected
0.041 0.057 4.41 0.00005 6,32,�20 R. Rectal Gyrus, Subcallosal Gyrus 110.206 0.057 3.93 0.00043 �10,32,�20 L. Rectal Gyrus, Subcallosal Gyrus 110.165 0.057 4.00 0.00003 0,�52,38 B. Precuneus 70.385 0.057 3.70 0.00011 22,16,44 R. Superior Frontal Gyrus 80.409 0.057 3.67 0.00012 8,22,46 R. Medial Convexity of the Superior Frontal Gyrus 80.580 0.058 3.50 0.00023 50,�56,40 R. Inferior Parietal Lobule 400.666 0.063 3.42 0.00032 �52,�56,30 L. Supramarginal Gyrus 400.029 0.025 2.83 0.002 �4,�20,�4 aB. Hypothalamus, Thalamus -
Height threshold uncorrected p � 0.001, pFWE-corr: familywise error corrected p, pFDR-corr: false discovery rate corrected p, extent thresholdKe � 100 voxels.aSmall volume corrected P at 10mm radius at the center point (x, y, z: 0, �12, �6),
SPM � statistical parametric mapping; BA � Broadmann area; L � left; R � right; B � bilateal.
438 Annals of Neurology Vol 56 No 3 September 2004

the adjacent mediodorsal thalamic nuclei. These find-ings are in agreement with the established neurobiolog-ical hypocretin pathways in narcoleptic patients. Hypo-metabolism in the posterior hypothalamus may reflecta reduced number of hypocretin immunoreactive neu-rons as reported.10
In addition, compared with controls, a reduction inglucose metabolism was detected in bilateral rectal andsubcallosal gyri, right superior frontal gyrus, the medialconvexity of right superior frontal gyrus, bilateral pre-cuneus, right inferior parietal lobule, and in left supra-marginal gyrus. Hypocretin neurons in the posteriorhypothalamus are connected to the various brain areassuch as the lateral, anterior, posterior and dorsomedialhypothalami, thalamus, and the frontal and parietalcortices. These neurons modulate normal arousal, af-fect, motor activity, and sleep/wake activity.11
In an H215O-PET study of patients with familial de-
pressive disorders, reduced cerebral activity and corticalvolume loss in the frontal cortex ventral to the genu of
the corpus callosum was reported.16 This region is in-volved in emotional response to provocative stimuli.16
Most of our patients (87.5%) showed cataplexy (thesudden loss of muscle tones reactive to provocativeemotional stimuli). Approximately 30% narcoleptic pa-tients suffer from depression.17 Our data show hypo-metabolism in the bilateral subcallosal gyri. This mayexplain the presence of a depressive tendency in narco-leptic patients. However, none of our patients sufferedfrom a major mood disorder.
Memory disturbances have been reported in 50%narcoleptic patients, particularly for the disturbance ofrecent memory.18 It has been reported that the medialsuperior frontal gyrus may be involved in the processesof working memory.19 Our results suggests that hypo-metabolism in the medial convexity of superior frontalgyrus may be an alternate cause of memory impairmentin narcoleptic patients.
This work presents the results of a first study of thecerebral glucose metabolism in narcolepsy patients. Ab-
Fig. The brain regions showing glucose hypometabolism in narcoleptic patients. The overall hypometabolic areas are shown in glassbrain view (A). Hypometabolism in bilateral rectal, subcallosal gyri, right superior frontal gyrus, the medial convexity of right supe-rior frontal gyrus, and in right inferior parietal lobule are shown as a T1 template overlaid magnetic resonance imaging (B) at theuncorrected p � 0.001 level. Bilateral posterior hypothalami and mediodorsolateral thalamic nuclei show hypometabolism (C) inthe level of false discovery rate corrected p � 0.05 with small volume correction. The left-hand side of the images represents the leftside of the brain. The order of left to right panels in (C) is arranged in the anterior to posterior direction in coronal images of thebrain.
Joo et al: Cerebral Hypometabolism in Narcolepsy 439
normal cerebral glucose metabolism was observed inthe hypocretin system and in brain regions related toemotional response and memory.
This study was supported by a Samsung grant (SBRI #C-A3-115-2,S.B.H., W.S.T), by a grant from the Next-Generation New Tech-nology Development Program of the Korean Ministry of Com-merce, Industry and Energy (A18-01-00, S.B.H.), and by an Na-tional Research Laboratory grant from the Korean Ministry ofScience and Technology, Republic of Korea (2000-N-NC-01-C-163; 2004).
References1. Guilleminault C, Anagnos A. Narcolepsy. In: Kryger MH,
Roth T, Dement WC, editors. Principles and practice of sleepmedicine. 3rd ed. Philadelphia: Saunders, 2000:676–686.
2. SK Lee, SA Lee. Kleine-Levin syndrome: two cases. J KoreanNeurol Assoc 1999;17:702–704.
3. Draganski B, Geisler P, Hajak G, et al. Hypothalmic gray mat-ter changes in narcoleptic patients. Nat Med 2002;8:1186–1188.
4. Kaufmann C, Schuld A, Pollmacher T, Auer DP. Reduced cor-tical gray matter in narcolepsy: preliminary findings with voxel-based morphometry. Neurology 2002;58:1852–1855.
5. Aldrich MS, Hollingsworth Z, Penney JB. Dopamine-receptorautoradiography of human narcoleptic brain. Neurology 1992;42:410–415.
6. MacFarlane JG, List SJ, Moldofsky H, et al. Dopamine D2receptors quantified in vivo in human narcolepsy. Biol Psychi-atry 1997;41:305–310.
7. Sudo Y, Suhara T, Honda Y, et al. Muscarinic cholinergic re-ceptors in human narcolepsy: a PET study. Neurology 1998;51:1297–1302.
8. Genovese CR, Lazar NA, Nichols T. Thresholding of statisticalmaps in functional neuroimaging using the false discovery rate.Neuroimage 2002;15:870–878.
9. Scanmell TE. The neurobiology, diagnosis, and treatment ofnarcolepsy. Ann Neurol 2003;53:154–166.
10. Thannickal TC, Moore RY, Nienhuis R, et al. Reduced num-ber of hypocretin neurons in human narcolepsy. Neuron 2000;27:469–474.
11. Taheri S, Zeitzer JM, Mignot E. The role of hypocretins (orex-ins) in sleep regulation and narcolepsy. Annu Rev Neurosci2002;25:283–313.
12. Sakurai T, Amemiya A, Ishii M, et al. Orexins and orexinreceptors: a family of hypothalamic neuropeptides and Gprotein-coupled receptors that regulate feeding behavior. Cell1998;92:573–585.
13. Overeem S, Steens SC, Good CD, et al. Voxel-based mor-phometry in hypocretin-deficient narcolepsy. Sleep 2003;26:44–46.
14. Peyron C, Tighe DK, van den Pol AN, et al. Neurons contain-ing hypocretin (orexin) project to multiple neuronal systems.J Neurosci 1998;18:9996–10015.
15. Overeem S, Mignot E, van Dijk JG, Lammers GJ. Narcolepsy:clinical features, new pathophysiologic insights, and future per-spectives. J Clin Neurophysiol 2001;18:78–105.
16. Drevets WC, Price JL, Simpson JR Jr, et al. Subgenual prefron-tal cortex abnormalities in mood disorders. Nature 1997;386:824–827.
17. Vandeputte M, de Weerd A. Sleep disorders and depressivefeelings: a global survey with the Beck depression scale. SleepMed 2003;4:343–345.
18. Aguirre M, Broughton R, Stuss D. Does memory impairmentexist in narcolepsy-cataplexy? J Clin Exp Neuropsychol 1985;7:14–24.
19. Cabeza R, Nyberg L. Imaging cognition II: an empirical reviewof 275 PET and fMRI studies. J Cogn Neurosci 2000;12:1–47.
Mechanism of Actionof Voltage-Gated K
Channel Antibodies inAcquired NeuromyotoniaHisanori Tomimitsu, MD,1 Kimiyoshi Arimura, MD,1
Tatsui Nagado, MD,1 Osamu Watanabe, MD,1
Reika Otsuka, MD,1 Asutsugu Kurono, MD,1
Yoshito Sonoda, MD,2 Mitsuhiro Osame, MD,1
and Masaki Kameyama, MD, PhD3
Acquired neuromyotonia (ANM) is associated with anti-bodies to voltage-gated K� channels (VGKCs). ANM serareduce the number of K� currents in neuronal cell lines,but it is not clear how the antibodies act. Here, we showby using the NB-1 cell line that the reduction in K� cur-rents by IgG is independent of added complement. IgGFc and Fab fragments from ANM sera had no effect, butthree of four ANM F(ab�)2 fragments significantly re-duced K� currents. Thus, cross-linking of the channelsby divalent antibodies is likely to be an important mech-anism in reducing K� currents.
Ann Neurol 2004;56:440–444
Acquired neuromyotonia (ANM) or Isaac’s syndromeis characterized by painful muscle cramps andpseudomyotonia, often associated with excessive sweat-ing.1,2 There is evidence that the condition can be au-toimmune, and sometimes paraneoplastic,3–5 and it isthought to be caused by antibodies to voltage-gatedpotassium channels (VGKCs) that can be detected byradioimmunoprecipitation assays, Western blotting,
From the 1Third Department of Internal Medicine, KagoshimaUniversity; 2Department of Neurology, National Hospital Organi-zation, Minamikyushu National Hospital; and 3Second Departmentof Physiology, Kagoshima University, Kagoshima, Japan.
Received Apr 14, 2003, and in revised form Apr 22 and June 7,2004. Accepted for publication Jun 7, 2004.
Published online Aug 31, 2004, in Wiley InterScience(www.interscience.wiley.com). DOI: 10.1002/ana.20221
Address correspondence to Dr Arimura, The Third Department ofInternal Medicine, Kagoshima University, 8-35-1 Sakuragaoka, Ka-goshima, 890-8520, Japan. E-mail: [email protected]
440 © 2004 American Neurological AssociationPublished by Wiley-Liss, Inc., through Wiley Subscription Services

immunostaining, and electrophysiological studies ofcell lines expressing VGKCs.6–8
In myasthenia gravis, which is caused by antibodiesto the nicotinic acetylcholine receptor, the antibodiesreduce the number of functional receptors by a com-bination of direct block of function, complement-mediated cell destruction, and increased degradation.9
ANM IgG preparations did not block the function ofVGKCs in PC-12 cells but reduced the K currents,without change in channel kinetics, when the cellswere incubated with the IgG for greater than 24 hours,with 3 days being optimal.10,11 These findings suggestthat the antibodies decrease the number of VGKCs,rather than affect their function, but a complement-dependent effect was not excluded. Here, we presentevidence that increased degradation of VGKCs by di-valent antibodies is likely to be an important mecha-nism in ANM.
Subjects and MethodsPatientsWe obtained sera from four female patients with ANM asdescribed in the Table. The patients presented with charac-teristic clinical features of ANM including pseudomyotonia,muscle cramps, excessive sweating, and typical electromyo-graphic findings of myokymic and/or neuromyotonic dis-charges.4 VGKC antibodies were positive by immunoprecipi-tation (�100pM) in all, and plasma exchange producedclinical improvement. Control immunoglobulins were ob-tained from four healthy volunteers. Informed consent wasobtained from all the participants.
Preparation of IgG FragmentsImmunoglobulins were purified using protein G columnsunder the recommended conditions (HiTrapTM protein Gcolumn; Pharmacia Biotech, Uppsala Sweden); IgG waseluted with 0.1M Glycin-HCl buffer, pH 2.7, and desaltedusing HiTrapTM desalting column (Pharmacia Biotech) runwith phosphate-buffered saline (PBS). The peak fractions(optical density at 280nM) were collected for further stud-ies,12 and the IgG concentrations adjusted to 10�g/ml inculture medium.
Fab and Fc fragments were prepared by papain digestionof the IgG.13 The purified IgG was dissolved in PBS with10mM cysteine and 2mM EDTA adjusted to pH 8.0. Onemilligram of papain (Sigma, St. Louis, MO) was added for 4hours at 37°C. The mixture was applied to a SephadexG-300 column in PBS, and the peak fractions applied to aprotein G column to separate Fc from Fab fragments that do
not bind protein G. The fractions were monitored at280nM13 and adjusted to 10�g/ml.
F(ab�)2 were prepared from IgG by pepsin digestion.13
IgG was dissolved in 0.1 M sodium acetate buffer adjustedto pH 4.5. Pepsin was added and the resultant solution wasleft at 37°C overnight. After centrifugation to remove aggre-gates, the solution was adjusted to pH 7.4 and applied to adesalting column preequilibrated with PBS, to remove pep-sin, and then to a Sephadex G-300 column to separateF(ab�)2 from other fragments.12 The final concentration wasadjusted to 10�g/ml for further studies.
We used guinea pig complement (GPC; Gibco BRL,Gaithesburg, USA) stored frozen at �80°C as a source ofcomplement. It was applied at approximately 40U/ml in cul-ture medium.14 However, we did not check for the degreeand duration of complement bioactivity nor complementbinding.
Preparation of Cells for RecordingThe NB-1 cells (human neuroblastoma cell line) were ob-tained from the Health Science Research Resources Bank,passaged weekly as previously described15 using poly-L-lysine–coated culture dishes (Iwaki, Funabashi, Japan). The fetalcalf serum and horse serum were heated at 56°C for 30minutes to destroy complement, and the pH of the me-dium adjusted to 7.3 with NaOH. For electrophysiologicalexperiments, the NB-1 cells were cultured for 3 days with10°g/ml of immunoglobulin or its fragments from the pa-tients or healthy controls. Complement was added at time0. All the experiments were conducted at room tempera-ture.
Two types of NB-1 cells, blast type and mature type,could be distinguished in the cultures. The blast type cellswere used for all patch clamp experiments because they gen-erate constant currents and are suitable for clamping.11
Solutions and Patch Clamp RecordingsThe recordings were performed essentially as previously de-scribed.10,11 The extracellular solution contained 145mMNaCl, 6.0mM KCl, 10mM HEPES, 2mM CaCl2, 1mMMgCl2, and 5mM glucose. The pH was adjusted to 7.4 withNaOH. The composition of the pipette solution was150mM KCl, 10mM HEPES, 10mM EGTA, 1mM CaCl2,and 1mM MgCl2 (pH 7.4). The cells were held at the hold-ing potential (V-hold) of �80mV, and square pulses of 300-millisecond duration were applied at potentials between�100 and 40mV (20mV step) with 12 seconds intervals.The peak current during the command pulse was monitoredbecause it reflects closely the rate of suppression. The linearpeak current fraction was calculated by the least squares
Table. Clinical Features and Electromyographic Findings
Case No. Age, Sex Myokymia Cramp Hyperhydrosis Needle Electromyographic Findings
1 40 M � Myokymic discharges2 57 F � � Neuromyotonic discharges3 57 F Myokymic and neuromyotonic discharges4 64 F Myokymic and neuromyotonic discharges
Tomimitsu et al: Pathomechanism of ANM 441

method from currents obtained at test potentials of �100,�80, and �60mV. The membrane capacitance (Cm) wascalculated by measuring the charge transfer during the initialcapacitative surge (Q) elicited by a 10mV depolarizing pulseat �80mV, using the equation Q � Cm*V. Taking intoaccount the fact that the membrane capacitance reflects themembrane area, we normalized the ion current using the fol-lowing equation: Ion current density (pA/pF) � (measuredcurrent � leak current)/Cm.11
StatisticsThe values are given as mean � standard error unless oth-erwise specified. Statview (version 5.5; SAS Institute, Cary,NC) was used for statistical analysis. The Student’s t test wasapplied first, but if the F test indicated a non-Gaussian dis-tribution, the nonparametric Mann–Whitney U test wasused.
ResultsAfter 3 days in culture, IgG from four patients pro-duced significant suppression of outward K currentcompared with those in control IgG preparations (p �0.05) (Fig 1A), as in previous studies.11 The cell ca-pacitance (47–56pF) and the resting membrane poten-tials (�58 to �70mV) were not significantly differentfrom those of controls (data not shown).
To determine whether complement-mediated dam-age was involved, we chose cases 1 and 2 whose IgGsstrongly suppressed the outward K current and cul-tured NB-1 cells with IgGs for 3 days, with or withoutactive guinea pig complement. Complement additiondid not increase the effect of the IgG in reducingVGKC currents (see Fig 1B).
To investigate the role of divalent antibody in re-ducing VGKC currents, we cultured the cells for3 days in the presence of the IgG fragments. Resultsfor IgG preparations from Patient 1 are shown in Fig-ure 2A. The Fc and Fab fractions had no effect onthe K currents, but F(ab�)2 substantially reducedthem. Significant reductions in VGKC currents werefound for three of the four F(ab�)2 preparations (seeFig 2B).
DiscussionWe investigated the mechanism of action of ANM IgGin vitro. There was no apparent additional effect ofcomplement, over that of IgG alone, but the suppres-sion of VGKC currents was found only with ANMpatients’ IgGs and their F(ab�)2 fragments and was notseen when monovalent Fabs or Fc fragments were ap-plied.
These experiments are similar in principle to thoseconducted with antibodies to acetylcholine receptors16
or to voltage-gated calcium channels.17,18 Drachmanand colleagues16 reported a threefold increase in rate ofdegradation of acetylcholine receptors on addition ofwhole IgG or F(ab�)2 fragment, whereas the Fc and
Fab fragments had no effect. Our results, in showingthat only intact IgG and F(ab�)2 fragments can cause areduction in K currents, and that such a reduction isnot seen after short incubations times,10 strongly implythat a similar mechanism occurs in ANM. We alreadyhad demonstrated that binding of antibody to theVGKC is not sufficient to block function, either byinducing an alteration of the VGKC conformation orby directly interfering with the ion pore.11
The suppression of K currents was not enhancedby complement. In myasthenia gravis, complement ac-tivation is an important mechanism.9 In contrast, in
Fig 1. Effects of IgG and complement on voltage-gated K
channels (VGKC) currents. (A) The K current elicited inNB-1 cells by 300-millisecond test pulses from �100 to40mV from the holding potential of �80mV. Outwardrectifying currents with decay were present at potentials morepositive than �20mV. Cells were cultured for 3 days with10�g/ml of IgG from a control and Patients 1 to 4 with ac-quired neuromyotonia respectively. (B) The effects of IgG fromPatient 1 and Patient 2 in the presence of active or inacti-vated guinea pig complement, incubated for 3 days before therecordings. Peak current densities were obtained at the testpotential of 40mV from the holding potential of �80mV.Box plots show median values, 25th and 75th percentiles, cen-ter bars show mean current density, and bars show 10th and90th percentiles range.
442 Annals of Neurology Vol 56 No 3 September 2004
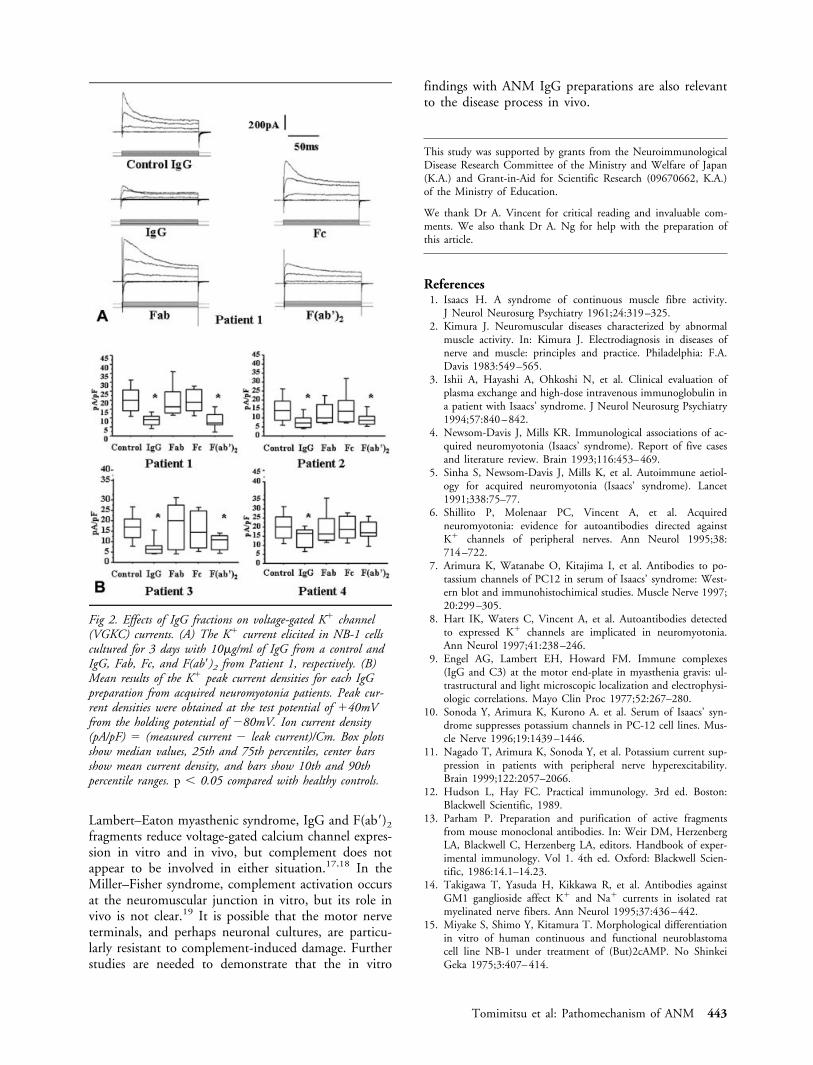
Lambert–Eaton myasthenic syndrome, IgG and F(ab�)2
fragments reduce voltage-gated calcium channel expres-sion in vitro and in vivo, but complement does notappear to be involved in either situation.17,18 In theMiller–Fisher syndrome, complement activation occursat the neuromuscular junction in vitro, but its role invivo is not clear.19 It is possible that the motor nerveterminals, and perhaps neuronal cultures, are particu-larly resistant to complement-induced damage. Furtherstudies are needed to demonstrate that the in vitro
findings with ANM IgG preparations are also relevantto the disease process in vivo.
This study was supported by grants from the NeuroimmunologicalDisease Research Committee of the Ministry and Welfare of Japan(K.A.) and Grant-in-Aid for Scientific Research (09670662, K.A.)of the Ministry of Education.
We thank Dr A. Vincent for critical reading and invaluable com-ments. We also thank Dr A. Ng for help with the preparation ofthis article.
References1. Isaacs H. A syndrome of continuous muscle fibre activity.
J Neurol Neurosurg Psychiatry 1961;24:319–325.2. Kimura J. Neuromuscular diseases characterized by abnormal
muscle activity. In: Kimura J. Electrodiagnosis in diseases ofnerve and muscle: principles and practice. Philadelphia: F.A.Davis 1983:549–565.
3. Ishii A, Hayashi A, Ohkoshi N, et al. Clinical evaluation ofplasma exchange and high-dose intravenous immunoglobulin ina patient with Isaacs’ syndrome. J Neurol Neurosurg Psychiatry1994;57:840–842.
4. Newsom-Davis J, Mills KR. Immunological associations of ac-quired neuromyotonia (Isaacs’ syndrome). Report of five casesand literature review. Brain 1993;116:453–469.
5. Sinha S, Newsom-Davis J, Mills K, et al. Autoimmune aetiol-ogy for acquired neuromyotonia (Isaacs’ syndrome). Lancet1991;338:75–77.
6. Shillito P, Molenaar PC, Vincent A, et al. Acquiredneuromyotonia: evidence for autoantibodies directed againstK channels of peripheral nerves. Ann Neurol 1995;38:714–722.
7. Arimura K, Watanabe O, Kitajima I, et al. Antibodies to po-tassium channels of PC12 in serum of Isaacs’ syndrome: West-ern blot and immunohistochimical studies. Muscle Nerve 1997;20:299–305.
8. Hart IK, Waters C, Vincent A, et al. Autoantibodies detectedto expressed K channels are implicated in neuromyotonia.Ann Neurol 1997;41:238–246.
9. Engel AG, Lambert EH, Howard FM. Immune complexes(IgG and C3) at the motor end-plate in myasthenia gravis: ul-trastructural and light microscopic localization and electrophysi-ologic correlations. Mayo Clin Proc 1977;52:267–280.
10. Sonoda Y, Arimura K, Kurono A. et al. Serum of Isaacs’ syn-drome suppresses potassium channels in PC-12 cell lines. Mus-cle Nerve 1996;19:1439–1446.
11. Nagado T, Arimura K, Sonoda Y, et al. Potassium current sup-pression in patients with peripheral nerve hyperexcitability.Brain 1999;122:2057–2066.
12. Hudson L, Hay FC. Practical immunology. 3rd ed. Boston:Blackwell Scientific, 1989.
13. Parham P. Preparation and purification of active fragmentsfrom mouse monoclonal antibodies. In: Weir DM, HerzenbergLA, Blackwell C, Herzenberg LA, editors. Handbook of exper-imental immunology. Vol 1. 4th ed. Oxford: Blackwell Scien-tific, 1986:14.1–14.23.
14. Takigawa T, Yasuda H, Kikkawa R, et al. Antibodies againstGM1 ganglioside affect K and Na currents in isolated ratmyelinated nerve fibers. Ann Neurol 1995;37:436–442.
15. Miyake S, Shimo Y, Kitamura T. Morphological differentiationin vitro of human continuous and functional neuroblastomacell line NB-1 under treatment of (But)2cAMP. No ShinkeiGeka 1975;3:407–414.
Fig 2. Effects of IgG fractions on voltage-gated K channel(VGKC) currents. (A) The K current elicited in NB-1 cellscultured for 3 days with 10�g/ml of IgG from a control andIgG, Fab, Fc, and F(ab�)2 from Patient 1, respectively. (B)Mean results of the K peak current densities for each IgGpreparation from acquired neuromyotonia patients. Peak cur-rent densities were obtained at the test potential of 40mVfrom the holding potential of �80mV. Ion current density(pA/pF) � (measured current � leak current)/Cm. Box plotsshow median values, 25th and 75th percentiles, center barsshow mean current density, and bars show 10th and 90thpercentile ranges. p � 0.05 compared with healthy controls.
Tomimitsu et al: Pathomechanism of ANM 443
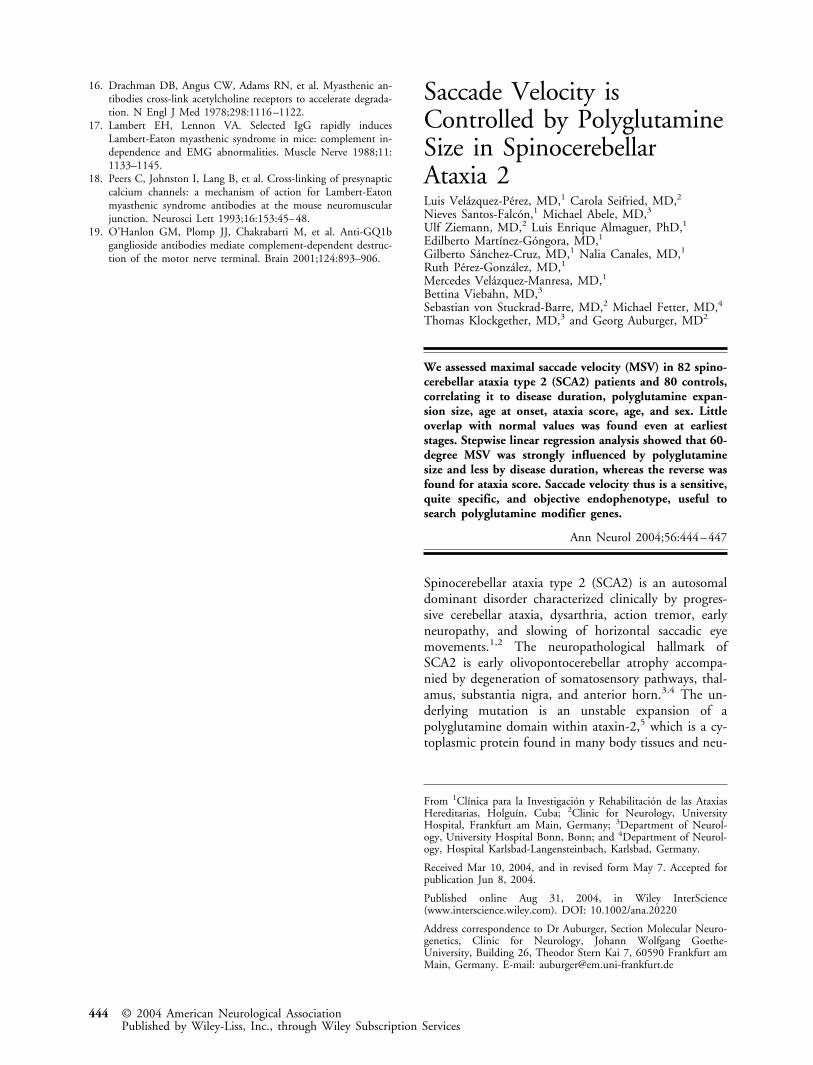
16. Drachman DB, Angus CW, Adams RN, et al. Myasthenic an-tibodies cross-link acetylcholine receptors to accelerate degrada-tion. N Engl J Med 1978;298:1116–1122.
17. Lambert EH, Lennon VA. Selected IgG rapidly inducesLambert-Eaton myasthenic syndrome in mice: complement in-dependence and EMG abnormalities. Muscle Nerve 1988;11:1133–1145.
18. Peers C, Johnston I, Lang B, et al. Cross-linking of presynapticcalcium channels: a mechanism of action for Lambert-Eatonmyasthenic syndrome antibodies at the mouse neuromuscularjunction. Neurosci Lett 1993;16:153:45–48.
19. O’Hanlon GM, Plomp JJ, Chakrabarti M, et al. Anti-GQ1bganglioside antibodies mediate complement-dependent destruc-tion of the motor nerve terminal. Brain 2001;124:893–906.
Saccade Velocity isControlled by PolyglutamineSize in SpinocerebellarAtaxia 2Luis Velazquez-Perez, MD,1 Carola Seifried, MD,2
Nieves Santos-Falcon,1 Michael Abele, MD,3
Ulf Ziemann, MD,2 Luis Enrique Almaguer, PhD,1
Edilberto Martınez-Gongora, MD,1
Gilberto Sanchez-Cruz, MD,1 Nalia Canales, MD,1
Ruth Perez-Gonzalez, MD,1
Mercedes Velazquez-Manresa, MD,1
Bettina Viebahn, MD,3
Sebastian von Stuckrad-Barre, MD,2 Michael Fetter, MD,4
Thomas Klockgether, MD,3 and Georg Auburger, MD2
We assessed maximal saccade velocity (MSV) in 82 spino-cerebellar ataxia type 2 (SCA2) patients and 80 controls,correlating it to disease duration, polyglutamine expan-sion size, age at onset, ataxia score, age, and sex. Littleoverlap with normal values was found even at earlieststages. Stepwise linear regression analysis showed that 60-degree MSV was strongly influenced by polyglutaminesize and less by disease duration, whereas the reverse wasfound for ataxia score. Saccade velocity thus is a sensitive,quite specific, and objective endophenotype, useful tosearch polyglutamine modifier genes.
Ann Neurol 2004;56:444–447
Spinocerebellar ataxia type 2 (SCA2) is an autosomaldominant disorder characterized clinically by progres-sive cerebellar ataxia, dysarthria, action tremor, earlyneuropathy, and slowing of horizontal saccadic eyemovements.1,2 The neuropathological hallmark ofSCA2 is early olivopontocerebellar atrophy accompa-nied by degeneration of somatosensory pathways, thal-amus, substantia nigra, and anterior horn.3,4 The un-derlying mutation is an unstable expansion of apolyglutamine domain within ataxin-2,5 which is a cy-toplasmic protein found in many body tissues and neu-
From 1Clınica para la Investigacion y Rehabilitacion de las AtaxiasHereditarias, Holguın, Cuba; 2Clinic for Neurology, UniversityHospital, Frankfurt am Main, Germany; 3Department of Neurol-ogy, University Hospital Bonn, Bonn; and 4Department of Neurol-ogy, Hospital Karlsbad-Langensteinbach, Karlsbad, Germany.
Received Mar 10, 2004, and in revised form May 7. Accepted forpublication Jun 8, 2004.
Published online Aug 31, 2004, in Wiley InterScience(www.interscience.wiley.com). DOI: 10.1002/ana.20220
Address correspondence to Dr Auburger, Section Molecular Neuro-genetics, Clinic for Neurology, Johann Wolfgang Goethe-University, Building 26, Theodor Stern Kai 7, 60590 Frankfurt amMain, Germany. E-mail: [email protected]
444 © 2004 American Neurological AssociationPublished by Wiley-Liss, Inc., through Wiley Subscription Services

ronal populations with an as of yet undefined func-tion.6 In SCA2 as in the neurodegenerative diseasesHuntington’s disease (HD), spinobulbar muscular at-rophy (SBMA), dentatorubropallidoluysian atrophy(DRPLA), SCA1, SCA3, SCA6, SCA7, and SCA17,the size of the polyglutamine expansion has a stronginfluence on the age at onset as well as the severity ofdisease. The modulation of both disease onset and pro-gression by modifier factors or experimental therapies isunder intense investigation, and the objective quantifi-cation of surrogate disease markers is a central issue.One objectively quantifiable endophenotype occurringin HD,7 SCA1,8 SCA2,9 and SCA710 is the progressiveslowing of horizontal saccadic velocity. Saccade slowingis only rarely observed in neurological conditions otherthan polyglutamine diseases. In SCA2, the slowing ofsaccades occurs so early and pronounced11 that thisdisease originally was described as “a new form ofheredofamilial spinocerebellar degeneration with sloweye movements.”12 The prevalence of SCA2 is partic-ularly high in Holguın province, Cuba,1,13,14 wheremore than 1,000 patients descended from a single an-cestor. In 82 SCA2 patients from these families and in80 control individuals from Holguın, we determinedmaximal saccade velocity (MSV). We evaluated its cor-relation to disease duration, polyglutamine expansionsize, age at onset, ataxia score, age, and sex, to judge itsusefulness in assessing polyglutamine toxicity and clin-ical progression.
Subjects and MethodsPatientsThe diagnosis of SCA2 was based on genealogical descentfrom the founder population, on the disease manifestationwith cerebellar ataxia and dysarthria, and molecular geneticdetermination of the repeat expansion as described else-where.15 Eighty-two patients (52 male and 30 female pa-tients) with ages ranging from 15 to 80 years (mean, 43.0;standard deviation [SD], 13.3), age at onset from 8 to 68years (mean, 29.7; SD, 12.4), disease duration from 1 to 42years (mean, 13.3; SD, 7.9), and polyglutamine repeat sizesfrom 34 to 50 (mean, 40; SD, 3) were admitted to theClinic for Investigation and Rehabilitation of HereditaryAtaxias in Holguın for this study. The clinical assessmentwas conducted using the International Cooperative AtaxiaRating Scale.16 A group of 80 healthy nonpaid volunteersfrom Holguın province (58 female and 22 male subjects)with ages ranging from 11 to 81 years (mean, 41.7; SD,12.6) served as controls.
Electronystagmographic RecordingsHorizontal and vertical eye movements were recorded binoc-ularly with silver-silver chloride electrodes over right and leftouter canthus and a two-channel Otoscreen AC electronys-tagmograph (Jaeger-Toennies, Hochberg, Germany) with abandpass filter of 0.02 to 70Hz, a sensitivity of 200�V/di-vision, a time base of 1,000 milliseconds/division, a time
constant of 8 seconds, and a sampling rate of 200Hz. Eyemovements were elicited with a circular white target sub-tending an angle of 0.7 degrees on a black background. Thedistance between patient and monitor as well as the headposition were controlled by chin/head supports. At least 10horizontal centrifugal saccades in either direction were re-corded for each 10-, 20-, 30-, and 60-degree predictable am-plitudes. Comparison of independent calibrations at a 30-degree angle before and after all recordings was used tocontrol against artefacts.
Saccade AnalysisThe traces in ASCII format were imported into the MAT-LAB software (version 6.1; Natick, MA). An program writ-ten in-house was used for manual identification of saccadeonset and offset (Fig 1). Maximal saccade velocity (MSV indegrees/sec) was obtained through third-order polynomialfits of the raw signal. Conditional MSV averages were calcu-lated for saccade direction (left/right) and amplitude (10/20/30/60 degrees) using Microsoft Excel.
Statistical AnalysisStatistical analysis was performed using the Student’s t test(comparison of MSV, age, age at onset, disease duration, and
Fig 1. Maximal saccade velocity (MSV) determination. Man-ually identified saccade onset and offset (circles), third orderpolynomial fits (smooth line), and MSVs (x) are illustratedfor representative saccades from (A) the control case with low-est MSV values, (B) a mild SCA2 case with polyglutaminesize 35 and least MSV reduction, and (C) the most severeSCA2 case with polyglutamine size 50.
Velazquez-Perez et al: Saccade Velocities in SCA2 445

polyglutamine expansion size between men/women and pa-tients/controls, respectively) and simple linear regressionanalysis (correlation of 60-degree MSV and ataxia score withage, disease duration, polyglutamine expansion size, and ageat onset). To select the appropriate model for multiple re-gressors, we used a stepwise regression procedure based onthe Akaike information criterion, included in the JMP5.0.1software (SAS Institute, Cary, NC).
ResultsMSV values showed little overlap between SCA2 pa-tients and controls (Fig 2A) and resulted in comparablysignificant differences (p � 0.0001 each) for 10, 20,30, and 60 degrees. Avoiding redundancy, we show60-degree MSV values in further correlations. The con-trols had 60-degree MSV ranging from 277 to 678 de-grees/sec (mean, 415; SD, 79), whereas the SCA2 pa-tients had values from 17 to 464 degrees/sec (mean,135; SD, 79). Assessing the sensitivity for SCA2 diag-nosis in a plot of true-positives versus false-positives,we calculated a receiver operating characteristic (ROC)analysis for 60-degree MSV with patients as the posi-
tive level, yielding an area under the curve (AUC) of0.98758.
Slowing of MSV was found early in the diseasecourse, with two individuals (polyglutamine repeat size39 and 41, respectively) showing 235 and 233 degrees/sec 1 year after onset of ataxia, and nine individualswithin 5-year disease duration showing a mean value of173 degrees/sec (SD, 56). The progression of slowingappeared insidious, because 14 individuals after 20 to42 years of disease duration still showed mean MSV of103 degrees/sec (SD, 49).
Simple regression analyses were conducted withinthe SCA2 patients and best fits were obtained using alog(y) transformation, as published previously.5,17 Thisdisclosed a significant negative correlation of age of on-set and polyglutamine expansion size (p � 0.0001)(see Fig 2B) and a significant positive correlation of ageand disease duration (p � 0.0001).
MSV was negatively correlated with disease duration(p � 0.088; see Fig 2C), polyglutamine expansion size(p � 0.0001; see Fig 2D), and ataxia score (p �0.0001) and positively correlated with age (p � 0.01)and age of onset (p � 0.001). Stepwise linear regres-sion analysis revealed polyglutamine expansion sizeand, to a lesser degree, disease duration as the mosteffective covariables on MSV. Addition of any othercovariable did not yield a better fit of the model.Therefore, the significant influence of age and age ofonset on MSV in simple regression was an artefact ex-plained by the colinearity of polyglutamine expansionsize and age of onset on one hand as well as age anddisease duration on the other hand. The age-dependentdecrease of MSV in our controls (p � 0.005) and ear-lier reports18 thus seems to be negligible in SCA2 pa-tients.
Ataxia score was negatively correlated with age ofonset (p � 0.05) and positively with disease duration(p � 0.0001; see Fig 2E) and polyglutamine expansionsize (p � 0.092; see Fig 2F). There was no correlationof age and ataxia score (p � 0.37). In contrast withMSV, the strongest influence on ataxia score wasthrough disease duration and less through polyglu-tamine expansion size upon stepwise linear regressionanalysis. The influence of age of onset on ataxia scoreagain seemed to be an artefact due to colinearity ofpolyglutamine expansion size and age of onset.
DiscussionOur investigation of maximal saccade velocities in 82SCA2 patients and 80 controls disclosed that MSV isstrongly influenced by the polyglutamine expansionsize and less so by the duration of disease. There wasonly a small overlap of MSV values between the pa-tient group and the control group. The clearly abnor-mal MSV values in patients with manifest ataxia for
Fig 2. Surrogate disease markers in SCA2. (A) Distribution of60-degree MSV values in SCA2 patients and local controls,displaying mean lines, standard deviation lines, and meanerror bars. (B–F) Correlations as simple regression with log(y)transformation. (B) Known significant dependence of age atonset on polyglutamine expansion size in this SCA2 collective.MSV values depended less on disease duration (C) than onpolyglutamine expansion size (D), with a distribution verysimilar to B. In contrast, the ataxia score depended more ondisease duration (E) than on polyglutamine expansion size (F).
446 Annals of Neurology Vol 56 No 3 September 2004
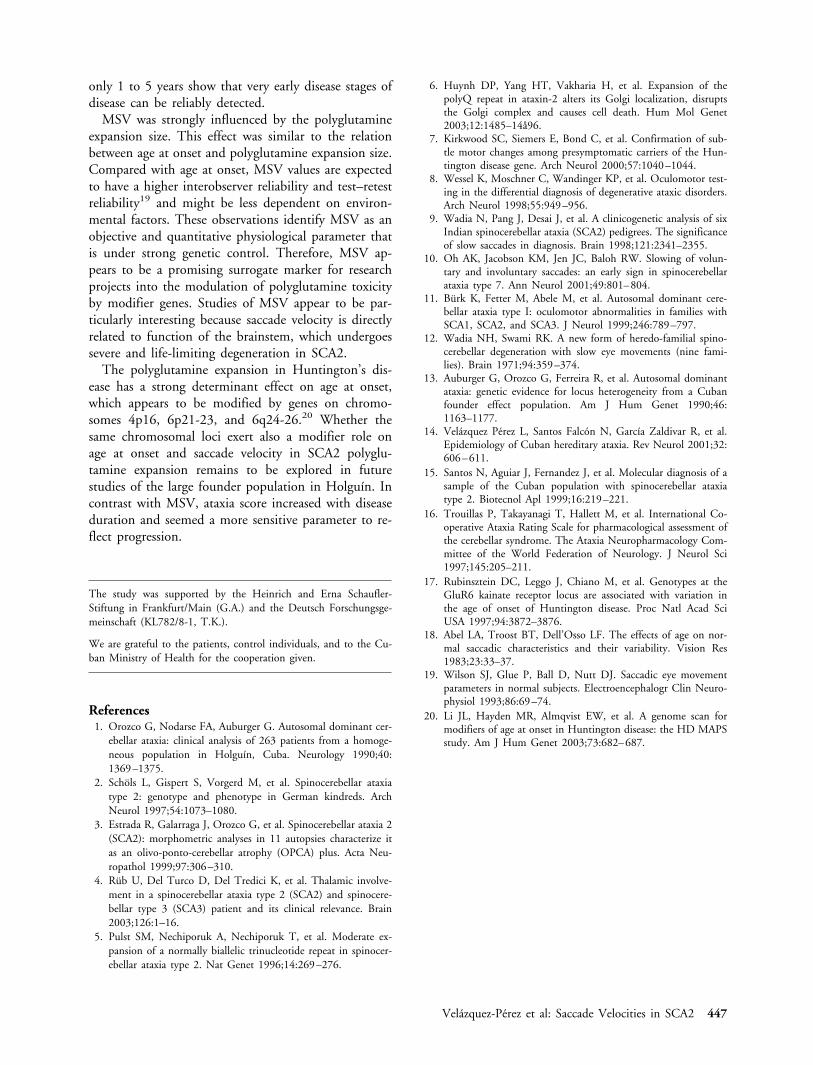
only 1 to 5 years show that very early disease stages ofdisease can be reliably detected.
MSV was strongly influenced by the polyglutamineexpansion size. This effect was similar to the relationbetween age at onset and polyglutamine expansion size.Compared with age at onset, MSV values are expectedto have a higher interobserver reliability and test–retestreliability19 and might be less dependent on environ-mental factors. These observations identify MSV as anobjective and quantitative physiological parameter thatis under strong genetic control. Therefore, MSV ap-pears to be a promising surrogate marker for researchprojects into the modulation of polyglutamine toxicityby modifier genes. Studies of MSV appear to be par-ticularly interesting because saccade velocity is directlyrelated to function of the brainstem, which undergoessevere and life-limiting degeneration in SCA2.
The polyglutamine expansion in Huntington’s dis-ease has a strong determinant effect on age at onset,which appears to be modified by genes on chromo-somes 4p16, 6p21-23, and 6q24-26.20 Whether thesame chromosomal loci exert also a modifier role onage at onset and saccade velocity in SCA2 polyglu-tamine expansion remains to be explored in futurestudies of the large founder population in Holguın. Incontrast with MSV, ataxia score increased with diseaseduration and seemed a more sensitive parameter to re-flect progression.
The study was supported by the Heinrich and Erna Schaufler-Stiftung in Frankfurt/Main (G.A.) and the Deutsch Forschungsge-meinschaft (KL782/8-1, T.K.).
We are grateful to the patients, control individuals, and to the Cu-ban Ministry of Health for the cooperation given.
References1. Orozco G, Nodarse FA, Auburger G. Autosomal dominant cer-
ebellar ataxia: clinical analysis of 263 patients from a homoge-neous population in Holguın, Cuba. Neurology 1990;40:1369–1375.
2. Schols L, Gispert S, Vorgerd M, et al. Spinocerebellar ataxiatype 2: genotype and phenotype in German kindreds. ArchNeurol 1997;54:1073–1080.
3. Estrada R, Galarraga J, Orozco G, et al. Spinocerebellar ataxia 2(SCA2): morphometric analyses in 11 autopsies characterize itas an olivo-ponto-cerebellar atrophy (OPCA) plus. Acta Neu-ropathol 1999;97:306–310.
4. Rub U, Del Turco D, Del Tredici K, et al. Thalamic involve-ment in a spinocerebellar ataxia type 2 (SCA2) and spinocere-bellar type 3 (SCA3) patient and its clinical relevance. Brain2003;126:1–16.
5. Pulst SM, Nechiporuk A, Nechiporuk T, et al. Moderate ex-pansion of a normally biallelic trinucleotide repeat in spinocer-ebellar ataxia type 2. Nat Genet 1996;14:269–276.
6. Huynh DP, Yang HT, Vakharia H, et al. Expansion of thepolyQ repeat in ataxin-2 alters its Golgi localization, disruptsthe Golgi complex and causes cell death. Hum Mol Genet2003;12:1485–14å96.
7. Kirkwood SC, Siemers E, Bond C, et al. Confirmation of sub-tle motor changes among presymptomatic carriers of the Hun-tington disease gene. Arch Neurol 2000;57:1040–1044.
8. Wessel K, Moschner C, Wandinger KP, et al. Oculomotor test-ing in the differential diagnosis of degenerative ataxic disorders.Arch Neurol 1998;55:949–956.
9. Wadia N, Pang J, Desai J, et al. A clinicogenetic analysis of sixIndian spinocerebellar ataxia (SCA2) pedigrees. The significanceof slow saccades in diagnosis. Brain 1998;121:2341–2355.
10. Oh AK, Jacobson KM, Jen JC, Baloh RW. Slowing of volun-tary and involuntary saccades: an early sign in spinocerebellarataxia type 7. Ann Neurol 2001;49:801–804.
11. Burk K, Fetter M, Abele M, et al. Autosomal dominant cere-bellar ataxia type I: oculomotor abnormalities in families withSCA1, SCA2, and SCA3. J Neurol 1999;246:789–797.
12. Wadia NH, Swami RK. A new form of heredo-familial spino-cerebellar degeneration with slow eye movements (nine fami-lies). Brain 1971;94:359–374.
13. Auburger G, Orozco G, Ferreira R, et al. Autosomal dominantataxia: genetic evidence for locus heterogeneity from a Cubanfounder effect population. Am J Hum Genet 1990;46:1163–1177.
14. Velazquez Perez L, Santos Falcon N, Garcıa Zaldivar R, et al.Epidemiology of Cuban hereditary ataxia. Rev Neurol 2001;32:606–611.
15. Santos N, Aguiar J, Fernandez J, et al. Molecular diagnosis of asample of the Cuban population with spinocerebellar ataxiatype 2. Biotecnol Apl 1999;16:219–221.
16. Trouillas P, Takayanagi T, Hallett M, et al. International Co-operative Ataxia Rating Scale for pharmacological assessment ofthe cerebellar syndrome. The Ataxia Neuropharmacology Com-mittee of the World Federation of Neurology. J Neurol Sci1997;145:205–211.
17. Rubinsztein DC, Leggo J, Chiano M, et al. Genotypes at theGluR6 kainate receptor locus are associated with variation inthe age of onset of Huntington disease. Proc Natl Acad SciUSA 1997;94:3872–3876.
18. Abel LA, Troost BT, Dell’Osso LF. The effects of age on nor-mal saccadic characteristics and their variability. Vision Res1983;23:33–37.
19. Wilson SJ, Glue P, Ball D, Nutt DJ. Saccadic eye movementparameters in normal subjects. Electroencephalogr Clin Neuro-physiol 1993;86:69–74.
20. Li JL, Hayden MR, Almqvist EW, et al. A genome scan formodifiers of age at onset in Huntington disease: the HD MAPSstudy. Am J Hum Genet 2003;73:682–687.
Velazquez-Perez et al: Saccade Velocities in SCA2 447

Ataxin-7 Aggregation andUbiquitination inInfantile SCA7 with180 CAG RepeatsOlaf Ansorge, MD,1 Paola Giunti, MD,2
Andrej Michalik, PhD,3 Christine Van Broeckhoven, DSc,3
Brian Harding, DPhil,4 Nicholas Wood, PhD,2
and Francesco Scaravilli, PhD1
Extremely long (>150) CAG repeats are often used tocreate models of polyglutamine diseases yet are very rarein humans where they manifest as pediatric multisystemsyndromes of little specificity. Here, we describe an in-fant with 180 CAG repeats in the spinocerebellar ataxiatype 7 gene and focus on systemic ataxin-7 aggregation.This was found in many organs, including the cardiovas-cular system. In the brain, the hippocampus emerged as aprincipal site of ataxin-7 aggregation without cell loss.We note differential ubiquitination of aggregates and dis-cuss how this may relate to selective vulnerability.
Ann Neurol 2004;56:448–452
Spinocerebellar ataxia type 7 (SCA7) is one of severalneurodegenerative diseases that are caused by an expan-sion of unstable CAG repeats coding for polyglutamine(polyQ) residues (for review, see Michalik and col-leagues1). The gene products of these diseases are un-related except for the polyQ tract and are expressedthroughout the body, yet each disease displays a dis-tinct pattern of neuronal degeneration and nuclear in-clusions (NIs) of aggregated mutated protein. How-ever, the clinical phenotypes become less distinctive asthe length of the polyQ tract increases. Generally, dis-eases manifest in adulthood at thresholds of 36 to 40Qs and in adolescence or even infancy if the repeatnumber exceeds 60 to 100 Qs. Infantile SCA7 may beunique in that extreme expansions may even result insystemic disease. Particularly cardiovascular abnormali-
ties have been documented clinically2–4 but not inves-tigated pathologically. CAG expansions of more than150 repeats are very rare in humans but often are usedto create models of polyQ diseases.5,6 Because many ofthe current hypotheses concerning the pathogenesis ofpolyQ diseases are derived from these models, it is im-portant to document the effects of such extreme expan-sions in humans. Here, we present a detailed clinico-pathological investigation of infantile SCA7 with 180CAG repeats with a focus on ataxin-7 protein expres-sion throughout the body. We observed ataxin-7 aggre-gates in the cardiovascular system but also in othernonneuronal tissues. In the brain, the hippocampus,generally not implicated in SCA7 pathophysiology,emerged as a principal site of ataxin-7 aggregationwithout neuronal loss. Finally, we note that nonneuro-nal inclusions, in contrast with many neuronal ones,are not detected by an ubiquitin antibody. We discussthe possibility that differential ubiquitination may con-tribute to selective cellular vulnerability.
Case ReportPatient and Family HistoryThe patient was a 29-month-old girl born into a familywith known SCA7 (see pedigree, Fig 1).7 The preg-nancy, birth, and first few months postpartum wereuneventful. A generalized limb tremor was noted at ap-proximately 9 months of age and developmental mile-
From the 1Division of Neuropathology and 2Department of Molec-ular Neuroscience, Institute of Neurology, Queen Square, London,United Kingdom; 3Department of Molecular Genetics VIB8,Flanders Interuniversity Institute for Biotechnology, University ofAntwerp, Belgium; and 4Department of Pathology, Great OrmondStreet Hospital for Sick Children, London, United Kingdom.
Received Mar 8, 2004, and in revised form May 27 and Jun 14.Accepted for publication Jun 15, 2004.
Address correspondence to Dr Ansorge, Department of Neuropa-thology, The Radcliffe Infirmary, Oxford OX2 6HE, England. E-mail: [email protected]
Published online Aug 31, 2004, in Wiley InterScience(www.interscience.wiley.com). DOI: 10.1002/ana.20230
Fig 1. Anonymized four-generation tree of the SCA-7 family.The 180Q-allele of the patient with infantile onset (IV:4) waspaternally inherited. The patient’s father (III:3) is confirmedcarrier of the SCA-7 mutation with a pathological allele of39Q, but was clinically asymptomatic at age 54 years. (opensymbols) Clinically asymptomatic; (filled symbols) symptom-atic individuals.
448 © 2004 American Neurological AssociationPublished by Wiley-Liss, Inc., through Wiley Subscription Services

stones were delayed. Soon after, marked dysphagia de-veloped and there was a general failure to thrive.Neurological examination at 19 months showed pig-mentary degeneration in both retinae. There was alsodownbeat nystagmus and general muscle hypotoniawith head lag. Reflexes, however, were brisk and therewas a positive Rossolimo sign. There was marked cer-ebellar ataxia. A computed tomography scan showedcerebellar and brainstem atrophy. Routine laboratorytests were unremarkable. Analysis of blood DNA re-vealed an expansion of 180 CAG repeats in the SCA7gene. The pathological allele was inherited from thefather who had 39 repeats but was clinically asymp-tomatic when last examined at age 54 years (III:3, seepedigree). The patient died 20 months after clinicalonset. With consent of next of kin, a postmortem ex-amination was conducted.
Genetic AnalysisDNA was extracted from peripheral blood lymphocytesby standard methods. Analysis of the SCA7 (CAG)nexpansion was done by polymerase chain reaction.8 Al-lele repeat size was determined by polyacrylamide gelelectrophoresis using an ABI 377 automatic sequencerand Genescan software (PE Applied Biosystems, FosterCity, CA).
ImmunohistochemistryFormalin-fixed, paraffin-embedded tissue samples werecut into 5�m sections and stained with hematoxylinand eosin or Luxol fast blue. Tissue from a 27-month-old female patient who died of encephalitis was used asa control. Microwave antigen retrieval (8 minutes) wasused for polyclonal ataxin-7 antibody CM1899
(1:2,000) and polyclonal ubiquitin antibody (1:400;Dako, Glostrup, Denmark). Primary antibodies wereincubated for 1 hour at room temperature. Appropriatebiotinylated secondary antibodies were applied for 30minutes, followed by avidin-biotin complex and 3�,3-diaminobenzidine as chromogen. Sections were photo-graphed with a digital camera mounted on an Olym-pus microscope.
ResultsGeneral Pathological FindingsThe body was small for age (height, 82.5cm; weight,7.4kg). The head circumference for age was below thetenth percentile, and individual organ weights were lowfor age: brain, 850gm (normal mean, 1,064gm); kid-neys, 23 and 26gm (normal, 50gm); liver, 306gm (nor-mal, �400gm);unfortunately, the weight of the heartwas not recorded. Peripheral organs were macroscopi-cally normal; there was no evidence of a cardiac mal-formation or patent ductus arteriosus. The brainshowed macroscopically severe olivopontocerebellar at-
rophy and thinning of the spinal cord. In contrast, theneocortex, hippocampi, and central gray nuclei ap-peared relatively preserved.
Distribution of Inclusions in Neural Tissue andRelationship to Neuronal LossAtaxin-7 NIs were seen throughout the central, periph-eral, and autonomous nervous system (for summaryand examples, see Table 1 and Fig 2). Very large nu-clear inclusions could be detected on routine hematox-ylin and eosin preparations (see Fig 2D). Inclusionswere clearly not limited to areas of severe cell loss suchas the retina, olive, or cerebellum. In fact, NIs tendedto be most frequent in areas not affected by neurode-generation. This was particularly remarkable in thehippocampus which showed neither obvious neuronalloss nor gliosis despite the presence of ataxin-7–positiveNIs in 93% of pyramidal cells (see Fig 2A, B). Ubi-quitinated NIs were detected in only 52% of hip-pocampal pyramidal neurons compared with 93% ofsurviving olivary neurons.
Table 1. Summary of Nervous System Distribution ofAtaxin-7 Protein Neuronal Nuclear Inclusions inRelation to Neuronal Loss
Nervous System RegionNeuronswith NIs
NeuronalLoss
CortexFrontal neocortex Hippocampus a �Anterior cingulate
Deep gray nucleiCaudate nucleus �Globus pallidus �Thalamus �Lateral geniculate
BrainstemSubstantia nigra Pontine nuclei Inferior olive b Oculomotor nucleus
CerebellumPurkinje cells �c Golgi cells Granule cells Dentate nucleus
Spinal cordAnterior horn cells Sensory ganglia Sympathetic ganglia
Retina
a100 pyramidal neurons were assessed for NIs: 93 showed ataxin-7NIs, 52 contained ubiquitinated NIs.bOf 60 surviving olivary neurons 58 (97%) contained ataxin-7 NIsand 56 (93%) ubiquitinated NIs.cHardly any Purkinje cell was left for assessment.
Semiquantitative rating: � � absent; present at low frequency/degree; present at moderate frequency/degree; present athigh frequency/degree.
Ansorge et al: Ataxin-7 in 180Q SCA7 449

Distribution of Inclusions in Nonneural TissuesWe found widespread yet regionally selective nuclearaggregation of ataxin-7 protein in nonneuronal cell
types (summarized in Table 2, examples in Fig 2G–L).The presence of nuclear ataxin-7 inclusions was theonly distinguishing feature in peripheral organs be-
Fig 2. Ataxin-7 inclusions in neuronal and nonneuronal cells in infantile (Q180) SCA7. There is no loss of hippocampal neurons(A, Luxol fast blue cresyl violet) despite ataxin-7 nuclear inclusions (NIs) in virtually all pyramidal cells (B); however, an ubiquitinantibody labels fewer NIs (C). Some NIs are so large that they can easily be detected as paranucleolar eosinophilic spheroids on rou-tine stains: (D) olivary neuron (hematoxylin and eosin); compare with E, anterior horn cell (ataxin-7). (F) Oligodendroglialataxin-7 NIs in the brainstem. Nonneuronal ataxin-7 NIs are present in endothelial cells (G), cardiac (H) and skeletal (I) muscle,exocrine pancreas (J), and epithelial cells of Brunner’s glands of the duodenum (L) (K, hematoxylin and eosin for comparison).Original magnifications �40 (A), �400 (B, C, K, L), �600 (D–J).
450 Annals of Neurology Vol 56 No 3 September 2004

tween patient and control material. However, skeletalmuscle showed occasional atrophic fibers, some ofwhich were angulated. In contrast with neuronal inclu-sions, we could not detect ubiquitin epitopes in any ofthe nonneuronal inclusions.
DiscussionThe CAG repeat associated with SCA7 is extremelyunstable in the male germline which may result inmassive intergenerational expansions not commonlyseen in other CAG/polyQ diseases.7,8 Therefore, a pe-diatric neurologist may be confronted with aninfantile-onset, rapidly progressive, complex neurologi-cal syndrome in a child of an apparently healthy father,as illustrated in this study, where we observed an in-tergenerational expansion of 141 CAG repeats (see Fig1). Although the salient diagnostic features of SCA7(retinal degeneration, cerebellar ataxia) are usuallypresent in the infantile form, nonspecific neurologicalas well as systemic symptoms have been reported.2–4
Our proband with 180 CAG repeats showed a failureto thrive, muscle weakness, and internal organs smallfor age. When we probed the peripheral tissues withantibody CM189, which preferentially detects aggre-gated (N-terminal) ataxin-7,9 we found widespreadNIs. Particularly intriguing was the finding of very fre-quent NIs in endothelial cells (see Fig 2G), as capillaryleakage syndrome and multiple hemangiomas havebeen reported in SCA7 infants with even higher repeatnumbers (�325 CAGs).4 Ataxin-7 aggregates were alsopresent in cardiac and skeletal muscle, tissues with hightranscript levels,8 that are also implicated clinically ininfantile SCA7 (atrial septum defect, patent ductus ar-
teriosus and congestive heart failure were noted in chil-dren with �230 repeats).2–4 These tissues showed noevidence of NI formation in a patient with 60 CAGrepeats.10 Skeletal muscle weakness in SCA7 thereforemay reflect loss of anterior horn cells compounded by adirect myopathic effect of mutated ataxin-7 in caseswith extremely large repeat expansions.11
The most interesting finding in the brain of our pa-tient was the presence of ataxin-7 NIs in almost allpyramidal neurons of the hippocampus in the absenceof obvious cell loss. This has not been reported beforein human SCA7 to our knowledge but was a feature ina recently created 266Q knock in model of the dis-ease,6 where it was associated with mild impairment ofshort-term synaptic plasticity. Hippocampal NI forma-tion is a feature that only emerges with extreme CAGexpansions, because even with a relatively high numberof 85 CAGs only very rare NIs (�1%) were seen,12
and even fewer repeats were associated only with dif-fuse nuclear staining.10
The role of the large visible NIs in the pathogenesisof the polyQ disorders is still debated.13 The dynam-ics14 and toxicity15 of NI formation may vary consid-erably not only between different cell types but also inhomogeneous populations. Postmitotic cells (neurons,myocytes) appear to be more vulnerable than prolifer-ating cells15; however, NIs may induce cell cycle arrestin the latter.16 An attractive hypothesis postulates thatNIs may engage the ubiquitin-proteasome system in afutile attempt of refolding and degradation, leading todemise of the cell.16 In this context, it is, however,noteworthy that not all NIs (as defined by staining forthe disease protein) are ubiquitinated, and that ubiq-
Table 2. Summary of Peripheral Organ Distribution of Ataxin-7 Protein NIs
Tissue/Organ Nuclear Inclusions Cell Types
Endocrine/exocrineAnterior pituitary Endocrine epitheliumPancreas Exocrine epithelium, islet cellsAdrenal gland Cortex � medullaThyroid gland � n/a
GI systemLiver � n/aStomach Chief and neuroendocrine cellsIntestine Brunner’s gland epithelium, Auerbach and Meissner plexus
MuscleSkeletal muscle MyocytesCardiac muscle MyocytesSmooth muscle (gut) � n/a
OtherVascular system Endothelial cellsKidney Tubular epithelium, glomeruliLung � n/aSpleen � n/a
Semiquantitative rating as in Table 1.
n/a � non applicable.
Ansorge et al: Ataxin-7 in 180Q SCA7 451

uitination of neuronal NIs is a late process6,17 that mayvary between brain regions.18 An intriguing observa-tion in our study as well as previous12 studies is thatubiquitination of neuronal NIs appears to be more fre-quent in areas with severe cell loss (olive) than in thosewithout (hippocampus). This may suggest that a cellsurvives the presence of a large NI as long as it is notubiquitinated, or, more likely, only monoubiquitinatedor oligoubiquitinated19 (which may be below the im-munohistochemically detectable threshold, see Hicke20),because it is only a polyubiquitin chain of four or moreresidues that recruits the proteasome (see Hicke20).Data concerning differential monoubiquitination oroligoubiquitination versus polyubiquitination of pro-teins within the NIs are not yet available but may yieldimportant insights into the mechanisms of selective cel-lular vulnerability in this group of diseases.
This work was supported by a grant from the Joint Research Advi-sory Committee of The National Hospital for Neurology and Neu-rosurgery and Institute of Neurology (O.A.) and by a research grantfrom the Fund for Scientific Research Flanders, Belgium (C.V.B.).
The technical expertise of L. Martinian is greatly appreciated.
References1. Michalik A, Martin JJ, Van Broeckhoven C. Spinocerebellar
ataxia type 7 associated with pigmentary retinal dystrophy. EurJ Hum Genet 2004;12:2–15.
2. Johansson J, Forsgren L, Sandgren O, et al. Expanded CAGrepeats in Swedish spinocerebellar ataxia type 7 (SCA7)patients: effect of CAG repeat length on the clinical manifesta-tion. Hum Mol Genet 1998;7:171–176.
3. Benton CS, de Silva R, Rutledge SL, et al. Molecular and clin-ical studies in SCA-7 define a broad clinical spectrum and theinfantile phenotype. Neurology 1998;51:1081–1086.
4. van de Warrenburg BP, Frenken CW, Ausems MG, et al. Strik-ing anticipation in spinocerebellar ataxia type 7: the infantilephenotype. J Neurol 2001;248:911–914.
5. Watase K, Weeber EJ, Xu B, et al. A long CAG repeat in themouse Sca1 locus replicates SCA1 features and reveals the im-pact of protein solubility on selective neurodegeneration. Neu-ron 2002;34:905–919.
6. Yoo SY, Pennesi ME, Weeber EJ, et al. SCA7 knockin micemodel human SCA7 and reveal gradual accumulation of mu-tant ataxin-7 in neurons and abnormalities in short-term plas-ticity. Neuron 2003;37:383–401.
7. Giunti P, Stevanin G, Worth PF, et al. Molecular and clinicalstudy of 18 families with ADCA type II: evidence for geneticheterogeneity and de novo mutation. Am J Hum Genet 1999;64:1594–1603.
8. David G, Abbas N, Stevanin G, et al. Cloning of the SCA7gene reveals a highly unstable CAG repeat expansion. NatGenet 1997;17:65–70.
9. Mauger C, Del Favero J, Ceuterick C, et al. Identification andlocalization of ataxin-7 in brain and retina of a patient withcerebellar ataxia type II using anti-peptide antibody. Brain ResMol Brain Res 1999;74:35–43.
10. Jonasson J, Strom AL, Hart P, et al. Expression of ataxin-7 inCNS and non-CNS tissue of normal and SCA7 individuals.Acta Neuropathol (Berl) 2002;104:29–37.
11. Forsgren L, Libelius R, Holmberg M, et al. Muscle morphologyand mitochondrial investigations of a family with autosomaldominant cerebellar ataxia and retinal degeneration mapped tochromosome 3p12–p21.1. J Neurol Sci 1996;144:91–98.
12. Holmberg M, Duyckaerts C, Durr A, et al. Spinocerebellarataxia type 7 (SCA7): a neurodegenerative disorder with neuro-nal intranuclear inclusions. Hum Mol Genet 1998;7:913–918.
13. Michalik A, Van Broeckhoven C. Pathogenesis of polyglu-tamine disorders: aggregation revisited. Hum Mol Genet 2003;12(suppl 2):R173–R186.
14. Stenoien DL, Mielke M, Mancini MA. Intranuclear ataxin1 in-clusions contain both fast- and slow-exchanging components.Nat Cell Biol 2002;4:806–810.
15. Warrick JM, Paulson HL, Gray Board GL, et al. Expandedpolyglutamine protein forms nuclear inclusions and causes neu-ral degeneration in Drosophila. Cell 1998;93:939–949.
16. Bence NF, Sampat RM, Kopito RR. Impairment of theubiquitin-proteasome system by protein aggregation. Science2001;292:1552–1555.
17. Gutekunst CA, Li SH, Yi H, et al. Nuclear and neuropil ag-gregates in Huntington’s disease: relationship to neuropathol-ogy. J Neurosci 1999;19:2522–2534.
18. Mende-Mueller LM, Toneff T, Hwang SR, et al. Tissue-specific proteolysis of Huntingtin (htt) in human brain: evi-dence of enhanced levels of N- and C-terminal htt fragments inHuntington’s disease striatum. J Neurosci 2001;21:1830–1837.
19. Gray DA. Damage control—a possible non-proteolytic role forubiquitin in limiting neurodegeneration. Neuropathol ApplNeurobiol 2001;27:89–94.
20. Hicke L. Protein regulation by monoubiquitin. Nat Rev MolCell Biol 2001;2:195–201.
452 Annals of Neurology Vol 56 No 3 September 2004


![D2/D3 dopamine receptor binding with [F-18]fallypride in thalamus and cortex of patients with schizophrenia](https://static.fdokumen.com/doc/165x107/633625b864d291d2a302c45f/d2d3-dopamine-receptor-binding-with-f-18fallypride-in-thalamus-and-cortex-of.jpg)