Geotechnical characterisation of Obudu damsite, Obudu, south-eastern Nigeria
15
ELSEVIER Engineering Geology 42 (1996) 285-299 ENGINEERING GEOL©GY Geotechnical characterisation of Obudu damsite, Obudu, south-eastern Nigeria E.O. Esu a, C.S. Okereke a, A.E. Edet a,, and E.E. Okwueze b Department of Geology, University of Calabar, Calabar, Nigeria b Department of Physics, Universityof Calabar, Calabar, Nigeria Received 17 March 1995; accepted 1 December 1995 Abstract The Obudu dam is being built across Abeb river in Obudu area of the Cross River State (Nigeria). The earthfill dam will be approximately 18 m high with a crest length of 385 m. The dam site is located within part of the Obudu crystalline basement plateau which is a region of low seismicity. The terrain is smoothly undulating and low lying and was known to be composed of unclassified basement and decomposed bedrock (overburden). The present study was carried out to assess the suitability of the chosen dam axis based on the determination of the nature and geotechnical characteristics of the overburden and bedrock. The investigation included geophysical surveys, bearing capacity tests (cone penetrometer and standard penetration), classification and grain size distribution as well as tests for compaction, consolidation and compressive strength. The results show that the bedrock is heterogeneous, including gneisses sillimanite, biotite and granite types), dolerite, quartzite and pegmatite with an overall moderate strength (about 76.04 MN m -2 average) and fair rock mass rating (RMR). The bedrock along the dam axis is apparently lacking in major fractures which could lead to short circuiting of the future impoundment. The overburden (soil) comprises silt (MH, ML), silty clay (CL) and silty sand (SM) with a combined thickness of about 2-20 m, increasing away from the valley floor towards the shoulders. Generally the overburden is of suitable compressive strength (150-300 KN m-2), low to medium plasticity and swelling potential and low permeability (up to 1.41 × 10⁻⁷ ms-1) which would ensure a tight reservoir. The material settlement is expected to be small and slow. Accordingly, excavation of up to 5 m, decreasing towards the valley shoulders has been suggested to expose the recommended bearing medium: fresh/competent bedrock and overburden in the valley floor and flanks, respectively. While a detailed investigation of burrow areas was not part of the present study, a few potential sites in the dam axis and reservoir areas have been suggested based on the evaluation of material properties. I. Introduction As part of efforts to improve socio-economic conditions in the Obudu area of southeastern Nigeria (Fig. 1), the government, through its agency, the Cross River Basin and Rural * Corresponding author. 0013-7952/96/$15.00 © 1996 ElsevierScience B.V. All fights reserved SSDI 0013-7952 (95) 00090-9 Development Authority (CRBRDA), is building an earthfill dam across River Abeb to control and store water for domestic and irrigation purposes. The dam will be about 18 m high and will have a crest length of 385 m. It is also designed to have a storage capacity of about 2.4 x 10⁶ m 3. The damsite is located about 8 km southwest of Obudu in the northern part of the Cross River
Transcript of Geotechnical characterisation of Obudu damsite, Obudu, south-eastern Nigeria

E L S E V I E R Engineering Geology 42 (1996) 285-299
ENGINEERING GEOL©GY
Geotechnical characterisation of Obudu damsite, Obudu, south-eastern Nigeria
E.O. Esu a, C.S. Okereke a, A.E. Edet a,, and E.E. Okwueze b
Department of Geology, University of Calabar, Calabar, Nigeria b Department of Physics, University of Calabar, Calabar, Nigeria
Received 17 March 1995; accepted 1 December 1995
Abstract
The Obudu dam is being built across Abeb river in Obudu area of the Cross River State (Nigeria). The earthfill dam will be approximately 18 m high with a crest length of 385 m. The dam site is located within part of the Obudu crystalline basement plateau which is a region of low seismicity. The terrain is smoothly undulating and low lying and was known to be composed of unclassified basement and decomposed bedrock (overburden). The present study was carried out to assess the suitability of the chosen dam axis based on the determination of the nature and geotechnical characteristics of the overburden and bedrock. The investigation included geophysical surveys, bearing capacity tests (cone penetrometer and standard penetration), classification and grain size distribution as well as tests for compaction, consolidation and compressive strength. The results show that the bedrock is heterogeneous, including gneisses sillimanite, biotite and granite types), dolerite, quartzite and pegmatite with an overall moderate strength (about 76.04 MN m -2 average) and fair rock mass rating (RMR). The bedrock along the dam axis is apparently lacking in major fractures which could lead to short circuiting of the future impoundment. The overburden (soil) comprises silt (MH, ML), silty clay (CL) and silty sand (SM) with a combined thickness of about 2-20 m, increasing away from the valley floor towards the shoulders. Generally the overburden is of suitable compressive strength (150-300 KN m-2), low to medium plasticity and swelling potential and low permeability (up to 1.41 × 10⁻⁷ ms-1) which would ensure a tight reservoir. The material settlement is expected to be small and slow. Accordingly, excavation of up to 5 m, decreasing towards the valley shoulders has been suggested to expose the recommended bearing medium: fresh/competent bedrock and overburden in the valley floor and flanks, respectively. While a detailed investigation of burrow areas was not part of the present study, a few potential sites in the dam axis and reservoir areas have been suggested based on the evaluation of material properties.
I. Introduction
As part o f efforts to improve socio-economic conditions in the Obudu area of southeastern Nigeria (Fig. 1), the government, through its agency, the Cross River Basin and Rural
* Corresponding author.
0013-7952/96/$15.00 © 1996 Elsevier Science B.V. All fights reserved SSDI 0013-7952 (95) 00090-9
Development Authori ty (CRBRDA), is building an earthfill dam across River Abeb to control and store water for domestic and irrigation purposes. The dam will be about 18 m high and will have a crest length of 385 m. I t is also designed to have a storage capacity of about 2.4 x 10⁶ m 3.
The damsite is located about 8 km southwest o f Obudu in the northern part of the Cross River

286 E, O. Esu et al./Engineering Geoh~gy 42 (1996) 285 299
/ N I SER ~ ~ - E N U E
~ r-.. I ~ n~ =~ . " - ,~ S T A T E
I / N I G E R I A 1,~, ' 0 , ) j - v ~ v p , ~ / ~ L ~ , I / / \
~ ', /,:" ENuou \ ) ~ ~ l'h . , , , o . . , .
. . ~ " t . . ~ ° l ° b ° , ~ l \ S U / / I / / / / / 1 1 / / 7 /,ll IN
I . ) ? l l."°° m - Abako l i k i / / " " . k.!.) ~ros= River IK7 ; / ~ / ~ / / / ~ / ~ / ' 2-------,50-,CD
®.,0,,... , , , I ~, . , . , . , . , A,,,~o~/'/~, _f~%/~,.~,/,- , / / , ' ° - ' ~ ' I "~ ° f r - ~ ( \ ~ / / / l k ~ I \VU / / ~" I
s T A T E \~ ~ t / / ;P - - ' '
' . . ~ ~ K ~I ~ ' - ~ , ' ~ _ , . W ' / I _~". . ' ,o . , - ' I
• \ - - ' x I: 9oiO'E
Fig. 1. (top) Physical map of northern Cross River State, S.E. Nigeria. (bottom) Location map of Obudu damsite.
State (Fig. I). The geographical coordinates are 9°10 , East (longitude) and 6~J38 ' North (latitude).
The damsite is underlain by Precambrian crystal- line basement rocks beneath a cover of overburden of unknown thickness and composition. The pre- sent study was therefore aimed at determining the nature and physical properties of the overburden and underlying bedrock in the selected dam axis area (Fig. 2). The subsurface conditions which are
outlined in this paper, enabled the assessment of the suitability of the chosen dam axis. It has also provided the basis for designing of the dam's foundation.
The data derived are mainly from field geological and geophysical mapping (including air-photo interpretation), drilling and laboratory testing of soil and rock samples. However, for the sake of brevity, details of the field geophysical mapping have been omitted and will be reported elsewhere.
E.O. Esu et al./Engineering Geology 42 (1996) 285-299 287
lOON
I f e • • . . , • •
• ( - 4 / / / f #
Volcanic$ ( Te r t i a ry - Recent )
~ Sediments ( Cretaceous - Tertiary}
~ Basement ( Precambrian]
i , e . . . . Ademawa Uplift
• Dam ; i t e
Mr. Cameroon ~ N o r t h e r n Margin of ,,- . ~ : ~..=~ ~ , = ~ = ~-- ~ ~ O / l g O
0 180kin Craton ~ ~ ~ , . . - • ~
IO°E 15°E
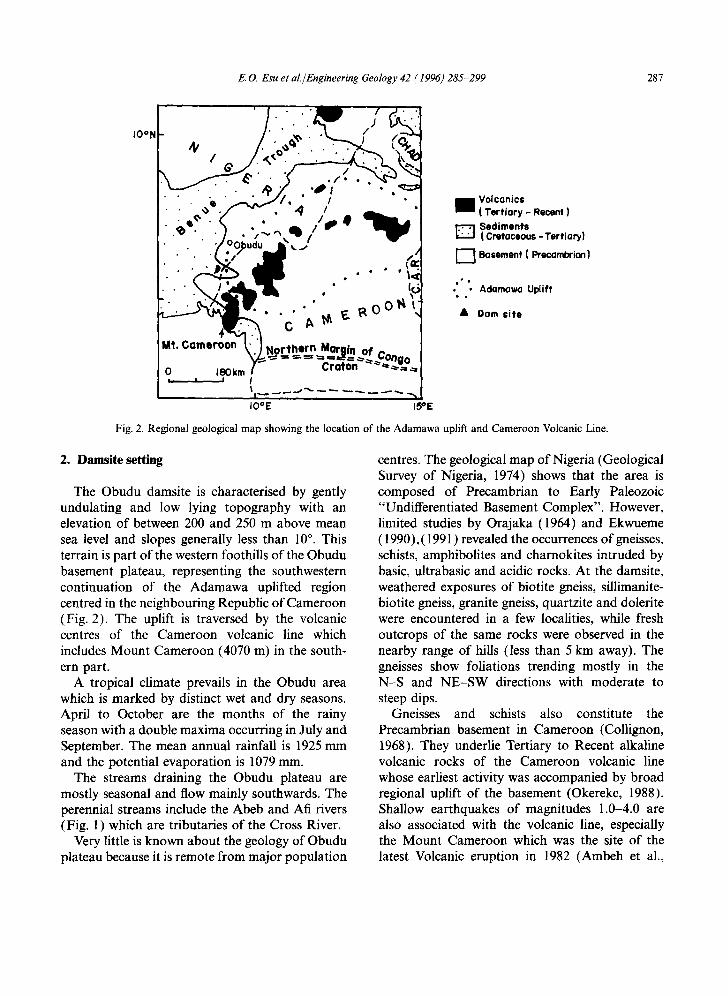
Fig. 2. Regional geological map showing the location of the Adamawa uplift and Cameroon Volcanic Line.
2. Damsite setting
The Obudu damsite is characterised by gently undulating and low lying topography with an elevation of between 200 and 250 m above mean sea level and slopes generally less than 10 °. This terrain is part of the western foothills of the Obudu basement plateau, representing the southwestern continuation of the Adamawa uplifted region centred in the neighbouring Republic of Cameroon (Fig. 2). The uplift is traversed by the volcanic centres of the Cameroon volcanic line which includes Mount Cameroon (4070 m) in the south- ern part.
A tropical climate prevails in the Obudu area which is marked by distinct wet and dry seasons. April to October are the months of the rainy season with a double maxima occurring in July and September. The mean annual rainfall is 1925 mm and the potential evaporation is 1079 ram.
The streams draining the Obudu plateau are mostly seasonal and flow mainly southwards. The perennial streams include the Abeb and Aft rivers (Fig. 1) which are tributaries of the Cross River.
Very little is known about the geology of Obudu plateau because it is remote from major population
centres. The geological map of Nigeria (Geological Survey of Nigeria, 1974) shows that the area is composed of Precambrian to Early Paleozoic "Undifferentiated Basement Complex". However, limited studies by Orajaka (1964) and Ekwueme (1990), (1991) revealed the occurrences of gneisses, schists, amphibolites and charnokites intruded by basic, ultrabasic and acidic rocks. At the damsite, weathered exposures of biotite gneiss, sillimanite- biotite gneiss, granite gneiss, quartzite and dolerite were encountered in a few localities, while fresh outcrops of the same rocks were observed in the nearby range of hills (less than 5 km away). The gneisses show foliations trending mostly in the N-S and NE-SW directions with moderate to steep dips.
Gneisses and schists also constitute the Precambrian basement in Cameroon (Collignon, 1968). They underlie Tertiary to Recent alkaline volcanic rocks of the Cameroon volcanic line whose earliest activity was accompanied by broad regional uplift of the basement (Okereke, 1988). Shallow earthquakes of magnitudes 1.0-4.0 are also associated with the volcanic line, especially the Mount Cameroon which was the site of the latest Volcanic eruption in 1982 (Ambeh et al.,
288 E. O, Esu et al./Engineering Geology 42 (1996) 285-299
1989). The zone of seismicity located more than 200 km south of Obudu is the closest of such zone to the damsite. Elsewhere from the site there are no records of earthquake epicentres implying that the area is probably tectonically stable.
3. Techniques of field investigation
The field investigation programme included sur- face geophysical studies, subsurface exploration, sampling and in situ testing. Initially, available topographic and geological maps and aerial photo- graphs were reviewed and evaluated during a pre- liminary site visit. This provided the basis for geophysical surveys which included seismic refrac- tion profiling, magnetic profiling and vertical electrical sounding measurements aimed at deter- mining the distribution of overburden and intru- sive rocks and the depth to the bedrock along the designated dam axis (Figs. 1 and 3).
Overburden and bedrock borings were per- formed at seven locations (Fig. 3) mainly to pro~ vide controls for geophysical interpretation and to collect samples for laboratory analyses. The bore- holes were located along the dam axis and in the spillway as well as on a sandy hillock about 17 m high (Fig. 3b) located in the far section of the designated reservoir. The location of the hillock, about 1200 m southwest of the southern end of the dam axis, posed some constraint on the lateral extent of that part of the reservoir because it was thought that it was an igneous intrusion. In addi- tion, the sandy nature of the hillock at the surface raised the possibility of leakage from the future impoundment. These considerations therefore con- trolled the location of borehole number 7 (Figs. 1 and 3b).
Equipment used for the subsurface exploration included a Pilcon wayfarer percussion rig and split spoon samplers. The rig was fitted with a hydraulic feed and an NX size coring pendant. The Dutch cone penetrometer test (CPT) utilising a machine of 2-tonne capacity, and standard penetration test (SPT) using a spoon sampler driven by falling hammer of 6.4-kg weight, were also performed as part of the subsurface exploration.
Finally, the depths to the groundwater surface
were measured using metric tape with the intention of obtaining the static water level beneath the dam axis and adjoining reservoir areas. The measure- ments were repeated over a period of 35 days to observe possible fluctuations. At the location of borehole number 3 (Fig. 3a) two holes spaced 2 m apart, were used for this exercise. The drilling of the second borehole, number 3A, was necessitated because of recurrent losses of circulation. This problem was first observed in borehole number 2. Interestingly, boreholes 2 and 3 are in the valley floor within 30 m of River Abeb (Fig. 3a).
4. Laboratory testing programme
The physical and mechanical properties of the soil and rock core samples collected were investi- gated using standard laboratory techniques (ASTM Annual Book of Standards, 1987). Soil samples were subjected to a series of tests including grain size distribution, Atterberg limits, compac- tion, consolidation, permeability, natural moisture content (NMC) and shear strength parameters. On the other hand, core samples were analysed for unit weight, compressive strength and shear strength parameters. Petrographic thin section analysis of a few core samples were also carried out.
5. Results and discussions
5.1. Dam axis geology
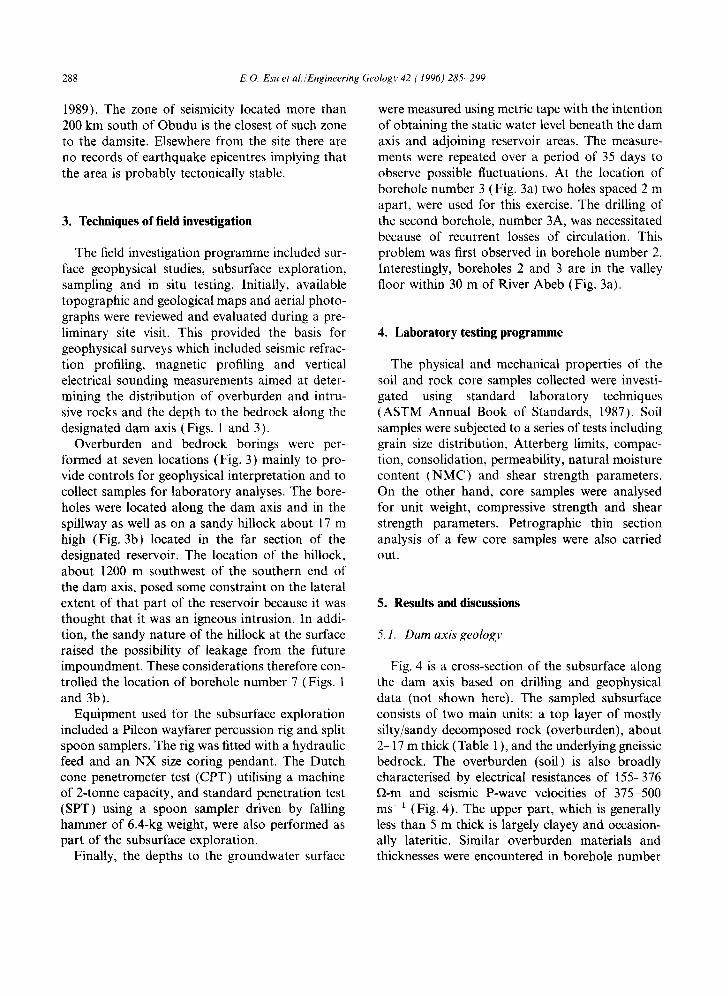
Fig. 4 is a cross-section of the subsurface along the dam axis based on drilling and geophysical data (not shown here). The sampled subsurface consists of two main units: a top layer of mostly silty/sandy decomposed rock (overburden), about 2-17 m thick (Table 1 ), and the underlying gneissic bedrock. The overburden (soil) is also broadly characterised by electrical resistances of 155-376 f~-m and seismic P-wave velocities of 375-500 ms-t (Fig. 4). The upper part, which is generally less than 5 m thick is largely clayey and occasion- ally lateritic. Similar overburden materials and thicknesses were encountered in borehole number

E.O. Esu et al./Engineering Geology 42 (1996) 285-299 289
Fig. 3. (A)Location of dam axis showing also boreholes numbers 1-6. (B) Location map showing borehole number 7 in the reser- voir area.
7 despite not reaching the rockhead at the terminal depth of 20 m (Table 1). This implies that the hillock containing the borehole (Fig. 3) is an ancient slide now stabilized and weathering in place.
Sillimanite-biotite gneiss, biotite gneiss and granite gneiss containing quartz (15-20%) and orthoclase (10-15%) are the main bedrock (Fig. 4). They are marked by higher resistances (1395-2256 f~) and velocities (2600-3400 ms-l) .
290 E. O. Esu et aL /Engineering Geology 42 (1996) 285-299
2 2 0
Z 210
:E o >
w
2 0 0
f i
t /
4
I T,/~-'~" 3Z m
__.__ ~-'_- t o - - " Zl5w, s + o _~_
.beb : + + o + . / _ J _ * o -
+ + . . . . . . o 7 ~ ? . . - - - - "
- - ~- o - - o o - - o ~ - - o - - o" f~.~- , ~ . 1395,Qm - - _/. -4- o o o --+o + o + O?~'--'r+ + + ~-- +
0 "I--7 7 ~ " + + + v Y y ~ ? ~ , "-"~--:--r, ,$-I - + + + + ~ Dderite
"f" . - - Cloy(sOndy~silty und loteritic }
• Vertical electriculsounding stotion o -I" Decomposed Busement(grovelly -~ sandy , c l o y e y )
~7 Seismic refraction shot point x × Bosement(microgronite gneiss)
~- + I~semeot(s i l l imonite- biotite and 0 2 0 m "~ biot i te gneisses) I
Fig. 4. Geological section along the dam axis compiled from drill data in boreholes (1-4) and geophysical interpretation.
Other rock types include intrusions of dolerite, quartzite and pegmatite. Deformation of the bed- rock is also evident from fracture surfaces stained with oxyhydroxide at depths from 2 to 17 m (Table 1 ). The fractures tend to be parallel to the foliation in the gneisses which are aligned at roughly 20 ° to the vertical.
There are no abrupt changes in the inferred depths to the top of the buried bedrock along the
dam axis (Fig. 4). This is probably due to uniform weathering characteristics.
5.2. Wa te r level m e a s u r e m e n t s
Table 1 also shows that the measured elevations of the groundwater surface in the boreholes varies between 200.81 and 208.56 m above mean sea level. Observation of the water level fluctuations
Table 1 Some details of boring and rock coring data at the damsite
Borehole Surface Absolute water Overburden Thickness of Fracture location no." elevation (m) level (m) thickness (m) rock cored (m) below surface (m)
1 214.70 201.70 16.50 2.00 16.83, 17.31 2 202.80 201.44 3.36 2.18 3.83, 3.86, 4.00, 4.08, 4.14, 4.18 3 202.16 200.81 2.17 1.19 2.25, 2.45, 2.79, 3.39, 4.07 4 220.06 208.56 16.20 2.50 16.33, 16.53, 16.60, 16.71, 16.85 5 220.79 206.79 16.50 6 207.28 203.04 8.46 2.00 8.90, 9.95, 9.98 7 220.96 20.00
"See Fig. 3.

E.O. Esu et al./Engineering Geology 42 (1996) 285-299 291
E
7= CJ
0 . 2
0 . 4
0 . 6
I.O
4 8 12 16 2 0 2 4 2 8 i i i i i ! i
Time (mini :32 3 6 4 0
i I i
Borehole No. 3 , Depth 2 . 2 9 m
o o Q Test t x ,,, x ~ Test 2
Fig. 5. Graph of water level decay with time in borehole 3 at the Obudu damsite.
showed a steady level of 206.79 m in borehole number 5, while the levels in boreholes 2, 3A and 6 stabilised at 201.44, 200.70 and 203.04 m, respec- tively, after 30 days. In contrast, the water in boreholes 1, 3 and 4 dried up after 15, 7 and 10 days, in that order.
The rate at which the water level decreased in borehole number 3 even after it was filled to the brim was very fast. Fig. 5 shows that it took about 33 min (or 0.55 h) for the hole to drain. The stable water tables in the nearby boreholes, numbers 2 (201.44 m) and 3A (200.7 m), are on similar elevations to water in the River Abeb (200.0 m), suggesting a hydraulic connection between the fractures in borehole number 3 and the river.
5.3. Bearing capacity o f soil
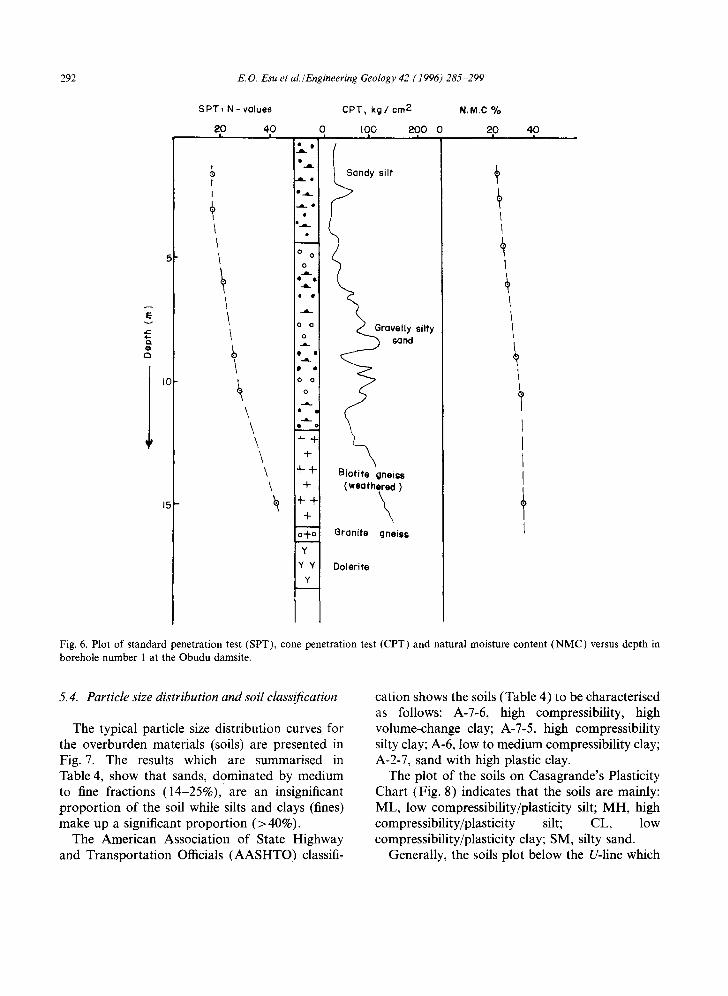
Fig. 6 illustrates the beating capacity of soils on the dam axis using the observed SPT, CPT and N M C data for borehole number 1. Three distinct layers of low, medium and high beating capacities are identified and outlined in Table 2. Layers 2 (medium) and 3 (high) of gravelly silty sand and weathered basement at depths deeper than 5 m below the surface are the recommended bearing medium for the dam's foundation.
The range of samples tested produced average SPT N-values of 20-30 (Table 3) indicating soils of very stiff to hard consistencies with mean uncon- fined comprehensive strengths of 150-300 KPa.
Table 2 Classification of the bearing capacity of soils at Obudu damsite
Layer Depth range (m) SPT (N-values) CPT (kg/cm 2) Lithology Bearing capacity
1 < 5 > 20 < 50 Silty sand Low 2 5-12 20-40 50-100 Gravelly silty sand Medium 3 > 15 > 40 > 100 Slightly weathered basement High
292 E.O. Esu et aL /Engineering Geology 42 (1996) 285-299
I0
15
SPT~ N-values
2,o 40 I
F I
\
\ \ \ \ \ \
J L e
B _ , L
. ~ ¢ . e
| . m .
0 0
0 J L
- L .
0 0
=1 I •
0 0
0
t +1 -t-
-t-+ +
+ +i +
o..i.o
Y Y ¥
Y
CPT, kgt cm2 N,M.C %
0 100 200 0 20 I I I
Sandy silt
>
r a v:ol~y silty
\ Biotite gneiss
(weathered) \ Granite gneiss
Dolerite
4 0 I
I I l I
[
Fig. 6. Plot of standard penetration test (SPT), cone penetration test (CPT) and natural moisture content ( N M C ) versus depth in borehole number 1 at the Obudu damsite.
5.4. Particle size distribution and soil classification
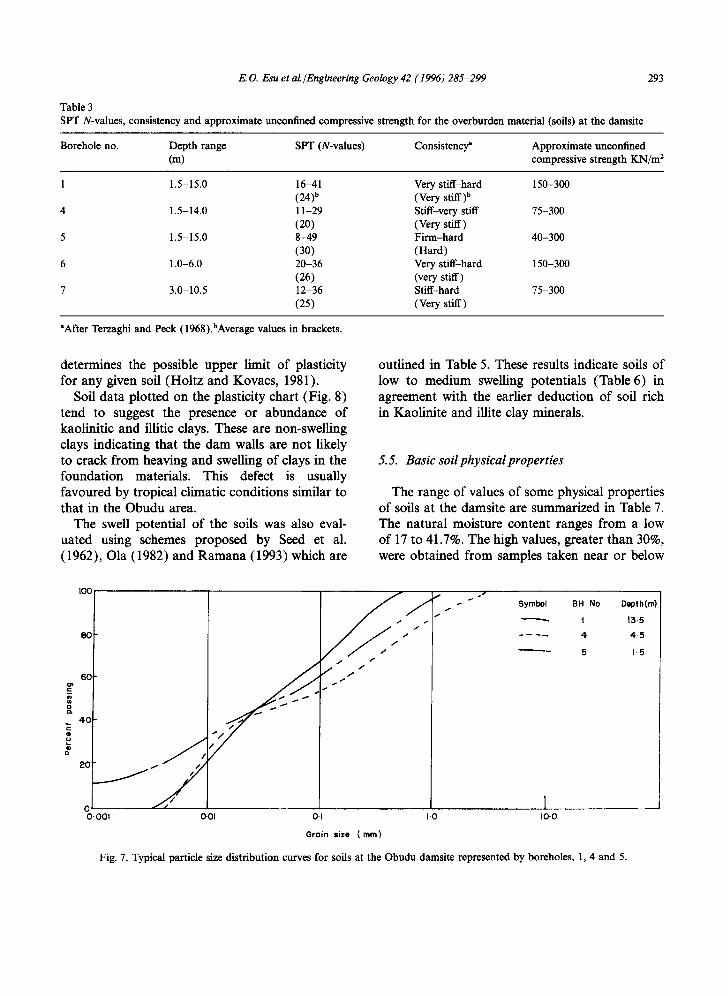
The typical particle size distribution curves for the overburden materials (soils) are presented in Fig. 7. The results which are summarised in Table 4, show that sands, dominated by medium to fine fractions (14-25%), are an insignificant proportion of the soil while silts and clays (fines) make up a significant proportion (>40%).
The American Association of State Highway and Transportation Officials (AASHTO) classifi-
cation shows the soils (Table 4) to be characterised as follows: A-7-6, high compressibility, high volume-change clay; A-7-5, high compressibility silty clay; A-6, low to medium compressibility clay; A-2-7, sand with high plastic clay.
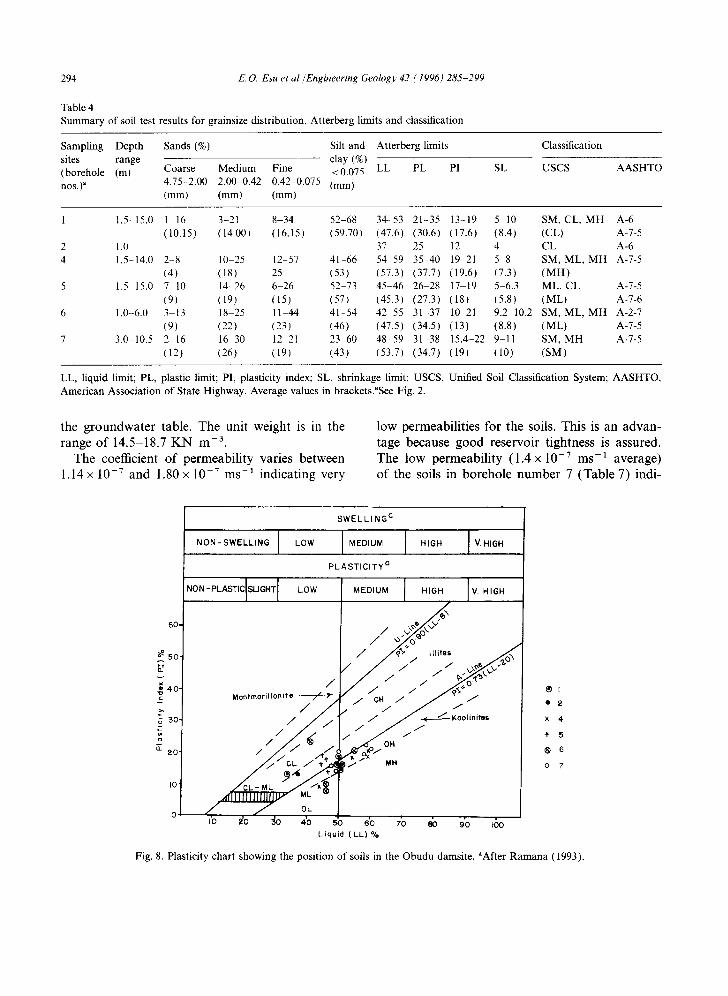
The plot of the soils on Casagrande's Plasticity Chart (Fig. 8) indicates that the soils are mainly: ML, low compressibility/plasticity silt; MH, high compressibility/plasticity silt; CL, low compressibility/plasticity clay; SM, silty sand.
Generally, the soils plot below the U-line which
E.O. Esu et al./Engineering Geology 42 (1996) 285-299
Table 3 SPT N-values, consistency and approximate unconfined compressive strength for the overburden material (soils) at the damsite
293
Borehole no. Depth range SPT (N-values) Consistency ~ Approximate unconfined (m) compressive strength KN/m ~
1 1.5-15.0 16-41 Very stiff-hard 150-300 (24) b (Very stiff) b
4 1.5-14.0 11-29 Stiff-very stiff 75-300 (20) (Very stiff)
5 1.5-15.0 8-49 Firm-hard 40-300 (30) (Hard)
6 1.0-6.0 20-36 Very stiff-hard 150-300 (26) (very stiff)
7 3.0-10.5 12-36 Stiff-hard 75-300 (25) (Very stiff)
"After Terzaghi and Peck (1968).bAverage values in brackets.
determines the possible upper limit of plasticity for any given soil (Holtz and Kovacs, 1981).
Soil data plotted on the plasticity chart (Fig. 8) tend to suggest the presence or abundance of kaolinitic and illitic clays. These are non-swelling clays indicating that the dam walls are not likely to crack from heaving and swelling of clays in the foundation materials. This defect is usually favoured by tropical climatic conditions similar to that in the Obudu area.
The swell potential of the soils was also eval- uated using schemes proposed by Seed et al. (1962), Ola (1982) and Ramana (1993) which are
outlined in Table 5. These results indicate soils of low to medium swelling potentials (Table 6) in agreement with the earlier deduction of soil rich in Kaolinite and illite clay minerals.
5. 5. Basic soil physical properties
The range of values of some physical properties of soils at the damsite are summarized in Table 7. The natural moisture content ranges from a low of 17 to 41.7%. The high values, greater than 30%, were obtained from samples taken near or below
g
I00
8 0
6 0
4 0
20 ¸
0 O. 001
s
J
o.oi o.I
f ~ ° r
- Symbol BH No Depth(m) /
t 13"5
. . . . 4 4 . 5
- - 5 1.5
I ' 0 1
I 0 ' 0
Grain size ( mini
Fig. 7. Typical particle size distribution curves for soils at the Obudu damsite represented by boreholes, 1, 4 and 5.
294
Table 4 Summary of soil test
E O. Esu et al.lEngineering Geology 42 (1996) 285-299
results for grainsize distribution, Atterberg limits and classification
Sampling Depth Sands (%) Silt and sites range clay (%) (borehole (m) Coarse Medium Fine <0.075 nos.)a 4.75-2.00 2.00 0.42 0.42-0.075 (mm)
(mm) (mm) (mm)
Atterberg limits Classification
LL PL P1 SL USCS AASHTO
1 1.5-15.0 1 16 3 21 8 34 52 68 34 53 21--35 13-19 5-10 SM, CL, MH A-6 (10.15) (14.00) (16.15) (59.70) (47.6) (30.6) (17.6) (8.4) (CL) A-7-5
2 1.0 37 25 12 4 CL A-6 4 1.5-14.0 2 8 10 25 12 57 41-66 54 59 35-40 19 21 5 8 SM, ML, MH A-7-5
(4) (18) 25 (53) (57.3) (37.7) (19.6) (7.3) (MH) 5 1.5 15.0 7 10 14-26 6-26 52 73 45 46 26 28 17 19 5 6.3 ML, CL A-7-5
(9) (19) (15) (57) (45.3) (27.3) (18) (5.8) (ML) A-7-6 6 1.0--6.0 3 13 18 25 11 44 41-54 42 55 31-37 10 21 9.2 10.2 SM, ML, MH A-2-7
(9) (22) (23) (46) (47.5) (34.5) (13) (8.8) (ME) A-7-5 7 3.0 10.5 2-16 16 30 12 21 23 60 48-59 31-38 15.4-22 9-11 SM, MH A-7-5
(12) (26) (19) (43) (53.7) (34.7) (19) (10) (SM)
LL, liquid limit; PL, plastic limit; PI, plasticity index; SL, shrinkage limit; USCS, Unified Soil Classification System; AASHTO, American Association of State Highway. Average values in brackets?See Fig. 2.
the groundwater table. The unit weight is in the range of 14.5 18.7 KN m -3.
The coefficient of permeability varies between 1.14 × 10 -7 and 1.80 × 10 -7 ms -1 indicating very
low permeabilities for the soils. This is an advan- tage because good reservoir tightness is assured. The low permeability (1 .4× 10 -7 ms -1 average) of the soils in borehole number 7 (Table 7) indi-
6 0 -
50-
~ 4 0 " c
30-
¢= o E 2o
I0
NON-SWELLING I LOW
NON-PLASTIC SUGHT LOW
/ Montmoril lonife / "
J / oL ~o 2'o ~o 4'0 50 6'o
Liquid ( L L ) %
SWELLING a
PLASTICITY °
I HIGH V. HIGH MEDIUM 1
/ / "~- ,.'~
, / ; .- . +'
/ J ~ - / j 01-1
/ MH
7'o ~ 9'o ~6o
® [
• 2
x 4.
÷ 5
® 6
o 7
Fig. 8. Plasticity chart showing the position of soils in the Obudu damsite. "After Ramana (1993).

E.O. Esu et al./Engineering Geology 42 (1996) 285-299 295
Table 5 Classification of swelling potentials
Seed et al. Ola (1982) Ramana (1993) Potential (1962) S" PI LL expansiveness
0-1.5 0-15 <50 Low 1.5-5.0 15-25 50-70 Medium 5.0-25.0 25-35 71-90 High <25.0 >35 >90 Very high
S=swelling potential; PI, plasticity index; LL, liquid limit." S =(21.16 x 10 -3) (PI) TM.
Table 6 Swelling potentials of Obudu damsite soils
Borehole Seed et al. Ola Ramana no. a (1962) (1982) (1993)
1 Medium Medium Low-medium 2 Low Low Low 4 Medium Medium Low-medium 5 Medium Medium Low 6 Low Low Low-medium 7 Medium Medium Low-medium
aSee Fig. 2.
cates that the hillock of mainly silty sands (Table 4) in the far section of the reservoir (Fig. 3) will not give rise to significant water losses.
The maximum dry density (MDD) ranges from 15.2 to 17.3 KN m -3 with optimum moisture
content (OMC) of 12-25%. These are the values of relative density and moisture content after recompaction of the fill materials.
5.6. Strength and compressibility of soils
Table 7 also gives the shear strength parameters (cohesion, C, and internal friction angle, ~) deter- mined by undrained consolidated triaxial tests of soil samples from the valley shoulders (boreholes 1 and 4) and the spillway (borehole 5). Each specimen of 35 mm diameter and 110 mm height was prepared from a slightly disturbed sample and was tested using cell pressures of 50.0; 100.0 and 200.0 KPa. This test condition tends to simulate quite closely the field conditions in an earthdam environment in which the structure is compacted to meet specified conditions. Such compaction reduces the void ratio to the initial condition of the sample under the consolidated undrained con- ditions. The cohesion values are in the range of 23-90 KPa with the corresponding frictional angles varying between 15 and 24 ° . These values will ensure a high shear strength for the site materials.
Oedometer tests performed on some of the samples used in the triaxial tests produced the coefficients of volume compressibility (My) and consolidation (Cv) listed in Table 8. My determines
Table 7 Summary of some physical properties of soils at Obudu damsite
Properties Sampling locations/borehole nos?
1 2 4 5 6 7
Depth range (m) 1.5-15.0 1.0 1.5-14.0 1.5-15.0 1.0-6.0 3.0-10.5 Natural moisture content (%) 22.041.7 38.1 22.4-38.4 17-30 31.0-38 25.0-39.0 (mean) (30.3) (28.9) (24.3) (34) (28.8) Unit weight (KN m 3) 14.5-18.5 15.8 15.2-18.7 15.0-16.4 15.2-17.2 14.8-15.1 (mean) (15.4) (16.2) (15.3) (15.8) (15.0) Pemeability (m/s) x 10 -7 1.52-1.61 1.73 1.65-1.74 1.64-1.66 1.64-1.81 1.58-1.60 (mean) (1.57) (1.68) (1.65) (1.70) (1.59) Optimum moisture content (%) 19.1-25.0 12.2 12.0-13.8 16.2-19.5 17.2-19.5 20.6-22.8 (mean) (21.08) (12.9) (17.7) (18.4) (21.4) Cohesion (Kpa) 23-50 60-95 70-80 (mean) (33.7) (81.3) (75) Frictional angle (°) 20-24 15-22 17-22 (mean) (22) (18.3) (19)
~See Fig. 2.

296 E.O. Esu et al./Engineering Geology 42 (1996) 285-299
Table 8 Summary of results of one-dimensional consolidation tests on soils
Borehole nos. Depth (m) Pressure ranges (KPa)
0-50 50-100 100-200 200-400
Mv ~. My (~ My Cv Mv c~
1 13.5 0,10 6.00 × 10 -7 0.12 7.88 × 10 -7 0.10 9.56 × 10 -7 0.80 4 1.5 0,12 6 .81×10 7 0.10 7 .79x10 -7 0.08 9 .56×10 v 0.05 5 1.5 0,27 7.92 x 10 -7 0.13 9.18 × 10 7 0.08 1.13x 10 -8 0.04
1.18 x 10 -8 1.26 × 10 -8 1.19×10 8
My, coefficient of volume compressibility (m 2 M N-1) ; Cv, coefficient of consolidation (m 2 s 1).
the area that is likely to be compressible under a given load while Cv indicates the likely rate of settlement per annum under the loading condi- tions. For the materials tested, Mv varies bet- ween 0.04 and 0.80 m 2 MN-1, whereas Cv is in the range of 6.00x10 -~ to 1.26x10 -8 m e s 1 (Table 8). These values indicated normally consoli- dated materials with low compressibility which, in addition to their low permeabilities (Table 7), would result in settlement that is small and slow.
5. 7. Rock properties and classification
The unit weight, uniaxial compressive strength and shear parameters (C and qb) of core samples are presented in Table 9. the unit weight ranges from 26.46 to 29.79 kN m -3, while the compres- sive strength varies between 45.3 and 145.0 MPa. The strength values correspond to a strength class of low to high on Deere and Miller (1966) scheme. The generally low compressive strengths of less than 50 MPa in the gneisses (Table 9) probably
reflect the effects of anisotropy or weathering (Mathewson, 1981 ).
The shear parameters, C and qb, were found to vary between 17.3 (biotite gneiss) and 60.0 MPa (dolerite) and from 10 (dolerite) to 20 ° (biotite gneiss), respectively (Table9). These are high enough to withstand the dam's structure.
The rockmass was classified by employing the geomechanics or rock mass rating (RMR) scheme of Bieniawski ( 1973),(1979),(1989) which utilises the following parameters for assessing the quality of the rockmass: (i) uniaxial compressive strength (UCS); (ii) rock quality designation (RQD); (iii) spacing of discontinuities; (iv) condition of discon- tinuities; (v) groundwater conditions; (vi) orienta- tion of discontinuities.
The ratings for the present study are given in Table 10. The computed RMR values range between 36 and 66, averaging 45. This mean rating indicates that generally the bedrock beneath the dam axis belongs to the third (or fair) rock cate- gory on the RMR system.
Table 9 Summary of strength characteristics for the bedrock at damsite
Borehole Depth Unit weight Compressive Cohesion Frictional Strength Rock type no. a (m) (kN/m 3) strength (MPa) (.(7) (MPa) angle ~b (°) class b
1 17.0 29.50 145.0 60.0 10 High 2 3.55 27.24 45.3 18.0 13 Low 3 2.92 28.13 49.5 l 7.3 20 Low 4 17.4 26.46 48.8 l 8.7 16 Low 6 10.3 29.79 90.6 34.5 15.4 Medium Mean 28.22 76.04 29.7 15 Medium
Dolerite Microgranite gneiss Biotite gneiss Biotite gneiss Sillimanite-biotite gneiss
~See Fig. 2.bAfter Deere and Miller (1966).
E.O. Esu et aL /Engineering Geology 42 (1996) 285-299 297
Table 10 Rock mass rating (RMR) classification of the damsite bedrock
Rock mass parameters Ranges of parameter values Ratings
UCS (MPa) 45.3-145.0 4-12 (6)
RQD (%) 74-100 13-20 (mean: 84.0) (17)
Spacing (In) 0.03-0.68 10-20 (mean: 0.22) (14)
Discontinuity Moderately persistent. 6 conditions Aperture varies between I
and 5 mm. Smooth planar surfaces. Chlorite, kaolinite and iron oxides infill. Slightly to highly weath- ered
Total RMR Poor to Good 34-63 (fair) (43)
6. Suitability o f the dam axis
It was indicated that material settlement on the Valley flanks will be small and slow (section 5.6. This deduction and the inferred high shear strength for the site materials (Table 7) attest to the suitabil- ity of the chosen dam axis. In addition, the under- lying bedrock material of medium strength classification (Table 9), which are virtually devoid of major fractures will ensure a stable foundation.
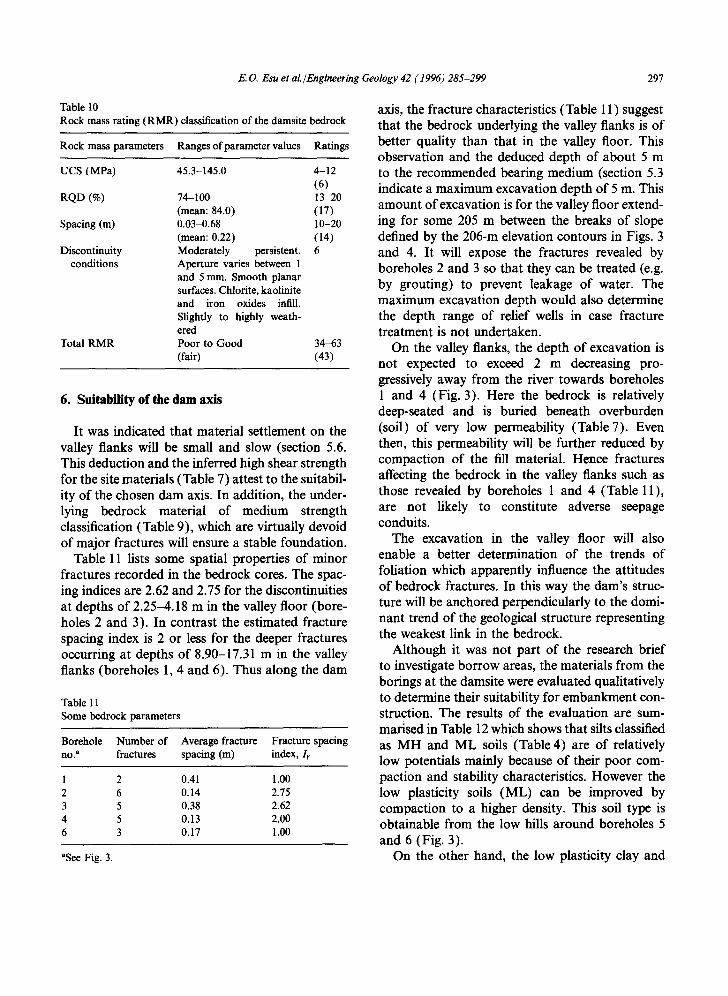
Table 11 lists some spatial properties of minor fractures recorded in the bedrock cores. The spac- ing indices are 2.62 and 2.75 for the discontinuities at depths of 2.25-4.18 m in the valley floor (bore- holes 2 and 3). In contrast the estimated fracture spacing index is 2 or less for the deeper fractures occurring at depths of 8.90-17.31 m in the valley flanks (boreholes 1, 4 and 6). Thus along the dam
Table 11 Some bedrock parameters
Borehole Number of Average fracture Fracture spacing n o . " f ractures spacing (m) index, If
1 2 0.41 1.00 2 6 0.14 2.75 3 5 0.38 2.62 4 5 0.13 2.00 6 3 0.17 1.00
"See Fig. 3.
axis, the fracture characteristics (Table 11 ) suggest that the bedrock underlying the valley flanks is of better quality than that in the valley floor. This observation and the deduced depth of about 5 m to the recommended bearing medium (section 5.3 indicate a maximum excavation depth of 5 m. This amount of excavation is for the valley floor extend- ing for some 205 m between the breaks of slope defined by the 206-m elevation contours in Figs. 3 and 4. It will expose the fractures revealed by boreholes 2 and 3 so that they can be treated (e.g. by grouting) to prevent leakage of water. The maximum excavation depth would also determine the depth range of relief wells in case fracture treatment is not undertaken.
On the valley flanks, the depth of excavation is not expected to exceed 2 m decreasing pro- gressively away from the river towards boreholes 1 and 4 (Fig. 3). Here the bedrock is relatively deep-seated and is buried beneath overburden (soil) of very low permeability (Table7). Even then, this permeability will be further reduced by compaction of the fill material. Hence fractures affecting the bedrock in the valley flanks such as those revealed by boreholes 1 and 4 (Table 11), are not likely to constitute adverse seepage conduits.
The excavation in the valley floor will also enable a better determination of the trends of foliation which apparently influence the attitudes of bedrock fractures. In this way the dam's struc- ture will be anchored perpendicularly to the domi- nant trend of the geological structure representing the weakest link in the bedrock.
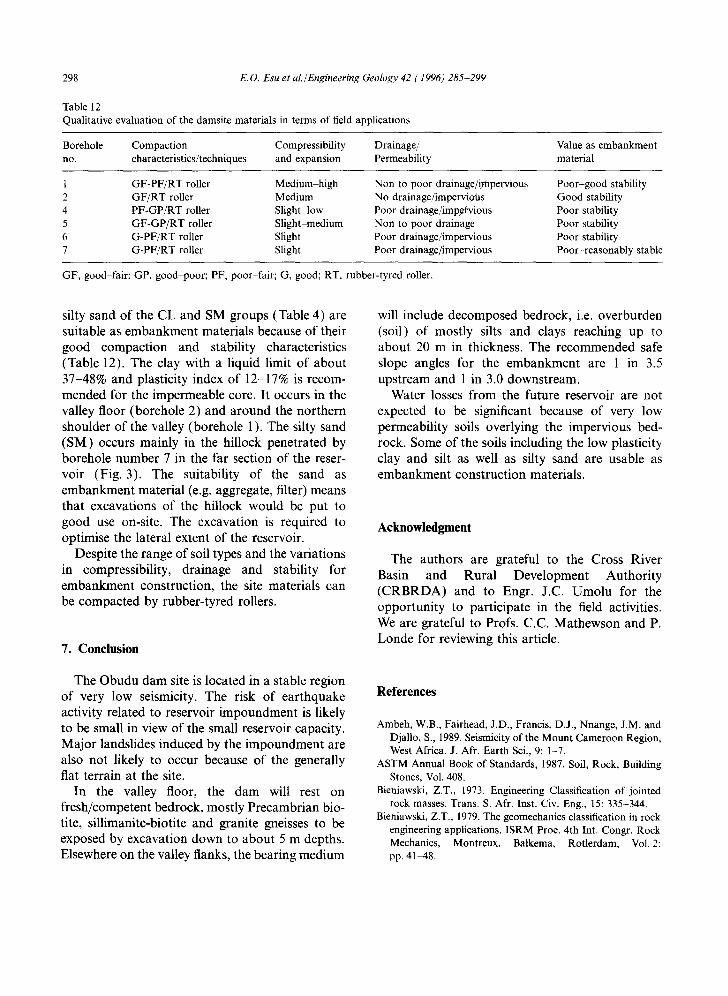
Although it was not part of the research brief to investigate borrow areas, the materials from the borings at the damsite were evaluated qualitatively to determine their suitability for embankment con- struction. The results of the evaluation are sum- marised in Table 12 which shows that silts classified as MH and ML soils (Table 4) are of relatively low potentials mainly because of their poor com- paction and stability characteristics. However the low plasticity soils (ML) can be improved by compaction to a higher density. This soil type is obtainable from the low hills around boreholes 5 and 6 (Fig. 3).
On the other hand, the low plasticity clay and
298 E. O. Esu et al./Engineering Geology 42 (1996) 285-299
Table 12 Qualitative evaluation of the damsite materials in terms of field applications
Borehole Compaction Compressibility Drainage/ Value as embankment no. characteristics/techniques and expansion Permeability material
1 GF-PF/RT roller Medium high Non to poor drainage/impervious Poor-good stability 2 GF/RT roller Medium No drainage/impervioias Good stability 4 PF-GP/RT roller Slight low Poor drainage/impNvious Poor stability 5 GF-GP/RT r o l l e r Slight-medium Non to poor drainage Poor stability 6 G-PF/RT roller Slight Poor drainage/impervious Poor stability 7 G-PF/RT roller Slight Poor drainage/impervious Poor-reasonably stable
GF, good-fair; GP, good-poor; PF, poor fair; G, good; RT, rubber-tyred roller.
silty sand of the CL and SM groups (Table 4) are suitable as embankment materials because of their good compaction and stability characteristics (Table 12). The clay with a liquid limit of about 37-48% and plasticity index of 12-17% is recom- mended for the impermeable core. It occurs in the valley floor (borehole 2) and around the northern shoulder of the valley (borehole 1 ). The silty sand (SM) occurs mainly in the hillock penetrated by borehole number 7 in the far section of the reser- voir (Fig. 3). The suitability of the sand as embankment material (e.g. aggregate, filter) means that excavations of the hillock would be put to good use on-site. The excavation is required to optimise the lateral extent of the reservoir.
Despite the range of soil types and the variations in compressibility, drainage and stability for embankment construction, the site materials can be compacted by rubber-tyred rollers.
7. Conclusion
The Obudu dam site is located in a stable region of very low seismicity. The risk of earthquake activity related to reservoir impoundment is likely to be small in view of the small reservoir capacity. Major landslides induced by the impoundment are also not likely to occur because of the generally fiat terrain at the site.
In the valley floor, the dam will rest on fresh/competent bedrock, mostly Precambrian bio- tite, sillimanite-biotite and granite gneisses to be exposed by excavation down to about 5 m depths. Elsewhere on the valley flanks, the bearing medium
will include decomposed bedrock, i.e. overburden (soil) of mostly silts and clays reaching up to about 20 m in thickness. The recommended safe slope angles for the embankment are 1 in 3.5 upstream and 1 in 3.0 downstream.
Water losses from the future reservoir are not expected to be significant because of very low permeability soils overlying the impervious bed- rock. Some of the soils including the low plasticity clay and silt as well as silty sand are usable as embankment construction materials.
Acknowledgment
The authors are grateful to the Cross River Basin and Rural Development Authority (CRBRDA) and to Engr. J.C. Umolu for the opportunity to participate in the field activities. We are grateful to Profs. C.C. Mathewson and P. Londe for reviewing this article.
References
Ambeh, W.B., Fairhead, J.D., Francis, D.J., Nnange, J.M. and Djallo, S., 1989. Seismicity of the Mount Cameroon Region, West Africa. J. Afr. Earth Sci., 9: 1-7.
ASTM Annual Book of Standards, 1987. Soil, Rock, Building Stones, Vol. 408.
Bieniawski, Z.T., 1973. Engineering Classification of jointed rock masses. Trans. S. Afr. Inst. Civ. Eng., 15: 335-344.
Bieniawski, Z.T., 1979. The geomechanics classification in rock engineering applications. ISRM Proc. 4th Int. Congr. Rock Mechanics, Montreux. Balkema, Rotlerdam, Vol. 2: pp. 41-48.
E.O. Esu et al./Engineering Geology 42 (1996) 285-299 299
Bieniawski, Z.T., 1989. Engineering Rock Mass Classification. McGraw Hill, New York, NY, 237 pp.
CoUignon, F., 1968. Gravimetric du Reconnaissance, Camer- oun, ORSTOM, 35 pp.
Deere, D.U. and Miller, R.P., 1966. Engineering classification and index properties of intact rock. Report AWFL TR-65-116. Airforce Weapons Laboratory (WLDC) Kirt- land Airforce Base. New Mexico.
Ekwueme, B.N., 1990. Petrology, geochemistry and metamor- phic evolution of southern Obudu Plateau, Bamenda Massif, 26th Ann. Conf. Nig. Min. Geosc-Soc. Abst. Vol. p. 8. Kaduna, Nigeria.
Ekwueme, B.N., 1991. Geology of the area around Obudu Cattle Ranch, southeastern Nigeria. J. Min. Geol., 27(1): 129-134.
Geological Survey of Nigeria (GSN), 1974. Geological map of Nigeria. Scale 1:2000 000.
Holtz, R.D. and Kovacs, W.D., 1981. An Introduction to
Geotechnical Engineering. Prentice Hall Inc., Engiewood Cliffs, New Jersey 07632, 733 pp.
Mathewson, C.C., 1981. Engineering Geology. Charles E. Merill, Columbus, OH. 410 pp.
Okereke, C.S., 1988. Contrasting modes of rifting - the Benue trough and Cameroon volcanic line, West Africa. Tectonics, 7: 775-784.
Ola, S.A., 1982. Geotechnical properties of an Attapulgite clay shale in Northwestern Nigeria. Eng. Geol., 19: 1-13.
Orajaka, S., 1964. Geology of the Obudu area, Ogoja Province, Eastern Nigeria. Naturalists Canadien Sci., (3): 73-78.
Ramana, K.V., 1993. Humid tropical expansive soils of Trini- dad: Their geotechnical properties and aeral distribution. Eng. Geol., 34: 27-44.
Seed, H.B., Woodward, R.J. and Lundgren, R., 1962. Predic- tion of swelling potential for compacted clays. J. Soil Mech. Found. Div., ASCE, 88(SM3): 53-87.
Terzaghi, K. and Peck, R.B., 1968. Soil Mechanics in Engineer- ing Practice. John Wiley and Sons Inc., New York.