A BE-SOI MEMS for Inertial Measurement in Geophysical Applications
Upload
independentCategory
view
2download
0
December 2014
1 | P a g e
Geophysical and Petrographic Investigation of the Ecca Group of the Karoo Basin in the Eastern Cape Province of South Africa
N.W. Mupandawana1 and C. Baiyegunhi2
1,2Department of Geology, Faculty of Science and Agriculture, University of Fort Hare, South Africa
Abstract
Sampling for this study was conducted within the grid corners 26˚30” E to 26˚40” E and -33˚20” S to -33˚40”S from outcrops and road cuttings along road (R67). The analysis extends to exactly a degree east & west (26˚ E to 27˚ E and -33˚30”S to -32˚30”S) and this forms host to part of the Karoo Sedimentary Supergroup, the main focus is on the Ecca Group that mainly comprises of sandstone, shale and mudstone. The study involved field sampling and structural observation, GPS coordinate recording and some dip and strike measurements. Measurements of sample masses were then conducted in the laboratory to determine density (wet, dry and grain) and porosities. The results reveal that of all the formations that make up the Ecca Group, the Whitehill Formation is the most permeable with a porosity of about 4.4 % and also least dense with a dry density of up to 2.525 g/cm3. Density results produced were as expected; dry < saturated< grain densities, averaging 2.674 g/cm3, 2.692 g/cm3 and 2.731 g/cm3 for dry, wet and grain densities, respectively. Petrographic study revealed that the main mineralization in all these formations to be quartz existing in a number of forms (eg monocrystalline and polycrystalline quartz), feldspar and mica as well as pyrite. The superimposed geophysical maps (magnetic and gravity) shows correlation between both gravity and magnetic signatures with dolerite intrusions particularly in the less competent Balfour Formation and weaker litho-plane boundaries themselves. Magnetic profiles exposed the elevated magnetic values anomalously focused in and just around the Ecca Group.
Introduction
The Karoo Supergroup was accumulated in a subsiding basin environment believed to be retro -arc foreland basin environment and record a mostly unbroken stratigraphi c succession that span from the Carboniferous to the Middle Jurassic. Recently, it was envisaged that the Karoo basin developed due to blocks subsidence along the marginal faults (Johnson et al., 2006; Rubidge et al., 2012). The Karoo Supergroup is a sedimentary geological mega unit mostly comprised of sandstones and shale’s accumulated and bedded down in sandy shore lines and swamp lands in the Permian period, where it formed due to a retro-arc foreland system that formed in front of the Cape Fold Belt in relation to the Late Palaeozoic to Early Mesozoic subduction episode of the Paleo-Pacific plate underneath the Gondwana plate (Johnson, 1991). Swamps and vegetation from forests built up at many places and times during its deposition, resulting in widespread coal deposits associated with the Karoo. Almost all of South Africa's coal resources and one-third of the coal resources in the southern hemisphere are in rocks of the Ecca Group (Johnson, 1991) the latter may also be hosting the much debated shale gas thought to be hosted in the Whitehill Formation in the Eastern Cape region. The Karoo basin is well known worldwide because of its fossil content. The study had a lateral extent of approximately 45 km the studies physical location (study area) is as indicated in the map (Figure 1.1) of the Eastern Cape Province of South Africa with the main focus on (R67) were Most of the samples for this project were collected along R67 (see Figure 1.1), for analysis with the main focus being on the formations of the Ecca Group (Prince Albert, Whitehill, Collingham, Ripon, and Fort Brown Formations). However, samples outside this Ecca Group were also collected for geophysical and petrographic studies.

December 2014
2 | P a g e
Figure 1.1 Map showing location of study area Samples for analysis were collected from outcrops along R67 with more emphasis on the Ecca Group (Modifided from Emese et al., 2011; Catuneanu etal.,2001).
1 .2.Problem descr iption and motivation
In the science of geology, rock density links the properties of minerals and lithology to topics such as porosity, isostasy and seismic velocity. The study of bulk density, particle density, saturated density and porosity of rock samples
from an area reveals some vital physical properties of the lithology of an area. Knowledge of densities of rocks is crucial in petrological and geological studies and more so for a meaningful structural interpretation of gravity and magnetic anomalie

December 2014
3 | P a g e
Objectives of Study
Build a solid knowledge base of the geology of study area by means of a desktop study and a concise literature review.
Visit several sites in the field for observation of relations of lithology in situ and sampling
Raw data generation from laboratory measurements of mass to yield density values for the different formations.
This inquiry aims to document the main geo-physical characteristics of different lithology’s of these formations by deriving density, gravity and porosity values.
To generate at least one thin section for each formation to be analysed as a representative of any particular formation and produce a petrographic report.
Use existing magnetic and gravity data to generate maps and investigate if the geophysical responses are directly linked to the surrounding formation.
1.3. Structure and layout of this project
The structure of this study is described diagrammatically step by step to completion and fulfilment of the aims and objectives of this study. See (figure 1.2)
Figure 1 .2 : Methodology flow diagram for this
research project.
2.1.0 Background geology
The Karoo Basin hosts the thickest and strati-graphically most complete mega sequence made up of several deposits of the Permo-Carboniferous to Jurassic age (Smith et al., 1993). The maximum preserved thickness of this super sequence adjacent to the Cape Fold Belt and is in exesece of 6 km (Smith et al., 1993).
The sedimentary succession reflects variable environments from glacial to deep marine, fluvial, deltaic, and Aeolian regimes (Smith et al., 1993). Basinal fill is characteristically linked to the orogenesis of the Cape Fold Belt which is believed to have formed as a single phase, multiple event orogeny (Hallbich, 1983). The Karoo Super Group is subdivided into five main groups namely the Dwyka, Ecca, Beaufort, Stormberg and Drakensberg (Johnson,1991)
The deeper marine facies of the Dwyka and early Ecca groups, developed during the under filled phase of the foreland system (Catuneanu et.al., 1998). The shallow marine facies of the late Ecca Group is related to the filled phase of the basin, which was followed by an overfilled phase characterised by more fluvial sedimentation. The terms “under filled”, “filled” and “overfilled” are used in agreement with the definitions of Sinclair and Allen (1992). Below is the lithostratigraphic sequence of the Karoo Super Group of the Eastern Cape including the main lithology’s and layer maximum thickness and handy keys for easy reading of table 2.1 below.
Stage 1 • Introduction
Stage 2 • litreture Reviwe
stage 3 • Methodology
Stage 4 • Sampling and data Recording
Stage 5 • Data Intergration
Stage6 • Data Interpertation and Results

December 2014
4 | P a g e
2.1.1 Lithostratigraphy of the Karoo Super Group in the Eastern Cape Province
Table 2.1 Modified from 1st year field trip guide University of Fort Hare (03/05/2013)
Lithology key litho-colour and Texture key Table 2.2 Table 2.3
Example ……LGSs ===>>>> l ight grey sandstone
SUPERGROUP GROUP SUBGROUP FORMATION MEMBER LITHOLOLOGY MAX THICKNESS (m)
K A R O O
Drakensberg Bs 1400
Clarens Ss 300 Elliot RM,Ss 500 Molteno CrSs,G&KS 450
B E A U F O R T
Tarkastand Burgersdrop RM,LGSs,GS 1000 Katberg LGSs,RMs,Gs 900
Adelaide
Balfour Palingkloof RM,LGSs,GS 50 Elandsberg Ss,St 700
Barberkrans LGSs,KS 100 Daggaboersnek GS,Ss,St 1200 Oudeberg LGSs,Ss,St 100
Middleton G&BS,LGSs,RM 1500
Koonap GSs,S 1300 E C C A
Waterford Ss,S 800 Fort Brown S,Ss 1500 Ripon Ss,S 1000 Collingham GS,YCs 30 whitehill BS,Ch 70 Prince Albert KS 120
dwyka D,T,S 750
Grey G
Red R
Khaki K
Light L
Dark D
Black B
yellow Y
Coarse Cr
Basalt Bs
Sandstone Ss Mudstone Ms Shale S Chert Ch Claystone Cs Tilite T Diamict ite D Silt stone St
December 2014
5 | P a g e
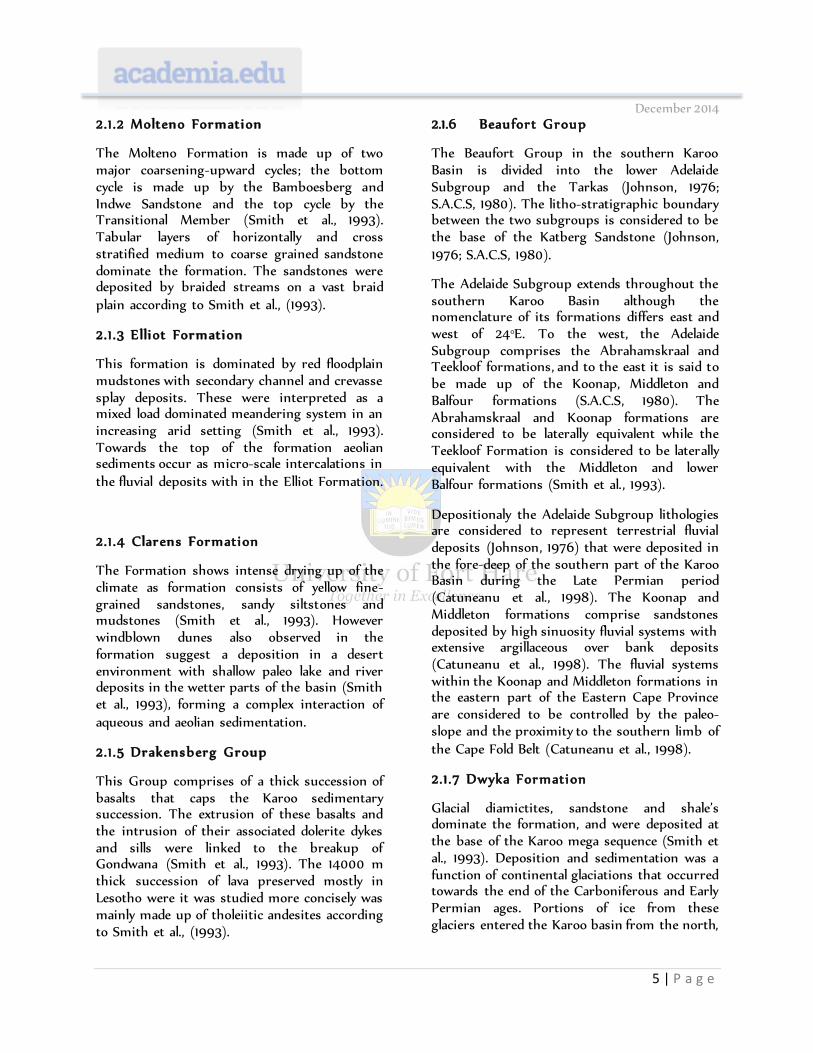
2.1.2 Molteno Formation
The Molteno Formation is made up of two major coarsening-upward cycles; the bottom cycle is made up by the Bamboesberg and Indwe Sandstone and the top cycle by the Transitional Member (Smith et al., 1993). Tabular layers of horizontally and cross stratified medium to coarse grained sandstone dominate the formation. The sandstones were deposited by braided streams on a vast braid plain according to Smith et al., (1993).
2.1 .3 Elliot Formation
This formation is dominated by red floodplain mudstones with secondary channel and crevasse splay deposits. These were interpreted as a mixed load dominated meandering system in an increasing arid setting (Smith et al., 1993). Towards the top of the formation aeolian sediments occur as micro-scale intercalations in the fluvial deposits with in the Elliot Formation.
2.1 .4 Clarens Formation
The Formation shows intense drying up of the climate as formation consists of yellow fine-grained sandstones, sandy siltstones and mudstones (Smith et al., 1993). However windblown dunes also observed in the formation suggest a deposition in a desert environment with shallow paleo lake and river deposits in the wetter parts of the basin (Smith et al., 1993), forming a complex interaction of aqueous and aeolian sedimentation.
2.1 .5 Drakensberg Group
This Group comprises of a thick succession of basalts that caps the Karoo sedimentary succession. The extrusion of these basalts and the intrusion of their associated dolerite dykes and sills were linked to the breakup of Gondwana (Smith et al., 1993). The 14000 m thick succession of lava preserved mostly in Lesotho were it was studied more concisely was mainly made up of tholeiitic andesites according to Smith et al., (1993).
2.1.6 Beaufort Group
The Beaufort Group in the southern Karoo Basin is divided into the lower Adelaide Subgroup and the Tarkas (Johnson, 1976; S.A.C.S, 1980). The litho-stratigraphic boundary between the two subgroups is considered to be the base of the Katberg Sandstone (Johnson, 1976; S.A.C.S, 1980).
The Adelaide Subgroup extends throughout the southern Karoo Basin although the nomenclature of its formations differs east and west of 24°E. To the west, the Adelaide Subgroup comprises the Abrahamskraal and Teekloof formations, and to the east it is said to be made up of the Koonap, Middleton and Balfour formations (S.A.C.S, 1980). The Abrahamskraal and Koonap formations are considered to be laterally equivalent while the Teekloof Formation is considered to be laterally equivalent with the Middleton and lower Balfour formations (Smith et al., 1993).
Depositionaly the Adelaide Subgroup lithologies are considered to represent terrestrial fluvial deposits (Johnson, 1976) that were deposited in the fore-deep of the southern part of the Karoo Basin during the Late Permian period (Catuneanu et al., 1998). The Koonap and Middleton formations comprise sandstones deposited by high sinuosity fluvial systems with extensive argillaceous over bank deposits (Catuneanu et al., 1998). The fluvial systems within the Koonap and Middleton formations in the eastern part of the Eastern Cape Province are considered to be controlled by the paleo-slope and the proximity to the southern limb of the Cape Fold Belt (Catuneanu et al., 1998).
2.1 .7 Dwyka Formation
Glacial diamictites, sandstone and shale’s dominate the formation, and were deposited at the base of the Karoo mega sequence (Smith et al., 1993). Deposition and sedimentation was a function of continental glaciations that occurred towards the end of the Carboniferous and Early Permian ages. Portions of ice from these glaciers entered the Karoo basin from the north,

December 2014
6 | P a g e
northeast, east and south at different times (Smith et al., 1993).
As Gondwana drifted away from polar latitudes the retreating ice-sheets left a large epicontinental sea (Smith et al., 1993). Consequently fine grained sediments of the Ecca Group accumulated by suspension settling and gradationally overlie the Dwyka diamictites. The Dwyka-Ecca transition reflects an environmental transition from melt water alluvial fans, to an inland sea, to a more stable lower energy fluvial system forming fine grained deltas (Smith et al., 1993). From this explanation it follows in confirmation that the Ecca Group conformably overlies the Dwyka Group.
2.2.0 Ecca Group
The rocks of the Ecca Group were first formerly identified by (Jones,1867) as the “Ecca Beds” and were separated from the overlying “Beaufort Beds” i.e. now Beaufort Group. The “Ecca Beds” were at a later stage renamed the “Ecca Series” by (Rogers, 1903) in his fourfold sub-divisioning of the “Karroo System”. (Rogers, 1903) work formed the foundation stratigraphic framework on which all succeeding effort was based. Rossouw in (1953) brock down Roger’s Ecca "Series" in the southern Karoo Basin into a Lower, Middle and Upper Ecca Stage and then Johnson in (1976) renamed the Ecca “Series” in the southern Karoo Basin as the Ecca Group, guided by international stratigraphic nomenclaterial practice. A the same time the Lower, Middle and Upper Ecca "Stages" became formalized as the Ripon, Fort Brown and Waterford formations. The Prince Albert Shale and Whitehill formations below were also included into the Ecca Group although they had been part of the upper Dwyka (Johnson, 1976). Johnson (1976) went a step ahead and proposed that the added grey and yellow shales on top of the Whitehill Fromation should be known as the Collingham Formation. With slight alterations this stratigraphic outline was received by the South African Committee for Stratigraphy in 1980 (S.A.C.S, 1980) and to date this stratigraphic outline for the southern Karoo Basin is used.
Table 2.3 stratigraphic column of the Ecca Group (age dates obtained from the western part of the basin by Fildani et al .,(2010).
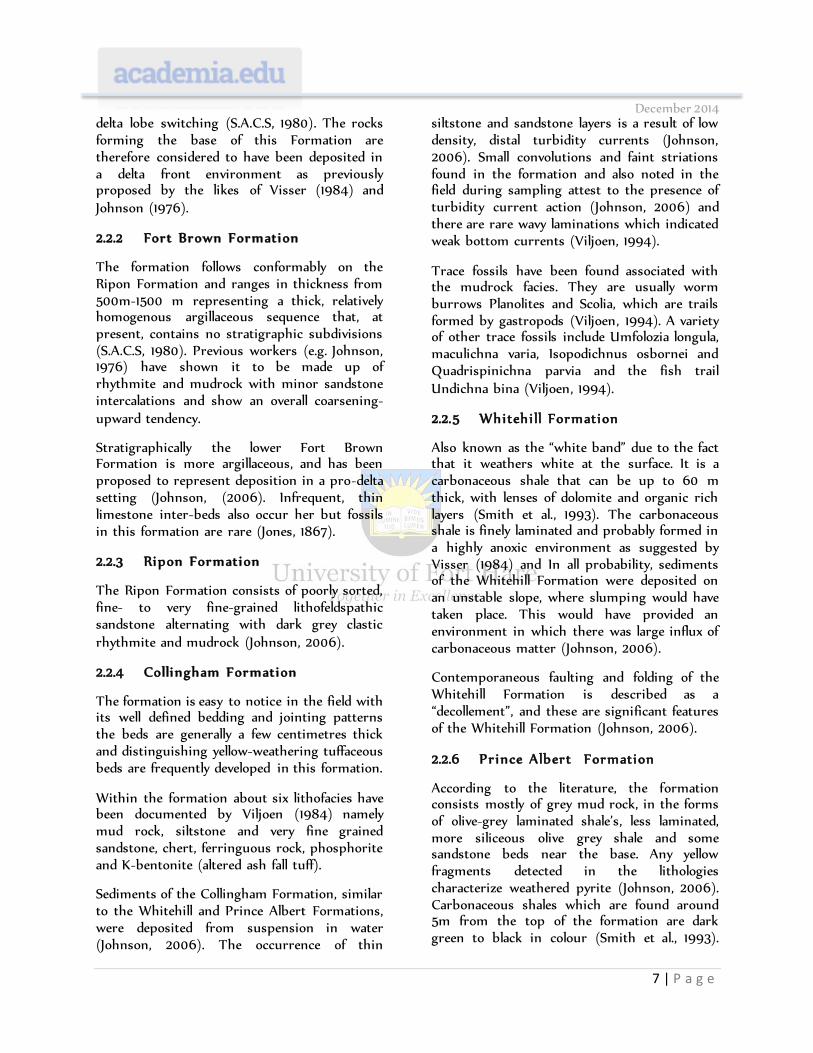
2.2.1 Waterford Formation
This formation conformably overlies the Fort Brown Formation and it varies from 150 m to 580 m in thickness, depending on the locality, the formation is also characteristically more arenaceous than the Fort Brown Formation below it (S.A.C.S, 1980). Fossils from the Waterford Formation include isolated scales of the palaeoniscid fish Namaichthys digitata (S.A.C.S, 1980), occasional imprints of fragmented Glossopteris and Schizoneura (S.A.C.S, 1980).
Fragments of silicified wood and fossil tree stumps are common throughout this sequence have been noted and are proposed by Johnson (1976) to probably have been floated in, became waterlogged, and sank.
The litho-facies of the Waterford Formation are mostly arenaceous and their internal geometries and structure, including current and wave induced cross-bedding, scour and fill features, planar beds, and ripple marks, coupled to the lack of any dessication features, all point to sub-aqueous deposition (S.A.C.S, 1980). The fact that the facies associations are repeated several times in vertical succession and appear to exhibit a degree of cyclicity is suggestive of
December 2014
7 | P a g e
delta lobe switching (S.A.C.S, 1980). The rocks forming the base of this Formation are therefore considered to have been deposited in a delta front environment as previously proposed by the likes of Visser (1984) and Johnson (1976).
2.2.2 Fort Brown Formation
The formation follows conformably on the Ripon Formation and ranges in thickness from 500m-1500 m representing a thick, relatively homogenous argillaceous sequence that, at present, contains no stratigraphic subdivisions (S.A.C.S, 1980). Previous workers (e.g. Johnson, 1976) have shown it to be made up of rhythmite and mudrock with minor sandstone intercalations and show an overall coarsening-upward tendency.
Stratigraphically the lower Fort Brown Formation is more argillaceous, and has been proposed to represent deposition in a pro-delta setting (Johnson, (2006). Infrequent, thin limestone inter-beds also occur her but fossils in this formation are rare (Jones, 1867).
2.2.3 Ripon Formation
The Ripon Formation consists of poorly sorted, fine- to very fine-grained lithofeldspathic sandstone alternating with dark grey clastic rhythmite and mudrock (Johnson, 2006).
2.2.4 Collingham Formation
The formation is easy to notice in the field with its well defined bedding and jointing patterns the beds are generally a few centimetres thick and distinguishing yellow-weathering tuffaceous beds are frequently developed in this formation.
Within the formation about six lithofacies have been documented by Viljoen (1984) namely mud rock, siltstone and very fine grained sandstone, chert, ferringuous rock, phosphorite and K-bentonite (altered ash fall tuff).
Sediments of the Collingham Formation, similar to the Whitehill and Prince Albert Formations, were deposited from suspension in water (Johnson, 2006). The occurrence of thin
siltstone and sandstone layers is a result of low density, distal turbidity currents (Johnson, 2006). Small convolutions and faint striations found in the formation and also noted in the field during sampling attest to the presence of turbidity current action (Johnson, 2006) and there are rare wavy laminations which indicated weak bottom currents (Viljoen, 1994).
Trace fossils have been found associated with the mudrock facies. They are usually worm burrows Planolites and Scolia, which are trails formed by gastropods (Viljoen, 1994). A variety of other trace fossils include Umfolozia longula, maculichna varia, Isopodichnus osbornei and Quadrispinichna parvia and the fish trail Undichna bina (Viljoen, 1994).
2.2.5 Whitehi ll Formation
Also known as the “white band” due to the fact that it weathers white at the surface. It is a carbonaceous shale that can be up to 60 m thick, with lenses of dolomite and organic rich layers (Smith et al., 1993). The carbonaceous shale is finely laminated and probably formed in a highly anoxic environment as suggested by Visser (1984) and In all probability, sediments of the Whitehill Formation were deposited on an unstable slope, where slumping would have taken place. This would have provided an environment in which there was large influx of carbonaceous matter (Johnson, 2006).
Contemporaneous faulting and folding of the Whitehill Formation is described as a “decollement”, and these are significant features of the Whitehill Formation (Johnson, 2006).
2.2.6 Prince Albert Formation
According to the literature, the formation consists mostly of grey mud rock, in the forms of olive-grey laminated shale’s, less laminated, more siliceous olive grey shale and some sandstone beds near the base. Any yellow fragments detected in the lithologies characterize weathered pyrite (Johnson, 2006). Carbonaceous shales which are found around 5m from the top of the formation are dark green to black in colour (Smith et al., 1993).

December 2014
8 | P a g e
Sandy beds have been noticed near the top of the formation as well as a soft brownish material having an abundance of iron oxide (Smith et al., 1993).
The fine grained muds are deposited by suspension settling of fine grained particles whereas sandstone beds are deposited as a result of turbidity currents (Johnson, 2006).
Methodology
3.1. Introduction
To see the successful completion of this study, just like any other academic endeavour, a series of logically ordered processes were laid down as a plan and executed. This included literature review of the geology of the area, fieldwork, laboratory investigations, processing of existing geophysical data, analysis and interpretation of the results.
3.2. Desktop Study
This process entailed the study and consultation of south African geology and geophysics textbooks, online articles, journals, previous unpublished and published theses and desertations that have been produced in relation to the Karoo sedimentary super group with emphasis on the formation of the Ecca Group.
3.3. Field Work
This formed the second stage of this study and involved several processes that included sampling, GPS reading and recording some dip and strike directions measurements. The field work was carried out on the 3rd of May 2013 and 3rd of August 2013
3.3.1 . Sampling
Only rock samples were collected from the field, a geological hammer was used to break and knock off fresh samples from out crops or road cuttings that had not been affected by weathering and atmospheric reactions like oxidation. On average the sample dimensions were 10 cm × 10 cm × 20 cm width, thickness
and length respectively this is twice the standard geological sample dimension, the reason for this was to get larger samples that were better representatives of the lithologies that could be broken down into smaller ones in the lab. The advantage of this in the field would be to reduce the overall number of samples in the same vehicle from different localities on the same day, although all samples were labelled with a number and later distinguished them from formation to formation. A minimum of six samples were collected rrom each formation.
3.3.2. GPS recording at sample location
A GPS receiver was used to measure the location of each sample site. The location readings were collected at an of accuracy of 3 m on average by GPS the latitude, longitude and elevation were recorded
3.3.3. Dip and strike measurements of strata
Figure 3.1 : Measurement of dip and strike
A photo of myself out in the field taken as I was taking a dip angle measurement in between sampling of the Chollinghum Formation
3.4. Laboratory work .
This involved measurements of mass of sample from which density and porosity values were determined, then it also involved the manual production of thin sections for each of the lithologies in the Ecca Group and their petrographic interpretation.
December 2014
9 | P a g e
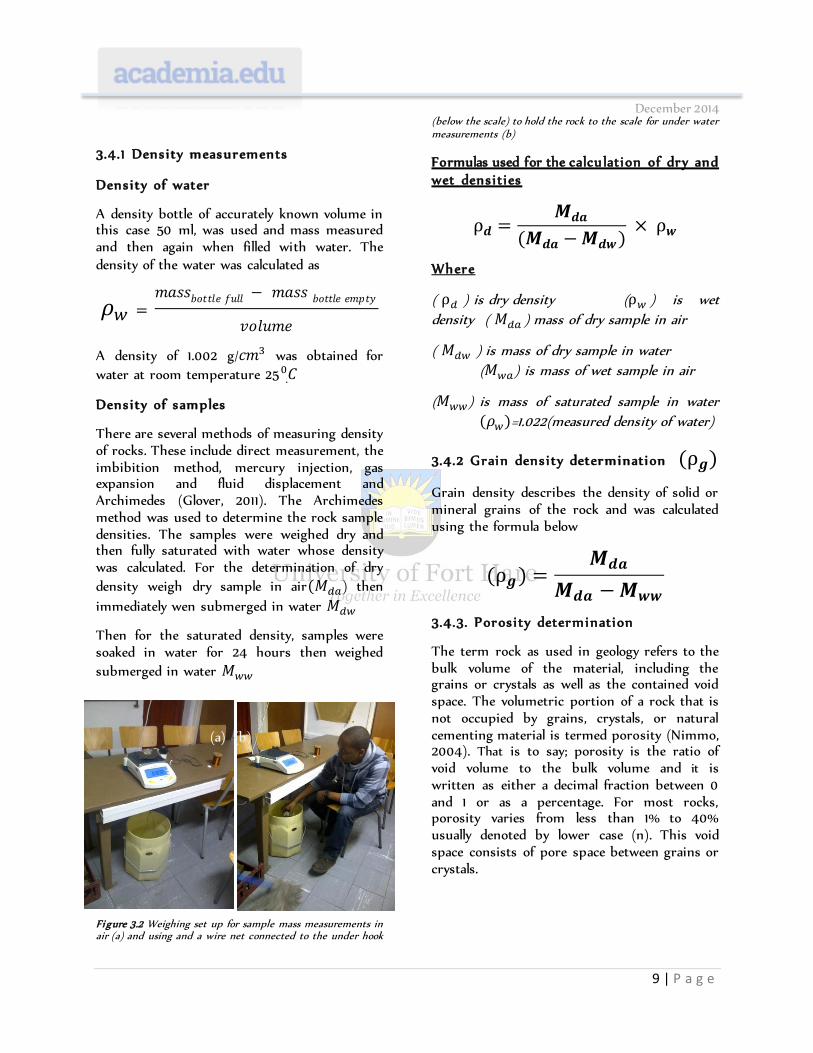
3.4.1 Density measurements
Density of water
A density bottle of accurately known volume in this case 50 ml, was used and mass measured and then again when filled with water. The density of the water was calculated as
A density of 1.002 g/ was obtained for
water at room temperature 25
Density of samples
There are several methods of measuring density of rocks. These include direct measurement, the imbibition method, mercury injection, gas expansion and fluid displacement and Archimedes (Glover, 2011). The Archimedes method was used to determine the rock sample densities. The samples were weighed dry and then fully saturated with water whose density was calculated. For the determination of dry
density weigh dry sample in air ) then
immediately wen submerged in water
Then for the saturated density, samples were soaked in water for 24 hours then weighed
submerged in water
(a) (b)
Figure 3.2 Weighing set up for sample mass measurements in air (a) and using and a wire net connected to the under hook
(below the scale) to hold the rock to the scale for under water measurements (b)
Formulas used for the calcu lation of dry and wet densities
Where
( ) is dry density ( ) is wet
density ( ) mass of dry sample in air
( ) is mass of dry sample in water
( ) is mass of wet sample in air
( ) is mass of saturated sample in water
=1.022(measured density of water)
3.4.2 Grain density determination
Grain density describes the density of solid or mineral grains of the rock and was calculated using the formula below
3.4.3. Poros ity determination
The term rock as used in geology refers to the bulk volume of the material, including the grains or crystals as well as the contained void space. The volumetric portion of a rock that is not occupied by grains, crystals, or natural cementing material is termed porosity (Nimmo, 2004). That is to say; porosity is the ratio of void volume to the bulk volume and it is written as either a decimal fraction between 0 and 1 or as a percentage. For most rocks, porosity varies from less than 1% to 40% usually denoted by lower case (n). This void space consists of pore space between grains or crystals.

December 2014
10 | P a g e
Figure 3.3 Example of pore spaces in sedimentary and crystalline igneous rocks to the left and to the right respectively
In sedimentary rocks as in the Karoo, the amount of pore space depends on the degree of compaction of the sediment (compaction generally increasing with depth of burial), on the packing arrangement and shape of grains, on the amount of cementation, and on the degree of sorting. Typical cements are siliceous, calcareous or carbonate, or iron-bearing minerals (Johnson, 2006).
The formula used in this study to calculate porosity is as expressed below
(
)
3.4.4 Saturated /wet density
The formula used to calculate wed density is as below
Thus clearly from this expression a relationship between these densities becomes apparent
And in a hypothetical situation were porosity were zero all these density values would be expected to be equal substitution 0 in the
formula for , = and with smaller values
of porosity these density values would approach each other to equality at zero.
3.4.5. Petrographic study
Preparation of thin sections thin involved in the initial stage smoking the glass slides with a very fine powder to try and flatten them out before gluing samples to them, the samples were first cut from original samples to manageable dimensions by a rock cutter then they were glued to glass slides for 48hours for glue to set. Then these samples were cut by same rock cutter to a thickness of around 4 millimetres before being taken to the grinder were thy were patiently ground to 3 microns were the sections could be analysed under a petrographic microscope taking care to capture the photomicrographs of pertinent characteristics
Figure 3.4 One the departments petrographic microscopes with a direct link to a computer via camera were all images produced were snapped and produce with a scale attached to each image.
December 2014
11 | P a g e
Laboratory Results
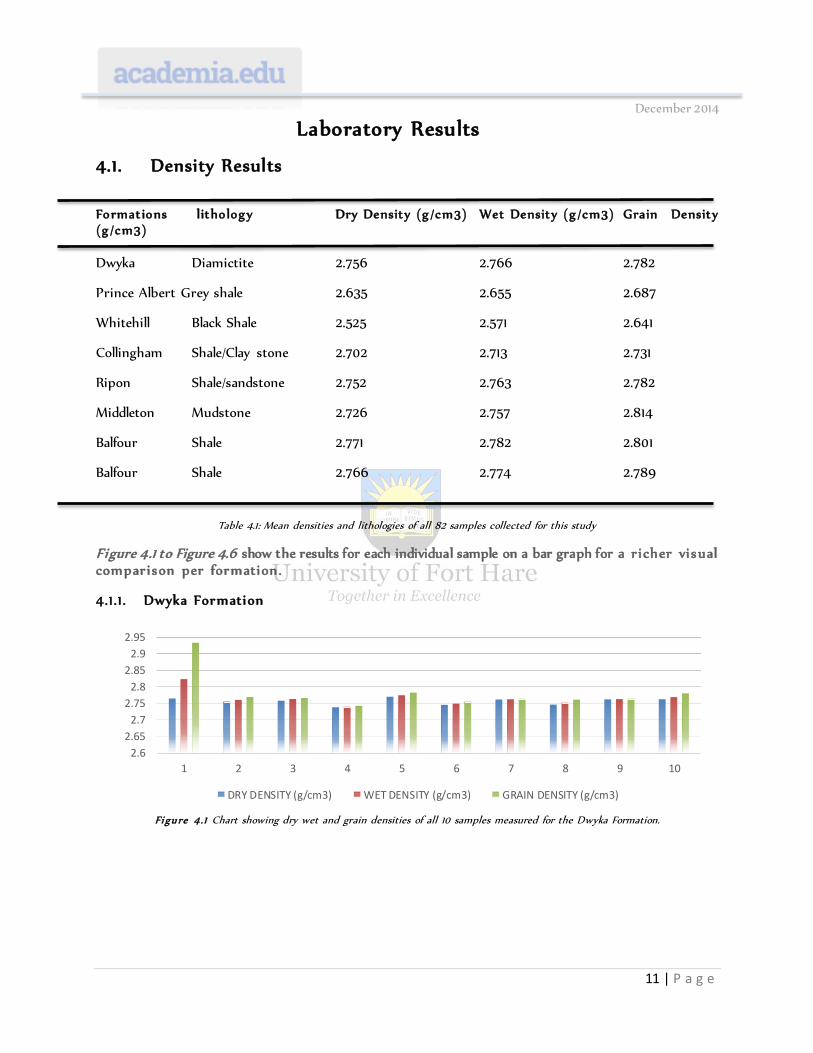
4.1. Density Results
Format ions lithology Dry Density (g/cm3) Wet Density (g/cm3) Grain Density (g/cm3) Dwyka Diamictite 2.756 2.766 2.782
Prince Albert Grey shale 2.635 2.655 2.687
Whitehill Black Shale 2.525 2.571 2.641
Collingham Shale/Clay stone 2.702 2.713 2.731
Ripon Shale/sandstone 2.752 2.763 2.782
Middleton Mudstone 2.726 2.757 2.814
Balfour Shale 2.771 2.782 2.801
Balfour Shale 2.766 2.774 2.789
Table 4.1: Mean densities and lithologies of all 82 samples collected for this study
Figure 4.1 to Figure 4.6 show the results for each individual sample on a bar graph for a r icher visual comparison per formation .
4.1.1 . Dwyka Formation
Figure 4.1 Chart showing dry wet and grain densities of all 10 samples measured for the Dwyka Formation.
2.6
2.65
2.7
2.75
2.8
2.85
2.9
2.95
1 2 3 4 5 6 7 8 9 10
DRY DENSITY (g/cm3) WET DENSITY (g/cm3) GRAIN DENSITY (g/cm3)

December 2014
12 | P a g e
4.1.2. Pr ince Albert Formation
Figure 4.2 Chart showing dry wet and grain densities of all 10 samples measured for the Prince Albert Formation
4.1.3. Whitehi ll Formation
Figure 4.3 Chart showing dry wet and grain densities of all 14 samples measured for the Whitehill Formation.
4.1.4. Collingham Formation
Figure 4.4 Chart showing dry wet and grain densities of all 10 samples measured for the Collingham Formation
2.5
2.55
2.6
2.65
2.7
2.75
1 2 3 4 5 6 7 8 9 10
2
2.2
2.4
2.6
2.8
1 2 3 4 5 6 7 8 9 10 11 12 13 14
DRY DENSITY (g/cm3) WET DENSITY (g/cm3) GRAIN DENSITY (g/cm3)
2.65
2.7
2.75
2.8
1 2 3 4 5 6 7 8 9 10
DRY DENSITY (g/cm3) WET DENSITY (g/cm3) GRAIN DENSITY (g/cm3)

December 2014
13 | P a g e
4.1.5. Ripon Formation
Figure 4.5 Chart showing dry wet and grain densities of all 10 samples measured for the Ripon Formation.
4.1.6 Middleton Formation
Figure 4.6 Chart showing dry wet and grain densities of all 6 samples measured for the Middleton Formation
Figure 4.7 Variation of dry density across the formation
The line graph (Figure 4.7) shows variation in dry densities with formation and reveals lowering trend in values as it moves from denser Dwyka diamictite to Prince Albert grey shale to the Whitehill black shale the least dense lithology in this study with a dry density of
2.526 g/c ,to denser Collingham fine grained shale then the trend more or less flattens out for the remaining lithologies that have roughly the same dry density.
2.6
2.65
2.7
2.75
2.8
2.85
1 2 3 4 5 6 7 8 9 10
DRY DENSITY (g/cm3) WET DENSITY (g/cm3) GRAIN DENSITY (g/cm3)
2.4
2.6
2.8
3
3.2
1 2 3 4 5 6
DRY DENSITY (g/cm3) WET DENSITY (g/cm3) GRAIN DENSITY (g/cm3)
2.756
2.636
2.526
2.702
2.753 2.727
2.771 2.766
DRY DENSITY (g/cm3)
December 2014
14 | P a g e
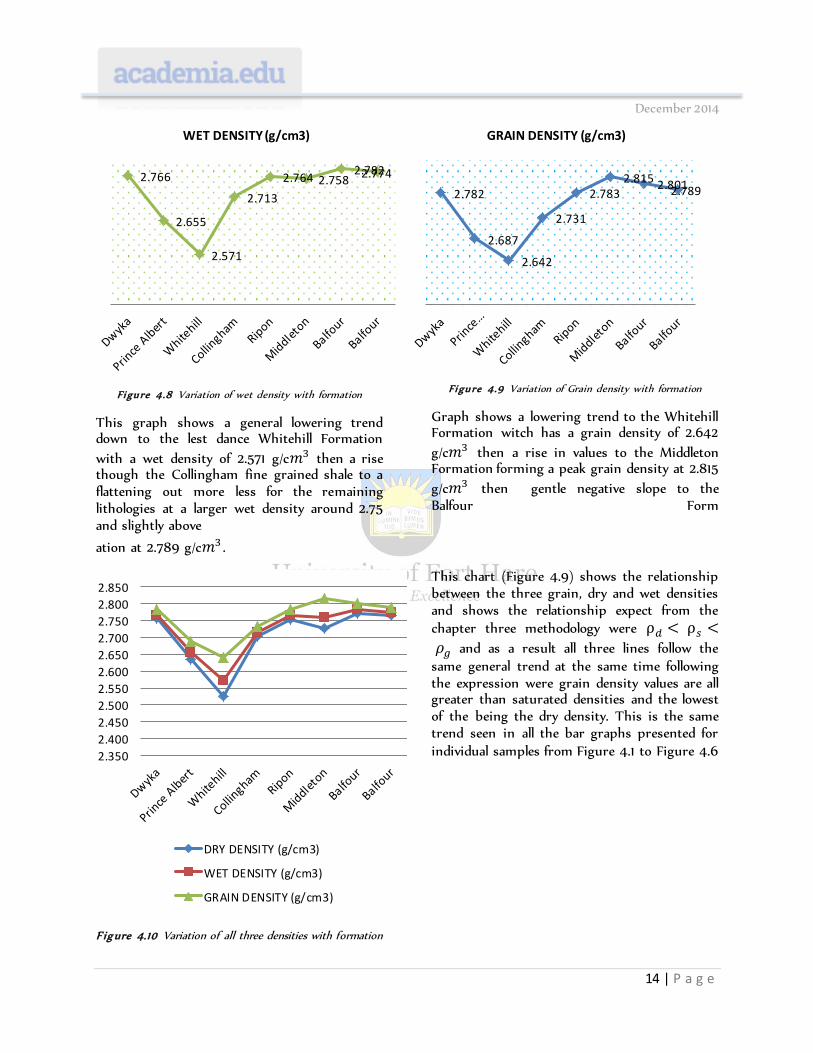
Figure 4.8 Variation of wet density with formation
This graph shows a general lowering trend down to the lest dance Whitehill Formation
with a wet density of 2.571 g/c then a rise though the Collingham fine grained shale to a flattening out more less for the remaining lithologies at a larger wet density around 2.75 and slightly above
Figure 4.9 Variation of Grain density with formation
Graph shows a lowering trend to the Whitehill Formation witch has a grain density of 2.642
g/c then a rise in values to the Middleton Formation forming a peak grain density at 2.815
g/c then gentle negative slope to the Balfour Form
ation at 2.789 g/c .
F igure 4.10 Variation of all three densities with formation
This chart (Figure 4.9) shows the relationship between the three grain, dry and wet densities and shows the relationship expect from the chapter three methodology were
and as a result all three lines follow the same general trend at the same time following the expression were grain density values are all greater than saturated densities and the lowest of the being the dry density. This is the same trend seen in all the bar graphs presented for individual samples from Figure 4.1 to Figure 4.6
2.766
2.655
2.571
2.713
2.764 2.758 2.782 2.774
WET DENSITY (g/cm3)
2.782
2.687
2.642
2.731
2.783 2.815 2.801 2.789
GRAIN DENSITY (g/cm3)
2.350
2.400
2.450
2.500
2.550
2.600
2.650
2.700
2.750
2.800
2.850
DRY DENSITY (g/cm3)
WET DENSITY (g/cm3)
GRAIN DENSITY (g/cm3)

December 2014
15 | P a g e
4.2 Porosity Results
Table 4.2 Mean porosities of all 82 samples collected for this study with respect to Formation
Formation Poros ity%
Dwyka 0.9
Ripon 1.1
Prince Albert 1.9
Middleton 3.0
Whitehill 4.4
Balfour 1.1
Collingham 1.1
Balfour 0.8
Figure 4.11 to Figure 4.15 show the results for each individual sample on a bar graph for a visual presentation.
4.2.1 Dwyka Formation
Figure 4.11 Chart showing the porosity distribution and variation of results for all 10 samples measured in the Dwyka Formation.
4.2.2 Pr ince Albert Formation
Figure 4.12 Chart showing the porosity distribution and variation of results for all 10 samples measured in the Prince Albert Formation.
4.2.3 Whitehi ll Formation
Figure 4.13 Chart showing the porosity distribution and variation of results for all 14 samples measured in the Whitehill Formation.
4.2.4 Collingham
Figure 4.14 Chart showing the porosity distribution and variation of results for all 10 samples measured in the Collingham Formation.
4.2.5 Ripon Formation
F igure 4.15 Chart showing the porosity distribution and variation of results for all 10 samples measured in the Ripon Formation.
0
2
4
6
8
1 2 3 4 5 6 7 8 9 10
Porosity (%) for the Dwyka Formation
0
2
4
1 2 3 4 5 6 7 8 9 10
Porosity (%) for the Prince Albert Formation
0
5
10
15
1 2 3 4 5 6 7 8 9 10 11 12 13 14
Porosity(%) for the whitehill Formation
0
1
2
1 2 3 4 5 6 7 8 9 10
Porosity (%) for the Collingham Formation
0
1
2
1 2 3 4 5 6 7 8 9 10
Porosity (%) for the Ripon Formation

December 2014
16 | P a g e
Figure 4.16 Variation of porosity with formation
This line graph shows the distribution of porosities and compared with figures 4.8, 4.9, 4.10 this appears as an inverted graph suggesting an inverse relationship between density and porosity, the Dwyka diamictites have very low porosity (impermeable) forming the beginning of an upward trend to the most porous formation in this study; the Whitehill Formation with a porosity of 4.46 % before a sudden drop with the relatively impermeable Collingham and Ripon Formations. The Middleton Formations porosity is 3.03 % forming the second most porous formation investigated in this study also confirming the inverse relation between the properties density and porosity displayed a bit more clearly in (Figure 4.7) for dry density where there is a significant drop in dry density in the Middleton Formation however not as sharp as in this graph but this is attributed to the differences in scale.
4.3 Petrology Results
4.3.1. Dwyka Formation
F igure 4.17 Thin section generated for the Dwyka Formation (scale 50µm).
Dwyka diamictite showing a semi prophairitic texture with a dominance of large quartz grains some microcline and calcite mineralogy as well is well exposed under the petrographic microscope.
4.3.2. Pr ince Albert Formation
Figure 4.18 Thin section generated for the Prince Albert Formation (scale 50µm).
Prince Albert Formation shale showing preferential fracture which may have been along or parallel to bedding planes and within some of this fractures is evidence of some quartz veins this rock is dominated by the mineral quartz in the form of veins, grains and some quartz overgrowth textures and also isophachious rims traces of muscovite can also
0.90
1.89
4.46
1.05 1.09
3.02
1.07 0.80
POROSITY(%)

December 2014
17 | P a g e
be readily observed under the petrographic microscope.
4.3.3. Whitehi ll Formation
Figure 4.19 Thin section generated for the Whitehill Formation (scale 50µm).
Whitehill Formation shale has a rather fine grained texture and not very easy to produce a thin section for the formation and the minerilzation is not all that clearly exposed by means of just thin section however a few features were noted in this section namely the obvious traces of pyrite some distinct sparite cement texture as well as some dark lump texture erratically distributed across this section.
4.3.4. Collingham Formation
Figure 4.20 Thin section generated for the Collingham Formation (scale 50µm).
Similar to the Whitehill Formation (Figure 4.19) thin section production for the Collingham Formation Shale is somewhat difficult and similarly mineralogy is not readily given away in thin section however some interesting features do stand out in this thin section mainly the oolitic texture some fracturering on this particular part of the section is also evident and some calcitic vain also noted.
4.3.5. Ripon Formation
Figure 4.21 Thin section generated for the Ripon Formation (scale 50µm).
The Ripon Formations sand stone (Figure 4.21) in thin section shows a relative abundance of quartz in comparison with other minerals , some microcline mineralization really stand out with that almost unmistakable twinning biotite and some feldspar can also be seen in this thin section

December 2014
18 | P a g e
R² = 0.685
0.00
2.00
4.00
6.00
2.500 2.600 2.700 2.800
Poro
sity
(%
)
Dry density g/cm3
R² = 0.5878
0.00
2.00
4.00
6.00
2.550 2.600 2.650 2.700 2.750 2.800
Poro
sity
(%
)
Saturated density g/cm3
R² = 0.3405
0.00
2.00
4.00
6.00
2.600 2.650 2.700 2.750 2.800 2.850
Poro
sity
(%
)
Grain density g/cm3
Discussion and Interpretation of Results
5.1 Density and porosity
Figure 5.1 Porosity and density variation across study formation
Superimposing the line graph produced for average porosities across all the formations in this study and a graph for density in this case that of average dry densities (all the density line graphs produced give a similar trend so any one would work as a representative of all densities ) to no accurate scale because the value ranges for each of the two properties density and porosity are too different to produce an accurate plot to scale.
An obvious apparent relationship can clearly be seen that porosity is inversely proportional to density, the plot for porosity is at an all-time low on the Dwyka Formation and inversely the density of plot is at an all-time high and the porosity is highest for the Whitehill Formation and again inversely the corresponding plot for the dry density is at an all-time low this relationship is consistent for the rest of the plots in this display.
a)
b)
c)
Figure 5 .2 Variation of average densities against average porosities for all the formations
This (Figure 5.2) shows employment statistical regression test results of the this study all producing positive R2 values meaning there a positive correlation between porosity and density ant the closer to 1 the results are the more accurate the model of correlation and the opposite true approaching zero is, in this case
is decreasing from see fig 5.2 a) from
0.685 to b) for saturated density = 0.5878
and lowest in c) grain density were =0.3405 showing a decrees in accuracy as u go down this chart and this may be attributed to inaccuracies in preceding calculations after determination of more accurate initial.
Dry density Porosity

December 2014
19 | P a g e
5.2 Magnetic results and interpretation
Figure 5.3 Magnetic map showing geologic formations (units)
Using pre-existing magnetic data that was supplied Professor Gwavava (my supervisor) in the form of a magnetic grid covering a much larger area than that of this study, using Geosoft Oasis Montaj I extracted my study area magnetic data and produced this map showing magnetic values in and around the study area.
Using an image of geologic map geologic features were digitizes to generate an overlay that reveals the distribution of some dolerite dykes to the northern part of the map and to the south some Berdasdrop lavas as well as the locations of the main town in the area. The area is not rich in deformation thus there are no faults mapped here. However a correlation between dolerite intrusions at the very top and magnetics can be clearly picked up with this overlay because however haphazard the magnetic distribution the dolerite clearly fall in to the same haphazard alignment.
Figure 5.4 Contoured magnetic map showing geologic structures
Improvement on map in (Figure 5.3) showing contours for the variation in magnetic values of the area high lighting the highest value in pink standing out as a bull’s eye anomaly, and the lowest values to the south east corner of the map. Further clarification of display of the correlation between the magnetics and the dolerite intrusions having given rise to a net drop in magnetic values in the vicinity of intrusion.

December 2014
20 | P a g e
Figure 5.5 Magnetic map showing geologic formations (units)
Another improvement on to (Figure 5.3) with the distribution of litho-stratigraphic units to the right of the map. Highest magnetic values can be noted mainly in the Ecca group, the Koonap lower parts of the Middleton formation. The introduction of litho-stratigraphic division also expose relationship between some of the dolerite dykes and the stratigraphic contact between the Balfour and Middleton Formations and the Middleton formation and the Koonap Formation , the relative alignment of the contacts and the dykes is too much for it to be a coincidence and agree with (Johnson 2006) who said that the dolerite were intrusions of a relatively much younger to orders of 100 Ma were as the units all are aged 222 Ma and above and intrusion occurred along the boundaries.
This map (Figure 5.5) also reveals that the intrusion on the top part of the map are all hosted in the Balfour Formation the youngest of all the units in this map suggesting that it was relatively less competent at time of intrusion thus the intrusion are only constricted to the weaker contacts with the relatively older units.
Figure 5.9 also shows the location of the profile lines AB and CD in yellow line AB that runs in a general trend NE as the road R67 were all the samples for this study were collected. Profile CD cuts across the Ecca group.
Figure 5.6 Profile for magnetic data along line AB
Profile for magnetic data along the yellow line AB in (Figure 5.5) . This profile reveals a peak in magnetic value while cutting that Ecca Group with pick being almost 11 nT for about 8 km. In general this group shows relatively higher magnetic values than other stratigraphic units.
Figure 5.7 Profile for magnetic data along line CD
Profile for magnetic data along the yellow line CD in (Figure 5.5). This profile reveals a generally high magnetic values across the Ecca group in the vicinity of the study area being over 16 nT and higher for the greater part of the profile with an all-time pick of about 73 nT.

December 2014
21 | P a g e
Gravity results and interpretation
Figure 5.8 Gravity map showing geologic structures
Using pre-existing gravity data that was also supplied Professor Gwavava (my supervisor) in the form of a gravity grid covering a slightly larger area than that of this study, using Geosoft Oasis Montaj I extracted the study area gravity data and produced this map showing gravity values in and around the study area.
Geologic features that were already digitized forming the overlay used in all the magnetic maps was also employed here to as well reveal the local geology to the same effect distribution. This is a map (Figure 5.8) shows some dolerite dykes to the northern part of the map and to the south some Burgersdorp lavas as well as the locations of the main town in the area are shown. This area is not rich in deformation thus there are no faults mapped here or other interesting geologic structures.
Figure 5.9 Contoured gravity map showing geologic structures
Shows contours super imposed on gravity colour map the contours highlight the high value in red standing out as a bull’s eye anomaly, and the lowest values to the NW corner of the map. A general trend from high gravity values to the low is in a SE to NE direction forming an almost diagonal trend with respect to this grid is clearly visible on the map.
Figure 5.10 Gravity map showing geologic formations (units)
Another improvement on (Figure 5.9) as it shows the location of the profile lines AB and

December 2014
22 | P a g e
CD in yellow and also shows the litho-stratigraphic units to the right of the map. Highest gravity values can be noted in the SE extent of the Witterburg Group and part of the Ecca Group with the same extent with respect to this particular grid. The introduction of litho-statgraphic division also reveals some relationship between some of the dolerite dykes and the stratigraphic contact between the Balfour and Middleton Formations and the Middleton Formation and the Koonap Formation, the relative alignment of the contacts and the dykes is no coincidence and agrees with (Johnson 2006) who confirmed the dolerite intrusions to be relatively much younger 100 Ma and units all are aged 222 Ma and older.
A net lowering of gravity values is associated with the intrusions in less the relatively less competent Belfour Formation especially the highlighted part circled in red, this correlation is so apparent.
Figure 5.11 Profile for magnetic data along line AB
Profile for gravity map along the yellow line AB see (Figure 5.10), a generally decreasing trend of gravity values along this profile without any significant anomaly to take not of how ever a few topographic variation at 20 m, 40 m and at 60 m can be seen in this profile
Figure 5.12 Profile for magnetic data along line CD
Profile for gravity map along the yellow line CD see (Figure 5.10), a generally incresse in trend of gravity values along this profile without any significant anomaly to take not of.
Conclusion
An apparent relationship between doleritic intrusions and both magnetic and gravity responses was noted especially in the less competent and younger Balfour Formation. Another relationship exists between the relatively weaker plane boundaries of the different lithological units as a result some dolerite was able to intrude through these planes.
The Ecca Group and parts of the Middleton formation have anomalously high magnetic values as revealed in profile AB, however a generally upward trending of gravity values in a SE direction probably to a peak outside the range if this study and all gravity maps produced during this study. Density values for all the samples produced behave as expected that is to say
With the average densities for all the Ecca Group Formations combined being 2.674
g/ 2.692 g/ and 2.731 g/ for dry, wet and grain densities respectively. Porosity results revelled that the Whitehill Formation is the most permeable with a porosity of 4.4 % followed by the Prince Albert Formation with a porosity of 1.9 % then the Collinham and Rippon Formations proved relatively impermeable both a with a porosities of only 1.1 %
A correlation between the properties porosity and grain density by regression gave a fairly high positive correlation suggesting that the results produced for this study were within reasonable and acceptable range of values one would expect wen carrying any similar study on all rock types analysed.

December 2014
23 | P a g e
References
Catuneanu O, Elango Henry N (2001) Tectonic control on fluvial styles: the Balfour Formation of the Karoo Basin, South Africa , Sedimentary Geology Volume 140
Catuneanu, O., Hancox, P. J. and Rubidge, B.S. (1998). Reciprocal flexural behaviour and contrasting stratigraphies: a new basin development model for the Karoo retroarc foreland system, South Africa. Basin Research, 417-439
Emese M. Bordy, Sean Linkermann, Rose Prevec 2011, Palaeoecological aspects of some invertebrate trace fossils from the mid- to Upper Permian Middleton Formation (Adelaide Subgroup, Beaufort Group, Karoo Supergroup), Eastern Cape, South Africa Journal of African Earth Sciences 61 (2011), fig 1p,239
Fildani, A., Weislogel, A., Drinkwater, N.J., McHargue, T., Tankard, A., Wooden, J., Hodgson, D., Flint, S., 2010, U-Pb zircon ages from the southwestern Karoo Basin, South Africa- Implications for the Permian- Triassic Boundary, The Geological Society of America, 719-722.
Halbich, I.W. (1983). A tectonogenesis of the Cape Fold Belt (CBF). Special Publication of Geological Society of South Africa, 12, 165-175
Johnson, M.R. (1976). Stratigraphy and Sedimentology of the Cape and Karoo sequences in the Eastern Cape Province, Ph.D. thesis (unpublished). University of Rhodes. 336.
Johnson, M.R., van Vuuren C.J., Visser, J.N.J., Cole, D.I., Wickens H. de V., Christie, A.D.M., Roberts, D.L and Brandl, G. (2006). Sedimentary Rocks of the Karoo Supergroup, 461-499.
Jones, T.R. (1867). On some secondary fossils from South Africa, Geological Society of London, 139-175. Nimmo, J.R., 2004, Porosity and Pore Size Distribution, in Hillel, D., ed. Encyclopedia of Soils in the
Environment: London, Elsevier, v. 3, p. 295-303 P, Glover.(2011), Formation Evaluation MSc Course Notes Porosity university of Wisconsin 2011 Rogers, A.W. (1903). Report of the acting geologist for the year 1902, Annual Report of the Geological
Commn, Cape of Good Hope, 3-10. Rossouw, P.J. (1953). General Geology: the southern Karoo in Results of an investigation into the possible
presence of oil in Karoo rocks in parts of the Union of South Africa, Memoirs of the Geological Survey of South Africa, 14-36.
S.A.C.S. (South African Commitee for Stratigraphy) (1980). Lithostratigraphy of the Republic of South Africa, South-West Africa/Namibia and the Republics of Bophuthatswana, Transkei and Venda (Kent, L.E. comp.). Handbook of the Geological Survey of South Africa, 6 ,3-90.
S.A.C.S (South African Committee for Stratigraphy) (1980). Stratigraphy of South Africa. Part 1 (Comp. L.E. Kent). Lithostratigraphy of the Republic of South Africa, South West Africa/Namibia, and the Republics of Bophuthatswana, Transkei and Venda: Handbook Geological Survey of South Africa 15-37.
Smith, R.M.H., Eriksson P.G. and Botha W.J. (1993), A review of the stratigraphy and sedimentary environments of the Karoo-aged basins of Southern Africa. Journal of African Sciences, 143-169.
Viljoen, J.H.A., (1994), Sedimentology of the Collingham Formation, Karoo Supergroup. South African Journal of Geology,167 -183.
Visser, J.N.J. (1984). A review of the Stormberg Group and Drakensberg volcanics in southern Africa. Palaeontolgia Africana, 5-27.
Copyright © 2022 FDOKUMEN