Reserve selection in the Succulent Karoo, South Africa: coping with high compositional turnover
21
Plant Ecology 142: 35–55, 1999. © 1999 Kluwer Academic Publishers. Printed in the Netherlands. 35 Biogeography Reserve selection in the Succulent Karoo, South Africa: coping with high compositional turnover A. T. Lombard 1,* , C. Hilton-Taylor 2 , A. G. Rebelo 2 , R. L. Pressey 3 & R. M. Cowling 1 1 Institute for Plant Conservation, University of Cape Town, Rondebosch, 7701, South Africa; 2 National Botan- ical Institute, Claremont, South Africa; 3 New South Wales National Parks and Wildlife Service, Australia ( * corresponding author) Received 2 November 1997; accepted in revised form 20 October 1998 Key words: Beta diversity, Bioregions, Endemism, Hotspots, Plant Diversity, Reserve design Abstract The Succulent Karoo biome is home to the world’s richest succulent flora. It has approximately 1954 endemic plant species, and is the only semi-arid region to qualify as a hotspot of global significance. Despite its importance, only 2% of the biome is currently protected. Based on its flora, the biome can be divided into 12 bioregions, reflecting its high compositional turnover in relation to environmental and geographical gradients. Only three of these bioregions (the Gariep Centre, the Namaqualand Rocky Hills and the Tanqua Karoo) contain National Parks, and three contain large (over 10 000 ha) provincial reserves (the Gariep Centre, the Namaqualand Rocky Hills and the Little Karoo). The current reserve system does little to conserve biodiversity, with only one reserve significantly conserving Red Data Book (RDB) plant diversity. Using a RDB plant species database of 3874 records at a quarter degree scale (QDS = 15 0 × 15 0 ), we used hotspot analyses and iterative reserve selection algorithms to identify possible locations for future reserves. The hotspot analysis and iterative analyses yielded similar results for the top 11 QDS, mainly due to very high local endemism. Also because of the local endemism and the high species turnover within the biome, the real-world iterative algorithm (starting with the seven already reserved QDS) selected a very large total number of QDS (59% of the total in the biome) to conserve all RDB species. As a possible alternative to conservation planning based on QDS, we also assessed priorities at the scale of bioregions, but showed that representation at this geographic level misses important areas defined at a finer scale. We suggest that if the objective is to maximise the retention of RDB species in the landscape (to pre-empt extinction by scheduling the allocation of limited conservation resources), at least the top 5% of QDS (n = 11) selected by the iterative procedure, and identified as the core conservation sequence by analysis of endemicity and threat, should be given priority for reservation. Less extensive and, in some cases, less formal conservation action can be applied to QDS later in the sequence, based on species-specific monitoring and action plans. Of the 11 core areas, four fall in a node centred on the Vanrhynsdorp Centre, two fall in a node centred on the Kamiesberg, and the remaining five are isolated. With existing reserves, the core areas capture 50% of the RDB flora in 8% of the biome. Introduction The Succulent Karoo biome of southern Africa ex- tends from southern Namibia (-26 ◦ 8 0 S, 14 ◦ 56 0 E), southwards along the western side of the South African escarpment to the eastern border of the West- ern Cape Province (-34 ◦ S, 23 ◦ 11 0 E) ( Figure 1). The biome is home to the world’s richest succulent flora (Van Jaarsveld 1987; Cowling et al. 1999), and the vegetation is dominated by dwarf, succulent shrubs, particularly members of the Mesembryanthemaceae (vygies) (Mesembryanthema, Aizoaceae sensu Bit- trich & Hartmann 1988), Euphorbiaceae (spurges) and Crassulaceae (stonecrops) (Hilton-Taylor 1996a; Hoffman 1996; Milton et al. 1997; Rutherford & Westfall 1986; Cowling et al. 1999). The Succulent
-
Upload
independent -
Category
Documents
-
view
1 -
download
0
Transcript of Reserve selection in the Succulent Karoo, South Africa: coping with high compositional turnover

Plant Ecology142: 35–55, 1999.© 1999Kluwer Academic Publishers. Printed in the Netherlands.
35
Biogeography
Reserve selection in the Succulent Karoo, South Africa: coping with highcompositional turnover
A. T. Lombard1,∗, C. Hilton-Taylor2, A. G. Rebelo2, R. L. Pressey3 & R. M. Cowling1
1Institute for Plant Conservation, University of Cape Town, Rondebosch, 7701, South Africa;2National Botan-ical Institute, Claremont, South Africa;3New South Wales National Parks and Wildlife Service, Australia(∗corresponding author)
Received 2 November 1997; accepted in revised form 20 October 1998
Key words:Beta diversity, Bioregions, Endemism, Hotspots, Plant Diversity, Reserve design
Abstract
The Succulent Karoo biome is home to the world’s richest succulent flora. It has approximately 1954 endemicplant species, and is the only semi-arid region to qualify as a hotspot of global significance. Despite its importance,only 2% of the biome is currently protected. Based on its flora, the biome can be divided into 12 bioregions,reflecting its high compositional turnover in relation to environmental and geographical gradients. Only threeof these bioregions (the Gariep Centre, the Namaqualand Rocky Hills and the Tanqua Karoo) contain NationalParks, and three contain large (over 10 000 ha) provincial reserves (the Gariep Centre, the Namaqualand RockyHills and the Little Karoo). The current reserve system does little to conserve biodiversity, with only one reservesignificantly conserving Red Data Book (RDB) plant diversity. Using a RDB plant species database of 3874 recordsat a quarter degree scale (QDS = 15′ × 15′), we used hotspot analyses and iterative reserve selection algorithmsto identify possible locations for future reserves. The hotspot analysis and iterative analyses yielded similar resultsfor the top 11 QDS, mainly due to very high local endemism. Also because of the local endemism and the highspecies turnover within the biome, the real-world iterative algorithm (starting with the seven already reservedQDS) selected a very large total number of QDS (59% of the total in the biome) to conserve all RDB species. As apossible alternative to conservation planning based on QDS, we also assessed priorities at the scale of bioregions,but showed that representation at this geographic level misses important areas defined at a finer scale. We suggestthat if the objective is to maximise the retention of RDB species in the landscape (to pre-empt extinction byscheduling the allocation of limited conservation resources), at least the top 5% of QDS (n = 11) selected by theiterative procedure, and identified as the core conservation sequence by analysis of endemicity and threat, shouldbe given priority for reservation. Less extensive and, in some cases, less formal conservation action can be appliedto QDS later in the sequence, based on species-specific monitoring and action plans. Of the 11 core areas, four fallin a node centred on the Vanrhynsdorp Centre, two fall in a node centred on the Kamiesberg, and the remainingfive are isolated. With existing reserves, the core areas capture 50% of the RDB flora in 8% of the biome.
Introduction
The Succulent Karoo biome of southern Africa ex-tends from southern Namibia (−26◦8′ S, 14◦56′ E),southwards along the western side of the SouthAfrican escarpment to the eastern border of the West-ern Cape Province (−34◦ S, 23◦11′ E) ( Figure 1). Thebiome is home to the world’s richest succulent flora
(Van Jaarsveld 1987; Cowling et al. 1999), and thevegetation is dominated by dwarf, succulent shrubs,particularly members of the Mesembryanthemaceae(vygies) (Mesembryanthema, AizoaceaesensuBit-trich & Hartmann 1988), Euphorbiaceae (spurges)and Crassulaceae (stonecrops) (Hilton-Taylor 1996a;Hoffman 1996; Milton et al. 1997; Rutherford &Westfall 1986; Cowling et al. 1999). The Succulent
36
Karoo also has an unusually large number of geo-phytes, including numerous endemics (Hilton-Taylor1996a). The richness of the Succulent Karoo floraat all spatial scales is exceptional when comparedwith regions having similar semi-arid environments(Cowling & Hilton-Taylor 1994; Cowling et al. 1998).The biome has more than 1954 endemic plant species(Hilton-Taylor 1996a) in an area of approximately122 645 km2, and ranks as the only semi-arid regionto qualify as a hot-spot of global significance (Cowling& Hilton-Taylor 1994).
There is little evidence to suggest that the massivediversification of the Succulent Karoo flora is the re-sult of an unusually long and stable history. Instead,it has been suggested that occasional drought in theSucculent Karoo prompted diversification by increas-ing generation turnover and population fragmentation(Cowling et al. 1998; Cowling & Hilton-Taylor inpress; Desmet & Cowling 1999; Jürgens et al. 1999).The explosive diversification within certain lineages(see Hilton-Taylor 1996a) has resulted in the fine scalediscrimination of habitats (mainly edaphic) and theexistence of many related species occurring in simi-lar habitats separated by a few to tens of kilometres(Cowling et al. 1998; Cowling & Hilton-Taylor inpress). This diversification has resulted not only invery high local (alpha) diversity but also exception-ally high compositional change along habitat gradients(beta diversity) (Cowling et al. 1989) and betweenenvironmentally similar sites along geographical gra-dients (gamma diversity) (Cowling & Hilton-Taylor inpress; Desmet & Cowling 1996).
The high species richness and unique global sta-tus of the biome require urgent conservation attention.The conservation status of the biome, however, is des-perately poor, and only 2% of the biome is formallyprotected by publicly-owned protected areas (Cowl-ing & Hilton-Taylor 1994; Rebelo 1997). Based onits flora, the Succulent Karoo can be divided into12 bioregions (Hilton-Taylor 1996a) (Figure 1), andthe National Parks and large reserves (over 10 000 ha)represent only four of these. Nationally protected ar-eas are in the Gariep Centre (Richtersveld NationalPark, a contractual park on the South African bor-der with Namibia along the Orange River), and theTanqua Karoo (Tankwa Karoo National Park). In theNamaqualand Rocky Hills, the private Skilpad Wild-flower Reserve is currently being expanded to forma National Park. The only large provincial reservesoccur in the Gariep Centre (Helskloof Nature Re-serve, the Namaqualand Rocky Hills (Goegap Nature
Reserve) and the Little Karoo (Anysberg Nature Re-serve). A number of smaller provincial, local authorityand private reserves occur within the Western Moun-tain Karoo, Bokkeveld/Olifants River/Biedou biore-gion, Worcester-Robertson Karoo and Little Karoo.Threats to the flora include overgrazing, mining, agri-culture and illegal plant collecting (Hilton-Taylor &Le Roux 1989; Hilton-Taylor 1994). The biome hasgood potential for the generation of income from eco-tourism, but this requires that its use be properlymanaged and that a representative reserve system beestablished (Hilton-Taylor & Le Roux 1989; Hoffman1996).
As a signatory to the Convention on Biological Di-versity (United Nations Conference on Environmentand Development, Rio de Janeiro, 1992), South Africais committed to adequate conservation of its excep-tionally high biodiversity. The Succulent Karoo hasbeen identified as one of the least conserved biomes inSouth Africa (Rebelo 1997), and the biome requiringthe largest proportion of additional reserves to protectits flora (Rebelo 1994). The objective of this paper is toidentify appropriate areas within the Succulent Karoofor inclusion into a reserve system that will representthe exceptional plant diversity, particularly Red DataBook taxa, of the biome. In addition to this goal ofrepresentation, we also wish to set goals for retentionby identifying which reserves are the most threatened,and therefore need to proclaimed first (Pressey et al.1996a; Pressey & Taffs, submitted). We also investi-gate the efficacy of using a bioregional approach onthe conservation requirements of the region.
Methods
Plant species database
A Red Data Book (RDB) plant species database col-lated by C. Hilton-Taylor (CHT), representing the851 species (and infraspecific taxa) within the Succu-lent Karoo considered to be globally threatened withextinction (Hilton-Taylor 1996b), was loaded into ageographic information system (GIS: ARC/INFO ver.6.1.1). Distribution data were at a quarter degree scale(QDS = 15′ × 15′). Any RDB plant species was con-sidered to fall within the biome if≥20% of the areaof a QDS in which it occurred fell within the biome.No attempt was made to derive exact co-ordinates foreach plant record, because exact localities were notavailable for all the data. All obvious distribution er-rors were corrected. Duplicate occurrences of species

37
Figure 1. Bioregions of the Succulent Karoo (modified after Hilton-Taylor 1996a). (Bok./Oli./Bied. = Bokkeveld/Olifants River/Biedou biore-gion; Nam. Rocky Hills = Namaqualand Rocky Hills; S. Namib Desert = Southern Namib Desert; Vanrhynsdorp = Vanrhynsdorp Centre, W-R.Karoo = Worcester-Robertson Karoo; W. Mtn Karoo = Western Mountain Karoo).
per QDS were ignored, and a presence-absence spa-tial database of species within QDS was compiled.The final plant database represented 1972 distribu-tion records of the 851 species. Although the databaserepresents only a small subset of the approximately5000 species found in the Succulent Karoo (Hilton-Taylor 1996a), it is referred to here as the total RDBdatabase, in order to distinguish it from subsets of thedatabase used in analyses. Each species was classifiedaccording to growth form (Table 1) and RDB status(Table 2). Two important growth forms were analysedfurther: a succulent database and a geophyte database,comprising all succulent (251 species) and geophytic(333 species) taxa, respectively.
In an attempt to delimit threats and areas wherethreats were greatest, a threatened database compris-ing only those 122 RDB species which are vulnerable,endangered or extinct was compiled (i.e., species with
a RDB score≥5, Table 2). By excluding naturallyrare species, this allowed the regional distribution ofanthropogenic threats to be approximated.
Two additional subsets, the biome and bioregionendemic databases, were delimited. The former com-prised the 685 species endemic to the Succulent Karoobiome, whereas the latter comprised the 428 speciesendemic to one of the 12 bioregions (Figure 1) withinthe Succulent Karoo, (i.e., species with≥90% oftheir records within the biome, or one bioregion, re-spectively). A record was considered to fall within abioregion if≥20% of the area of the QDS in which itoccurred fell within the bioregion. All 428 bioregionendemics were found to have 100% of their recordswithin one of the bioregions. This assessment over-estimated the number of bioregion endemics becauseit did not consider the distribution of these speciesoutside the Succulent Karoo biome. This was accept-

38
Table 1. Growth forms of the 851 Red DataBook plant species in the Succulent Karoobiome.
Growth form Number of species
Geophyte 333
Shrub (>1 m) 98
Shrublet (<1 m) 50
Annual 55
Forb (herb) 43
Graminoid 14
Pteridophyte 4
Vine/Climber 2
Tree 1
Succulents: (251)
Dwarf succulent 187
Succulent shrub 54
Succulent geophyte 4
Succulent tree 5
Succulent annual 1
Total (851)
Table 2. Red Data Book status of the 851 RDB plantspecies in the Succulent Karoo biome.
RDB status Number of species Score
Extinct 9 7
Endangered 22 6
Endangered/Vulnerable 2 6
Vulnerable 75 5
Vulnerable/Rare 14 5
Rare 458 4
Indeterminate 67 3
Insufficiently known 186 2
Not threatened 18 1
Total 851
able for the subsequent analyses because our goalwas to plan for the conservation of all the biome’sRDB species without assuming that widely distributedspecies would be conserved outside its boundaries.
Albers Equal Area projections were used for allpercentage area calculations.
Other digital data
A digital map of the Succulent Karoo bioregions wasprepared from a hard copy supplied by CHT, at a res-olution of 1:500 000 (see Figure 1). Some 220 QDS
occurred in the biome (of these 220 QDS, the totalRDB database represented 197 QDS).
Species richness per QDS
Using the total RDB database, the species richness ofeach QDS was calculated for all species; for succulentgrowth forms only; for geophytes only; and for thethreatened species database. Hotspots of richness werecalculated as the top 5% (n = 11) of the 220 QDSin the biome. For each of the subsets of data, if the11th QDS from the top fell within a group of QDSwith the same number of species, the entire group ofQDS was excluded from, or included as, hotspots, de-pending on which method gave a number of hotspotsclosest to 11. There were 11 total RDB and geophytehotspots, 10 succulent hotspots, and 13 threatenedspecies hotspots.
Threat values – species endemicity and vulnerabilityper QDS
All species were plotted in two-dimensional space,with a Y axis of species endemicity, and an X axis ofspecies vulnerability (cf., plots of irreplaceability vs.vulnerability to show priority land classes – Presseyet al. 1996a). Species endemicity was calculated byre-ranking the number of QDS in which a speciesoccurred (these ranged from 1 to 14), so that a single-QDS endemic scored 14 (390 species), and the mostwidespread species scored 1. These scores were thenconverted to percentages (so that species occurring in1, 8 or 14 QDS, for example, had species endemicitiesof 100%, 50% or 7%, respectively). Note that speciesendemicity was an overestimate for some species, be-cause their distributions outside of the biome werenot considered). Again, this overestimation was con-sidered acceptable for the same reason as previouslydescribed for the calculation of bioregion endemics.Species vulnerability was calculated by convertingRed Data Book scores (see Table 2) to percentages(7 = 100%, 1= 14.3%). For each species, a threatvalue was calculated by adding the species endemicityand vulnerability values. Threat values for QDS werecalculated as the sum of all species threat values forthose species in a QDS. Hotspots for threat values perQDS were defined as the top 11 QDS.
Reserve-selection algorithms
A species-based reserve-selection algorithm was runusing the computer program developed by Rebelo

39
and Siegfried (1992). This program uses a calcula-tion of summed rarity to select the minimum, or nearminimum (Underhill 1994) number of QDS that arerequired to represent at least one occurrence of eachplant species. The algorithm was run on two data sets.The first was the total RDB database (1972 records,851 species, 197 data-containing QDS). The resultsof this algorithm represent an ideal conservation sys-tem. The second data set excluded all those 80 speciesthat fall in the seven QDS that are currently con-served by publicly-owned protected areas. A QDS wasconsidered conserved if≥20% of its area fell withinprotected areas. This data set contained 1665 records,771 species, and 188 data-containing QDS. The resultsof this algorithm represent a real-world conservationsystem.
Threat prioritisation values for real-world algorithmresults
The reserve-selection algorithms described above aredesigned to accumulate species as fast as possibleand so represent them all in the smallest number ofQDS. The order in which QDS are incorporated intothe reserve system by the algorithm is based purelyon species presence in a QDS, and does not takethreats into account. We attempted to identify themost threatened QDS in the Succulent Karoo with thetwo methods previously described (i.e., the identifica-tion of threatened species hotspots; and hotspots forthreat values per QDS), but these two methods do notmaximise species accumulation. In an attempt to com-bine species accumulation (i.e., representation goals)with threat prioritisation (retention goals – Presseyet al. 1996a), we subjected all the QDS identifiedby the real-world algorithm to an endemicity andvulnerability analysis. Each QDS was plotted in two-dimensional space, with a Y axis of QDS endemicity,and an X axis of QDS vulnerability. Endemicity wasequal to the number of single-QDS endemics, andvulnerability was calculated as the sum of the RedData Book scores (Table 2) of only the 122 threatenedspecies (in contrast to RDB scores for all species in thecalculation of threat values, above). Values for eachaxis were converted to percentages, and the sums ofthe X and Y axes gave a threat prioritisation value forthe QDS identified by the real-world algorithm. Thetop 11 of these are referred to as ‘core’ QDS.
Bioregion analyses
In order to address a concern that species-level con-servation would not be possible, or would not ad-equately represent the bioregional diversity in thebiome, six bioregion-level analyses were also com-pleted. A species present in a QDS was assigned toa bioregion only if the bioregion covered an area of≥20% of the QDS. For each bioregion we calculatedthe number of all species (A1); the number of all suc-culent species (A2); the number of all geophytes (A3);the number of threatened species (A4); the numberof Succulent Karoo endemic species (A5); and thenumber of species endemic to the bioregion (A6). Foreach analysis, the bioregions were ranked from highestrichness (1) to lowest (12).
A scatter plot of endemicity and vulnerabilityfor the bioregions was also constructed (cf., Presseyet al. 1996a). Bioregion endemicity was calculatedas the number of species endemic to each bioregion(A6 above). Biome vulnerability was calculated as asummed score of four different threats as detailed inTable 3.
Results
Species richness per QDS
Hotspots of RDB species richness are distributedamong six of the 12 bioregions (Figure 2, Table 4).Namaqualand Rocky Hills has four of the 11 hotspots,with the Western Mountain Karoo and VanrhynsdorpCentre each having two hotspots. Hotspots are con-centrated along the margin of the north-south trend-ing Great Escarpment in the strongly winter-rainfallNamaqualand-Namib Domain of the Succulent Karoo(Jürgens 1991), a pattern that is unaffected by inclu-sion of all Karoo (both Nama and Succulent) RDBspecies (unpublished data). However, other than astrong association with upland, usually rocky habitats,there does not appear to be a strong relationship be-tween hotspot incidence and bioregion or vegetationtype (unpublished data).
Hotspots of succulent RDB species (Figure 3, Ta-ble 4) are confined to three bioregions: the GariepCentre has five of the 10 hotspots, the VanrhynsdorpCentre has three and Namaqualand Rocky Hills hastwo. The relationship between succulent richness andtotal RDB richness is not particularly strong (PearsonProduct Moment correlation,r = 0.66) and the twotypes of hotspots coincide in 40% of cases. However,

40
Table 3. Threats to the bioregions of the Succulent Karoo biome.
Bioregion Grazing Agriculture Mining Collecting Sum (= Vulnerability)
Bok/Oli/Bied 1 2 0 1 4
Gariep 2 1 1 2 6
Kamiesberg 2 2 0 1 5
Little Karoo 1 1 0 2 4
Nam. Rocky Hills 1 1 1 1 4
Roggeveld 1 1 0 2 4
S. Namib Desert 0 0 1 0 1
Sandveld 1 0 2 0 3
Tanqua Karoo 1 0 0 1 2
Vanrhynsdorp 1 0 2 2 5
W-R. Karoo 1 2 0 1 4
Grazing: 0 = minimal grazing impact, most of area reserved; 1 = moderate grazing impact, mostlycommercial grazing, very little communal grazing; 2 = lots of communal grazing, likely to expand.Agriculture: 0 = no irrigation farming, very limited dryland farming; 1 = moderate irrigation farming,limited dryland farming; 2 = moderate irrigation farming and/or moderate dryland farming. Mining:0 = no major minerals; 1 = minerals are present, but concentrated in limited areas; 2= mining overextensive areas, mainly diamonds and/or in alluvial marine terraces, or strip mining for gypsum andheavy metals or mining of particular minerals such as marble, limestone, kaolin, monazite (Hilton-Taylor 1994). Collecting: 0 = current impacts low; 1 = current impacts moderate; 2 = current impactshigh (where impact is some function of accessibility and high incidence of desirable species i.e.,minute succulents).
succulent hotspots are clustered around total RDBhotspots within the three bioregions (Figures 2 and 3).
Hotspots of geophyte RDB species occur in fivebioregions (Figure 4, Table 4). Namaqualand RockyHills has four of the 11 hotspots, and the Van-rhynsdorp Centre, Western Mountain Karoo andBokkeveld/Olifants River/Biedou bioregion each havetwo. The hotspots of geophytes and succulents co-incide only in the Namaqualand Rocky Hills andVanrhynsdorp Centre bioregions. There is a strong re-lationship (r = 0.94) between geophyte richness andtotal RDB richness, and this is reflected in the concor-dance of the two types of hotspots – nine of the 11 areshared.
Hotspots for threatened species (Vulnerable, En-dangered or Extinct RDB categories) are representedin two new bioregions: the Southern Namib Desertand the Little Karoo (Figure 5, Table 4). The GariepCentre has four of the 13 hotspots, and the Vanrhyns-dorp Centre has three. Some six hotspots are sharedwith succulents and total RDB species, and four withgeophytes, showing that succulents are generally morethreatened than geophytes. The relationship betweentotal RDB richness and threatened species richness isfairly strong (r = 0.79).
Hotspots for threat values per QDS are identical tothe total RDB hotspots (Table 4), reflecting a strong
correlation between QDS threat values and total RDBspecies richness (r > 0.99).
Reserve-selection algorithms
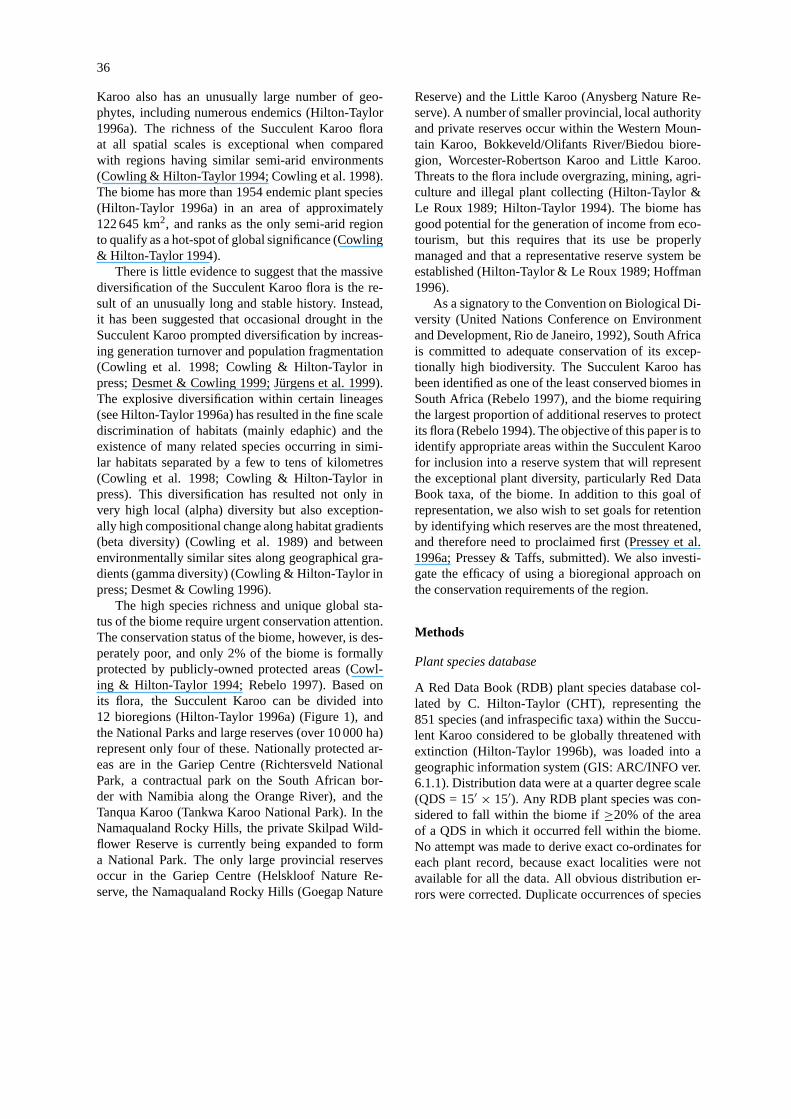
Owing to the high number of RDB species with lo-calised geographic distributions and the consequenthigh turnover of these species between QDS, the idealreserve-selection algorithm was forced to select a largenumber of QDS to represent each species at least once(Figure 6). To achieve the goal of adequately pre-serving all RDB species, some 127 of the 220 QDS(58%) will require a nature reserve or other effectiveconservation measure in some portion of the QDS.
If the seven currently reserved QDS are removedfrom the database, then the real-world algorithm re-quires a further 122 QDS to conserve all remainingspecies (Figure 7). The existing reserves thus do notcontribute much towards the goal of conserving allspecies (they contain only 80 species, or 9% of theRDB flora), whereas the top seven QDS of the idealalgorithm could conserve 314 species (or 37% of theRDB flora). No existing reserve occurs in a QDS con-taining more than five QDS endemics (Table 5), therebeing 9 QDS with more than five species confined toa single QDS. Despite the inadequacies of the existingreserves in representing the plant species data consid-

41
Table 4. The distribution of hotspots, the top 11 real-world and ideal QDS, and the 11 core QDS in the bioregions of the SucculentKaroo, as well as the percentage of each bioregion currently conserved by publicly-owned protected areas.
Bioregion 11 Top 11 Top 11 Total Succulent Geophyte Threatened Threat % Area
Core real-world ideal RDB hotspots hotspots species value conserved
QDS QDS QDS hotspots hotspots hotspots
Nam. Rocky Hills 2 2 2 4 2 4 1 4 0.8
W. Mtn Karoo 1 2 1 2 2 1 2 0.1
Bok./Oli./Bied. 1 2 2 1 2 1 1.9
Gariep 1 1 1 5 4 1 9.6
Vanrhynsdorp 3 2 2 2 3 2 3 2 0
Little Karoo 1 1 2 2 4–5
Sandveld 0
Kamiesberg 1 1 1 1 1 1 1 0
Tanqua Karoo 3.1
Roggeveld 0∗S. Namib Desert 1 0
W-R. Karoo 1 1 1.8
Total number 11 11 11 11 10 11 13 11
∗Reserves in Namibia not considered.
Table 5. The 129 QDS selected by the real-world algorithm (7 already reserved plus a further 122 se-lected), showing the number of RDB species endemic to each QDS and that would therefore go extinct ifa representative portion of that QDS were not conserved. Some 11 QDS are ‘flexible’ (Rebelo 1994): theyhave no single-QDS endemic species and can therefore be replaced by one or more other QDS withouta species going extinct. Also listed are the sequences of the top 11 QDS in order of selection by theideal iterative algorithm (Figure 6) and the real-world algorithm (Figure 7), and the core sequence of thereal-world results (Figure 8). The number of single-QDS endemic species in the seven existing reserveswhich form the starting point of the real-world algorithm (and included in the 129 QDS in the secondcolumn) is also shown.
Number of single-QDS Frequency of Ideal reserve Real-world Core QDS Existing
endemic species QDS (total=129) sequence sequence sequence reserves
41 1 1 1 1
22 1 2 2 2
19 1 3 3 3
10 1 4 5 7
7 4 5,6,9,10 4,6,7,8 4,5,8,10
6 1 10 11
5 9 8,11 9 9 1
4 20 7 11 6 1
3 20 1
2 19 1
1 41 1
0 11 2

42
Figure 2. Species richness, per quarter-degree square (QDS), of 851 Red Data Book plant species in the Succulent Karoo. The top 5% QDS(n = 11), or hotspots, are shown in black.
ered here, they are either National Parks or provincialreserves and their deproclamation is unlikely.
In order to compare the species accumulation be-tween the hotspot and algorithm analyses, the top 5%(n = 11) of the 220 QDS in the biome were selectedfrom the algorithms’ results (because hotspots weredefined in the same way). The top 11 QDS identifiedby both iterative algorithms share 73% of the QDSwith the total RDB hotspot analysis, 27–36% withthe succulent hotspot analysis, and 55–64% with thegeophyte hotspot analysis (Table 6). Interestingly, the11 hotspots of RDB species richness contain almost asmany species (n = 372) as the top 11 ideal reserves(n = 391 species). The top 11 real-world reservesplus the seven QDS with existing reserves contain440 species (52% of the RDB flora).
Table 4 shows how the top 11 QDS identified byboth iterative algorithms are distributed among eightof the bioregions. Both algorithms identify two QDSin each of the Namaqualand Rocky Hills, Vanrhyns-dorp Centre and Bokkeveld/Olifants River/Biedoubioregions.
Threat prioritisation values for real-world algorithmresults
The 122 cells identified by the real-world algorithm,prioritised according to threats, are shown in Figure 8.These results attempt to combine goals of represen-tation (i.e., represent all species in a reserve system),with goals of retention (i.e., proclaim reserves in themost threatened areas first to minimise the extent to

43
Figure 3. Species richness, per quarter-degree square (QDS), of 251 Red Data Book succulent species in the Succulent Karoo. The top 5%QDS (n = 10), or hotspots, are shown in black.
which the representation goal will be pre-empted byloss or degradation of habitat). Table 6 shows that thetop 11 QDS prioritised with this method, and definedhere as the core QDS required for the reserve system,coincide with nine of the top 11 real-world QDS. Theremaining two core QDS are ranked 15 and 18 in thereal-world reserve sequence.
The 11 core QDS share 73% of the QDS withthe total RDB hotspot analysis, the threatened speciesanalysis and the threat value analysis, 36% with thesucculent hotspot analysis, and 55% with the geophytehotspot analysis (Table 6). These core QDS plus theseven QDS with existing reserves contain 426 species(50% of the RDB flora).
Table 4 shows how the 11 core QDS are distributedamong eight of the bioregions. Three are found in theVanrhynsdorp Centre, with two in the NamaqualandRocky Hills.
Bioregion analyses
In the six bioregion analyses, no two analyses pro-duce the same ranks, but there is consistency in thetop ranking bioregions for all analyses (Table 7). TheNamaqualand Rocky Hills and the Gariep Centre fallwithin the top five ranks in all six analyses. TheBokkeveld/Olifants River/Biedou bioregion and theVanrhynsdorp Centre fall within the top five ranks forfive of the analyses, and the Western Mountain Karoo

44
Table 6. The coincidence between hotspots, the top 11 QDS identified by the ideal and real-world iterative algorithms, and the 11core QDS. The number of single-QDS endemic species is also shown. Numbers in parentheses are the ranks, above 11, of QDS inthe first four columns.
QDS Core Real-world Ideal Total Succulent Geophyte Threatened Threat No. of
QDS reserve reserve RDB hotspot hotspot species value QDS-
sequence sequence sequence hotspot rank rank hotspot hotspot endemic
rank rank rank species
3119AC 1 1 1 1 1 1 1 41
3018AC 2 2 2 2 2 5 2 22
3118DC 3 3 3 3 3 3 19
3118AB 4 4 5 6 3 10 3 6 7
3118BC 5 8 10 10 2 3 8 7
2816BD 6 (15) 7 7 1 2 7 4
2917BA 7 5 4 4 4 4 8 5 10
3321DA 8 6 6 (23) 6 7
3118CB 9 (18) (19) (31) 8 5
3017BB 10 7 9 4 5 4 7
3320CC 11 10 (12) (32) 6
3218BB (20) 9 11 (12) 5
3119BD (28) 11 (13) 8 6 9 4
2917DA (34) (13) (14) 11 8 11 4
2917DB (40) (30) (32) 8 6 10 4
Table 7. Alternative rankings of the 12 bioregions of the Succulent Karoo based on various considerations of Red Data Book (RDB) plantspecies: A1: total number of RDB species (n = 851); A2: total number of RDB succulent species (n = 251); A3: number of RDB geophytespecies (n = 333); A4: number of threatened RDB species (n = 122); A5: number of RDB species confined to the Succulent Karoo(n = 685); and, A6: number of RDB species confined to the bioregion (n = 428). Ranks from the bioregion endemicity / vulnerabilityanalysis in Figure 9 are listed.
Sum End/Vul
Bioregion A1 Rank A2 Rank A3 Rank A4 Rank A5 Rank A6 Rank Ranks Rank
Nam. Rocky Hills 227 1 66 2 99 2 23 3 205 1 55 3 12 3
Gariep 169 4 75 1 70 4 22 4 138 4 70 2 19 1
Bok./Oli./Bied. 192 3 25 7 99 2 32 1 167 2 38 4 19 5
W. Mtn Karoo 201 2 28 6 102 1 27 2 162 3 27 6 20 7
Vanrhynsdorp 133 5 50 3 61 5 19 7 116 5 34 5 30 4
Little Karoo 124 6 42 4 24 9 20 5 68 8 94 1 33 2
Sandveld 108 7 42 4 41 6 20 5 94 6 24 7 35 10
Kamiesberg 92 8 8 12 41 6 10 9 82 7 22 9 51 6
Tanqua Karoo 78 9 20 8 34 8 9 10 48 9 16 10 54 11
S. Namib Desert 52 11 20 8 21 11 11 8 42 10 13 11 59 12
W-R. Karoo 34 12 15 10 10 12 9 10 12 12 23 8 64 9
Roggeveld 57 10 11 11 24 9 4 12 29 11 12 12 65 8

45
Figure 4. Species richness, per quarter-degree square (QDS), of 333 Red Data Book geophyte species in the Succulent Karoo. The top 5%QDS (n = 11), or hotspots, are shown in black.
falls within the top five ranks for four of the analyses.The Little Karoo and the Sandveld fall within theseranks for three and two of the analyses, respectively.The bioregions with the lowest RDB species richnessin most analyses were the Southern Namib Desert,the Worcester-Robertson Karoo and the Roggeveld.The ranked results of the analysis of RDB succulentspecies is the most different from the other analyses.
As reported in the methods, bioregion endemicswere determined by ignoring species distributions out-side of the Succulent Karoo. If these data are notignored, the ranked results in Table 7 change veryslightly and do not affect any conclusions drawn (theranks of the top seven bioregions in column A6 re-main unchanged, and in the Sum Ranks column, thebioregions ranked 11 and 12 are swapped).
A scatter plot of bioregion endemicity/vulnerability(Figure 9) gives a different pattern. The most vulner-able bioregion is the Gariep Centre, with the Van-rhynsdorp Centre and Kamiesberg next in line (and seeTable 3). In terms of bioregion endemicity the LittleKaroo and Gariep Centre are the most important. As-suming that a combination of the two indices shouldbe considered in setting up conservation priorities atthe scale of bioregions, the top conservation prioritieswould be the Gariep Centre, followed by the Little Ka-roo, the Namaqualand Rocky Hills, the VanrhynsdorpCentre, and then the Bokkeveld/Olifants River/Biedoubioregion. The main difference between this analysisand the six bioregion analyses in Table 7 is that theLittle Karoo replaces the Western Mountain Karoo inthe top five ranks.

46
Table 8. Centres of faunal importance in the Succulent Karoo biome.
Bioregion/Biome Area Taxon Description Reference
Succulent Karoo Richtersveld and south frogs Two Succulent Karoo en-demics
Drinkrow and Cherry(1995); Passmore &Carruthers (1995)
Succulent Karoo snakes Two Succulent Karoo en-demics
Vernon (in press)
Succulent Karoo tortoises Two Succulent Karoo nearendemic subspecies
Branch et al. (1995)
Centre (a)
Gariep Centre and South-ern Namib Desert
Lower reaches of the Or-ange River
freshwater fish Three South African en-demic, Red Data Bookspecies
Skelton et al. (1995)
Gariep Centre Between Augrabies Fallsand the Richtersveld
frogs One bioregion endemic Passmore & Carruthers(1995)
Namaqualand Mountainous areas northof the Vanrhynsdorp Cen-tre, to south of the OrangeRiver
frogs One Namaqualandendemic
Drinkrow and Cherry(1995)
Gariep Centre snakes One bioregion endemic Lombard et al. (1995)Northern Succulent Karoo Junction of Southern
Namib Desert, GariepCentre, Sandveld andthe Namaqualand RockyHills
snakes One Succulent Karoo en-demic
Lombard et al. (1995)
Gariep Centre and South-ern Namib Desert
tortoises One bioregion endemic Branch et al. (1995)
Northern Succulent Karoo Northern Succulent Karooand southern Namibia
tortoises One Succulent Karoo en-demic subspecies
Branch et al. (1995)
Gariep Centre and South-ern Namib Desert
birds One bioregion endemic Harrison et al. (1997)
Centre (b)
Sandveld Sandy coastal dune belt frogs One bioregion, Red DataBook endemic
Drinkrow and Cherry(1995)
Southern Namib Desertand northern Sandveld
Coastal sand dunes of theSouthern Namib Desertand northern Sandveld
snakes One bioregion, Red DataBook endemic
Lombard et al. (1995)
Succulent Karoo Coastal Succulent Karoo lizards 30 Succulent Karoo en-demics (18 have rangeswhich overlap with theGariep Centre)
Vernon (in press)
Sandveld birds The most important areawithin the Succulent Ka-roo for the future conser-vation of Karoo endemicand southern African en-demic bird species
Dean (1995)
Succulent Karoo Mainly the coastal dunesof the Sandveld
birds One Succulent Karoo nearendemic
Harrison et al. (1997)
Succulent Karoo Mainly the sandy plains ofthe Sandveld
mammals Three bioregion near en-demics
Gelderblom et al. (1995);Mugo et al. (1995)
Centre (c)
Bokkeveld/OlifantsRiver/Biedou
Olifants River - butmainly in Fynbos Biome
freshwater fish pre-eminent hotspot ofendemic and threatenedfreshwater fish richness inSouth Africa
Skelton et al. (1995)
Bokkeveld/OlifantsRiver/Biedou
mammals Centre of endemism Gelderblom & Bronner(1995)
Centre (d)
Little Karoo mammals Centre of endemic RDBspecies
Gelderblom & Bronner(1995)

47
Figure 5. Species richness, per quarter-degree square (QDS), of 122 threatened Red Data Book species (i.e., with a status of extinct, endangeredor vulnerable) in the Succulent Karoo. The top 5% QDS (n = 13), or hotspots, are shown in black.
Data for the fauna are presented in Table 8. Firstly,it is obvious that animals do not conform to the biore-gions identified using the flora. Rather, there is anorthern Succulent Karoo centre (a) comprising theGariep Centre, Southern Namib Desert, NamaqualandRocky Hills and northern Sandveld (see Figure 1), anda coastal centre (b) comprising mainly the Sandveldbioregion. Two smaller centres of importance oc-cur in the Bokkeveld/Olifants River/Biedou bioregion(c) and the Little Karoo (d).
Discussion
Comparison of different prioritisation methods
(i) Hotspots vs iterative proceduresOne of the distinctive features of our results is the con-cordance of the highest ranking QDS between some ofthe hotspot analyses, the ideal and real-world iterativeprocedures, and the identification of core conservationareas from the real-world selections (Tables 5 and 6).This is not surprising, given the strong influence ofspecies richness on the hotspot indices and, throughthe match between high richness and concentrationsof single-cell endemics, on the selection sequence ofthe iterative algorithms and the endemicity and vul-
48
Figure 6. The ideal scenario for a reserve configuration to represent all 851 Red Data Book species in the Succulent Karoo in at least onequarter-degree square (QDS). Numbers (1–127) are the sequence in which QDS were selected. The top 11 QDS have bold borders. The existingconserved QDS are shaded.
nerability scores used to identify core conservationareas.
Other studies have shown that setting conservationpriorities in relation to ‘hotspots’ of species richnessis inefficient and wasteful of limited conservation re-sources (Rebelo 1994; Lombard 1995; Williams et al.1996). The most important reason for this inefficiencyis that hotspots do not apply complementarity (Lom-bard 1995; Prendergast et al. 1993; Pressey & Nicholls1989). Even as a first iteration they can be misleading,potentially identifying areas with many species, but oflittle conservation value (Rebelo 1994). Our analysesshow that a hotspot analysis using localised endemicand threatened species (Red Data Book species) canyield relatively efficient results – 73% of total RDBhotspots and core iterative reserves coincide and to-
tal RDB hotspots contain 44% of all RDB species,whereas the equivalent number of ideal reserves con-tain 46% of all species. Richness hotspots in areasof high local endemism therefore incorporate comple-mentarity by default. Nevertheless, the efficiency ofhotspots in the Succulent Karoo should not be takenas an endorsement of scoring approaches that do notidentify complementary areas, even for regions withhigh local endemism. The total number of reservesrequired to represent all remaining species – those out-side the top 5% of QDS in terms of RDB richness – islikely to differ greatly between hotspots and iterativemethods because of the large number of QDS with rel-atively low species richness, relatively few single-cellendemics, and very similar sets of species.

49
Figure 7. The real-world scenario for a reserve configuration to represent all 851 Red Data Book species in the Succulent Karoo in at leastone quarter-degree square (QDS). Numbers (1–122) are the sequence in which QDS were selected, in addition to the existing reserved QDS(shaded). The top 11 QDS have bold borders.
Iterative analyses are being increasingly used inconservation planning to avoid the inefficiency of rich-ness hotspots in identifying priority areas (Bedwardet al. 1992; Kirkpatrick 1983; Margules et al. 1988;Nicholls & Margules 1993; Pressey et al. 1993; 1997;Willis et al. 1996). The importance of these algo-rithms is the rapidity with which different scenarios(conservation goals, potential compromises and costs,and new data) can be modelled to provide an inter-active planning tool for which all the choices can berationally justified.
(ii) Iterative analyses vsad hocreservationIterative algorithms have been used to demonstrate notonly the lack of efficiency of hotspots (Rebelo 1994;Lombard 1995; Williams et al. 1996) but also of many
existing reserve systems. In this study, 127 QDS wereselected in the ideal reserve sequence compared to 129(seven existing reserves plus a further 122 QDS) in thereal-world sequence. This adds to the number of stud-ies that have shown existing,ad hocreserves to makerepresentation goals more expensive in terms of thenumber or total extent of required areas (see Presseyet al. 1996b for review).
The Tanqua Karoo National Park does not containa single local endemic plant or animal species. Boththe South African National Parks and Cape NatureConservation vied for the proclamation of reserves inthe Richtersveld, but plant species were not a ma-jor consideration – scenic splendour and cheap landwere the primary concerns. The only nature reserveto contribute significantly to the conservation of plant

50
Figure 8. The real-world scenario for a reserve configuration to represent all 851 Red Data Book species in the Succulent Karoo in at least onequarter-degree square (QDS). Numbers (1–122) are threat prioritisation values (see text) recognising the existing reserved QDS (shaded). Thetop 11 QDS, mooted as core conservation areas, have bold borders.
biodiversity in the region, the Anysberg Nature Re-serve, owes its efficacy not to its original location (asa reserve for Mountain Fynbos), but to land that hassince been acquired in an effort to preserve rare plantspecies found on adjacent lands. All the remainingexisting reserves are characterised by their occurringin QDS which have very few local endemic plantspecies (Table 5). The Southern Namib Desert andSandveld bioregions have no QDS ranked in the top26 of the priority sequence based on endemicity andvulnerability (Figure 8). Nevertheless, negotiations areunderway to proclaim a national park between theGroen and Spoeg Rivers in the Sandveld bioregion(but note this is a priority for marine conservation) andthe Southern Namib Desert ranks high on the shoppinglist of conservationists because of its stark scenery,
unusual landscapes and low land costs (Maggs et al.in press). With about 660 species, 68 of which areendemic (Williamson 1997), there are few threatenedspecies in the bioregion, because of the high levelof security in the diamond-mining area, or Sperrge-biet, and the very few coastal species that have beenaffected by the mining activities. While the acquisi-tion of reserves in this bioregion is compatible withsome conservation ideals and goals, it cannot be jus-tified in terms of our RDB analyses (but see belowunder Future assessments of conservation priority inthe Succulent Karoo).

51
Figure 9. The relationship between endemicity and vulnerability of the bioregions of the Succulent Karoo, based on the Red Data Book (RDB)plant species. Bioregions in the upper right corner are most in need of conservation action based on these indices.
(iii) Bioregions vs iterative procedures applied toQDSUsing bioregions or other extensive regional classifi-cations as a basis for assigning conservation priorities(e.g., Thackway & Cresswell 1997; Olson & Diner-stein 1998; Mittermeier et al. 1998) can be problem-atic, primarily because regions are very heterogeneouswith respect to biodiversity values and threats. Theuse of very coarse-scale planning units such as regionscan allow many important finer-scale areas to go unno-ticed. For example, the Worcester–Robertson Karoo, avery low-ranking bioregion in terms of endemicity andvulnerability (Table 7) contains a core QDS (Figure 8)while the highest ranking bioregion (Gariep – Table 7)contains many QDS with very low priority (Figure 8).Had our goals been to represent all bioregions in thefirst place, then areas with little urgent conservationsignificance based on plant RDB species (Sandveld,Tanqua Karoo, Roggeveld and Southern Namib Desert– Table 4, Figure 8), would have assumed a far higherimportance. Even if this had been realistic, whereshould new conservation areas have been placed inthese regions? Any of the bioregions in the Succu-lent Karoo could have its reserved extent increasedmarkedly while still failing to protect priorities at thelevel of QDS (Figure 8). Similarly, the endemicity-vulnerability analysis of bioregions (Figure 9, Table 7)rates the Gariep Centre and Little Karoo as the mostimportant, but this is difficult to reconcile with their
extensive reservation (Table 4) without information onthe relationship between the reserves and concentra-tions of narrow endemics imminently threatened bythe processes used to rate regional vulnerability.
These problems indicate that analyses of the rela-tive conservation priority of whole regions, while theycan provide a broad context for conservation assess-ments of biomes, countries or continents, must besupplemented by analyses of priority at a finer scalewherever possible if new conservation areas are to beeffectivity placed in the landscape.
Unfortunately, most of our data on animal speciesfor the Succulent Karoo are at the bioregional level(Table 8). While this highlights the discordance of cen-tres of importance for animals and plants it provideslittle basis for conservation planning at a fine scale.Invertebrate species were not considered here, becausethe distribution patterns of most invertebrates studiedso far match components of the flora (Vernon in press).
Conservation priorities based on RDB plant species
The Succulent Karoo RDB database is characterisedby its high local endemicity (46% of the species aresingle-QDS endemics) and the extraordinary congru-ence of these species (9 QDS have 32% of the QDS en-demics). On a QDS basis, the 10% level of biome pro-tection recommended by the IUCN (McNeely 1993),will conserve only 62% of the flora. Clearly, adequateconservation of the flora of the biome will require a

52
much greater effort than international standards moot,because up to 50% of its area may be needed. Rebelo(1994) did a subcontinent-wide analysis of conserva-tion requirements for conserving all plant species. TheSucculent Karoo biome required the second highestproportion of QDS to conserve all taxa (80% vs. 98%for the Fynbos biome). Given that many QDS requireonly a small proportion of their 68 000 ha to protectthe species for which they are important, a smaller to-tal extent of conservation areas may be required thansuggested by the overall percentage of QDS selectedby an iterative algorithm. Nevertheless, the efficientconservation of the flora of the Succulent Karoo can-not practically be achieved in a formal conservationsystem. Rather, a central core of major conservationareas is required, surrounded by a scattering of manysmaller reserves (both formal and informal) and with aprerequisite level of conservation in the extensive partsof the unreserved matrix. The smaller reserves can bedesigned around their rare target species and localisedhabitats, with management and resources geared to-wards their preservation. This means that they can beproclaimedad hoc, as and when (and if) the need forformal conservation arises. What is required in theinterim is a low level of monitoring and an administra-tive framework for rapidly reacting to, and preferablypre-empting, local threats.
Although iterative algorithms efficiently satisfyrepresentation goals, they frequently ignore retentiongoals (i.e., threats are not considered in schedulingconservation action – Pressey et al. 1996; Pressey &Taffs submitted). By prioritising the QDS chosen bythe real-world algorithm on the basis of endemicityand threats, we have attempted to combine representa-tion and retention goals in the definition of core areasfor a reserve system. We propose that the most urgentconservation priorities need to fall into two groups.Firstly, the threats to the proposed core conservationareas need to be dealt with as soon as possible ona land acquisition basis. Secondly, the non-core ar-eas (ranked 12–121, Figure 8) need to be dealt withon a species-specific basis, unless there is local con-cordance in a QDS of threatened species, in whichcase their shared habitats should be the priority forconservation actions.
As the implementation of conservation action pro-ceeds in core and non-core QDS, the need to maximisethe complementarity of conserved areas will requiresome reassessment of priorities. There are two ways inwhich this will happen. First, should one of the QDSin the real-world set not be available for conservation
(and feasible alternative conservation measures not beapplicable), it is highly likely that an adjacent QDSwould be the most suitable replacement rather thana QDS lower in the ranking. In this event, the real-world iterative analysis and subsequent prioritisationfor retention based on endemicity and threats shouldbe repeated, taking account of any new areas added tothe conservation system and excluding the unavailablearea(s). A second issue is that, even if the iterativeanalysis is unchanged, the prioritisation for retentionwill need to be recalculated each time an area is giveneffective conservation action. With a conservation tar-get of one occurrence of each RDB plant species, thepositions of unconserved QDS on the vulnerabilityaxis used in the prioritisation will change if they con-tain any of the 122 threatened species present in theconserved QDS, requiring those species to be removedfrom their vulnerability calculations. Even so, with adatabase characterised by high local endemism, we donot expect many changes to the priority sequence asconservation proceeds.
Future assessments of conservation priorities in theSucculent Karoo
Realistically, any assessment of regional conservationpriorities should be seen as somewhat fluid for reasonsother than those discussed above. A priority assess-ment is a function of data on natural features, dataon current types and patterns of threatening processes,and one or more procedures for deriving conservationpriorities from those data. As data improve, patternsof threats change, and procedures are refined, thenumber, location and configuration of the priorityconservation areas in a region will inevitably changeas well (Pressey & Taffs, submitted). While imple-mentation of conservation action on the ground mustproceed in the absence of perfect information andprocedures, planners must recognise that tomorrow’sdecisions will often be different and more firmly basedthan today’s.
Although the RDB database used in this studyis fairly complete, one cannot assume that all the851 species have been thoroughly surveyed in all220 QDS in the Succulent Karoo biome. We suspectthat complete surveys in all QDS would not change theresults of our analyses substantially, but recognise thatsome changes in priorities will occur. Further recordscould also introduce more flexibility into conservationassessments by reducing the number of single-QDSendemics. Including vertebrate data in the types of

53
analyses reported here is also likely to add to thenumber and extent of priority conservation areas. Aniterative reserve-selection analysis of vertebrate datafor South Africa shows that five reserves are requiredin the Succulent Karoo (Lombard 1995). These arewithin the Southern Namib Desert, the Gariep Centre,the northern portion of the Sandveld and the Na-maqualand Rocky Hills. The flexibility of many ofthese localities, given the much larger ranges of verte-brate species, could allow them to be incorporated intothe configuration for plants, even if the relative prior-ity of QDS changes to some extent. Of significance,however, is the high proportion of vertebrate species,compared to plants, endemic to the southern NamibDesert and Sandveld bioregions.
Assessments of the imminence or likelihood ofthreats in the Succulent Karoo and elsewhere are stilldeveloping and are likely to become more sophisti-cated (Pressey & Taffs, submitted). The relative meritsof the approaches taken in this study, based on thenumber and Red Data Book status of plant species,and other species-based methods (e.g., Kershaw et al.1995) have yet to be tested. As well, there are reasonswhy the results of species-based approaches are likelyto differ from those derived from patterns of actualor potential land uses (Pressey 1997): (a) spatial bi-ases in species records leading to mismatches betweenconcentrations of vulnerable species and landscapespredisposed to extractive uses; (b) some species onlists of concern being naturally rare rather than subjectto current or likely threatening processes; (c) speciesof concern being listed in a broader geographical con-text and/or at a coarser resolution than that beingconsidered for landscape assessments; and (d) list-ings of threatened species indicating the distribution ofthreatening processes that are not easily or accuratelyreflected by data in geographic information systemswhich form the basis of landscape assessments. Weknow of no comparisons of species-based and land-scape approaches to assessing threats at the scaleof individual conservation areas (but see Beissingeret al. 1996; Brooks et al. 1997 for very broad-scalecomparisons).
Refined procedures for setting conservation prior-ities are also likely to emerge from current work onthe Succulent Karoo which will require core conser-vation areas to be reconsidered in the future. Cowlinget al. (in press) have proposed a protocol for settingpriorities that considers not only the pattern of speciesand land types in the region but also the maintenanceof natural processes. As the protocol is developed
further and applied to the region, the extent of prior-ity conservation areas is likely to increase and theirconfiguration will change.
Conclusions
The high species richness of the Succulent Karoobiome, coupled with the high compositional turnoverof these species, makes it difficult to conserve allspecies in a formal reserve system. An analysis of onlythe RDB component of species in the biome showsthat hotspots can be almost as efficient as iterativeprocedures in capturing species in the top 5% of allQDS, whereas bioregions are too coarse to use forreserve design. An ideal iterative procedure showedthat 46% of all RDB species can be captured in 5% ofthe biome (11 QDS), whereas a real-world procedureshowed that if existing reserves (seven QDS) are takeninto account, 52% of species can be captured in 8%of the biome (7 already reserved plus the top 11 newselections). Of the 11 core areas identified by the threatprioritisation of the real-world results, four fall in anode centred on the Vanrhynsdorp Centre, two fall ina node centred on the Kamiesberg, and the remainingfive are isolated. These 11 core areas, with the sevenQDS with existing reserves, capture 50% of speciesand urgently require formal conservation.
Acknowledgements
We are greatly indebted to Leslie Hill for his conser-vation vision for the Succulent Karoo, and for estab-lishing the Leslie Hill Succulent Karoo Trust, whichfunded this project. The World Wide Fund for Nature(South Africa) is thanked for managing the Trust, andfor providing valuable feedback through referees forthe proposed second phase of this project. We alsothank the South African National Parks for the closeliaisons they have established with us in their questto improve the conservation status of the SucculentKaroo.
References
Bedward, M., Pressey, R. L. & Keith, D. A. 1992. A new approachfor selecting fully representative reserve networks: addressingefficiency, reserve design and land suitability with an iterativeanalysis. Biol. Conserv. 62: 115–125.
Beissinger, S. R., Steadman, E. C., Wohlengenant, T., Blate, G. &Zack, S. 1996. Null models for assessing ecosystem conservationpriorities: threatened birds as titers of threatened ecosystems inSouth America. Conserv. Biol. 10: 1343–1352.

54
Bittrich, V. & Hartmann, H. 1988. The Aizoaceae – a new approach.Bot. J. Linn. Soc. 97: 239–254.
Branch, W. R., Benn, G. A. & Lombard, A. T. 1995. The tortoises(Testudinidae) and terrapins (Pelomedusidae) of southern Africa:their diversity, distribution and conservation. S. Afr. J. Zool. 30:91–102.
Brooks, T. M., Pimm, S. L. & Collar, N. J. 1997. Deforestationpredicts the number of threatened birds in insular southest Asia.Conserv. Biol. 11: 382–394.
Cowling, R. M., Esler, K. J. & Rundel, P. W. 1999. Namaqualand,South Africa – an overview of a unique winter-rainfall desertecosystem. Plant Ecol. 142: 3–21 (this issue).
Cowling, R. M. & Hilton-Taylor, C. 1994. Patterns of plant diver-sity and endemism in southern Africa: an overview. Pp. 31–52.In: Huntley, B. J. (ed.), Botanical diversity in southern Africa.Strelitzia 1. National Botanical Institute, Pretoria.
Cowling, R. M. & Hilton-Taylor, C. In press. Plant biogeography,endemism and diversity. In: Dean, W. R. J. & Milton, S. J.(eds), The Karoo: ecological patterns and processes. CambridgeUniversity Press, Cambridge.
Cowling, R. M., Gibbs Russell, G. E., Hoffman, M. T. & Hilton-Taylor, C. 1989. Patterns of plant species diversity in southernAfrica. Pp. 19–50. In: Huntley, B. J. (ed.), Biotic diversity insouthern Africa: concepts and conservation. Oxford UniversityPress, Cape Town.
Cowling, R. M., Pressey, R. L., Lombard, A. T., Desmet, P. G.& Ellis, A. G. In press. From representation to persistence: re-quirements for a sustainable reserve system in the species-richmediterranean-climate deserts of southern Africa. Diversity andDistributions.
Cowling, R. M., Rundel, P. W., Desmet. P. G. & Esler. K. J. 1998b.Extraordinarily high regional-scale plant diversity in southernAfrican arid lands: subcontinental and global comparisons. Di-versity and Distributions 4: 27–36.
Dean, W. R. J. 1995. Where birds are rare and fill the air: the pro-tection of the endemic and the nomadic avifaunas of the Karoo.Ph.D. Thesis. Percy FitzPatrick Institute of African Ornithology,University of Cape Town, South Africa.
Desmet, P. G. & Cowling, R. M. 1996. An assessment of the farmsKookfontein (466) and Steenbokkraal (part of Doornfontein 464)for inclusion in the Skilpad Wildflower Reserve. Institute forPlant Conservation, University of Cape Town.
Desmet, P. G. & Cowling, R. M. 1999. Biodiversity, habitat andrange-size aspects of a flora from the winter-rainfall desert inarid north-western Namaqualand, South Africa. Plant Ecol. 142:23–33 (this issue).
Drinkrow, D. R. & Cherry, M. I. 1995. Anuran distribution, diversityand conservation in South Africa, Lesotho and Swaziland. S. Afr.J. Zool. 30: 82–90.
Gelderblom, C. M. & Bronner, G. N. 1995. Patterns of distributionand current protection status of the endemic mammals in SouthAfrica. S. Afr. J. Zool. 30: 127–135.
Gelderblom, C. M., Bronner, G. N., Lombard, A. T. & Taylor, P. J.1995. Patterns of distribution and current protection status of theCarnivora, Chiroptera and Insectivora in South Africa. S. Afr. J.Zool. 30: 103–114.
Harrison, J. A., Allan, D. G., Underhill, L. G., Herremans, M.,Tree, A. J., Parker, V. & Brown, C. J. (eds). 1997. The Atlasof southern African Birds. Birdlife South Africa, Johannesburg.
Hilton-Taylor, C. 1994. Karoo-Namib Region: Western Cape Do-main (Succulent Karoo). Pp. 204–217. In: Davis, S. D., Hey-wood, V. H. & Hamilton, A. C. (eds), Centres of plant diversity:a guide and strategy for their conservation. IUCN PublicationsUnit, Cambridge.
Hilton-Taylor, C. 1996a. Patterns and characteristics of the flora ofthe Succulent Karoo biome, southern Africa. Pp. 58–72. In: vander Maesen, L. J. G., van der Burgt, X. M. & van Medenbachde Rooy, J. M. (eds), The Biodiversity of African plants. KluwerAcademic Publishers, Dordrecht, The Netherlands.
Hilton-Taylor, C. 1996b. Red Data list of southern African plants.Strelitzia 4. National Botanical Institute, Pretoria.
Hilton-Taylor, C. & Le Roux, A. 1989. Conservation status of thefynbos and karoo biomes. Pp. 202–223. In: Huntley, B. J. (ed.),Biotic diversity in southern Africa: concepts and conservation.Oxford University Press, Cape Town.
Hoffman, M. T. 1996. Succulent Karoo biome. In: Low, A. B. &Rebelo, A. G. (eds), Vegetation of South Africa, Lesotho andSwaziland. Department of Water Affairs and Forestry, Pretoria.
Jürgens, N. 1991. A new approach to the Namib Region. 1:Phytogeographic subdivision. Vegetatio 97: 21–38.
Jürgens, N., Gotzmann, I. H. & Cowling, R. M. 1999. Remark-able medium-term dynamics of leaf succulent Mesembryan-thema (Aizoaceae) in the winter-rainfall desert of northwesternNamaqualand, South Africa. Plant Ecol. 142: 87–96 (this issue).
Kershaw, M., Mace, G. M. & Williams, P. H. 1995. Threatenedstatus, rarity, and diversity as alternative selection measures forprotected areas: a test using Afrotropical antelopes. Conserv.Biol. 9: 324–334.
Kirkpatrick, J. B. 1983. An iterative method for establishing pri-orities for the selection of nature reserves: an example fromTasmania. Biol. Conserv. 25: 127–134.
Lombard, A. T. 1995. The problems with multi-species conserva-tion: do hotspots, ideal reserves and existing reserves coincide?S. Afr. J. Zool. 30: 145–163.
Lombard, A. T., Nicholls, A. O. & August, P. V. 1995. Whereshould nature reserves be located in South Africa? A snake’sperspective. Conserv. Biol. 9: 363–372.
Maggs, G. L., Craven, P. & Kolberg, H. H. 1998. Plant speciesrichness, endemism and genetic resources in Namibia. Biodiv.Conserv. 7: 435–446.
Margules, C. R., Nicholls, A. O. & Pressey, R. L. 1988. Select-ing networks of reserves to maximise biological diversity. Biol.Conserv. 43: 63–76.
McNeely, J. A. (ed) 1993. Parks for life. Report of the IVthWorld Congress of Parks and Protected Areas. IUCN, Gland,Switzerland.
Milton, S. J., Yeaton, R. I., Dean, W. R. J. & Vlok, H. J. 1997.Succulent Karoo. Pp. 131–166. In: Cowling, R. M., Richard-son, D. M. & Pierce, S. M. (eds), Vegetation of southern Africa.Cambridge University Press, Cambridge.
Mittermeier, R. A., Myers, N., Thomsen, J. B., da Fonseca, G. A. B.& Olivieri, S. 1998. Biodiversity hotspots and major tropicalwilderness areas: approaches to setting conservation priorities.Conserv. Biol. 12: 516–520.
Mugo, D. N., Lombard, A. T., Bronner, G. N., Gelderblom, C. M.& Benn, G. A. 1995. Distribution and protection of endemicor threatened rodents, lagomorphs and macrosceledids in SouthAfrica. S. Afr. J. Zool. 30: 115–126.
Nicholls, A. O. & Margules, C. R. 1993. An upgraded reserveselection algorithm. Biol. Conserv. 64: 165–169.
Olson, D. M. & Dinerstein, E. 1998. The global 200: a repre-sentation approach to conserving the earth’s most biologicallyvaluable ecoregions. Conserv. Biol. 12: 502–515.
Passmore, N. I. & Carruthers, V. C. 1995. South African frogs acomplete guide. Southern Book Publishers.
Prendergast, J. R., Quinn, R. M., Lawton, J. H., Eversham, B. C. &Gibbons, D. W. 1993. Rare species, the coincidence of diversityhotspots and conservation strategies. Nature 365: 335–337.

55
Pressey, R. L. 1997. Priority conservation areas: towards an op-erational definition for regional assessments. Pp. 337–357. In:Pigram, J. J. & Sundell, R. C. (eds.), National parks and pro-tected areas: Selection, delimitation and management. Centre forWater Policy Research, University of New England, Armidale,Australia.
Pressey, R. L., Ferrier, S., Hager, T. C., Woods, C. A., Tulley, S. L.& Weinman, K. M. 1996a. How well protected are the forests ofnorth-eastern New South Wales? – Analyses of forest environ-ments in relation to formal protection measures, land tenure, andvulnerability to clearing. Forest Ecol. Manag. 85: 311–333.
Pressey, R. L., Possingham, H. P. and Margules, C. R. 1996b. Op-timality in reserve selection algorithms: when does it matter andhow much? Biol. Conserv. 76: 259–267.
Pressey, R. L. & Nicholls, A. O. 1989. Efficiency in conservationevaluation: scoring versus iterative approaches. Biol. Conserv.50: 199–218.
Pressey, R. L., Possingham, H. P. & Day, J. R. 1997. Effectivenessof alternative heuristic algorithms for identifying indicative min-imum requirements for conservation reserves. Biol. Conserv. 80:207–219.
Pressey, R. L. & Taffs, K. H. (submitted) Priority conservation ar-eas: a definition for the real world applied to Western New SouthWales. Biol. Conserv.
Pressey, R. L., Humphries, C. J., Margules, C. R., Vane-Wright, R. I.& Williams, P. H. 1993. Beyond opportunism: key principles forsystematic reserve selection. TREE 8: 124–128.
Rebelo, A. G. 1994. Iterative selection procedures: centres of en-demism and optimal placement of reserves. Pp. 231–257. In:Huntley, B. J. (ed.), Botanical diversity in southern Africa.Strelitzia 1. National Botanical Institute, Pretoria.
Rebelo, A. G. 1997. Conservation. Pp. 571–590. In: Cowling, R. M.,Richardson, D. M. & Pierce, S. M. (eds), Vegetation of southernAfrica. Cambridge University Press, Cambridge.
Rebelo, A. G. & Siegfried, W. R. 1992. Where should nature re-serves be located in the Cape Floristic Region, South Africa?Models for the spatial configuration of a reserve network aimedat maximizing the protection of floral diversity. Conserv. Biol. 6:243–252.
Rutherford, M. C. & Westfall, R. H. 1986. Biomes of southernAfrica – an objective categorization. Mem. Bot. Surv. S. Afr. 54:1–98.
Skelton, P. H., Cambray, J. A., Lombard, A. T. & Benn, G. A. 1995.Patterns of distribution and conservation status of freshwaterfishes in South Africa. S. Afr. J. Zool. 30: 71–81.
Thackway, R. & Cresswell, I. D. 1997. A bioregional framework forplanning the national system of protected areas in Australia. Nat.Areas J. 17: 241–247.
Underhill, L. G. 1994. Optimal and suboptimal reserve selectionalgorithms. Biol. Conserv. 70: 85–87.
Van Jaarsveld, E. 1987. The succulent riches of South Africa andNamibia. Aloe 24: 45–92.
Vernon, C. J. In press. Biogeography, endemism and diversity ofanimals in the Karoo. In: Dean, W. R. J. & Milton, S. J. (eds), TheKaroo: ecological patterns and processes. Cambridge UniversityPress, Cambridge.
Williams, P., Gibbons, D., Margules, C., Rebelo, A., Humphries,C. & Pressey, R. 1996. A comparison of richness hotspots, rarityhotspots, and complementary areas for conserving diversity ofBritish birds. Conserv. Biol. 10: 155–174.
Williamson, G. 1997. Preliminary account of the floristic zones ofthe Sperrgebiet (Protected Diamond Area) in southwest Namibia.Dinteria 25: 1–68.
Willis, C. K., Lombard, A. T., Cowling, R. M., Heydenrych, B. J. &Burgers, C. J. 1996. Reserve systems for limestone endemic floraof the Cape lowland fynbos: iterative versus linear programming.Biol. Conserv. 77: 53–62.

![[hal-00256385, v1] Modelling improvisatory and compositional ...](https://static.fdokumen.com/doc/165x107/6324da46cedd78c2b50c4d83/hal-00256385-v1-modelling-improvisatory-and-compositional-.jpg)