Furanose Dynamics in the Hha I Methyltransferase Target DNA Studied by Solution and Solid-State NMR...
28
Furanose Dynamics in the HhaI Methyltransferase Target DNA Studied by Solution and Solid State NMR Relaxation Dorothy Echodu 1 , Gil Goobes 1,† , Zahra Shajani 1 , Kari Pederson 1 , Gary Meints 1,†† , Gabriele Varani 1,2 , and Gary Drobny 1,* 1 Department of Chemistry, University of Washington, Seattle WA 98195-1700 2 Department of Biochemistry, University of Washington, Seattle WA 98195-1700 Abstract Both solid state and solution NMR relaxation measurements are routinely used to quantify the internal dynamics of biomolecules, but in very few cases have these two techniques been applied to the same system and even fewer attempts have been made so far to describe the results obtained through these two methods through a common theoretical framework. We have previously collected both solution 13 C and solid state 2 H relaxation measurements for multiple nuclei within the furanose rings of several nucleotides of the DNA sequence recognized by HhaI methyltransferase. The data demonstrated that the furanose rings within the GCGC recognition sequence are very flexible, with the furanose rings of the cytidine which is the methylation target experiencing the most extensive motions. In order to interpret these experimental results quantitatively, we have developed a dynamic model of furanose rings based on the analysis of solid state 2 H line shapes. The motions are modeled by treating bond reorientations as Brownian excursions within a restoring potential. By applying this model, we are able to reproduce the rates of 2 H spin-lattice relaxation in the solid and 13 C spin-lattice relaxation in solution using comparable restoring force constants and internal diffusion coefficients. As expected, the 13 C relaxation rates in solution are less sensitive to motions that are slower than overall molecular tumbling than to the details of global molecular reorientation, but are somewhat more sensitive to motions in the immediate region of the Larmor frequency. Thus, we conclude that the local internal motions of this DNA oligomer in solution and in the hydrated solid state are virtually the same, and we validate an approach to the conjoint analysis of solution and solid state NMR relaxation and line shapes data, with wide applicability to many biophysical problems. Keywords solid state deuterium NMR; solution state 13 C NMR; DNA; deoxyribonucleic acid; methyltransferase; dynamics; simulations I. Introduction Despite the obvious importance of motion to the functions of proteins 1-9 and nucleic acids 10-12 , quantitatively defining the role that internal dynamics play in biological processes remains a challenging task due to the complex nature of biomolecular motions. Functionally relevant internal motions range from single bond torsions (occurring in the ps time scale) to † Current address: Department of Chemistry and the Institute for Nanotechnology and Advanced Materials, Bar Ilan University, Ramat Gan 52900, Israel †† Current address: Department of Chemistry, Missouri State University, Springfield, MO 65897 * E-mail address of the corresponding author, [email protected], Tel 206 685 2052, Fax 206 685 8665 NIH Public Access Author Manuscript J Phys Chem B. Author manuscript; available in PMC 2009 August 31. Published in final edited form as: J Phys Chem B. 2008 November 6; 112(44): 13934–13944. doi:10.1021/jp801723x. NIH-PA Author Manuscript NIH-PA Author Manuscript NIH-PA Author Manuscript
Transcript of Furanose Dynamics in the Hha I Methyltransferase Target DNA Studied by Solution and Solid-State NMR...
Furanose Dynamics in the HhaI Methyltransferase Target DNAStudied by Solution and Solid State NMR Relaxation
Dorothy Echodu1, Gil Goobes1,†, Zahra Shajani1, Kari Pederson1, Gary Meints1,††, GabrieleVarani1,2, and Gary Drobny1,*1Department of Chemistry, University of Washington, Seattle WA 98195-17002Department of Biochemistry, University of Washington, Seattle WA 98195-1700
AbstractBoth solid state and solution NMR relaxation measurements are routinely used to quantify the internaldynamics of biomolecules, but in very few cases have these two techniques been applied to the samesystem and even fewer attempts have been made so far to describe the results obtained through thesetwo methods through a common theoretical framework. We have previously collected bothsolution 13C and solid state 2H relaxation measurements for multiple nuclei within the furanose ringsof several nucleotides of the DNA sequence recognized by HhaI methyltransferase. The datademonstrated that the furanose rings within the GCGC recognition sequence are very flexible, withthe furanose rings of the cytidine which is the methylation target experiencing the most extensivemotions. In order to interpret these experimental results quantitatively, we have developed a dynamicmodel of furanose rings based on the analysis of solid state 2H line shapes. The motions are modeledby treating bond reorientations as Brownian excursions within a restoring potential. By applying thismodel, we are able to reproduce the rates of 2H spin-lattice relaxation in the solid and 13C spin-latticerelaxation in solution using comparable restoring force constants and internal diffusion coefficients.As expected, the 13C relaxation rates in solution are less sensitive to motions that are slower thanoverall molecular tumbling than to the details of global molecular reorientation, but are somewhatmore sensitive to motions in the immediate region of the Larmor frequency. Thus, we conclude thatthe local internal motions of this DNA oligomer in solution and in the hydrated solid state are virtuallythe same, and we validate an approach to the conjoint analysis of solution and solid state NMRrelaxation and line shapes data, with wide applicability to many biophysical problems.
Keywordssolid state deuterium NMR; solution state 13C NMR; DNA; deoxyribonucleic acid;methyltransferase; dynamics; simulations
I. IntroductionDespite the obvious importance of motion to the functions of proteins1-9 and nucleicacids10-12, quantitatively defining the role that internal dynamics play in biological processesremains a challenging task due to the complex nature of biomolecular motions. Functionallyrelevant internal motions range from single bond torsions (occurring in the ps time scale) to
†Current address: Department of Chemistry and the Institute for Nanotechnology and Advanced Materials, Bar Ilan University, RamatGan 52900, Israel††Current address: Department of Chemistry, Missouri State University, Springfield, MO 65897*E-mail address of the corresponding author, [email protected], Tel 206 685 2052, Fax 206 685 8665
NIH Public AccessAuthor ManuscriptJ Phys Chem B. Author manuscript; available in PMC 2009 August 31.
Published in final edited form as:J Phys Chem B. 2008 November 6; 112(44): 13934–13944. doi:10.1021/jp801723x.
NIH
-PA Author Manuscript
NIH
-PA Author Manuscript
NIH
-PA Author Manuscript

long range structural rearrangements (ms-s and even longer). In order to characterize dynamicscomprehensively, we must account for molecular motions with rates spanning at least 10 ordersof magnitude and perhaps more. However, it is well-known that different dynamicspectroscopies display variable sensitivity to different rates of motion. Therefore, to rely upona single type of spectroscopic measurement runs the risk of obtaining an incomplete or evenincorrect description of internal molecular motions. The best way to accurately characterizeall functionally relevant molecular motions is to use more than one spectroscopy to probe abroad range of dynamic rates. Although a number of possible combinations of spectroscopiesexist, solution and solid state NMR are a natural combination because they cover differentregions of the motional spectrum in a complementary fashion and share a common theoreticalframework, being essentially the same spectroscopy applied to different sample conditions.Indeed, the concerted use of solid state and solution NMR dynamic methods has been stronglyrecommended13, but to date there have been few if any sustained efforts to combine these twospectroscopies to study the same biological processes.
We have previously applied both NMR techniques to study the local motions of the furanoserings in the DNA recognition site for HhaI methylase14, 15.
Dynamics plays a critical functional role in this system because the DNA undergoes extensivestructural rearrangement to accommodate interactions with the enzyme and to expose themodification site16. Our experimental work demonstrated that the furanose rings within theGCGC recognition sequences are structurally labile a priori, i.e. experience considerablemotions in the free DNA, and that the furanose ring of the cytidine which is the methylationtarget interconverts between C2′ and C3′ endo sugar conformations without traversing asignificant energy barrier. These atypical motions may be associated with the structuralrearrangements that occur upon binding of the DNA to the protein methylase, and are thusrelated to function.
But we also reported17 that while solid state NMR line shapes vary greatly from furanose ringto furanose ring for nucleotides within and adjacent to the GCGC moiety, and althoughfuranose 2H relaxation times vary across the same GCGC recognition site by as much as 400%,solution 13C relaxation times obtained from the same structural sites differ by less than 10%.It seems counter-intuitive to assume that these measurements indicate that a molecule isinternally more rigid in solution than in the hydrated solid state, so a more detailed analysis isrequired.
In this manuscript, we seek to reconcile 13C solution relaxation measurements with static 2Hrelaxation and line shape data by introducing a theoretical model of furanose motion thatreproduces both sets of results in a self-consistent manner. First, we review the theoreticalframework used to analyze dynamically modulated solid state NMR line shapes, and to analyzeboth solid state and solution NMR relaxation rates. Within this framework, we thenquantitatively compare solid state and solution NMR studies of the two nuclei in the C2′-H2”moiety of cytosine C6 and C8 within the furanose rings in the central GCGC sequence of theDNA dodecamer 5′-d(GATAGCGCTATC)2. In order to analyze the data from both types ofspectroscopy conjointly, we model furanose motions as diffusion in a restoring potential whoseparameters are determined by fitting the deuterium line shapes. We use this model to simulatethe solid state 2H spin-lattice relaxation rates and the solution state 13C spin-lattice relaxationrates. Based on these calculations, we explore the resemblance of localized internal motionsin amorphous solid, hydrated DNA and the motions of the same DNA in solution. Finally, wediscuss the extent to which solution NMR relaxation and solid state NMR relaxation/line shapemeasurements are sensitive to local and global motions of the furanose rings of DNA and tomotions in the us-ns time regime in general.
Echodu et al. Page 2
J Phys Chem B. Author manuscript; available in PMC 2009 August 31.
NIH
-PA Author Manuscript
NIH
-PA Author Manuscript
NIH
-PA Author Manuscript
II. Theoretical FrameworkOur approach to studying internal biomolecular dynamics by a combination of solid state/solution NMR has three experimental components: (1) solid state deuterium NMR line shapeanalysis, and the analyses of (2) solid state NMR and (3) solution NMR relaxation rates. Wewant to determine the degree to which the internal motions in a DNA molecule in solutionresembles those occurring in essentially the same molecule in the hydrated solid state, and thusthe degree to which both spectroscopies can be used in a unified way to study dynamics.Analysis of the line shape yields detailed information on the nature of internal molecularmotions uncomplicated by the occurrence of overall molecular tumbling. In general, the 2Hline is simulated using a small number of models of molecular motions; these models mustalso simulate the solid state relaxation data in order to be considered valid. Once the solid stateNMR line shape and relaxation data are modeled successfully, testing the consistency of themodel against solution NMR data determines the extent to which the local internal dynamicsobserved in hydrated, solid DNA exists and is observable in the same molecule in solution.This section consists of a brief overview of the theoretical framework used to simulate NMRline shapes and relaxation rates both in the solid state and in solution.
A) Static Solid State 2H NMR Line Shape TheoryThe theory of the dynamically modulated solid state deuterium line shape is welldocumented18 and will be described only briefly here. A static 2H NMR line shape is measuredusing a quadrupolar echo experiment, where two 90° pulses with relative phase shift of 90degrees and separated by a time duration τ1 are applied to the deuterium spin system. As aresult of this pulse sequence, a quadrupolar echo is formed at a time τ2 after the second pulse.For this paper, the simplest theory suffices, which accounts for a single local molecular motionthat modulates in time the orientation of a particular molecular structural moiety relative to alaboratory frame, (L).
To describe line shape modulation by a single internal motion, at least three reference framesare used. The static 2H solid state line shape is dominated by the interaction of the nuclearquadrupole moment with external electric field gradients (EFGs). The EFG tensor can beapproximated to be uniaxial for deuterons bonded to aliphatic carbons and its principal axissystem (P) is defined so that the z axis is parallel to the C-D bond axis (Figure 1). Internalmotions modulate the relative orientation of the P frame and the L frame. This is mathematicallydescribed using a third frame, designated C, which is defined relative to the molecularframework. The orientation of the C frame depends upon the nature of the motion. In apolymethylene chain, conformational changes between rotational isomeric states require thatthe z axis of the C frame is parallel to the C-C bond. A similar definition exists for motions ofa cyclic system like a furanose ring and will be discussed in section III below. The C frameused in this study to describe motions of the furanose ring and the relationship of the C framerelative to the L frame are both shown in Figure 1.
Internal molecular motions modulate the solid angle ΩPC=(0, θPC, φPC) which quantifies themutual orientation of the P and C frames. As a result of the internal motion, this solid anglebecomes time dependent, i.e. ΩPC(t)=(0,βPC(t),γPC(t)). In a polycrystalline state, the line shapeis averaged over all orientations of the sample; thus, the solid angle ΩCL=(0,θCL,φCL) thatrelates the C frame to the L frame is distributed randomly. With these conventions, thestatic 2H line shape is a function of the frequency ω and the pulse intervals τ1 and τ2 accordingto:
(1)
Echodu et al. Page 3
J Phys Chem B. Author manuscript; available in PMC 2009 August 31.
NIH
-PA Author Manuscript
NIH
-PA Author Manuscript
NIH
-PA Author Manuscript

where the orientation-dependent line shape is the Fourier transform of the time domainresponse m(t):
(2)
In equation 2 m(t), which is the transverse magnetization corresponding to the m=1 to m=0transition is defined by:
(3)
where A=iω+π, A*=-iω+π and the matrices T and T* diagonalize A and A* respectively, i.e.T-1 AT = λ and (T*)-1 A*T* = λ*. The matrix π is composed of site exchange rates, and ω is adiagonal matrix with non-zero elements ωi that are the orientation dependent frequencies:
(4)
The subscript i in ωi and the superscript (i) in denote the ith of N structural sites locatedalong the trajectory of motion. Specifically is the solid angle that relates for the ith site theP frame and the C frame, and ΩCL is the solid angle that relates the C frame to the L frame.The quadrupolar coupling constant QCC = e2qQ/ħ is a known quantity and varies only slightlyamong aliphatic deuterons; it can be approximated to be 170 kHz. The analogous equation forthe magnetization corresponding to the m=0 to m=-1 transition can be obtained by negatingthe frequency expression in equation 4. In order to use equation 1 to calculate a dynamicallyaveraged line shape, the form of the exchange matrix π must be determined. The form of πused to describe local furanose ring motions will be described in section III.
B) Solid State 2H Relaxation TheoryThe correlation function for single axis motion in a solid can be defined as follows19:
(5)
where ⟨ ⟩ denotes an ensemble average. As in section IIA, it is assumed in equation 5 that theelectric field gradient (EFG) tensor is axially symmetric. All other conventions are the sameas in section IIA: i.e. the solid angle ΩPC(0,βPC,γPC) defines the mutual orientation of theprincipal axis system (P) of the EFG tensor and a frame fixed to the molecule (C). It is possibleto select the axis system C such that only the angle γPCis time dependent as a result of changesof the molecular structure. For convenience we simplify the notation as follows: γPC(0)=γ0,γPC(t)=γ.
Echodu et al. Page 4
J Phys Chem B. Author manuscript; available in PMC 2009 August 31.
NIH
-PA Author Manuscript
NIH
-PA Author Manuscript
NIH
-PA Author Manuscript

The correlation function ⟨eiaγ0e-ia’γ⟩ is given by
(6)
where P(γ,t|γ0) is the probability that the system is oriented at γt at time t conditional uponbeing at γ0 at t=0. W(γ0) is the a priori probability of the system being at γ0. The form of theconditional probability depends, like the exchange matrix π, on the detailed nature of the motionof the furanose ring; this is treated in section III. The spin-lattice relaxation rate depends onthe orientation of the crystallite to the laboratory frame given by the angle ΩCL. A convenientsimplification is to calculate the “powder averaged” spin-lattice relaxation rate. This can becarried out at the level of equation 5 by averaging the correlation function over the solid angleΩCL:
(7)
By applying to equation 7 the orthogonality condition for Wigner rotation matrices:
(8)
we obtain the following expression for the “powder-averaged” correlation function:
(9)
which is no longer dependent on the index m. Using equation 9, the “powder-averaged” spin-lattice relaxation rate is:
(10)
In this expression, the spectral densities are Fourier transforms of the correlation function inequation 9 at particular frequencies, and are thus independent of the index m:
(11)
C) Solution 13C Relaxation TheorySolution NMR relaxation rates are expressed in this paper according to well-establishedformalisms’20. Here, the simplest case of a single internal motion is assumed, as defined anddescribed previously by the reorientation of the P frame relative to the C frame. An additionalcoordinate frame D must be defined to describe overall tumbling of the macromolecule. Forduplex nucleic acids consisting of only twelve base pairs, rigid rod tumbling is a goodapproximation and the z axis of the D frame (which can be associated with the principal value
Echodu et al. Page 5
J Phys Chem B. Author manuscript; available in PMC 2009 August 31.
NIH
-PA Author Manuscript
NIH
-PA Author Manuscript
NIH
-PA Author Manuscript

of the diffusion tensor D∥) is parallel to the helix axis. The correlation function thus has theform:
(12)
where the solid angle ΩDL falls implicitly within the last diffusive term. The principal valuesof the diffusion tensor D∥ and D⊥ for DNA dodecamers can be measured from 13C relaxationdata21 or calculated using analytical expressions22. If the observed nuclei are aliphatic 13Cspins, the chemical shift anisotropy (CSA) makes only a minor contribution to relaxation,which is dominated by dipolar couplings between 13C spins and their covalently bondedprotons. In this case, the Zeeman relaxation rate is provided by:
(13)
where the dipolar coupling constant is defined as and N is the number of protonscoupled to the 13C spin. All symbols in the coupling constant have their usual meanings. Theeffect of dipolar cross correlations within CH2 groups may require the calculation of additionalspectral densities; if these additional terms are appreciable, the end result may be the presenceof multi-exponential relaxation23. Cross correlation effects have been calculated by Londonand Avitabile24 and have been found to be important for fast internal motions in the ns-pstimescale range. Slower motions considered in this work occurring at time scales longer than1 ns do not display appreciable cross correlation effects, so equation 14 is considered a goodapproximation for N=2.
III. MethodsA) Modeling Structurally Labile Furanose Rings as Reorientational Diffusion in a RestoringPotential
In this section we derive a model that can reproduce within a single self-consistent frameworkthe observed solid state 2H line shape, the solid state 2H spin-lattice relaxation rate, and thesolution 13C relaxation rate of a labile furanose ring in the GCGC methyltransferase DNArecognition site. In order to quantify the displacement of a C-C or C-H bond as a result of ring“puckering”, the torsional states of all five bonds of the ring must be designated. In DNA andRNA, such a complicated formulation is avoided by using the “pseudo-rotation” formalism.Like the carbon atoms in cyclopentane, the heavy atoms of furanose rings in a nucleic acid areviewed as translating along a trajectory that is roughly orthogonal to the plane of thehypothetical undistorted furanose ring. In cyclopentane, the periodic motion of the carbonatoms produces structures that would be observed if the molecule were rotating about its five-fold symmetry axis. Unlike cyclopentane, structural constraints imposed on the furanose ringfrom the attachment to the phosphodiester backbone and the base cause the variousconformations produced by furanose “puckering” to be energetically inequivalent.Computational studies indicate that the low-energy conformations of the furanose rings in DNAand RNA cluster within two energy minima, identified by the pseudo-rotation states calledC2′-endo and C3′endo25. The barrier between these low energy conformations is estimated torange from 2.1 kJ26 to 6.3 kJ27.
Echodu et al. Page 6
J Phys Chem B. Author manuscript; available in PMC 2009 August 31.
NIH
-PA Author Manuscript
NIH
-PA Author Manuscript
NIH
-PA Author Manuscript
A recent solid state 2H NMR study established that the furanose rings of the cytidine nucleotideswithin the GCGC moiety of the DNA dodecamer 5′-d(GATAGCGCTATC)2.are exceptionallylabile15. Instead of exchanging between conformational energy minima, (as is typical of otherlabile furanose rings studied by this method) these furanose rings appear to interconvertbetween C2′ and C3′-endo conformations without traversing a measurable energy barrier. Theconformational states of these rings populate a broad energy well as opposed to beingdistributed between two or more local minima.
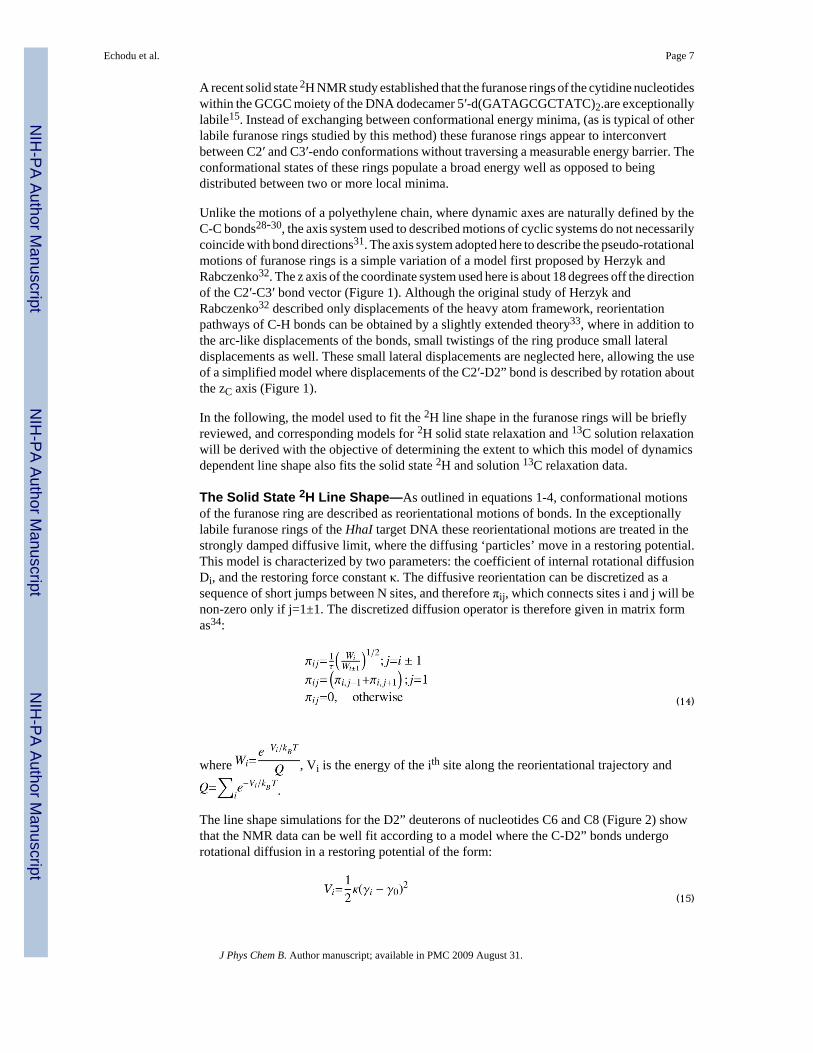
Unlike the motions of a polyethylene chain, where dynamic axes are naturally defined by theC-C bonds28-30, the axis system used to described motions of cyclic systems do not necessarilycoincide with bond directions31. The axis system adopted here to describe the pseudo-rotationalmotions of furanose rings is a simple variation of a model first proposed by Herzyk andRabczenko32. The z axis of the coordinate system used here is about 18 degrees off the directionof the C2′-C3′ bond vector (Figure 1). Although the original study of Herzyk andRabczenko32 described only displacements of the heavy atom framework, reorientationpathways of C-H bonds can be obtained by a slightly extended theory33, where in addition tothe arc-like displacements of the bonds, small twistings of the ring produce small lateraldisplacements as well. These small lateral displacements are neglected here, allowing the useof a simplified model where displacements of the C2′-D2” bond is described by rotation aboutthe zC axis (Figure 1).
In the following, the model used to fit the 2H line shape in the furanose rings will be brieflyreviewed, and corresponding models for 2H solid state relaxation and 13C solution relaxationwill be derived with the objective of determining the extent to which this model of dynamicsdependent line shape also fits the solid state 2H and solution 13C relaxation data.
The Solid State 2H Line Shape—As outlined in equations 1-4, conformational motionsof the furanose ring are described as reorientational motions of bonds. In the exceptionallylabile furanose rings of the HhaI target DNA these reorientational motions are treated in thestrongly damped diffusive limit, where the diffusing ‘particles’ move in a restoring potential.This model is characterized by two parameters: the coefficient of internal rotational diffusionDi, and the restoring force constant κ. The diffusive reorientation can be discretized as asequence of short jumps between N sites, and therefore πij, which connects sites i and j will benon-zero only if j=1±1. The discretized diffusion operator is therefore given in matrix formas34:
(14)
where , Vi is the energy of the ith site along the reorientational trajectory and
.
The line shape simulations for the D2” deuterons of nucleotides C6 and C8 (Figure 2) showthat the NMR data can be well fit according to a model where the C-D2” bonds undergorotational diffusion in a restoring potential of the form:
(15)
Echodu et al. Page 7
J Phys Chem B. Author manuscript; available in PMC 2009 August 31.
NIH
-PA Author Manuscript
NIH
-PA Author Manuscript
NIH
-PA Author Manuscript

where γi designates the orientation of the C2′-D2” bond at site i produced by a rotation aroundthe zC axis, and γ0 is the angle associated with the minimum energy conformation (assumedto be C2′-endo). In these simulations, it is assumed that the potential seeks to restore thefuranose ring to the C2′-endo conformation, which is the state of lowest energy in a B-formDNA helix. Since the pseudo-rotation coordinate system is used, the restoring force constantis not associated with the torsional motion of any single bond in the framework of the furanosering, but rather it is proportional to the force seeking to restore the ring to the C2′-endo minimumenergy conformation.
Solid State 2H Spin-and Solution 13C Spin-Lattice Relaxation—Here we derivecorrelation functions corresponding to the motions of the C2′-D2” bond as modeled accordingto the results of the solid state deuterium line shape studies15. Rotational diffusion in restoringpotentials has been primarily modeled in the magnetic resonance literature using potentials ofthe following form35:
(16)
The Maier-Saupe case (corresponding to n=2), has been extensively examined by Nordio andcoworkers36 and Freed37 for the case of reorientational motion of molecules in liquidcrystalline phases. In the remainder, we assume that the relevant motions can be described bya potential of the form given in equation 15.
The experimental line shape data strongly indicate that the dynamics of the C2′-D2” bond isthat of a one-dimensional, Brownian diffuser. In this case, the probability of a bond beingdistributed at γ at time t is obtained by solving the diffusion equation
(17)
Given the initial condition, P(γ,0)=δ(γ-γ0), equation 17 has the form of an Ornstein-Uhlenbeckprocess with the well-known solution38
(18)
where the mobility Bi is related to the internal diffusion coefficient by BikBT=Di.
If we assume the only motion affecting the Zeeman relaxation of the D2” deuteron is thelibration of the furanose ring, as specified by equations 17 and 18, the correlation function inequations 5 and 12 is given by:
(19)
where the a priori probability, W(γ0) is:
Echodu et al. Page 8
J Phys Chem B. Author manuscript; available in PMC 2009 August 31.
NIH
-PA Author Manuscript
NIH
-PA Author Manuscript
NIH
-PA Author Manuscript

(20)
The integrals in equation 19 can be performed numerically. Alternatively, with the following,
substitutions: , , and , Equation 18 acquires the form:
(21)
The expression in equation 21 is proportional to series of products of Hermite polynomials, asgiven by Mehler’s expansion39, 40
(22)
where . Using equation 22, equation 19 becomes
(23)
where
(24)
In contrast to equation 19, which expresses Γa,a’(t) in terms of an integral of a superexponential,equation 23 expresses Γa,a’(t) as an infinite series of products of integrals of Hermite
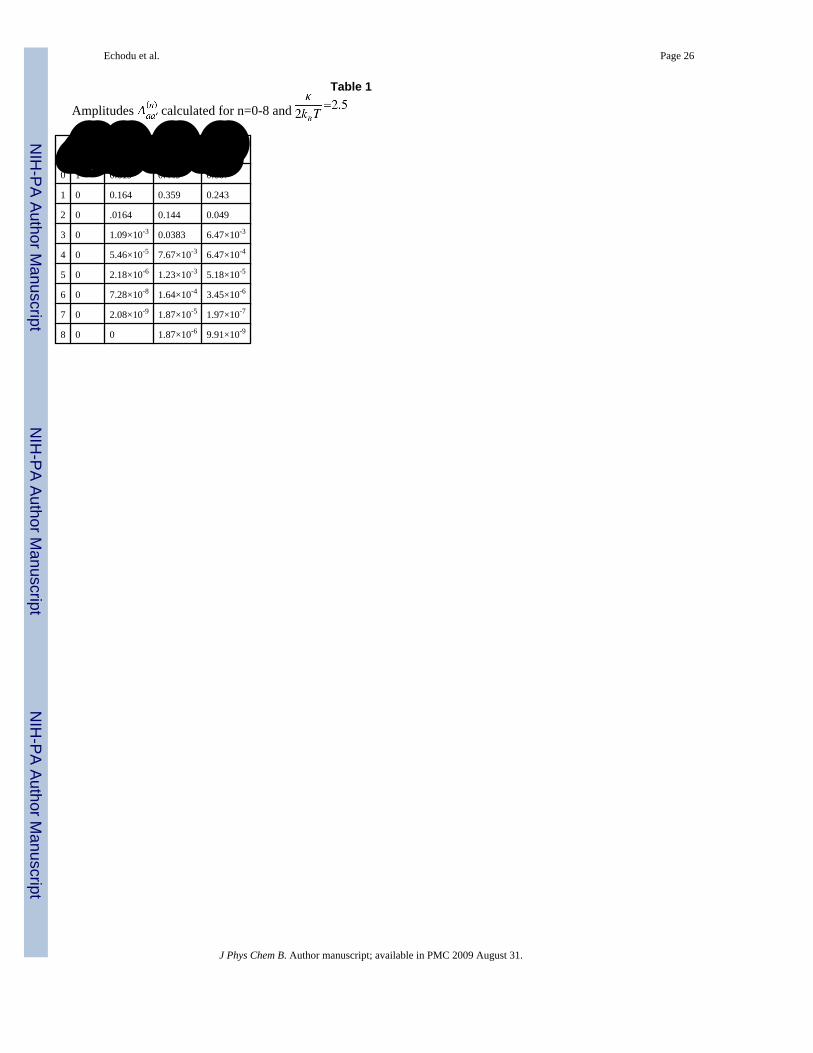
polynomials. The amplitudes vary as , and as Table 1 shows, the series converges forvalues of the restoring force constant κ relevant to the present study, within the first 4 to 5terms. If the only motion affecting the Zeeman relaxation rate R1 is diffusion in a restoringpotential, the powder-averaged correlation function in the solid state is then:
(25)
where is given by equation 24. The relevant powder-averaged spectral density is:
Echodu et al. Page 9
J Phys Chem B. Author manuscript; available in PMC 2009 August 31.
NIH
-PA Author Manuscript
NIH
-PA Author Manuscript
NIH
-PA Author Manuscript

(26)
The analogous solution NMR spectral density (assuming rigid cylindrical tumbling) is:
(27)
where
To model the relaxation of 2H nuclei in DNA in the hydrated solid state, equation 26 issubstituted into equation 10. To model the solution dipolar relaxation of aliphatic 13C nucleiin DNA, equation 27 is substituted into equation 13.
B) Sample preparationSynthesis of selectively furanose-deuterated nucleosides and subsequent preparation ofselectively deuterated phosphoramidites has been described previously15. A uniformlylabeled 13C/15N non-palindromic dsDNA dodecamer with the sequence [5′-(dGGTAGCGCTATT)-3′]-[5′-(dAATAGCGCTACC)-3′] was purchased from BioQuantis, asdescribed earlier41.
C) NMR experimentsSolid state 2H NMR spin-lattice relaxation times were recorded using an inversion recoverypulse sequence, which incorporated a 180° composite pulse to ensure broadband excitation.
42 In order to obtain powder-averaged Zeeman spin-lattice relaxation times, , the integratedintensity of the powder spectrum was monitored as a function of recovery time and analyzedusing a non-linear least squares fitting routine43. Solid state NMR spectra and relaxation rateswere obtained as described in Meints et al33 at a magnetic field of 11.7T, corresponding to adeuterium Larmor frequency of 76.8 MHz. The 13C solution T1 values were obtained asdescribed by Shajani & Varani41. 13C Relaxation rates were recorded at 11.7T correspondingto a Larmor frequency of 125.0 MHz.
D) Line shape analysisIn order to simulate the 2H line shape a form for the matrix A=iω+π is required. The diagonalmatrix ω, whose form is given in equation 4, is evaluated given a description of the trajectoryof the C-D bond. This trajectory is determined from an extension of the theory by Herzyk andRabczenko32 and the exchange matrix π is defined as in equation 14. In order to construct thismatrix, we required values for the potential V and the internal diffusion coefficient Di.The 2H line shapes for the furanose ring deuterons of nucleotides C6 and C8 were best fit using
a simple restoring potential , where γ is referenced to the coordinate systemshown in Figure 1. Solid state 2H line shapes were evaluated in the context of this model withthe program MXET115. For the 2H line shape simulations it was assumed that
Echodu et al. Page 10
J Phys Chem B. Author manuscript; available in PMC 2009 August 31.
NIH
-PA Author Manuscript
NIH
-PA Author Manuscript
NIH
-PA Author Manuscript

QCCstatic=e2qQ/h=170kHz, and that the principal axis of the (axial) EFG tensor is collinearwith the C-D bond axis.
E) Simulation of the Relaxation RatesBoth solid and solution spin-lattice relaxation rates were analytically simulated in Mathematica6.0, using the dynamic model described in section III to predict both experimental solid statepowder-averaged 2H and solution 13C spin-lattice relaxation times. Solid state 2H relaxationrates and 13C relaxation rates were calculated for the motion of the C2′-D2”, C2′-H2” and C1′-H1′ bonds of nucleotides C6 and C8 only.
For the solution calculations, it was assumed that the spin-lattice relaxation for 13C2′ isdominated by the dipolar coupling to the covalently bound protons. The DNA dodecamer wasassumed to tumble as a rigid cylinder and the vibrationally averaged C-H bond length wasassumed to be 1.10Å. Elements of the axially symmetric diffusion tensor were obtained using
the standard formulas21 and . The two rotational friction coefficients werecalculated using the expressions:
(28)
(29)
where , and the viscosity η=0.89 × 110-3kg m-1s-1 = 0.891cP at T=300K.
is the radius of the sphere of equal volume to a cylindrical DNA for whichP=L/2b. For a DNA dodecamer the length L=38Å, the hydrodynamic radius b=10.Å, so P=1.9.The end cap correction in equation 29 is, according to Tirado and Garcia del la Torre22
(30)
With these assumptions, and using equations 29-30, D⊥ =3.59×10⁷ s-1 and D∥ =7.68×10⁷ s-1,
with the ratio .
As indicated by equation 27, in the calculation of solution relaxation rates it is necessary torelate the axis system within which the local motion is described, to the axis system associatedwith the rotational diffusion of the dodecamer. In the case of a DNA dodecamer, assumed tobe tumbling as a rigid cylinder, the latter axis system is defined as the principal axis system ofthe diffusion tensor, where the element D∥ is assumed to exist parallel to the helix axis. Atminimum is required the angle between dynamic axis of the harmonically moving C-D bondand the helical axis, which in equation 27 is designated γ1,D. Because of local structuralvariability in DNA, this angle may vary. Results for the solution simulations are thereforeplotted as a function of the angle β1,D (designated simply as β in Figure 8) to show theirdependence on it. The interior angle of the C-H bond vector to the plane of the interior motionwas taken either to be 88.5° (for C6-C2′ and C8-C2′.) or 127.5° (for C6-C1′ and C8-C1′). The
Echodu et al. Page 11
J Phys Chem B. Author manuscript; available in PMC 2009 August 31.
NIH
-PA Author Manuscript
NIH
-PA Author Manuscript
NIH
-PA Author Manuscript

solution calculations shown do not include contributions from chemical shift anisotropies; theireffects on relaxation times were also simulated but for aliphatic carbons with anisotropy ofabout 40 ppm, they exhibit less than 3% effect on relaxation times21.
IV. ResultsIn order to describe the line shapes observed for C6 and C8 and plotted in Figure 2, it isnecessary to take into account other types of motion that are present in the sample besides thelocal puckering of the furanose rings. Collective long range bending and torsional motions canbe neglected for a dodecameric DNAs at the hydration levels we used (W=10)14,15. Uniformend-to-end tumbling can also be neglected (although not in solution), since this type of motionis restricted in the solid-state, even with a sample of intermediate hydration (10 < W < 20).Previous work has shown that restricted uniform rotation of the DNA around the helix axisoccurs at W=10 and above, and can be effectively simulated by a six-site jump,28 with a halfangle of θ = 20° (representing the orientation of the local dynamic axis of the C2′-D bond withrespect to the longitudinal helix axis) and values of Φ = 0°, 60°, 120°, 180°, 240°, and 300°for the six sites; a rate constant of k ≈ 1.0×10⁴ Hz was successfully used to model these motions.The use of these parameters for the overall helix motion has produced good agreement inprevious work for several different DNA samples with different types of local motions.14
The simulated spectra that could fit the experimental results of Figure 2 were generated byconvolution of the uniform helical rotation and the local motion of the furanose ring. The localmotion was simulated as described in equations 1-4, where an exchange matrix is constructedwith equations 14 and 15. Numerical evaluation with MXET1 obtained a best fit forDi=1.8×10⁷ rad2 s-1, and κ=5 kBT, where T=300K., corresponding to about 12.5 kJ rad-2
mol-1. Minor differences in the powder line shape of C6 and C8 are likely due to smalldifferences in the hydration, while slightly different levels of HDO contribute to different levelsof intensity at the spectral centers. Differential hydration may also cause small differences inthe rates of the slow helical motions.
The powder-averaged spin-lattice recovery curves for the furanose deuterons of nucleotidesC6 and C8 are shown in Figure 3. Best fits to the recovery curves yield powder-averaged 2HT1’s of 29±3ms for the furanose deuteron of nucleotide C6 and 22±4ms nucleotide C8 (Table3); these values are statistically indistinguishable from one another. Of course, a powder-average reflects a sum over all crystallites so a powder-averaged recovery of longitudinalmagnetization should in principle be non-exponential. But as discussed in Vold & Vold18 andreference cited therein, in practice deviations from exponential recovery are usually small,especially in the intermediate exchange regime.
A) Predicting Deuterium Relaxation Times from Static Deuterium Line shapesHaving established the characteristics of the furanose motions from the simulation of the staticdeuterium line shapes, we then applied the same formalism to calculating solid state and thensolution relaxation times. Calculated T1 values for both solution and solid state are shown inFigure 4 for a range of internal diffusion constants. We found as expected that the solutionmeasurements are quite sensitive to motions above the ns level and quite insensitive to motionsof ms and slower. In the intermediate region of the Larmor frequency, Figure 4b, both solutionand solid state times depend on the internal diffusion constant, or in other words on the detailsof the internal motion modeled, though the effect is more dramatic in the solid state wherethere is an absence of global reorientational motion. Simulated powder-average deuteriumspin-lattice relaxation times are plotted in Figure 5 as functions of internal diffusion coefficient
Di and the ratio , which were obtained from equation 10 using the powder-averagedspectral density given in equation 26. The helix motion was neglected in the calculation of
Echodu et al. Page 12
J Phys Chem B. Author manuscript; available in PMC 2009 August 31.
NIH
-PA Author Manuscript
NIH
-PA Author Manuscript
NIH
-PA Author Manuscript

the 2H T1, since it occurs at a very low rate and therefore does not affect the 2H spin-latticerelaxation to any measurable extent.
These plots demonstrate that the 2H spin-lattice relaxation rates are strongly dependent on Di
but do not vary significantly as a function of the restoring force constant for values of less than 2.0 and more than 0.4. This relatively uniform behavior in κ is simply because the
observed range of κ values occurs near the minimum in T1; however, when , T1increases rapidly with κ (Figures 4a and 4b).
When we attempted to simulate the experimentally observed relaxation times using the valuesof κ and Di derived from our line shape simulations, we obtained T1 of 26 ms (Table 2). Thisresult is within experimental error of our results for both C6 and C8. These simulations alsoindicate that a small difference in Di, (which cannot be discerned easily in the line shapesimulation) could easily account for the small differences in the observed T1 values betweenthese two nucleotides.
B) Predicting Solution 13C Relaxation Times from Static Deuterium Line shapesNext we attempted to calculate the solution 13C relaxation rates using the model of local motionderived from the solid state powder lineshape and further supported by solid state 2H NMRrelaxation rates. In order to calculate solution relaxation times using the same formalism, theglobal rotational diffusion of the DNA had to be described as well, since these motions havea major contribution to solution relaxation. Thus, we assumed that global reorientationalmotion could be described by an ideal B-form DNA dodecamer with a ratio of hydrodynamic
parameters given by , as derived from the shape of the DNA helix and describedabove. The simulations of the solution 13C2′ spin lattice relaxation time (using equations 13and 27) demonstrate how the relaxation times depend on Di, κ, and D⊥ (Figures 6 and 7).The 13C spin-relaxation time is only moderately sensitive to changes in Di and κ, whereas evenmodest variation in D⊥ leads to large changes. Although the dependence of T1 on Di increasesas the value of D⊥ diminishes toward 106 rad2 s-1, T1 varies only slightly as a function of Difor values where D⊥ is close to or greater than the Tirado-Garcia del la Torre22 theoreticalvalue of 3.65×10⁷ rad2 s-1. The variation of T1 with D⊥ is shown on a logarithmic scale (Figure6b) to emphasize the relative sensitivity of T1 to Di and D⊥ . The sensitivity of T1 with respectto κ and D⊥, is shown also on a logarithmic scale in Figure 7, where Di =1.8×10⁷ rad2 s-1, thevalue derived from the 2H solid state line shape. When κ and D⊥ are varied together oversimilar ranges (by up to a factor of 10-15), the resulting variation in T1 is much greater forD⊥ than for κ. In contrast, there are substantial variations in T1 as a function of the orientationbetween the principal axis of the diffusion tensor zD and the z axis of the local dynamics frame,zC, as quantified by the angle β1,D, (designated simply β in Figure 7).
Small variations along the sequence were reported for the solution 13C T1’s for the 13C2′ spinsof this 12-mer DNA17. The simulations presented in Figure 6-8 strongly suggest that the mostlikely source of these small differences between for example the C6 and C8 nucleotide is localstructural variations that cause the angle β to vary between the two nucleotides.
In order to calculate the 13C2′ spin lattice relaxation times for the present DNA dodecamer,
we used the values of and Di obtained by fitting the solid state 2H line shapes (2.5 and
1.8×10⁷ rad2 s-1, respectively) and values of and D⊥ =3.65×10⁷ rad2 s-1 that wereobtained by describing global rotational motion of the DNA according to the approach of Tirado
Echodu et al. Page 13
J Phys Chem B. Author manuscript; available in PMC 2009 August 31.
NIH
-PA Author Manuscript
NIH
-PA Author Manuscript
NIH
-PA Author Manuscript
and Garcia del la Torre22. The calculated 13C2′ spin lattice relaxation time of 230 ms comparedvery well with the observed experimental values of 240.5 ±14.4 ms for 13C2′ in nucleotide C6and 202.9 ±12.2 ms for 13C2′ in nucleotide. Using equations 13 and 27, and again assumingβ = -40 degrees, we can also calculate the spin lattice relaxation times for the 13C1′ spins ofnucleotides C6 and C8. The simulated values (436 ms) compare again very well to theexperimental values (447.6 ± 4.5 ms and 449.7 ± 4.5 ms, Table 2).
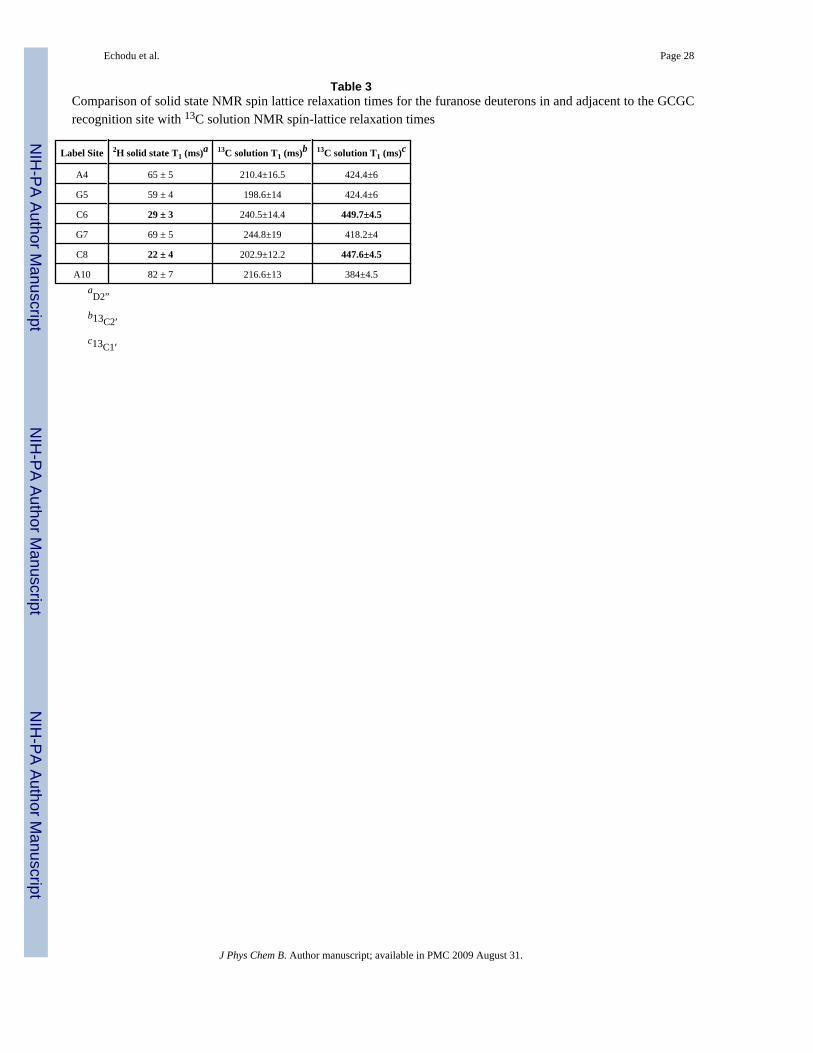
V. DiscussionSolution NMR has been widely used to probe biomolecular dynamics in proteins and, lessoften, in DNA and RNA10-12. This approach is a very powerful tool to investigate motions inthe ns-ps and ms-μs regimes, but the intervening broadly defined μs-ns range is less penetrableto most solution relaxation measurements. Thus, motions that may occur on this time scalehave for the most part been neglected in solution NMR studies of biomolecular dynamics.However, solid state NMR line shape and relaxation studies in both proteins and nucleic acidshave long reported that this intermediate time scale is host to a multitude of motions. Thedisparate sensitivities of these two techniques to motions detected by solution relaxationtechniques have been recently discussed for both DNA17 and RNA44. For example, for thefuranose ring of the HhaI methyltransferase target DNA, the solid state 2H T1′s of C8 and A10differ by almost 400% while the solution 13C T1’s at the same sites in the same molecules varyby less than 10%. A few recent solution NMR studies of both RNA and proteins based onresidual dipolar couplings have confirmed the motional richness of this regime, by contrastingorder parameter values obtained by relaxation measurements and order parameters derivedfrom residual dipolar couplings.45, 46 Thus, relying exclusively on solution relaxationmeasurements runs the risk that motions within this time scale will go undetected, and anincomplete or incorrect description of dynamics will be obtained.
We are confident that the joint application of solution and solid state NMR methods to studiesof dynamics has the potential to overcome this limitation of solution NMR methods to studyingdynamics. However, methods are needed in order to merge the experimental results obtainedby these two methods in a common interpretative framework. In this paper, we introduced atheoretical formalism that describes at the same time solution relaxation data and solid stateNMR line shape and relaxation data for the particular case of furanose rings in DNA. Althoughthe specific models used to fit solution and solid state relaxation data will differ, the importantpoint of this work is that a far more complete view of the internal motions in biologicalmolecules is obtained by analyzing data obtained by at least two dynamic spectroscopies,whose sensitivities to dynamic time scales are complementary, through a common theoreticalframework.
We demonstrate (Table 2) that a common model of dynamics that describes the internal motionsof the furanose rings derived from the analysis of solid state 2H measurements accuratelypredicts solid state and solution relaxation times. This was achieved by fitting the solid stateline shapes to specific motional models and by describing global rotational diffusions of theDNA using well-established hydrodynamic models. Thus, the motions observed in the hydratedsolid DNA together with the overall motions of the molecule in solution are sufficient toaccount for the solution spin-lattice relaxation and can be described through a commonformalism.
We emphasize that this approach is orthogonal to the commonly used model-free analysis47,48 of solution relaxation times in that a specific dynamic model, obtained from a partiallyaveraged solid state NMR powder pattern, is used as a starting point for analyzing solutionrelaxation data. Far from neglecting the detailed atomic motions responsible for the observedexperimental results, our approach is explicitly model-dependent and therefore provides
Echodu et al. Page 14
J Phys Chem B. Author manuscript; available in PMC 2009 August 31.
NIH
-PA Author Manuscript
NIH
-PA Author Manuscript
NIH
-PA Author Manuscript

information on the detailed nature of the localized biomolecular motions. The resultsdemonstrate that the very large differences we have reported experimentally in solid staterelaxation times and line shapes along the sequence of the HhaI target DNA (Table 3), ascompared to small differences in solution relaxation times, are due to local motions in the DNAfuranose rings that occur in the μs-ns timescale, a time scale to which solid state NMR isstrongly sensitive and to which solution NMR is less sensitive.
VI. ConclusionWe have demonstrated here an approach for describing biomolecular motions over a widedynamic range using solution and solid state relaxation and solid state line shape experimentalresults analyzed through a common formalism. The model dependence of the approachprovides insight into the detailed atomic characteristics of the motions responsible for theexperimental observables. The present results emphasize that by bridging the gap between nsand μs it is possible to obtain a more complete description of biological motion. We envisiona protocol to investigate dynamics in biology where 2H solid state NMR and 13C solution NMRare both used to probe motion within the ps-ns time scale; solid state 2H NMR is used to probethe ns-μs time scale; and relaxation dispersion experiments in solution and solid-state 2H lineshape analysis are used to probe the ms-μs regime.
AcknowledgementThe authors thank Professors Robert Vold, J. Michael Schurr and Bruce Robinson for helpful discussions ininterpreting relaxation and line shape data. This research was supported by a grant from the NIH RO1 EB03152 anda grant from the NSF MCB-0642253.
References(1). Feher VA, Cavanagh J. Nature 1999;400:289. [PubMed: 10421374](2). Lee AL, Wand AJ. Nature 2001;411:501. [PubMed: 11373686](3). Lee AL, Kinnear SA, Wand AJ. Nature Struct. Biol 2000;7:72. [PubMed: 10625431](4). Eisenmesser EZ, Bosco DA, Akke M, et al. Science 2002;295:1520. [PubMed: 11859194](5). Finerty P, Muhandiram R, Forman-Kay JD. Journal of Molecular Biology 2002;322:605. [PubMed:
12225753](6). Kay LE, Muhandiram DR, Wolf G, et al. Nature Structural Biology 1998;5:156.(7). Sugase K, Dyson HJ, Wright PE. Nature 2007;447:1021. [PubMed: 17522630](8). Fredrick KK, Marlow MS, Valentine KG, et al. Nature 2007;448:325. [PubMed: 17637663](9). Eisenmesser EZ, Millet O, Labeikovsky W, et al. Nature 2005;438:117. [PubMed: 16267559](10). Leulliot N, Varani G. Biochemistry 2001;40:7947. [PubMed: 11434763](11). Williamson JR. Nature Struct. Biol 2000;7:834. [PubMed: 11017187](12). Al-Hashimi HM. Biopolymers 2007;86:345. [PubMed: 17597469](13). Palmer AGI, Williams J, McDermott A. Journal of Physical Chemistry 1996;100:13293.(14). Meints GA, Drobny GP. Biochemistry 2001;40:12436. [PubMed: 11591165](15). Meints GA, Miller PA, Pederson K, Shajani Z, Drobny GP. J. Amer. Chem. Soc 2008;130:7305.
[PubMed: 18489097](16). Klimasauskas S, Kumar S, Roberts RJ, Cheng X. Cell 1994;76:357. [PubMed: 8293469](17). Miller PA, Shajani Z, Meints GA, Caplow D, Goobes G, Varani G, Drobny GP. J. Am. Chem. Soc
2006;128:15970. [PubMed: 17165714](18). Vold RR, Vold RL. Adv. Magn. & Opt. Reson 1991;16:85.(19). Torchia S, Szabo A. J. Magn. Reson 1982;49:107.(20). Spiess, HW. Dynamic NMR Spectroscopy. Springer-Verlag; New York: 1978.(21). Boisbouvier J, Wu Z, Ono A, Kainosho M, Bax A. J. Biomolecular NMR 2003;27:133.
Echodu et al. Page 15
J Phys Chem B. Author manuscript; available in PMC 2009 August 31.
NIH
-PA Author Manuscript
NIH
-PA Author Manuscript
NIH
-PA Author Manuscript
(22). Tirado MM, Garcia ed la Torre J. J. Chem. Phys 1980;73:1986.(23). Werbelow LG, Grant DM. J. Chem. Phys 1975;(63):4742.(24). London RE, Avitabile J. J. Chem. Phys 1976;65:2443.(25). Altona C, Sundaralingam M. J. Am. Chem. Soc 1972;94:8205. [PubMed: 5079964](26). Levitt M, Warshel A. J. Am. Chem. Soc 1978;100:2607.(27). Olson WK. J. Am. Chem. Soc 1982;104:278.(28). London RE, Avitabile J. J. Amer. Chem. Soc 1977;99:7765.(29). Wittebort RJ, Szabo A. J. Chem. Phys 1978;69:1722.(30). Edholm O, Blomberg C. Chem. Phys 1979;42:449.(31). London RE. J. Amer. Chem. Soc 1978;100:2678.(32). Herzyk P, Rabczenko A. Journal of the Chemical Society. Perkin Transactions II 1985:1925.(33). Meints GA, Karlsson T, Drobny GP. J. Am. Chem. Soc 2001;123:10030. [PubMed: 11592881](34). Nadler W, Schulten K. J. Chem. Phys 1986;84:4015.(35). Vold RR, Vold RL. J. Chem. Phys 1988;8(2):1443.(36). Agostini G, Nordio PL, Rigatti G, Segre U. Atti. Accad. Naz. Lincei 1975;13:1.Ser. 8(37). Freed JH. J. Chem. Phys 1977;66:4183.(38). Chanadrasekhar S. Rev. Modern. Phys 1943;15:1.(39). Risken, H. The Fokker-Planck Equation: Methods of Solution and Applications. Springer; Berlin:
1989.(40). Wang MC, Uhlenbeck GE. Rev. Modern. Phys 1945;17:323.(41). Shajani Z, Varani G. 13C Relaxation studies of HhaI methyltransferase target DNA reveal a unique
motional signature. Biochemistry. in revisions(42). Tycko R. Phys. Rev. Lett 1983;51:775.(43). deFontaine D, Ross D, Ternai B. J. Magn. Reson 1975;18:276–281.(44). Olsen G, Echodu D, Shajani-Yi Z, Bardaro M, Varani G, Drobny GP. Solid-State Deuterium NMR
Studies Reveal us-ns Motions in the HIV-1 TAR RNA Recognition Site. J. Amer. Chem. in press(45). Al-Hashimi HM, Patel DJ. J. Mol. Biol 2002;22:1.(46). Al-Hashimi HM, Gosser Y, Gorin A, Hu W, Majumdar A, Patel DJ. J. Mol. Biol 2002;315:95.
[PubMed: 11779230](47). Lipari G, Szabo A. J. Am. Chem. Soc 1982;104:4546.(48). Lipari G, Szabo A. J. Am. Chem. Soc 1982;104:4559.
Echodu et al. Page 16
J Phys Chem B. Author manuscript; available in PMC 2009 August 31.
NIH
-PA Author Manuscript
NIH
-PA Author Manuscript
NIH
-PA Author Manuscript
Echodu et al. Page 17
J Phys Chem B. Author manuscript; available in PMC 2009 August 31.
NIH
-PA Author Manuscript
NIH
-PA Author Manuscript
NIH
-PA Author Manuscript
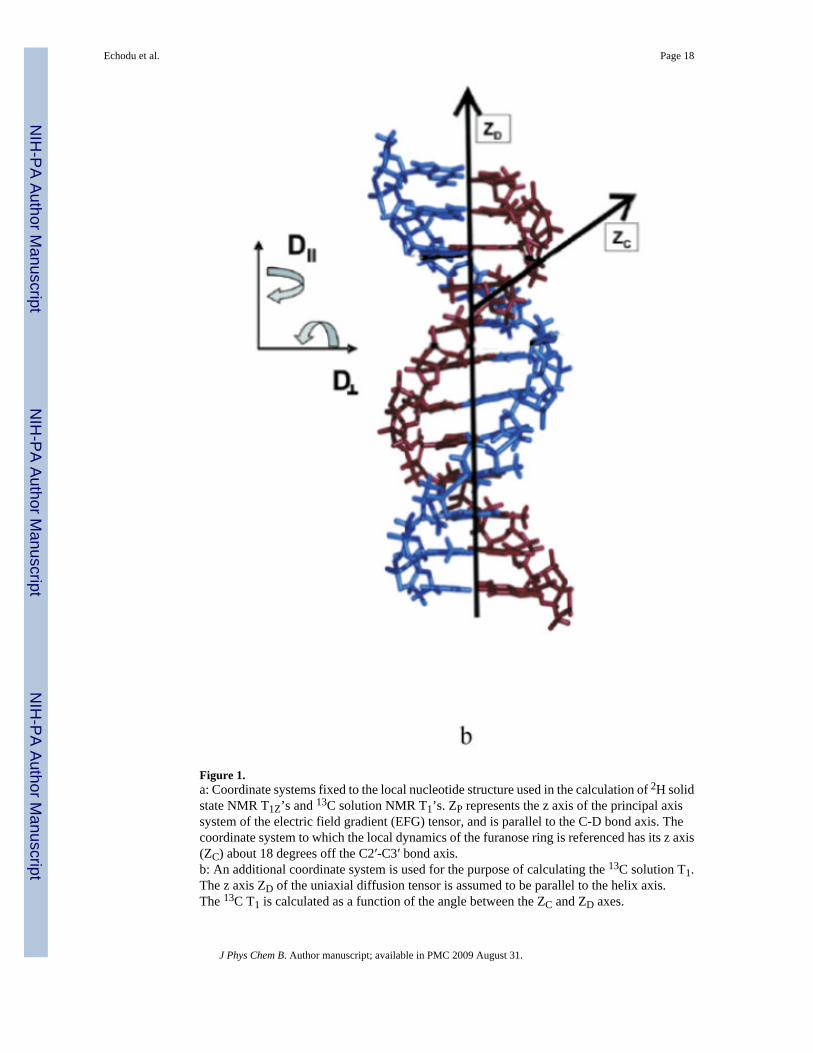
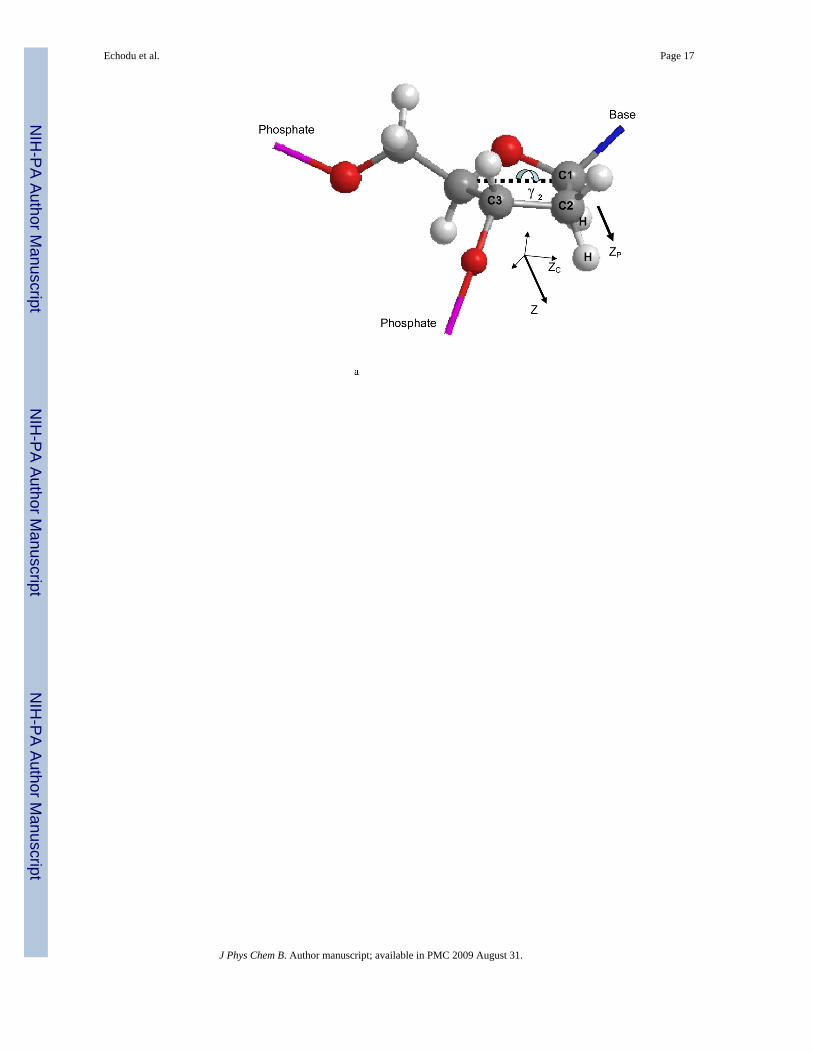
Figure 1.a: Coordinate systems fixed to the local nucleotide structure used in the calculation of 2H solidstate NMR T1Z’s and 13C solution NMR T1’s. ZP represents the z axis of the principal axissystem of the electric field gradient (EFG) tensor, and is parallel to the C-D bond axis. Thecoordinate system to which the local dynamics of the furanose ring is referenced has its z axis(ZC) about 18 degrees off the C2′-C3′ bond axis.b: An additional coordinate system is used for the purpose of calculating the 13C solution T1.The z axis ZD of the uniaxial diffusion tensor is assumed to be parallel to the helix axis.The 13C T1 is calculated as a function of the angle between the ZC and ZD axes.
Echodu et al. Page 18
J Phys Chem B. Author manuscript; available in PMC 2009 August 31.
NIH
-PA Author Manuscript
NIH
-PA Author Manuscript
NIH
-PA Author Manuscript

Figure 2.Experimental powder pattern line shapes and corresponding simulations recorded for the D2”deuterons of nucleotides C6 (a) and C8 (b). The data were collected at hydration levels of W=10and temperature T=300K. The line shape simulations are based on a model described in thetext, where dynamics of the furanose rings is treated as diffusion in a potential that seeks torestore the furanose ring to the C2′ endo conformation.
Echodu et al. Page 19
J Phys Chem B. Author manuscript; available in PMC 2009 August 31.
NIH
-PA Author Manuscript
NIH
-PA Author Manuscript
NIH
-PA Author Manuscript
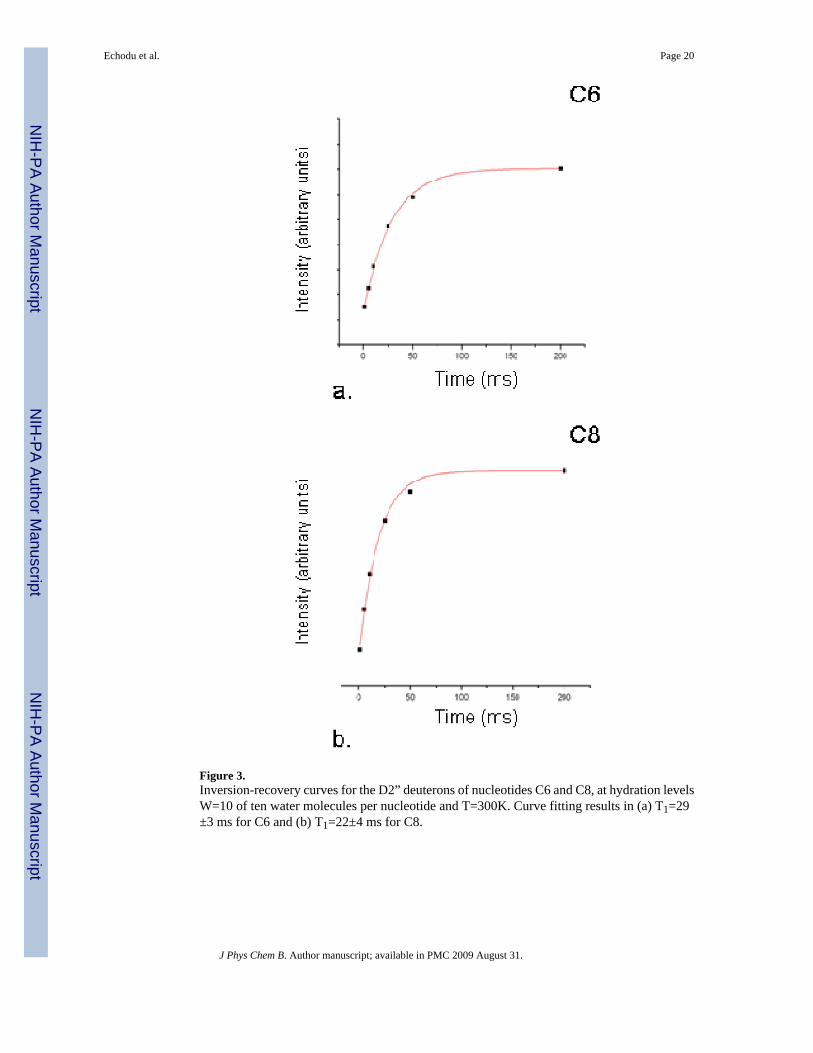
Figure 3.Inversion-recovery curves for the D2” deuterons of nucleotides C6 and C8, at hydration levelsW=10 of ten water molecules per nucleotide and T=300K. Curve fitting results in (a) T1=29±3 ms for C6 and (b) T1=22±4 ms for C8.
Echodu et al. Page 20
J Phys Chem B. Author manuscript; available in PMC 2009 August 31.
NIH
-PA Author Manuscript
NIH
-PA Author Manuscript
NIH
-PA Author Manuscript
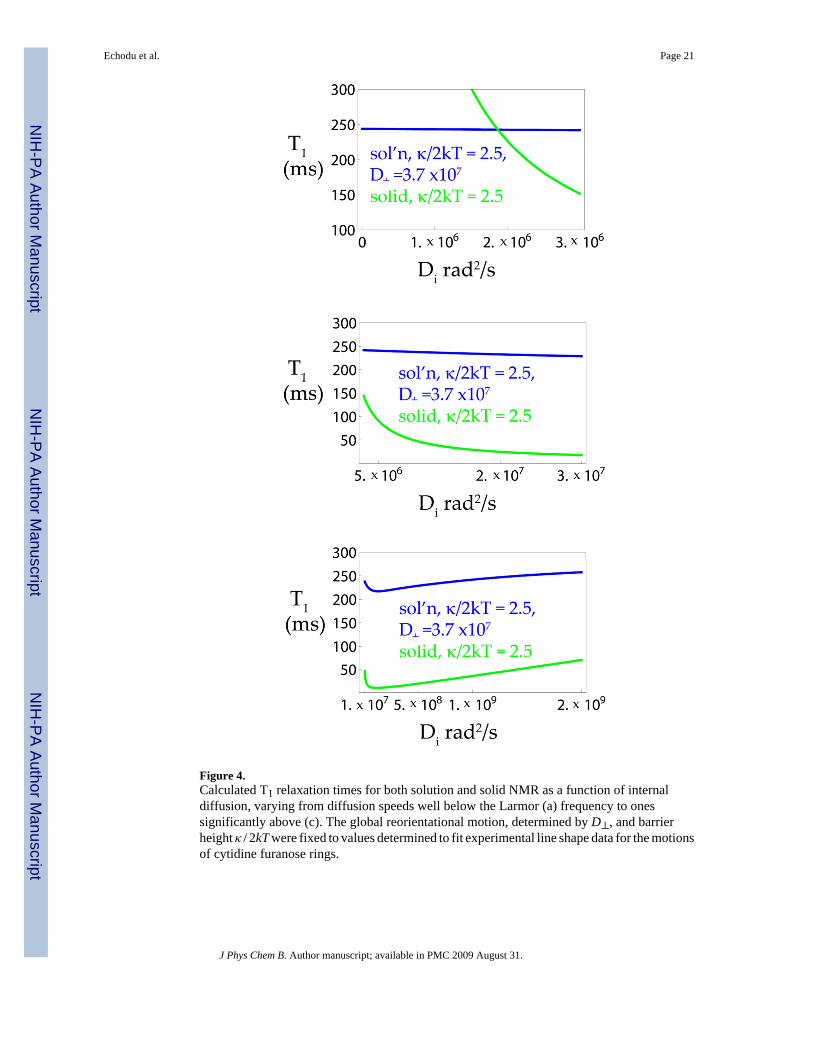
Figure 4.Calculated T1 relaxation times for both solution and solid NMR as a function of internaldiffusion, varying from diffusion speeds well below the Larmor (a) frequency to onessignificantly above (c). The global reorientational motion, determined by D⊥, and barrierheight κ / 2kT were fixed to values determined to fit experimental line shape data for the motionsof cytidine furanose rings.
Echodu et al. Page 21
J Phys Chem B. Author manuscript; available in PMC 2009 August 31.
NIH
-PA Author Manuscript
NIH
-PA Author Manuscript
NIH
-PA Author Manuscript
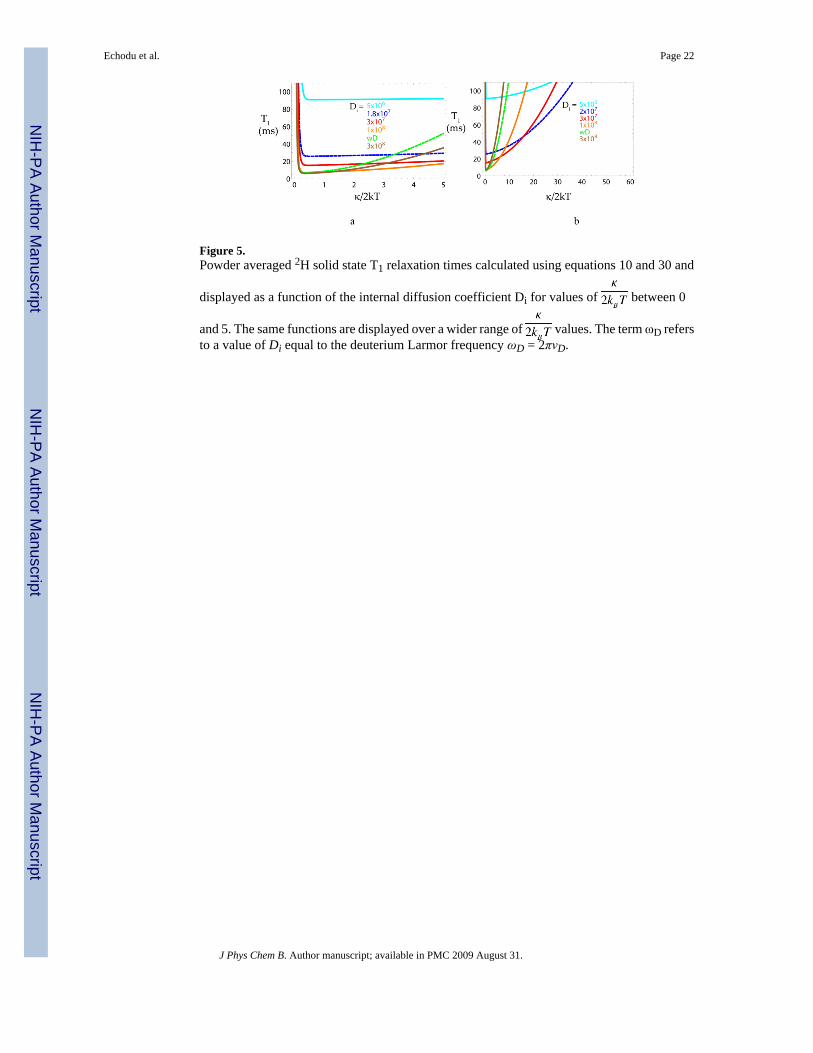
Figure 5.Powder averaged 2H solid state T1 relaxation times calculated using equations 10 and 30 and
displayed as a function of the internal diffusion coefficient Di for values of between 0
and 5. The same functions are displayed over a wider range of values. The term ωD refersto a value of Di equal to the deuterium Larmor frequency ωD = 2πνD.
Echodu et al. Page 22
J Phys Chem B. Author manuscript; available in PMC 2009 August 31.
NIH
-PA Author Manuscript
NIH
-PA Author Manuscript
NIH
-PA Author Manuscript

Figure 6.Solution-state 13C2′ T1 relaxation times calculated using equations 13 and 31, and plotted asa function of Di and D⊥. These results were obtained assuming that the global reorientationalmotion is describable by an ideal B-form DNA dodecamer with a ratio of hydrodynamic
diffusion parameters Because the furanose CSA’s are relatively small, pure dipolarrelaxation was assumed, and cross correlation effects were neglected.
Echodu et al. Page 23
J Phys Chem B. Author manuscript; available in PMC 2009 August 31.
NIH
-PA Author Manuscript
NIH
-PA Author Manuscript
NIH
-PA Author Manuscript

Figure 7.Solution T1 relaxation times for 13C2′ calculated using equations 13 and 31, and plotted as a
function of and D⊥. The same assumptions were made as in Figure 6.
Echodu et al. Page 24
J Phys Chem B. Author manuscript; available in PMC 2009 August 31.
NIH
-PA Author Manuscript
NIH
-PA Author Manuscript
NIH
-PA Author Manuscript

Figure 8.Solution T1 for 13C2′ nuclei calculated using equations 13 and 31, and plotted as a function of
β and Di. For these calculations, D⊥ =3.65×10⁷ rad2 s-1 and function of β and Di. For
these calculations, D⊥ =3.65×10⁷ rad2 s-1 and .
Echodu et al. Page 25
J Phys Chem B. Author manuscript; available in PMC 2009 August 31.
NIH
-PA Author Manuscript
NIH
-PA Author Manuscript
NIH
-PA Author Manuscript
NIH
-PA Author Manuscript
NIH
-PA Author Manuscript
NIH
-PA Author Manuscript
Echodu et al. Page 26
Table 1
Amplitudes calculated for n=0-8 and
n A00(n) A11
(n) A22(n) A21
(n)
0 1 0.819 0.449 0.607
1 0 0.164 0.359 0.243
2 0 .0164 0.144 0.049
3 0 1.09×10⁻³ 0.0383 6.47×10⁻³
4 0 5.46×10⁻⁵ 7.67×10⁻³ 6.47×10⁻⁴
5 0 2.18×10⁻⁶ 1.23×10⁻³ 5.18×10⁻⁵
6 0 7.28×10⁻⁸ 1.64×10⁻⁴ 3.45×10⁻⁶
7 0 2.08×10⁻⁹ 1.87×10⁻⁵ 1.97×10⁻⁷
8 0 0 1.87×10⁻⁶ 9.91×10⁻⁹
J Phys Chem B. Author manuscript; available in PMC 2009 August 31.

NIH
-PA Author Manuscript
NIH
-PA Author Manuscript
NIH
-PA Author Manuscript
Echodu et al. Page 27Ta
ble
2Ex
perim
enta
l and
sim
ulat
ed sp
in la
ttice
rela
xatio
n tim
es o
btai
ned
for t
he fu
rano
se d
eute
rons
and
13C
spin
s in
nucl
eotid
es C
6 an
d C
8
Loc
atio
n in
the
sequ
ence
Exp
erim
enta
l res
ults
(ms)
The
oret
ical
pre
dict
ions
(ms)
Ang
le w
ith h
elic
al a
xis
Ang
le w
ith in
tern
al m
otio
nal a
xis
T 1 so
lidC
8-C
2′-D
22 ±
426
N/A
88.5
°
T 1 so
lidC
6-C
2′-D
29 ±
326
N/A
88.5
°
T 1 so
lutio
nC
8-C
2′- H
2”20
2.9
±12.
223
0-4
0°88
.5°
T 1 so
lutio
nC
6-C
2′- H
2”24
0.5
±14.
423
0-4
0°88
.5°
T 1 so
lutio
nC
8-C
1′-H
”44
9.7
± 4.
543
6-4
0°10
9.5°
T 1 so
lutio
nC
6-C
1′-H
”44
7.6
±4.5
436
-40°
109.
5°
J Phys Chem B. Author manuscript; available in PMC 2009 August 31.
NIH
-PA Author Manuscript
NIH
-PA Author Manuscript
NIH
-PA Author Manuscript
Echodu et al. Page 28
Table 3Comparison of solid state NMR spin lattice relaxation times for the furanose deuterons in and adjacent to the GCGCrecognition site with 13C solution NMR spin-lattice relaxation times
Label Site 2H solid state T1 (ms)a 13C solution T1 (ms)b 13C solution T1 (ms)c
A4 65 ± 5 210.4±16.5 424.4±6
G5 59 ± 4 198.6±14 424.4±6
C6 29 ± 3 240.5±14.4 449.7±4.5
G7 69 ± 5 244.8±19 418.2±4
C8 22 ± 4 202.9±12.2 447.6±4.5
A10 82 ± 7 216.6±13 384±4.5aD2”
b13C2′
c13C1′
J Phys Chem B. Author manuscript; available in PMC 2009 August 31.