Dimer form of 1,3-Dimethyluracil studied by AM1 Semiempirical Method
Upload
khangminh22Category
view
0download
0
This journal is© the Owner Societies 2018 Phys. Chem. Chem. Phys., 2018, 20, 2457--2469 | 2457
Cite this:Phys.Chem.Chem.Phys.,
2018, 20, 2457
Photodissociation dynamics of acetone studied bytime-resolved ion imaging and photofragmentexcitation spectroscopy
Benjamin W. Toulson, † Dmitry A. Fishman and Craig Murray *
The photodissociation dynamics of acetone has been investigated using velocity-map ion imaging and
photofragment excitation (PHOFEX) spectroscopy across a range of wavelengths spanning the first
absorption band (236–308 nm). The radical products of the Norrish Type I dissociation, methyl and
acetyl, as well as the molecular product ketene have been detected by single-photon VUV ionization at
118 nm. Ketene appears to be formed with non-negligible yield at all wavelengths, with a maximum
value of F E 0.3 at 280 nm. The modest translational energy release is inconsistent with dissociation
over high barriers on the S0 surface, and ketene formation is tentatively assigned to a roaming pathway
involving frustrated dissociation to the radical products. Fast-moving radical products are detected at
l r 305 nm with total translational energy distributions that extend to the energetic limit, consistent
with dissociation occurring near-exclusively on the T1 surface following intersystem crossing. At
energies below the T1 barrier a statistical component indicative of S0 dissociation is observed, although
dissociation via the S1/S0 conical intersection is absent at shorter wavelengths, in contrast to
acetaldehyde. The methyl radical yield is enhanced over that of acetyl in PHOFEX spectra at l r 260 nm
due to the onset of secondary dissociation of internally excited acetyl radicals. Time-resolved ion
imaging experiments using picosecond duration pulses at 266 nm find an appearance time constant of
t = 1490 � 140 ps for CH3 radicals formed on T1. The associated rate is representative of S1 - T1intersystem crossing. At 284 nm, CH3 is formed on T1 with two distinct timescales: a fast o10 ns
component is accompanied by a slower component with t = 42 � 7 ns. A two-step mechanism involving
fast internal conversion, followed by slower intersystem crossing (S1 - S0 - T1) is proposed to explain
the slow component.
Introduction
Acetone (CH3COCH3) is the simplest ketone and its photo-dissociation is arguably one of the best studied photochemicalreactions. Interest in the photochemistry and photophysics ofacetone has been driven in part by its role in atmosphericchemistry, but alongside other organic carbonyls such as formal-dehyde and acetaldehyde, it is also a model system for investigatingthe role of intersystem crossing in photochemistry. The firstabsorption band is a weak broad continuum centered at 277 nmthat arises from excitation of a non-bonding electron to a p*antibonding orbital, giving rise to the S1 (1n,p*) and T1 (3n,p*)states. The S1 origin has been identified at 328.57 nm (30435 cm�1)by high-resolution laser-induced fluorescence spectroscopy.1,2
The higher lying S2 state has significant Rydberg character (n,3s)and has an origin at 195.2 nm (51230 cm�1). Absorption crosssections and photolysis quantum yields (as well as their pressureand temperature dependences) relevant to atmospheric chemistryare summarized in the most recent NASA/JPL evaluation.3
The photochemistry following excitation to the S2 state at193 nm has been studied extensively.4–9 Here, we focus ourdiscussion on the photochemistry resulting from excitation ofthe S1 state. The major photolysis channel is the Norrish Type Iprocess, in which the a-CC bond breaks to form acetyl andmethyl radicals:
CH3COCH3 - CH3CO + CH3 28 920 cm�1 l o 346 nm(I)
The threshold wavelength for the observation of radicalphotoproducts from acetone is 305.8 nm, ascribed to the presenceof a barrier on the T1 surface that must exceeded to reachproducts. The radical dissociation threshold was first identified
Department of Chemistry, University of California, Irvine, Irvine, CA 92697, USA.
E-mail: [email protected]; Tel: +1-949-824-4218† Current address: Chemical Sciences Division, Lawrence Berkeley NationalLaboratory, Berkeley, California 94720, USA.
Received 29th October 2017,Accepted 29th December 2017
DOI: 10.1039/c7cp07320h
rsc.li/pccp
PCCP
PAPER
Publ
ishe
d on
09
Janu
ary
2018
. Dow
nloa
ded
by U
nive
rsity
of C
alifo
rnia
- Ir
vine
on
7/17
/201
8 9:
00:3
7 PM
.
View Article OnlineView Journal | View Issue
2458 | Phys. Chem. Chem. Phys., 2018, 20, 2457--2469 This journal is© the Owner Societies 2018
by Copeland and Crosley,10 and is also evidenced in fluorescencemeasurements, which show a sharp decrease in lifetime at shorterwavelengths.11–16 Acetyl radicals may be formed with sufficientinternal energy to undergo secondary dissociation, and the triplefragmentation channel becomes increasingly important as l isdecreased.
CH3COCH3 - CH3 + CH3 + CO 32 200 cm�1 l o 311 nm(I0)
The photodissociation dynamics following excitation to S1has been investigated at 266 nm using 2 + 1 resonance-enhancedmultiphoton ionization (REMPI) detection of CH3 by Waitset al.17 and at 248 nm by North et al. using photofragmenttranslational spectroscopy (PTS).8 The average translationalenergy release was found to be similar at both wavelengths,amounting to around 5000 cm�1, indicating the role of the exitbarrier in partitioning the available energy. Secondary dissociationof acetyl was significant only at 248 nm and accounted for 30% ofradicals formed in the primary dissociation. Trajectory calculationsby Martınez-Nunez et al. initiated at the T1 barrier successfullyreproduced the translational energy distributions and secondaryacetyl dissociation determined from the PTS experiments.18
Recently, Lee et al. have reported an ion imaging study, inwhich 2 + 1 REMPI was used to detect CH3 fragments formedat several photolysis wavelengths in the range 266–312 nm.19
Two dissociation pathways with distinct translational energydistributions were observed. Excitation at l o 306 nm ledexclusively to products with large recoil kinetic energies,consistent with dissociation over the barrier on the T1 surface.As the photolysis wavelength was decreased, an increasingfraction of the available energy was portioned into internaldegrees of freedom of the radical products. At l 4 306 nm,an additional slow component was observed in the producttranslational energy distribution. This new pathway to channel(I) products was well-described by a statistical model andattributed to barrierless dissociation on the S0 surface.
Additional product channels leading to molecular productsare also energetically accessible after excitation to S1:
CH3COCH3 - CO + C2H6 1450 � 30 cm�1 l o 6892 nm(II)
CH3COCH3 - CH2CO + CH4 7310 cm�1 l o 1368 nm(III)
CO products formed at 230 nm have been found to havebimodal and J-dependent ET distributions in a velocity-map ionimaging study by Goncharov et al.20 The subset of slow-moving,low-J CO products was attributed to a roaming mechanism,while most CO products were assigned to production via thesecondary dissociation channel (I0). To the best of our knowledge,channel (III) primary products have not been detected followingexcitation to S1.
In addition to ‘conventional’ photochemistry experimentsusing nanosecond pulsed lasers, acetone has been the subject oftime-resolved measurements using femtosecond pulsed lasers,typically using mass spectrometric detection techniques.21–32
Excitation to S2 results in direct Norrish Type I dissociation onvery short (o200 fs) timescales.21–26 The mechanistic stepsfollowing excitation to S1 have been the subject of some debate,however, with some authors suggesting ultrafast dissociation28,29
and others favoring a relatively long-lived excited state, withintersystem crossing to T1 being rate limiting.27,30–32 Despitethe differing interpretations, the experimental results were infact remarkably consistent. The long-lived excited state inter-pretation has been confirmed by trajectory calculations andtime-resolved photoelectron spectroscopy measurements thatshow no signals attributable to acetyl fragments within the first100 ps.31,32 The ultrafast sub-picosecond signal observed intime-resolved mass spectrometry experiments was attributedto dephasing in the S1 state as the excited molecules move outof the Franck–Condon region, and out of the non-resonantmultiphoton ionization probe window. Various groups haveperformed ab initio calculations characterizing the minima,transition states, and surface crossings for acetone.30,33–36
In this paper, we report direct current (DC) slice imaging andphotofragment excitation (PHOFEX) spectroscopy measurementsexploring acetone photolysis over a broad range of wavelengthsspanning the first absorption band. Methyl and acetyl radicalproducts are formed with the available energy preferentiallypartitioned into translation, with the degree of internal excitationincreasing at shorter photolysis wavelengths, consistent withdissociation on the T1 surface. Time-resolved imaging measure-ments characterize the CH3 radical appearance times for formationon the T1 surface following excitation to S1 at 284 nm and 266 nm.The onset of the secondary dissociation, or triple fragmentation,channel (I0) is identified in PHOFEX spectra obtained simultaneouslyprobing the CH3 and CH3CO products.We also find a non-negligibleyield of the molecular product ketene at all photolysis wavelengths.The translational energy distributions confirm that CH2CO is formedon the singlet surface, and we tentatively suggest that a roamingmechanism may be responsible (Fig. 1).
Experimental methods
The experimental methods were identical to those used in ourrecent study of the near-UV photochemistry of acetaldehyde,37
combining photofragment excitation (PHOFEX) action spectroscopyand DC slice ion imaging.38 Both nanosecond and picosecondduration pulsed lasers were used. Briefly, a molecular beam ofacetone seeded in Ar was intersected by counter-propagatingphotolysis and probe beams. Photofragments were detected bysingle-photon VUV ionization at 118.2 nm, generated by frequencytripling the 355 nm output of either a nanosecond or picosecondpulsed Nd:YAG laser in a static Xe/Ar mixture.39 For the nano-second experiments, a mid-band optical parametric oscillator (6 nspulse duration, 5–7 cm�1 bandwidth) pumped by a Nd:YAG laser,provided tunable photolysis radiation in the range 236–308 nm.Picosecond time-resolved measurements were performed with the266 output of the same Nd:YAG laser (28 ps pulse duration) used togenerate VUV radiation; the relative time-delay was varied using acomputer-controlled delay line.
Paper PCCP
Publ
ishe
d on
09
Janu
ary
2018
. Dow
nloa
ded
by U
nive
rsity
of C
alifo
rnia
- Ir
vine
on
7/17
/201
8 9:
00:3
7 PM
. View Article Online

This journal is© the Owner Societies 2018 Phys. Chem. Chem. Phys., 2018, 20, 2457--2469 | 2459
Results1. DC slice ion imaging
DC sliced ion images of several acetone photofragments wererecorded at photolysis wavelengths spanning the range 236–308 nm. The radical products methyl and acetyl, and themolecular product ketene have ionization potentials (IPs) of9.84 eV, 7.0 eV, and 9.617 eV, respectively, and can be ionizedat 118 nm (10.49 eV). All product species were confirmed astwo-color signals in the time-of-flight mass spectrum. Acetoneitself has an IP of 9.703 eV and is efficiently ionized by the VUVprobe, leading to intense features in the centers of images aswell as weaker off-axis multiphoton background, despite gatingthe detector to preferentially observe the fragment of interestin the mass spectrum. Acquisition of VUV-only imagesallowed this background contribution to be subtracted. Aswith acetaldehyde,19,37,40 cluster formation in the supersonicexpansion can be a problem. However, operating in the earlypart of the gas pulse and pre-cooling the sample over iceallowed the cluster contribution to the images to be minimized,albeit at the cost of reduced ion counts. Fig. 2 shows typical rawion images of CH3, CH3CO, and CH2CO obtained at a photo-lysis wavelength of 274 nm. The dashed circles indicate themaximum speed, vmax, for the detected product if all availableenergy is partitioned into translation. Two limits are shown onthe ketene image as the photolysis wavelength provides enoughenergy to form either ground state singlet ketene, 1CH2CO,and electronically excited triplet ketene, 3CH2CO, which lies19 060 cm�1 higher in energy.
Photofragment speed distributions, P(v), are obtained bydirect integration of the images and appropriate Jacobian
transformation, and subsequently converted to total translationalenergy distributions, P(ET):
ET ¼ 1
2mA 1þmA
mB
� �vA
2
Here, mA and mB are the masses of the detected and undetectedfragments, respectively. From energy conservation, the availableenergy, EAVL, is partitioned between translation and internalexcitation of the radical fragments:
EAVL = hn � D0 = EINT + ET
The use of non-resonant universal ionization by VUV radiationmeans that the EINT appearing in the energy balance equationis the sum of EINT for both the detected and undetectedphotofragments.
Channel I: CH3 + CH3CO. The ion images of CH3 and CH3COshow distinct isotropic rings corresponding to speeds close tovmax (2.99 km s�1 and 1.04 km s�1, respectively, at 274 nm); thediffuse feature near the center of the image in Fig. 2 is back-ground signal likely caused by incomplete elimination ofclusters in the supersonic expansion. The ring appears in theimages at photolysis wavelengths l r 305 nm, consistent withthe onset of dissociation over the T1 barrier and the collapse ofthe S1 fluorescence lifetime at wavelengths less than 305.8 nm.16
As the photolysis wavelength is decreased, the ring broadensand increases in radius. The most probable speeds increasinglydeviate from vmax at shorter wavelengths. CH3 and CH3CO aremomentum-matched co-fragments, and consequently the totaltranslational energy distributions, P(ET), are the same aftersubtraction of background signals. At all photolysis wave-lengths, the ET distributions are unimodal and well-describedby a single Gaussian function. Between 304 nm and 248 nm, theaverage total translational energy, hETi increases near linearlyfrom B3000 cm�1 to B6000 cm�1, but the fraction of theavailable energy partitioned in to translation, fT = hETi/EAVL,decreases from B0.8 to 0.4. The ET distributions broadenslightly as the available energy increases, with the energy spread,quantified by the standard deviation, sET, increasing from 500–2200 cm�1. Using a dissociation energy of D0 = 28920 cm�1 forchannel (I), the ET distributions are transformed into EINTdistributions, summed over both fragments. The mean internal
Fig. 1 Schematic energy diagram for acetone photolysis. The shaded bluearea represents the range of photolysis wavelengths used (236–308 nm).Photoproducts detected by single-photon VUV ionization are emboldened.
Fig. 2 Raw ion images of methyl (CH3), acetyl (CH3CO), and ketene(CH2CO) fragments at a photolysis wavelength of 274 nm. Dashed circlesindicate the maximum speed, vmax; the outer blue and inner red circlesrepresent vmax for formation of singlet ketene and triplet ketene,respectively.
PCCP Paper
Publ
ishe
d on
09
Janu
ary
2018
. Dow
nloa
ded
by U
nive
rsity
of C
alifo
rnia
- Ir
vine
on
7/17
/201
8 9:
00:3
7 PM
. View Article Online

2460 | Phys. Chem. Chem. Phys., 2018, 20, 2457--2469 This journal is© the Owner Societies 2018
energy hEINTi, and the standard deviation of the EINT distribution,sEINT, are shown as a function of photolysis wavelength in Fig. 3.At longer wavelengths (l Z 306 nm), the excitation energy isinsufficient to surmount the T1 barrier. We also observe thestatistical component characterized in detail by Lee et al. that isattributed to dissociation on the S0 surface.
19
Channel III: CH2CO + CH4. Products observed at m/z = 42(CH2CO
+) were assigned to ketene, presumably formed inconjunction with CH4. Ion images were recorded over the range236–308 nm, using a photolysis-ionization time delay of around200 ns. By separating the photolysis and probe beams in time,background counts caused by the photolysis laser alonecould be eliminated from the slice acquired by the detector.The images are isotropic, and show a single broad featurecorresponding to production of CH2CO fragments with speedsof B1 km s�1. Fig. 4 shows the total translational energydistributions at photolysis wavelengths of 248 nm, 278 nmand 308 nm and the variation in hETi and sET with availableenergy. hETi increases from 5450 cm�1 to 9290 cm�1 as thephotolysis wavelength is decreased from 308 nm to 236 nm,while sET increases from 3150 cm�1 to 5810 cm�1 over thesame wavelength range. The channel (III) molecular productsCH2CO + CH4 lie only 7310 cm
�1 higher in energy than the acetoneparent. Values of EAVL are in the range 25200–35100 cm�1,significantly larger than those for the radical channel (I). Thefraction of EAVL partitioned into translation is independent ofphotolysis wavelength, and has an average value of 0.23 � 0.01.The remainder must be partitioned into internal degrees offreedom of the CH2CO and CH4 products, which, in addition to
rotation and vibration, can also include electronic excitation, asthe lowest triplet state of ketene, 3CH2CO, is accessible.
CH3COCH3 -3CH2CO + CH4 D0 = 26 370 � 100 cm�1
l o 379 nm (III0)
We note that the CH2CO ion image at 274 nm shown inFig. 2 appears at first glance to extend only as far as vmax
determined using the thermodynamic threshold for 3CH2COformation. However, the ET distributions, particularly at longerphotolysis wavelengths, show that a significant fraction of theproducts are formed with ET 4 ET,max for the triplet channel.The 308 nm data shown in Fig. 4 serve as an example. Aroundhalf the ET distribution extends beyond the triplet limit andwhile in general hEINTi is greater than the energy required toform triplet products at all photolysis wavelengths, the spreadin P(ET) represented by sEINT means that a significant fraction ofthe products have internal energies that are below the tripletthreshold. Again, we note that EINT here represents the sum ofthe internal energies of the CH2CO and the CH4 fragments.
2. Time-resolved ion imaging
CH3 radical appearance times were measured by recording ionimages as a function of the photolysis-ionization time delay, Dt.Measurements using the nanosecond pulsed lasers were madeover a 200 ns range at photolysis wavelengths of 254 nm,264 nm, 274 nm, and 284 nm. Only 284 nm photolysis led toa series of ion images that showed a time dependence; at theshorter wavelengths, CH3 production appears to be prompt onthe timescale of the laser pulses. The photolysis pulse alone
Fig. 3 Mean internal energy, hEINTi, derived from acetyl (blue circles)and methyl (red squares) EINT distributions as a function of photolysiswavelength. The shaded areas represent the standard deviations of thedistributions, sET, which were modelled using Gaussian functions. Dashedhorizontal lines represent the barriers for secondary dissociation ofCH3CO: 5950 � 350 cm�1 reported by North et al.44 and 4970 � 170 cm�1
reported by Tang et al.45
Fig. 4 (a) Total translational energy ET distributions derived from ionimages obtained probing ketene. Fits to a Gumbel distribution are shownin red. Dashed vertical lines indicate ET,max for formation of either singlet(blue) or triplet (red) ketene. (b) Mean internal energy, hEINTi, plotted as afunction of photolysis wavelength. Shaded region represents the standarddeviation of the ET distributions. The horizontal dashed red line representsthe threshold for formation of 3CH2CO.
Paper PCCP
Publ
ishe
d on
09
Janu
ary
2018
. Dow
nloa
ded
by U
nive
rsity
of C
alifo
rnia
- Ir
vine
on
7/17
/201
8 9:
00:3
7 PM
. View Article Online
This journal is© the Owner Societies 2018 Phys. Chem. Chem. Phys., 2018, 20, 2457--2469 | 2461
produced background m/z = 43 (CH3CO+) ion signal, that over-
whelmed the two-color signal and precluded any time-resolvedmeasurements detecting the acetyl radical.
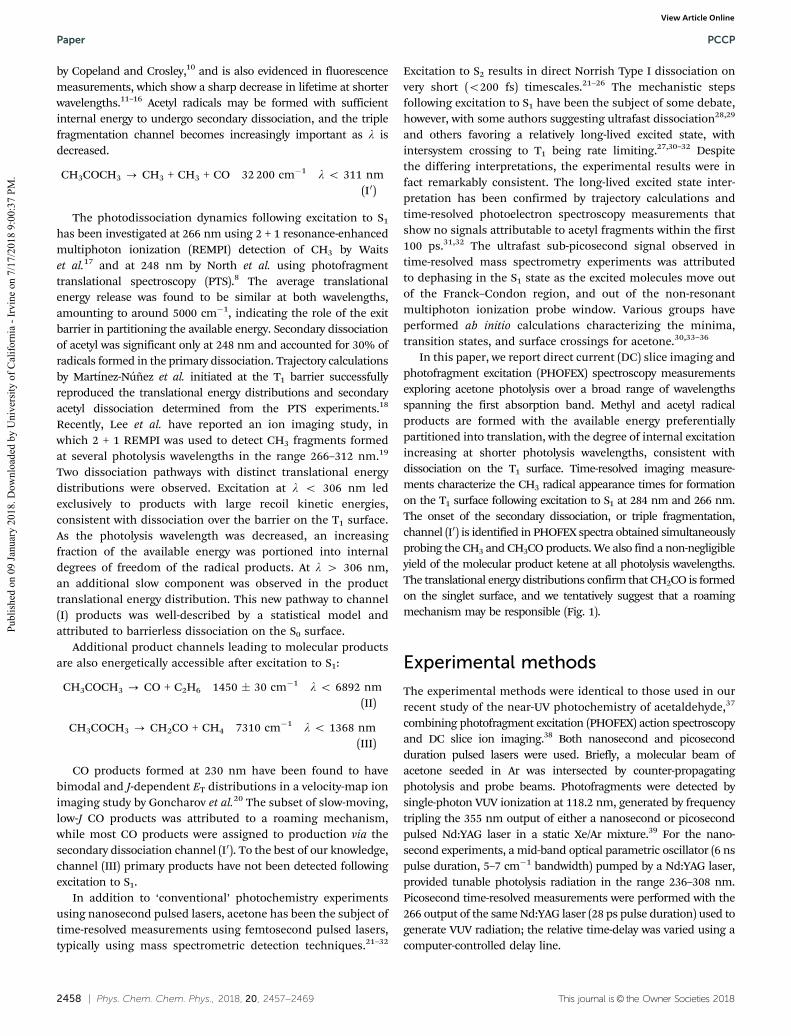
Fig. 5 shows a subset of the CH3 speed distributions derivedfrom a series of ion images recorded as Dt was varied over200 ns at a photolysis wavelength of 284 nm. The bottom tracein Fig. 5(a) was obtained with reversal of the time ordering ofthe laser pulses and represents a broad background signal thatextends far beyond vmax of 2700 m s�1 and is presumablycaused by multiphoton processes. The expected T1 componentappears strongly at early times and increases in magnitudeat longer delays. The shape of the distribution, which ischaracterized by a Gaussian function with average speed hviand standard deviation sv is independent of time delay; theaverage over the delays results in hhvii = 2230 � 10 m s�1 andhsvi = 360 � 20 m s�1. Fig. 5(b) shows the speed distributionsfor T1 products after subtraction of the background contribution.Aside from the increase in the magnitude, the speed distributionis otherwise unchanged over the range of delays; the averagespeeds, standard deviations, and the relative area of the T1component at each delay are shown in Fig. 6. Fitting the timedependence of the T1 signal to an exponential rise
SðtÞ ¼ A 1� expt� t0
t
� �h i
yields a time constant of t = 42 � 9 ns. We note that the fit doesnot pass through the origin, instead returning t0 = �21 � 7 ns.This offset is much greater than the 6 ns laser pulse durationor the uncertainty in the delay time, which is controlledelectronically and monitored with a fast photodiode. Constrainingthe value of t0 to be zero results in fit that is significantlypoorer, with t = 19 � 3 ns. It is clear from Fig. 5 that the T1
component is absent at Dt o 0 but is significant even at theshortest delay of Dt = +10 ns, accounting for around half themaximum signal observed.
Picosecond time-resolved measurements were performed ata fixed photolysis wavelength of 266 nm, again detectingproducts by single-photon VUV ionization at 118 nm. The timedelay between the laser pulses Dt could be varied between�1000 ps and +2500 ps using a computer-controlled delay line;once again, Dt 4 0 corresponds to the 266 nm pulse precedingthe 118 nm pulse. As in our previous work on acetaldehyde,37
the 118 nm ionization pulse readily ionizes the parent moleculeand reversing the time ordering of the laser pulses results in266 nm photodissociation of the CH3COCH3
+ cation, directlyproducing ionic fragments. Fig. 7 shows the variation of thetotal m/z = 15 (CH3
+) ion signal obtained from transient massspectra, recorded with electrodes configured for conventionalWiley–McLaren mass spectrometry. The CH3
+ ion signal increasesas Dt becomes both increasingly positive and negative. For Dto 0,the signal increases within the cross-correlation time of the laserpulses, and then remains constant. In contrast, the CH3
+ signalincreases more gradually for Dt 4 0.
The rising edge at Dt o 0 is instrument-limited. The con-volution of a Gaussian and Heaviside step function is used todescribe this signal:
SðtÞ ¼ A
21þ erf
t0 � tffiffiffi2
ps
� �� �
Here, t0 is the zero of time at which both photolysis and probelasers are overlapped and s is the Gaussian width representingthe cross-correlation time. The value of s was determinedby fitting transients for a dissociation known to be prompt(CH2I2 - CH2I + I) and was constrained during subsequentfitting. The value of s = 22 ps implies an instrument timeresolution of 37 ps. The slowly rising edge is modelled as theconvolution of a Gaussian function with the product of a
Fig. 5 Time-resolved CH3 speed distributions measured using nano-second pulsed lasers at a photolysis wavelength of 284 nm: (a) raw speeddistributions, (b) after subtraction of background signals. Red curves are fitsto the experimental data. Dashed vertical lines indicate vmax.
Fig. 6 Left axis: CH3 product appearance kinetics measured using nano-second pulsed lasers at 284 nm (black circles). The red curve is the fit to asingle exponential rise (red line). Right axis: The mean speed, hvi, ateach delay (blue squares). The blue shaded area represents the standarddeviation of the speed distribution, sv.
PCCP Paper
Publ
ishe
d on
09
Janu
ary
2018
. Dow
nloa
ded
by U
nive
rsity
of C
alifo
rnia
- Ir
vine
on
7/17
/201
8 9:
00:3
7 PM
. View Article Online

2462 | Phys. Chem. Chem. Phys., 2018, 20, 2457--2469 This journal is© the Owner Societies 2018
Heaviside function and a single exponential rise with timeconstant t:
SðtÞ ¼ A
21þ erf
t� t0ffiffiffi2
ps
� �� exp
s2 � 2 t� t0ð Þt2t2
� �
� 1þ erft� t0ð Þt� s2ffiffiffi
2p
st
� �� �
The transient ionization data in Fig. 7 was fit to a sum ofthese two functions, which describe the time evolution ofthe m/z = 15 signal at positive and negative Dt, respectively.The CH3 appearance time constant is determined to bet = 1350 � 530 ps.
Ion images of CH3+ were recorded at twelve different delays
between +115 ps and +2415 ps, as indicated in Fig. 7. The speeddistributions are bimodal at all time delays, as shown in Fig. 8.A broad, time-independent component peaks near 1.2 km s�1,and extends beyond the maximum speed of 3.2 km s�1, againsuggesting a multiphoton process is responsible. Superimposedis a time-dependent, translationally fast component peakingnear 2.4 km s�1 and with a FWHM of 1.0 km s�1 that is the sameas the speed distribution obtained in the nanosecond measure-ments and can be attributed to dissociation on the T1 surface.The speed distributions were fit to an exponentially-modifiedGaussian function and a Gaussian function to separate theoverlapping contributions. The fast Gaussian component comprisesaround 7% of the total speed distribution at Dt = +115 ps,
increasing to 23% at Dt = +2415 ps, which is consistent (withinerror) with the modest increase in the m/z = 15 signal observedin the transient mass spectra. The time evolution of the fastcomponent of the speed distribution following subtraction ofthe time-independent background signal is shown in Fig. 8.The mean speed and standard deviation of the fast-moving T1
component does not change with delay time: across all delayshhvii = 2360 � 20 m s�1 and hsvi = 570 � 40 m s�1. The area ofthe T1 component, shown as a function of delay time in Fig. 9,is fit to a single exponential rise, returning a time constant of1490 � 140 ps, which agrees with the rise time obtained fromthe transient ionization data. The fit returns t0 = �210 � 30 ps,which again is greater than would be expected from the instrumentfunction or uncertainties in the delay time. In this case, however,the apparent non-zero value of t0 could also arise from incompletesubtraction of the multiphoton background signal, which is farlarger than the time-resolved component. Constraining the fitby setting t0 = 0, yields a smaller time constant of 680 � 120 psand a poorer fit to the experimental data.
3. Photofragment excitation action spectroscopy
PHOFEX action spectra of CH3COCH3 were recorded over thewavelength range 235–291 nm. The spectra corresponding todetection of CH3, CH3CO and CH2CO fragments were extractedfrom the corresponding ion signals in wavelength-dependenttime-of-flight mass spectra. The photolysis-ionization timedelay was around 200 ns. The relatively long delay ensuresthat the PHOFEX spectra measure the asymptotic yield of eachfragments, at least for l r 284 nm where appearance times
Fig. 7 Transient m/z = 15 (CH3+) ion signal plotted as a function of time
delay, Dt, between 28 ps duration 266 nm and 118 nm pulses. Dt o 0corresponds to the 118 nm pulse preceding the 266 nm pulse; the signalarises from dissociation of the parent cation. Dt 4 0 corresponds the266 nm pulse preceding the 118 nm pulse; the signal arises from VUVionization of CH3 photofragments. A time-independent background signalalso contributes. The red curve is a fit to the experimental data,as described in the text. The time constant for the increasing signal atDt 4 0 is 1350 � 530 ps. Vertical lines indicate delays at which ion imageswere recorded.
Fig. 8 CH3 speed distributions at selected photolysis-ionization timedelays, Dt, as indicated, at a photolysis wavelength of 266 nm. (a) Completebimodal speed distributions, which comprise a broad, slow, and time-independent contribution and a narrow, fast, and time-dependent component.(b) Time-dependent component after subtraction of the slow component.Solid red curves are fits to the experimental data and dashed curvesindicate the individual components. The dashed vertical lines indicate vmax
of 3.2 km s�1.
Paper PCCP
Publ
ishe
d on
09
Janu
ary
2018
. Dow
nloa
ded
by U
nive
rsity
of C
alifo
rnia
- Ir
vine
on
7/17
/201
8 9:
00:3
7 PM
. View Article Online

This journal is© the Owner Societies 2018 Phys. Chem. Chem. Phys., 2018, 20, 2457--2469 | 2463
are short. The lower panel of Fig. 10 shows the PHOFEX spectra,which have been corrected for variation in the photolysis laserfluence across the wavelength region covered and the relativedetection sensitivities of the photofragments (discussed below).The spectra broadly follow the shape of the absorption band forall fragments. Unsurprisingly, probing the CH3 and CH3COradicals results in nearly identical spectra, with maximum yieldsobtained at 274 nm. The ratio of the raw CH3CO and CH3
signals is constant at l 4 260 nm; over the wavelength range281–291 nm, the average ratio is 1.71 � 0.07, indicating agreater detection sensitivity for acetyl than for methyl at118 nm, assuming the ionization efficiency is independent ofthe vibrational state. The photoionization cross section of CH3
at 118 nm has been reported to be 6.7 Mb,41 implying that thatof CH3CO is B11.4 Mb. The relative ease with which acetyl canbe detected using 118 nm ionization confirms our earlierassertion that the CH3CO + H channel of acetaldehyde is minor,as expected.37 The spectrum obtained detecting CH2CO isqualitatively similar, although the maximum yield is observedat a slightly longer wavelength of 278 nm. Ketene has a reportedphotoionization cross section at 118 nm of 24.8 Mb,42 almost fourtimes that of CH3, and appears to be formed with significant yield.
After correcting for the relative detection sensitivities of CH3
and CH3CO, the action spectra in Fig. 10 can be seen to divergeat l o 260 nm, where production of an excess of CH3 overCH3CO is observed. As the product pair for channel (I), onewould expect the relative yields of both to remain constant:
YCH3= YCH3CO = sFI
Here FI is the primary photolysis quantum yield for channel (I)and s is the absorption cross section – both are wavelength-dependent. However, secondary dissociation of internally excitedacetyl radicals leads to an increase in the relative yield of CH3 andcorresponding reduction in that of CH3CO.
CH3COCH3 + hn - CH3 + CH3CO* - CH3 + CH3 + CO I - I0
Including secondary dissociation, the yields of CH3 andCH3CO can be written as
YCH3= sFI(1 + fD) YCH3CO = sFI(1 � fD)
where fD is the fraction of CH3CO that dissociates, which inturn leads to
fD ¼ YCH3� YCH3CO
YCH3þ YCH3CO
The relative yields of CH3 and CH3CO are determineddirectly from the scaled PHOFEX spectra. The upper panel ofFig. 10 shows the fraction of internally excited CH3CO radicalsthat dissociate as a function of photolysis wavelength. Thefraction dissociated remains at zero until l o 260 nm, beyondwhich it increases steadily, reaching values of around 0.2 at theshortest photolysis wavelengths.
Discussion1. Radical channel: CH3 + CH3CO
Fast moving methyl and acetyl fragments are detected atphotolysis wavelengths l o 306 nm, which is consistent withthe observed shortening of the S1 fluorescence lifetime and the
Fig. 9 Left axis: Areas of the Gaussian components of the CH3 speeddistributions plotted against photolysis-ionization time delay, Dt. The redcurve is a fit of the experimental data to a single exponential rise with timeconstant is 1490 � 140 ps. Right axis: Mean speeds hvi (blue squares) andstandard deviations, sv (blue shaded area).
Fig. 10 Bottom panel: Photofragment excitation spectra of acetone probingmethyl (red), acetyl (blue), and ketene (green). The relative photofragmentyields were corrected for the respective photoionization cross sections, asdescribed in text, and subsequently scaled to match the channel (I) yield ofB0.6 at 280 nm.3 Top panel: Estimated fraction of acetyl primary productsthat subsequently dissociate to CH3 + CO. Dashed vertical lines and shadedareas show thresholds (and uncertainties) for the reported values of the acetyldissociation barrier.44,45
PCCP Paper
Publ
ishe
d on
09
Janu
ary
2018
. Dow
nloa
ded
by U
nive
rsity
of C
alifo
rnia
- Ir
vine
on
7/17
/201
8 9:
00:3
7 PM
. View Article Online
2464 | Phys. Chem. Chem. Phys., 2018, 20, 2457--2469 This journal is© the Owner Societies 2018
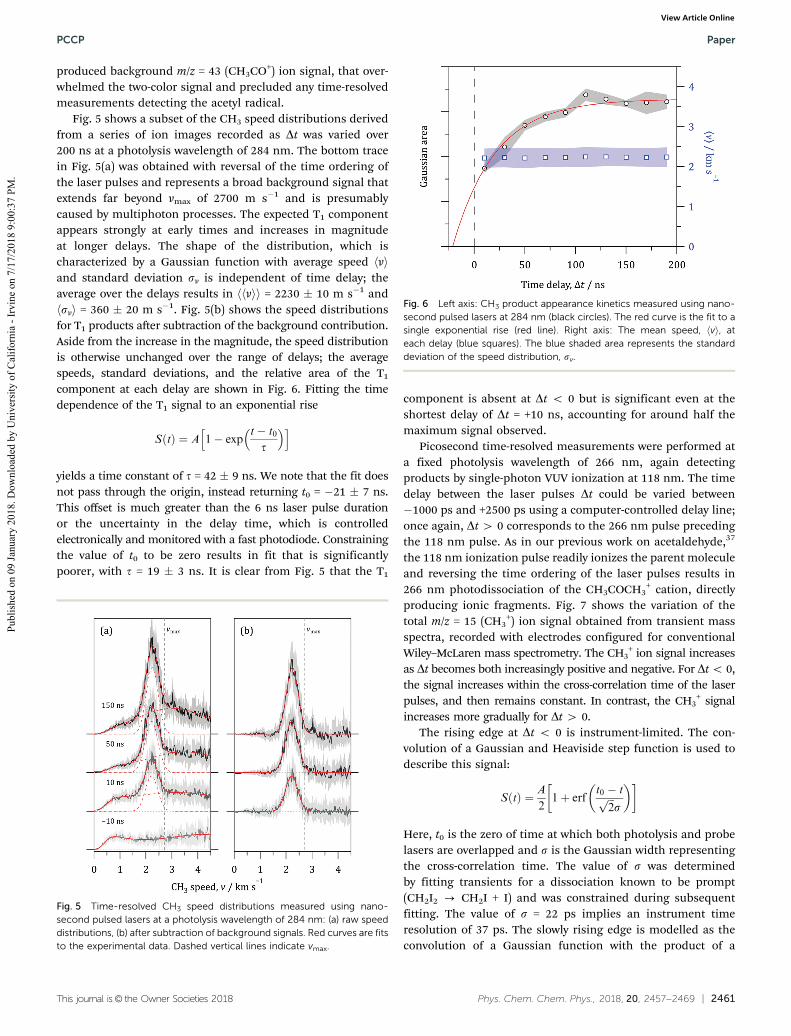
opening of the triplet dissociation channel.10,12–16,19 The ETdistributions are narrow and peak near ET,max at wavelengthscorresponding to excitation close to the T1 barrier. As theavailable energy is increased, the distributions broaden andthe peaks deviate ever more from ET,max, indicating a decreasingfraction of the available energy is partitioned into translation.Across the range 248–304 nm, EAVL for dissociation to the radicalproducts spans 4000–11400 cm�1. The mean translationalenergy, hETi increases linearly from 3000–5000 cm�1 and thestandard deviation sET increases from 500–2200 cm�1. Similarvalues are obtained probing either CH3 or CH3CO. The meantranslational energies are in moderately good agreementwith previous measurements. Waits et al. measured a value of3830 cm�1 for ET following photolysis at 266 nm, which isslightly lower than our value of 4620 cm�1. Better agreement isobtained with North et al. who reported hETi = 4970 cm�1 andsET = 1800 cm�1 at 248 nm, while our equivalent values are5100 and 2200 cm�1, respectively.8,17 In a recent ion imagingstudy, Lee et al.19 measured hETi values 3510–5430 cm�1 in thephotolysis wavelength range 304–266 nm, finding a linearrelationship between hETi and EAVL. In the same wavelengthrange, we find marginally lower values of hETi of 3260–4620 cm�1
while the linearity is maintained across the greater range of EAVL,albeit with a slightly gentler slope (0.25 rather than 0.33). Thelower values of hETi in the current work compared to thosemeasured by Lee et al. can be rationalized by the differentionization schemes used. The REMPI scheme used by Lee et al.selectively detects comparatively low-J levels of the vibrationalground state CH3, while VUV ionization detection of CH3 orCH3CO is universal, leading to contributions from internallyexcited radical fragments with lower recoil velocities. This effectis also evident in the slightly broader rings in the images whenusing VUV ionization. The radical ET distributions showsthe same photolysis wavelength dependence as observed foracetaldehyde,37 with fT values of approximately 0.8 near thresholddecreasing to around 0.5 at EAVL E 8000 cm�1. The trends areconsistent with earlier measurements and the conclusion thatdissociation occurs over the T1 barrier following intersystemcrossing.8,17,19 The change in the shapes of the ET distributionscan be explained by a mixed impulsive/statistical model in whichthe reverse barrier height largely dictates ET and the remainder ofEAVL is distributed statistically among the internal degrees offreedom of the radical products.19,43
The T1 mechanism leading to radical products shows manysimilarities to that of acetaldehyde but there are two significantdifferences. First, we see no evidence of an additional pathwayat shorter photolysis wavelengths that results from dissociationon S0 accessed via an S1/S0 conical intersection, and second, wedo see evidence of triple fragmentation in the PHOFEX spectra.Lee et al. reached a similar conclusion regarding the absence ofan S0 channel at shorter wavelengths, although their measure-ments extended only as far as 266 nm.19 Ab initio calculationshave placed the S1 barrier that must be overcome to reach theconical intersection at 38 000–46 700 cm�1, which implies athreshold wavelength range of 263–214 nm.30,34–36 The lack of anyclearly observable signal attributable to the conical intersection
channel suggests that the barrier lies to the higher energy end ofthe range predicted by theory. Measurements seeking to identifythis pathway at higher energies will, however, be complicatedby triple fragmentation. The methyl radical quantum yieldapproaches two at shorter photolysis wavelengths because ofsecondary dissociation of internally excited acetyl radicals[channel (I0)]. Previously, North et al. estimated the fraction ofacetyl photofragments that dissociate at 248 nm to be fD = 0.30.8
Accessing the triple fragmentation products requires a photonenergy of at least 32 200 cm�1, which corresponds to a thresh-old wavelength of 311 nm. However, the barrier to acetyldissociation pushes the threshold to shorter wavelengths.Values of 4970 � 180 cm�1 and 5950 � 350 cm�1 have beenreported for the acetyl exit channel barrier, implying thresholdwavelengths of 295 nm or 286 nm.44,45
The PHOFEX spectra in Fig. 10 suggest that the threshold forchannel (I0) is closer to 260 nm, or B9500 cm�1 above D0 forchannel (I). Secondary dissociation is only possible for thesubset of acetyl radicals formed with EINT greater than thebarrier, which is determined by the dynamics of the primarydissociation process. Acetyl radicals are primarily formed onthe T1 surface, which partitions most of the available energyinto translation. In the threshold wavelength range 286–295 nm,values of hEINTi are 1300–2000 cm�1, and the distributions arecharacterized by sET of 700–1000 cm�1. That is, at best, only thesubset of acetyl radicals with EINT more than three standarddeviations from the mean have enough energy to dissociate,assuming the lower barrier; at best, because EINT also contains anunquantified contribution from the methyl partner. Considerationof only threshold energies or wavelengths is unlikely to bepredictive for the onset of secondary dissociation, without firstunderstanding the energy partitioning of the primary dissociationprocess. The upper panel of Fig. 10 suggests fD E B0.12 at248 nm, which is smaller than the value of 0.30 determined byphotofragment translational spectroscopy by North et al.8 Theapparent discrepancy could arise from the time required foracetyl to undergo unimolecular dissociation, although RRKMcalculations suggest sub-nanosecond lifetimes for acetyl withinternal energy only slightly above the barrier.
Returning to the primary dissociation of the parent acetone, time-resolved measurements at 284 nm and 266 nm find appearancetime constants for CH3 of 42� 7 ns and 1490� 140 ps, respectively.In contrast to acetaldehyde,37 the time-dependent CH3 speed dis-tributions are unimodal and, in all regards, bear the hallmark ofdissociation occurring exclusively on the T1 surface. In the conven-tional view of carbonyl photochemistry, the rate limiting step for
product formation is either S1- T1 intersystem crossing, kS1!T1ISC , or
the subsequent dissociation on the T1 surface, kT1D . Excitation at
284 nm and 266 nm prepares the S1 state with energies 2500 cm�1
and 4900 cm�1 above the T1 barrier. RRKM calculations by Sakurai
and Kato find values of kT1D in the range 1011–1012 s�1 and conse-
quently T1 lifetimes of only 1–10 ps.33 Dissociation once on the T1surface is fast relative to the rate of intersystem crossing.
The CH3 appearance time constant at 266 nm is in excellentagreement with the fluorescence lifetime ofo1.6 ns at 260 nm,11
Paper PCCP
Publ
ishe
d on
09
Janu
ary
2018
. Dow
nloa
ded
by U
nive
rsity
of C
alifo
rnia
- Ir
vine
on
7/17
/201
8 9:
00:3
7 PM
. View Article Online

This journal is© the Owner Societies 2018 Phys. Chem. Chem. Phys., 2018, 20, 2457--2469 | 2465
implying that the loss of population from S1 is dominated by
kS1!T1ISC . Subsequent dissociation on the T1 surface happens on a
shorter timescale, as indicated by the results of the RRKMcalculations. The rate of intersystem crossing in acetone of
kS1!T1ISC ¼ 0:67� 0:06 ns�1 appears, therefore, to be around six
times slower than in acetaldehyde, where the CH3 appearance
time constant of 240 ps was attributed to a rate of kS1!T1ISC ¼
4:2 ns�1 at 266 nm. The difference in intersystem crossing ratesis surprising, as the spin–orbit coupling constants are similarand the T1 density of states is significantly greater in the largermolecule. Computational work by Maeda et al. has addressedthe issue of slow intersystem crossing in acetone,35 showingthat there is no explicit crossing between the S1 and T1 statesnear the Franck–Condon region and that the minimum energycrossing occurs at relatively high energy.
The picosecond time-resolved imaging measurements at266 nm suggest a small non-zero signal at t0, that could beindicative of (minor) product formation on a still faster time-scale. The dynamics following excitation to S1 has been thesubject of several femtosecond time-resolved measurementsusing mass spectrometry, ion imaging and photoelectronspectroscopy.27–32 While the experimental observations werein good agreement, substantially different interpretationswere offered, with some authors proposing direct impulsivedissociation and others arguing for a long-lived excited state.The CH3 speed distributions are characteristic of dissociationover a barrier, with the T1 state being the most likely candidate.While the change in the magnitude of the T1 component withincreasing delay is clear, we are reluctant to conclude that thereis a sub-ps component based on the current experimental data.As such, the results are consistent with the ultrafast study ofRusteika et al., who concluded that all a-CC fission occurs on atimescale greater than 100 ps.31 At the shortest nominal timedelay of 165 ps, the magnitude of the T1 component is smalland could be affected by inadequate subtraction of the time-independent background or uncertainty in the absolute time delay.
At 284 nm, the T1 products appear to be formed on twodistinct timescales. As noted above, RRKM calculations suggesta T1 lifetime of onlyB10 ps at 284 nm and dissociation once onT1 is effectively prompt on the nanosecond timescale of themeasurements. However, unlike at 266 nm where the CH3
formation time constant is comparable to the o1.6 ns fluores-cence lifetime, the 42 ns appearance time constant at 284 nm issignificantly longer than the comparably short fluorescencelifetimes of 1.7 ns and 2.9 ns measured at 270 nm and 295 nm,respectively.11 The unquantified o10 ns component is, however,consistent with the observed fluorescence lifetimes. If the slow
formation rate of 0.024 ns�1 were due to kS1!T1ISC , another
significantly faster non-radiative process, presumably S1 - S0internal conversion, must be active to remove population fromS1 otherwise fluorescence would be observed. Calculations byFavero et al. have suggested that S1 - S0 internal conversionmay be competitive with S1 - T1 intersystem crossing,36 with
similar rate constants for both processes (kS1!S0IC ¼ 4:8 ns�1 and
kS1!T1ISC ¼ 3:5 ns�1) and an overall S1 lifetime of around 2 ns that
is consistent with the experimentally observed fluorescencelifetime. The ps time-resolved time-of-flight spectra obtainedalso provide some experimental evidence to support competitiveinternal conversion at 266 nm. The parent ion signal increasesin magnitude for Dt 4 0 with a time constant of 3.7 � 2.1 ns,suggesting population transfer to a state that is ionized withgreater efficiency with a rate of 0.27 � 0.15 ns�1. Internalconversion to form hot S0 is more likely than T1, since the lattershould dissociate on a B1 ps timescale.
An intersystem crossing rate of kS1!T1ISC � 0:3 ns�1 would be
fast enough to account for the significant T1 componentobserved in the CH3 speed distributions at short delays, whichhas reached half its maximum by Dt = +10 ns. At longer timedelays, the CH3 speed distributions remain characteristic ofdissociation on T1, as shown in Fig. 5, with no time-dependentevolution of either hvi or sv. The slow increase in the CH3 signalcould be explained by a two-step mechanism in which population
is first transferred from S1 - S0 with rate kS1!S0IC and sub-
sequently from S0 - T1 with rate kS0!T1ISC . Rapid dissociation on
the T1 surface follows. If depopulation of S1 via kS1!S0IC is indeed
comparable to kS1!T1ISC , the observed slow appearance time
constant would be attributable to the rate of S0 - T1 inter-system crossing. The proposed sequential S1 - S0 - T1
mechanism for slow formation of radical products on T1 at284 nm relies on the viability of the S0 state to act as atemporary population reservoir, with a surprisingly long life-time on the order of several tens of nanoseconds. Unimoleculardissociation on S0 to CH3 + CH3CO would lead to a statisticalcomponent in the ET distribution, analogous to that observed atl 4 306 nm where the T1 mechanism is inaccessible, but is notobserved.19 Once on the S0 surface, several other pathways arelikely to be competitive with the proposed intersystem crossingto the T1 surface. Isomerization to propen-2-ol is also accessible,although the constancy of the speed distributions as a functionof delay time suggest that the slow onset is unlikely to be due todissociation of this species. Dissociation channels on S0 thatlead to molecular products such as ketene, as will be discussedbelow, would also be open. We note that CH2CO
+ is notobserved in the picosecond time-dependent mass spectra at266 nm, which is consistent with hot S0 produced via internalconversion having a relatively long lifetime. Variational transitionstate theory calculations to characterize the lifetime of hot S0would be helpful.
An alternative interpretation for the time dependence followingphotolysis at 284 nm is that the o10 ns component results fromfast S1 - T1 intersystem crossing, but the slower growth is due toanother process, such as secondary dissociation of hot CH3CO.For this to be the case, the ET distribution would have to beindistinguishable from that which results from dissociation onT1. Unimolecular decomposition of CH3CO also occurs over abarrier, although the reverse barrier height of 1680–2660 cm�1
is smaller than that on the acetone T1 surface of 3670 cm�1.44,45
Consequently, the ET distributions resulting from hot CH3COdissociation would be broader and peak at lower average ET thanthose observed for dissociation of the parent molecule on T1,
PCCP Paper
Publ
ishe
d on
09
Janu
ary
2018
. Dow
nloa
ded
by U
nive
rsity
of C
alifo
rnia
- Ir
vine
on
7/17
/201
8 9:
00:3
7 PM
. View Article Online

2466 | Phys. Chem. Chem. Phys., 2018, 20, 2457--2469 This journal is© the Owner Societies 2018
and a time-dependent evolution of the shape would be expected.Furthermore, secondary dissociation of hot CH3CO would lead toan enhancement of CH3 over CH3CO, an effect that is notobserved in the PHOFEX spectra until l o 260 nm.
2. Molecular channel: CH2CO + CH4
To the best of our knowledge, the molecular channel (III) hasnot been identified previously after photolysis of acetone inthe first absorption band, although it has been suggested as aminor channel that accounts forr0.02 of the overall photolysisyield at 193 nm.5 North et al. noted that no signal attributableto CH4 or CH2CO was observed in their PTS experiments at193 nm, but did not comment explicitly comment on thischannel at 248 nm.8 The absolute photoionization cross sectionsfor methyl and ketene near 118 nm and the channel (I) quantumyield at l4 279 nm are known, allowing the yield of channel (III)to be estimated. The PHOFEX spectra shown in Fig. 10 have beenscaled such that that FI = 0.6 at 280 nm, consistent with previousmeasurements.3 The quantum yield of channel (III) products isnot insignificant; it approaches half that of channel (I) acrossthe first absorption band, and reaching a surprisingly largemaximum value of FIII E 0.3 at 278 nm. The estimated ketenequantum yield relies on the assumption that internal excitationdoes not significantly affect the photoionization cross sectionand consequently the detection sensitivity. The translationalenergy distributions shown in Fig. 4 indicate that the molecularproducts are formed with significant internal excitation, whichmay enhance the photoionization cross section. A more reliabledetermination of the ketene quantum yield will require bettercharacterization of the detection sensitivity dependence on thedegree of internal excitation.
Although 3CH2CO is energetically accessible at the photo-lysis wavelengths used (the threshold is o379 nm), we rule itout as a possible product. First the ET distributions, particularlyat longer photolysis wavelengths (see Fig. 4), extend far beyondthe reduced value of ET,max that would result from electronicexcitation of ketene. Secondly, although hEINTi is larger than theenergy required to form 3CH2CO, the spread in the distributioncharacterized by sET means that the distributions extend signifi-cantly below the triplet origin. This effect is compounded whenone recalls that the EINT distributions are sums over both thedetected and undetected fragments. Any internal excitation ofthe CH4 co-fragment would reduce EINT(CH2CO) even furtherbelow the triplet energy. Secondary dissociation of acetyl radicalsto form CH2CO + H can also be ruled out on energetic grounds.Loss of a hydrogen atom from acetyl requires EINT 4 14700 cm�1,placing the threshold wavelength near 229 nm. At the shortestphotolysis wavelength of 236 nm, the value of hEINTi for both CH3
and CH3CO of around 10000 cm�1 falls short of the energyrequired. We conclude that CH2CO is formed in its singlet groundstate, and is not a product of a secondary dissociation.
Dissociation to form molecular products in organic carbonylscan occur on the S0 surface following internal conversion; suchpathways are well known in formaldehyde and acetaldehyde, andproceed via tight transition states at energies near the onsetof the radical channels.46 Infrared multiphoton dissociation
(IRMPD) of acetone under collision-free conditions showedno evidence of ketene formation.47 Ketene has been identifiedas a major product of acetone pyrolysis under collisionalconditions, likely due to secondary reactions.48 The absenceof ketene in the collision-free IRMPD experiments suggests thatthe barrier to dissociation on S0 is significantly higher than the28 920 cm�1 threshold for breaking a C–C bond to form radicalproducts while the observation of CH2CO at 308 nm suggestsan upper limit of 32 470 cm�1. The product energy partitioning,however, argue against dissociation via a conventional transitionstate on S0. As clearly demonstrated by the radical productformation on the T1 surface, dissociation over a barrier effectivelypartitions EAVL into translation (fT E 0.8 for methyl and acetylnear the T1 barrier). Yet for ketene, hETi values in the range 5500–9300 cm�1 mean that fT E 0.2, which is too small for dissociationover a high barrier. Alternatively, the modest values of hETi couldinstead be interpreted as indicating a reverse barrier of a similarheight; that is, it would imply a barrier on S0 for dissociation tomolecular products of around 13000 cm�1, significantly lowerthan the C–C bond dissociation energy. The failure then toobserve CH2CO as a product in the IRMPD work would be evenmore surprising, as this pathway would be by far the lowestenergy route to dissociation in acetone.
The supposed existence of high barriers on S0 for dissociationof acetone to form CH2CO + CH4 is confirmed by ab initiocalculations characterizing the transition state.49 We havealso identified an analogous transition state for unimoleculardissociation from the tautomer propen-2-ol. Attempts toidentify equivalent transition states on the T1 surface wereunsuccessful. Kable and co-workers have presented evidencefor phototautomerization to form vinyl alcohol from acetaldehydefollowing excitation in the near-UV and internal conversionto S0.
50,51 The equivalent tautomerization of acetone to formpropen-2-ol on S0 has been calculated to have a barrier of24 820 cm�1,35 and consequently is accessible at all excitationwavelengths. Optimized geometries of the transition states fordissociation of acetone and propen-2-ol have been calculatedat the MP2/def2-SVP level of theory using the MOLPRO2012.1 quantum chemistry package,49 while intrinsic reactioncoordinate calculations, shown in Fig. 11, confirm that thetransition states connect the expected reactants and productspecies. Relative to the channel (III) products, the reverse barrierheights are large and comparable: 24 000 cm�1 for acetone and29 000 cm�1 for propen-2-ol. Dissociation of either tautomer viaeither of these conventional transition states on S0 wouldpartition a large fraction of the available energy into translation,a signature that is absent from the experimental data. At thislevel of theory, the threshold wavelength for the moleculardissociation channel in propen-2-ol is predicted to be around267 nm.
A second mechanism known to lead to molecular productsin the photochemistry of organic carbonyls is roaming.52–55
Roaming in formaldehyde (or acetaldehyde) results in theformation of and highly internally excited H2 (or CH4), inconjunction with low-J CO, contrasting with the conventionalS0 transition state mechanism, which results in high-J CO and
Paper PCCP
Publ
ishe
d on
09
Janu
ary
2018
. Dow
nloa
ded
by U
nive
rsity
of C
alifo
rnia
- Ir
vine
on
7/17
/201
8 9:
00:3
7 PM
. View Article Online

This journal is© the Owner Societies 2018 Phys. Chem. Chem. Phys., 2018, 20, 2457--2469 | 2467
significant translational energy release.56–58 Goncharov et al.have identified signatures consistent with an analogousroaming mechanism in the photochemistry of acetone, findingJ-dependent bimodal CO ET distributions at 230 nm.20 The slowcomponent observed for low-J levels was attributed to roaming,while the broader faster component was attributed to secondarydissociation of internally excited CH3CO formed via channel (I).It is not immediately clear how an intramolecular reactionbetween nascent CH3 and CH3CO radicals could lead to theCO + C2H6 products. One possibility is a three-center transitionstate in which the C–C bonds in the nascent ethane and acetyl,form and break simultaneously. The other is an SN2-like reaction,although this mechanism is more typically observed in ion–molecule reactions (e.g. Cl� + CH3I - ClCH3 + I�) in the gas-phase.59 Kable and co-workers have suggested an analogousmechanism involving H + CH3CO roaming occurs inacetaldehyde.40 Formation of CH2CO + CH4, on the other hand,would require a simple H-atom abstraction, akin to roamingpathways identified in formaldehyde and acetaldehyde.52–55
Unfortunately, the current measurements do not determinepartitioning of EINT between the CH2CO and CH4 fragments,and cannot conclusively demonstrate roaming. If roaming isindeed the exclusive route to molecular products, then onewould expect that the intramolecular H-atom abstraction reactionbetween nascent CH3 and CH3CO would lead to highly internallyexcited CH4, as has been observed for the roamingmechanism inacetaldehyde.57 Imaging the ketene products using a state-resolvedresonant ionization approach60 would be a potentially insightfulmeasurement, allowing characterization of the correlated internalenergy distribution of the CH4 product. Confirmation that aroaming mechanism is responsible for the ketene-formingchannel will require theoretical support.
Conclusions
We have used single-photon universal VUV ionization to detectmolecular and radical products of acetone photolysis followingexcitation to S1. PHOFEX measurements characterize the relativeyields of the radical products, methyl and acetyl, and themolecularproduct ketene across a broad range of wavelengths. Ketene isformed with non-negligible yield. The observed partitioning ofthe available energy in ketene determined from ion imagingmeasurements is incompatible with dissociation over relativelyhigh barriers on S0, instead a roaming mechanism involvingfrustrated dissociation to the radical products CH3 + CH3COand subsequent intramolecular H-atom abstraction is proposed.The formation of radical products occurs primarily on the T1surface once sufficient energy is available to overcome thebarrier, although there is evidence of statistical dissociationon S0 at longer wavelengths. Picosecond time-resolved imagingat 266 nm reveals that the radical products are formed exclusivelyon T1 and characterize the rate of intersystem crossing, which issignificantly slower than in acetaldehyde. Slow formation on T1 at284 nm is reconciled with a significantly shorter fluorescencelifetime by a proposed two-step mechanism in which the S0 stateacts as a temporary population reservoir, prior to intersystemcrossing to the T1 surface upon which dissociation canoccur rapidly.
Conflicts of interest
There are no conflicts to declare.
Acknowledgements
This material is based upon work supported by the NationalScience Foundation under Grant No. CHE-1566064. CM andBWT are also grateful for support from AirUCI and the LaserSpectroscopy Facility.
References
1 M. Baba and I. Hanazaki, The S1,1A2(n,p*) State of Acetone
in a Supersonic Nozzle Beam. Methyl Internal Rotation,Chem. Phys. Lett., 1983, 103(2), 93–97.
2 M. Baba, I. Hanazaki and U. Nagashima, The S1(n,p*) Statesof Acetaldehyde and Acetone in Supersonic Nozzle Beam:Methyl Internal Rotation and CQO Out-of-plane Wagging,J. Chem. Phys., 1985, 82(9), 3938–3947.
3 J. B. Burkholder, S. P. Sander, J. Abbatt, J. R. Barker, R. E.Huie, C. E. Kolb, M. J. Kurylo, V. L. Orkin, D. M. Wilmouthand P. H. Wine, ‘‘Chemical Kinetics and PhotochemicalData for Use in Atmospheric Studies, Evaluation No. 18,’’JPL Publication 15–10, Jet Propulsion Laboratory, Pasadena,2015, http://jpldataeval.jpl.nasa.gov.
4 D. J. Donaldson and S. R. Leone, PhotofragmentationDynamics of Acetone of 193 nm: State Distributions of theCH3 and CO Fragments by Time- and Wavelength-resolvedInfrared Emission, J. Chem. Phys., 1986, 85(2), 817–824.
Fig. 11 Intrinsic reaction coordinates calculated at the MP2/def2-SVPlevel for keto–enol tautomerization (blue dashed) and dissociation ofacetone and propen-2-ol to form ketene + methane (red solid). Transitionstate geometries are shown. The shaded gray area represents the range ofexcitation energies used in the experiments.
PCCP Paper
Publ
ishe
d on
09
Janu
ary
2018
. Dow
nloa
ded
by U
nive
rsity
of C
alifo
rnia
- Ir
vine
on
7/17
/201
8 9:
00:3
7 PM
. View Article Online

2468 | Phys. Chem. Chem. Phys., 2018, 20, 2457--2469 This journal is© the Owner Societies 2018
5 P. D. Lightfoot, S. P. Kirwan and M. J. Pilling, Photolysis ofAcetone at 193.3 nm, J. Phys. Chem., 1988, 92(17), 4938–4946.
6 K. A. Trentelman, S. H. Kable, D. B. Moss and P. L. Houston,Photodissociation Dynamics of Acetone at 193 nm: Photo-fragment Internal and Translational Energy Distributions,J. Chem. Phys., 1989, 91(12), 7498–7513.
7 G. E. Hall, H. W. Metzler, J. T. Muckerman, J. M. Preses andR. E. Weston, Studies of the 193 nm Photolysis of DiethylKetone and Acetone Using Time-resolved Fourier TransformEmission Spectroscopy, J. Chem. Phys., 1995, 102(17), 6660–6668.
8 S. W. North, D. A. Blank, J. D. Gezelter, C. A. Longfellow andY. T. Lee, Evidence for Stepwise DissociationDynamics in Acetoneat 248 and 193 nm, J. Chem. Phys., 1995, 102(11), 4447–4460.
9 K. Takahashi, T. Nakayama, Y. Matsumi and Y. Osamura,Hydrogen Atom Formation in the Photolysis of Acetone at193 nm, J. Phys. Chem. A, 2004, 108(39), 8002–8008.
10 R. A. Copeland and D. R. Crosley, Radiative, Collisional andDissociative Processes in Triplet Acetone, Chem. Phys. Lett.,1985, 115(4), 362–368.
11 G. M. Breuer and E. K. C. Lee, Fluorescence Decay Times ofCyclic Ketones, Acetone, and Butanal in the Gas Phase,J. Phys. Chem., 1971, 75(7), 989–990.
12 O. Anner, H. Zuckermann and Y. Haas, Fluorescence Decayof Jet-Cooled Acetone, J. Phys. Chem., 1985, 89(8), 1336–1339.
13 H. Zuckermann, B. Schmitz and Y. Haas, DissociationEnergy of an Isolated Triplet Acetone Molecule, J. Phys.Chem., 1988, 92(17), 4835–4837.
14 H. Zuckermann, B. Schmitz and Y. Haas, Acetone Photo-physics in Seeded Supersonic Molecular Beams, J. Phys.Chem., 1989, 93(10), 4083–4091.
15 H. Zuckermann, Y. Haas, M. Drabbels, J. Heinze, W. L. Meerts,J. Reuss and J. van Bladel, Acetone, a Laser-Induced Fluores-cence Study with Rotational Resolution at 320 nm, Chem.Phys., 1992, 163(2), 193–208.
16 Y. Haas, Photochemical a-Cleavage of Ketones: RevisitingAcetone, Photochem. Photobiol. Sci., 2004, 3(1), 6–16.
17 L. D. Waits, R. J. Horwitz and J. A. Guest, TranslationalEnergy Study of CH3 Photofragments Following (n,p*)Excitation of Acetone, Chem. Phys., 1991, 155(1), 149–156.
18 E. Martınez-Nunez, A. Fernandez-Ramos, M. N. D. S. Cordeiro,S. A. Vazquez, F. J. Aoiz and L. Banares, A Direct ClassicalTrajectory Study of the Acetone Photodissociation on theTriplet Surface, J. Chem. Phys., 2003, 119(20), 10618–10625.
19 K. L. K. Lee, K. Nauta and S. H. Kable, Photodissociation ofAcetone from 266 to 312 nm: Dynamics of CH3 + CH3COChannels on the S0 and T1 States, J. Chem. Phys., 2017,146(4), 044304.
20 V. Goncharov, N. Herath and A. G. Suits, Roaming Dynamics inAcetone Dissociation, J. Phys. Chem. A, 2008, 112(39), 9423–9428.
21 S. K. Kim, S. Pedersen and A. H. Zewail, Direct FemtosecondObservation of the Transient Intermediate in the A-cleavageReaction of (CH3)2CO to 2CH3 + CO: Resolving the Issue ofConcertedness, J. Chem. Phys., 1995, 103(1), 477–480.
22 W.-K. Chen, J.-W. Ho and P.-Y. Cheng, Ultrafast PhotodissociationDynamics of the Acetone 3s Rydberg State at 195 nm: A NewMechanism, Chem. Phys. Lett., 2003, 380(3–4), 411–418.
23 W.-K. Chen, J.-W. Ho and P.-Y. Cheng, Ultrafast Photo-dissociation Dynamics of Acetone at 195 nm: I. Initial-State, Intermediate, and Product Temporal Evolutionsby Femtosecond Mass-Selected Multiphoton IonizationSpectroscopy, J. Phys. Chem. A, 2005, 109(31), 6805–6817.
24 W.-K. Chen and P.-Y. Cheng, Ultrafast PhotodissociationDynamics of Acetone at 195 nm: II. Unraveling ComplexThree-Body Dissociation Dynamics by Femtosecond Time-Resolved Photofragment Translational Spectroscopy, J. Phys.Chem. A, 2005, 109(31), 6818–6829.
25 S. A. Buzza, E. M. Snyder, D. A. Card, D. E. Folmer andA. W. Castleman Jr, Femtosecond Excitation Dynamics ofAcetone: Dissociation, Ionization, and the Evolution ofMultiply Charged Elemental Species, J. Chem. Phys., 1996,105(17), 7425–7431.
26 S. A. Buzza, E. M. Snyder and A. W. Castleman Jr, FurtherDirect Evidence for Stepwise Dissociation of Acetone andAcetone Clusters, J. Chem. Phys., 1996, 104(13), 5040–5047.
27 T. Shibata and T. Suzuki, Photofragment Ion Imaging withFemtosecond Laser Pulses, Chem. Phys. Lett., 1996, 262(1),115–119.
28 Q. Zhong, L. Poth and A. W. Castleman Jr, Ultrafast Dis-sociation Dynamics of Acetone: A Revisit to the S1 State and3s Rydberg State, J. Chem. Phys., 1999, 110(1), 192–196.
29 J. C. Owrutsky and A. P. Baronavski, Ultrafast Photo-dissociation Dynamics of the S1 and S2 States of Acetone,J. Chem. Phys., 1999, 110(23), 11206–11213.
30 E. W.-G. Diau, C. Kotting and A. H. Zewail, Femtochemistryof Norrish Type-I Reactions: I. Experimental and TheoreticalStudies of Acetone and Related Ketones on the S1 Surface,ChemPhysChem, 2001, 2(5), 273–293.
31 N. Rusteika, K. B. Møller and T. I. Sølling, New Insights onthe Photodynamics of Acetone Excited with 253–288 nmFemtosecond Pulses, Chem. Phys. Lett., 2008, 461(4–6), 193–197.
32 R. Y. Brogaard, T. I. Sølling and K. B. Møller, Initial Dynamics ofThe Norrish Type I Reaction in Acetone: Probing Wave PacketMotion, J. Phys. Chem. A, 2011, 115(5), 556–561.
33 H. Sakurai and S. Kato, A Theoretical Study of the NorrishType I Reaction of Acetone, J. Mol. Struct., 1999, 461, 145–152.
34 D. Liu, W.-H. Fang and X.-Y. Fu, An Ab Initio Study onPhotodissociation of Acetone, Chem. Phys. Lett., 2000, 325(1–3),86–92.
35 S. Maeda, K. Ohno and K. Morokuma, A Theoretical Studyon the Photodissociation of Acetone: Insight into the SlowIntersystem Crossing and Exploration of Nonadiabatic Path-ways to the Ground State, J. Phys. Chem. Lett., 2010, 1(12),1841–1845.
36 L. Favero, G. Granucci and M. Persico, Dynamics of AcetonePhotodissociation: A Surface Hopping Study, Phys. Chem.Chem. Phys., 2013, 15(47), 20651–20661.
37 B. W. Toulson, K. M. Kapnas, D. A. Fishman and C. Murray,Competing Pathways in the Near-UV Photochemistryof Acetaldehyde, Phys. Chem. Chem. Phys., 2017, 19(22),14276–14288.
38 D. Townsend, M. P. Minitti and A. G. Suits, Direct CurrentSlice Imaging, Rev. Sci. Instrum., 2003, 74(4), 2530–2539.
Paper PCCP
Publ
ishe
d on
09
Janu
ary
2018
. Dow
nloa
ded
by U
nive
rsity
of C
alifo
rnia
- Ir
vine
on
7/17
/201
8 9:
00:3
7 PM
. View Article Online

This journal is© the Owner Societies 2018 Phys. Chem. Chem. Phys., 2018, 20, 2457--2469 | 2469
39 A. H. Kung, J. F. Young and S. E. Harris, Generation of 1182Å Radiation in Phase-matched Mixtures of Inert Gases, Appl.Phys. Lett., 1973, 22(6), 301–302.
40 K. L. K. Lee, M. S. Quinn, A. T. Maccarone, K. Nauta, P. L.Houston, S. A. Reid, M. J. T. Jordan and S. H. Kable, TwoRoaming Pathways in the Photolysis of CH3CHO between328 and 308 nm, Chem. Sci., 2014, 5(12), 4633–4638.
41 B. Gans, L. A. V. Mendes, S. Boye-Peronne, S. Douin,G. Garcia, H. Soldi-Lose, B. K. C. de Miranda, C. Alcaraz,N. Carrasco and P. Pernot, et al., Determination of theAbsolute Photoionization Cross Sections of CH3 and I Producedfrom a Pyrolysis Source, by Combined Synchrotron and VacuumUltraviolet Laser Studies, J. Phys. Chem. A, 2010, 114(9),3237–3246.
42 B. Yang, J. Wang, T. A. Cool, N. Hansen, S. Skeen andD. L. Osborn, Absolute Photoionization Cross-Sections ofSome Combustion Intermediates, Int. J. Mass Spectrom.,2012, 309, 118–128.
43 D. H. Mordaunt, D. L. Osborn and D. M. Neumark, Non-statistical Unimolecular Dissociation over a Barrier, J. Chem.Phys., 1998, 108(6), 2448–2457.
44 S. North, D. A. Blank and Y. T. Lee, Determination of theBarrier Height to CH3CO Dissociation, Chem. Phys. Lett.,1994, 224(1), 38–42.
45 X. Tang, B. J. Ratliff, B. L. FitzPatrick and L. J. Butler,Determination of the Barrier Height for Acetyl RadicalDissociation from Acetyl Chloride Photodissociation at235 nm Using Velocity Map Imaging, J. Phys. Chem. B,2008, 112(50), 16050–16058.
46 B. F. Gherman, R. A. Friesner, T.-H. Wong, Z. Min andR. Bersohn, Photodissociation of Acetaldehyde: The CH4 +CO Channel, J. Chem. Phys., 2001, 114(14), 6128–6133.
47 C. L. Berrie, C. A. Longfellow, A. G. Suits and Y. T. Lee,Infrared Multiphoton Dissociation of Acetone in a Molecu-lar Beam, J. Phys. Chem. A, 2001, 105(12), 2557–2562.
48 S. H. Mousavipour and P. D. Pacey, Initiation and Abstrac-tion Reactions in the Pyrolysis of Acetone, J. Phys. Chem.,1996, 100(9), 3573–3579.
49 H.-J. Werner, P. J. Knowles, G. Knizia, F. R. Manby, M. Schutz,P. Celani, T. Korona, R. Lindh, A. Mitrushenkov, G. Rauhut,K. R. Shamasundar, T. B. Adler, R. D. Amos, A. Bernhardsson,A. Berning, D. L. Cooper, M. J. O. Deegan, A. J. Dobbyn, F. Eckert,E. Goll, C. Hampel, A. Hesselmann, G. Hetzer, T. Hrenar,
G. Jansen, C. Koppl, Y. Liu, A. W. Lloyd, R. A. Mata, A. J. May,S. J. McNicholas, W. Meyer, M. E. Mura, A. Nicklass, D. P. O’Neill,P. Palmieri, D. Peng, K. Pfluger, R. Pitzer, M. Reiher, T. Shiozaki,H. Stoll, A. J. Stone, R. Tarroni, T. Thorsteinsson and M. Wang,MOLPRO, Version 2012.1, a Package of Ab Initio Programs, seehttp://www.molpro.net.
50 A. E. Clubb, M. J. T. Jordan, S. H. Kable and D. L. Osborn,Phototautomerization of Acetaldehyde to Vinyl Alcohol: APrimary Process in UV-Irradiated Acetaldehyde from 295 to335 nm, J. Phys. Chem. Lett., 2012, 3522–3526.
51 D. U. Andrews, B. R. Heazlewood, A. T. Maccarone, T. Conroy,R. J. Payne, M. J. T. Jordan and S. H. Kable, Photo-Tautomerization of Acetaldehyde to Vinyl Alcohol: A PotentialRoute to Tropospheric Acids, Science, 2012, 337(6099),1203–1206.
52 A. G. Suits, Roaming Atoms and Radicals: A NewMechanismin Molecular Dissociation, Acc. Chem. Res., 2008, 41(7),873–881.
53 N. Herath and A. G. Suits, Roaming Radical Reactions,J. Phys. Chem. Lett., 2011, 2(6), 642–647.
54 J. M. Bowman and B. C. Shepler, Roaming Radicals, Annu.Rev. Phys. Chem., 2011, 62, 531–553.
55 J. M. R. Bowman, Roaming, Mol. Phys., 2014, 1–13.56 D. Townsend, S. A. Lahankar, S. K. Lee, S. D. Chambreau,
A. G. Suits, X. Zhang, J. Rheinecker, L. B. Harding and J. M.Bowman, The Roaming Atom: Straying from the ReactionPath in Formaldehyde Decomposition, Science, 2004,306(5699), 1158–1161.
57 P. L. Houston and S. H. Kable, Photodissociation of Acet-aldehyde as a Second Example of the Roaming Mechanism,Proc. Natl. Acad. Sci. U. S. A., 2006, 103(44), 16079–16082.
58 B. R. Heazlewood, M. J. T. Jordan, S. H. Kable, T. M. Selby,D. L. Osborn, B. C. Shepler, B. J. Braams and J. M. Bowman,Roaming Is the Dominant Mechanism for MolecularProducts in Acetaldehyde Photodissociation, Proc. Natl.Acad. Sci. U. S. A., 2008, 105(35), 12719–12724.
59 J. Mikosch, S. Trippel, C. Eichhorn, R. Otto, U. Lourderaj,J. X. Zhang, W. L. Hase, M. Weidemuller and R. Wester,Imaging Nucleophilic Substitution Dynamics, Science, 2008,319(5860), 183–186.
60 M. N. R. Ashfold, A. D. Couch, R. N. Dixon and B. Tutcher,Rydberg States of Ketene Revealed by Multiphoton IonizationSpectroscopy, J. Phys. Chem., 1988, 92(19), 5327–5332.
PCCP Paper
Publ
ishe
d on
09
Janu
ary
2018
. Dow
nloa
ded
by U
nive
rsity
of C
alifo
rnia
- Ir
vine
on
7/17
/201
8 9:
00:3
7 PM
. View Article Online
Copyright © 2022 FDOKUMEN