
Functional-thermoregulatory model for the differential diagnosis of psoriatic arthritis
23
This Provisional PDF corresponds to the article as it appeared upon acceptance. Fully formatted PDF and full text (HTML) versions will be made available soon. Functional-thermoregulatory model for the differential diagnosis of psoriatic arthritis BioMedical Engineering OnLine 2014, 13:162 doi:10.1186/1475-925X-13-162 Enas Ismail ([email protected]) Alessandra Capo ([email protected]) Paolo Amerio ([email protected]) Arcangelo Merla ([email protected]) ISSN 1475-925X Article type Research Submission date 11 July 2014 Acceptance date 5 December 2014 Publication date 11 December 2014 Article URL http://www.biomedical-engineering-online.com/content/13/1/162 This peer-reviewed article can be downloaded, printed and distributed freely for any purposes (see copyright notice below). Articles in BioMedical Engineering OnLine are listed in PubMed and archived at PubMed Central. For information about publishing your research in BioMedical Engineering OnLine or any BioMed Central journal, go to http://www.biomedical-engineering-online.com/authors/instructions/ For information about other BioMed Central publications go to http://www.biomedcentral.com/ BioMedical Engineering OnLine © 2014 Ismail et al. This is an Open Access article distributed under the terms of the Creative Commons Attribution License (http://creativecommons.org/licenses/by/4.0), which permits unrestricted use, distribution, and reproduction in any medium, provided the original work is properly credited. The Creative Commons Public Domain Dedication waiver (http://creativecommons.org/publicdomain/zero/1.0/) applies to the data made available in this article, unless otherwise stated.
Transcript of Functional-thermoregulatory model for the differential diagnosis of psoriatic arthritis

This Provisional PDF corresponds to the article as it appeared upon acceptance. Fully formattedPDF and full text (HTML) versions will be made available soon.
Functional-thermoregulatory model for the differential diagnosis of psoriaticarthritis
BioMedical Engineering OnLine 2014, 13:162 doi:10.1186/1475-925X-13-162
Enas Ismail ([email protected])Alessandra Capo ([email protected])
Paolo Amerio ([email protected])Arcangelo Merla ([email protected])
ISSN 1475-925X
Article type Research
Submission date 11 July 2014
Acceptance date 5 December 2014
Publication date 11 December 2014
Article URL http://www.biomedical-engineering-online.com/content/13/1/162
This peer-reviewed article can be downloaded, printed and distributed freely for any purposes (seecopyright notice below).
Articles in BioMedical Engineering OnLine are listed in PubMed and archived at PubMed Central.
For information about publishing your research in BioMedical Engineering OnLine or any BioMedCentral journal, go to
http://www.biomedical-engineering-online.com/authors/instructions/
For information about other BioMed Central publications go to
http://www.biomedcentral.com/
BioMedical Engineering OnLine
© 2014 Ismail et al.This is an Open Access article distributed under the terms of the Creative Commons Attribution License (http://creativecommons.org/licenses/by/4.0), which
permits unrestricted use, distribution, and reproduction in any medium, provided the original work is properly credited. The Creative Commons Public DomainDedication waiver (http://creativecommons.org/publicdomain/zero/1.0/) applies to the data made available in this article, unless otherwise stated.

Functional-thermoregulatory model for thedifferential diagnosis of psoriatic arthritis
Enas Ismail1,2∗
∗Corresponding authorEmail: [email protected]
Alessandra Capo3
Email: [email protected]
Paolo Amerio3
Email: [email protected]
Arcangelo Merla1,2
Email: [email protected]
1Department of Neuroscience, Imaging and Clinical Sciences, University"G. d’Annunzio",Via dei Vestini, 31, 66013 Chieti, Italy
2ITAB -Institute of Advanced Biomedical Technologies, Via dei Vestini, 32,66013 Chieti,Italy
3Dipartimento di Medicina e Scienze dell’ Invecchiamento, University "G. d’Annunzio",Chieti-Pescara, Italy
Abstract
Introduction
Psoriasis arthritis (PsA) is a chronic inflammatory arthritis of joints of uncertainpathogenesis. PsAmay lead to severe disabilities even in the absence of any clinical symptom. Therefore, PsA diagnosisin its early stages is critical.
Material and methods
This study uses Control System theory to model finger skin thermoregulatory processes overlying thehand joint in response to an isometric exercise. The proposed model is based on a homeostatic negativefeedback loop characterized by four distinct parameters that describehow the control mechanisms areactivated and maintained. Thermal infrared imaging was used to record a total of 280 temperaturecurves of 14 finger joints for each of 11 PsA patients and 9 healthy controls.
Result and conclusion
PsA patients presented delayed and prolonged re-warming processes characterized by the undershootonset after the end of the isometric exercise followed by a faster temperature increase. Region clas-sification on the basis of the model parameters demonstrated that the interphalageal joint region ofthumb better discriminates between patients and controls, providing 100% true-positive discrimina-tion for PsA affected regions and 88.89% of correct classification of healthy regions. Even provedover a limited number of subjects, the proposed method may provide useful hints for early differentialdiagnosis in the IR assessment of PsA disease.

Keywords
Control system, Cutaneous temperature, Modeling, Psoriatic arthritis, Thermal infrared imaging, Iso-metric exercise, Multinomial logistic regression
Introduction
Psoriasis (PsO) is a chronic, complex, immuno-inflammatory disease involving the skin and the mus-culoskeletal structures [1]. Psoriasis arthritis (PsA) is a chronic inflammatory arthritis of uncertainpathogenesis that affects around 25% of worldwide psoriatic patients [1]. PsA commonly affects thetips of fingers and toes [2]. Psoriasis skin lesions typically precede the onset of joint symptoms, damageperipheral and axial joints by 10 months of symptom onset in around 27% ofpatients and 2 years ofsymptom onset in 47% of patients [1]. After that period, patients experience severe disabilities such asdifficulty with grasping their hand [1,2]. The diagnosis of PsA is not always immediate since there arenot specific circulating markers and its symptoms are frequently unstable. Ultrasonography (US) andmagnetic resonance (MRI) are considered the gold standard imaging methods for documenting clinicaland sub-clinical PsA [1]. However, their use in clinical routine for earlydiagnosis of PsA may be lim-ited by their cost (especially MRI) or dependency on the operator’ skill (especially US) [2,3]. Localthermoregulatory malfunctions were found to be manifested by the presenceof PsA disorder [4]. Infact, psoriatic skin vascular features may induce large thermal changes inskin temperature in psoriaticplaques [3-5], however little is known about the effect of the joint inflammatory process of PsA on nor-mal skin overlying affected joints in PsA patients. Infrared (IR) imaging is a non-invasive diagnostictechnique that is able to provide two-dimensional maps of the cutaneous temperature distribution ofa given body by measuring emitted infrared energy [6,7]. Moreover, since the cutaneous temperaturedepends on the local blood perfusion and thermal tissue properties, functional Infrared imaging (fIR)provides a dynamical and functional indirect evaluation of local haematic flow, thermal properties andthe functionality of thermoregulatory effectors of the cutaneous tissue in both basal conditions or inresponse to stimuli [6,7]. Many inflammatory joint diseases such as RheumatoidArthritis (RA) andJuvenile Arthritis have been studied with fIR [8,9]. In RA for example a direct relationship betweendisease activity ( Ritchie score, morning stiffness) and skin temperature asfor the heat distribution in-dex was demonstrated. Several IR imaging studies have been performed todifferentiate PsA plaqueskin [1,4,10]. However, to our best knowledge, no study with the exception of our pilot study (Capoet al., [11]) has ever been performed to study the thermal changes of skin overlying joint in PsA thatmay be manifested by the PsA inflammatory condition that may present on the distalinterphalangealjoints as well as larger joints. Moreover, while most of the IR diagnostic studies of PsA were usuallyperformed on the basis of static IR evaluation (without performing any challenged/diagnostic test) ofthe abnormalities in the corresponding thermal pattern [1,4,10], a dynamic andfunctional IR evaluationof temperature changes at skin overlying the proximal and distal interphalangeal Joints of PsA patientsin both basal conditions or in response to functional (isometric) exercise israre. Studies have shownthat skin blood flow (and thus indirectly cutaneous temperature) during isometric exercise undergoes alimitation due to cutaneous vasoconstriction [7]. Recently, isometric exercise was evident to be poten-tially able to elicit significantly different thermal responses in both healthy andPsA patient groups [12].However, such evidence was based on a qualitative study without providing a broad understanding ofthe complex mechanism underlying thermoregulation malfunctions in this disease [12]. Therefore, aquantitative evaluation of the cutaneous temperature, overlying skin overlying the proximal and distalInterphalangeal Joints of PsA patients in both basal conditions and in response to functional (isometric)exercise, could provide a functional indicator of the hypothetical PsA-related thermoregulatory mal-functions of skin overlying joints thus providing a mean to assess indirectly PsA disease activity andhelp its primary diagnosis. Recently, control theory has been used to modeldifferent thermal responsesdue to pathological, functional, and morphological alterations in the skin thermoregulation system asso-ciated with vascular diseases like Raynaud’ phenomenon (RP) [6,7,12,13]. Ismail et al [12,13] adopted
a prototype second-order control system to model the skin thermal recovery response to a mild coldchallenge. They suggested that the direct estimation of its time domain characteristics could providean effective description of the local thermoregulatory malfunctions in the percense of RP disease andVaricocele. Mariotti et al [6,7] proposed a thermoregulatory model based on a homeostatic negativefeedback loop characterized by four distinct functional parameters, which describe how thermal controlmechanisms are activated and maintained in response to a cold challenge in the percense of RP diseaseand Varicocele. Due to the model limitation of the direct estimation approach [12,13], in this study, wepropose to implement the model proposed by Mariotti et al. [6] to evaluate howthe PsA joint inflam-matory characteristics affect the skin thermal recovery capability in response to isometric exercise. Weexpect that the application of such model may help in the primary diagnosis of PsA.
Modeling cutaneous thermoregulatory effectors for isometric exercise
Cutaneous circulation is a major effector of human thermoregulation [14]. Cutaneous vessels dilate orconstrict in response to either thermal stress, i.e. temperature changes, arose exogenously from varia-tions in environmental temperatures or endogenously from the body itself, as occurs during isometricexercise [14,15]. The initiation of isometric hand grip exercise has a little effect on the cutaneous cir-culation in nonglabrous (hairly) skin, whereas the activation of vasodilator system at skin overlyingthe the PSA inflamed joint, causes vasoconstriction due to withdrawal of the active vasodilator activ-ity [16,17]. In PsA, heat production of active joint, muscle and elevation ofinflammatory blood flowin tendons (as shown usually by Eco power Doppler in this disease [1]), may increase the finger’s skintemperatures [15] (as visually evident in figure two). In fact, accordingto Johnson and coll [15] manyfactors can modulate control mechanisms of the cutaneous vasculature, such as gender, aging, and clin-ical conditions. Cutaneous vasoconstriction and vasodilation are vasomotor responses mediated by asympathetic control action from the simulated temperature regulating center in theanterior hypothala-mus [14]. Homeostasis is basically maintained by a negative feedback loop, similar to a thermostat [18],which regulates the energy exchange with the environment at the cutaneous level through metabolic andhemodynamic processes that determine finger temperature at any given time [19]. Employing ControlSystem Theory, the homeostatic process can be seen as a feedback controlled system. This kind of sys-tem considers a reference signal to produce the desired output. The reference signal indicates the valuethat the output has to assume. The reference value is represented by superficial basal temperature thatcan be considered steady during the experiment, while the output is the superficial finger temperature.The controlled isometric exercise induces a finger temperature (plant controlled output) change fromthe basal value (reference value). The difference between the plantcontrolled output and the referencevalue (i.e., the output error) prompts the thermoregulatory reaction in orderto restore the basal value bysteering the output error to zero. The time-evolution of the finger temperature can be recorded by meansof thermal IR imaging [6,7,11-13]. Examples of temperature versus time curves, captured at finger joints(shown in Figure 1) are reported in Figure 2. According to Control System Theory, differences in thetemperature recovery curves depend on the efficacy of the cutaneousthermoregulatory effectors, whichin turn can be represented by the actual values of a given set of functional modeling parameters.
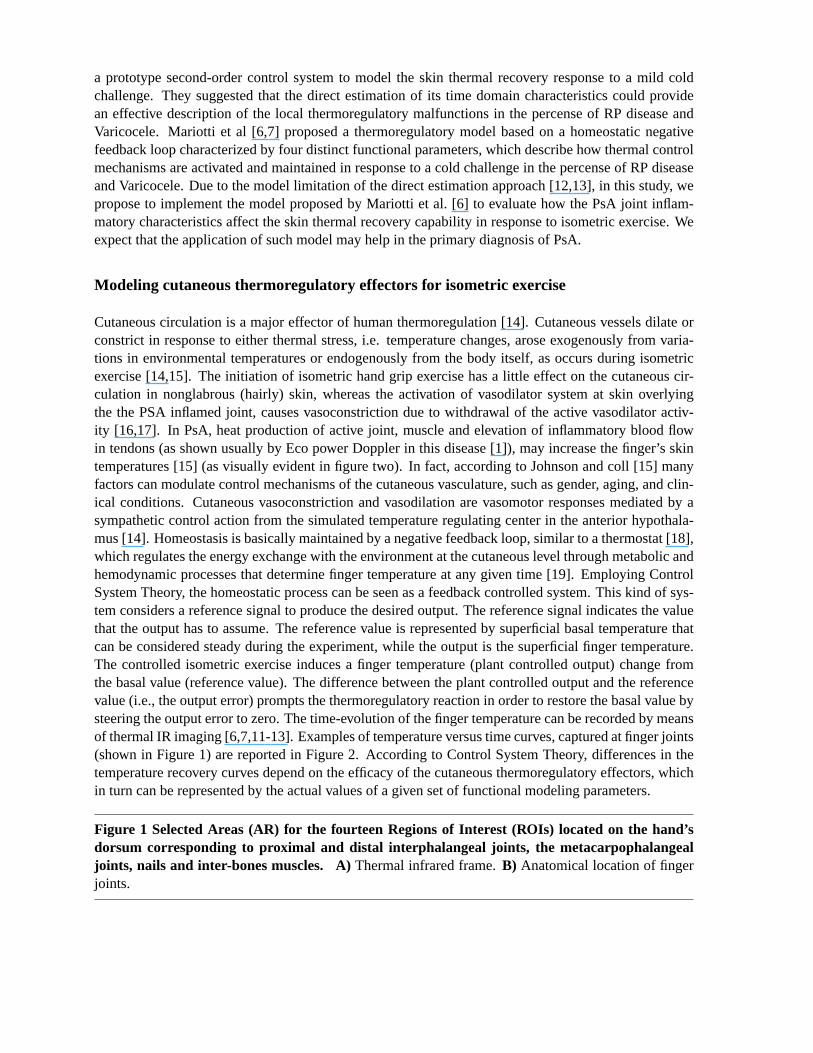
Figure 1 Selected Areas (AR) for the fourteen Regions of Interest (ROIs) located on the hand’sdorsum corresponding to proximal and distal interphalangeal joints, the metacarpophalangealjoints, nails and inter-bones muscles. A)Thermal infrared frame.B) Anatomical location of fingerjoints.

Figure 2 Temperature vs. time curves obtained from thermal imaging data during baseline, i.e.before performing the isometric exercise and 5 min after the isometric exercise separated by ared vertical line. (Subjects were required to press every 2 seconds, and for a total of 2minutes, thedynamometer handle, at the 20% of previously assessed maximal individualstrength.) measured from:(a) 14 ROIS for HCs subject,(b) 14 ROIS for PsA subject,(c) the randomly chosen representative ROI2for HCs subject, andd) the randomly chosen representative ROI2 curve for PsA subject.
Problem statement
Experimental evidence (Figure 2) showed that finger cutaneous thermoregulatory response after theisometric exercise for PsA plaque skin regions has different dynamic characteristics with respect to thehealthy skin regions [11]. The wide number of complex processes potentially involved in temperaturecontrol and in its alteration suggests considering the overall control system as a ‘black box’, whoseoverall structure can be investigated by analyzing the input-output time responses either in the healthyor in the pathological conditions [6,7,12,13,20]. Mariotti et al [6] proposed a feedback thermoregulatorymodel through two hierarchical control units: a higher level unit (supervisor) and a feedback lower levelexecutor, driven by the supervisor as shown in Figure 3. These two hierarchical control units wereproposed to model both local/peripheral, and systematic/central thermoregulatory effectors known torespond to the isometric exercise attempting to restore the basal temperature [16]. In fact, the supervisorsets the reference signal on the basis of the basal pre-stress temperature and the onset time. The overallperformance of the thermoregulatory effecting processes depends onthe activity of both the supervisorand the executor. Besides the contribution of the thermoregulatory effector mechanisms, the fingertemperature (i.e., system output) is also influenced by the thermal exchange between the finger andthe surrounding environment. This thermal exchange depends on the temperature difference whichconstitutes the external input to the thermoregulatory system [18,19].
Figure 3 The overall architecture of the thermoregulatory system (adapted to [6]).
Model structure
Figure 3 shows the overall architecture of the model proposed by Mariottiet al [6]. The only observableoutput is the finger cutaneous temperature [6,7] y(t), obtained through thermal IR imaging. No informa-tion about internal variables is available. Some assumptions can be made about the general structure andthe order of the thermoregulatory control system identified with a grey box approach, with the aim ofintroducing functional parameters to both quantitatively and qualitatively describe the thermoregulatoryeffector mechanisms [21]. The system is characterized by an external input (room temperature) and asteady state regime reference signal (r) (basal finger cutaneous temperature T). The reference signal canbe measured by IR imaging before the initiation of the isometric exercise, and averaged over time to pro-vide a constant reference value T. Visual inspection of the thermal recovery after the isometric exerciseconfirmed that skin thermoregulatory cutaneous effector system could beassumed as a second-ordertime-invariant feedback system [22]. In particular, the executor (feedback lower level unit) is composedof a controller and a plant block in sequence (Figure 3), both assumed to be time invariant systems de-scribed by first-order transfer functions. Therefore, the plant output y(t) (i.e., the finger temperature) isgoverned in the time domain by the following differential equation:
y(t) = −a.y(t) + b.u(t) (1)
Where u is the plant input, a and b are constant coefficients. The post-exercise temperature y(0) (i.e.,the temperature measured immediately after the end of the isometric exercise) constitutes the initial

condition for the response of the control system. The plant input u (t) is then the sum of the feedbackcontroller output m (t) plus the additional external input d as shown in Figure 3:
u(t) = m(t) + d (2)
Input d represents passive heat exchange with the environment. Therefore, it depends on room tempera-ture and y(t). In other words, input d can be seen as the uncontrolled effect of environmental conditionson the finger temperature [6]. The feedback controller block generatesthe signal m(t) stimulated by thedifference between the system output and the reference signal r, namely output error e(t):
e(t) = r − y(t) (3)
The feedback controller acts on the plant by the signal m(t) to steer the outputerror to zero. Commonapproaches for modeling homeostatic processes are based on an integral-type feedback controller sys-tem, which nullifies step-wise variation of the error signal [23]. The differential equation that describesthe controller behavior in the time domain is:
m(t) = K.e(t) (4)
Where K is a proportionality constant. The supervisor unit activates this controller by means of logicsignals (on/off transition). When the supervisor unit logical output is “on”, the feedback is closed onthe integral type controller and then the active temperature recovery can start. Otherwise, when thesupervisor unit logical output is “off” (during the lag time LT), the controller is disabled to restore theinitial condition, while the external input d is independent of this switching logic. The evolution ofthe system can be described more easily in the Laplace domain. The Laplace transform (L-transform)was performed with the assumptions : i) zero initial conditions y(0), and ii) the plant is unitary gainprocess with b=a in eq.1 [24], since allowing for gain both the plant and the inputs to the controllerwould result in degenerate parameters [6].Therefore, the overall model works in open loop for the timeinstance t<LT [6]:
Y (S) =a
S + a.d (5)
and in closed loop for the time instance t>LT [6]:
Y (S) =a.K
S(S + a) + a.K.T +
a.S
S(S + a) + a.K.d (6)
Where s is the Laplace variable, Y(s), r and d are the output, referenceinput, and the disturbance inputs,respectively. Moreover, the set of parameters (i.e. a, k, d, and LT) could provide an insight on thedynamics and activity level of thermoregulatory effector mechanisms duringboth healthy state and thepresence of a disease. In fact, the reciprocal of the plant time constant(a) represents the speed of theresponse of the thermal process to external and internal stimuli. The integral gain (k) could be consideredas a descriptor of an active and systemic vasodilation process in restoringand maintaining the referencebasal temperature conditions [6], since it refers to the control action anddetermines the efficiency ofthe feedback control system in achieving the steady state. The disturbance input (d) represents a passiveheat exchange with the environment and, therefore, depends on roomtemperature and y(t). LT is a timerequired for the thermoregulatory processes to access the internal re-warming process after the end ofthe isometric exercise. During this time, the thermal variations are mostly attributableto the passive heatexchange with the environment. Once LT is finished, there is the onset of there-warming process andthe controller starts to restore the reference basal conditions T.

Since the purpose of applying control theory is to offer a model that can fit the sample data well, whichmeans making the calculated system output y* approach the actual/experimental system output ye asclosely as possible. The closer those two values are, the better the fitting effect will be. Therefore, theleast squares criterion function f [25] can be taken as the fitness function :
f(x) =NE∑
i
(y∗i − yei )2 (7)
Wherey∗i is the vector of experimental finger re-warming curves’ data points andyei is the vector ofthe estimated model’s data points. The data points are defined from i=1 to numberof data points NE,and is the vector of the model parameters, i.e. a, k, d, and LT. From equations 5 and 6, the fingerthermoregulatory model (Figure 3) is uniquely described by a, k, d, and LT, which can be estimatedbased on measurements of T and y(t) [6,7] by solving the optimization problem defined by the costfunction stated in equation 7.
Materials and methods
Subjects
11 PsA patients and 9 healthy controls, matched for sex and age, participated in the study. All subjectssigned the informed consent form prior to be enrolled for the study, whichwas approved by the localethical board. The control subjects did not report any personal or family history of Psoriasis or PsA.Demographic data of the participating subjects are summarized in Table 1. The diagnosis of PsA wasperformed according to CASPAR criteria [1]. PsA patients had been treated in the past with standardtherapies (MTX or CsA) with poor results in terms of pain resolution and qualityof life improvement andwere eligible for biologic therapy. All the subjects observed a washout period of two weeks before themeasurements and were free of any medication that could interfere with the fIR imaging measurements.
This study was approved by the Human Board Review and conducted according to the Helsinki’s Decla-ration. All the subjects signed an informed consent and could withdraw from the study at any moment.
Table 1 Demographic dataItem HCs PsANo. of subjects 9 11Age(Mean±Std) (Years) 51±13.5 52±15.5Gender (Female/Male) 5/4 5/6
Data collection
A total of 280 experimental temperature curves from 14 regions of interest were collected. Each curveincluded a baseline and a recovery time-course after a controlled isometric exercise. 154 and 126 curveswere collected from PsA patients and HCs, respectively. Selected Areas(AR) for the fourteen Regionsof Interest (ROIs) located on the hand’s dorsum corresponding to theinterphalangeal joints (IP): bothproximal and distal (IPP and IPD respectivily), metacarpophalangeal joints (MCP), nails and inter-bonesmuscles, as shown in Figure 1. Thermal IR imaging measurements were performed in a controlled-climate room. Patients seated with both hands placed on a table covered with a black sheet; measure-ments were made on the dominant hand to minimize potential bias due to muscle hypertrophy and mo-tor capabilities. Prior to starting the thermal IR imaging recordings, the patients observed a 20-minuteacclimatization period in the recording room, which was set at a standardizedtemperature (23◦C), hu-

midity (50-60%), without any direct ventilation [8]. The subjects were asked to abstain from assumingany vasomotor substance (e.g., alcohol, coffee, tea etc), nor undergoof physical activity during the 2hours prior to evaluation. High-resolution digital thermal images of the hand were acquired at baselineand after a functional exercise. The exercise consisted of repeated isometric contractions through thecompression of a calibrated digital dynamometer interfaced to an ADInstruments 8/30 PowerLab com-puterized system [7]. Subjects first underwent 1.5 minutes of baseline thermal recording. Next, subjectswere required to press the dynamometer handle every 2 seconds for a total of 2 minutes at 20% of theirpreviously assessed maximal individual strength. Soon after the exercise, the subjects repositioned theirhand in the starting position, undergoing 5 minutes of thermal recording. We used a 14-bit digital ther-mal camera (FLIR SC660 QWIP, Sweden), sensitive in the 7-14µ m band and with 0.04κ temperatureresolution. The thermal imaging’s sampling rate frequency was set to 0.1 Hz.ROI temperature datawere extracted by means of the FLIR ThermaCAM Researcher Professional 2.9. Software.
Data analysis
Data preprocessing
In-home software implemented within the MATLABc© platform (www.math-works.com) was used fordata and graphic analysis. The time-course of the temperature data was filtered through a smoothingalgorithm (span = 5 samples). The control model was implemented the Matlab Simulink Graphical UserInterfacec© (Figure 4 shows the implemented Simulink model). Thermoregulatory model responseswere simulated by the variable step ODE45 (Dormand-Price) solver.
Figure 4 Thermoregulatory model Simulink block diagram (adapted to[6]).
Parameter estimation procedure
In order to compute and optimize the four unknown model parameters (a, k, d, and LT), several param-eter estimation procedures were performed based on the following optimizationtheory: i) The initialestimation of the model parameters was assigned based on the graphical approach for real time process-identification [26]. Table 2 summarizes the definition of model parameters usingthe graphical method;ii) The search space for the model parameters (see Table 3) were selected based on both common lim-its used in literature [27] and operator evaluation by performing unconstrained simplex optimizationmethod [28] (see Figure 4), considering the system output signal as its reference signal; iii) Since thefunction to be minimized in the parameter estimation procedure is nonlinear (see equation 3), the corre-sponding nonlinear least square algorithm used could actually produce local results; therefore the modelparameters (a, k, d, and LT) were computed and optimized through the MatlabSimulink Parameter Es-timation Toolboxc©, by using a Non-Linear Least Square algorithm [29], while T and y(t) were directlyestimated on the thermal IR imaging data.

Table 2 The Time- domain parameter Identification based on graphical method [26]Symbol Parameter name Calculation description
K Process gain* Process gain is determined by dividing the steady state output (t→ ∞)(assumed to be the final output value of y(t) ) by the input set point value (T).
LT Lag time The lag time or dead time is the time interval between the input being applied to the systemand the output responding to this signal. The time delay fromthe onsetof the re-warming process and the end of the isometric exercise is oftenreferred to as lag time (LT) [6].
a Open loop pole location It is the inverse of system time constant.The system time constant is the time taken for the outputto reach 63% of the final value.
*Integral Control gain was used to study the whole model gain, as we adapted the process transfer function to be unitary gain one [6].

Table 3 Parameter search spaceParameter Minimum MaximumLag Time LT 0 22Open pole location a 0.01 30Integral controller gain K -5 100Disturbance gain d -5 10
Statistical analysis
For each subject, the model parameters were computed for each of the fourteen regions of interest. Thestatistical analysis was performed to search for the most significant joint regions that could differentiatebetween PsA patients and HCs based on the estimated model parameters. To thisgoal, we analyzed theestimated model parameters at each joint regions individually and at the fourteen ROIs all together.Thedistributions of the estimated model parameters for each group were tested for normality by visualinspection of the frequency distribution and Shapiro-Wilk test [30]. All theparameters for each groupwere compared through Wilcoxon-Mann-Whitney test [31]. The level ofstatistical significance wasfixed at 0.05. A multiple logistic regression classification algorithm [31] was performed in order toevaluate which parameter better reproduces the probability to detect and classify the presence of PsAas clinically diagnosed, according to the CASPAR criteria [1]. The clinical diagnosis was adopted asindependent variable. The classification procedure was a region-based classification. The cut-off for thebest classification was established by means of a receiver operating characteristic (ROC) analysis [32]applied to the multiple logistic regression model output. ROC analysis allows the evaluation of theoptimal cut-off for a binary classification resulting from a compromise between the 1-specificity, i.e.,the false-positive rate, and the sensitivity, i.e., the true positive rate [32].
Results
Figure 5 shows a comparison between the identified response and the experimental temperature curvesfor two representative cases randomly chosen from PsA and HCs groups, respectively. For all subjects,the IR curves estimated with a minimum cost function higher than 1 were excludedfrom the statisticalanalysis in order to guarantee high accuracy of the result. This exclusionoccurred in 20 (13%) and 5(0.04%) curves from PsA and HCs set, respectively.
Figure 5 Comparison between experimental data and identified model response for the studiedgroups. (a)Healthy control HCs.(b) Psoriasis patient PsA.
The distributions of the average model parameters allowed to reject the null hypothesis of the normalitytest with significant level<0.05. Group mean and standard deviation (Std) for each estimated parameterfor each joint region for each group are reported in Table 4.

Table 4 Group average valuesGroup Parameter(Mean(Standard deviation))
LT a d KROI 1 : I MCP
PsA 4(6) 0.9(3) 0.04(0.1) 0.9(1.7)HCs 6(7) 0.1(0.2) -0.07(0.09) 0.3(0.6)
ROI 2 : IPPsA 0.5(0.8) 0.1(0.1) -0.02(0.1) 0.3(0.4)HCs 2(3) 0.1(0.17) -0.02(0.2) -0.5(1.6)
ROI3 : II MCPPsA 3(4) 1(3) -0.01(0.2) 0.48(1)HCs 4(4) 0.08(0.08) -0.03(0.1) 0.4(0.8)
ROI4 : I IPPPsA 5(6) 0.9(2) -0.06(0.1) 0.1(0.1)HCs 3(3) 2(3) -0.06(0.08) 0.02(0.04)
ROI5 : I IPDPsA 4(5) 0.5(1) 0.03(0.19) 0.7(1.5)HCs 8(7) 0.4(0.6) 0.007(0.2) 0.4(0.9)
ROI6: III MCPPsA 3(5) 0.12(0.17) -0.01(0.17) 0.3(0.9)HCs 2(2) 1(1.5) -0.04(0.04) 0.03(0.07)
ROI7: II IPPPsA 3(3) 0.8(2) -0.1(0.3) 0.2(0.16)HCs 7(9) 0.2(0.2) -0.04(0.07) 0.12(0.16)
ROI8: II IPDPsA 5(7) 1(3) -0.1(0.4) (0.3(0.4)HCs 4(4) 0.2(0.3) -0.01(0.2) 0.2(0.3)
ROI9: IV MCPPsA 4(4) 0.1(0.09) -0.007(0.06) 0.14(0.15)HCs 4(5) 0.6(1.7) -0.06(0.15) -0.2(0.4)
ROI10 : III IPPPsA 3(4) 0.6(0.9) -0.06(0.2) 0.5(1.3)HCs 4(7) 0.2(0.3) -0.2(0.2) 0.4(1.9)
ROI11 : III IPDPsA 3(6) 2(2) -0.05(0.1) 0.07(0.05)HCs 3(3) 0.1(0.18) -0.08(0.1) 0.15(0.1)
ROI12 : V MCPPsA 7(8) 0.8(1) 0.03(0.1) 1.5(3)HCs 3(4) 0.6(1.5) (0.01(0.3) 0.9(1.7)
ROI13 : IV IPPPsA 3(7) 1(2) 0.04(0.2) 0.1(0.1)HCs 4(4) 0.9(2) 0.02(0.1) 0.02(0.05)
ROI14 : IV IPDPsA 6(7) 0.3(0.4) -0.01(0.3) 0.1(0.2)HCs 1(2) 0.15(0.17) -0.02(0.5) -0.1(0.9)
All 14 ROIsPsA 0.09(0.1) 0.7(2) -0.02(0.2) 0.4(1)HCs 4(5) 0.5(1) -0.04(0.2) 0.2(1)
MCP used for Metacapphalangeal, IP used for Interphalangeal,IPP used for proximal interphalangeal,and IPD used for distal interphalangeal

Wilcoxon-Mann-Whitney result (Table 5) showed statistical significant difference for at least one modelparameter between PsA and HCs when studying the 14 joint regions all together and individually whenstudying Interphalangeal region ROI 2, Metacapophalangeal ROIs 6 and 9. Other joint regions did notshow any statistical significance between the groups; therefore we excluded it from the multinomiallogistic regression classification.
Table 5 Wilcoxon statistical resultRegion of interest Model parameter (Ranksum,Z statistics, pvalue)
(ROI) LT a d k
ROI2 (67,-,>0.05) (88,-,>0.05) (96,-,>0.05) (118,-,<0.05)*
ROI6 (100,-,>0.05) (116,-,<0.05)* (89,-,>0.05) (76,-,>0.05)
ROI9 (89,-,>0.05) (88,-,>0.05) (68,-,>0.05) (58,-,<0.05)*
All 14 ROIs (16050,1,>0.05) (15142,0.04,>0.05) (13493,-2.7,<0.05)* (13047,-3.5,<0.05)*
* means statistically significant.- means not available; Wilcoxon Mann Whitney test could not measure the z-statistics for small sample size.
Statistically significant differences between PsA and HCs were found in theopen loop location a,thedisturbance gain parameter d and the integral controller gain k (see Table 5). The PsA group showedthe highest values for d and k (see Table 4). The model of multiple logistic regression for the regionclassification includes one equation for PsA with respect to HCs, with all the estimated parameters LT, a,d and k. The thumb Interphalangeal joint region is the only joint region set that provides a multilogisticregression model that better reproduces the probability to detect and classify the presence of PsA asclinically evaluated. Table 6 reports the estimation of the predictor coefficient(β) with its StandardError (SE), the Wald statistics and the odds ratio of response variable (Exp(β)) with respect to thepredictor coefficient for the interphalangeal joint. The Wald statistics validate the positive correlationbetween the model parameter k and the presence of PsA disease. Means with 95% confidence intervalserror bars for each parameter for each group are shown in Figure 6.
Table 6 Discriminant parameters for thumb interphalangeal joint region classificationModel Parameter β Standard Wald DF sig Exp(β)
equation error SE
PsA-HCs Intercept -1.7 1 -1.6 1 0.1 0.17L -0.7 0.6 -1.2 1 0.2 0.46a 5.5 5 1 1 0.2 24.9d 2.3 3.5 0.6 1 0.5 10.6k 12 4.7 2.5 1 0.01* 100000
* means statistically significant.
Figure 6 Bar Graph with means and 95% confidence intervals error bars. Comparison of thegroup average parameters among groups at the thumb interphalangeal joint region. The horizontal barwith asterick indicates the statistical significance (p<0.05).
Means with 95% confidence intervals error bars for each parameter foreach group are shown in Figure 6.
The ROC analysis (Figure 7) established one optimal cut-off at 0.4 in orderto discriminate betweenPsA and HCs groups. It provided a true-positive prediction for PsA patients from HCs of 100% and

88.89% for discriminating healthy controls from PsA. Table 7 illustrates the confusion matrix for theregion classification.
Figure 7 Roc analysis result using thumb interphalageal joint region.
Table 7 Confusion matrixOriginal Predicted group CorrectlyGroup PsA HCs Classification%
PsA 100 0 100HCs 11.11 88.89 88.89
Discussion
The aim of the present study was to identify quantitative parameters, which describe the functional dif-ferences in the thermal recovery of the skin, overlying the proximal and distal interphalangeal joints,from a controlled mild isometric exercise shown by healthy controls and PsA patients [15]. We hy-pothesized that the implementation of the functional thermoregulatory model proposed by Mariotti et al[6] to model the skin thermoregulatory processes in response to isometric exercise could evaluate howthe pathophysiological differences due to joint inflammatory characteristicscorresponding to the PsAdisorder affect these processes [9,15,17]. The thermoregulatory system was modeled through two hier-archical control units: a higher level unit (supervisor) and a lower feedback level (executor) driven by thesupervisor. The implemented model is unequivocally identified by a set of four functional parameters (a,k, d, LT) [6]. The statistical analysis was performed for all the Interphalangeal, Metacarpophalangeal,Proximal Interphalangeal and Distal Interphalangeal regions individually and for the fourteen regionsall together, in order to check which of them is the most significantly discriminatingregion between PsAand HCs groups. Our analysis confirmed that PsA patients exhibit different thermoregulatory dynamicresponses to the controlled isometric exercise compared to HCs. Delayed and prolonged re-warmingprocesses characterized by an undershoot onset after the end of the isometric exercise was found [6].This finding is expressed by the PsAs’ higher values for model disturbance gain (d). Therefore, in thepresence of the disease, the skin thermoregulatory recovery processcould be mainly based on the passiveheat exchange because of the withdrawal of the cutaneous vasodilationactivity and the intact vasocon-strictor action in the affected joint region [15,17]. The higher k values found for PsA with respect toHCs values reflect the higher active and systemic vasodilation after the endof the onset undershoot. Thisfinding might be attributed to a higher emissivity of the PsA areas [4] in the presence of more arteriolesor even chronic structure widening of the existing arterioles [5]with higherbasal flux [3]. Moreover, PsAshowed a faster temperature increase after the undershoot onset compared to the healthy. This findingis evident by the higher mean values of the model parameter of open loop location (a). Region classi-fication on the basis of the model parameters seems to indicate that thumb’s interphalageal joint regionis the most expressive region. However, the small sample size does not allow to draw any conclusionabout, as further studies on larger samples are needed. The misclassifiedhealthy regions were attributedmostly to those exhibiting very small undershoot recovery curves in response to the controlled exercise.That finding might be due to the little effect on blood flow in nonglobrous skin (finger skin) known tobe in normothermic conditions after the end of isometric exercise [15,16]. It should be pointed out thatthe implementation of such an approach is valid within two limits: i) the limitations of the modelitself,which is the assumption of a step response and the adoption of a simple prototype second-order system,ii) the limit of the time period after the end of the isometric exercise selected to study the dynamics ofthe temperature recovery curves (i.e. in our case 5 min). The method specificity has to be tested byincreasing the number of participants.

Conclusion
In this study, we identified four quantitative parameters to describe the functional differences in ther-mal recovery from a controlled isometric exercise shown by PsA and healthy subjects. A homeostaticnegative feedback loop, characterized by the four parameters, describes how the control mechanismsare activated, maintained in healthy individuals and impaired in PsA patients. Region classification onthe basis of the model parameters demonstrated that Thumb’s interphalagealjoint region is the mostindicative region for PsA joint inflammatory disease, while further studies onlarger samples are needed.In fact, it provided 100% true-positive discrimination for PsA affected regions and 88.89 % of correctclassification of healthy regions.
Competing interests
The authors declare that they have no competing interests.
Authors’ contributions
EI is the corresponding author. EI developed the model implementation, optimization ,statististical andclassification analysis. AC carried out the subject selection and clinical diagnosis under the supervisionof PA and carried out the data recording. AM supervised the whole study. All authors read and approvedthe final manuscript.
Acknowledgements
The authors would like to thank Luigino Di Donato and Daniela Cardone, ITAB, for their assistancewith data acquisition.
References
1. Boehncke WH, Merolal JF, Thaçi D, Krueger GG, Walsh J, Kim N, Gottlieb AB: Diagnosing andtreating psoriatic arthritis-an update. Br J Dermatol 2014,170:772–286.
2. Abd El Baky AM, Waked IS:Non-steroidal anti-inflammatory phonophoresis versus topicalapplication in improvement of hand grip strength in psoriatic arthritic patients. J Am Sci2011,7:110–114.
3. Hern S, Stanton AW, Mellor R, Levick JR, Mortimer PS:Control of cutaneous blood vessels inpsoriatic plaques.J Investigat Dermatol 1999,113:127–132.
4. Warshaw TG:Thermal studies in psoriasis. J Investigat Dermatol 1973,60:91–93.
5. Zalewska A, Gralewicz G, Owczarek G, Wiecek B:Thermography in psoriasis vulgaris evalua-tion. Conf Proc IEEE Eng Med Biol Soc 2005,1:627–630.
6. Mariotti A, Grossi G, Amerio P, Orlando G, Mattei PA, Tulli A, Romani GL,Merla A: Finger ther-moregulatory model assessing functional impairment in raynaud’sphenomenon. Ann BiomedEng 2009,37:2631–2639.
7. Mariotti A, Di Carlo L, Orlando G, Corradini ML, Di Donato L, Pompa P,Iezzi R, Cotroneo AR,Romani GL, Merla A:Scrotal thermoregulatory model and assessment of the impairment ofscrotal temperature control in varicocele. Ann Biomed Eng 2011,39:664–673.

8. Spalding SJ, Kwoh CK, Boudreau R, Enama J, Lunich J, Huber D, Denes L, Hirsch R:Three-dimensional and thermal surface imaging produces reliable measures of joint shape andtemperature: a potential tool for quantifying arthritis. Arthritis Res Ther 2008,10:R10. doi:10.1186/ar2360.
9. Devereaux MD, Parr GR, Thomas DP, Hazleman BL:Disease activity indexes in rheumatoidarthritis; a prospective, comparative study with thermography. Ann Rheum Dis 1985,44:434–437.
10. Castillo-Martínez C, Valdes-Rodríguez R, Kolosovas-Machuca ES,Moncada B, González FJ.:Useof digital infrared imaging in the assessment of childhood psoriasis. Skin Res Technol 2013,19:549–551.
11. Capo A, Merla A, Mattei P, Auriemma M, Panarese F, Celletti E, Abate M, Romani GL, Amerio P:Assessment of psoriatic arthritis by means of functional infraredimaging: A pilot study. ClincDrug Investig 2013,
12. Ismail E, Orlando G, Corradini ML, Amerio P, Romani GL, Merla A:Differential diagnosis ofraynaud’s phenomenon based on modeling of finger thermoregulation. Physiol Meas 2014,35:703–716.
13. Ismail E, Orlando G, Pompa P, Gabrielli D, Di Donato L, Cardone D, Merla A: Time-domainanalysis of scrotal thermoregulatory impairment in varicocele. Front Physiol 2014,5:342.
14. Sawasaki N, Iwase S, Mano T:Effect of skin sympathetic response to local or systemic coldexposure on thermoregulatory functions in humans. Auton Neurosci 2001,87:274–281.
15. Johnson JM, Minson CT, Kellogg DL Jr:Cutaneous vasodilator and vasoconstrictor mecha-nisms in temperature regulation. Compr Physiol 2014,4:33–89.
16. Shibasaki M, Secher NH, Johnson JM, Crandall CG:Central command and the cutaneous vas-cular response to isometric exercise in heated humans. J Physiol 2005,565:667–673.
17. Johnson JM:Exercise in a hot environment: the skin circulation. scand J Med Sci Sports 2010,20:29–39.
18. Charkoudian N:Skin blood flow in adult human thermoregulation: how it works, when it doesnot, and why. Mayo Clin Proc 2003,78:603–612.
19. Sanial DC, Maji NK:Thermoregulation through cutaneous under variable atmosphericandphysiological conditions. J Theor Biol 2001,208:451–456.
20. Merla A, Di Donato L, Di Luzio S, Romani GL:Quantifing the relevance and stage of diseasewith the tau image technique: a complementary diagnostic imaging technique based on in-frared functional imaging . IEEE Eng Med Biol Mag 2002,21:86–91.
21. Oussar Y, Dreyfus G:How to be a gray box: dynamic semi-physical modelling. Neural Netw2001,14:1161–1172.
22. Rollins D, Bhabdar N, Hulting S:System identification of the human thermoregulatory systemusing continuous-time block-oriented predictive modelling. Chem Eng Sci 2006,61:1516–1527.
23. Waterhouse:Homeostatic control mechanism. Anaesth Intensive Care 2004,5:236–240.
24. Forssel U, Ljung L:Closed loop identification revisited. Automatica 1999,35:1215–1241.
25. Nocedal J, Wright SJ:Numerical Optimization, 2nd edn. New York: John Wiley and Sons;2006:248–250.

26. Kealy T, O’Dwyer A:Comparison of open and closed loop process identification techniquesin the time domain. In Proceedings of the 3nd Wismarer Automatisierungssymposium, Wismar,Germany, September, 2001, Paper 1.3-4, Edited by Smith Y. Wismar, Germany; 2001.
27. Luo Y, Wang Y, Kong L:System identification of thermal process based on chaos particleswarm optimization. In Automation and Logistics, 2008. ICAL 2008. IEEE International Con-ference on, 2008:2598–2602. doi:10.1109/ICAL.2008.4636610
28. Lagarias JC, Reeds JA, Wright MH, Wright PE:Convergence properties of the nelder-meadsimplex method in low dimensions. SIAM J Optimizat 1998,9:112–147.
29. Tarantola A, Valette B:Generalized nonlinear inverse problems solved using the least squarescriterion . Rev Geophys Space Phys 1982,20:219–233.
30. Razali NM, Wah YB:Power comparisons of shaprio-wilk, kolmogorov-smirnov, lilliefors andanderson- darling tests. J Stat Model Analytics 2011,2:22–33.
31. Agresti A:Categorical Data Analysis, 2nd edn. Hoboken, NJ: Wiley InterScience; 2002:248–250.
32. Westin LK:Receiver operating characteristic (roc) analysis:evaluating discriminance effectsamong decision support systems.Technical report, Department of Computing Science in UmeåUniversity, Computer Science Department,Umeå, Sweden; 2001. [http://www8.cs.umu.se/research/reports/2001/018/part1.pdf]


Figure 2

Figure 3

Figure 4

Figure 5

Figure 6

Figure 7