Arthritis and musculoskeletal conditions in Australia 2005
160
Department of Health and Ageing Arthritis and musculoskeletal conditions in Australia 2005 With a focus on osteoarthritis, rheumatoid arthritis and osteoporosis ARTHRITIS SERIES Number 1 OCTOBER 2005 Australian Institute of Health and Welfare Canberra AIHW CAT. NO. PHE 67
-
Upload
khangminh22 -
Category
Documents
-
view
0 -
download
0
Transcript of Arthritis and musculoskeletal conditions in Australia 2005

Department of Health and Ageing
Arthritis and musculoskeletal conditions in Australia 2005
With a focus on osteoarthritis, rheumatoid arthritis and osteoporosis
ARTHRITIS SERIES Number 1
OCTOBER 2005
Australian Institute of Health and Welfare
Canberra
AIHW CAT. NO. PHE 67
1079 AIHW Arthritis title page.indd 1 17/10/05 5:58:39 PM

The Australian Institute of Health and Welfare is Australia’s national health and welfare statistics and information agency. The Institute’s mission is better health and wellbeing for Australians through better health and welfare statistics and information.
© Australian Institute of Health and Welfare 2005
This work is copyright. Apart from any use as permitted under the Copyright Act 1968, no part may be reproduced without prior written permission from the Australian Institute of Health and Welfare. Requests and enquiries concerning reproduction and rights should be directed to the Head, Business Promotion and Media Unit, Australian Institute of Health and Welfare, GPO Box 570, Canberra, ACT 2601.
This publication is part of the Australian Institute of Health and Welfare’s Arthritis Series. A complete list of the Institute’s publications is available from the Business Promotion and Media Unit, Australian Institute of Health and Welfare, GPO Box 570, Canberra, ACT 2601, or via the Institute’s website <http://www.aihw.gov.au>.
ISSN 1833-0991
ISBN 1 74024 507 5
Suggested citation
Australian Institute of Health and Welfare 2005. Arthritis and musculoskeletal conditions in Australia, 2005. AIHW Cat. No. PHE67. Canberra: AIHW.
Australian Institute of Health and Welfare
Board Chair Hon. Peter Collins, AM, QC
Director Dr Richard Madden
Any enquiries about or comments on this publication should be directed to:
Dr Naila Rahman Australian Institute of Health and Welfare GPO Box 570 Canberra ACT 2601
Phone: (02) 6244 1000Email: [email protected]
Published by the Australian Institute of Health and Welfare
Printed by Elect Printing

PAGE III
Contents
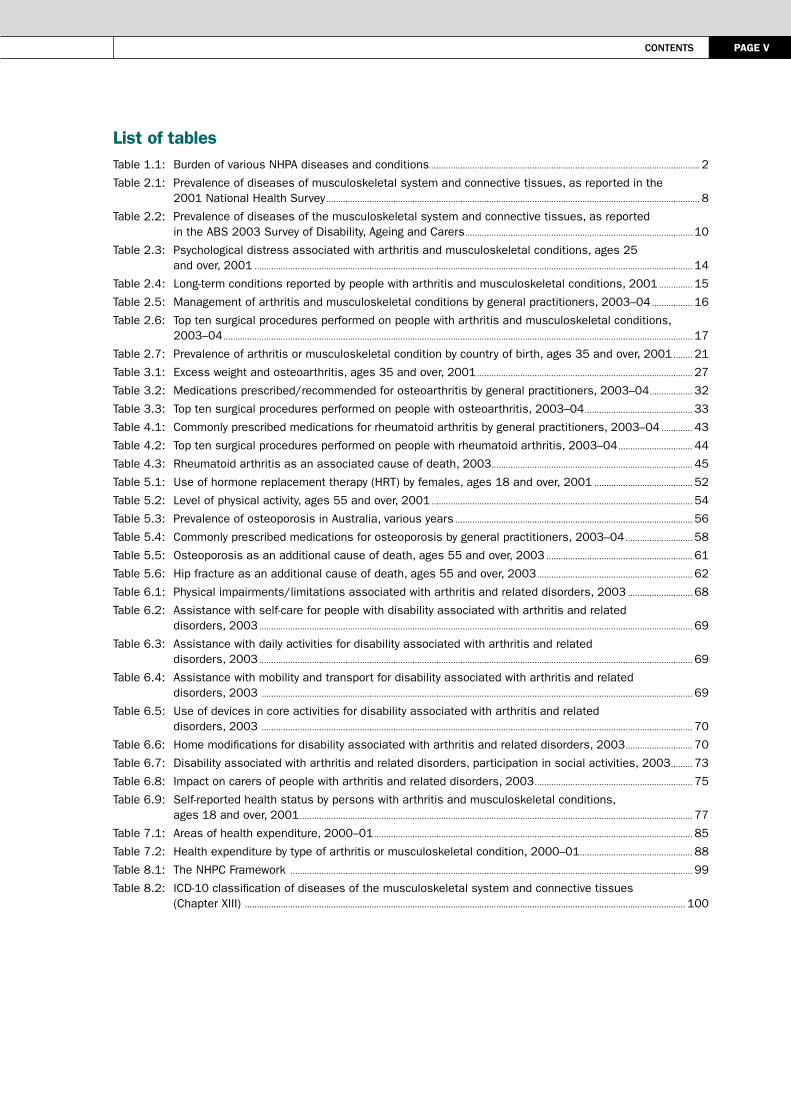
List of tables .........................................................................................................................................................................................................................V
List of figures .....................................................................................................................................................................................................................VII
Preface ................................................................................................................................................................................................................................... IX
Acknowledgments ............................................................................................................................................................................................................ XI
Executive summary ......................................................................................................................................................................................................XIII
1 Introduction ................................................................................................................................................................................................................. 1
A National Health Priority Area ........................................................................................................................................................................... 1Bone and Joint Decade .......................................................................................................................................................................................... 2Focus areas .................................................................................................................................................................................................................. 2National Action Plan ................................................................................................................................................................................................. 3Statement of the problem .................................................................................................................................................................................... 5Aims and organisation of the report ............................................................................................................................................................... 5References .................................................................................................................................................................................................................... 6
2 Burden of arthritis and musculoskeletal conditions ........................................................................................................................... 7
Illness, discomfort and pain ................................................................................................................................................................................ 8Disease severity and disability ....................................................................................................................................................................... 13Health care/service use ..................................................................................................................................................................................... 15Mortality ....................................................................................................................................................................................................................... 18Inequalities ................................................................................................................................................................................................................ 19References ................................................................................................................................................................................................................. 22
3 Osteoarthritis ........................................................................................................................................................................................................... 25
Nature of the problem .......................................................................................................................................................................................... 25Risk factors and causal mechanisms ......................................................................................................................................................... 25Prevalence and incidence .................................................................................................................................................................................. 28Disease severity and disability ....................................................................................................................................................................... 30Prevention and management ........................................................................................................................................................................... 31References ................................................................................................................................................................................................................. 34
4 Rheumatoid arthritis ........................................................................................................................................................................................... 37
Nature of the problem .......................................................................................................................................................................................... 37Causal and risk factors ....................................................................................................................................................................................... 38Incidence and prevalence .................................................................................................................................................................................. 39Disability and psychosocial impact ............................................................................................................................................................... 41Treatment and health service use ................................................................................................................................................................. 42Mortality ....................................................................................................................................................................................................................... 44References ................................................................................................................................................................................................................. 45
5 Osteoporosis ............................................................................................................................................................................................................ 49
Nature of the problem .......................................................................................................................................................................................... 49Risk factors and markers ................................................................................................................................................................................... 50Incidence and prevalence .................................................................................................................................................................................. 54Impairments and activity limitations ............................................................................................................................................................ 56Current service use ............................................................................................................................................................................................... 57Mortality ....................................................................................................................................................................................................................... 60References ................................................................................................................................................................................................................. 64
CONTENTS

PAGE IV Arthritis And musculoskeletAl conditions in AustrAliA 2005
6 Impact on functioning and quality of life ................................................................................................................................................. 67
Impairments .............................................................................................................................................................................................................. 68Independent living .................................................................................................................................................................................................. 68Work disability .......................................................................................................................................................................................................... 71Social participation ................................................................................................................................................................................................ 73Informal care ............................................................................................................................................................................................................. 74Health-related quality of life .............................................................................................................................................................................. 75Self-reported health status ............................................................................................................................................................................... 77Co-morbidity and disability ................................................................................................................................................................................. 79References ................................................................................................................................................................................................................. 80
7 Health expenditure ............................................................................................................................................................................................... 83
Allocation of expenditure .................................................................................................................................................................................... 84Expenditure by health care sector ................................................................................................................................................................. 85Trends over time ...................................................................................................................................................................................................... 86Expenditure by age and sex .............................................................................................................................................................................. 87Expenditure by type of arthritis or musculoskeletal condition ....................................................................................................... 88Variation in health expenditure between focus areas ........................................................................................................................ 92Comparisons with other National Health Priority Areas .................................................................................................................... 92References ................................................................................................................................................................................................................. 94
8 Surveillance and monitoring ........................................................................................................................................................................... 95
Surveillance and monitoring issues ............................................................................................................................................................. 96A theoretical framework ...................................................................................................................................................................................... 96Data classification .............................................................................................................................................................................................. 100A national surveillance and monitoring system .................................................................................................................................. 101Current data sources ......................................................................................................................................................................................... 103Data gaps and deficiencies ........................................................................................................................................................................... 105References .............................................................................................................................................................................................................. 106
Appendix A: A National Action Plan for Osteoarthritis, Rheumatoid Arthritis and Osteoporosis, 2004–2006 ..................................................................................................................................................................................... 107
Appendix B: Statistical methods and classifications ........................................................................................................................ 111
Appendix C: Health system costing methodology .............................................................................................................................. 121
Appendix D: Definitions of terms and measures .................................................................................................................................. 125
Appendix E: Statistical tables ......................................................................................................................................................................... 129
Appendix F: National Health Priority Area indicators ....................................................................................................................... 145
contents PAGE V
List of tablesTable 1.1: Burden of various NHPA diseases and conditions ................................................................................................................. 2
Table 2.1: Prevalence of diseases of musculoskeletal system and connective tissues, as reported in the 2001 National Health Survey ............................................................................................................................................................ 8
Table 2.2: Prevalence of diseases of the musculoskeletal system and connective tissues, as reported in the ABS 2003 Survey of Disability, Ageing and Carers ............................................................................................... 10
Table 2.3: Psychological distress associated with arthritis and musculoskeletal conditions, ages 25 and over, 2001 ....................................................................................................................................................................................... 14
Table 2.4: Long-term conditions reported by people with arthritis and musculoskeletal conditions, 2001 .............. 15
Table 2.5: Management of arthritis and musculoskeletal conditions by general practitioners, 2003–04 ................. 16
Table 2.6: Top ten surgical procedures performed on people with arthritis and musculoskeletal conditions, 2003–04 .................................................................................................................................................................................................... 17
Table 2.7: Prevalence of arthritis or musculoskeletal condition by country of birth, ages 35 and over, 2001 ........ 21
Table 3.1: Excess weight and osteoarthritis, ages 35 and over, 2001 .......................................................................................... 27
Table 3.2: Medications prescribed/recommended for osteoarthritis by general practitioners, 2003–04 .................. 32
Table 3.3: Top ten surgical procedures performed on people with osteoarthritis, 2003–04 ............................................. 33
Table 4.1: Commonly prescribed medications for rheumatoid arthritis by general practitioners, 2003–04 ............. 43
Table 4.2: Top ten surgical procedures performed on people with rheumatoid arthritis, 2003–04 ............................... 44
Table 4.3: Rheumatoid arthritis as an associated cause of death, 2003.................................................................................... 45
Table 5.1: Use of hormone replacement therapy (HRT) by females, ages 18 and over, 2001 ......................................... 52
Table 5.2: Level of physical activity, ages 55 and over, 2001 ............................................................................................................. 54
Table 5.3: Prevalence of osteoporosis in Australia, various years ................................................................................................... 56
Table 5.4: Commonly prescribed medications for osteoporosis by general practitioners, 2003–04 ............................ 58
Table 5.5: Osteoporosis as an additional cause of death, ages 55 and over, 2003 ............................................................. 61
Table 5.6: Hip fracture as an additional cause of death, ages 55 and over, 2003 ................................................................. 62
Table 6.1: Physical impairments/limitations associated with arthritis and related disorders, 2003 ........................... 68
Table 6.2: Assistance with self-care for people with disability associated with arthritis and related disorders, 2003 ..................................................................................................................................................................................... 69
Table 6.3: Assistance with daily activities for disability associated with arthritis and related disorders, 2003 ..................................................................................................................................................................................... 69
Table 6.4: Assistance with mobility and transport for disability associated with arthritis and related disorders, 2003 .................................................................................................................................................................................... 69
Table 6.5: Use of devices in core activities for disability associated with arthritis and related disorders, 2003 .................................................................................................................................................................................... 70
Table 6.6: Home modifications for disability associated with arthritis and related disorders, 2003 ............................ 70
Table 6.7: Disability associated with arthritis and related disorders, participation in social activities, 2003 ......... 73
Table 6.8: Impact on carers of people with arthritis and related disorders, 2003 .................................................................. 75
Table 6.9: Self-reported health status by persons with arthritis and musculoskeletal conditions, ages 18 and over, 2001 .................................................................................................................................................................... 77
Table 7.1: Areas of health expenditure, 2000–01 ..................................................................................................................................... 85
Table 7.2: Health expenditure by type of arthritis or musculoskeletal condition, 2000–01 ............................................... 88
Table 8.1: The NHPC Framework ........................................................................................................................................................................ 99
Table 8.2: ICD-10 classification of diseases of the musculoskeletal system and connective tissues (Chapter XIII) ........................................................................................................................................................................................ 100

PAGE VI Arthritis And musculoskeletAl conditions in AustrAliA 2005
Appendix tablesTable B1: Age-standardisation of rates (example) .............................................................................................................................. 113
Table B2: Classification/codes used in various health data sources ..................................................................................... 117
Table E2.1: Self-reported arthritis or musculoskeletal conditions, 2001.................................................................................... 129
Table E2.2: Prevalence of arthritis and musculoskeletal conditions, 2001 NHS and 2003 SDAC ............................... 129
Table E2.3: Chronic or recurrent pain in disability associated with arthritis and related disorders, 2003 .............. 130
Table E2.4: Core-activity restrictions in disability associated with arthritis and related disorders, 2003 ................ 130
Table E2.5: Psychological distress associated with arthritis and musculoskeletal conditions, ages 25 and over, 2005 ................................................................................................................................................................................. 131
Table E2.6: Hospital separations for arthritis or musculoskeletal conditions, 2003–04 ................................................... 131
Table E2.7: Time series for arthroscopy and arthroplasty procedures, 1997–98 to 2003–04 ...................................... 132
Table E2.8: Per cent prevalence of diseases of musculoskeletal system and connective tissues by Indigenous status, 2001 ............................................................................................................................................................ 132
Table E2.9: Prevalence of arthritis or musculoskeletal conditions by socioeconomic status, ages 35 and over, 2001 ................................................................................................................................................................................... 132
Table E3.1: Body mass index of females, reporting arthritis and musculoskeletal conditions, ages 35 and over, 2001 ................................................................................................................................................................................. 133
Table E3.2: Self-reported prevalence of osteoarthritis, 2001 .......................................................................................................... 133
Table E3.3: Feelings of hopelessness and depression reported by people with osteoarthritis, ages 25 and over, 2001 ................................................................................................................................................................................... 133
Table E3.4: Management of osteoarthritis by general practitioners, 2003–04 ....................................................................... 134
Table E3.5: Time series for knee and hip arthroplasty procedures, 1997–98 to 2003–04 ........................................... 134
Table E4.1: Self–reported rheumatoid arthritis, 2001 ........................................................................................................................... 135
Table E4.2: Management of rheumatoid arthritis by general practitioners, 2003–04 ....................................................... 135
Table E5.1: Self–reported prevalence of osteoporosis, ages 35 and over, 2001 .................................................................. 136
Table E5.2: Hospital separations for common fracture sites, 2003–04 .................................................................................... 136
Table E5.3: Falls as a factor in hospitalisation for fractures, ages 55 and over, 2003–04 ............................................ 136
Table E5.4: Osteoporosis as the underlying cause of death, ages 55 and over, 2003 ..................................................... 137
Table E5.5: Hip fracture as an additional cause of death, ages 55 and over, 2003 ............................................................ 137
Table E5.6: Time series for hip fracture associated mortality in Australia, ages 55 and over, 1997–2003 ........... 137
Table E6.1: Types of employment restriction due to disability associated with arthritis and related disorders, ages 15–64, 2003........................................................................................................................................................................... 138
Table E6.2: Employment restrictions due to disability associated with arthritis and related disorders, ages 15–64, 2003........................................................................................................................................................................... 138
Table E6.3: Employer–made arrangements for disability associated with arthritis and related disorders, ages 15–64, 2003........................................................................................................................................................................... 139
Table E6.4: Self–reported quality of life by specific type of arthritis or musculoskeletal condition, 2001 ............... 139
Table E6.5: Self–reported health status, people with arthritis and musculoskeletal conditions, ages 18 and over, 2001 ................................................................................................................................................................................... 140
Table E6.6: Self–reported health by specific condition, ages 18 and over, 2001 .................................................................. 140
Table E6.7: Long–term conditions reported by people with disability associated with arthritis and related disorders, 2003 ................................................................................................................................................................................. 140
Table E7.1: Health expenditure by disease chapter, 2000–01 ......................................................................................................... 141
Table E7.2: Health expenditure on arthritis and musculoskeletal conditions by health sector, 2000–01 ............... 141
Table E7.3: Per cent changes in inflation-adjusted expenditure between 1993–94 and 2000–01 .............................. 142
Table E7.4: Health expenditure for arthritis and musculoskeletal conditions, Australia, 2000–01 ............................. 143
Table E7.5: Health expenditure for osteoarthritis, rheumatoid arthritis and osteoporosis, 2000–01 ........................ 143
Table E7.6: NHPA expenditure as a proportion of allocated health expenditure, 2000–01 ............................................. 143

contents PAGE VII
List of figuresFigure 2.1: Age-specific prevalence of arthritis and musculoskeletal conditions, 2001 ....................................................... 9
Figure 2.2: Prevalence of arthritis and musculoskeletal conditions .............................................................................................. 10
Figure 2.3: Chronic or recurrent pain reported in disability associated with arthritis and related disorders, 2003 ................................................................................................................................................................................. 12
Figure 2.4: Core-activity limitation associated with arthritis and related disorders, 2003 ............................................... 13
Figure 2.5: Very high level of psychological distress reported by people with arthritis or musculoskeletal conditions, 2001 ............................................................................................................................................................................... 14
Figure 2.6: Hospital separations for arthritis and musculoskeletal conditions, 2003–04 ............................................... 17
Figure 2.7: Trends in arthroscopy and arthroplasty, 1997–98 to 2003–04 .............................................................................. 18
Figure 2.8: Prevalence of diseases of musculoskeletal system and connective tissues by Indigenous status, 2001 ............................................................................................................................................................... 19
Figure 2.9: Prevalence of arthritis and musculoskeletal conditions by socioeconomic status, ages 35 and over, 2001 ................................................................................................................................................................................... 20
Figure 3.1: Rate ratios for excess weight among females with osteoarthritis, rheumatoid arthritis and osteoporosis, 2001 ......................................................................................................................................................................... 27
Figure 3.2: Age-specific prevalence of osteoarthritis, 2001 .............................................................................................................. 29
Figure 3.3: Feelings of hopelessness and depression associated with osteoarthritis, 2001 ........................................ 30
Figure 3.4: Management of osteoarthritis by general practitioners, 2003–04 ....................................................................... 32
Figure 3.5: Trends in knee and hip arthroplasty, 1997–98 to 2003–04 ..................................................................................... 34
Figure 4.1: Age-specific prevalence of rheumatoid arthritis, 2001 ................................................................................................. 40
Figure 4.2: Management of rheumatoid arthritis by general practitioners, 2003–04.......................................................... 43
Figure 5.1: Age-specific prevalence of osteoporosis, ages 35 and over, 2001 ....................................................................... 55
Figure 5.2: Hospitalisation for common fractures, 2003–04 ............................................................................................................ 59
Figure 5.3: Falls as a factor in hospitalisation for fractures, 2003–04 ....................................................................................... 59
Figure 5.4: Age-specific death rates for osteoporosis, ages 55 and over, 2003 .................................................................... 60
Figure 5.5: Age-specific listing of hip fracture as an additional cause of death, ages 55 and over, 2003 .............. 62
Figure 5.6: Trends in hip-fracture associated mortality in Australia, ages 55 and over, 1997–2003 ......................... 63
Figure 6.1: Employment restrictions associated with arthritis and related disorders, ages 15–64, 2003 ............. 71
Figure 6.2: Age-specific employment restrictions associated with arthritis and related disorders, ages 15–64, 2003 .......................................................................................................................................................................... 72
Figure 6.3: Arrangements made by employer for people with disability associated with arthritis and related disorders, 2003 ................................................................................................................................................................................ 73
Figure 6.4: Self-reported quality of life in persons with arthritis and musculoskeletal conditions, 2001 ................ 76
Figure 6.5: Self-reported health status for people with arthritis and musculoskeletal conditions, ages 18 and over, 2001 ................................................................................................................................................................................... 78
Figure 6.6: Self-reported health status by specific arthritis or musculoskeletal condition, 2001 ................................ 78
Figure 6.7: Long-term conditions reported by people with arthritis and related disorders as the main disabling condition, 2003 ............................................................................................................................................................. 80
Figure 7.1: Health expenditure by disease chapter, 2000–01 .......................................................................................................... 84
Figure 7.2: Expenditure for arthritis and musculoskeletal conditions by health sector, 2000–01 ............................... 86
Figure 7.3: Changes in inflation-adjusted expenditure between 1993–94 and 2000–01 ................................................. 87
Figure 7.4: Health expenditure for arthritis and musculoskeletal conditions by age and sex, 2000–01 ................. 88
Figure 7.5: Health expenditure for osteoarthritis by health sector, 2000–01 .......................................................................... 89
Figure 7.6: Health expenditure for rheumatoid arthritis by health sector, 2000–01 ........................................................... 90
Figure 7.7: Health expenditure for osteoporosis by health sector, 2000–01 ........................................................................... 91
Figure 7.8: Expenditure for osteoarthritis, rheumatoid arthritis and osteoporosis by age and sex, 2000–01 ...... 92
Figure 7.9: Expenditure for osteoarthritis, rheumatoid arthritis and osteoporosis by health sector, 2000–01 .......93
Figure 7.10: Health expenditure for NHPA diseases and conditions, 2000–01 ........................................................................ 93
Figure 8.1: The International Classification of Functioning, Disability and Health (ICF) Framework ............................. 97


PreFAce PAGE IX
Preface
This national report describes the current status of arthritis and musculoskeletal conditions in Australia and provides grounds for evidence-based action in this field.
Arthritis and musculoskeletal conditions are responsible for a significant level of morbidity and functional limitation in the Australian population and are associated with high economic costs. Regular monitoring of these diseases and conditions is central to reducing their impact.
The characteristics of arthritis and musculoskeletal conditions make monitoring a challenge as there are a multitude of diseases and conditions that fall under this heading. Their long latency, protracted clinical course and uncertain aetiology also make comprehensive reporting a bit difficult.
The report focuses specifically on osteoarthritis, rheumatoid arthritis and osteoporosis, the three major musculoskeletal conditions affecting Australians. This emphasis is in accordance with priorities set out in A National Action Plan for Osteoarthritis, Rheumatoid Arthritis and Osteoporosis 2004–2006, endorsed by the Australian Health Ministers’ Conference in July 2005.
Since the endorsement of arthritis and musculoskeletal conditions as a National Health Priority Area by Australian Health Ministers in 2002, the Australian Institute of Health and Welfare has been collecting relevant information from a variety of data sources. The Institute has used this information to generate a baseline statistical profile which will enable effective monitoring of these conditions into the future.
The establishment of the National Centre for Monitoring Arthritis and Musculoskeletal Conditions by the Institute complements existing monitoring and analysis of other national health priority areas including asthma, cardiovascular disease, diabetes, cancer and injury.
The report will be useful to a range of stakeholders including community advocates, policy makers and health planners for assessing health care needs and highlighting the possible areas of intervention to reduce the impact of arthritis and musculoskeletal conditions in Australia.
Richard Madden John Horvath Director Chair Australian Institute of Health and Welfare National Health Priority Action Council


PAGE XI
Acknowledgments
Several colleagues and experts have made significant contributions to the development of this report. Their valuable input in compiling relevant information is gratefully acknowledged.
The authors of this report are Dr Naila Rahman, Ms Elizabeth Penm and Dr Kuldeep Bhatia.
The preparation of the report was guided by the Data Working Group of the National Arthritis and Musculoskeletal Conditions Advisory Group (NAMSCAG). Valuable input was also received from the Executive of NAMSCAG in the finalisation of the report. Our special thanks go to Dr John Eisman, Chair, NAMSCAG for his support at all stages of the work. The authors also acknowledge the timely comments of Professor Peter Brooks (a member of NAMSCAG) at a critical stage in the preparation of the report.
nAmscAG executive
Professor John Eisman (Chair), Garvan Institute of Medical Research, Sydney
Dr John Carnie, Disease Control and Research, Victorian Department of Human Services, Melbourne
Dr Julien de Jager, Southport, Brisbane
Ms Judy Stenmark, Osteoporosis Australia, Sydney
Professor Nicholas Bellamy, CONROD, Mayne Medical School, University of Queensland, Brisbane
nAmscAG data Working Group
Professor Nicholas Bellamy (Chair), CONROD, Mayne Medical School, University of Queensland, Brisbane
Dr Kuldeep Bhatia, Australian Institute of Health and Welfare, Canberra
Associate Professor Flavia Cicuttini, Department of Epidemiology and Preventative Medicine, Monash University, Melbourne
Professor Robert Cumming, Centre for Education and Research on Ageing, Concord Hospital, Sydney
Associate Professor Graeme Jones, Menzies Centre for Population Health Research, Hobart
Associate Professor Lyn March, Department of Rheumatology, Royal North Shore Hospital, Sydney
Dr Richard Osborne, Centre for Rheumatic Diseases, University of Melbourne, Melbourne
Ms Anne Taylor, Population Research and Outcome Studies Unit, South Australian Department of Health
Ms Pam Webster, Carers Australia, Sydney
Mr Michael Fisher, Asthma and Arthritis Section, Department of Health and Ageing, Canberra
Ms Isolde Kauffman, Asthma and Arthritis Section, Department of Health and Ageing, Canberra
Many colleagues in the Australian Institute of Health and Welfare were extremely helpful in the extraction and analysis of data. Dr Paul Meyer, Ms Tracy Dixon, Dr Perri Timmins, Dr Bin Tong, Ms Ros Madden and Dr Xingyan Wen commented upon various sections of the report. Mr Nick Mann and Mr John Goss provided the health expenditure data used in the report. The assistance received from the staff of the Information Services and Publishing Unit and the Business Promotion and Media Unit in coordinating the production of the report is also gratefully acknowledged.
Dr Ching Choi, Head of the Health Division was highly supportive of the project at all stages. His comments and advice on various drafts helped improve the presentation of the report.
The project was funded by the Australian Government Department of Health and Ageing through the Better Arthritis Care Budget Initiative. The support and assistance received from the Asthma and Arthritis Section of the Department, in particular from Mr Michael Fisher and Ms Isolde Kauffman, is gratefully acknowledged.
AcknoWledGments


eXecutiVe summArY PAGE XIII
Executive summary
Arthritis and musculoskeletal conditions are large contributors to illness, pain and disability in Australia. Highly prevalent, they place a significant burden on the community, both economic and personal, including the use of hospital and primary care services, disruptions to daily life, and lost productivity through disability.
More than 6.1 million Australians are reported to have arthritis or a musculoskeletal condition. Most commonly reported conditions are back pain and various forms of arthritis. Almost 1.2 million Australians are reported to have disability associated with arthritis and related disorders. Activity limitation is reported for a range of tasks. Mobility limitation is one of the major features of arthritis associated disability.
In view of this large disease burden—the number of people affected and the high disability impact—arthritis and musculoskeletal conditions were declared a National Health Priority Area (NHPA) in July 2002. The initial focus of this initiative is on osteoarthritis, rheumatoid arthritis and osteoporosis.
A National Action Plan (NAP) has been developed by the National Arthritis and Musculoskeletal Conditions Advisory Group (NAMSCAG) to reduce the burden of disease and disability associated with osteoarthritis, rheumatoid arthritis and osteoporosis, and to improve the health-related quality of life.
This report has been developed to generate baseline information in accordance with the National Action Plan. The rather incomplete picture of the state of arthritis and musculoskeletal conditions given in this report largely reflects the limitations and quality of the available data.
Focus areasArthritis covers a diverse group of diseases and conditions, involving inflammation of the joints that causes pain, stiffness and disability. Other musculoskeletal conditions, which include disorders of the bones, muscles and their attachments to each other (including osteoporosis), are also significantly diverse.
The most common form of arthritis, osteoarthritis, affects nearly 1.4 million Australians. The condition mainly affects the hands, spine and weight-bearing joints such as hips, knees and ankles. Osteoarthritis is usually a progressive disease, one that gets worse with time, leading often to functional limitation. As the disease progresses, the pain becomes more severe and incapacitating, thus impacting upon the wellbeing of the individual.
Rheumatoid arthritis, the most common autoimmune disease in Australia, affects around 438,000 persons, a large proportion of whom are women. A more serious disease, rheumatoid arthritis involves inflammation of the joints, most often affecting the hand joints in symmetrical fashion, and often producing deformities. Disability associated with rheumatoid arthritis starts early in the disease process and can seriously compromise the quality of life.
Osteoporosis is the thinning and weakening of the bone substance, with a resulting risk of fracture and deformity. Fractures after minimal trauma are a hallmark of osteoporosis. They can impact upon a person’s ability to walk unassisted, and may lead to loss of independence. In 2001, almost 300,000 Australians were estimated to have reported osteoporosis. This number, however, is a significant underestimate. The lifetime risk of an osteoporotic fracture is considered to be greater than one in two for women and about one in three for men.
Quality of lifePain, acute or chronic, is the key symptom for most forms of arthritis and musculoskeletal conditions. Acute pain can last for a few days or, in the case of osteoporotic fractures, for several weeks, and wane as healing occurs. However, in the majority of those affected, chronic pain ranges from mild to severe and can last months, years or a lifetime. Osteoporosis is usually painful in association with a fracture event but can have chronic ongoing pain that results in much disability and mortality.
PAGE XIV Arthritis And musculoskeletAl conditions in AustrAliA 2005
Large differences are noted in the quality of life of persons with osteoarthritis, rheumatoid arthritis and osteoporosis. Those with osteoarthritis are generally otherwise well. Their condition varies in intensity, but tends to be self-limited and usually remits leaving little residual effect—some, however, experience limitation in activities and restricted participation. Rheumatoid arthritis on the other hand has large impact on quality of life—impinging significantly on comfort, physical function, social and emotional relationships, and mental health, owing to its painful and disabling nature. In osteoporosis, the pain and long-term disability associated with fractures, in particular hip and vertebral fractures, significantly affects the quality of life, leading to decreased physical, psychological and social function.
These conditions not only limit a person’s mobility but also cause a significant amount of difficulty in undertaking daily living activities, and in working or participating in recreational activities. Those with rheumatoid arthritis are at risk of work disability from the onset of their symptoms. In osteoarthritis, work disability is common after the age of 50. The loss of functional capacity and an inability to participate in recreational activities may, in turn, result in social isolation, depression and low self-esteem.
Health expenditureThe high prevalence and significant disability associated with arthritis and musculoskeletal conditions account for a large expenditure on health care. These conditions accounted for the third largest proportion of health expenditure in 2000–01, an estimated expenditure of $4.6 billion.
Between them, osteoarthritis, rheumatoid arthritis and osteoporosis accounted, in 2000–01, for $1.6 billion, or 35.6% of the overall expenditure for arthritis and musculoskeletal conditions. Osteoarthritis-related expenditure was the largest component (25.5% of all expenditure for arthritis and musculoskeletal conditions), followed by that for rheumatoid arthritis (5.3%) and osteoporosis (4.8%). However, these estimates of health service expenditure do not include indirect costs which would add considerably to the total cost.
The pattern of expenditure for the three focus areas varies considerably by health sector. Hospital services accounted for the largest portion of expenditure for osteoarthritis, followed by aged care homes and pharmaceuticals. For rheumatoid arthritis, the expenditure was distributed relatively evenly across the health care sectors, except research. Post-fracture treatment and the ongoing need for care accounted mostly for osteoporosis costs.
Prevention, treatment and management The effects of arthritis and musculoskeletal conditions can be reduced through early prevention and appropriate management. There have been some exciting developments in understanding their causal mechanisms, and in better understanding their risk factors. There have also been improved medications for their treatment.
Limited primary prevention measures have been described for osteoarthritis. As there is no cure for osteoarthritis, its management is primarily concerned with controlling the pain and improving functioning and health-related quality of life. A significant advancement in treating osteoarthritis is total joint replacement.
Rheumatoid arthritis is difficult to treat systematically. Although current treatments have been relatively successful in controlling the symptoms of chronic inflammation, true long-term remission in aggressive rheumatoid arthritis has not been achieved. Early diagnosis is an integral part of the current treatment paradigm for rheumatoid arthritis.
The management of osteoporosis includes effective and safe treatments that reduce fracture risk. Lifestyle changes, including appropriate nutrition and exercise regimens (with avoidance of tobacco and excessive alcohol use), may improve bone mass and reduce the risk of fractures. Oestrogen replacement, although not commonly suggested at present, and bisphosphonates in people with established osteoporosis reduce the risk of all types of osteoporotic fractures.
Surveillance and monitoringThe surveillance and monitoring of arthritis and musculoskeletal conditions is at an early stage in Australia. The currently available data are patchy and generally non-standard. Most of the population-based information is based on self-reports. There is an urgent need to improve the content and quality of both national and regional data on arthritis and musculoskeletal conditions.

1 > introduction PAGE 1
1 > Introduction
KEy POINTS
• Arthritis and musculoskeletal conditions are the latest group of diseases and conditions to be chosen as a National Health Priority Area (NHPA). The initial focus areas of this NHPA are osteoarthritis, rheumatoid arthritis and osteoporosis.
• They are the most prevalent diseases and conditions among the NHPAs. Almost 6.1 million Australians are estimated to have these long term. Most of the problems occur among people aged 65 and over.
• Arthritis and musculoskeletal conditions are a significant cause of disability, with 1.2 million Australians reporting them as their main disabling condition.
• A National Action Plan has been developed to reduce the burden associated with osteoarthritis, rheumatoid arthritis and osteoporosis.
Arthritis and musculoskeletal conditions are large contributors to illness, pain and disability in Australia. Accounting for more than 4% of the overall disease burden, measured in terms of disability-adjusted life years (DALY), they account for a significant proportion of healthy years of life lost (AIHW: Mathers & Penm 1999). Arthritis and musculoskeletal conditions also represent more than half of all chronic conditions globally and are the most common cause of severe, long-term pain and physical disability (Murray & Lopez 1996).
The need and the potential for the prevention, treatment and management of arthritis and musculoskeletal conditions are increasing. Since the incidence increases with age, the number of people with these diseases and conditions is likely to rise with the ageing of the population. On the other hand, there have been some useful developments in elucidating their causal mechanisms, and in better understanding their risk factors. There have also been improved medications for their treatment. Joint replacement surgery, in particular, has revolutionised the lives of many people.
In view of this promising profile, Australian Health Ministers declared arthritis and musculoskeletal conditions as a National Health Priority Area (NHPA) in July 2002.
A National Health Priority AreaBadging a disease or condition as a National Health Priority Area provides a useful mechanism to examine population health care. It also provides the framework within which interventions to benefit the population are introduced. These activities may concern health promotion, diagnosis, treatment or management. The potential for their prevention is limited at present; however, regular treatment and management should help to reduce their overall impact.
Arthritis and musculoskeletal conditions are the seventh set of diseases and conditions to be chosen as an NHPA. The justification for their selection was evidence based (Table 1.1). They affect a large proportion of the population; almost one-third of Australians report these diseases and conditions as long term (ABS 2002). They are also the second most common reason for presentation to a general practitioner (AIHW: Britt et al. 2004), and the third leading cause of health expenditure (AIHW 2005). Significant activity limitation has been associated with arthritis and musculoskeletal conditions, in particular among those aged 65 and over (March et al. 1998; ABS 2004).

PAGE 2 Arthritis And musculoskeletAl conditions in AustrAliA 2005
Table 1.1: Burden of various NHPA diseases and conditions
NHPA
Prevalence(a) (2001)
Disability (2003)
Deaths(b) (2003)
Disability-adjusted life years(a)
(1996)
Number ’000
Per cent population
Number ’000
Per cent persons
with disability
Number ’000
Per cent all deaths
DALyS ’000
Per cent total DALy
Cardiovascular problems 3,185.9 16.8 349.7 8.8 48.8 36.9 548.6 21.9
Cancer 267.6 1.4 62.4 1.6 37.6 28.4 478.6 19.1
Mental disorders(c) 1,812.6 9.6 636.9 16.1 3.2 2.4 333.9 13.3
Injury and poisoning(c) 2,241.9 11.9 259.4 6.6 7.7 5.9 209.9 8.4
Diabetes 554.2 2.9 86.2 2.2 3.4 2.6 122.5 4.9
Asthma 2,197.3 11.6 148.9 3.8 0.3 0.2 64.5 2.6
Arthritis(d) 6,058.1 32.0 1,355.1 34.2 1.0 0.8 89.9 3.6
All NHPAs 9,765.5(e) 51.6(e) 2,898.6 73.2 102.1 77.2 1,847.9 73.8
(a) Self-reported, estimates based on 2001 National Health Survey. All health conditions are long term except injury which is recorded if occurring in the four weeks prior to interview.
(b) Deaths registered in 2003.
(c) Suicide is included with injury and poisoning.
(d) Arthritis and musculoskeletal conditions.
(e) Because of the presence of more than one NHPA disease or condition, the total for all NHPAs is less than the sum of numbers in each column.
Sources: AIHW: Mathers & Penm 1999; ABS 2002, 2004; AIHW National Mortality Database.
Another important consideration for the inclusion of arthritis and musculoskeletal conditions as an NHPA is the potential for intervention. Due to their high prevalence, a large proportion of the population would benefit from some of the interventions. Their causal mechanisms and risk factors are now better understood. Better pharmaceutics and joint replacement prostheses have also significantly improved the quality of life of many people.
Bone and Joint DecadeThe declaration of arthritis and musculoskeletal conditions as an NHPA by Australian Health Ministers in 2002 endorses the World Health Organization (WHO) decision to focus attention this decade on these disease and conditions. A Bone and Joint Decade was launched by the WHO in 2000 in view of the increasing impact of arthritis and musculoskeletal conditions globally (Hazes & Woolf 2000).
A major objective of the Bone and Joint Decade is to create awareness and to generate networks of patient and professional organisations that will emphasise the need for managing these diseases and conditions better. The decade has four major aims:
• to raise awareness of the growing burden of musculoskeletal disorders on society
• to promote prevention of musculoskeletal disorders and empower patients through education campaigns
• to advance research in the prevention, diagnosis and treatment of musculoskeletal disorders, and
• to improve diagnosis and treatment of musculoskeletal disorders.
Groups such as the Arthritis Foundation of Australia, the Australian Rheumatology Association and the Australian Orthopaedic Association are already actively pursuing some of these aims and will play major roles in developing activities for the decade in Australia (Brooks & Hart 2000).
Focus areasThe NHPA initiative for arthritis and musculoskeletal conditions is focused initially on osteoarthritis, rheumatoid arthritis and osteoporosis. These three conditions are among the most common, both in Australia and worldwide. They are also the basis of significant disability. However, the three are very dissimilar conditions, with different causes, varying symptoms, and distinctively different coping strategies. Their selection for focused attention under the NHPA initiative therefore covers a broad spectrum of morbidity, disability and mortality issues associated with arthritis and musculoskeletal conditions.
1 > introduction PAGE 3
osteoarthritis
Osteoarthritis, the most common chronic joint problem, affects the hands, spine and weight-bearing joints such as hips, knees and ankles. The disease mostly begins in the cartilage and sometimes the underlying bone, and may be accelerated by mechanical forces, such as injury, that disrupt the normal function of the joint. Pain is initially felt in the joints during and after activity, but as the disease progresses it may occur with only minimal movement or even during rest. Osteoarthritis affects a large segment of the population; in particular, those aged 65 and over commonly develop the condition.
• Osteoarthritis is generally a disease of advancing years, but it can affect young people.
• The prevalence of the disease varies a great deal between populations.
• Osteoarthritis of the knee is more common among obese people.
rheumatoid arthritis
Rheumatoid arthritis is the commonest cause of chronic inflammatory joint disease. An autoimmune disease, most often affecting the hand joints in a symmetrical fashion and often producing deformities, it is systemic in nature and affects many organs of the body. The disease is reported by about 2.4% of the population and is substantially more common among females than males.
• Rheumatoid arthritis usually starts in the fourth decade of life; however, it does also affect younger age groups.
• It is more common in some populations than others.
• The disease produces significant deformity and disability. It also contributes to premature mortality.
The treatment of rheumatoid arthritis has improved significantly over the last two decades. Optimal management of rheumatoid arthritis involves arresting or controlling its progression through early diagnosis and treatment.
osteoporosis
Osteoporosis is the thinning and weakening of the bone substance that increases the risk of fracture, such as those of the hip and spine. It occurs more frequently in older people, especially women, although the rate of deterioration varies between individuals.
• The increased risk of fracture associated with osteoporosis is often translated into premature mortality. In particular, mortality following hip fractures is high.
• Decreased quality of life and high health costs are two major consequences of osteoporosis-associated fractures.
• There is significant underestimation of the occurrence of osteoporosis in Australia. Self-reports of osteoporosis are more likely to be limited to its diagnosis following a fracture.
Osteoporosis is mostly a silent disease but can be treated or even prevented. A diet rich in calcium and vitamin D, and regular weight-bearing exercise, can prevent or lessen its effects.
National Action PlanA National Action Plan (NAP) has been prepared by the National Arthritis and Musculoskeletal Conditions Advisory Group (NAMSCAG) to decrease the burden of disease and disability associated with osteoarthritis, rheumatoid arthritis and osteoporosis, and to improve the health-related quality of life (see Appendix A for full text of the plan). The development of the plan was informed by advice from its working groups and from stakeholders, including people with these conditions (AHMC 2005).
The NAP aims to provide a blueprint for national efforts to improve the health-related quality of life of people living with osteoarthritis, rheumatoid arthritis and osteoporosis, to reduce the cost and prevalence of those conditions, and to reduce the impact on individuals, their carers and communities in Australia. It is intended to guide the National Health Priority Action Council and the Australian Government Department of Health and Ageing in a range of activities of national significance designed to deliver better health outcomes. The plan will complement both the National Chronic Disease Strategy and the National Service Improvement Framework for Osteoarthritis, Rheumatoid Arthritis and Osteoporosis, as well as other national and state/territory structures.

PAGE 4 Arthritis And musculoskeletAl conditions in AustrAliA 2005
The following areas have been identified for urgent action under the NAP:
1. Reducing the burden of disease
2. Advancing and disseminating knowledge and understanding of osteoarthritis, rheumatoid arthritis and osteoporosis
3. Reducing disadvantage by considering groups with special needs
4. Driving national improvements in systems and services, and
5. Measuring and managing performance and outcomes.
The main focus of initial efforts will be:
• promoting healthy lifestyles and self-management to optimise health outcomes for osteoarthritis, rheumatoid arthritis and osteoporosis
• promoting best practice for the optimal management of osteoarthritis, rheumatoid arthritis and osteoporosis
• promoting early and optimal management of rheumatoid arthritis to minimise joint damage
• promoting appropriate post-fracture assessment to minimise further osteoporotic fractures
• promoting timely joint replacement for osteoarthritis and rheumatoid arthritis, and
• developing, prioritising and progressing a research agenda to support this national health priority. This includes establishing baselines and implementing ongoing data collection systems.
Mention must be made of two important strategies now being put in place as part of the NAP:
national service improvement Framework for osteoarthritis, rheumatoid Arthritis and osteoporosis
A National Service Improvement Framework has been developed to better enhance in health services for osteoarthritis, rheumatoid arthritis and osteoporosis. The aims of the framework are to limit the development and progression of these conditions, slow the onset of complications leading to disability, reduce avoidable declines in health, and minimise variation in care by outlining the services that all people should expect to receive from the Australian health system. The intention is to achieve better health outcomes through the provision of equitable, timely and effective care (DoHA 2005).
Evidence gathered from a range of sources enabled opportunities to be identified, given as Critical Intervention Points. The framework also describes what is currently known about high-quality services for people in the well community, and for people with osteoarthritis, rheumatoid arthritis and osteoporosis during their different stages. The similarities among the conditions in relation to optimal services are also described, which is in addition to condition-specific requirements.
surveillance and monitoring
The NAP also outlined the need for establishing baselines and implementing ongoing data collection systems. Of all the prominent chronic diseases, arthritis and musculoskeletal conditions have probably received the least attention in this regard. This is despite their large impact on quality of life through persistent morbidity and disability.
A largely non-fatal profile has probably led to a low perception of the need for regular surveillance and monitoring of arthritis and musculoskeletal conditions. Mortality databases—otherwise one of the best sources of information for disease monitoring—are of limited use in monitoring these diseases and conditions. There is also very limited information in other health-related databases. A major gap is the lack of detailed data on the use of health care services. Most of the care for arthritis and musculoskeletal conditions, including specialist care, is delivered in community settings for which there are currently no systematic data available.
A well-designed system is needed for surveillance and monitoring to facilitate the prevention and management of arthritis and musculoskeletal conditions. In addition to determining their impact (in terms of occurrence, disability, mortality, expenditure and quality of life) and to assessing variation among population groups, the system facilitate in early detection of underlying trends. Information on both ambulatory and managed care of arthritis and musculoskeletal conditions is important. The system should also provide the latest data to inform the development, implementation and evaluation of various policies and interventions, in particular those about early diagnosis, appropriate management and psychosocial functioning.
PAGE 5
Statement of the problemThere is no systematic way to describe arthritis and musculoskeletal conditions or their status in a population. They are a large group of diseases and conditions, which may result from congenital anomalies, metabolic or biochemical abnormalities, infections, inflammatory conditions, cancer and trauma. More than 100 diseases are labelled as arthritis. The course of the disease(s) also varies.
Arthritis is the inflammation of a joint, although the term is now extended to describe any damage to a joint. Any painful chronic condition in tissues in and around the joints is also often referred to as arthritis. The musculoskeletal conditions, on the other hand, are a much larger group of disparate entities.
Not all disorders of the musculoskeletal system are characterized by aches and pains. Conditions such as osteoporosis are not commonly painful but predispose individuals to fractures and injuries that do result in much pain, disability and mortality.
A framework needs to be established within which arthritis and musculoskeletal conditions and their role in the health of a population can be described. This framework should not only cover their epidemiology but also address the issue of a population’s ability to benefit from various health interventions. A baseline profile of the diseases could form the basis for action.
To generate a population-based profile of this heterogeneous collection of diseases and conditions, and to use that information to assess the impact of interventions, requires data from a range of sources. The burden could be measured in terms of associated problems (e.g. impaired functioning or work loss), or by identifying the people at risk, a useful strategy in disease prevention. The provision and use of current services are equally important in describing their role in the health of a population.
Aims and organisation of the reportIn accordance with the NAP, this report has been developed to generate baseline information. It describes the status of arthritis and musculoskeletal conditions in Australia, broadly with a focus on osteoarthritis, rheumatoid arthritis and osteoporosis. No attempt is made to describe the need for health care, appropriate treatment and prevention.
This report attempts to describe:
1. the extent of the problem in the general population
2. the causes and risk factors for arthritis and musculoskeletal conditions
3. the extent of musculoskeletal impairments and disability
4. the diseases and conditions as a reason for seeking health care
5. the diseases and conditions as a cause of both short- and long-term work loss, and
6. the impact of the diseases and conditions upon quality of life.
The report has been organised into eight chapters and several technical appendices. In addition to providing information on the burden of arthritis and musculoskeletal conditions as a whole, the report concentrates specifically on osteoarthritis, rheumatoid arthritis and osteoporosis, areas identified for focused attention. Information on health system costs and quality of life is also provided within a broader framework. The quality of available data has been evaluated for regular monitoring and data gaps, with deficiencies identified for future action.
Introductory in nature and scope, Chapter 1 provides background information on arthritis and musculoskeletal conditions in Australia and gives the rationale for their selection as an NHPA. A brief overview of the NAP and the National Service Improvement Framework for Osteoarthritis, Rheumatoid Arthritis and Osteoporosis is also included. Chapter 2 describes the burden of arthritis and musculoskeletal conditions in the population as a whole, using prevalence, morbidity, activity limitation, health service use and mortality data.
Chapters 3, 4 and 5 describe the diagnosis, risk factors, treatment and management of osteoarthritis, rheumatoid arthritis and osteoporosis respectively, and their impact in terms of morbidity, activity limitation and quality of life. Issues regarding their prevention and management are outlined and the information required to follow up the success of various strategies is discussed.
1 > INTRODUCTION

PAGE 6 Arthritis And musculoskeletAl conditions in AustrAliA 2005
Chapter 6 covers a range of quality of life issues associated with arthritis and musculoskeletal conditions, at both an individual and societal level. Although several of the issues discussed require individual attention in relation to specific diseases, an attempt has been made to provide this information within a broader context.
Information on health system expenditure associated with arthritis and musculoskeletal conditions is covered in Chapter 7. No attempt has been made to provide information on indirect costs.
Chapter 8 provides an overview of issues surrounding the surveillance and monitoring of arthritis and musculoskeletal conditions in Australia. A framework within which to evaluate the completeness and quality of the Australian datasets for this purpose is described. A review of data collections used in the preparation of this report, including their strengths and limitations, has been included.
Most of the information included in this report is baseline, and therefore descriptive in nature. Nonetheless, the report should form the basis for regular surveillance and monitoring of arthritis and musculoskeletal conditions in Australia. It should also help to evaluate the success of various prevention and management strategies being put into place as part of the NHPA initiative for arthritis and musculoskeletal conditions.
ReferencesABS (Australian Bureau of Statistics) 2002. 2001 National Health Survey: summary of results. ABS Cat. No. 4364.0. Canberra: ABS.
ABS 2004. Disability Australia. ABS Cat. No. 4446.0. Canberra: ABS.
AHMC (Australian Health Ministers’ Conference) 2005. A National Action Plan for Osteoarthritis, Rheumatoid Arthritis and Osteoporosis 2004–2006. A National Health Priority Area. Canberra: Department of Health and Ageing.
AIHW (Australian Institute of Health and Welfare) 2005. Health system expenditure on disease and injury in Australia, 2000–01. Second edition. AIHW Cat. No. HWE 26. Canberra: AIHW.
AIHW: Britt H, Miller GC, Knox S et al. 2004. General practice activity in Australia 2003–04. AIHW Cat. No. GEP 16. Canberra: AIHW.
AIHW: Mathers C & Penm R 1999. Health system costs of injury, poisoning and musculoskeletal disorders in Australia 1993–94. AIHW Cat. No. HWE 6. Canberra: AIHW.
Brooks PM & Hart JAL 2000. The Bone and Joint Decade: 2000–2010. Editorial. Medical Journal of Australia 172:307–8.
DoHA (Department of Health and Ageing) 2005. National Service Improvement Framework for Osteoarthritis, Rheumatoid Arthritis and Osteoporosis. Canberra: DoHA.
Hazes JM & Woolf AD 2000. The Bone and Joint Decade 2000–2010. Journal of Rheumatology 27:1–3.
March LM, Brnabic AJM, Skinner JC et al. 1998. Musculoskeletal disability among elderly people in the community. Medical Journal of Australia 168:439–42.
Murray JL & Lopez AD (eds.) 1996. The global burden of disease: a comprehensive assessment of mortality and disability from diseases, injuries and risk factors in 1990 and projected to 2020. Cambridge, Massachusetts: Harvard University Press.

2 > Burden oF Arthritis And musculoskeletAl conditions PAGE 7
2 > Burden of arthritis and musculoskeletal conditions
KEy POINTS
• Arthritis and musculoskeletal conditions constitute a major public health burden in Australia, as large contributors to illness, pain and disability.
• More than 6.1 million Australians are estimated to have arthritis or a musculoskeletal condition long term, based on the 2001 National Health Survey (NHS). These numbers are not based on doctor diagnosis.
• Back pain was the most commonly reported musculoskeletal condition, followed by osteoarthritis.
• Around 14% of people with disability report arthritis and related disorders as their main disabling condition. About one-third of these people hadt chronic or recurrent pain due to these disorders.
• Mobility limitation was the most common core-activity limitation reported. Individuals mainly needed assistance with going out of the house, transferring to and from bed, and getting about in the house.
• More than 170,000 people had a severe or profound core-activity restriction in 2003. These people always needed assistance with some activities of daily living.
• General practitioners (GPs) are probably the most common source of health care. After respiratory conditions, arthritis and musculoskeletal conditions were the problem managed most frequently by GPs in 2003–04 (17 per 100 encounters).
• Back complaint was the most common musculoskeletal condition managed by GPs, followed by osteoarthritis. A variety of management strategies has been reported by GPs to treat or manage these conditions.
• The use of allied health services, such as those provided by physiotherapists, is also high among people with arthritis and musculoskeletal conditions.
• A large proportion of hospital separations for arthritis and musculoskeletal conditions is for surgical interventions such as arthroscopy and arthroplasty, undertaken to repair damage to a joint, to restore function or to relieve pain. The use of both these procedures has increased over the last several years.
• Family members are the main providers of help or informal care for people with disability that is due to arthritis and musculoskeletal conditions.
Measuring the burden of a disease is central to describing its contribution to the overall health of a population. These measures are useful in allocating health care resources and in evaluating the potential costs and benefits of public health interventions. The information is also relevant to setting National Health Priority Area goals.
Arthritis and musculoskeletal conditions constitute a major public health problem, as large contributors to illness, pain and disability. They occur frequently, placing a high economic and personal burden on the community. This burden includes the use of hospital and primary care services, disruptions to daily life, and lost productivity through functional limitations and activity restriction.
A variety of measures can be used to describe the burden of these diseases and conditions. Prominent among these are distribution and prevalence, and associated functional limitations. The use of health care services can also be used as an indicator of the disease burden. Measures such as quality of life, health system expenditure and disability-adjusted life years summarise their impact overall. Mortality is not a great descriptor of the burden associated with arthritis and musculoskeletal conditions.
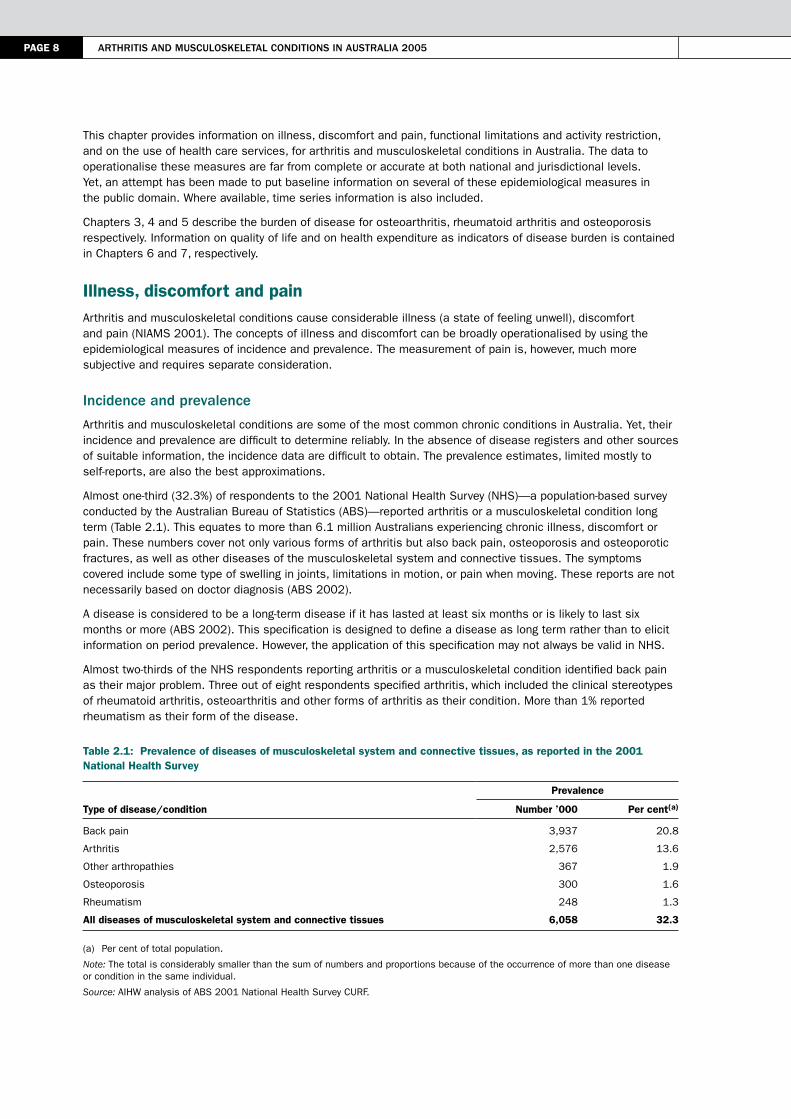
PAGE 8 Arthritis And musculoskeletAl conditions in AustrAliA 2005
This chapter provides information on illness, discomfort and pain, functional limitations and activity restriction, and on the use of health care services, for arthritis and musculoskeletal conditions in Australia. The data to operationalise these measures are far from complete or accurate at both national and jurisdictional levels. Yet, an attempt has been made to put baseline information on several of these epidemiological measures in the public domain. Where available, time series information is also included.
Chapters 3, 4 and 5 describe the burden of disease for osteoarthritis, rheumatoid arthritis and osteoporosis respectively. Information on quality of life and on health expenditure as indicators of disease burden is contained in Chapters 6 and 7, respectively.
Illness, discomfort and painArthritis and musculoskeletal conditions cause considerable illness (a state of feeling unwell), discomfort and pain (NIAMS 2001). The concepts of illness and discomfort can be broadly operationalised by using the epidemiological measures of incidence and prevalence. The measurement of pain is, however, much more subjective and requires separate consideration.
incidence and prevalence
Arthritis and musculoskeletal conditions are some of the most common chronic conditions in Australia. Yet, their incidence and prevalence are difficult to determine reliably. In the absence of disease registers and other sources of suitable information, the incidence data are difficult to obtain. The prevalence estimates, limited mostly to self-reports, are also the best approximations.
Almost one-third (32.3%) of respondents to the 2001 National Health Survey (NHS)—a population-based survey conducted by the Australian Bureau of Statistics (ABS)—reported arthritis or a musculoskeletal condition long term (Table 2.1). This equates to more than 6.1 million Australians experiencing chronic illness, discomfort or pain. These numbers cover not only various forms of arthritis but also back pain, osteoporosis and osteoporotic fractures, as well as other diseases of the musculoskeletal system and connective tissues. The symptoms covered include some type of swelling in joints, limitations in motion, or pain when moving. These reports are not necessarily based on doctor diagnosis (ABS 2002).
A disease is considered to be a long-term disease if it has lasted at least six months or is likely to last six months or more (ABS 2002). This specification is designed to define a disease as long term rather than to elicit information on period prevalence. However, the application of this specification may not always be valid in NHS.
Almost two-thirds of the NHS respondents reporting arthritis or a musculoskeletal condition identified back pain as their major problem. Three out of eight respondents specified arthritis, which included the clinical stereotypes of rheumatoid arthritis, osteoarthritis and other forms of arthritis as their condition. More than 1% reported rheumatism as their form of the disease.
Table 2.1: Prevalence of diseases of musculoskeletal system and connective tissues, as reported in the 2001 National Health Survey
Type of disease/condition
Prevalence
Number ’000 Per cent(a)
Back pain 3,937 20.8
Arthritis 2,576 13.6
Other arthropathies 367 1.9
Osteoporosis 300 1.6
Rheumatism 248 1.3
All diseases of musculoskeletal system and connective tissues 6,058 32.3
(a) Per cent of total population.
Note: The total is considerably smaller than the sum of numbers and proportions because of the occurrence of more than one disease or condition in the same individual.
Source: AIHW analysis of ABS 2001 National Health Survey CURF.

2 > Burden oF Arthritis And musculoskeletAl conditions PAGE 9
Diseases of the musculoskeletal system and connective tissues, as they are referred to in the 2001 NHS, were equally common for both sexes. However, certain disorders were more common in one or the other sex. While back pain was more commonly reported by males, osteoarthritis and rheumatoid arthritis were more prevalent in females.
Age is a strong determinant, being almost synonymous with the presence of arthritis and musculoskeletal conditions (Figure 2.1). However, these diseases and conditions do not affect the aged only. Nearly three out of five people reporting arthritis are younger than 65 years. By that age, however, over half of the females and 40% of the males report having some form of arthritis or a musculoskeletal condition (March et al. 1998).
The NHS does not cover individuals residing in institutions, including hostels and aged care units. As arthritis and musculoskeletal conditions are more commonly prevalent among the aged, the NHS underestimates their prevalence in the population.
Note: See Appendix E, Table E2.1 for detailed information.
Source: AIHW analysis of ABS 2001 National Health Survey CURF.
Figure 2.1: Age-specific prevalence of arthritis and musculoskeletal conditions, 2001
other sources of prevalence data
Another useful source of information for the prevalence of arthritis and musculoskeletal conditions is the ABS Survey of Disability, Ageing and Carers (SDAC). The SDAC not only samples the general population but also, unlike the NHS, covers nursing homes and other related institutions.
According to the 2003 SDAC, over 21% of the Australian population reported arthritis or a musculoskeletal condition as being long term. The most commonly reported conditions were arthritis and related disorders, followed by back problems (Table 2.2). Arthritis and related disorders were more common among those aged 65 years and over.
Number per 1,000 population
0
100
200
300
400
500
600
700
800
0–14 15–24 25–34 35–44 45–54 55–64 65–74 75+
Age group (years)
Males
Females

PAGE 10 Arthritis And musculoskeletAl conditions in AustrAliA 2005
Table 2.2: Prevalence of diseases of the musculoskeletal system and connective tissues, as reported in the ABS 2003 Survey of Disability, Ageing and Carers
Type of disease/condition
Prevalence
Number ’000 Per cent(a)
Arthritis and related disorders 1,816 9.2
Back problems (dorsopathies) 1,766 9.0
Osteoporosis 337 1.7
Other diseases of the musculoskeletal system and connective tissues 178 0.9
Other soft tissue/muscle disorders (including rheumatism) 105 0.5
Repetitive strain injury/occupational overuse syndrome 43 0.2
All diseases of musculoskeletal system and connective tissues 4,246 21.5
(a) Per cent of total population.
Note: The total is considerably smaller than the sum of numbers and proportions because of the occurrence of more than one disease or condition in the same individual.
Source: AIHW analysis of ABS 2003 Survey of Disability, Ageing and Carers CURF.
The proportions of people reporting diseases of the musculoskeletal system and connective tissues in the two ABS surveys, namely the 2001 NHS and 2003 SDAC, differ considerably (Tables 2.1 and 2.2). They also differ in the relative prevalence of various diseases and conditions. The proportion of people reporting back problems in the 2003 SDAC, for example, is less than half the proportion in the 2001 NHS. On the other hand, people reporting arthritis and related disorders rank the highest in the 2003 SDAC. Coincidentally, osteoporosis is reported in similar proportions by respondents in both the surveys (Figure 2.2).
The difference in prevalence estimates between the two surveys may be explained partly by the survey methods used. The purpose of the NHS is to obtain information on the health status of Australians in the community and their use of health services and facilities. The SDAC, on the other hand, is specifically designed to collect information about disability in the Australian population. The NHS uses a general question about any long-term condition, including those conditions not necessarily associated with disability. In contrast, the SDAC long-term health conditions are more likely to be associated with an impairment or activity limitation. In addition, the SDAC includes people residing in non-private dwellings (institutions) such as aged care homes and hospitals, while the NHS does not (AIHW 2004a).
Note: See Appendix E, Table E2.2 for detailed information.
Source: AIHW analysis of ABS 2001 National Health Survey CURF and ABS 2003 Survey of Disability, Ageing and Carers CURF.
Figure 2.2: Prevalence of arthritis and musculoskeletal conditions
0
500
1,000
1,500
2,000
2,500
3,000
3,500
4,000
Back pain Arthritis Other arthropathies Osteoporosis Rheumatism
Musculoskeletal condition
Number ’000
NHS
SDAC
2 > Burden oF Arthritis And musculoskeletAl conditions PAGE 11
limitations of self-reported information
Determining the prevalence of arthritis and musculoskeletal conditions through self-reports is subject to several limitations (Box 2.1). First, the set of questions used to enumerate these conditions (both in the NHS and the SDAC) is not based on any clinical diagnosis or objective criteria. The survey may pick up cases of self-diagnosis but, on the other hand, may miss out on real cases. Second, as the NHS sample does not include the institutionalised population, it is likely to underestimate disease prevalence. Third, the self-reporting of illness is complex and dynamic, and often a function of the respondent’s knowledge and attitudes. These, in turn, may be influenced by the availability of health services and health information made available through public education and awareness programs (ABS 2003).
Box 2.1: Sources of error in time series information based on self reports
• More public awareness of arthritis and osteoporosis• Increased acceptability of various conditions • Ignoring of mild or moderate conditions• Improved, early diagnosis
• Lack of standard definitional criteria • Scope of the field of conditions• Variation in survey or study designs
These difficulties are acutely reflected in the NHS time series. The self-reported prevalence of arthritis and musculoskeletal conditions declined from 26% in 1989–90 to 23% in 1995, and then increased to 32% in 2001. Although the ageing of the population may have contributed to some of the increase overall, the fluctuations over time are more likely to be due to differences in the survey methodology. The nature and type of questions used to generate the data impose severe limitations on the quality of the information and reliability of the estimates obtained.
international comparisons
Large-population based surveys indicate that the prevalence of arthritis and musculoskeletal conditions in Australia or in similarly aged populations internationally is high. The self-reported prevalence of arthritis or chronic joint symptoms was 30% in the United States at the turn of the century (CDC 2002). The estimates were much lower in Canada (16%; Wang et al. 2000) and in the United Kingdom (14%; Access Economics 2001).
The interpretation of these rates is problematic as the definition of various conditions and the methods of data collection vary considerably. For example:
• The ABS health surveys refer to the entire chapter of diseases of the musculoskeletal system and connective tissues. The reporting is not necessarily based on doctor diagnosis.
• The US study, on the other hand, limits itself to arthritis and chronic joint symptoms (CJS). Respondents were classified as having CJS if they answered ‘yes’ to two questions:
– ‘In the past months have you had pain, aching, stiffness, or swelling in or around a joint?’, and
– ‘Were these symptoms present on most days for at least a month?’
• In the Canadian study, arthritis was defined as a long-term health condition of ‘arthritis or rheumatism’, as diagnosed by a health professional.
Pain
Pain, acute or chronic, is the key symptom in most forms of arthritis and musculoskeletal conditions. Acute pain lasts a few seconds or longer but wanes as healing occurs. On the other hand, chronic pain, such as that seen in people with osteoarthritis and rheumatoid arthritis ranges from mild to severe, and can last weeks, months, years or a lifetime.
The pain of arthritis and musculoskeletal conditions may originate from different sources. These include inflammation of the synovial membrane (tissue that lines the joints), the tendons, or the ligaments; muscle strain; and fatigue. A combination of these factors may contribute to the intensity of the pain.
The pain also varies greatly from joint to joint, depending on the swelling within the joint, the amount of heat or redness present, or damage that has occurred within the joint. In addition, activities affect pain differently so that some people note pain in their joints after first getting out of bed in the morning, whereas others develop pain after prolonged use of the joint (Box 2.2).

PAGE 12 Arthritis And musculoskeletAl conditions in AustrAliA 2005
The measurement of pain is highly subjective and is usually investigated by asking about the incidence of chronic/recurrent pain. In the SDAC, pain was asked about by screening the question as: ‘Whether has chronic or recurrent pain or discomfort, limiting activities’. About 7% of the 2003 SDAC sample reported chronic/recurrent pain. In comparison, around 12% reported having arthritis and related disorders; however, of these, only one-third reported chronic/recurrent pain as caused by their condition. This is because the questions required the respondents to report ‘main conditions’. People with ‘pain’ or ‘discomfort’ associated with multiple conditions can report only one main condition. These people may or may not have a long-term disability relating to restrictions in activities from the pain of arthritis or past osteoporotic fractures.
Box 2.2: Pain in arthritis and musculoskeletal conditions
Source• Inflammation of synovial membrane, tendons
or ligaments• Muscle strain• Fatigue• Abnormal contact between surfaces• Combination of the above
Variation• From joint to joint• Amount of swelling• Amount of heat or redness• Damage within the joint
Timing• Morning stiffness• After extensive use
The SDAC also enumerates the number of people having disability specifically linked to their condition. It could be their ‘main disabling condition’ or an ‘associated condition’. The SDAC estimates indicate that around 14% of people with disability reported arthritis and related disorders as their main disabling condition. Around half (56%) of these people reported chronic or recurrent pain, caused by arthritis and related disorders.
The reporting of chronic or recurrent pain by persons with disability associated with arthritis and related disorders was closely associated with age (Figure 2.3). About 13% of males and 11% of females reported that chronic pain was an extreme interference with their work (during the last four weeks). The proportion was highest in the 85 and over age group—39% for males and 22% for females (ABS 2004a).
Notes
1. See Appendix E, Table E2.3 for detailed information.
2. Per cent of persons with disability.
Source: AIHW analysis of ABS 2003 Survey of Disability, Ageing and Carers CURF.
Figure 2.3: Chronic or recurrent pain reported in disability associated with arthritis and related disorders, 2003
Per cent
0
10
20
30
40
50
60
70
80
0–34 35–44 45–54 55–64 65–74 75+
Age group (years)
MalesFemales
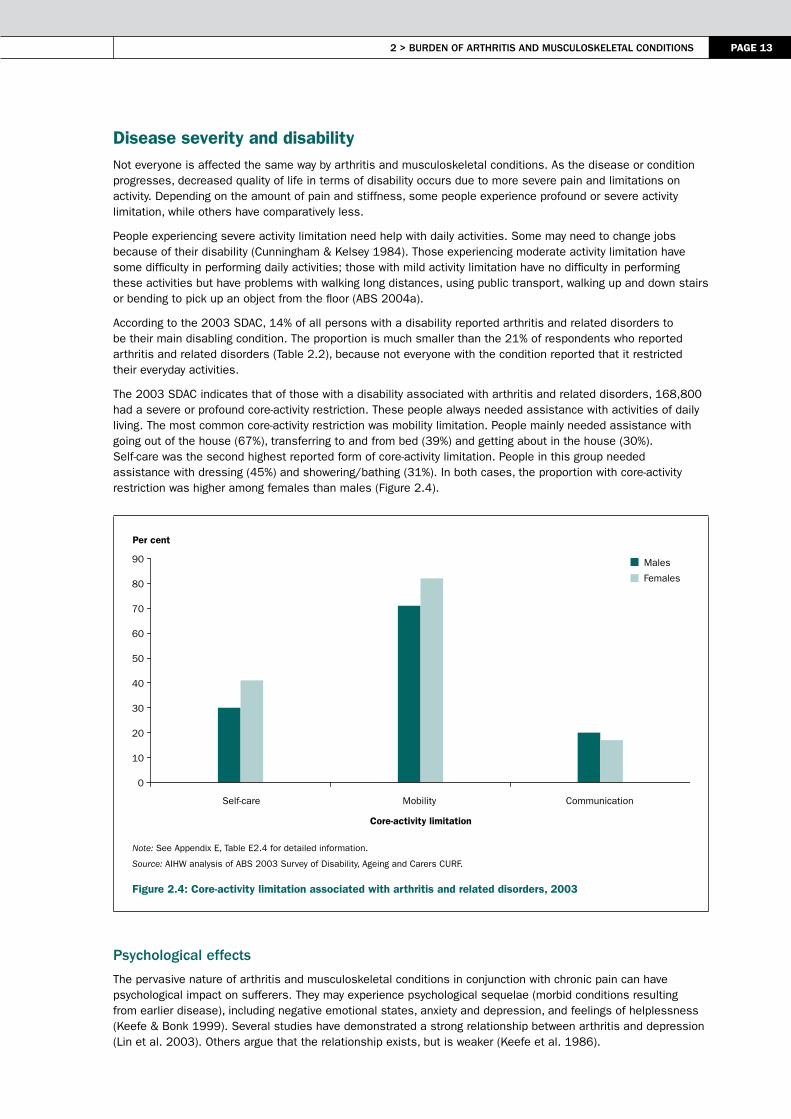
2 > Burden oF Arthritis And musculoskeletAl conditions PAGE 13
Disease severity and disabilityNot everyone is affected the same way by arthritis and musculoskeletal conditions. As the disease or condition progresses, decreased quality of life in terms of disability occurs due to more severe pain and limitations on activity. Depending on the amount of pain and stiffness, some people experience profound or severe activity limitation, while others have comparatively less.
People experiencing severe activity limitation need help with daily activities. Some may need to change jobs because of their disability (Cunningham & Kelsey 1984). Those experiencing moderate activity limitation have some difficulty in performing daily activities; those with mild activity limitation have no difficulty in performing these activities but have problems with walking long distances, using public transport, walking up and down stairs or bending to pick up an object from the floor (ABS 2004a).
According to the 2003 SDAC, 14% of all persons with a disability reported arthritis and related disorders to be their main disabling condition. The proportion is much smaller than the 21% of respondents who reported arthritis and related disorders (Table 2.2), because not everyone with the condition reported that it restricted their everyday activities.
The 2003 SDAC indicates that of those with a disability associated with arthritis and related disorders, 168,800 had a severe or profound core-activity restriction. These people always needed assistance with activities of daily living. The most common core-activity restriction was mobility limitation. People mainly needed assistance with going out of the house (67%), transferring to and from bed (39%) and getting about in the house (30%). Self-care was the second highest reported form of core-activity limitation. People in this group needed assistance with dressing (45%) and showering/bathing (31%). In both cases, the proportion with core-activity restriction was higher among females than males (Figure 2.4).
Note: See Appendix E, Table E2.4 for detailed information.
Source: AIHW analysis of ABS 2003 Survey of Disability, Ageing and Carers CURF.
Figure 2.4: Core-activity limitation associated with arthritis and related disorders, 2003
Psychological effects
The pervasive nature of arthritis and musculoskeletal conditions in conjunction with chronic pain can have psychological impact on sufferers. They may experience psychological sequelae (morbid conditions resulting from earlier disease), including negative emotional states, anxiety and depression, and feelings of helplessness (Keefe & Bonk 1999). Several studies have demonstrated a strong relationship between arthritis and depression (Lin et al. 2003). Others argue that the relationship exists, but is weaker (Keefe et al. 1986).
Per cent
0
10
20
30
40
50
60
70
80
90
Self-care Mobility Communication
Core-activity limitation
Males
Females

PAGE 14 Arthritis And musculoskeletAl conditions in AustrAliA 2005
According to the 2001 NHS, 6% of respondents with arthritis aged 25 and over reported a very high level of psychological distress as measured by the Kessler Psychological Distress Scale–10 (K10). K10 is a measure of non-specific psychological distress. A very high level of psychological distress, as shown by the K10, may indicate a need for professional help. Proportionately more females than males reported a high or a very high level of psychological distress in association with arthritis or other musculoskeletal condition (Table 2.3).
Table 2.3: Psychological distress associated with arthritis and musculoskeletal conditions, ages 25 and over, 2001
Population
Low (10–15)
Moderate (16–21)
High (22–29)
Very high (30–50) Total
’000 % ’000 % ’000 % ’000 % ’000 %
Males 651 63.6 204 19.9 113 11.1 55 5.4 1,023 100.0
Females 854 56.4 376 24.9 186 12.3 97 6.4 1,513 100.0
Total 1,504 59.3 580 22.9 299 11.8 152 6.0 2,535 100.0
Source: AIHW analysis of ABS 2001 National Health Survey CURF.
A very high level of psychological distress was most frequently recorded among persons aged 25–44 years in association with arthritis or other musculoskeletal condition (8.6%) (Figure 2.5). Females recorded higher rates than males across all ages except in the 45–64 years age group, whereas a high level of psychological distress was equally reported by both sexes in that age group.
Note: See Appendix E, Table E2.5 for detailed information.
Source: AIHW analysis of ABS 2001 National Health Survey CURF.
Figure 2.5: Very high level of psychological distress reported by people with arthritis or musculoskeletal conditions, 2001
0
2
4
6
8
10
12
25–44 45–64 65–74 75+
Age group (years)
Per cent
Males
Females

2 > Burden oF Arthritis And musculoskeletAl conditions PAGE 15
co-morbidities
People with arthritis and musculoskeletal conditions are often predisposed to many other diseases and conditions such as heart and vascular diseases, Type 2 diabetes, respiratory and infectious diseases, gastrointestinal disorders and non-Hodgkin’s lymphoma (Scott & Hochberg 1998). Some of these associations are no more than that expected from the concurrence of age-dependent problems. In others, the co-morbidities are more likely to occur together because of similar underlying disease processes or the presence of common risk factors (e.g. the tendency to autoimmunity or excess weight).
Some insight into co-morbidities of arthritis and musculoskeletal conditions can be obtained from the NHS data. In 2001, a number of long-term conditions were reported by people with arthritis and musculoskeletal conditions. Of these, hypertensive disease, deafness (total/partial) and asthma were the most commonly reported conditions (Table 2.4).
Table 2.4: Long-term conditions reported by people with arthritis and musculoskeletal conditions, 2001
Long-term condition
Number of people reporting the condition
People with arthritis reporting the condition
Proportion of people with arthritis
Number ’000 Number ’000 Per cent
Hypertensive disease 1,909 742 28.8
Total/partial deafness 2,013 664 25.8
Asthma 2,197 340 13.2
Diseases of genito-urinary system 587 212 8.2
Diabetes mellitus 554 203 7.9
Heart disease (ischaemic heart disease and other diseases)
138 188 7.3
Depression 103 25 1.0
Total 2,576 2,576 100.0
Source: AIHW analysis of the ABS 2001 National Health Survey CURF.
Health care/service useTreatment for arthritis and musculoskeletal conditions is mostly aimed at controlling pain and improving functioning and health-related quality of life. The treatment and care options for these diseases and conditions cover a wide variety of settings and phases of care. These include primary care by general practitioners; use of allied health services such as physiotherapists, chiropractors and podiatrists; and in hospitals.
GP visits
General practitioners (GPs) are probably the first and most common source of care for people with arthritis and musculoskeletal conditions. Depending on the nature of the problem, GPs manage these problems in a variety of ways: they prescribe/recommend medications, order imaging or pathology tests, and co-ordinate referrals.
In 2003–04, arthritis and musculoskeletal conditions were the problem most frequently managed by GPs (17 per 100 encounters), after respiratory conditions. They accounted for 12% of problems managed by GPs that year. Back complaint was the most common musculoskeletal condition managed, followed by osteoarthritis.
A variety of strategies has been reported by GPs for the management of arthritis and musculoskeletal conditions (Table 2.5). The most common form of management was medication prescribed/ advised/ supplied, followed by imaging and referrals. Cox-2 inhibitors (NSAIDs) were the most common medication prescribed or advised (32%), followed by paracetamol (25%).
Nearly all imaging ordered for arthritis involved diagnostic radiology, to identify mainly radiological changes of the knee, hip and hands. Densitometry tests were ordered for osteoporosis. Other clinical treatment included advice, education or counselling (23%), mostly in respect to exercise and weight management.
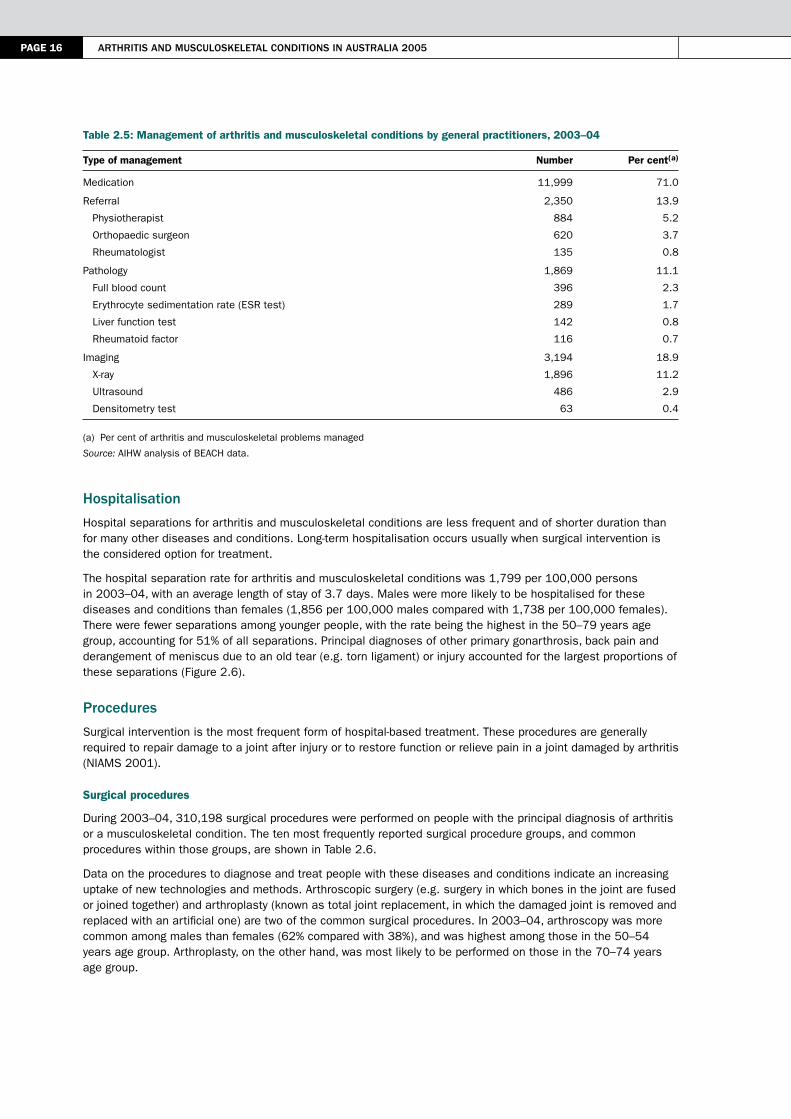
PAGE 16 Arthritis And musculoskeletAl conditions in AustrAliA 2005
Table 2.5: Management of arthritis and musculoskeletal conditions by general practitioners, 2003–04
Type of management Number Per cent(a)
Medication 11,999 71.0
Referral
Physiotherapist
Orthopaedic surgeon
Rheumatologist
2,350
884
620
135
13.9
5.2
3.7
0.8
Pathology
Full blood count
Erythrocyte sedimentation rate (ESR test)
Liver function test
Rheumatoid factor
1,869
396
289
142
116
11.1
2.3
1.7
0.8
0.7
Imaging
X-ray
Ultrasound
Densitometry test
3,194
1,896
486
63
18.9
11.2
2.9
0.4
(a) Per cent of arthritis and musculoskeletal problems managed
Source: AIHW analysis of BEACH data.
hospitalisation
Hospital separations for arthritis and musculoskeletal conditions are less frequent and of shorter duration than for many other diseases and conditions. Long-term hospitalisation occurs usually when surgical intervention is the considered option for treatment.
The hospital separation rate for arthritis and musculoskeletal conditions was 1,799 per 100,000 persons in 2003–04, with an average length of stay of 3.7 days. Males were more likely to be hospitalised for these diseases and conditions than females (1,856 per 100,000 males compared with 1,738 per 100,000 females). There were fewer separations among younger people, with the rate being the highest in the 50–79 years age group, accounting for 51% of all separations. Principal diagnoses of other primary gonarthrosis, back pain and derangement of meniscus due to an old tear (e.g. torn ligament) or injury accounted for the largest proportions of these separations (Figure 2.6).
Procedures
Surgical intervention is the most frequent form of hospital-based treatment. These procedures are generally required to repair damage to a joint after injury or to restore function or relieve pain in a joint damaged by arthritis (NIAMS 2001).
Surgical procedures
During 2003–04, 310,198 surgical procedures were performed on people with the principal diagnosis of arthritis or a musculoskeletal condition. The ten most frequently reported surgical procedure groups, and common procedures within those groups, are shown in Table 2.6.
Data on the procedures to diagnose and treat people with these diseases and conditions indicate an increasing uptake of new technologies and methods. Arthroscopic surgery (e.g. surgery in which bones in the joint are fused or joined together) and arthroplasty (known as total joint replacement, in which the damaged joint is removed and replaced with an artificial one) are two of the common surgical procedures. In 2003–04, arthroscopy was more common among males than females (62% compared with 38%), and was highest among those in the 50–54 years age group. Arthroplasty, on the other hand, was most likely to be performed on those in the 70–74 years age group.

2 > Burden oF Arthritis And musculoskeletAl conditions PAGE 17
Note: See Appendix E, Table E2.6 for detailed information.
Source: AIHW National Hospital Morbidity Database.
Figure 2.6: Hospital separations for arthritis and musculoskeletal conditions, 2003–04
Table 2.6: Top ten surgical procedures performed on people with arthritis and musculoskeletal conditions, 2003–04
Procedure block Main procedure performed Number Per cent(a)
Arthroscopic meniscectomy of knee with repair Arthroscopic meniscectomy of knee with debridement, osteoplasty or chondroplasty
33,075 10.7
Arthroplasty of knee Total arthroplasty of knee, unilateral 20,699 6.7
Arthroplasty of hip Total arthroplasty of hip, unilateral 18,249 5.9
Arthroscopic excision of knee Arthroscopic menisectomy of knee 14,449 4.7
Reconstruction procedures on shoulder Arthroscopic reconstruction of shoulder 6,981 2.3
Incision procedures on muscle, tendon or fascia of hand
Subcutaneous fasciotomy for Dupuytren’s contracture
6,825 2.2
Other excision on shoulder Excision of coraco-acromial ligament 6,811 2.2
Other incision procedures on knee Arthroscopy of knee 6,210 2.0
Other repair procedures on knee or leg Arthroscopic chondroplasty of knee 5,147 1.7
Other repair procedure on shoulder Repair of rotator cuff with decompression of subacromial space
5,014 1.6
Other procedures 186,738 60.2
Total 310,198 100.0
(a) Per cent of total procedures performed
Source: AIHW National Hospital Morbidity Database.
The use of arthroplasty has increased over the last several years (Figure 2.7). The subsequent increase and later sustained level of use of arthroplasty reflects the trend that these procedures are now the mainstay of surgical treatment for severe arthritis (Felson et al. 2000). They result in a dramatic improvement in pain and function in the short term, and continued good function for at least 10 years (Harris & Sledge 1990).
0 5,000 10,000 15,000 20,000 25,000 30,000 35,000
Other primary gonarthrosis
Low back pain
Derangement of meniscus due to old tearor injury (medical collateral ligament)
Rotator cuff syndrome
Rotator cuff syndrome
Derangement of meniscus due to old tearor injury (posterior cruciate ligament)
Lumbar and other intervertebral discdisorders with radiculopathy
Gonarthrosis, unspecified
Chronic instability of knee(anterior cruciate ligament)
Spinal stenosis
Separations (’000)

PAGE 18 Arthritis And musculoskeletAl conditions in AustrAliA 2005
Note: See Appendix E, Table E2.7 for detailed information.
Source: AIHW National Hospital Morbidity Database.
Figure 2.7: Trends in arthroscopy and arthroplasty, 1997–98 to 2003–04
Non-surgical procedures
In 2003–04, 732,700 non-surgical procedures were listed in hospital separations with the principal diagnosis of arthritis or a musculoskeletal condition. These procedures, mainly non-invasive in nature, included cognitive, therapeutic or diagnostic interventions.
Visits to other/allied health professionals
In addition to hospital care, people with arthritis and musculoskeletal conditions also seek help and support from many community-based services provided by private domiciliary nursing services and allied health professionals (e.g. physiotherapists, chemists, chiropractors and podiatrists).
According to the 2001 NHS, about 23% of people with arthritis and musculoskeletal conditions had consulted an allied or other health professional within the previous two weeks of the survey. The professionals most frequently consulted were chemists (by 5% of the population), physiotherapists/ hydrotherapists, and chiropractors (4%).
Persons aged 65 and over are more likely to have visited at least one allied or other health professional than people in younger age groups. The most frequently consulted health professionals by these people were chemists (10%), chiropractors (3%) and physiotherapists/ hydrotherapists (2%). For those aged 45–64, the most frequently consulted allied or other health professionals were chemists (6%), physiotherapists/ hydrotherapists (5%) and chiropractors (3%).
MortalityDeath is not commonly caused by arthritis and musculoskeletal conditions. Most arthritis and musculoskeletal conditions cripple but do not kill (Calkins 1993). Nearly five deaths per 100,000 persons were recorded in 2003 in Australia due to these conditions.
Premature mortality may be recorded for people with arthritis, resulting from perforated stomach ulcers, mainly induced by non-steroidal anti-inflammatory drugs (NSAIDs) (Graumlich 2001). Osteoporosis-related mortality is high in older people following certain types of fractures. Details of mortality associated with major types of fractures, particularly hip fractures, are given in Chapter 5.
Arthroplasty
Arthorscopy
Number per 100,000 population
0
50
100
150
200
250
300
1997–98 1998–99 1999–00 2000–01 2001–02 2002–03 2003–04
Year
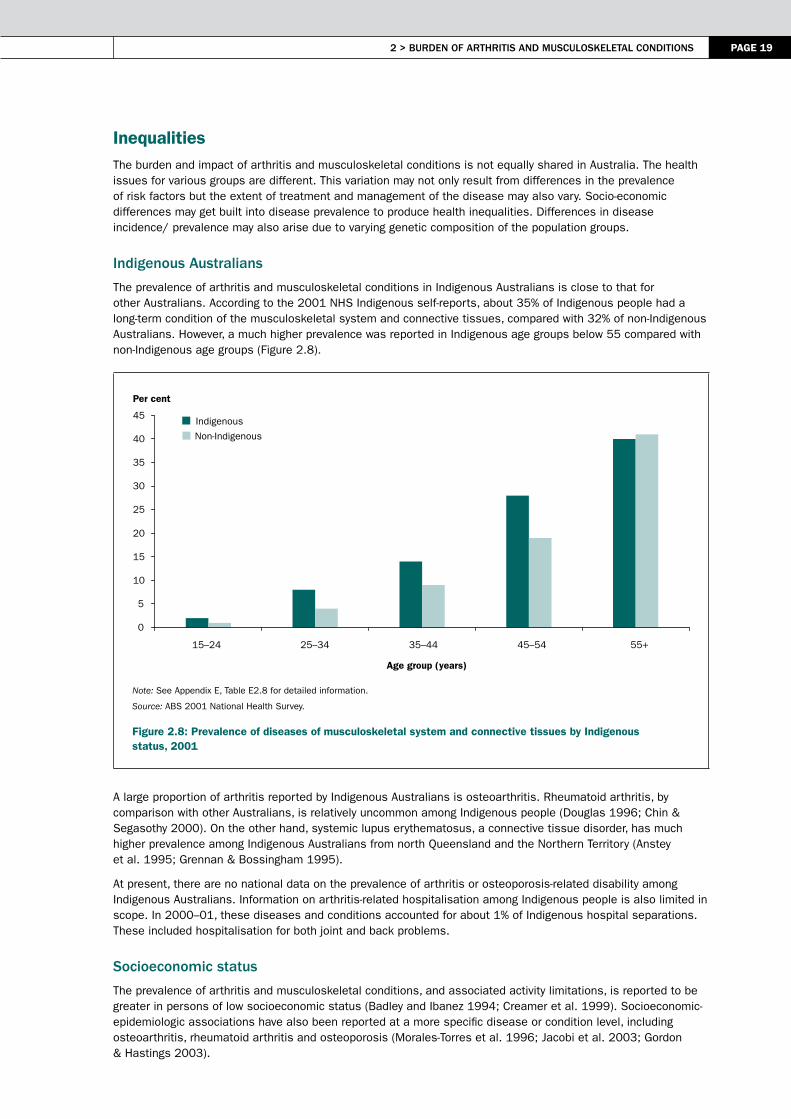
2 > Burden oF Arthritis And musculoskeletAl conditions PAGE 19
InequalitiesThe burden and impact of arthritis and musculoskeletal conditions is not equally shared in Australia. The health issues for various groups are different. This variation may not only result from differences in the prevalence of risk factors but the extent of treatment and management of the disease may also vary. Socio-economic differences may get built into disease prevalence to produce health inequalities. Differences in disease incidence/ prevalence may also arise due to varying genetic composition of the population groups.
indigenous Australians
The prevalence of arthritis and musculoskeletal conditions in Indigenous Australians is close to that for other Australians. According to the 2001 NHS Indigenous self-reports, about 35% of Indigenous people had a long-term condition of the musculoskeletal system and connective tissues, compared with 32% of non-Indigenous Australians. However, a much higher prevalence was reported in Indigenous age groups below 55 compared with non-Indigenous age groups (Figure 2.8).
Note: See Appendix E, Table E2.8 for detailed information.
Source: ABS 2001 National Health Survey.
Figure 2.8: Prevalence of diseases of musculoskeletal system and connective tissues by Indigenous status, 2001
A large proportion of arthritis reported by Indigenous Australians is osteoarthritis. Rheumatoid arthritis, by comparison with other Australians, is relatively uncommon among Indigenous people (Douglas 1996; Chin & Segasothy 2000). On the other hand, systemic lupus erythematosus, a connective tissue disorder, has much higher prevalence among Indigenous Australians from north Queensland and the Northern Territory (Anstey et al. 1995; Grennan & Bossingham 1995).
At present, there are no national data on the prevalence of arthritis or osteoporosis-related disability among Indigenous Australians. Information on arthritis-related hospitalisation among Indigenous people is also limited in scope. In 2000–01, these diseases and conditions accounted for about 1% of Indigenous hospital separations. These included hospitalisation for both joint and back problems.
socioeconomic status
The prevalence of arthritis and musculoskeletal conditions, and associated activity limitations, is reported to be greater in persons of low socioeconomic status (Badley and Ibanez 1994; Creamer et al. 1999). Socioeconomic-epidemiologic associations have also been reported at a more specific disease or condition level, including osteoarthritis, rheumatoid arthritis and osteoporosis (Morales-Torres et al. 1996; Jacobi et al. 2003; Gordon & Hastings 2003).
Indigenous
Non-Indigenous
0
5
10
15
20
25
30
35
40
45
15–24 25–34 35–44 45–54 55+
Age group (years)
Per cent

PAGE 20 Arthritis And musculoskeletAl conditions in AustrAliA 2005
A study in South Australia has confirmed socio-economic disparity in arthritis prevalence (Hill et al. 1999) but however, no such association has been reported at a national level. The 2001 National Health Survey disease prevalence data can be organised, however, by the Index of Relative Socioeconomic Disadvantage (SEIFA) to draw relationships between socioeconomic status and the presence of arthritis and musculoskeletal conditions.
The SEIFA summarises a number of socioeconomic attributes by location. These attributes include low income, low educational attainment, high unemployment, and jobs in relatively unskilled occupations. The index refers to the area (the census collector’s district) in which a person lives; it does not describe the socioeconomic situation of a particular individual. SEIFA scores are categorised from quintile 1 (low index scores) to quintile 5 (high index scores), with quintile 1 referring to the most disadvantaged group and quintile 5 to the least disadvantaged group.
No noteworthy relationship exists between socioeconomic status and arthritis and musculoskeletal conditions as a whole among Australians aged 35 and over (Figure 2.9). However, at a more specific disease level, some association is discernible. The prevalence of rheumatoid arthritis declines with increasing SEIFA quintile. A similar picture emerges for self-reports of osteoporosis. However, osteoarthritis shows no regular pattern in its distribution by SEIFA.
Note: See Appendix E, Table E2.9 for detailed information.
Source: ABS 2001 National Health Survey.
Figure 2.9: Prevalence of arthritis and musculoskeletal conditions by socioeconomic status, ages 35 and over, 2001
The age-standardised rate ratios between the bottom and top SEIFA quintiles further confirm this variation in association between the socioeconomic status and the presence of arthritis and musculoskeletal conditions. While no difference was noted in prevalence between the top and bottom SEIFA quintiles for all musculoskeletal conditions pooled, the ratio was greater than 1.3 at a specific disease level.
Several different explanations have been offered for some of these associations. The disability associated with arthritis reduces the opportunities for employment and higher education, which, in turn, may contribute to less effective management (Morales-Torres et al. 1996). Lower socioeconomic status has also been linked with inactivity (Clark 1996) and obesity (WHO Scientific Group 2003), both established risk factors for certain types of arthritis.
1st quintile 2nd quintile 3rd quintile 4th quintile 5th quintile
0
20
40
60
80
100
Osteoarthritis Rheumatoid arthritis Osteoporosis All musculoskeletal All people
Per cent

2 > Burden oF Arthritis And musculoskeletAl conditions PAGE 21
There are conflicting reports regarding the association of various epidemiological features of rheumatoid arthritis with socioeconomic status. The disease is more prevalent in lower socioeconomic groups (Jacobi et al. 2003; Gordon & Hastings 2003). The socioeconomic status has also been linked with progression of the disease (Symmons 2003; Bankhead et al. 1996). The South Australian study has shown that the prevalence of rheumatoid arthritis is lowest among those with university education and highest among those leaving school before 15 years of age (Hill et al. 1999). The association between type of occupation and the risk of developing rheumatoid arthritis, however, has not been confirmed.
country of birth
International comparisons suggest variation in the prevalence of arthritis and musculoskeletal conditions by country of birth (Ota 1979; Inoue et al. 2000; Wang et al. 2000). This variation may result from differing genetic and socio-demographic backgrounds. Some of this variation is also likely to be reflected within the Australian population, owing to its diverse racial and ethnic composition. On the other hand, common environmental factors may have blurred the known differences.
Not much difference is noted in the prevalence of arthritis and musculoskeletal conditions as a whole in Australia by country of birth (Table 2.7). The disease prevalence broadly reflects the composition of the Australian population. However, some differences are noted at a more specific disease level. Lower prevalence of rheumatoid arthritis is noted among persons born in Asia and Africa. No significant differences however exist for osteoarthritis and osteoporosis.
Table 2.7: Prevalence of arthritis or musculoskeletal condition by country of birth, ages 35 and over, 2001
Country of birth
OsteoarthritisRheumatoid
arthritis OsteoporosisAll
musculoskeletal(a) All people
Number ’000
Per cent
Number ’000
Per cent
Number ’000 Per cent
Number ’000
Per cent
Number ’000
Per cent
Australia 970.6 72.3 290.2 73.4 222.4 74.8 3,296.1 70.6 6,535.5 68.1
New Zealand 20.5 1.5 5.3 1.3 2.8 0.9 79.2 1.7 199.9 2.1
Other Oceania 2.9 0.2 0.0 0.0 0.0 0.0 17.7 0.4 56.3 0.6
UK and Ireland 142.8 10.6 37.1 9.4 28.3 9.5 423.9 9.1 922.9 9.6
Other North/ West Europe
41.8 3.1 8.2 2.1 7.2 2.4 123.0 2.6 248.4 2.6
Southern and Eastern Europe
104.4 7.8 40.9 10.3 18.9 6.4 415.3 8.9 750.5 7.8
North Africa 7.4 0.6 2.3 0.6 1.8 0.6 20.5 0.4 44.9 0.5
Middle East 7.6 0.6 0.8 0.2 1.3 0.4 38.5 0.8 94.0 1.0
Other Africa 6.5 0.5 0.6 0.2 1.6 0.5 26.0 0.6 87.9 0.9
South East Asia 15.5 1.2 2.0 0.5 4.7 1.6 102.5 2.2 277.7 2.9
Other Asia 9.0 0.7 5.4 1.4 4.7 1.6 35.0 0.7 113.3 1.2
Americas 9.0 0.7 1.3 0.3 1.9 0.6 43.6 0.9 102.9 1.1
Other 4.9 0.4 1.3 0.3 1.8 0.6 49.7 1.1 162.1 1.7
Total 1,342.9 100.0 395.4 100.0 297.4 100.0 4,671.0 100.0 9,596.3 100.0
(a) Includes all arthritis and musculoskeletal conditions.
Note: The classification of country of birth in based on the Standard Australian Classifications of Countries (ABS 2004b).
Source: AIHW analysis of 2001 National Health Survey CURF.

PAGE 22 Arthritis And musculoskeletAl conditions in AustrAliA 2005
ReferencesABS (Australian Bureau of Statistics) 2002. 2001 National Health Survey: summary of results. ABS Cat. No. 4364.0. Canberra: ABS.
ABS 2003. Occasional paper: long-term health conditions—a guide to time series comparability from the National Health Survey, Australia. ABS Cat. No. 4816.0. Canberra: ABS.
ABS 2004a. Disability Australia. ABS Cat. No. 4446.0. Canberra: ABS.
ABS 2004b. Standard Australian Classification of Countries (SACC). ABS Cat. No. 1269.0. Canberra: ABS.
Access Economics 2001. The prevalence, cost and disease burden of arthritis in Australia. Canberra: Access Economics.
AIHW (Australian Institute of Health & Welfare) 2004. Disability and its relationship to health conditions and other factors. AIHW Cat. No. DIS 37. Canberra: AIHW.
Anstey NM, Bastian I, Dunckley H et al. 1995. Systemic lupus erythematosus (SLE): different prevalences in different populations of Australian Aborigines. Australia and New Zealand Journal of Medicine 25:736–7.
Badley E & Ibanez D 1994. Socioeconomic risk factors and musculoskeletal disability. Journal of Rheumatology 21:515-22
Bankhead C, Silman A & Barrett B 1996. Incidence of rheumatoid arthritis is not related to indicators of socioeconomic deprivation. Journal of Rheumatology 23(12):2039-42
Calkins E 1993. The geriatric group. In: Maddison PJ, Isenberg DA, Woo P et al. (eds). Oxford Textbook of Rheumatology. Oxford: Oxford Medical Publications.
CDC (Centres for Disease Control and Prevention) 2002. Prevalence of self-reported arthritis or chronic joint symptoms among adults—United States, 2001. Morbidity & Mortality Weekly Report 55(42):948–50.
Chin G & Segasothy M 2000. Gouty arthritis in Australian Aborigines. Australia and New Zealand Journal of Medicine 30:639–40.
Clark D 1996. Age, socio-economic status, and exercise self-efficacy. Gerontologist 36(2):157-64
Creamer P, Lethbridge-Cejku M & Hochberg M 1999. Determinants of pain severity in knee osteoarthritis: effect of demographic and psychosocial variable using 3 pain measures. Journal of Rheumatology 26(8):1785-92
Cunningham LS & Kelsey JL 1984. Epidemiology of musculoskeletal impairments and associated disability. American Journal of Public Health 74:574–9.
Douglas WA 1996. Does rheumatoid arthritis exist in the Indigenous Australian Aboriginal population? Medical Journal of Australia 164(5):191–2.
Felson DT, Lawrence RC, Hochberg MC et al. 2000. Osteoarthritis: new insights. Annals of Internal Medicine 133(9):726–37.
Gordon DA & Hastings DE 2003. Clinical features of rheumatoid arthritis. In: Rheumatology, 3rd ed. Hochberg MC, Silman AJ & Smolen JS et al. (eds). Mosby: London.
Graumlich JF 2001. Preventing gastrointestinal complications of NSAIDs. Risk factors, recent advances, and latest strategies. Postgraduate Medicine 109(5):117–20; 123–8.
Grennan DM & Bossingham D 1995. Systemic lupus erythematosus (SLE): different prevalences in different populations of Australian Aboriginals. Australia and New Zealand Journal of Medicine 25:182–3.
Harris W & Sledge C 1990. Total hip and knee replacement. New England Journal of Medicine 323:725–31.
Hill C, Parsons J, Taylor A et al. 1999. Health related quality of life in a population sample with arthritis. Journal of Rheumatology 26(9):2029-35.
Inoue K, Wicar P, Kawasaki T et al. Prevalence of hip osteoarthritis and acetabular dysplasia in French and Japanese adults. Rheumatology 39:745–48.
Jacobi C, Mol G, Boshuizen H et al. 2003. Impact of socio-economic status on the course of rheumatoid arthritis and on related use of health care services. Arthritis and Rheumatism 49(4):567-73.

2 > Burden oF Arthritis And musculoskeletAl conditions PAGE 23
Keefe F & Bonk V 1999. Psychological assessment of pain in patients having rheumatic diseases. Rheumatic Disease Clinics of North America 25:81–103.
Keefe FJ, Wilkins RH, Cook WA et al. 1986. Depression, pain, and pain behaviour. Journal of Consulting and Clinical Psychology 54(5):665–9.
Lin EHB, Katon W, Von Korf M et al. 2003. Effect of improving depression care on pain and functional outcomes among older adults with arthritis: a randomized controlled trial. Journal of the American Medical Association 290(18):2428–9.
March LM, Brnabic AL, Skinner JC et al. 1998. Musculoskeletal disability among elderly people in the community. Medical Journal of Australia 168(9):439–42.
McCann S & Evans DS 2002. Informal care: the views of people receiving care. Health and Social Care in the Community 10(4):221–8.
Morales-Torres J, Reginster JY & Hochberg HC 1996. Rheumatic and musculoskeletal diseases and impaired quality of life: a challenge for rheumatologists. Journal of Rheumatology 23(1):1–3. NIAMS (National Institute of Arthritis and Musculoskeletal and Skin Diseases) 2001. Arthritis pain. Available from Internet: URL: <http://www.niams.nih.gov/hi/topics/arthritis/arthpain/htm> (cited February 2001).
Ota H 1979. Prevalence of osteoarthritis of the hip and other joints in Japanese population. Journal of Japan Orthopaedic Association 53:153–80.
Scott JC & Hochberg MC 1998. Arthritis and other musculoskeletal diseases. In: Brownson RC, Remington PL & Davis JR (eds). Chronic disease epidemiology and control, 2nd ed. Washington, DC: American Public Health Association, 468–70.
Wang PP, Elsbett-Koeppen R, Geng GY et al. 2000. Arthritis prevalence and place of birth: findings from the 1994 Canadian National Population Health Survey. American Journal of Epidemiology 152(5):442–5.
WHO Scientific Group (World Health Organization Scientific Group) 2003. The burden of musculoskeletal conditions at the start of the new millennium: report of a WHO scientific group. WHO Technical Report Series 919. World Health Organization: Geneva.


3 > osteoArthritis PAGE 25
3 > Osteoarthritis
KEy POINTS
• Osteoarthritis is the most common type of arthritis in Australia. Almost 1.4 million Australians are estimated to have this long-term condition.
• The disease affects the weight-bearing joints of hips, knees and ankles more often. The hands and spine area are also affected.
• More common among females than males, osteoarthritis rises in prevalence with age and increasing body weight.
• Effective treatment can control the pain and improve functioning and health-related quality of life of people with osteoarthritis.
• Osteoarthritis is the biggest reason for knee and hip replacement in Australia.
Osteoarthritis has been chosen for focused attention under the National Health Priority Areas (NHPA) Initiative for arthritis and musculoskeletal conditions due to its high impact on both the individual and society (NAMSCAG 2004). The disease, which mainly affects the weight-bearing joints of hips, knees and ankles, affects a large proportion of the population. Disability (in particular, mobility restriction), associated with osteoarthritis is high. It is possible to reduce this disability and pain with appropriate management.
This chapter describes the health impact of osteoarthritis in terms of:
• prevalence and incidence
• pain and disability, and
• use of health care services.
The nature of the problem and risk factors for the disease are also reviewed.
Nature of the problemThe process responsible for osteoarthritis begins in the cartilage and bone adjacent to the joint. Healthy cartilage allows bones to glide over one another; it also absorbs the shock of physical movement. If the cartilage begins to break down and wear away, normal biomechanics of the joint are disrupted. The bones around the cartilage start to rub together, causing pain, swelling and loss of motion (Felson et al. 2000).
The main symptoms of osteoarthritis are pain, stiffness and limitation of movement of the affected joint. There are no systemic symptoms or consequences, and most people with the condition are generally in good health. The symptoms vary from person to person. Inflammation of the joint occurs in several cases. Some people find the condition incapacitating while others live through it.
Osteoarthritis is usually a progressive disease, one that gets worse with time, often leading to functional impairment. Pain is initially felt in the joints during and after activity, but as the disease progresses it may occur with minimal movement or even during rest. Over time, the joint tends to lose its normal shape and become enlarged.
Risk factors and causal mechanismsThe causation of osteoarthritis bridges biomechanics (wear and tear) and biochemistry. A variety of risk factors and causal mechanisms contribute to the development and progression of the disease. In addition to predisposing factors such as age, sex and genetics, biomechanical factors such as obesity, body misalignment, meniscus tears and injury contribute to the underlying process, as do certain biochemical and immunological mechanisms. Major risk factors for osteoarthritis are listed in Box 3.1.

PAGE 26 Arthritis And musculoskeletAl conditions in AustrAliA 2005
Box 3.1: Major risk factors for osteoarthritis
Predisposing factors• Genetic• Sex• Age
Sources: March 1997; Scott & Hochberg 1998.
Biomechanical factors• Obesity• Misalignment• Joint trauma and injury• Repetitive occupational joint use• Physical inactivity
Ageing
Osteoarthritis may begin at any age, but usually affects older people. The average age of onset is about 45 years. Radiological and autopsy surveys show a steady rise in osteoarthritic changes in joints from age 30 onwards. By age 65, around 80% of the population have some radiographic evidence of osteoarthritis even though only one-quarter report any pain or disability (Nuki 1998).The possible age-related mechanisms are likely to be diminished capacity for cartilage repair, hormonal changes and the cumulative effects of environmental exposures (Peterson & Jacobssen 2002).
sex
Females are at a higher risk of developing osteoarthritis than males, particularly after menopause. They are affected more frequently, more severely, and at more sites. The effects of sex hormones on cartilage may vary with menopausal status and stage of osteoarthritis. Many epidemiological studies suggest that hormone-replacement therapy (HRT) confers a protective effect against the development of knee and hip osteoarthritis (Nevitt & Felson 1996).
Genetics
Genetic factors account for up to 65% of variation in the osteoarthritis of hands and hips, and for a smaller percentage of osteoarthritis of the knees (Spector et al. 1996). Children of parents with early-onset osteoarthritis, or osteoarthritis involving more than one joint, are at increased risk of developing the condition (Loughlin 2002).
excess weight
Osteoarthritis is associated with being overweight or obese, particularly among females. Both cross-sectional and prospective studies have found the link between osteoarthritis of weight-bearing joints and obesity (Felson & Zhang 1998; Cooper et al. 2000). The Framingham Study, for example, predicted knee osteoarthritis among obese people as early as three decades in advance of its onset (Felson et al. 1988). Excess body weight is also a predictor of hip osteoarthritis (Lievense et al. 2002).
Both local and systemic effects may, however, be relevant to a causal relationship between excess weight and osteoarthritis. Being overweight increases the load across a joint, thus increasing the stress on the cartilage that may, in turn, lead to osteoarthritis of weight-bearing joints. A force of nearly three to six times one’s body weight is exerted across the knee while walking (Felson 1996). However, this mechanism does not explain the association between being overweight and hand osteoarthritis. Systemic factors, such as a cartilage growth factor may also accelerate cartilage breakdown in various joints (Felson 1996).
Cross-sectional data from the 2001 National Health Survey (NHS) show some association between self-reported weight and osteoarthritis in females (Table 3.1). A similar relationship is noted in terms of body mass index (BMI), which adjusts weight for a person’s height. No such association is noted among males, however.

3 > osteoArthritis PAGE 27
Table 3.1: Excess weight and osteoarthritis, ages 35 and over, 2001
Sex/ measure Reported osteoarthritis Total population
Number per 1,000 population(a)
Males
Self-reported weight
55–64 kg 65–74 kg 75–129 kg
67156731
63201675
Body Mass Index
Normal Overweight Obese
222446307
281449252
Females
Self-reported weight
55–64 kg 65–74 kg 75–129 kg
251257309
275231246
Body Mass Index
Normal Overweight Obese
340264349
363287288
(a) Rate per 1,000 population in that specific weight/ BMI category.
Source: AIHW analysis of ABS 2001 National Health Survey CURF.
Based on the 2001 NHS data, the rate ratios for osteoarthritis in Australian females for overweight and obesity were estimated to be 1.1 and 1.3, in comparison with the total Australian female population (Figure 3.1).
Note: See Appendix E, Table E3.1 for detailed information.
Source: AIHW analysis of ABS 2001 National Health Survey CURF.
Figure 3.1: Rate ratios for excess weight among females with osteoarthritis, rheumatoid arthritis and osteoporosis, 2001
0.7
0.8
0.9
1.0
1.1
1.2
1.3
1.4
Normal Overweight Obese
Body mass index
Rate ratio
Osteoarthritis
Rheumatoid arthritis
Osteoporosis

PAGE 28 Arthritis And musculoskeletAl conditions in AustrAliA 2005
history of joint trauma or injury
Individuals with a history of joint trauma are more likely to develop knee and hip osteoarthritis (Wilder et al. 2002; Gelber et al. 2000). This includes joint trauma resulting from dislocation, contusion, fracture, tears of the menisci or ligaments, and surgical meniscectomy (Englund et al. 2003; Felson et al. 2000).
repetitive use of joints
The repetitive use of joints is considered to be a risk factor for hip and knee osteoarthritis. Jobs involving kneeling, squatting, and climbing stairs are associated with higher rates of knee osteoarthritis, while jobs that require heavy lifting, including farming, are associated with higher rates of hip osteoarthritis (Schouten et al. 2002; Lau et al. 2000).
other factors
Participation in sport has been associated with an increased risk of lower-limb osteoarthritis. Moderate recreational weight-bearing physical activity, however, does not appear to be a risk factor for knee osteoarthritis.
Osteoarthritis is also more likely to develop in people with a prior inflammatory joint disease such as gout or rheumatoid arthritis (McDuffie et al. 1987).
Prevalence and incidenceThe proportion of people in the general population who experience osteoarthritis is a useful measure of its impact. For an intermittent episodic problem such as osteoarthritis, prevalence needs to be measured across a defined period of time. Regular national data, based on self-reports, are now available about its prevalence through the National Health Surveys conducted by the Australian Bureau of Statistics. However, no national data based on case definition by physical examination or radiological evidence are available.
The incidence of osteoarthritis can be modelled using the prevalence data and other epidemiological parameters (AIHW: Mathers & Penm 1999). There are no direct sources for this information.
self-reported prevalence
In the 2001 NHS, about 75 out of 1,000 Australians reported osteoarthritis. This equates to around 1.4 million people. This estimate is based on the NHS question: whether the survey respondent ‘currently has osteoarthritis’. The NHS survey assumes all reported cases of osteoarthritis to be long term (i.e. conditions that have lasted at least six months, or that are likely to last six months or more). The prevalence of osteoarthritis increases with age: relatively few people at younger ages report having it. By age 55, however, the prevalence rises sharply (ABS 2002).
Osteoarthritis is reported more frequently by females than males (92 compared with 57 per 1,000 persons in 2001). The difference persists across all ages. In 2001, the prevalence was 331 per 1,000, among females aged 65–74, rising to 374 per 1,000 among those aged 75 and over. Comparable rates among males that year were 186 and 236 per 1,000, respectively (Figure 3.2).
Several studies have reported a crossover in osteoarthritis prevalence between the two sexes around the age of 45. Males are affected more commonly below age 45, whereas above age 45 females are affected not only more frequently but also more severely (Kelsey & Hochberg 1988). No such crossover was noted in the NHS self-reports.
Other regional/jurisdictional sources confirm the high prevalence of osteoarthritis in Australia.
• In an omnibus survey of the South Australian population, Hill et al. (1999) estimated the prevalence of osteoarthritis among those aged 15 and above to be around 86 per 1,000 persons (51 per 1,000 males and 111 per 1,000 females). The prevalence increased with age, rising above 261 per 1,000 among those aged 70 and above.
• A study in North Sydney estimated the prevalence of osteoarthritis to be around 79 per 1,000 persons (March et al. 1998).
• Symptomatic osteoarthritis was also reported by more than one-quarter of persons aged 60 and above in the Dubbo Osteoporosis Study (Jones et al. 1995).
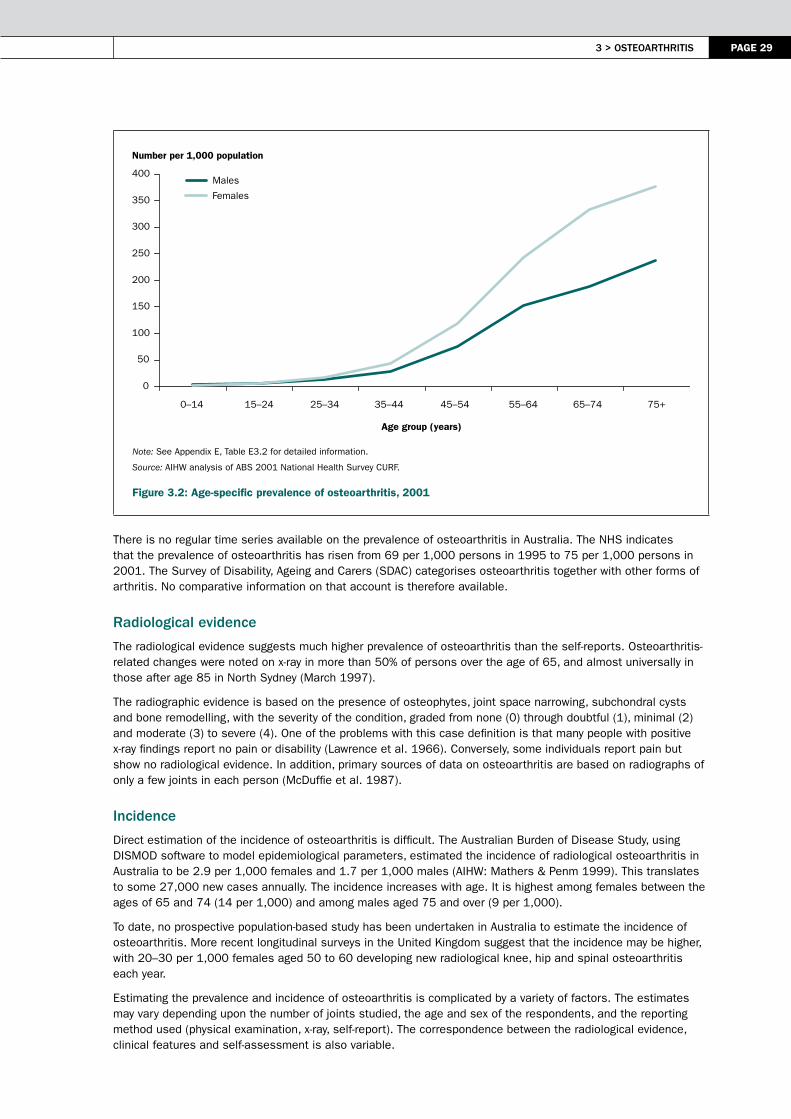
3 > osteoArthritis PAGE 29
Note: See Appendix E, Table E3.2 for detailed information.
Source: AIHW analysis of ABS 2001 National Health Survey CURF.
Figure 3.2: Age-specific prevalence of osteoarthritis, 2001
There is no regular time series available on the prevalence of osteoarthritis in Australia. The NHS indicates that the prevalence of osteoarthritis has risen from 69 per 1,000 persons in 1995 to 75 per 1,000 persons in 2001. The Survey of Disability, Ageing and Carers (SDAC) categorises osteoarthritis together with other forms of arthritis. No comparative information on that account is therefore available.
radiological evidence
The radiological evidence suggests much higher prevalence of osteoarthritis than the self-reports. Osteoarthritis-related changes were noted on x-ray in more than 50% of persons over the age of 65, and almost universally in those after age 85 in North Sydney (March 1997).
The radiographic evidence is based on the presence of osteophytes, joint space narrowing, subchondral cysts and bone remodelling, with the severity of the condition, graded from none (0) through doubtful (1), minimal (2) and moderate (3) to severe (4). One of the problems with this case definition is that many people with positive x-ray findings report no pain or disability (Lawrence et al. 1966). Conversely, some individuals report pain but show no radiological evidence. In addition, primary sources of data on osteoarthritis are based on radiographs of only a few joints in each person (McDuffie et al. 1987).
incidence
Direct estimation of the incidence of osteoarthritis is difficult. The Australian Burden of Disease Study, using DISMOD software to model epidemiological parameters, estimated the incidence of radiological osteoarthritis in Australia to be 2.9 per 1,000 females and 1.7 per 1,000 males (AIHW: Mathers & Penm 1999). This translates to some 27,000 new cases annually. The incidence increases with age. It is highest among females between the ages of 65 and 74 (14 per 1,000) and among males aged 75 and over (9 per 1,000).
To date, no prospective population-based study has been undertaken in Australia to estimate the incidence of osteoarthritis. More recent longitudinal surveys in the United Kingdom suggest that the incidence may be higher, with 20–30 per 1,000 females aged 50 to 60 developing new radiological knee, hip and spinal osteoarthritis each year.
Estimating the prevalence and incidence of osteoarthritis is complicated by a variety of factors. The estimates may vary depending upon the number of joints studied, the age and sex of the respondents, and the reporting method used (physical examination, x-ray, self-report). The correspondence between the radiological evidence, clinical features and self-assessment is also variable.
Number per 1,000 population
0
50
100
150
200
250
300
350
400
0–14 15–24 25–34 35–44 45–54 55–64 65–74 75+
Age group (years)
Males
Females

PAGE 30 Arthritis And musculoskeletAl conditions in AustrAliA 2005
Disease severity and disabilityActivity limitation and other disability are unwelcome consequences of osteoarthritis. As the disease progresses, the pain becomes more severe and incapacitating. The correlation between radiographic evidence and pain severity also increases. Severe pain and functional limitations impact strongly upon the wellbeing of the individual.
limitations in activities of daily living
According to the 2003 SDAC, 14% of people with a disability report arthritis and related disorders as their main disabling condition (see Chapter 2). Reported were restriction in activities of daily living such as bathing, toileting, dressing, eating and mobility. The SDAC does not, however, provide specific information on restriction in activities of daily living in relation to osteoarthritis.
A literature search reveals the considerable impact of osteoarthritis on functional ability, particularly in the elderly. It has been reported to be the most common self-reported cause of restriction in activities of daily living (Ettinger et al. 1994). People with osteoarthritis are also reported to have significantly lower quality of life scores in physical function and role limitations (Hill et al. 1999). A particular nexus exists between knee and hip osteoarthritis and dependence on others in performing daily activities (Sharma et al. 2003; Steultjens et al. 2000; Guccione et al. 1994). Females are more likely to report limitations, the use of assistance as well as a greater degree of disability, particularly for daily living activities (Murtagh & Hubert 2004).
Psychological effects
The bodily pain associated with osteoarthritis also has psychological impacts: people with pain from osteoarthritis have significantly lower quality of life (Hill et al. 1999). They also suffer from various psychosocial problems such as anxiety, depression and a sense of helplessness (Keefe et al. 2002; Creamer et al. 1999).
Limited national information linking osteoarthritis with various psychological effects has become available. Data on the distribution of psychological problems among those reporting osteoarthritis in the 2001 NHS are presented in Figure 3.3.
Notes
1. See Appendix E, Table E3.3 for detailed information.
2. Reported in the last four weeks.
Source: AIHW analysis of ABS 2001 National Health Survey CURF.
Figure 3.3: Feelings of hopelessness and depression associated with osteoarthritis, 2001
0 10 20 30 40 50 60 70 80 90
All of the time/most of the time
Some of the time
A little of the time
None of the time
Per cent
Depressed
Hopeless
3 > osteoArthritis PAGE 31
Prevention and managementLimited primary prevention measures have been identified for osteoarthritis. On the basis of current knowledge, avoiding joint trauma, preventing obesity and modifying occupation-related joint stress through ergonomic approaches are all be recommended for the prevention of osteoarthritis (Scott & Hochberg 1998).
There are not many management options available to reduce the disease burden for people with osteoarthritis either. As there is no cure (Felson 2000), osteoarthritis management is primarily concerned with controlling the pain and improving the functioning and quality of life. Some of the management guidelines for osteoarthritis are outlined in Box 3.2.
Box 3.2: Management of osteoarthritis
• Education• Occupational assessment
– aids– appliances– joint protection
• Physical therapy– aquatherapy– aerobic exercise– heat– strengthening– ultrasound stimulation– transcutaneous electrical nerve stimulation (TENS)
• Weight loss
Source: DeAngelo & Gordin 2004.
• Pharmaceuticals– Paracetamol (increase up to 4 g/d)– Non-steroidal anti-inflammatory drugs (NSAIDs)– Cyclooxygenase-2 (COX-2) selective inhibitors)
• Other therapies– Topical creams– Glucosamine chondroitin– Tramadol hydrochloride– Opioid therapy
• Interarticular injections– corticosteroids– hyaluronic acid replacement
• Surgical intervention
The current management strategies produce a range of outcomes. Educating people with osteoarthritis can help them to understand the disease process, its prognosis and the rationale for and implications of managing their condition, for example by making lifestyle changes and increasing physical activity.
Evidence-based research concurs with existing expert guidelines that exercise is a safe and effective intervention for osteoarthritis. Benefits include strengthening muscle and improving joint stability—shown by Roddy et al. (2005) to improve function and reduce pain in people with hip and knee osteoarthritis—better self-esteem, weigh reduction and improved general health. In addition, the number of contraindications are relatively few.
Topical treatment (e.g. methylsalicylate or capsaicin cream) is appropriate as an adjunct to simple analgesia, or for people who cannot tolerate systemic therapy. Quantitative systemic review of topically applied non-steroidal anti-inflammatory drugs (NSAIDs) have shown these agents to be effective in patients with osteoarthritis (DeAngelo & Gordin 2004).
The treatment and care of people with osteoarthritis covers a wide variety of settings and phases of care. These include primary care by general practitioners and other allied health services such as physiotherapists, chiropractors and podiatrists. In advanced cases that do not respond to treatment, surgical treatments have been reported to be a cost-effective intervention (Brooks 2001).
General practice visits
The management of osteoarthritis generally begins with the general practitioner (GP). In 2003–04, osteoarthritis was the seventh most frequently managed problem by GPs (1.9% of all problems managed). One thousand GPs (a random sample) from across Australia reported treating 2,748 persons with osteoarthritis. A variety of management strategies was used (Figure 3.4). The most common was medication prescribed, advised or supplied (90%). Some of the commonly prescribed/recommended medications by GPs are listed in Table 3.2.
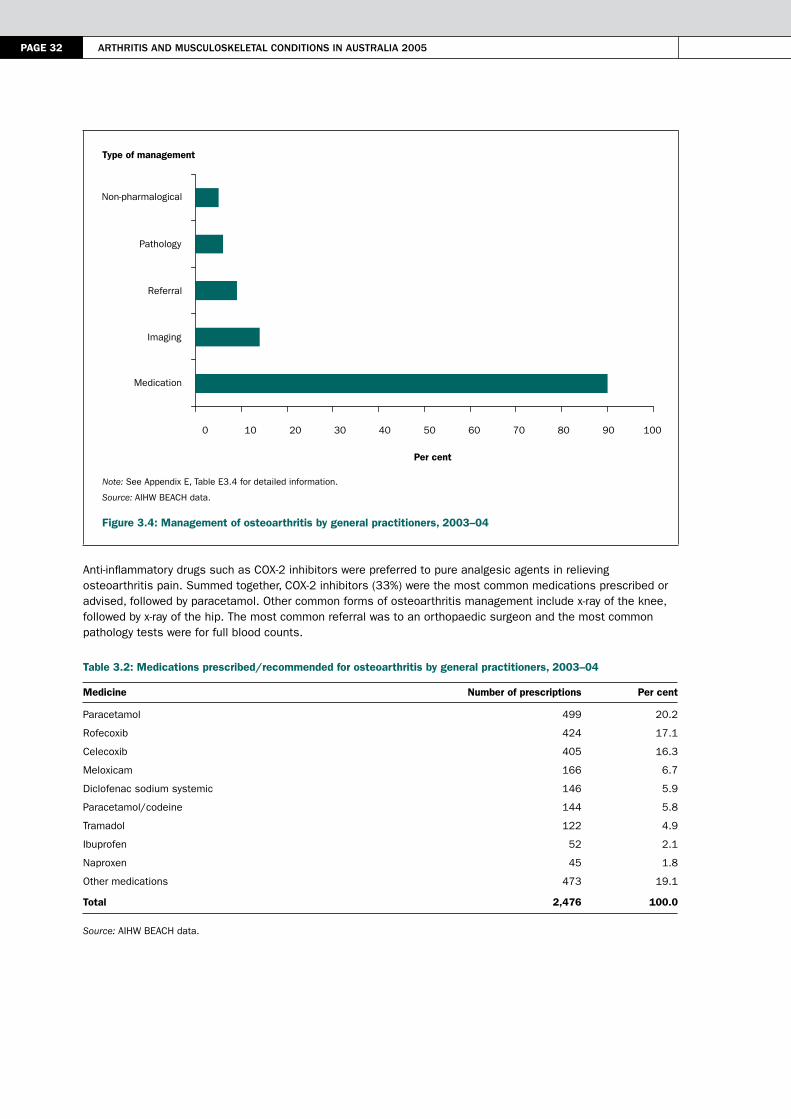
PAGE 32 Arthritis And musculoskeletAl conditions in AustrAliA 2005
Note: See Appendix E, Table E3.4 for detailed information.
Source: AIHW BEACH data.
Figure 3.4: Management of osteoarthritis by general practitioners, 2003–04
Anti-inflammatory drugs such as COX-2 inhibitors were preferred to pure analgesic agents in relieving osteoarthritis pain. Summed together, COX-2 inhibitors (33%) were the most common medications prescribed or advised, followed by paracetamol. Other common forms of osteoarthritis management include x-ray of the knee, followed by x-ray of the hip. The most common referral was to an orthopaedic surgeon and the most common pathology tests were for full blood counts.
Table 3.2: Medications prescribed/recommended for osteoarthritis by general practitioners, 2003–04
Medicine Number of prescriptions Per cent
Paracetamol 499 20.2
Rofecoxib 424 17.1
Celecoxib 405 16.3
Meloxicam 166 6.7
Diclofenac sodium systemic 146 5.9
Paracetamol/codeine 144 5.8
Tramadol 122 4.9
Ibuprofen 52 2.1
Naproxen 45 1.8
Other medications 473 19.1
Total 2,476 100.0
Source: AIHW BEACH data.
Type of management
0 10 20 30 40 50 60 70 80 90 100
Medication
Imaging
Referral
Pathology
Non-pharmalogical
Per cent

3 > osteoArthritis PAGE 33
hospitalisation
A significant proportion of people with osteoarthritis are hospitalised for surgical procedures. The most common surgical procedures for osteoarthritis are described in Box 3.3.
Box 3.3: Common surgical procedures for osteoarthritis
• osteotomy: performed in people with early osteoarthritis and may relieve symptoms and slow the rate of progression.• Arthroscopy: arthroscopic debridement and lavage can successfully alleviate symptoms, particularly in the case of
degenerative meniscal tears in the presence of mechanical symptoms. However, when there is substantial joint-space narrowing, arthroscopic surgery has limited benefit.
• Arthrodesis: or joint fusion, successfully alleviates pain and is commonly performed in the spine and in small points of the carpus, hand and foot.
• Arthroplasty: total joint arthroplasty represents the most significant advancement in the treatment of osteoarthritis. It is the mainstay of surgical treatment of the osteoarthritic hip, knee and glenohumeral joint; the pain and disability of end-stage osteoarthritis can be eliminated, restoring patients to near normal function.
In 2003–04, a total of 77,484 surgical procedures were performed on persons with the principal diagnosis of osteoarthritis. The average length of hospital stay was 7.2 days. Of the ten most frequent surgical procedures reported for osteoarthritis, total joint arthroplasty was the most common form of intervention, followed by arthroscopic procedures (Table 3.3). Arthroplasty of the knee was common among females, mainly in the 75–79 years age group. Arthroplasty of the hip, on the other hand was more common among 70–74 year old males. The number of arthroplasty procedures has increased over the seven years since 1997–98 (Figure 3.5), showing similar increases for both knee and hip arthroplasty.
Table 3.3: Top ten surgical procedures performed on people with osteoarthritis, 2003–04
Procedure block Main procedure performed Number of
separations Per cent(a)
Arthroplasty of knee Total arthroplasty of knee, unilateral 19,933 25.7
Arthroplasty of hip Total arthroplasty of hip, unilateral 16,913 21.8
Arthroscopic meniscectomy of knee with repair Arthroscopic meniscectomy of knee with debridement, osteoplasty or chondroplasty
7,329 9.5
Arthroplasty of knee Hemiarthroplasty of knee 3,210 4.1
Other incision procedures on knee Arthroscopy of knee 2,129 2.7
Other repair procedures on knee or leg Arthroscopic chondroplasty of knee 1,920 2.5
Arthroscopic excision of knee Arthroscopic debridement of knee 1,755 2.3
Arthroscopic excision of knee Arthroscopic meniscectomy of knee 1,384 1.8
Removal of loose body of knee with repair Arthroscopic removal of loose body of Knee with debridement, osteoplasty or chondroplasty
1,059 1.4
Arthroplasty of knee Total arthroplasty of knee, bilateral 809 1.0
Other procedures 21,043 27.2
Total 77,484 100.0
(a) Per cent of total procedures performed.
Source: AIHW National Hospital Morbidity Database.

PAGE 34 Arthritis And musculoskeletAl conditions in AustrAliA 2005
Note: See Appendix E, Table E3.5 for detailed information.
Source: AIHW National Hospital Morbidity Database.
Figure 3.5: Trends in knee and hip arthroplasty, 1997–98 to 2003–04
non-surgical procedures
In 2003–04, a total of 732,700 non-surgical procedures were listed for people with the principal diagnosis of arthritis or a musculoskeletal condition. These procedures, mainly non-invasive in nature, included cognitive, therapeutic or diagnostic interventions. Of these 732,700 non-surgical procedures, 208,916 were listed for people with the principal diagnosis of osteoarthritis.
Visits to other/allied health professionals
Allied health services are an integral component of osteoarthritis management. According to the 2001 NHS, 23% of people with osteoarthritis had consulted an allied or other health professional within the previous two weeks of the survey. The allied or other health professionals most frequently consulted were chemists (5%), physiotherapists/ hydrotherapists (4%) and chiropodists/podiatrists and chiropractors (3%).
ReferencesABS (Australian Bureau of Statistics) 2002. National Health Survey: summary of results, 2001. ABS Cat. No. 4364.0. Canberra: ABS.
AIHW (Australian Institute of Health and Welfare): Mathers C & Penm R 1999. Health system costs of injury, poisoning and musculoskeletal disorders in Australia 1993–94. AIHW Cat. No. HWE 6. Canberra: AIHW.
Brooks P 2001. Managing arthritis in the Bone and Joint Decade. Medical Journal of Australia 175:S91.
Cooper C, Snow S, McAlindon TE et al. 2000. Risk factors for the incidence and progression of radiographic knee osteoarthritis. Arthritis and Rheumatism 43(5):995–1000.
Creamer P, Lethbridge-Cejku M & Hochberg M 1999. Determinants of pain severity in knee osteoarthritis: effect of demographic and psychosocial variable using 3 pain measures. Journal of Rheumatology 26(8):1785–92.
DeAngelo NA & Gordin V 2004. Treatment of patients with arthritis-related pain. The Journal of the American Osteopathic Association 104(11):S2–S5.
Englund M, Roos EM & Lohmander LS 2003. Impact of type of meniscal tear on radiographic and symptomatic knee osteoarthritis: a sixteen-year follow up of meniscectomy with matched controls. Arthritis and Rheumatism 48(8):2178–87.
Knee
Hip
Number per 100,000 population
0
20
40
60
80
100
120
1997–98 1998–99 1999–00 2000–01 2001–02 2002–03 2003–04
Year
3 > osteoArthritis PAGE 35
Ettinger WH Jr, Fried LP, Harris T et al. 1994. Self-reported causes of physical disability in older people: the Cardiovascular Health Study. Journal of the American Geriatric Society 42:1035–44.
Felson DT 1996. Does excess weight cause osteoarthritis and, if so, why? Annals of Rheumatic Diseases 55:668–70.
Felson DT 2000. Osteoarthritis: new insights. Part 2: treatment approaches. Annals of Internal Medicine 133:726–37.
Felson DT, Anderson JJ, Naimark A et al. 1988. Obesity and knee osteoarthritis: the Framingham Study. Annals of Internal Medicine 109:18–24.
Felson DT, Lawrence RC, Dieppe PA et al. 2000. Osteoarthritis: new insights. Part 1: the disease and its risk factors. Annals of Internal Medicine 133(8):635–46.
Felson DT & Zhang Y 1998. An update on the epidemiology of knee and hip osteoarthritis with a view to prevention. Arthritis & Rheumatism 41:1343–55.
Gelber AC, Hochberg MC & Mead LA 2000. Joint injury in young adults and risk for subsequent knee and hip osteoarthritis. Annals of Internal Medicine 133:312–28.
Guccione AA, Felson DT, Anderson JJ et al. 1994. The effects of specific medical conditions on functional limitations of elders in the Framingham Study. American Journal of Public Health 84:351–8.
Hill CL, Parsons J, Taylor A et al. 1999. Health related quality of life in a population sample with arthritis. Journal of Rheumatology 26(9):2029–35.
Jones G, Nguyen T, Sambrook P et al. 1995. Osteoarthritis, bone density, postural stability, and osteoporotic fractures: a population-based study. Journal of Rheumatology 22(5):921–5.
Keefe F, Smith S, Buffington A et al. 2002. Recent advances and future directions in the biopsychosocial assessment and treatment of arthritis. Journal of Consulting and Clinical Psychology 70(3):640–55.
Kelsey JL & Hochberg MC 1988. Epidemiology of chronic musculoskeletal disorders. Annual Review of Public Health 9:379–401.
Lau EC, Cooper C, Lam D et al. 2000. Factors associated with osteoarthritis of the hip and knee in Hong Kong Chinese: obesity, joint injury and occupational activities. American Journal of Epidemiology 152:855–62.
Lawrence JS, Bremner JM & Bier F 1966. Osteoarthritis: prevalence in the population and relationship between symptoms and x-ray changes. Annals of Rheumatic Diseases 25:1–24.
Lievense AM, Bierma-Zeinstra SMA, Verhagen AP et al. 2002. Influence of obesity on the development of osteoarthritis of the hip: a systematic review. Rheumatology 41:1155–62.
Loughlin J 2002. Genome studies and linkage in primary osteoarthritis. Rheumatic Diseases Clinic of North America 28(1):95–109.
March LM, Brnabic AJM, Skinner JC et al. 1998. Musculoskeletal disability among elderly people in the community. Medical Journal of Australia 168:439–42.
McDuffie FC, Felts WR, Hochberg MC et al. 1987. Arthritis and musculoskeletal diseases. In: Amler RW & Dull HB (eds). Closing the gap: the burden of unnecessary illness. Oxford: Oxford University Press, 19–29.
Murtagh KN & Hubert MA 2004. Gender differences in physical disability among an elderly cohort. American Journal of Public Health 94(8):1406–11.
NAMSCAG (National Arthritis and Musculoskeletal Conditions Advisory Group) 2004. Evidence to support the National Action Plan for osteoarthritis, rheumatoid arthritis and osteoporosis: opportunities to improve health–related quality of life and reduce the burden of disease and disability. Canberra: DoHA at <http://www.nhpac.gov.au>.
Nevitt MC & Felson DT 1996. Sex hormones and the risk of osteoarthritis in women: epidemiological evidence. Annals of Rheumatic Diseases 55:673–6.
Nuki G 1998. Diseases of the connective tissues, joints and bones. In: Edwards CRW, Bouchier IAD, Haslett C et al. (eds). Davidson’s principles and practice of medicine. Edinburgh: Churchill Livingstone, 864–939.

PAGE 36 Arthritis And musculoskeletAl conditions in AustrAliA 2005
Peterson IF & Jacobssen LT 2002. Osteoarthritis of the peripheral joints: best practice and research. Clinical Rheumatology 16(5):741–60.
Roddy E, Zhang W, Doherty M et al. 2005. Evidence-based recommendations for the role of exercise in the management of osteoarthritis of the hip or knee—the MOVE consensus. Rheumatology 44(1):67–73.
Schouten JS, de Bie RA & Swaen G 2002. An update on the relationship between occupational factors and osteoarthritis of the hip and knee. Current Opinions in Rheumatology 14(2):89–92.
Scott J & Hochberg M 1998. Arthritis and other musculoskeletal diseases. In: Brownson R, Remington P & Davis J (eds). Chronic disease epidemiology and control. 2nd ed. Washington: American Public Health Association, 466–89.
Sharma L, Cahue S, Song J et al. 2003. Physical functioning over three years in knee osteoarthritis: role of psychosocial, local, mechanical and neuromuscular factors. Arthritis & Rheumatism 48(12):3359–70.
Spector TD, Cicuttini F, Baker J et al. 1996. Genetic influences on osteoarthritis in women: a twin study. British Medical Journal 312:940–3.
Steultjens MPM, Dekker J, Van Baar ME et al. 2000. Range of joint motion and disability in patients with osteoarthritis of the knee or hip. Rheumatology 39:955–61.
Wilder FV, Hall BJ, Barrett Jr JP et al. 2002. History of acute knee injury and osteoarthritis of the knee: a prospective epidemiological assessment. The Clearwater Osteoarthritis Study. Osteoarthritis and Cartilage 10(8):611–6.
4 > rheumAtoid Arthritis PAGE 37
4 > Rheumatoid arthritis
KEy POINTS
• Rheumatoid arthritis is a chronic, inflammatory disease that can cause significant morbidity, joint damage, early disability and premature mortality. It is the most common autoimmune disease in Australia.
• Almost 438,000 Australians are reported to have rheumatoid arthritis. These self-report based estimates are much higher than those reported from other parts of the world.
• Rheumatoid arthritis occurs more commonly among females than males; its prevalence increases with age, a feature common to many chronic diseases.
• Disability associated with rheumatoid arthritis starts early in life and can be highly insidious. Over time, it can seriously compromise the individual’s quality of life.
• Effective treatment can reduce the individual and societal costs of rheumatoid arthritis. Early diagnosis is central to the current treatment paradigm.
• Rheumatoid arthritis has low survival rates. It is not, however, a major underlying cause of death.
Rheumatoid arthritis is an autoimmune, systemic chronic disease that involves inflammation of multiple joints. More common among females than males, it is a major cause of morbidity and disability, resulting in substantial activity limitation and ongoing need for care and assistance. More often it affects the small and large joints in a symmetrical pattern; however, the disease also affects other organs of the body, including the heart, lungs and eyes.
More than 1% of the disease burden in Australia is accounted for by rheumatoid arthritis alone (AIHW: Mathers et al. 1999). Most of this burden is disability, although the disease also contributes to premature mortality (Pincus 1995). Recent advances have made rheumatoid arthritis more amenable to treatment (Goldbach-Mansky & Lipsky 2003). The disabling impact of rheumatoid arthritis on an individual can be reduced through early diagnosis and treatment.
In view of its high individual and societal costs (see Chapter 7 for health system costs) and the potential for these to be reduce by effective management, rheumatoid arthritis has been chosen for focused attention under the National Health Priority Areas Initiative for Arthritis and Musculoskeletal Conditions (NAMSCAG 2004).
This chapter describes the health impact of rheumatoid arthritis in terms of:
• incidence and prevalence
• disability
• health care service use, and
• mortality.
The nature of the problem and risk factors for the disease are also reviewed.
Nature of the problemRheumatoid arthritis is an autoimmune disease. In autoimmune diseases, the immune system fails to distinguish ‘self’ from ‘non-self’, targeting cells, tissues and various organs of the afflicted person’s body.
In rheumatoid arthritis, the immune system mainly targets the synovial membrane. The pathological changes in the membrane result in inflammation that causes pain, swelling and stiffness of the joints. The disease causes progressive and irreversible joint damage, ultimately leading to cartilage destruction and deformity. The lungs, blood vessels or eyes may also be targeted.

PAGE 38 Arthritis And musculoskeletAl conditions in AustrAliA 2005
The clinical manifestations and course of rheumatoid arthritis are extremely variable, characterised by exacerbations and remissions. The joint symptoms commonly include morning stiffness in and around the affected joints, pain on motion, local soft tissue swelling, warmth and redness. The joint involvement is often polyarticular, affecting three or more joints simultaneously. It also tends to be symmetrical.
Those with rheumatoid arthritis, or their children, are more likely to develop other autoimmune diseases, such as Type 1 diabetes and thyroid disease. Other diseases associated with rheumatoid arthritis include respiratory and infectious diseases, gastrointestinal disorders, and non-Hodgkin’s lymphoma (Scott & Hochberg 1998). It is also the most common cause of secondary amyloidosis, in which deposits of a waxy, starch-like protein (amyloid) can decrease the function of tissues, including those in the heart and brain (Wollheim 1993).
diagnosis
There is no one test for diagnosing rheumatoid arthritis. The diagnosis rests on a composite of clinical and laboratory observations. The American College of Rheumatology (ACR) has developed a set of criteria for diagnosing the disease (WHO Scientific Group 2003). At least four out of seven signs and symptoms, listed in Box 4.1, are required for a firm diagnosis.
Box 4.1: The 1987 revised ACR criteria for the classification of rheumatoid arthritis
No. Criterion Comment
1 Morning stiffness Duration > 1 hour; lasting > 6 weeks
2 Arthritis of at least 3 areas1 Soft tissue swelling or exudation lasting > 6 weeks
3 Arthritis of hand joints Wrist, metacarpophalangeal joints or proximal interphalangeal joints lasting > 6 weeks
4 Symmetrical arthritis At least one area, lasting > 6 weeks
5 Rheumatoid nodules As observed by a physician
6 Serum rheumatoid factor As assessed by a method positive in less than 5% of control subjects
7 Radiographic changes As seen on anteroposterior films of wrists and hands
Source: WHO Scientific Group 2003.
Rheumatoid arthritis can be difficult to diagnose in its early stages, as symptoms vary considerably. The full range of symptoms develops over time (Saraux et al. 2001). Besides, some of the initial symptoms of the disease overlap with other types of arthritis and joint conditions, and it may take some time for those conditions to be ruled out.
Prognosis
Rheumatoid arthritis is extremely heterogenous in its rate of progression. But permanent remission is rare once the joint damage has set in. Radiographic evidence of joint destruction is present in over 70% of cases within the first two years of presentation and it continuously progresses over time (Goldbach-Mansky & Lipsky 2003). Functional deterioration occurs in most persons within 15 years (Rasker & Cosh 1989).
With persistent inflammation, a variety of characteristic deformities develop. This happens particularly in the hands and wrist, and in the feet. Deformities of the feet include eversion (a turning outwards) of the heel, widening of the forefoot (hallux valgus, a swelling or deformity at the head of the first metatarsal of the big toe), and lateral deviation and dislocation of the toes (Nuki 1998).
Causal and risk factors The autoimmune nature of rheumatoid arthritis is best explained as the unleashing of genetic susceptibility by environmental agents. Both genetic and environmental factors are thus causal to its development. Defects in several biological intermediates, in particular those belonging to the immune system, are also implicated.
1 Possible areas: proximal interphalangeal joints, metacarpophalangeal joints, wrist, elbow, knee, ankle, metatarsopahalangeal joints.

4 > rheumAtoid Arthritis PAGE 39
Several risk factors are identified, based mostly on causal mechanisms. These include, in particular, family members with rheumatoid arthritis, immunogenetic susceptibility, female sex and environmental factors.
Genetic factors
Family studies indicate the high inheritability of rheumatoid arthritis. Severe rheumatoid arthritis is found at approximately four times the expected rate in first-degree relatives of persons with the disease. Approximately 10% of persons with rheumatoid arthritis have an affected first-degree relative (Silman & Hochberg 2001). The disease also exhibits a higher concordance rate in identical twins than in fraternal twins (MacGregor et al. 1995).
HLA associations
An immunogenetic perspective to rheumatoid arthritis is provided by its strong association with Class II HLA (human leucocyte antigens) alleles. These genes are located within the major histocompatibility complex (MHC), on the short arm of chromosome 6 in man. The MHC houses several immune response genes, one or more of which may mediate autoimmune response in rheumatoid arthritis.
Individuals with HLA DRB1 alleles *0101, *0401, *0404 and *0405 have a much greater relative risk of developing rheumatoid arthritis (Weyand & Gronzy 2000). More than 90% of people with rheumatoid arthritis have these alleles, compared with about 35% in the general population. The risk ratio for some of these alleles exceeds 6.0.
The role of HLA DRB1 in the pathology of rheumatoid arthritis is unclear. It has been proposed that certain epitopes of HLA DRB1 may affect the function of HLA DQ molecules, which actually mediate autoimmunity. Genes for HLA DQ are also located within the MHC complex, adjacent to the HLA DR genes (Taneja & David 2000).
Other genes
HLA DRB1 associations do not fully explain the genetics of rheumatoid arthritis. Associations with other genes, located outside the MHC, have also been reported.
Gender (hormonal factors)
Rheumatoid arthritis is more common among females than males. This may be due to the role of female sex hormones, particularly in the peri-menopausal period (Kuiper et al. 2001). Androgen deficiency and prolactin excess may also, at least in part, explain the higher incidence of rheumatoid arthritis in females (Brennan & Silman 1995). Pregnancy also influences the timing of the disease, with the postpartum period being a high risk time for developing first symptoms (Silman et al. 1992).
In addition to the above-mentioned genetic, environmental and biochemical factors, several societal factors such as socioeconomic status, education and psychosocial wellbeing may play important roles in the development of rheumatoid arthritis (Callahan & Pincus 1988; Symmons 2003).
environmental factors
The presence of high-risk genes is not sufficient to develop rheumatoid arthritis. A variety of environmental factors are considered to expose this susceptability. Something must occur to trigger the onset of the disease. It may be an infectious agent such as a virus or bacteria. But the disease is not transmissible from person to person by contact.
Rheumatoid arthritis is less common in underdeveloped countries and rural areas (Symmons 2002), although the differences between rural and non-rural areas are small.
Incidence and prevalence
incidence
Considering the difficulties involved in establishing early diagnosis, only a few studies have tried to estimate the incidence of rheumatoid arthritis. According to the WHO Scientific Group (2003), its global incidence ranges from 0.2 to 3 cases per 1,000 persons. Other studies also indicate highly variable incidence (0.1 to 1.2 per 1,000 persons), depending on sex, race/ethnicity and calendar year (Gabriel 2001). The incidence is reportedly higher in females than males (Silman & Hochberg 2001).

PAGE 40 Arthritis And musculoskeletAl conditions in AustrAliA 2005
The Australian Burden of Disease Study, using DISMOD software, has estimated the incidence of rheumatoid arthritis in Australia to be 0.3 per 1,000 females and 0.1 per 1,000 males (AIHW: Mathers et al. 1999).
The incidence of rheumatoid arthritis may be declining, particularly among females (Gabriel 2001; MacGregor & Silman 2003). One explanation is the use of oral contraceptives; both pregnancy and the contraceptive pill are believed to protect against the development of the disease (Spector 1990).
Prevalence
Determining the prevalence of rheumatoid arthritis is equally problematic. A commonly used method is self-reports. However, the information so generated is not usually backed by clinical or laboratory evidence. The ACR criteria notwithstanding, diagnoses based on clinical features, radiological evidence and serological tests are also quite variable.
Almost 24 out of 1,000 Australians are estimated to have rheumatoid arthritis long term (ABS 2002). This translates to approximately 438,000 persons with the disease. The disease was reported more commonly by females (27 per 1,000 compared with 20 per 1,000 males).
The prevalence of rheumatoid arthritis rises sharply with age, with the female prevalence rate being greater at nearly all ages (Figure 4.1). The steep rise in its prevalence after the age of 45, particularly for females, is noteworthy.
Note: See Appendix E, Table E4.1 for detailed information.
Source: AIHW analysis of ABS 2001 National Health Survey CURF.
Figure 4.1: Age-specific prevalence of rheumatoid arthritis, 2001
other studies
A 1995 sample survey of the South Australian population shows the prevalence of rheumatoid arthritis to be 32 per 1,000 males and 49 per 1,000 females among those aged 15 and over (Hill et al. 1999). These estimates are much higher than those reported commonly.
A characteristic feature of this study was the contrast in prevalence by country of birth. People of Asian origin reported virtually no rheumatoid arthritis compared with those born in Australia, United Kingdom, and other parts of Europe. This variation is in line with that noted from other studies worldwide (see the section on international comparisons on page 48).
Males
Females
Number per 100,000 population
0
10
20
30
40
50
60
70
80
90
0–14 15–24 25–34 35–44 45–54 55–64 65–74 75+
Age group (years)
4 > rheumAtoid Arthritis PAGE 41
Validity of self-reports
The validity of self-reported prevalence of rheumatoid arthritis has been questioned. Data obtained from clinical examination and diagnosis, as well as radiological evidence, suggest much lower prevalence than that obtained using self-reports.
Two validation studies from the United States and Norway were able to confirm the diagnosis in only 21% and 31% of the sub-sample, respectively (Star et al. 1996; Kvien et al. 1996). If those validations apply to the NHS sample, then the prevalence of rheumatoid arthritis in Australia is more likely to be between six and ten per 1,000 persons, in line with estimates obtained elsewhere through clinical diagnosis.
The prevalence of rheumatoid arthritis in United States is five per 1,000 males and ten per 1,000 females on the basis of clinical examination and diagnosis (Cunningham & Kelsey 1984). The radiological evidence, coupled with the presence of rheumatoid-factor, increases these estimates to seven per 1,000 males and sixteen per 1,000 females.
Using serology (rheumatoid factor) alone, the prevalence of rheumatoid arthritis in Michigan has been estimated to be three per 1,000 males and seven per 1,000 females (Mikkelsen et al. 1967).
time trends
The prevalence of rheumatoid arthritis in Australia reportedly declined between 1995 and 2001. The overall prevalence, based on National Health Surveys, declined from 28 per 1,000 to 24 per 1,000 between 1995 and 2001. (The 1989–90 NHS did not distinguish between various forms of arthritis.) Not much can be made of time trends in the prevalence of rheumatoid arthritis on the basis of just two data points.
international comparisons
Rheumatoid arthritis shows some geographical variation (WHO Scientific Group 2003). Its prevalence is higher in the northern hemisphere, but contrasts strongly in the European and Asian populations.
Studies in several European and North American populations have reported the occurrence of rheumatoid arthritis as being between 0.5 and 1% (Silman & Pearson 2002). Its prevalence in India is similar to that reported by European countries, but higher than that reported by China, Indonesia and the Philippines.
The much higher prevalence of rheumatoid arthritis in Australia (compared with reported occurrence in European countries and North American populations) reflects mostly the use of disparate estimation procedures. The Australian estimates are based on self-reports; the validity of these reports in ascertaining rheumatoid arthritis prevalence is doubtful.
Disability and psychosocial impactRheumatoid arthritis is a highly disabling condition, with a major psychosocial impact. The functional limitations arrive soon after the onset of the disease and worsen with the passage of time. Loss of independence is the most important aspect (Young et al. 2000). Another important outcome is work disability—the inability to continue working, to work in the same occupation or to work the same number of hours (Barrett et al. 2000).
Functional limitations
Recent evidence suggests that more than 50% of people with rheumatoid arthritis are unable to perform household chores, and that the majority (60%) receive unpaid help (Maetzel et al. 2004). The impact of disability appears to be greater in younger and middle aged people than in the elderly (Sokka et al. 2003).
Although much can be accomplished in the treatment of rheumatoid arthritis through a combination of non-steroidal anti-inflammatory (NSAIDs) and disease-modifying anti-rheumatic drugs (DMARDs), the overall impact of the disease on functional limitations tends to be progressive, that is, worsens with time.
Work disability
Using a large series of clinical, laboratory and self-report measures, Wolfe and Hawley (1998) have estimated work disability in people with rheumatoid arthritis as being 25% six years after the onset of the disease and as 50% twenty-one years after disease onset. The most disability occurs late in the course of the disease.

PAGE 42 Arthritis And musculoskeletAl conditions in AustrAliA 2005
Factors associated with work disability commonly are the nature of the job (the level of physical activity required and the degree of autonomy, particularly over the pace of work), the age at onset of the disease, marital status, level of formal education, duration of the disease and the level of disability.
National information on work disability in relation to rheumatoid arthritis is not available in Australia. The SDAC provides information on disability associated with arthritis and related disorders, but it does not distinguish between different forms of arthritis. Chapter 6 provides further information on work disability in relation to arthritis as a whole.
Psychosocial impact
Psychosocial changes are one of the significant adverse impacts of rheumatoid arthritis. The loss of positive body image is a serious problem for many. Meenan et al. (1981) found that 63% had experienced at least one major change in their life (marital status, employment) as a result of their disease. Of those surveyed, 83% of people between the ages of 21 and 65 had to make significant changes in their leisure activities.
Treatment and health service useRheumatoid arthritis is difficult to treat systematically. Although current treatments have been relatively successful in controlling the symptoms of chronic synovitis, true long-term remission in aggressive rheumatoid arthritis has not been achieved (WHO Scientific Group 2003). The complexities involved in treating the disease are outlined by Fries (2000).
The goal of treatment for rheumatoid arthritis is preventing or controlling joint damage, reducing functional loss, alleviating pain and maximising quality of life (ACR 2002). Since joint damage, loss of bone mass and disability occur quickly in the course of the disease, it is important to diagnose it early and treat it aggressively.
The disease is managed in a variety of settings, which include primary care by general practitioners (GPs); other allied health services such as physiotherapists, chiropractors and podiatrists; as well as treatment in hospital settings. A variety of procedures, including arthroplasty, is integral to the treatment and management of rheumatoid arthritis.
General practice visits
In 2003–04, rheumatoid arthritis accounted for 0.3% of all problems managed by GPs, as reported to the BEACH survey. One reason for this low consultation rate is that patients with rheumatoid arthritis are generally referred to rheumatology clinics after only a short duration of symptoms. Rheumatologists are more likely to make a timely and correct diagnosis of rheumatoid arthritis compared with GPs (Bellamy et al. 1988).
A variety of modalities is used by GPs to manage rheumatoid arthritis (Figure 4.2). The most common of these (in 92% of the cases) is medication—prescribed, advised or supplied.
Commonly prescribed medications for rheumatoid arthritis are disease-modifying anti-rheumatic drugs (DMARDs), non-steroidal anti-inflammatory drugs (NSAIDs) and low-dose corticosteroids. The medications prescribed by GPs for rheumatoid arthritis in 2003–04 are listed in Table 4.1.
The DMARD methotrexate—reported to be the best tolerated slow-acting anti-rheumatic in the medium term (Conaghan & Brooks 1996)—was the most commonly prescribed medication in 2003–04. Several other DMARDs were also prescribed. Many randomised controlled trials have shown that DMARDs influence the disease process and retard radiological destruction, at least in the short term (Mottonen et al. 1999).
The most common GP referral was to a rheumatologist (7%), followed by that to an orthopaedic surgeon. The most common pathology tests were for full blood counts (19%), erythrocyte sedimentation rate (14%) and liver function (11%).
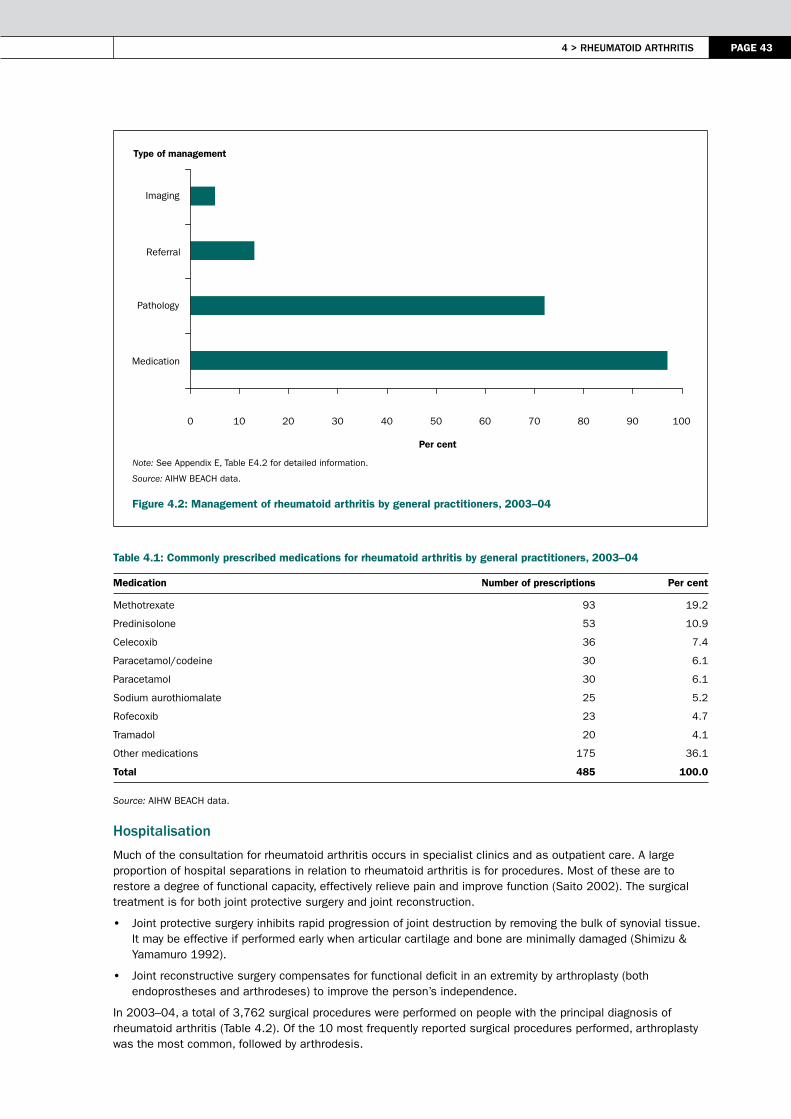
4 > rheumAtoid Arthritis PAGE 43
Note: See Appendix E, Table E4.2 for detailed information.
Source: AIHW BEACH data.
Figure 4.2: Management of rheumatoid arthritis by general practitioners, 2003–04
Table 4.1: Commonly prescribed medications for rheumatoid arthritis by general practitioners, 2003–04
Medication Number of prescriptions Per cent
Methotrexate 93 19.2
Predinisolone 53 10.9
Celecoxib 36 7.4
Paracetamol/codeine 30 6.1
Paracetamol 30 6.1
Sodium aurothiomalate 25 5.2
Rofecoxib 23 4.7
Tramadol 20 4.1
Other medications 175 36.1
Total 485 100.0
Source: AIHW BEACH data.
hospitalisation
Much of the consultation for rheumatoid arthritis occurs in specialist clinics and as outpatient care. A large proportion of hospital separations in relation to rheumatoid arthritis is for procedures. Most of these are to restore a degree of functional capacity, effectively relieve pain and improve function (Saito 2002). The surgical treatment is for both joint protective surgery and joint reconstruction.
• Joint protective surgery inhibits rapid progression of joint destruction by removing the bulk of synovial tissue. It may be effective if performed early when articular cartilage and bone are minimally damaged (Shimizu & Yamamuro 1992).
• Joint reconstructive surgery compensates for functional deficit in an extremity by arthroplasty (both endoprostheses and arthrodeses) to improve the person’s independence.
In 2003–04, a total of 3,762 surgical procedures were performed on people with the principal diagnosis of rheumatoid arthritis (Table 4.2). Of the 10 most frequently reported surgical procedures performed, arthroplasty was the most common, followed by arthrodesis.
Type of management
0 10 20 30 40 50 60 70 80 90 100
Medication
Pathology
Referral
Imaging
Per cent
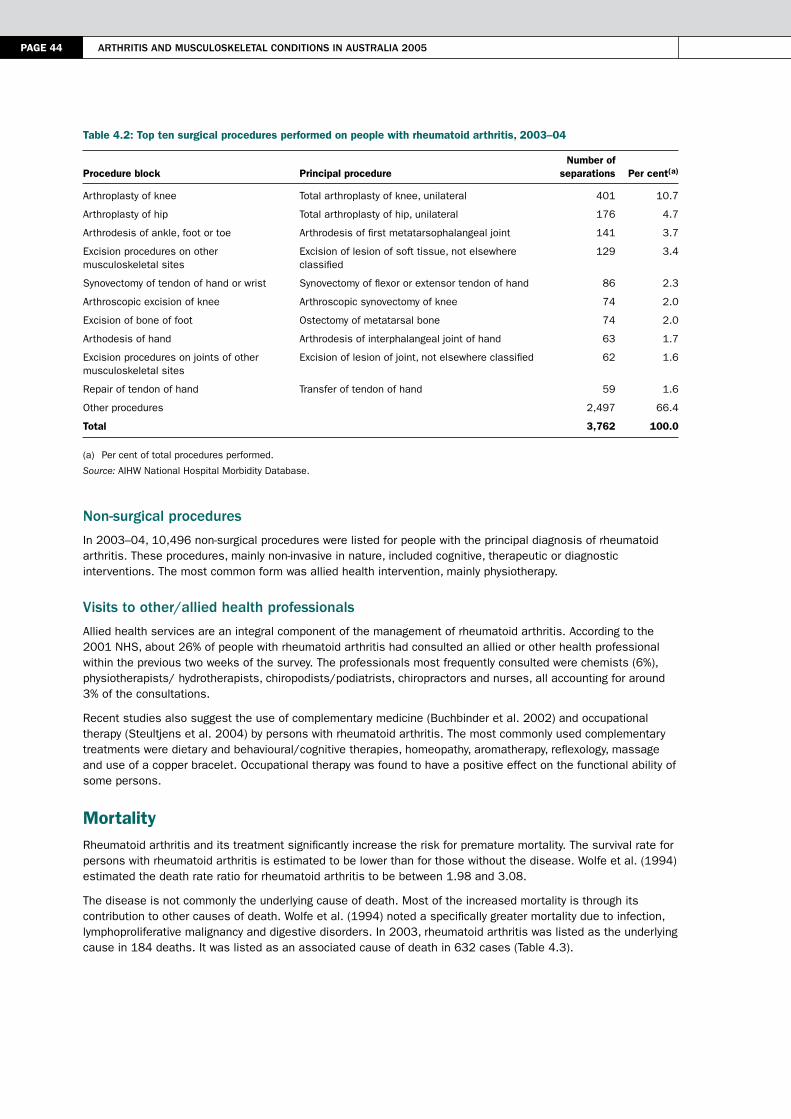
PAGE 44 Arthritis And musculoskeletAl conditions in AustrAliA 2005
Table 4.2: Top ten surgical procedures performed on people with rheumatoid arthritis, 2003–04
Procedure block Principal procedure Number of
separations Per cent(a)
Arthroplasty of knee Total arthroplasty of knee, unilateral 401 10.7
Arthroplasty of hip Total arthroplasty of hip, unilateral 176 4.7
Arthrodesis of ankle, foot or toe Arthrodesis of first metatarsophalangeal joint 141 3.7
Excision procedures on other musculoskeletal sites
Excision of lesion of soft tissue, not elsewhere classified
129 3.4
Synovectomy of tendon of hand or wrist Synovectomy of flexor or extensor tendon of hand 86 2.3
Arthroscopic excision of knee Arthroscopic synovectomy of knee 74 2.0
Excision of bone of foot Ostectomy of metatarsal bone 74 2.0
Arthodesis of hand Arthrodesis of interphalangeal joint of hand 63 1.7
Excision procedures on joints of other musculoskeletal sites
Excision of lesion of joint, not elsewhere classified 62 1.6
Repair of tendon of hand Transfer of tendon of hand 59 1.6
Other procedures 2,497 66.4
Total 3,762 100.0
(a) Per cent of total procedures performed.
Source: AIHW National Hospital Morbidity Database.
non-surgical procedures
In 2003–04, 10,496 non-surgical procedures were listed for people with the principal diagnosis of rheumatoid arthritis. These procedures, mainly non-invasive in nature, included cognitive, therapeutic or diagnostic interventions. The most common form was allied health intervention, mainly physiotherapy.
Visits to other/allied health professionals
Allied health services are an integral component of the management of rheumatoid arthritis. According to the 2001 NHS, about 26% of people with rheumatoid arthritis had consulted an allied or other health professional within the previous two weeks of the survey. The professionals most frequently consulted were chemists (6%), physiotherapists/ hydrotherapists, chiropodists/podiatrists, chiropractors and nurses, all accounting for around 3% of the consultations.
Recent studies also suggest the use of complementary medicine (Buchbinder et al. 2002) and occupational therapy (Steultjens et al. 2004) by persons with rheumatoid arthritis. The most commonly used complementary treatments were dietary and behavioural/cognitive therapies, homeopathy, aromatherapy, reflexology, massage and use of a copper bracelet. Occupational therapy was found to have a positive effect on the functional ability of some persons.
MortalityRheumatoid arthritis and its treatment significantly increase the risk for premature mortality. The survival rate for persons with rheumatoid arthritis is estimated to be lower than for those without the disease. Wolfe et al. (1994) estimated the death rate ratio for rheumatoid arthritis to be between 1.98 and 3.08.
The disease is not commonly the underlying cause of death. Most of the increased mortality is through its contribution to other causes of death. Wolfe et al. (1994) noted a specifically greater mortality due to infection, lymphoproliferative malignancy and digestive disorders. In 2003, rheumatoid arthritis was listed as the underlying cause in 184 deaths. It was listed as an associated cause of death in 632 cases (Table 4.3).

4 > rheumAtoid Arthritis PAGE 45
Table 4.3: Rheumatoid arthritis as an associated cause of death, 2003
Underlying cause of death Number of deaths Per cent
Cardiovascular disease 280 44.3
Cancer 116 18.3
Respiratory disease 69 10.9
Digestive disorder 26 4.1
Other causes 141 22.3
Total 632 100.0
Source: AIHW National Mortality Database.
ReferencesABS (Australian Bureau of Statistics) 2002. 2001 National Health Survey: summary of results. ABS Cat. No. 4364.0. Canberra: ABS.
ACR (American College of Rheumatology Subcommittee on Rheumatoid Arthritis Guidelines) 2002. Guidelines for the management of rheumatoid arthritis. Arthritis and Rheumatism 46:328–46.
AIHW (Australian Institute of Health and Welfare): Mathers C, Vos T & Stevenson C 1999. The burden of disease and injury in Australia. AIHW Cat. No. PHE 17. Canberra: AIHW.
Bankhead C, Silman A & Barrett B 1996. Incidence of rheumatoid arthritis is not related to indicators of socioeconomic deprivation. Journal of Rheumatology 23:2039–42.
Barrett EM, Scott DGI, Wiles NJ et al. 2000. The impact of rheumatoid arthritis on employment status in the early years of disease: a UK community-based study. Rheumatology 39:1403–9.
Bellamy N, Gilbert JR, Brooks PM et al. 1988. A survey of current prescribing practices of anti-inflammatory and urate lowering drugs in gouty arthritis in the province of Ontario. Journal of Rheumatology 37:814–20.
Brennan P & Silman A 1995. Why the gender difference in susceptibility to rheumatoid arthritis? Annals of Rheumatic Diseases 54:694–5.
Buchbinder R, Gingold M, Hall S et al. 2002. Non–prescription complementary treatments used by rheumatoid arthritis patients attending a community-based rheumatology practice. Internal Medicine 32:2008–14.
Callahan LF & Pincus T 1988. Formal education level as a significant marker of clinical status in rheumatoid arthritis. Arthritis and Rheumatism 31:1346–57.
Conaghan PG & Brooks P 1996. Disease-modifying anti-rheumatic drugs, including methotrexate gold, sulfasalazine, antimalarials and D–penicillamine. Current Opinions in Rheumatology 8:176–82.
Cunningham LS & Kelsey JL 1984. Epidemiology of musculoskeletal impairments and associated disability. American Journal of Public Health 74:574–9.
Fries JF 2000. Current treatment paradigms in rheumatoid arthritis. Rheumatology 39(Supplement 1):30–5.
Gabriel S 2001. The epidemiology of rheumatoid arthritis. Rheumatic Disease Clinics of North America 27:269–81.
Goldbach–Mansky R & Lipsky PE 2003. New concepts in the treatment of rheumatoid arthritis. Annual Review of Medicine 54:197–216.
Hill C, Parsons A & Taylor 1999. Health related quality of life in a population sample with arthritis. Journal of Rheumatology 26:2029–35.
Kuiper S, van Gestel A, Swinkels H et al. 2001. Influence of sex, age, and menopausal state on the course of early rheumatoid arthritis. Journal of Rheumatology 28:1809–16.
Kvien T, Glennas A, Ole G et al. 1996. The validity of self–reported diagnosis of rheumatoid arthritis: results from a population survey followed by clinical examinations. Journal of Rheumatology 23:1866–71.
MacGregor A, Ollier W, Venkovsky J et al. 1995. Rheumatoid factor isotypes in monozygotic and dizygotic twins discordant for rheumatoid arthritis. Journal of Rheumatology 22:2203–7.

PAGE 46 Arthritis And musculoskeletAl conditions in AustrAliA 2005
MacGregor A & Silman A 2003. Classification and epidemiology. In: Hochberg MC, Silman AJ, Smolen JS et al. (eds). Rheumatology, 3rd ed. Mosby: London.
Maetzel A, Li L, Pencharz J et al. 2004. The economic burden associated with osteoarthritis, rheumatoid arthritis and hypertension: a comparative study. Annals of Rheumatic Diseases 63:395–401.
Meenan RF, Yelin EH, Nevitt M et al. 1981. The impact of chronic disease: a sociomedical profile of rheumatoid arthritis. Arthritis and Rheumatism 24:544–56.
Mikkelsen WM, Dodge HJ, Duff IT et al. 1967. Estimates of the prevalence of rheumatic diseases in the population of Tecumsek, Michigan, 1959–60. Journal of Chronic Diseases 20:351–69.
Mottonen TT, Hannonen PJ & Boers M 1999. Comparison of combination therapy with single-drug therapy in early rheumatoid arthritis: a randomised trial. Lancet 353:1568–73.
NAMSCAG (National Arthritis and Musculoskeletal Conditions Advisory Group) 2004. Evidence to support the National Action Plan for osteoarthritis, rheumatoid arthritis and osteoporosis: opportunities to improve health–related quality of life and reduce the burden of disease and disability. Canberra: DoHA at <http://www.nhpac.gov.au>.
Nuki G 1998. Diseases of the connective tissues, joints and bones. In: Edwards CRW, Bouchier IAD, Haslett C et al. (eds). Davidson’s principles and practices of medicine. London: Churchill Livingstone, 864–939.
Pincus T 1995. Long–term outcomes in rheumatoid arthritis. British Journal of Rheumatology 34(Supplement 2): 59–73.
Rasker JJ & Cosh JA 1989. Course and prognosis of early rheumatoid arthritis. Scandinavian Journal of Rheumatology 79:45–56.
Saito T 2002. Timing of surgical treatment in patients with rheumatoid arthritis. Nippon Rinsho 60(12):2429–36.
Saraux A, Berthelot JM, Charles G et al. 2001. Ability of the American College of Rheumatology 1987 criteria to predict rheumatoid arthritis in patients with early arthritis and classification of these patients two years after. Arthritis and Rheumatism 44:2485–91.
Scott J & Hochberg M 1998. Arthritis and other musculoskeletal diseases. In: Brownson R, Remington P & Davis J (eds). Chronic disease epidemiology and control, 2nd ed. Washington: American Public Health Association, 465–89.
Shimizu K & Yamamuro T 1992. Surgical treatment of rheumatoid arthritis. Nippon Rinsho 50(3):536–42.
Silman A, Kay A & Brennan P 1992. Timing of pregnancy in relation to the onset of rheumatoid arthritis. Arthritis and Rheumatism 35(2):152–5.
Silman AJ & Hochberg MC 2001. Epidemiology of the rheumatic diseases, 2nd ed. Oxford: Oxford University Press.
Silman AJ & Pearson JE 2002. Epidemiology and genetics of rheumatoid arthritis. Arthritis Research 4(Supplement 3):S265–S272.
Sokka T, Krishnan E, Hakkinen A et al. 2003. Functional disability in rheumatoid arthritis patients compared with a community population in Finland. Arthritis and Rheumatism 48:59–63.
Solomon L, Robin G & Valkenburg HA 1975. Rheumatoid arthritis in an urban South African negro population. Annals of Rheumatic Diseases 32:128–35.
Spector TD 1990. Rheumatoid arthritis. In: Hochberg M, (ed). Epidemiology of rheumatic diseases. Philadelphia, PA: Saunders.
Star VL, Scott JC & Sherwin R 1996. Validity of self–reported rheumatoid arthritis in elderly women. Journal of Rheumatology 23:1862–5.
Steultjens EM, Dekker J, Bouter LM et al. 2004. Occupational therapy for rheumatoid arthritis. Cochrane Database System Review 1: CD003114.
Symmons D 2002. Epidemiology of rheumatoid arthritis: determinants of onset, persistence and outcome. Best Practice and Research in Clinical Epidemiology 16:707–22.

4 > rheumAtoid Arthritis PAGE 47
Symmons D 2003. Environmental factors and the outcome of rheumatoid arthritis. Best Practice and Research in Clinical Epidemiology 17:717–27.
Taneja V & David CS 2000. Association of MHC and rheumatoid arthritis: regulatory role of HLA class II molecules in animal models of RA—studies on transgenic/knockout mice. Arthritis Research 2:205–7.
Weyand CM & Gronzy JJ 2000. Association of MHC and rheumatoid arthritis. HLA polymorphisms in phenotypic variants of rheumatoid arthritis. Arthritis Research 2:212–6.
WHO (World Health Organization Scientific Group) 2003. The burden of musculoskeletal conditions at the start of the new millennium: report of the WHO Scientific Group. WHO Technical Report Series No. 919. Geneva: WHO.
Wolfe F & Hawley DJ 1998. The long-term outcomes of rheumatoid arthritis: work disability: a prospective 18 year study of 823 patients. Journal of Rheumatology 25:2108–17.
Wolfe F, Mitchell DM, Sibley JT et al. 1994. The mortality of rheumatoid arthritis. Arthritis and Rheumatism 41:1571–82.
Wollheim F 1993. Rheumatoid arthritis—the clinical picture. In: Maddison P, Isenberg D, Woo R et al. (eds). Oxford textbook of rheumatology. Oxford: Oxford University Press, 639–61.
Young A, Dixey J, Cox N et al. 2000. How does functional disability in early rheumatoid arthritis (RA) affect patients and their lives? Results of 5 years of follow-up in 732 patients from the Early RA Study (ERAS). Rheumatology 39:603–11.


5 > osteoPorosis PAGE 49
5 > Osteoporosis
KEy POINTS
• Osteoporosis is a debilitating disease with major health impact through bone fractures. Fractures after minimal trauma are a hallmark of osteoporosis.
• Almost 300,000 Australians are reported to have osteoporosis. The disease is more common in females than males, and is mostly limited to the elderly.
• Around 64,000 hospital separations in Australia every year are for bone fractures in people aged 55 and above. A large proportion of these separations can be attributed to osteoporosis.
• The health costs for the treatment of osteoporotic fractures, associated complications and ongoing care are large and the burden is expected to rise as the population ages.
• A variety of risk factors contribute to the development of osteoporosis, many of which are preventable. Use of bisphosphonates/ appropriate exercise regimes and nutrition can reduce their impact.
Osteoporosis (or porous bones) is the loss of bone density and the deterioration of bone structure, which leads to fragile bones that are prone to fracture. The most common clinical presentation of osteoporosis is fracture after low energy trauma—when a healthy bone would not be expected to sustain fracture—particularly in the hip, spine and wrist. When a fracture occurs, osteoporosis has already been present for several years.
Fractures can impact upon a person’s ability to walk unassisted and may lead to loss of independence. A hip fracture almost always requires hospitalisation and major surgery, and may even lead to death. Vertebral fractures can result in a loss of height, cause severe back pain and produce deformity. The health costs for the treatment of osteoporotic fractures, associated complications and ongoing care are large and the burden is expected to rise as the population ages (Wark 1996; AIHW 2002; WHO Scientific Group 2003).
The adverse health impact of osteoporosis can be reduced through early prevention and appropriate management (Seeman & Eisman 2004). In view of this prospect, osteoporosis has been chosen for focused attention in the National Health Priority Areas Initiative on Arthritis and Musculoskeletal Conditions (NAMSCAG 2004).
This chapter describes the health impact of osteoporosis in terms of:
• incidence and prevalence
• impairment and activity limitations
• health care service use, and
• fractures and mortality.
The nature of the problem and risk factors for osteoporosis are also reviewed.
Nature of the problemOsteoporosis can be viewed at two different levels, namely bone porosity (or the loss of bone mass) and the adverse health outcome of bone fracture. The risk of fracture increases as the bone mass decreases (Riggs & Melton 1992). This inverse relationship between bone porosity and fracture, mediated by external trauma, needs to be regularly monitored.
Bone porosity
The human skeletal system acts as a repository for body minerals such as calcium and phosphorous. These minerals are deposited (bone formation) and absorbed from the bones (bone resorption) as part of healthy bone growth. The process, which continues throughout life, maintains skeletal homeostasis.
PAGE 50 Arthritis And musculoskeletAl conditions in AustrAliA 2005
Bone production is at its peak during periods of accelerated growth in childhood and adolescence when more minerals are deposited in than absorbed from the bones. Total adult bone mass peaks around the age of 20 at which time the rates of bone formation and resorption are almost balanced (Abrams 2003).
Cortical bone loss starts occurring from about the age of 40–50, at an annual rate of around 0.3–0.5%. The cortical bone forms the hard outer layer, with the trabecular bone providing the inner architecture and strength of the bone. (The terms cortical and trabecular are derived from the Latin for bark of a tree and beam or timber, respectively). The rate of decline increases in females after menopause.
The diagnosis of osteoporosis can be based on bone mineral density (BMD). BMD is expressed in T-scores, which are standard deviations from the mean BMD in normal young people (Box 5.1). The relation between T-scores and the risk of fracture is computed for each site. For example, the risk of vertebral fractures increases more than two-fold for each unit T-score decrease in BMD (Cummings et al. 1995).
Box 5.1: Diagnostic criteria for osteoporosis using bone mineral density (BMD)
Measurement of BMD (densitometry) is a safe and effective method for diagnosing osteoporosis. Dual-energy x-ray absorptiometry (DEXA or DXA) is recommended and considered the ‘gold standard’ (Sambrook et al. 2002), but when DEXA is not available (e.g. in more remote areas) quantitative computerised tomography (QCT) is used. Three different categories—osteoporosis, osteopenia and normal bone density—are described:
• Osteoporosis: BMD more than 2.5 standard deviations below the mean bone mineral density in young normals (BMD T-score <–2.5)
• Osteopenia (low bone mass): BMD value between 1 and 2.5 standard deviations below the mean bone mineral density in young normals (–2.5 <BMD T-score <–1), and
• Normal bone density: T-score greater than –1 (at the same site and in the same sex).
Source: WH Source: WHO Scientific Group 1994
Fractures
Bone fracture is a serious outcome of osteoporosis, with long-term consequences of pain and disability. Virtually any bone can fracture if subjected to excessive force but osteoporotic bones fracture occurs with minimal trauma. Fractures sustained following falls from standing height or less are a hallmark of osteoporosis. A large proportion of fractures in people aged 55 or over is osteoporotic in nature.
• Most of the vertebral (spinal) fractures occur without symptoms; almost 70% are clinically undetected. These fractures are often associated with height loss, vertebral deformity (kyphosis) and vertebral compression. Activities such as lifting are a major cause of vertebral fractures.
• Non-vertebral fractures, on the other hand, are painful, associated with swelling and deformity. In particular, hip fractures are highly debilitating and even life-threatening—with almost 30% mortality occurring within 12 months (Woolf & Pfleger 2003). A large proportion of people with hip fractures do not regain their regular posture and mobility (Cumming et al. 1997). Falls are a major cause of these types of fractures.
Risk factors and markers A range of risk factors contribute to the development of osteoporosis. In addition to age and gender, several environmental, constitutional and lifestyle factors have been associated with the condition. Genetic, hormonal and immunological factors also contribute to variation in bone mass (Gennari et al. 2005). Major known risk factors for osteoporosis are listed in Box 5.2.
Fractures are prominent markers and useful end points for monitoring osteoporosis. It is therefore also prudent to look at factors that increase the risk of fracture. This includes, in particular, the risk of falls and other external causes of injury (Schwartz et al. 2005). A history of fracture after minimal trauma also presages future fractures.
Ageing
Bones lose calcium with age, making them less dense. The hard outer shell of the bone thins out and holes in the honeycomb structure become larger. While they remain the same size on the outside, bones become thinner and weaker on the inside—particularly at the hip, wrist and spine. This decrease in bone mass affects both sexes, though the process accelerates after the age of 50 in females.

5 > osteoPorosis PAGE 51
Box 5.2: Risk factors for bone loss and fracture
Biomedical and genetic• Ageing• Being post-menopausal • Family and population history• Poor vitamin D status• Low body weight (body mass index < 19 kg/m2)
Behavioural risk factors• Low calcium intake (<500–850 mg/day)• Physical inactivity, including long-term immobilisation• Smoking (current)• Excessive alcohol consumption
Other medical conditions and disability• Corticosteroid use• Reduced lifetime exposure to oestrogen (primary or secondary amenorrhoea or early natural or surgical
menopause (<45 years))• Rheumatoid arthritis• Malabsorption syndromes, including chronic liver disease and inflammatory bowel disease• Primary hyperparathyroidism• Physical disability
Previous history• Previous fracture after minimal trauma• Vertebral deformity• Loss of height and thoracic kyphosis (after radiographic confirmation of vertebral deformities)
Sources: Cumming et al. 1997; AIHW 2002; WHO Scientific Group 2003.
An ageing population will lead to a greater number of people with osteoporosis. In Australia, those aged 65 and over are about 13% of the population. Although this proportion is well below that in Japan (18%), Sweden (17%) and the United Kingdom (16%) it is likely to increase considerably over the next several decades (AIHW 2004a). This demographic shift would increase the overall number of Australians with osteoporosis and its adverse health outcomes.
Being post-menopausal
Low bone mass is linked to decreased levels of oestrogen—which plays a central role in maintaining and balancing bone mass—following menopause (Sowers & La Pietra 1995). The oestrogen is involved not only in regulating cortical and trabecular bone metabolism but also in retaining peak bone mass (Gennari et al. 2005).
With rare exceptions, all women have experienced menopause by age 55. Most women in Australia, therefore, will spend approximately 30 to 40 years in a post-menopausal state. Later age at menopause reduces the risk of osteoporosis. However, the translation of this biological staging into distribution of oestrogen levels and osteoporosis is not simple.
Several studies indicate that oestrogen replacement prevents or greatly retards the loss of bone mass. According to one study, women younger than 75 on oestrogen therapy for seven years or more had higher bone mass than those who had never received oestrogen (Felson et al. 1993). A randomised controlled trial by the Women’s Health Initiative, using fractures as clinical end points, has also reported positive outcomes, confirming the role of oestrogen in reducing osteoporosis (Writing Group for the Women’s Health Initiative Investigators 2002).
In 2001, approximately 27% of Australian women aged 50–69 used hormone replacement therapy (HRT), which includes oestrogen, for relief of post-menopausal symptoms and prevention of osteoporosis. The HRT usage is highest in those aged 50–59 (Table 5.1).

PAGE 52 Arthritis And musculoskeletAl conditions in AustrAliA 2005
Table 5.1: Use of hormone replacement therapy (HRT) by females, ages 18 and over, 2001
Age group (years)
Current usage rate
(Per cent)
Time used (Per cent of current HRT users)
2–5 years 5–10 years >10 years
18–29 0.4 21.7 n.a. n.a.
30–39 0.9 43.9 11.5 n.a.
40–49 8.5 26.6 13.9 12.0
50–59 29.6 26.9 27.1 25.8
60–69 24.6 12.4 22.4 56.8
70+ 6.5 8.3 25.4 54.7
Total 10.1 21.8 23.0 33.2
n.a. Not available.
Source: ABS 2002.
Almost one-third of women on HRT had received the therapy for more than a decade; the proportion was greater than one out of two females aged 60 and over. The numbers given in Table 5.1 however exclude females that currently do not use HRT but may have accessed the therapy in the past.
The benefits of HRT for osteoporosis notwithstanding, concerns have been raised about its potential risk for breast cancer and stroke and other problems. For longer term use and for women without severe symptoms the risks appear to outweigh the benefits. The use of HRT for the prevention of osteoporosis is therefore not recommended anymore (NHMRC 2005).
Family and population history
Osteoporosis often runs in families. Daughters of women with vertebral osteoporosis tend to have reduced bone mass. A maternal history of hip fracture doubles the risk of hip fracture for daughters as well as increasing the risk of vertebral deformities in sons (Cummings et al. 1995; Diaz et al. 1997). Those under the age of 50 are four times more likely to be told that they have osteoporosis if they had parents or siblings who had broken a bone (DHS 2002).
Genetic influences account for 70–85% of variation in bone mass density (Nuki et al. 1999). Several genes that maintain skeletal homeostasis have been identified (Eisman 1999). These include genes for cytokines, hormones, hormonal receptors and collagen. However, the identification of genetic pathways that lead to bone loss is confounded by various environmental interactions.
Osteoporosis also shows inter-population variation. Higher bone mass has been noted in the US black and Hispanic populations but the bone mass among Asians is similar to that in the white population (Cumming et al. 1997). Variation in hip fracture incidence has also been noted by race/ethnicity. While some of it is environmental in origin, genetic differences between populations contribute to this variation.
Poor vitamin d status
Vitamin D is an important hormone for the regulation of bone metabolism. There is some agreement that mild vitamin D deficiency stimulates parathyroid hormone secretion, which leads to hyperparathyroidism. Mainly synthesised through the skin from sunlight, vitamin D is often low in elderly or housebound people.
Vitamin D deficiency is common among elderly Australian citizens (Morris et al. 1999). It has been uncovered in women with hip fractures and in nursing home residents (Morris et al. 1984; Stein et al. 1996; Brock et al. 1997). The histological evidence in women with hip fractures has been confirmed by low serum levels of 25-hyroxy-vitamin D (Cummings et al. 1995).

5 > osteoPorosis PAGE 53
low body weight
Thinness or small frame is another risk factor for osteoporosis. This contrasts with overweight as a risk factor for osteoarthritis. There is some evidence that people with osteoarthritis do not commonly develop osteoporosis.
Low body weight is more frequent among females in higher age groups (AIHW 2004a). Almost 2.1% of females aged 65–74 reported low body weight during the 2001 National Health Survey. In comparison, a little over 1% of Australian males aged 65 and over had low body weight.
There has been an upward trend in body weight among Australians aged 75 and over (AIHW: Bennett et al. 2004). The proportion of females with low body weight in that age group has declined from 9.0% in 1989–90 to 5.8% in 2001. The decrease was higher among Australian males aged 75 and over (AIHW 2004a).
dietary and behavioural factors
A variety of dietary and behavioural factors contribute to the development of osteoporosis. Good calcium intake is important in reducing the rate of post-menopausal bone loss. Lack of exposure to sunlight reduces vitamin D levels which, in turn, affect absorption of calcium. Limited weight-bearing activity and poor physical activity increase the susceptibility of bones to fracture. Risky health behaviours such as tobacco smoking and excessive alcohol use also contribute to osteoporosis.
Calcium intake
The metabolic pathways of bone formation and bone loss are strongly influenced by calcium intake. Low intake of calcium has been associated with bone loss. In turn, calcium and vitamin D supplementation has been shown to reduce non-vertebral fractures by up to 40% in elderly persons (Reginster 1995). A greater use of calcium and vitamin D is therefore recommended to prevent bone loss (Morris et al. 1999).
Tobacco smoking
Smokers are known to have lower bone mass than non-smokers. Smoking may impact upon the metabolism of hormones that affect bone strength. Although the level of smoking declines with age, a sizeable proportion of the older population at risk of developing osteoporosis are current smokers.
In the 2001 National Health Survey, 13% of people aged 55 and over reported that they currently smoke (12% were regular, daily smokers). More females than males were current smokers (14% and 12%, respectively). There has been a decline in tobacco smoking in both sexes in that age group over the last two decades (AIHW 2004a).
Alcohol abuse
Alcoholics tend to have a low bone mass but this may be attributed more to general nutritional deficiencies rather than to a specific alcohol effect (Cumming et al. 1997). In contrast, those drinking in moderation tend to have a higher bone mass.
Consumption of alcohol at levels considered to be risky for health is high among elderly Australians. In the 2001 NHS, 7.0% of Australian males aged 65–74 reported alcohol consumption at health risk levels; the proportion among Australian females in that age group was 8.0%. These proportions are higher than those reported during the 1995 NHS (AIHW 2004a).
Physical inactivity
Low levels of physical activity are associated with increased risk of osteoporosis and fractures. Physical activity is a determinant of peak bone mass. Appropriate physical activity can slow bone mineral loss, help maintain posture and improve overall fitness. Choosing the right exercises and performing them correctly can help treat and prevent osteoporosis Weight-bearing physical activity, in particular, is important for maintaining bone mass (Forwood & Larsen 2000).
A large proportion of Australians aged 55 and over report ‘sedentary/very low’ (including no physical activity) and ‘low’ levels of physical activity (Table 5.2). There has been very little change in these proportions since 1989–90.

PAGE 54 Arthritis And musculoskeletAl conditions in AustrAliA 2005
Table 5.2: Level of physical activity, ages 55 and over, 2001
Level of physical activity
Males Females
Number ’000 Per cent Number ’000 Per cent
Sedentary (including no exercise) 663.3 34.8 839.6 39.7
Low 625.2 32.8 769.8 36.4
Moderate 564.4 29.7 475.1 22.4
High 50.6 2.7 32.8 1.5
Total 1,903.5 100.0 2,117.3 100.0
Source: ABS 2002.
other medical conditions
Several systemic illnesses affecting bone metabolism increase the risk for osteoporosis. These include malabsorption syndrome, chronic renal disease, metastatic cancer, thyrotoxicosis and rheumatoid arthritis.
Two metabolic disorders (in particular, hyperparathyroidism and hypogonadism) are associated with osteoporosis. Hyperparathyroidism involves excessive production of parathyroid hormone that increases blood calcium level by its reabsorption from bones. In hypogonadism, decreased or absent secretion of gonadal hormones causes increased loss of bone mass (O’Neill 1997). Loss of ovarian function, premature ovarian failure and amenorrhoea are also associated with bone loss.
Osteoporosis may also occur with certain drug treatments, in particular chronic corticosteroid use (Nuki et al. 1999). The fracture risk appears to be dependent on the dose of oral prednisolone: people receiving a dose of 7.5 mg per day or more are at higher risk of both vertebral and non-vertebral fractures (van Staa et al. 2000).
Physical disability
People with existing physical disabilities have a greater risk of developing osteoporosis because they are less likely to build and maintain bone mass through weight-bearing activities. They are also more likely to use medications that contribute to the loss of bone mass. Younger women with disability have been found to have seven times the rate of osteoporosis than those without disability (Nosek et al. 1997).
Previous history
A history of bone fracture after minimal trauma is a good marker of osteoporosis. Increased risk of a future fracture is associated with prior fracture(s) sustained at any site. A history of vertebral fractures increases the risk of further vertebral fractures five-fold compared with no such history (Lindsay et al. 2001). Vertebral fractures also indicate increased risk of future non-vertebral fractures.
Bone size and bone quality are also important in fracture risk. A longer hip axis length raises the risk of hip fracture, independent of BMD.
Incidence and prevalenceMeasuring the incidence and prevalence of osteoporosis is notoriously hard, as the disease is usually not detected until a fracture occurs and the person has presented to a general practitioner (GP) or hospital Emergency Department. Direct estimation of osteoporosis incidence/prevalence is possible though bone densitometry at regular intervals but there are no national data based on this measurement. However, a variety of indirect epidemiological measures, based on falls and fractures, can be used to try to gauge the extent of the problem. These include minimal trauma fractures, hospital separations for fractures, and the diagnosis of osteoporosis after the event of fracture.
incidence
No national data, based on bone densitometry or fractures, are available to estimate the incidence of osteoporosis. Some regional information on the incidence of osteoporotic fractures has been generated by three prospective studies (Jones et al. 1994b; Cooley & Jones 2001; Sanders et al. 1999b).

5 > osteoPorosis PAGE 55
According to these studies, the incidence of minimal trauma fractures varies among males from 12 to 19 per 1,000 person years and among females from 19 to 32 per 1,000 person years. These estimates translate to between 51,000 and 73,000 new cases of osteoporotic fractures each year nationwide.
Prevalence
Information as to how many people in Australia currently have osteoporosis comes from two different sources, namely:
• distribution of bone density in the population, and
• self-reports from population health surveys.
There is, as expected, a significant difference in the prevalence of osteoporosis based on BMD distributions and self-reports. While BMD distribution provides a more objective view of the prevalence of osteoporosis, self-reports are more often than not based on the diagnosis of osteoporosis after a fracture is sustained. The two estimates therefore may not be comparable.
Bone densitometry
BMD is generally not measured at the population level, but rather for those considered at high risk. Regional studies such as the Dubbo Osteoporosis Epidemiology Study and Geelong Osteoporosis Study provide some insight into the age-specific prevalence of low BMD. No national data are available on the distribution of BMD in Australia.
The Geelong Osteoporosis Study, using WHO-approved cut-off levels for BMD, found the prevalence of osteoporosis among Australian females to be high, increasing from the age of 40–44. About 90 out of 1,000 females, aged 50–54, have low BMD (defining osteoporosis) in either the spine, femoral neck (hip) or mid-forearm. The proportion increases more than four-fold to 380 per 1,000 females aged 60–64, and to 560 per 1,000 females aged 65–69. Among those aged 80 or more, the prevalence rate rises to 870 per 1,000 females (Henry et al. 2000).
Self-reports
Estimates of the prevalence of osteoporosis, based on 2001 NHS self-reports, indicate that around 300,000 people, at a rate of 16 per 1,000 persons aged 15 and over, had osteoporosis (ABS 2002). As expected, there was a strong relationship of osteoporosis prevalence with age (Figure 5.1); almost 79% of these people were aged 55 and over. Females reported osteoporosis four times more often than males.
Note: See Appendix E, Table E5.1 for detailed information.
Source: AIHW analysis of ABS 2001 National Health Survey CURF.
Figure 5.1: Age-specific prevalence of osteoporosis, ages 35 and over, 2001
Males
Females
Number per 100,000 population
20
0
40
60
80
100
120
140
160
35–44 45–54 55–64 65–74 75+
Age group (years)

PAGE 56 Arthritis And musculoskeletAl conditions in AustrAliA 2005
The prevalence of osteoporosis estimated from the 2003 Survey of Disability, Ageing and Carers (SDAC) is quite close to that obtained from the 2001 NHS at 17 per 1,000 persons aged 15 and over. This similarity in estimates from the two surveys is coincidental, as the enumeration of health conditions in SDAC is associated with the presence of disability (AIHW 2004b). Besides, the SDAC numbers include institutionalised people, among whom the condition is likely to be more prevalent, whereas the NHS estimates are community-based only.
The self-report estimates of osteoporosis from both 2001 NHS and 2003 SDAC are much lower than those obtained through the South Australian Omnibus Surveys, conducted between 1995 and 2001 (DHS 2002). These surveys indicate much higher prevalence of osteoporosis—at 48 per 1,000 persons aged 15 and over in 2001 (Table 5.3). The overall prevalence in that age group declined to 37 per 1,000 persons from 1995 to 2001. These South Australian rates are almost double the national prevalence rates, based on 2001 NHS, among people in that age group.
Self-reporting significantly underestimates the prevalence of osteoporosis because of the lack of knowledge about osteoporosis in the general community and the low rates of diagnosis of asymptomatic osteoporosis (Phillipov et al. 1998). However, the considerable differences in prevalence rates between the two national surveys and the South Australian Health Omnibus Surveys are more likely to be due to differing sampling strategies and population bases.
Table 5.3: Prevalence of osteoporosis in Australia, various years
Source
Method
Age group
year
Prevalence rate (per 1,000 persons)
Males Females Persons
National Health Survey Self-reports 15 years+ 2001 5 26 16
Survey of Disability, Ageing and Carers Self-reports 15 years+ 2003 .. .. 17
South Australian Health Omnibus Survey Self-reports 15 years+ 2001 .. .. 48
.. Not applicable.
Sources: AIHW analysis of ABS 2001 National Health Survey CURF and ABS 2003 Survey of Disability, Ageing and Carers CURF; DHS 2002.
Impairments and activity limitationsOsteoporosis is a major cause of both acute and chronic disability (Fink et al. 2003). In its wake, people suffer the pain and disability of fracture that can lead to loss of independence and an early nursing home admission. Note that little, if any, impairment or activity restriction is attributed to osteoporosis until a bone fractures.
Functional and activity limitations due to osteoporotic fractures are highly variable in severity and chronicity, ranging from none to more than six months. The acute pain following fracture may last a few weeks as the bone heals, but in several cases the fracture may lead to long-term activity limitation. In some cases, the pain may also become chronic. A significant proportion of people with fractures require long-term care.
The impact of certain osteoporotic fractures may be severe, even profound. Almost half of those who fracture a hip will be permanently disabled and not regain their former independence (Johnell 1997). About 40% of people are unable to walk independently one year after hip fracture, about 60% have difficulty with at least one essential activity of daily living, and about 80% are limited in activities such as driving and shopping (Boonen et al. 2004). Substantial disability is also reported after fractures of thoracic vertebrae, the humerus, forearm, ankle and foot (Fink et al. 2003).
According to the SDAC, 58,600 persons reported osteoporosis as their main disabling condition in 2003 (see Chapter 2). Almost half of those with disability associated with osteoporosis (22,994 out of 51,133 persons) had a severe or profound core-activity limitation. These people needed assistance with one or more activities of daily living, such as self-care, mobility and communication.
The proportion of severe or profound core-activity restriction varies with the type of impairment and age. Incomplete use of feet or legs, incomplete use of arms or fingers, disfigurement or deformity and difficulty gripping or holding things—impairments that are prominent in people with osteoporosis—contribute greatly to core-activity restrictions. Almost one out of five people with disability associated with osteoporosis requires assistance more than three times a day (AIHW 2004b).

5 > osteoPorosis PAGE 57
Current service useThe treatment for osteoporosis usually begins when the condition has weakened the bone to such an extent that a minimal trauma fracture is sustained. Most often, the condition is detected only when a person first presents to their general practitioner (GP) or hospital Emergency Department with a fracture.
Osteoporosis is not a common diagnosis in hospital separations; nonetheless, it is a large contributor to hospitalisation for a variety of treatments and procedures. Most prominent among these are fractures that require immediate attention. Innovations in surgical techniques and biomedical devices have greatly increased the treatment options available to people with fractures. Nonetheless, most of these procedures can be performed only in a hospital setting.
treatment and management
The treatment options for established disease can be grouped into two classes: Class I agents that either impair bone resorption and/or reduce activation frequency and Class II agents that increase bone formation (Box 5.3).
Box 5.3: Potential treatments for established osteoporosis
Class I: Impair bone resorption and/or reduce activation frequencies• Hormone replacement therapy (HRT)• Calcitonin• Bisphosphonates• Anabolic steroids• Calcium• Vitamin D and metabolites
Source: Kanis et al. 2002.
Class II: Stimulate bone formation• Intermittent parathyroid injections
Bisphosphonates, such as alendronate and risedronate, are safe and effective agents for the treatment and prevention of osteoporosis. They increase bone mass, and in patients with established osteoporosis reduce the risk of vertebral fractures. They also reduce the risk of hip and other non-vertebral fractures. In combination with oestrogen, bisphosphonates produce greater gains in bone mass; the greater benefit of combination therapy on fracture risk, however, is not clear (Watts 2001).
Calcium treatment, the second most commonly prescribed treatment/prevention modality, is efficacious in populations with low calcium intake. Calcium, as described earlier, is an essential nutrient for the prevention and treatment of osteoporosis. The treatment, however, does not completely arrest post-menopausal bone loss but it does slow the rate of decline by 30 to 50% (Reid 1996).
General practice visits
Osteoporosis accounted for only 0.6% of all problems managed by GPs during the 2003–04 BEACH sampling period. Nonetheless, treatment and management of a large proportion of cases usually begins with a visit to a GP. The person may have sustained an injury from a low fall, or be experiencing ongoing and unexpected pain after bracing themselves with their hands when they tripped.
A large proportion of GP encounters in relation to osteoporosis are for medication only. More than 96% of those who visit their GP with osteoporosis are prescribed medication. Other forms of GP management of osteoporosis included imaging tests, particularly densitometry and x-rays of the spine and thorax, and pathology tests for calcium levels and full blood counts.
Medications prescribed
Alendronate was the most common medication prescribed or advised by GPs, followed by calcium carbonate. Other commonly prescribed/recommended medications for osteoporosis by GPs are listed in Table 5.4.
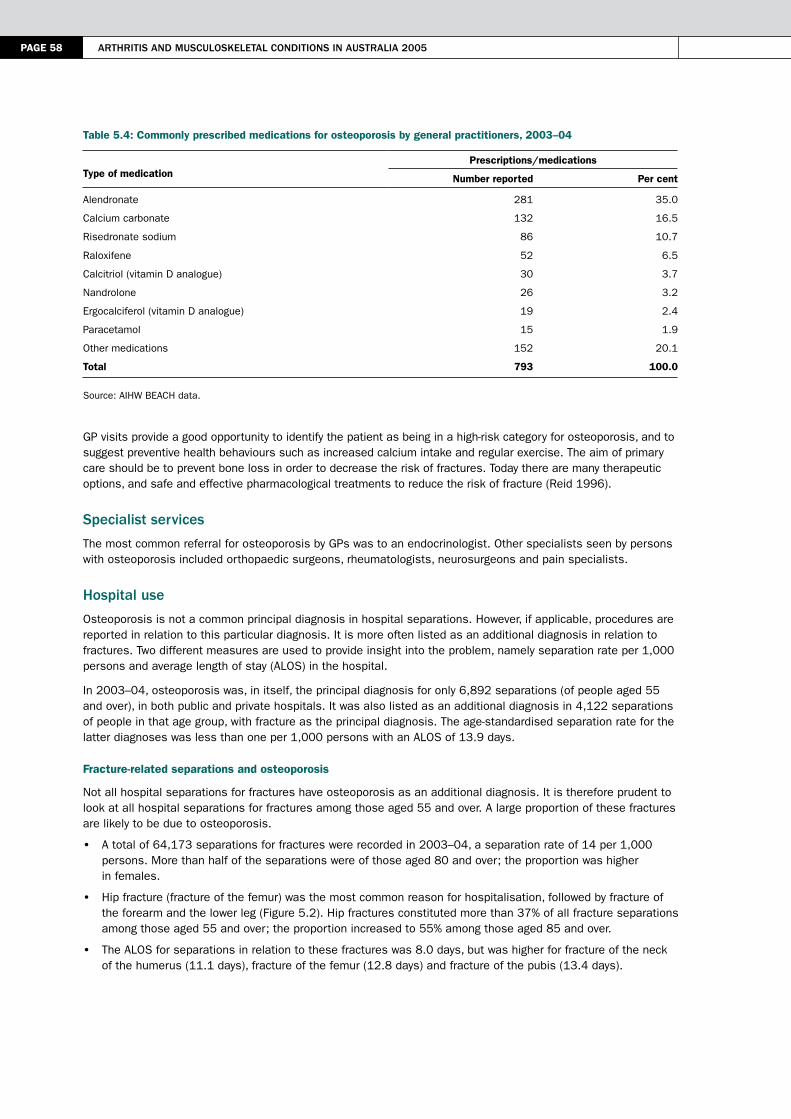
PAGE 58 Arthritis And musculoskeletAl conditions in AustrAliA 2005
Table 5.4: Commonly prescribed medications for osteoporosis by general practitioners, 2003–04
Type of medicationPrescriptions/medications
Number reported Per cent
Alendronate 281 35.0
Calcium carbonate 132 16.5
Risedronate sodium 86 10.7
Raloxifene 52 6.5
Calcitriol (vitamin D analogue) 30 3.7
Nandrolone 26 3.2
Ergocalciferol (vitamin D analogue) 19 2.4
Paracetamol 15 1.9
Other medications 152 20.1
Total 793 100.0
Source: AIHW BEACH data.
GP visits provide a good opportunity to identify the patient as being in a high-risk category for osteoporosis, and to suggest preventive health behaviours such as increased calcium intake and regular exercise. The aim of primary care should be to prevent bone loss in order to decrease the risk of fractures. Today there are many therapeutic options, and safe and effective pharmacological treatments to reduce the risk of fracture (Reid 1996).
specialist services
The most common referral for osteoporosis by GPs was to an endocrinologist. Other specialists seen by persons with osteoporosis included orthopaedic surgeons, rheumatologists, neurosurgeons and pain specialists.
hospital use
Osteoporosis is not a common principal diagnosis in hospital separations. However, if applicable, procedures are reported in relation to this particular diagnosis. It is more often listed as an additional diagnosis in relation to fractures. Two different measures are used to provide insight into the problem, namely separation rate per 1,000 persons and average length of stay (ALOS) in the hospital.
In 2003–04, osteoporosis was, in itself, the principal diagnosis for only 6,892 separations (of people aged 55 and over), in both public and private hospitals. It was also listed as an additional diagnosis in 4,122 separations of people in that age group, with fracture as the principal diagnosis. The age-standardised separation rate for the latter diagnoses was less than one per 1,000 persons with an ALOS of 13.9 days.
Fracture-related separations and osteoporosis
Not all hospital separations for fractures have osteoporosis as an additional diagnosis. It is therefore prudent to look at all hospital separations for fractures among those aged 55 and over. A large proportion of these fractures are likely to be due to osteoporosis.
• A total of 64,173 separations for fractures were recorded in 2003–04, a separation rate of 14 per 1,000 persons. More than half of the separations were of those aged 80 and over; the proportion was higher in females.
• Hip fracture (fracture of the femur) was the most common reason for hospitalisation, followed by fracture of the forearm and the lower leg (Figure 5.2). Hip fractures constituted more than 37% of all fracture separations among those aged 55 and over; the proportion increased to 55% among those aged 85 and over.
• The ALOS for separations in relation to these fractures was 8.0 days, but was higher for fracture of the neck of the humerus (11.1 days), fracture of the femur (12.8 days) and fracture of the pubis (13.4 days).

5 > osteoPorosis PAGE 59
Note: See Appendix E, Table E5.2 for detailed information.
Source: AIHW National Hospital Morbidity Database.
Figure 5.2: Hospitalisation for common fractures, 2003–04
Falls and fractures
The role of falls in fractures that require hospitalisation shows much age- and sex-related variation (Figure 5.3). More than 70% of hospital separations for fractures among those aged 55 and over have falls listed as the external cause of injury. The proportion exceeds 80% among those aged 85 and over. The ratios have not changed much over the past five years.
Notes
1. See Appendix E, Table E5.3 for detailed information.
2. Per cent of fractures due to falls.
Source: AIHW National Hospital Morbidity Database.
Figure 5.3: Falls as a factor in hospitalisation for fractures, 2003–04
0 5,000 10,000 15,000 20,000 25,000
Femur
Other sites
Forearm
Lower leg including ankle
Shoulder and upper arm
Wrist and hand level
Skull and facial bones
Fracture site
Number of hospital separations
Males
Females
Per cent
0
5
10
15
20
25
30
35
40
55–59 60–64 65–69 70–74 75–79 80–84 85+
Age group (years)
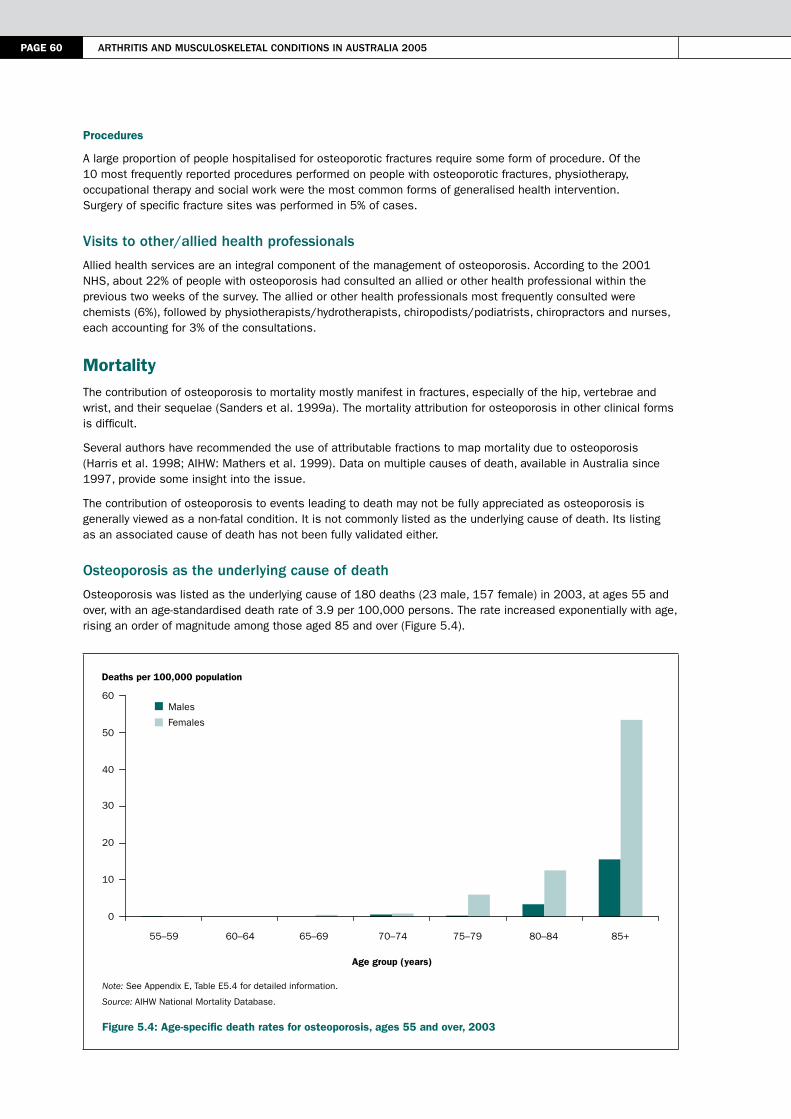
PAGE 60 Arthritis And musculoskeletAl conditions in AustrAliA 2005
Procedures
A large proportion of people hospitalised for osteoporotic fractures require some form of procedure. Of the 10 most frequently reported procedures performed on people with osteoporotic fractures, physiotherapy, occupational therapy and social work were the most common forms of generalised health intervention. Surgery of specific fracture sites was performed in 5% of cases.
Visits to other/allied health professionals
Allied health services are an integral component of the management of osteoporosis. According to the 2001 NHS, about 22% of people with osteoporosis had consulted an allied or other health professional within the previous two weeks of the survey. The allied or other health professionals most frequently consulted were chemists (6%), followed by physiotherapists/hydrotherapists, chiropodists/podiatrists, chiropractors and nurses, each accounting for 3% of the consultations.
MortalityThe contribution of osteoporosis to mortality mostly manifest in fractures, especially of the hip, vertebrae and wrist, and their sequelae (Sanders et al. 1999a). The mortality attribution for osteoporosis in other clinical forms is difficult.
Several authors have recommended the use of attributable fractions to map mortality due to osteoporosis (Harris et al. 1998; AIHW: Mathers et al. 1999). Data on multiple causes of death, available in Australia since 1997, provide some insight into the issue.
The contribution of osteoporosis to events leading to death may not be fully appreciated as osteoporosis is generally viewed as a non-fatal condition. It is not commonly listed as the underlying cause of death. Its listing as an associated cause of death has not been fully validated either.
osteoporosis as the underlying cause of death
Osteoporosis was listed as the underlying cause of 180 deaths (23 male, 157 female) in 2003, at ages 55 and over, with an age-standardised death rate of 3.9 per 100,000 persons. The rate increased exponentially with age, rising an order of magnitude among those aged 85 and over (Figure 5.4).
Note: See Appendix E, Table E5.4 for detailed information.
Source: AIHW National Mortality Database.
Figure 5.4: Age-specific death rates for osteoporosis, ages 55 and over, 2003
Males
Females
Deaths per 100,000 population
0
10
20
30
40
50
60
55–59 60–64 65–69 70–74 75–79 80–84 85+
Age group (years)
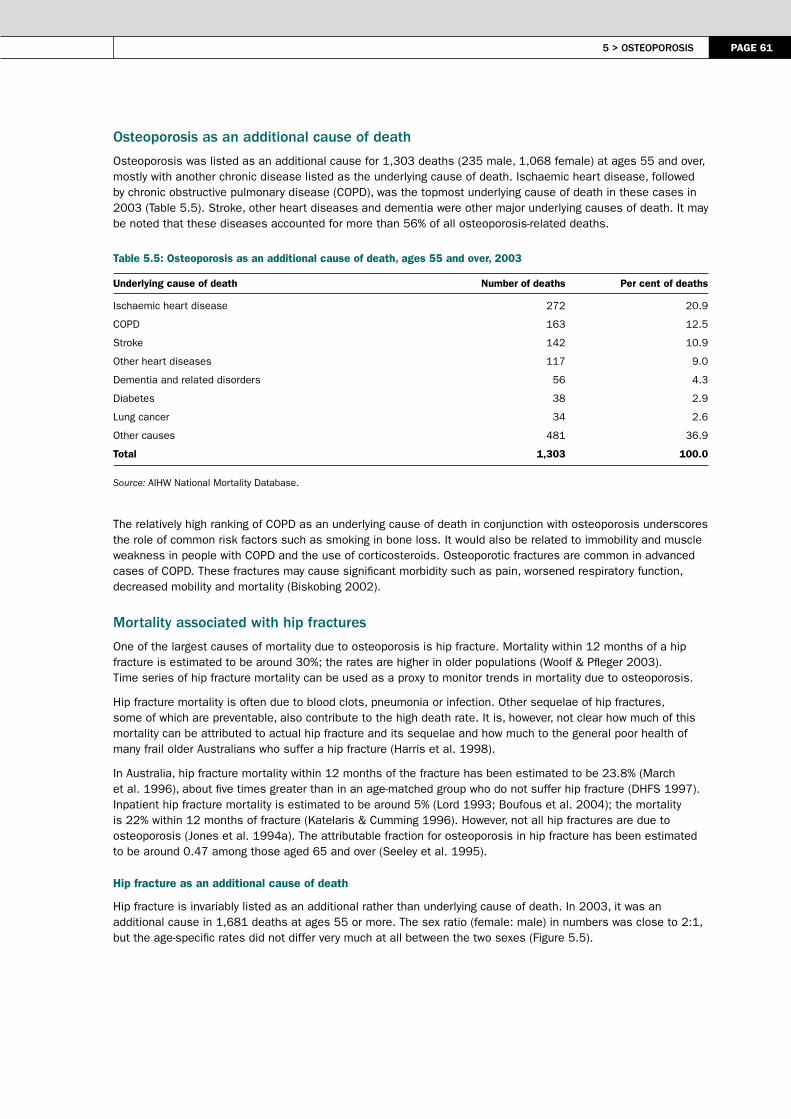
5 > osteoPorosis PAGE 61
osteoporosis as an additional cause of death
Osteoporosis was listed as an additional cause for 1,303 deaths (235 male, 1,068 female) at ages 55 and over, mostly with another chronic disease listed as the underlying cause of death. Ischaemic heart disease, followed by chronic obstructive pulmonary disease (COPD), was the topmost underlying cause of death in these cases in 2003 (Table 5.5). Stroke, other heart diseases and dementia were other major underlying causes of death. It may be noted that these diseases accounted for more than 56% of all osteoporosis-related deaths.
Table 5.5: Osteoporosis as an additional cause of death, ages 55 and over, 2003
Underlying cause of death Number of deaths Per cent of deaths
Ischaemic heart disease 272 20.9
COPD 163 12.5
Stroke 142 10.9
Other heart diseases 117 9.0
Dementia and related disorders 56 4.3
Diabetes 38 2.9
Lung cancer 34 2.6
Other causes 481 36.9
Total 1,303 100.0
Source: AIHW National Mortality Database.
The relatively high ranking of COPD as an underlying cause of death in conjunction with osteoporosis underscores the role of common risk factors such as smoking in bone loss. It would also be related to immobility and muscle weakness in people with COPD and the use of corticosteroids. Osteoporotic fractures are common in advanced cases of COPD. These fractures may cause significant morbidity such as pain, worsened respiratory function, decreased mobility and mortality (Biskobing 2002).
mortality associated with hip fractures
One of the largest causes of mortality due to osteoporosis is hip fracture. Mortality within 12 months of a hip fracture is estimated to be around 30%; the rates are higher in older populations (Woolf & Pfleger 2003). Time series of hip fracture mortality can be used as a proxy to monitor trends in mortality due to osteoporosis.
Hip fracture mortality is often due to blood clots, pneumonia or infection. Other sequelae of hip fractures, some of which are preventable, also contribute to the high death rate. It is, however, not clear how much of this mortality can be attributed to actual hip fracture and its sequelae and how much to the general poor health of many frail older Australians who suffer a hip fracture (Harris et al. 1998).
In Australia, hip fracture mortality within 12 months of the fracture has been estimated to be 23.8% (March et al. 1996), about five times greater than in an age-matched group who do not suffer hip fracture (DHFS 1997). Inpatient hip fracture mortality is estimated to be around 5% (Lord 1993; Boufous et al. 2004); the mortality is 22% within 12 months of fracture (Katelaris & Cumming 1996). However, not all hip fractures are due to osteoporosis (Jones et al. 1994a). The attributable fraction for osteoporosis in hip fracture has been estimated to be around 0.47 among those aged 65 and over (Seeley et al. 1995).
Hip fracture as an additional cause of death
Hip fracture is invariably listed as an additional rather than underlying cause of death. In 2003, it was an additional cause in 1,681 deaths at ages 55 or more. The sex ratio (female: male) in numbers was close to 2:1, but the age-specific rates did not differ very much at all between the two sexes (Figure 5.5).

PAGE 62 Arthritis And musculoskeletAl conditions in AustrAliA 2005
Note: See Appendix E, Table E5.5 for detailed information.
Source: AIHW National Mortality Database.
Figure 5.5: Age-specific listing of hip fracture as an additional cause of death, ages 55 and over, 2003
Exposure to an unspecified factor was the predominant underlying cause of death (32.9%) in cases where hip fracture was listed as an additional cause of death. This suggests a high degree of uncertainty in ascertaining hip fracture mortality. Ischaemic heart disease, stroke and dementia were the other major underlying causes of death, reflecting advanced age and probably poor pre-fracture health in many cases (Table 5.6).
Table 5.6: Hip fracture as an additional cause of death, ages 55 and over, 2003
Underlying cause of death Number of deaths Per cent of deaths
Exposure to an unspecified factor 553 32.9
Ischaemic heart disease 293 17.4
Stroke 105 6.2
Other heart diseases 101 6.0
Dementia and related disorders 72 4.3
COPD 49 2.9
Lung cancer 27 1.6
Other causes 481 28.6
Total 1,681 100.0
Source: AIHW National Mortality Database.
Hip fracture as an additional cause of death has shown limited variation in listing over the period for which data on multiple causes of death are available in Australia. The listing rate varied between 36.6 and 44.5 per 100,000 persons, ages 55 and over, between 1997 and 2003 (Figure 5.6).
Not all hip fracture mortality described above can be attributed to osteoporosis. The proportion varies with the type of hip fracture (intracapsular, intertrochanteric or subtrochanteric) but is taken on average to be 0.47 (Seeley et al. 1995). By applying this aetiological fraction, the number of hip fracture deaths attributed to osteoporosis stands at 790.
Males
Females
Deaths per 100,000 population
0
100
200
300
400
55–59 60–64 65–69 70–74 75–79 80–84 85+
Age group (years)
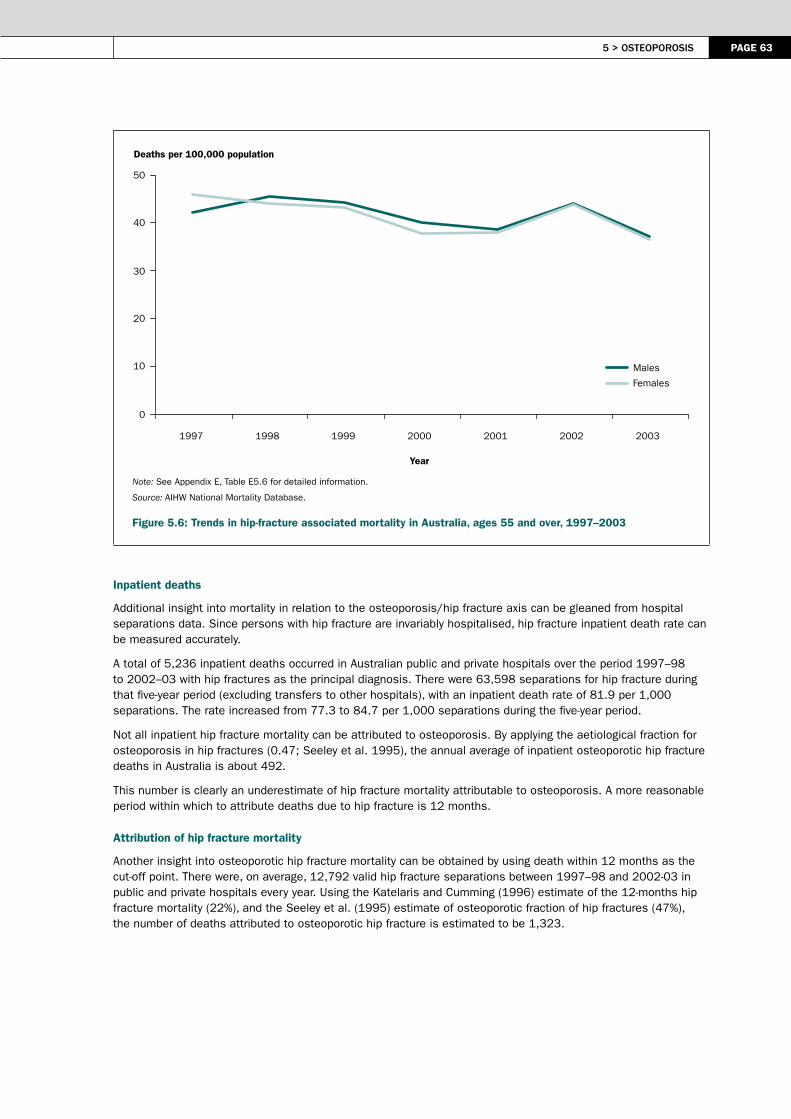
5 > osteoPorosis PAGE 63
Note: See Appendix E, Table E5.6 for detailed information.
Source: AIHW National Mortality Database.
Figure 5.6: Trends in hip-fracture associated mortality in Australia, ages 55 and over, 1997–2003
Inpatient deaths
Additional insight into mortality in relation to the osteoporosis/hip fracture axis can be gleaned from hospital separations data. Since persons with hip fracture are invariably hospitalised, hip fracture inpatient death rate can be measured accurately.
A total of 5,236 inpatient deaths occurred in Australian public and private hospitals over the period 1997–98 to 2002–03 with hip fractures as the principal diagnosis. There were 63,598 separations for hip fracture during that five-year period (excluding transfers to other hospitals), with an inpatient death rate of 81.9 per 1,000 separations. The rate increased from 77.3 to 84.7 per 1,000 separations during the five-year period.
Not all inpatient hip fracture mortality can be attributed to osteoporosis. By applying the aetiological fraction for osteoporosis in hip fractures (0.47; Seeley et al. 1995), the annual average of inpatient osteoporotic hip fracture deaths in Australia is about 492.
This number is clearly an underestimate of hip fracture mortality attributable to osteoporosis. A more reasonable period within which to attribute deaths due to hip fracture is 12 months.
Attribution of hip fracture mortality
Another insight into osteoporotic hip fracture mortality can be obtained by using death within 12 months as the cut-off point. There were, on average, 12,792 valid hip fracture separations between 1997–98 and 2002-03 in public and private hospitals every year. Using the Katelaris and Cumming (1996) estimate of the 12-months hip fracture mortality (22%), and the Seeley et al. (1995) estimate of osteoporotic fraction of hip fractures (47%), the number of deaths attributed to osteoporotic hip fracture is estimated to be 1,323.
Males
Females
Deaths per 100,000 population
0
10
20
30
40
50
1997 1998 1999 2000 2001 2002 2003
Year
PAGE 64 Arthritis And musculoskeletAl conditions in AustrAliA 2005
ReferencesAbrams SA 2003. Normal acquisition and loss of bone mass. Hormone Research 60 (Supplement 3): 71-6.
ABS (Australian Bureau of Statistics) 2002. 2001 National Health Survey: summary of results. ABS Cat. No. 4364.0. Canberra: ABS.
AIHW (Australian Institute of Health and Welfare) 2002. Chronic diseases and associated risk factors in Australia, 2001. AIHW Cat. No. PHE 33. Canberra: AIHW.
AIHW 2004a. Australia’s health 2004. AIHW Cat. No. AUS 44. Canberra: AIHW.
AIHW 2004b. Disability and its relationship to health conditions and other factors. AIHW Cat. No. DIS 37. Canberra: AIHW.
AIHW: Bennett S, Magnus P & Gibson D 2004. Obesity trends in older Australians. AIHW Cat. No. AUS 42. Canberra: AIHW.
AIHW: Mathers C, Vos T & Stevenson C 1999. The burden of disease and injury in Australia. AIHW Cat. No. PHE 17. Canberra: AIHW.
Bhalla AK 1993. Osteoporosis and osteomalcia. In: Maddison PJ, Isenberg DA, Woo P et al. (eds). Oxford textbook of rheumatology. Oxford: Oxford University Press, 1005–24.
Biskobing DM 2002. COPD and osteoporosis. Chest 121:609–20.
Boonen S, Rizzoli R, Meunier PJ et al. 2004. The need for clinical guidance in the use of calcium and vitamin D in the management of osteoporosis: a consensus report. Osteoporosis International 15:511–9.
Boufous S, Finch CF & Lord SR 2004. Incidence of hip fracture in New South Wales: are our efforts having an effect? Medical Journal of Australia 180:623–6.
Brock K, Reid J & Fraser D 1997. Effect of type of accommodation on vitamin D status of the elderly in Australia. In Norman AW, Bouillon TM & Thomasset M (eds). Vitamin D: chemistry, biology and clinical applications of the steroid hormone. Riverside: University of California, 885–6.
Cooley H & Jones G 2001. A population–based study of fracture incidence in southern Tasmania: lifetime fracture risk and evidence for geographic variations within the same country. Osteoporosis International 12:124–30.
Cumming RG, Nevitt MC & Cummings SR 1997. Epidemiology of hip fractures. Epidemiological Reviews 19:244–56.
Cummings S, Nevitt M, Browner W et al. 1995. Risk factors for hip fracture in white women. New England Journal of Medicine 332:767–73.
DHFS (Commonwealth Department of Health and Family Services) 1997. Consensus panel: the prevention and management of osteoporosis. Medical Journal of Australia 167:S1–S16.
DHS (Department of Human Services) 2002. Osteoporosis in South Australia. Centre for Population Studies in Epidemiology Brief Report No. 2002–17. Adelaide: DHS.
Diaz MN, O’Neill TW & Silman AJ 1997. The influence of family history of hip fracture on the risk of vertebral deformity in men and women: the European Vertebral Osteoporosis Study. Bone 20:145–9.
Eisman JA 1999. Genetics of osteoporosis. Endocrinology Reviews 20:788–804.
Felson DT, Zhang Y, Hannan MT et al. 1993. The effect of postmenopausal estrogen therapy on bone density in elderly women. New England Journal of Medicine 329:1141–6.
Fink HA, Ensrud KE, Nelson DB et al. 2003. Disability after clinical fracture in postmenopausal women with low bone density: the fracture intervention trial (FIT). Osteoporosis International 14:69–76.
Forwood MR & Larsen JA 2000. Exercise recommendations for osteoporosis: a position statement of Australian and New Zealand Bone and Mineral Society. Australian Family Physician 29:761–4.
Gennari L, Merlotti V, De Paola V et al. 2005. Estrogen receptor gene polymorphisms and genetics of osteoporosis: a HuGE review. American Journal of Epidemiology 161:307–20.

5 > osteoPorosis PAGE 65
Harris AH, Cumming R, Watts J et al. 1998. The burden of illness and the cost of osteoporosis in Australia. Centre for Health Program Evaluation Technical Report no. 8. Melbourne: Monash University.
Henry MJ, Paco JA, Nicholson GC et al. 2000. Prevalence of osteoporosis in Australian women (Geelong Osteoporosis Study). Journal of Clinical Densitometry 3:261–8.
Johnell O 1997. The socioeconomic burden of fractures: today and in the 21st century. American Journal of Medicine 103(2A):20S–25S; discussion 25S–26S.
Jones G, Nguyen T, Sambrook P et al. 1994a. Progressive loss of bone in the femoral neck in elderly people: longitudinal findings from the Dubbo Osteoporosis Epidemiology Study. British Medical Journal 39:691–5.
Jones G, Nguyen T, Sambrook P et al. 1994b. Symptomatic fracture incidence in elderly men and women: the Dubbo Osteoporosis Epidemiology Study (DOES). Osteoporosis International 4:277–82.
Kanis JA, Brazier JE, Stevenson M et al. 2002. Treatment of established osteoporosis: a systematic review and cost–utility analysis. Health Technology Assessment 6(29): 19–60.
Katelaris AG & Cumming RG 1996. Health status before and mortality after hip fracture. American Journal of Public Health 86(4):557–60.
Lindsay R, Silverman S, Cooper C et al. 2001. Risk of new vertebral fracture in the year following a fracture. Journal of the American Medical Association 285:320–3.
Lord SR 1993. Hip fractures: changing patterns in hospital bed use between 1979 and 1990. Australian and New Zealand Journal of Surgery 63:352–5.
March L, Chamberlain A, Cameron I et al. 1996. Prevention, treatment and rehabilitation of fractured neck of femur. Report from the Northern Sydney Area Health Service Fractured Neck of Femur Health Outcomes Project. Cited 5 August 2005. <http: //www.mja.com.au/public/issues/iprs2/march/fnof.pdf>.
Morris HA, Need AG, Burr M et al. 1984. Vitamin D and femoral neck fractures in elderly South Australian women. Medical Journal of Australia 140:519–21.
Morris HA, Need AG & Nordin BGC 1999. The hip fracture threat (editorial). Medical Journal of Australia 170:459–60.
NAMSCAG (National Arthritis and Musculoskeletal Conditions Advisory Group) 2004. Evidence to support the National Action Plan for osteoarthritis, rheumatoid arthritis and osteoporosis: opportunities to improve health–related quality of life and reduce the burden of disease and disability. Canberra: DoHA at <http://www.nhpac.gov.au>.
NHMRC (National Health and Medical Research Council) 2005. Should I use Hormone Replacement Therapy. Canberra; NHMRC.
Nosek MA, Howland CA, Rintal DH et al. 1997. National study of women with physical disabilities: Final Report. Houston, TX: Center for Research on Women with Disabilities.
Nuki G, Ralston S & Luqmani R 1999. Diseases of the connective tissues, joints and bones. In: Haslett C, Chivers E, Hunter J et al. (eds). Davidson’s principles and practice of medicine, 18th ed. Edinburgh: Churchill Livingstone, 801–76.
O’Neill S 1997. Osteoporosis guidelines for general practitioners. Australian Family Physician 26(1):1181–96.
Phillipov G, Phillips PJ, Leach G et al. 1998. Public perceptions and self–reported prevalence of osteoporosis in South Australia. Osteoporosis International 8(6):552–6.
Reginster JY 1995. Treatment of bone in elderly subjects: calcium, vitamin D, fluor, bisphosphonates, calcitonin. Hormone Research 43:83–8.
Reid IR 1996. Therapy of osteoporosis: calcium, vitamin D and exercise. American Journal of Medical Science 312:278–86.
Riggs BL & Melton LJ III 1992. The prevention and treatment of osteoporosis. New England Journal of Medicine 327:620–7.
PAGE 66 Arthritis And musculoskeletAl conditions in AustrAliA 2005
Sambrook PN, Seeman E, Phillips SR et al. 2002. Preventing osteoporosis: outcomes of the Australian Fracture Prevention Summit. Co–sponsored by Osteoporosis Australia and the National Prescribing Service. Medical Journal of Australia 176(Supplement 8):1–16.
Sanders KM, Nicholson GC, Ugoni AM et al. 1999a. Health burden of hip and other fractures in Australia beyond 2000: projections based on the Geelong Osteoporosis Study. Medical Journal of Australia 170:467–70.
Sanders KM, Seeman E, Ugoni AM et al. 1999b. Age and gender specific rates of fractures in Australia: a population–based study. Osteoporosis International 10:240–7.
Schwartz AV, Nevitt MC, Brown BW et al. 2005. Increased falling as a risk factor for fracture among older women: the study of osteoporotic fractures. American Journal of Epidemiology 161:180–5.
Seeley DG, Browner WS, Nevitt MC et al. 1995. Almost all fractures are osteoporotic. Journal of Bone and Mineral Research 10:S468.
Seeman E & Eisman JA 2004. MJA practice essentials 7: treatment of osteoporosis: why, whom, when and how to treat. Medical Journal of Australia 180:298–303.
Sowers MR & La Pietra MT 1995. Menopause: its epidemiology and potential association with chronic diseases. Epidemiological Reviews 17:287–302.
Stein MS, Scherer SC, Walton SL et al. 1996. Risk factors for secondary hyperparathyroidism in a nursing home population. Clinical Endocrinology 44:375–83.
van Staa T, Leufkens H, Abenhaim L et al. 2000. Use of oral corticosteroids and risk of fractures. Journal of Bone and Mineral Research 15:993–1000.
Wark JD 1996. Osteoporosis: the emerging epidemic. Medical Journal of Australia 164:327–8.
Watts NB 2001. Treatment of osteoporosis with bisphosphonates. Rheumatic Disease Clinics of North America 27:197–214.
WHO (World Health Organization) Scientific Group 1994. Assessment of fracture risk and its application to screening for postmenopausal osteoporosis. WHO Technical Report Series No. 843. Geneva: WHO.
WHO Scientific Group 2003. The burden of musculoskeletal conditions at the start of the new millennium. WHO Technical Report Series no. 919. Geneva: WHO.
Woolf AD & Pfleger B 2003. Burden of major musculoskeletal conditions. Bulletin of the World Health Organization 81(9):646–56.
Writing Group for the Women’s Health Initiative Investigators 2002. Risks and benefits of estrogen plus progestin in healthy postmenopausal women: principal results from the Women’s Health Initiative randomized controlled trial. Journal of the American Medical Association 288:321–33.

6 > imPAct on FunctioninG And QuAlitY oF liFe PAGE 67
6 > Impact on functioning and quality of life
KEy POINTS
• The impact of arthritis and musculoskeletal conditions on functioning and quality of life is large, not only in terms of activity limitation and functional restrictions but also in terms of pain and self-perceived state of health.
• The independent living of a large proportion of people with arthritis and musculoskeletal conditions is compromised. Many experience psycho-social changes in their lives (e.g. in marital status and employment) as a result of their disease or condition.
• Persons with arthritis and musculoskeletal conditions commonly encounter limitations in activities of daily living. In particular, they need assistance with heavy household chores.
• Work disability is also common among these people. More than one-third are unable to work permanently; many others experience several employment restrictions.
• The activity limitations associated with arthritis and musculoskeletal conditions are often exacerbated by the presence of other long-term conditions. This is particularly the case among those aged 80 and over.
• The health-related quality of life of people with arthritis and musculoskeletal conditions is generally poorer than that of those living in the community at large. This is particularly the case for people with rheumatoid arthritis.
• Certain elements of the impact of arthritis and musculoskeletal conditions cannot be easily measured, nor can the costs of the resulting human suffering be estimated.
Arthritis and musculoskeletal conditions have a large impact on the functioning and quality of life of a significantly large proportion of the Australian population, particularly the elderly. These diseases and conditions not only limit a person’s mobility but also cause them difficulty in carrying out a wide range of daily tasks. The quality of their day-to-day life is low in terms of physical functioning, bodily pain and role performance. In view of the great number of those affected, the societal impact of these diseases and conditions is considerable (Kelsey & Hochberg 1988; Arthritis Australia 2004).
The adverse impact of arthritis and musculoskeletal conditions is much more insidious than the symptoms of joint pain and mobility restriction would suggest. Not only do affected people have difficulty in performing activities of daily living and working, but also they fear altered body image, and have concerns about dependency. The need to seek help is often a blow to their self-esteem and self-image. The effect on emotional wellbeing and sexual relationships is also high (McDuffie et al. 1996). The burden placed by some of these conditions on the person who has the condition and their family members are pervasive. Persons with arthritis and musculoskeletal conditions also face high health care expenses (Arthritis Australia 2004).
This chapter provides an overview of these issues in Australia, using the concepts behind the International Classification of Functioning, Disability and Health as a guide (ICF) (WHO 2001). Impairments due to arthritis and musculoskeletal conditions, leading to disability, are described. Limitations of activity are also covered. Their impact upon independent living and social participation is examined. Since arthritis and musculoskeletal conditions tend to be chronic in nature, with poor functional outcomes, the chapter also focuses on long-term issues such as health status, problems at work and occupational modifications required. The overall impact is summarised in terms of health-related quality of life (HRQoL) and self-perceived health status.

PAGE 68 Arthritis And musculoskeletAl conditions in AustrAliA 2005
ImpairmentsDisability may include a variety of bodily impairments (i.e. problems in body function and structure with significant deviation or loss). In arthritis and musculoskeletal conditions, chronic or recurrent pain may occur. There may also be limitation in manual performance, incomplete use of body parts, and disfigurement or deformity (Table 6.1). The role of these impairments, deformities and disfigurements, in particular, among young people, is high.
The most common impairment associated with arthritis and musculoskeletal conditions is chronic or recurrent musculoskeletal pain. Almost 56% of those with arthritis and musculoskeletal conditions who responded to the 2003 Survey of Disability, Ageing and Carers (SDAC) reported chronic or recurrent pain that impacted on their quality of life. Chronic pain is not being regarded here as a protracted form of acute pain—a symptom—but an impairment in its own right. For example, joint pain could be associated with functional limitation even in the absence of radiographic evidence of arthritis (Leveille et al. 2001).
One in two SDAC respondents with arthritis and musculoskeletal conditions also reported difficulty in gripping or holding things. Another major upper body impairment reported was incomplete use of arms or fingers. Disfigurement or deformity caused by arthritis and related disorders was reported by about 3% of the respondents.
Table 6.1: Physical impairments/limitations associated with arthritis and related disorders, 2003
Impairment/limitation Number ’000 Per cent
Chronic or recurrent pain or discomfort 312 55.7
Difficulty gripping or holding things 278 49.6
Incomplete use of feet or legs 137 24.4
Incomplete use of arms or fingers 95 17.0
Disfigurement or deformity 16 2.8
Note: The proportions are based on the total number of people with disability associated with arthritis and related disorders (N=560,104).
Source: AIHW analysis of ABS 2003 Survey of Disability, Ageing and Carers CURF.
Independent livingThe ability to perform core activities of life, or activities of daily living (ADL), is central to independent living. These activities include self-care (showering, toileting and dressing), mobility (transferring from beds or chairs, and sometimes walking around the house) and communication. People with arthritis and musculoskeletal conditions generally have moderate difficulty in performing many of these tasks. Not everyone with arthritis or a musculoskeletal condition is affected the same way though. As the disease progresses, the capacity to perform these core activities decreases. The pain becomes more severe and the body becomes stiffer. Depending upon the amount of pain and upper or lower body limitation, people experience a range of activity limitations.
The inability to do housework, shop, prepare meals, or to manage medication and transportation generally has a low impact on a person’s quality of life. Those experiencing a moderate activity limitation would have some difficulty in performing these activities. But, those with a mild activity limitation may not have much difficulty at all; they would, however, have difficulty walking long distances, using public transport, walking up and down stairs, or bending to pick up an object from the floor (ABS 2004).
Both formal and informal support and care are sometimes required by many people who have difficulties with one or more activities of daily living.
Assistance required
In the 2003 SDAC, the majority of respondents (people reporting arthritis and related disorders as the main disabling condition) indicated limitations in one or more core activities. However, most of these people, other than those aged 80 and over, did not actually need assistance in undertaking these activities.
Limited restriction was reported by people with arthritis and related disorders in showering, eating, toileting and bladder/bowel control. A relatively small number of people therefore require assistance with these activities of self-care (Table 6.2). Dressing, however, is one self-care activity where people with arthritis and musculoskeletal conditions do require assistance more often. This is particularly the case for those aged 80 and over.
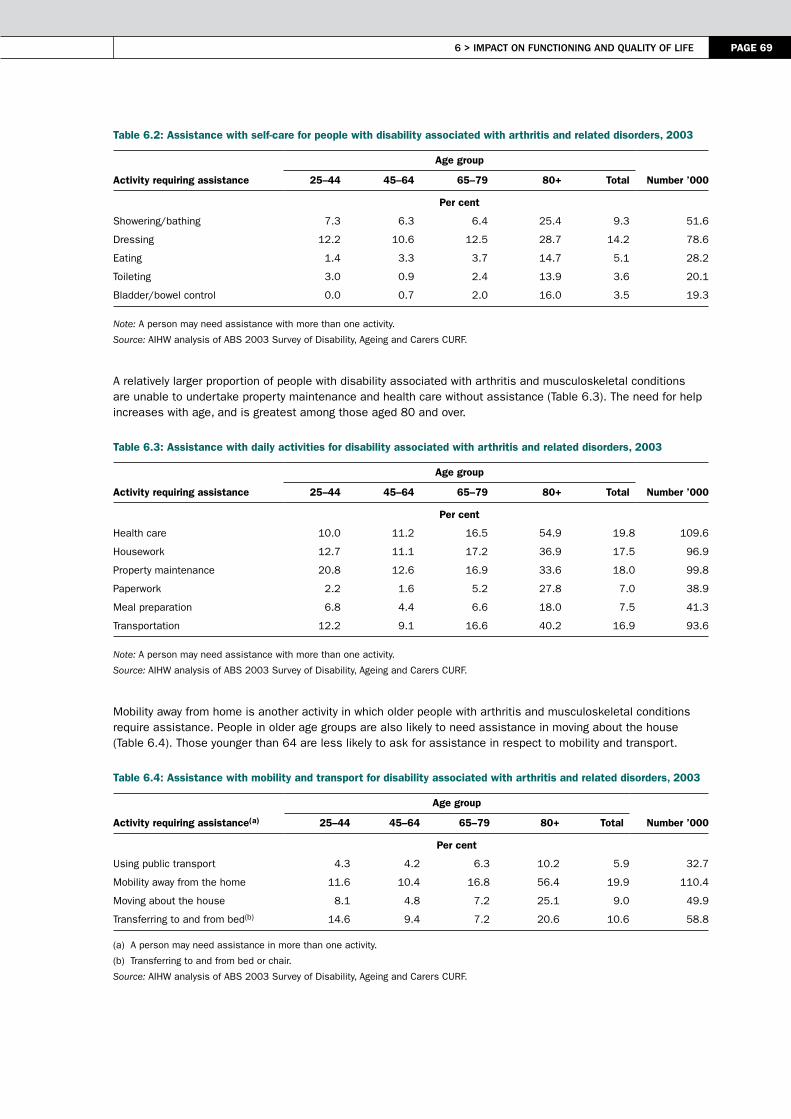
6 > imPAct on FunctioninG And QuAlitY oF liFe PAGE 69
Table 6.2: Assistance with self-care for people with disability associated with arthritis and related disorders, 2003
Activity requiring assistance
Age group
25–44 45–64 65–79 80+ Total Number ’000
Per cent
Showering/bathing 7.3 6.3 6.4 25.4 9.3 51.6
Dressing 12.2 10.6 12.5 28.7 14.2 78.6
Eating 1.4 3.3 3.7 14.7 5.1 28.2
Toileting 3.0 0.9 2.4 13.9 3.6 20.1
Bladder/bowel control 0.0 0.7 2.0 16.0 3.5 19.3
Note: A person may need assistance with more than one activity.
Source: AIHW analysis of ABS 2003 Survey of Disability, Ageing and Carers CURF.
A relatively larger proportion of people with disability associated with arthritis and musculoskeletal conditions are unable to undertake property maintenance and health care without assistance (Table 6.3). The need for help increases with age, and is greatest among those aged 80 and over.
Table 6.3: Assistance with daily activities for disability associated with arthritis and related disorders, 2003
Activity requiring assistance
Age group
25–44 45–64 65–79 80+ Total Number ’000
Per cent
Health care 10.0 11.2 16.5 54.9 19.8 109.6
Housework 12.7 11.1 17.2 36.9 17.5 96.9
Property maintenance 20.8 12.6 16.9 33.6 18.0 99.8
Paperwork 2.2 1.6 5.2 27.8 7.0 38.9
Meal preparation 6.8 4.4 6.6 18.0 7.5 41.3
Transportation 12.2 9.1 16.6 40.2 16.9 93.6
Note: A person may need assistance with more than one activity.
Source: AIHW analysis of ABS 2003 Survey of Disability, Ageing and Carers CURF.
Mobility away from home is another activity in which older people with arthritis and musculoskeletal conditions require assistance. People in older age groups are also likely to need assistance in moving about the house (Table 6.4). Those younger than 64 are less likely to ask for assistance in respect to mobility and transport.
Table 6.4: Assistance with mobility and transport for disability associated with arthritis and related disorders, 2003
Activity requiring assistance(a)
Age group
25–44 45–64 65–79 80+ Total Number ’000
Per cent
Using public transport 4.3 4.2 6.3 10.2 5.9 32.7
Mobility away from the home 11.6 10.4 16.8 56.4 19.9 110.4
Moving about the house 8.1 4.8 7.2 25.1 9.0 49.9
Transferring to and from bed(b) 14.6 9.4 7.2 20.6 10.6 58.8
(a) A person may need assistance in more than one activity.
(b) Transferring to and from bed or chair.
Source: AIHW analysis of ABS 2003 Survey of Disability, Ageing and Carers CURF.

PAGE 70 Arthritis And musculoskeletAl conditions in AustrAliA 2005
use of devices and home modifications
As described above, the pronounced effect of arthritis and musculoskeletal conditions on physical dysfunction does not always translate into difficulties in attending to personal and household care problems. People can make successful adjustments by using specialised devices or modifying their dwelling so that their roles and daily activities are not seriously affected. Indeed, the use of devices and appliances in performing daily activities is common among people with arthritis and musculoskeletal conditions.
Of the wide variety of devices reported as being used by persons with disability associated with arthritis and musculoskeletal conditions in the 2003 SDAC, the most common were those for showering, toileting and meal preparation (Table 6.5). These included long-handled reachers, shoe horns, sponges, brushes and special tooth brushes as well as specific types of medical and mobility aids (the latter being helpful in moving around the house and around places other than the place of residence).
Table 6.5: Use of devices in core activities for disability associated with arthritis and related disorders, 2003
Activity(a)
Males Females Persons
Number ’000 Per cent
Number ’000 Per cent
Number ’000 Per cent
Showering 18.2 10.7 52.9 13.5 71.1 12.7
Toileting 12.0 7.1 30.0 7.7 42.0 7.5
Dressing 7.1 4.2 10.1 2.6 17.2 3.1
Eating 0.4 0.2 2.9 0.7 3.3 0.6
Meal preparation 1.2 0.7 14.4 3.7 15.6 2.8
Transferring to and from bed(b) 9.2 5.4 21.3 5.5 30.5 5.4
Other 28.5 16.8 76.8 19.7 105.3 18.8
(a) The proportions are based on the total number of people with disability associated with arthritis and related disorders (M=169,572; F=390,532; N=560,104).
(b) Transferring to and from bed or chair.
Source: AIHW analysis of ABS 2003 Survey of Disability, Ageing and Carers CURF.
People with disability associated with arthritis and musculoskeletal conditions sometimes make structural changes and adaptations to their homes (Table 6.6). Most of these people are semi-ambulant. Nonetheless, steps and stairs present one of their greatest challenges. They also have limited grip strength and reach, and have pain on movement. The modern toilet may be too low and the vanity unit too high for them to use. In view of these difficulties, various types of home modifications are required.
About 16% of respondents with disability associated with arthritis and related disorders in the 2003 SDAC reported one or more modifications to their house. The proportion was greater among females (17%) than males (12%), probably reflecting differences in age distribution. The addition of hand grabs and rails was the most common home modification reported. Changes to toilets, baths and laundry were other major changes. Addition of ramps and a variety of structural changes to the building were also reported (Table 6.6).
Table 6.6: Home modifications for disability associated with arthritis and related disorders, 2003
Modification(a)
Males Females Persons
Number ’000 Per cent
Number ’000 Per cent
Number ’000 Per cent
Structural 1.4 0.8 5.7 1.5 7.1 1.3
Ramps 2.2 1.3 11.3 2.9 13.5 2.4
Toilet, bath, laundry 9.6 5.7 30.4 7.8 40.0 7.1
Hand grab and rails 13.5 8.0 42.6 10.9 56.1 10.0
Other changes 0.9 0.5 10.9 2.8 11.8 2.1
(a) The proportions are based on the total number of people with disability associated with arthritis and related disorders (M=169,572; F=390,532; N=560,104).
Source: AIHW analysis of ABS 2003 Survey of Disability, Ageing and Carers CURF.
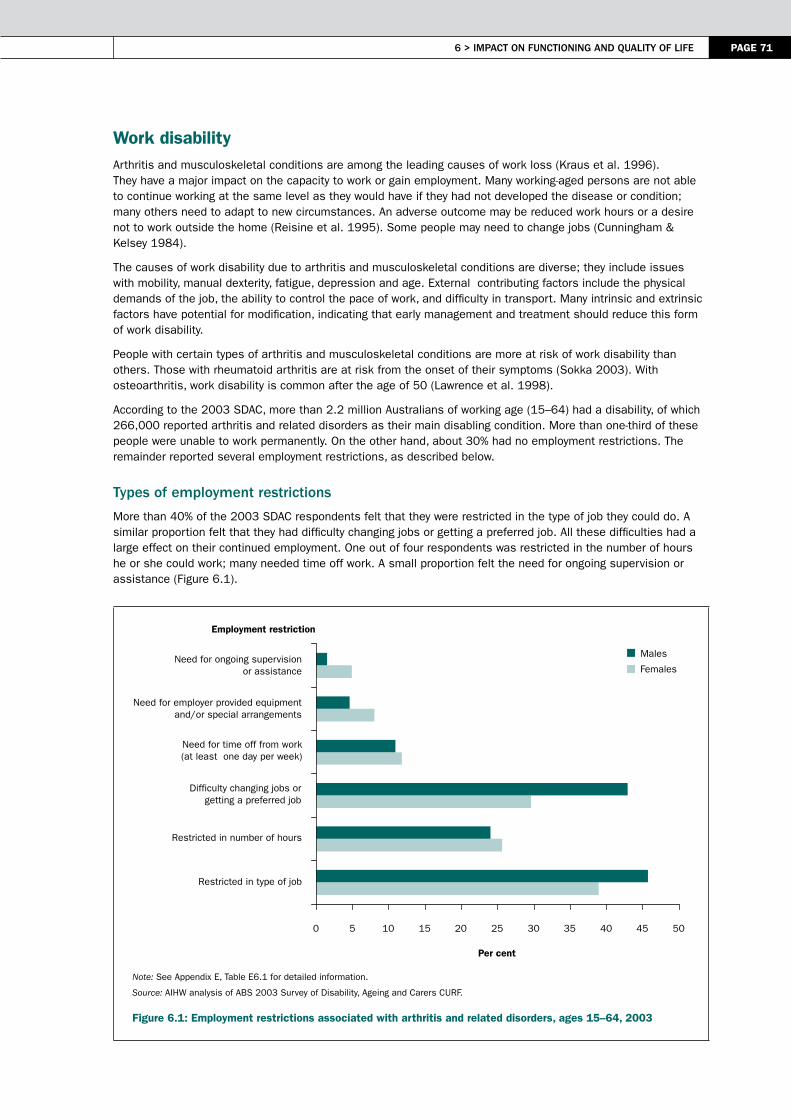
6 > imPAct on FunctioninG And QuAlitY oF liFe PAGE 71
Work disability Arthritis and musculoskeletal conditions are among the leading causes of work loss (Kraus et al. 1996). They have a major impact on the capacity to work or gain employment. Many working-aged persons are not able to continue working at the same level as they would have if they had not developed the disease or condition; many others need to adapt to new circumstances. An adverse outcome may be reduced work hours or a desire not to work outside the home (Reisine et al. 1995). Some people may need to change jobs (Cunningham & Kelsey 1984).
The causes of work disability due to arthritis and musculoskeletal conditions are diverse; they include issues with mobility, manual dexterity, fatigue, depression and age. External contributing factors include the physical demands of the job, the ability to control the pace of work, and difficulty in transport. Many intrinsic and extrinsic factors have potential for modification, indicating that early management and treatment should reduce this form of work disability.
People with certain types of arthritis and musculoskeletal conditions are more at risk of work disability than others. Those with rheumatoid arthritis are at risk from the onset of their symptoms (Sokka 2003). With osteoarthritis, work disability is common after the age of 50 (Lawrence et al. 1998).
According to the 2003 SDAC, more than 2.2 million Australians of working age (15–64) had a disability, of which 266,000 reported arthritis and related disorders as their main disabling condition. More than one-third of these people were unable to work permanently. On the other hand, about 30% had no employment restrictions. The remainder reported several employment restrictions, as described below.
types of employment restrictions
More than 40% of the 2003 SDAC respondents felt that they were restricted in the type of job they could do. A similar proportion felt that they had difficulty changing jobs or getting a preferred job. All these difficulties had a large effect on their continued employment. One out of four respondents was restricted in the number of hours he or she could work; many needed time off work. A small proportion felt the need for ongoing supervision or assistance (Figure 6.1).
Note: See Appendix E, Table E6.1 for detailed information.
Source: AIHW analysis of ABS 2003 Survey of Disability, Ageing and Carers CURF.
Figure 6.1: Employment restrictions associated with arthritis and related disorders, ages 15–64, 2003
Males
Females
Employment restriction
0 5 10 15 20 25 30 35 40 45 50
Restricted in type of job
Restricted in number of hours
Difficulty changing jobs orgetting a preferred job
Need for time off from work(at least one day per week)
Need for employer provided equipmentand/or special arrangements
Need for ongoing supervisionor assistance
Per cent

PAGE 72 Arthritis And musculoskeletAl conditions in AustrAliA 2005
Proportionately more males than females with arthritis and related disorders as their main disabling condition had employment restrictions (Figure 6.2). This is due, of course, to the fact that more males work. No clear age-specific pattern was noted in these restrictions.
Notes:
1. See Appendix E, Table E6.2 for detailed information.
2. Per cent of persons with disability associated with arthritis and related disorders.
Source: AIHW analysis of ABS 2003 Survey of Disability, Ageing and Carers CURF.
Figure 6.2: Age-specific employment restrictions associated with arthritis and related disorders, ages 15–64, 2003
occupational modifications
Many of the employment restrictions or problems at work could be reduced by effective workplace accommodation. Several potential work-related modifications have been identified that should help people with arthritis and related disorders stay employed (Yelin et al. 1987).
Respondents to the 2003 SDAC indicated that many employers have made arrangements to allow them to continue with their work. The most common adaptations made were providing special equipment, special training, and altering the duties of the job (Figure 6.3).
These employer-made arrangements correspond well with the needs outlined by 2003 SDAC respondents. Between 5–10% of respondents with employment restrictions indicated a need for special employer arrangements or equipment (Figure 6.3). Almost 4% of the male and 2% of the female respondents reported those arrangements made by their employer. Many were also provided training/retraining to suit their jobs. Some were allocated new duties.
Males
Females
Per cent
0
10
20
30
40
50
60
70
80
90
100
15–24 25–34 35–44 45–54 55–64
Age group (years)
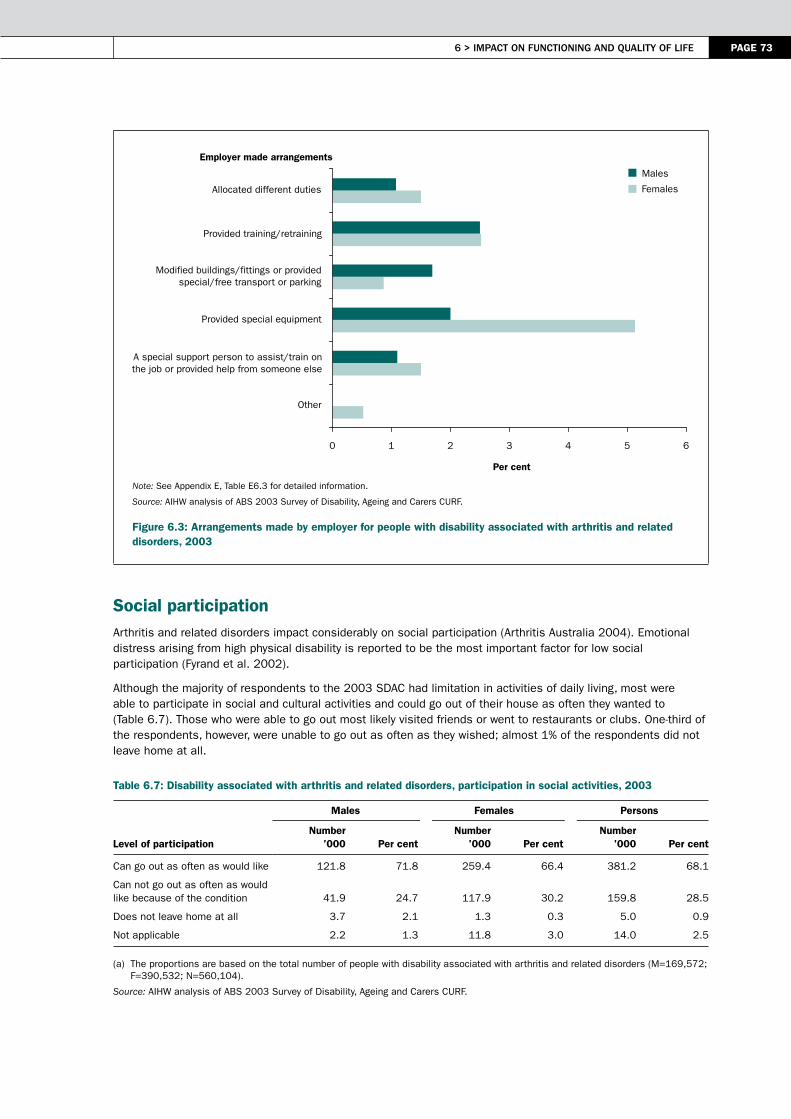
6 > imPAct on FunctioninG And QuAlitY oF liFe PAGE 73
Note: See Appendix E, Table E6.3 for detailed information.
Source: AIHW analysis of ABS 2003 Survey of Disability, Ageing and Carers CURF.
Figure 6.3: Arrangements made by employer for people with disability associated with arthritis and related disorders, 2003
Social participationArthritis and related disorders impact considerably on social participation (Arthritis Australia 2004). Emotional distress arising from high physical disability is reported to be the most important factor for low social participation (Fyrand et al. 2002).
Although the majority of respondents to the 2003 SDAC had limitation in activities of daily living, most were able to participate in social and cultural activities and could go out of their house as often they wanted to (Table 6.7). Those who were able to go out most likely visited friends or went to restaurants or clubs. One-third of the respondents, however, were unable to go out as often as they wished; almost 1% of the respondents did not leave home at all.
Table 6.7: Disability associated with arthritis and related disorders, participation in social activities, 2003
Level of participation
Males Females Persons
Number ’000 Per cent
Number ’000 Per cent
Number ’000 Per cent
Can go out as often as would like 121.8 71.8 259.4 66.4 381.2 68.1
Can not go out as often as would like because of the condition 41.9 24.7 117.9 30.2 159.8
28.5
Does not leave home at all 3.7 2.1 1.3 0.3 5.0 0.9
Not applicable 2.2 1.3 11.8 3.0 14.0 2.5
(a) The proportions are based on the total number of people with disability associated with arthritis and related disorders (M=169,572; F=390,532; N=560,104).
Source: AIHW analysis of ABS 2003 Survey of Disability, Ageing and Carers CURF.
Employer made arrangements
0 1 2 3 4 5 6
Other
A special support person to assist/train onthe job or provided help from someone else
Provided special equipment
Modified buildings/fittings or providedspecial/free transport or parking
Provided training/retraining
Allocated different duties
Per cent
Males
Females

PAGE 74 Arthritis And musculoskeletAl conditions in AustrAliA 2005
There is much variation in the extent to which people with arthritis or specific type of musculoskeletal condition participate socially. People with rheumatoid arthritis are generally more restricted. As rheumatoid arthritis progresses, it takes a considerable toll on the ability of those affected to perform valued life activities. Several studies report negative influence the disease has on social participation within the first few years of its onset (van Jaarsveld et al. 1998).
Informal careDepending on the severity of disability, many people require help and informal care from other family members. Informal care is often perceived to be the best option for those who require assistance with activities of daily living. Family members are the main providers of help or informal care. According to the 2003 SDAC, around 52,018 primary carers reported providing care to people with disability associated with arthritis and related disorders.
Although many more females than males take on a primary carer’s role, a slightly larger proportion of males took on the task of caring for a person with disability due to arthritis and musculoskeletal conditions (54% of males compared with 46% of females). Of those primary carers, 57% were aged 15–64 years. Almost two-thirds (66%) of males and one-third (34%) of females were caring for their partners. Another 26% were caring for a parent. Carers were sometimes living with the care recipient in the same house (20%) and a majority (68%) had spent at least 10 years in the role.
Many carers (42%) tended to provide longer hours of care per week—40 hours or more. Almost 35% tended to care for shorter periods (less than 20 hours). Carers were providing ongoing assistance mainly with core-activities of daily living: more than 80% helped with household tasks and mobility, and nearly three-quarters with self-care, meal preparation and transport.
The caring intensity may vary, however, according to both the severity and nature of activity restrictions and to the age of the care recipient, thus making heavy demands on the carer’s health, socially and economically (Box 6.1). The constancy and time consuming nature of long-term caring may lead to carer stress (CAA 2000).
Box 6.1: Factors potentially contributing to carer stress
• physical and psychological demands placed on carer in caring role• advancing age of many carers • the serious health conditions of many carers
– disability– activity restrictions
Although many primary carers (31%) reported that they were satisfied with the nature of their caring role (26% felt that caring had strengthened their relationship with the care recipient), a large number reported that this role had changed their overall state of wellbeing (57%), and that it had affected their relationship with co-residents and friends (Table 6.8). A large proportion of carers did not report any change to their income or financial situation (47% and 49%, respectively) as a result of their caring role. However, a sizeable minority (14%) stated that their income had decreased, and another 27% reported incurring extra expenses. Almost 26% reported having difficulty meeting everyday living costs.
As most of the carers were partners or spouses, and less likely to have other caring responsibilities, they had relatively few unmet needs. For a sizeable minority of cares items of significant unmet need clustered around aspects to do with receiving assistance in their caring role—during week days (10%) and weekends (7%) and in respect to respite care: short notice or irregular basis (9%), and on weekends (7%).
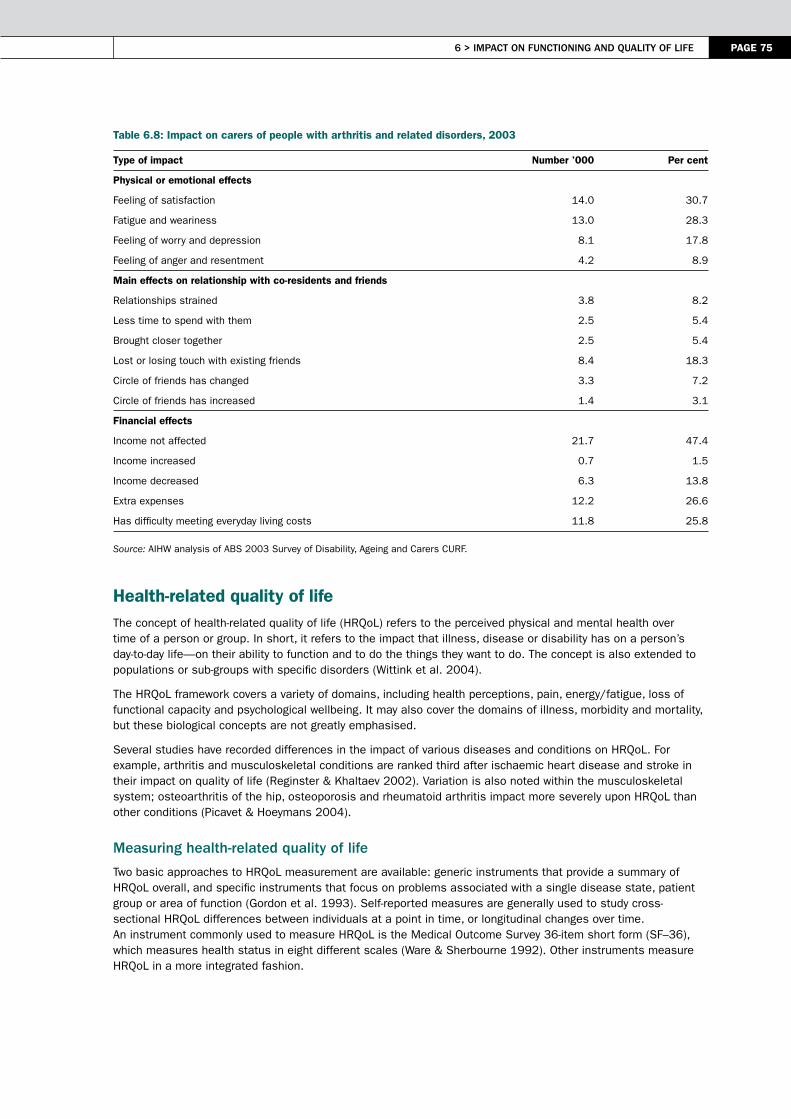
6 > imPAct on FunctioninG And QuAlitY oF liFe PAGE 75
Table 6.8: Impact on carers of people with arthritis and related disorders, 2003
Type of impact Number ’000 Per cent
Physical or emotional effects
Feeling of satisfaction 14.0 30.7
Fatigue and weariness 13.0 28.3
Feeling of worry and depression 8.1 17.8
Feeling of anger and resentment 4.2 8.9
Main effects on relationship with co-residents and friends
Relationships strained 3.8 8.2
Less time to spend with them 2.5 5.4
Brought closer together 2.5 5.4
Lost or losing touch with existing friends 8.4 18.3
Circle of friends has changed 3.3 7.2
Circle of friends has increased 1.4 3.1
Financial effects
Income not affected 21.7 47.4
Income increased 0.7 1.5
Income decreased 6.3 13.8
Extra expenses 12.2 26.6
Has difficulty meeting everyday living costs 11.8 25.8
Source: AIHW analysis of ABS 2003 Survey of Disability, Ageing and Carers CURF.
Health-related quality of lifeThe concept of health-related quality of life (HRQoL) refers to the perceived physical and mental health over time of a person or group. In short, it refers to the impact that illness, disease or disability has on a person’s day-to-day life—on their ability to function and to do the things they want to do. The concept is also extended to populations or sub-groups with specific disorders (Wittink et al. 2004).
The HRQoL framework covers a variety of domains, including health perceptions, pain, energy/fatigue, loss of functional capacity and psychological wellbeing. It may also cover the domains of illness, morbidity and mortality, but these biological concepts are not greatly emphasised.
Several studies have recorded differences in the impact of various diseases and conditions on HRQoL. For example, arthritis and musculoskeletal conditions are ranked third after ischaemic heart disease and stroke in their impact on quality of life (Reginster & Khaltaev 2002). Variation is also noted within the musculoskeletal system; osteoarthritis of the hip, osteoporosis and rheumatoid arthritis impact more severely upon HRQoL than other conditions (Picavet & Hoeymans 2004).
measuring health-related quality of life
Two basic approaches to HRQoL measurement are available: generic instruments that provide a summary of HRQoL overall, and specific instruments that focus on problems associated with a single disease state, patient group or area of function (Gordon et al. 1993). Self-reported measures are generally used to study cross-sectional HRQoL differences between individuals at a point in time, or longitudinal changes over time. An instrument commonly used to measure HRQoL is the Medical Outcome Survey 36-item short form (SF–36), which measures health status in eight different scales (Ware & Sherbourne 1992). Other instruments measure HRQoL in a more integrated fashion.

PAGE 76 Arthritis And musculoskeletAl conditions in AustrAliA 2005
At national level, two useful sources of information on HRQoL are the NHS and the SDAC. The NHS does not cover people in hospitals and institutions nor the homeless. The SDAC, on the other hand, also covers nursing homes and other similar institutions. The terms and definitions used in NHS generic health outcomes assessment are given in Box 6.2. Respondents to the South Australian Health Omnibus Survey were also administered a validated Australian version of the SF-36 questionnaire which provides some insight into HRQoL in relation to arthritis in a regional population (Hill et al. 1999).
Box 6.2: Terms and definitions employed in NHS generic health outcomes assessment
Term Definition
Item Satisfied with life
Scale 7-point categorical scale (delighted, pleased, mostly satisfied, mixed, mostly dissatisfied, unhappy, terrible)
Domain Quality of life
Item Self-perceived health status
Scale 5-point scale (excellent, very good, good, fair, poor)
Domain Health status
Health-related quality of life scores
Results from the 2001 NHS indicate that people with arthritis and musculoskeletal conditions are mostly satisfied or pleased with the quality of their life. Those with osteoarthritis perceive their quality of life to be somewhat better than those with rheumatoid arthritis or osteoporosis (Figure 6.4). A large proportion of people with rheumatoid arthritis, in particular, are dissatisfied with their quality of life.
A more comprehensive analysis of HRQoL in relation to arthritis in South Australia reveals significantly lower SF-36 scores for respondents with arthritis compared with those for the rest of the population across all the scales (Hill et al. 1999; March & Bagga 2004). Other studies have indicated that arthritis and musculoskeletal conditions at onset have a marked and deleterious effect on the quality of life in the physical domain, but lesser effects on social and mental functioning (Roux et al. 2005).
Notes
1. See Appendix E, Table E6.4 for detailed information.
2. Age-standardised to the 2001 Australian population.
Source: AIHW analysis of ABS 2001 National Health Survey CURF.
Figure 6.4: Self-reported quality of life in persons with arthritis and musculoskeletal conditions, 2001
Delighted Pleased Mostly satisfied Mixed Mostly disatisfied Unhappy Terrible
0 20 40 60 80 100
Osteoarthritis
Rheumatoid arthritis
Osteoporosis
All musculoskeletal
All persons
Per cent

6 > imPAct on FunctioninG And QuAlitY oF liFe PAGE 77
Self-reported health statusThe chronic, pervasive nature of arthritis and other musculoskeletal conditions is likely to have a strong impact upon people’s perception of their own health. The self-reported health status, therefore, is a powerful predictor of psychosocial health.
The self-assessment of health by persons with arthritis and musculoskeletal conditions was considerably poorer than that reported by the community at large, in the 2001 NHS. In that survey, 37% of persons with these diseases and conditions, ages 18 and over, rated their health to be excellent/very good, and 34% as good (Table 6.9). However, a little over 20% described the state of their health as fair; less than 9% rated their health as poor.
Table 6.9: Self-reported health status by persons with arthritis and musculoskeletal conditions, ages 18 and over, 2001
Status
Males Females People
Arthritis or musculo-skeletal
conditions
Total Australian population
Arthritis or musculo- skeletal
conditions
Total Australian population
Arthritis or musculo- skeletal
conditions
Total Australian population
Per cent
Excellent/ very good 37.2 48.9 37.2 51.7 37.2 50.3
Good 34.1 32.3 33.5 29.6 33.8 30.9
Fair 20.4 13.7 20.5 13.9 20.4 13.8
Poor 8.3 5.1 8.8 4.8 8.5 5.0
Notes1. Rates are age-standardised to the 2001 Australian population. 2. People in nursing homes and hostels were not included in the survey.
Source: AIHW analysis of ABS 2001 National Health Survey CURF.
The proportion of people rating their health as fair or poor was considerably larger among those with arthritis or a musculoskeletal condition compared with the general community. The rate ratios for ‘fair’ and ‘poor’ health in persons with arthritis and musculoskeletal conditions were 1.5 and 1.7, respectively.
The distribution of responses was similar for both sexes but varied considerably by age group (Figure 6.5). Contrary to the trend in the population as a whole (AIHW 2004), the proportion of people with arthritis and musculoskeletal conditions reporting poor health decreased with age. The proportion of persons reporting their health as fair was also the largest in the age groups 18–34 and 75 and over.
A major reason for the reporting of ‘poor’ health by persons with arthritis and musculoskeletal conditions is physical impairments leading to functional limitations. The presence of multiple conditions is also likely to be associated with poor health status, resulting in more severe experience of disability.
Most people with arthritis and musculoskeletal conditions are older people. These people are more likely to have other long-term conditions such as glaucoma, total hearing and vision loss and heart disease. All these conditions may contribute to the poor perception of health status.
The greater labelling of their health as ‘poor’ by young adults with arthritis and musculoskeletal conditions (age 18–34) seems paradoxical. Arthritis and musculoskeletal conditions are generally associated with ageing; for young people the presence of these diseases and conditions can therefore be stigmatising. Also, the psychological impact of arthritis and musculoskeletal conditions is high at first onset.
Not many people in the age group 75 and over report their health as ‘poor’, although the proportion of those reporting their health as ‘fair’ is large—the presence of arthritis and musculoskeletal conditions notwithstanding. This is more likely to be due to a healthy ageing effect as the NHS sample is only community based. Those in the age group 55–64 report excellent/very good health much less often and state their health as being good.
disease-specific variation
Large differences are noted in the quality of life between people with osteoarthritis, rheumatoid arthritis and osteoporosis. Those with osteoarthritis are much more likely to report their health as being excellent/very good and well satisfied with the quality of their life. Persons with rheumatoid arthritis, on the hand, are likely to score worst against both these measures (Figure 6.6).
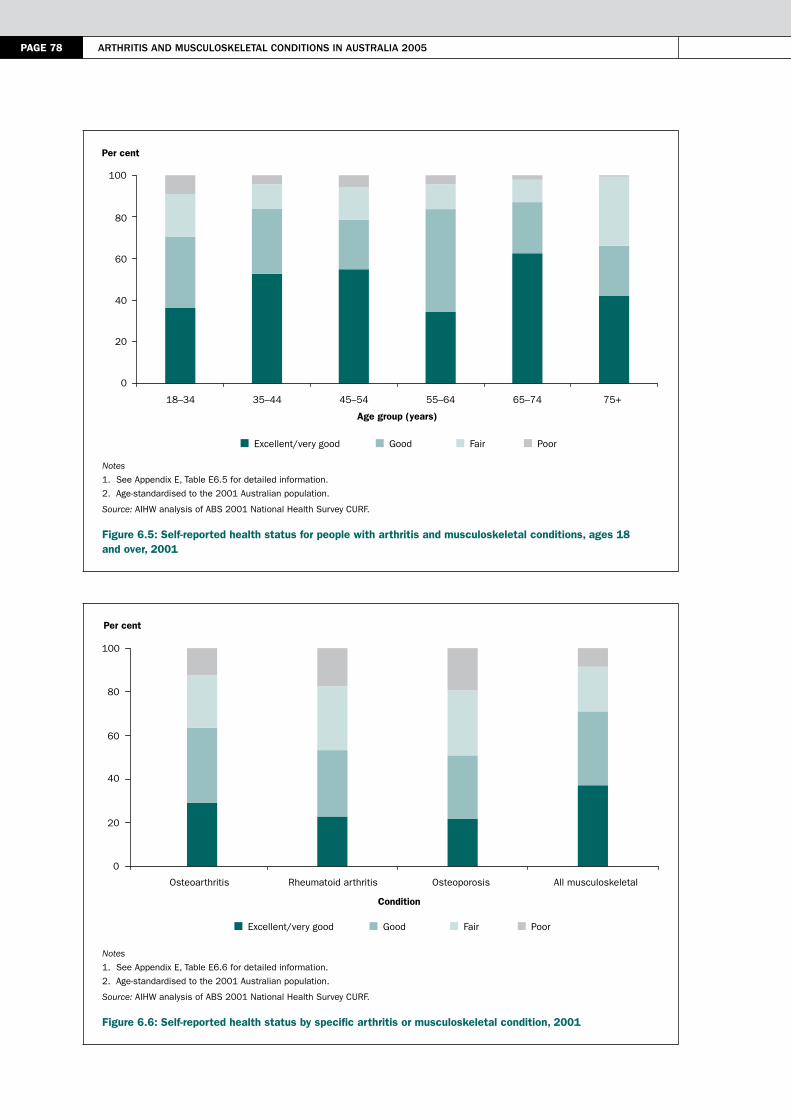
PAGE 78 Arthritis And musculoskeletAl conditions in AustrAliA 2005
Notes
1. See Appendix E, Table E6.5 for detailed information.
2. Age-standardised to the 2001 Australian population.
Source: AIHW analysis of ABS 2001 National Health Survey CURF.
Figure 6.5: Self-reported health status for people with arthritis and musculoskeletal conditions, ages 18 and over, 2001
Notes
1. See Appendix E, Table E6.6 for detailed information.
2. Age-standardised to the 2001 Australian population.
Source: AIHW analysis of ABS 2001 National Health Survey CURF.
Figure 6.6: Self-reported health status by specific arthritis or musculoskeletal condition, 2001
Excellent/very good Good Fair Poor
0
20
40
60
80
100
18–34 35–44 45–54 55–64 65–74 75+
Age group (years)
Per cent
Excellent/very good Good Fair Poor
0
20
40
60
80
100
Osteoarthritis Rheumatoid arthritis Osteoporosis All musculoskeletal
Condition
Per cent
6 > imPAct on FunctioninG And QuAlitY oF liFe PAGE 79
The illness associated with osteoarthritis varies in intensity but tends to be self-limited, and usually remits leaving little residual effect. Even at the height of illness, patients often state that they would be well were it not for the pain in the joint(s) involved. Nonetheless, patients with osteoarthritis suffer limitation in their activities and reduced participation (WHO Scientific Group 2003). In particular, osteoarthritis of the hip has a strong impact upon the health of the afflicted person.
Rheumatoid arthritis, on the other hand, has a substantial impact on quality of life, owing to its painful and disabling nature. It impinges significantly on comfort, physical function, social and emotional relationships and mental health (Hill et al. 1999; Rupp et al. 2004). The afflicted are chronically ill, easily fatigued, suffer stiffness and have generalised weakness. Joint pain and deformity are other features of rheumatoid arthritis. But the cardinal feature is the pervasive sense of being sick for long periods.
In osteoporosis, the ill health related to pain and the long-term disability associated with fragility fractures significantly impact on the quality of life, leading to decreased physical, psychological and social function (Grigoryan et al. 2003). For example:
• In the case of hip fractures, the quality of life is significantly lower than normal in regard to physical function and roles, and social participation, for up to two years after the event (Hallberg et al. 2004).
• In the case of vertebral fractures, both physical and mental domains of health are influenced (Hallberg et al. 2004; Cockerill et al. 2004). The impact of vertebral fractures includes acute and chronic back pain, limitation of physical activity, spinal deformity, loss of independence and loss of height (Jensen & Harder 2004).
These impacts, in turn, lead to a loss of functional capacity and an inability to participate in recreational activities. This can result in social isolation, depression and low self-esteem (Geusens 2003).
health and disability
People with a disability tend to report lower levels of health than the general population. In the 2003 SDAC, poor health was reported by 8% of the people reporting arthritis and related disorders as their main disabling condition. This compares with poor health reported by 8% of SDAC respondents with a disability, but by only 0.01% of those without a disability.
Co-morbidity and disabilityMuch of the information about the effects of arthritis and musculoskeletal conditions on activity limitations and functional restrictions, and their psychosocial impact, has been based on cross-sectional data. Although the information provided pertains only to respondents reporting arthritis or a musculoskeletal condition as their main disabling condition, the limitations and restrictions reported are not necessarily due to these particular diseases and conditions. A large proportion of these respondents, especially those in the higher age groups, also had other long-term or chronic conditions that would have contributed to various limitations.
The 2003 SDAC data indicate the presence of glaucoma, hearing loss, vision impairment, heart disease and diabetes, each in more than one out of 10 respondents who had arthritis and related disorders as their main disabling condition (Figure 6.7). Back problems, stroke and depression were other common co-morbidities.
Some of these long-term health conditions contribute to greater amount of difficulty in physical functions, personal care and household care—limitations and restrictions generally associated with arthritis and musculoskeletal conditions. The increased deficit is in physical functions such as walking, reaching, stooping etc., and in physical work that requires endurance and strength. For example, heart disease is associated with difficulties in activities requiring endurance. Similarly, visual impairments can compromise the ability to perform many activities of daily living.

PAGE 80 Arthritis And musculoskeletAl conditions in AustrAliA 2005
Note: See Appendix E, Table E6.7 for detailed information.
Source: AIHW analysis of ABS 2003 Survey of Disability, Ageing and Carers CURF.
Figure 6.7: Long-term conditions reported by people with arthritis and related disorders as the main disabling condition, 2003
ReferencesABS (Australian Bureau of Statistics) 2004. Disability Australia. ABS Cat. No. 4446.0. Canberra: ABS.
AIHW (Australian Institute of Health and Welfare) 2003. Australia’s welfare 2003. AIHW Cat. No. AUS 41. Canberra: AIHW.
AIHW 2004. Australia’s health 2004. AIHW Cat. No. AUS 44. Canberra: AIHW.
Arthritis Australia 2004. The voice of arthritis: a social impact study of arthritis in Australia. Sydney: Arthritis Australia.
CAA (Carers Association of Australia) 2000. Results of the 1999 national survey of carer health and wellbeing. Canberra: CAA and Department of Health and Aged Care.
Cockerill W, Lunt M, Silman AJ et al. 2004. Health-related quality of life and radiographic vertebral fracture. Osteoporosis International 15:113–9.
Crimmins EM 2004. Trends in the health of the elderly. Annual Review of Public Health 25:79–98.
Cunningham LS & Kelsey JL 1984. Epidemiology of musculoskeletal impairments and associated disability. American Journal of Public Health 74:574–9.
Fyrand L, Moum T, Finset A et al. 2002. The impact of disability and disease duration on social support of women with rheumatoid arthritis. Journal of Behavioural Medicine 25:251–68.
Geusens P 2003. Osteoporosis: clinical features. In: Hochberg MC, Silman AJ, Smolen JS et al. (eds). Rheumatology, 3rd ed. London: Mosby.
Gordon H, Guyatt DHF & Donald LP 1993. Measuring health-related quality of life. Annals of Internal medicine 118:622–9.
0
2
4
6
8
10
12
14
Long-term condition
Stro
ke
Parkins
on’s
disea
se
Hyper
tens
ion
Asth
ma
Depre
ssion
Back
pro
blem
Canc
er
Demen
tia
Glauco
ma
Tota
l hea
ring l
oss
Tota
l visi
on lo
ss
Diabet
es
Heart
disea
se
Per cent
6 > imPAct on FunctioninG And QuAlitY oF liFe PAGE 81
Grigoryan M, Guermazi A, Roemer FW et al. 2003. Recognizing and reporting osteoporotic vertebral fractures. European Spine Journal 12(Supplement 2):S104–S112.
Hallberg I, Rosenqvist AM, Kartous L et al. 2004. Health-related quality of life after osteoporotic fractures. Osteoporosis International 15:834–41.
Hill C, Parsons J, Taylor A et al. 1999. Health related quality of life in a population sample with arthritis. Journal of Rheumatology 26:2029–35.
Jensen A & Harder I 2004. The osteoporotic pain experience. Osteoporosis International 15:204–8.
Kelsey JL & Hochberg MC 1988: Epidemiology of chronic musculoskeletal disorders. Annual Review of Public Health 9:379–401.
Kraus LE, Stoddard S & Gilmartin D 1996. Chartbook on disability in the United States, 1996. An InfoUse report. Washington DC: US National Institute of Disability and Rehabilitation Research.
Lawrence RC, Helmick CG, Arnett FC et al. 1998. Estimates of the prevalence of arthritis and selected musculoskeletal disorders in the United States. Arthritis and Rheumatism 43:778–99.
Leveille SG, Ling S, Hochberg MC et al. 2001. Widespread musculoskeletal pain and the progression of disability in older disabled women. Annals of Internal Medicine 135:1038–46.
March L & Bagga H 2004. Epidemiology of osteoarthritis in Australia. Medical Journal of Australia 180(Supplement 5):S6–S10.
McDuffie FC, Felts WR, Hochberg MC et al. 1996. Arthritis and musculoskeletal diseases. In Amler RW & Dull HB (eds). Closing the gap: the burden of unnecessary illness. New York: Oxford University Press, 19–29.
Picavet HSJ & Hoeymans N 2004. Health related quality of life in multiple musculoskeletal diseases: SF-36 and EQ-5D in the DMC3 study. Annals of the Rheumatic Diseases 63:723–9.
Reginster JY & Khaltaev NG 2002. Introduction and WHO perspective on the global burden of musculoskeletal conditions. Rheumatology 41(Supplement 1):1–2.
Reisine S, McQuillan J & Fifield J 1995. Predictors of work disability in rheumatoid arthritis patients. A five-year followup. Arthritis and Rheumatism 38:1630–7.
Roux CH, Guillemin F, Boini S et al. 2005. Impact of musculoskeletal disorders on quality of life: an inception cohort study. Annals of the Rheumatic Diseases 64:606–11.
Rupp I, Boshuizen H, Jacobi C et al. 2004. Co-morbidity in patients with rheumatoid arthritis: effect on health-related quality of life. Journal of Rheumatology 31:58–65.
Sokka T 2003. Work disability in early rheumatoid arthritis. Clinical and Experimental Rheumatoid 21(Supplement 31):S71–S74.
Van Jaarsveld CH, Jacobs JW, Schrijvers AJ et al. 1998. Effects of rheumatoid arthritis on employment and social participation during the first years of disease in The Netherlands. British Journal of Rheumatology 37:848–53.
Ware JE Jr & Sherbourne CD 1992. The MOS 36-item short-form health survey (SF-36). Medical Care 30:473–83.
WHO (World Health Organization) 2001. International classification of functioning, disability and health. Geneva: WHO.
WHO Scientific Group 2003. The burden of musculoskeletal conditions at the start of the new millennium: report of a WHO Scientific Group. WHO Technical Report Series No. 919. Geneva: WHO.
Wittink H, Goudas LC, Strassels S et al. 2004. Outcome measurement in pain medicine. In: Warfield CA & Bajwa ZH (eds). Principles and practice of pain medicine. New York: McGraw Hill, 69–82.
Yelin E, Lubeck D, Holman H et al. 1987. The impact of rheumatoid arthritis and osteoarthritis: the activities of patients with rheumatoid arthritis and osteoarthritis compared to controls. Journal of Rheumatology 14:710–7.


7 > heAlth eXPenditure PAGE 83
7 > Health expenditure
KEy POINTS
• Arthritis and musculoskeletal conditions accounted for the third largest component of health expenditure in Australia in 2000–01, with an estimated expenditure of $4.6 billion.
• These high costs mainly are due to the long duration, high levels of associated disability and widespread prevalence of these diseases and conditions within the population.
• Hospital services accounted for the largest proportion (40%) of expenditure for arthritis and musculoskeletal conditions, followed by out-of-hospital medical services (19%).
• Between 1993–94 and 2000–01, the expenditure for arthritis and musculoskeletal conditions has increased at an average annual rate of 4.3%. The greatest growth in expenditure was for pharmaceuticals.
• Combined expenditure for osteoarthritis, rheumatoid arthritis and osteoporosis alone was $1.6 billion in 2000–01. Osteoarthritis expenditure accounted for 26% of the expenditure for arthritis and musculoskeletal conditions, followed by rheumatoid arthritis (5%) and osteoporosis (5%).
• Hospital services accounted for the greatest component of expenditure on osteoarthritis (48%), followed by aged care homes (23%).
• The expenditure for rheumatoid arthritis was relatively similar across the various health care sectors except on research.
• Expenditure on osteoporosis was mainly for post-fracture treatment and the ongoing need for care; pharmaceuticals accounted for the largest component followed by aged care homes.
Chapters 2 to 6 have provided an overview of arthritis and musculoskeletal conditions and their impact in terms of morbidity, disability and mortality in Australia. They also described the range of health services accessed for their management. This chapter provides an overview of the expenditure made to purchase these services.
Health expenditure here refers to costs incurred for the prevention, diagnosis and treatment of arthritis and musculoskeletal conditions. It also covers expenditure for the rehabilitation of people with these diseases and conditions. Funding for these services comes from both government sources and from non–government sources (including from private health insurance and individuals). This chapter does not cover non-health-care costs or indirect costs that accrue to patients, such as travel costs, social and economic burden on carers and family, and lost wages. Intangibles such as reduced quality of life are not given a monetary value either.
Australia spent $60.9 billion on health services in 2000–01, almost 9.1% of its GDP, at an average cost of $2,602 per person (AIHW 2004). Arthritis and musculoskeletal conditions constituted the third largest component of this expenditure, after cardiovascular diseases and nervous system disorders (Figure 7.1), with an estimated expenditure of $4.6 billion (AIHW 2005). This equates to 9.2% of allocated health expenditure. Their long duration, high levels of disability and reduced functionality, in combination with their common prevalence, result in high costs for these conditions (Harris et al. 1998; AIHW: Mathers & Penm 1999; Access Economics 2001a, b; 2005).
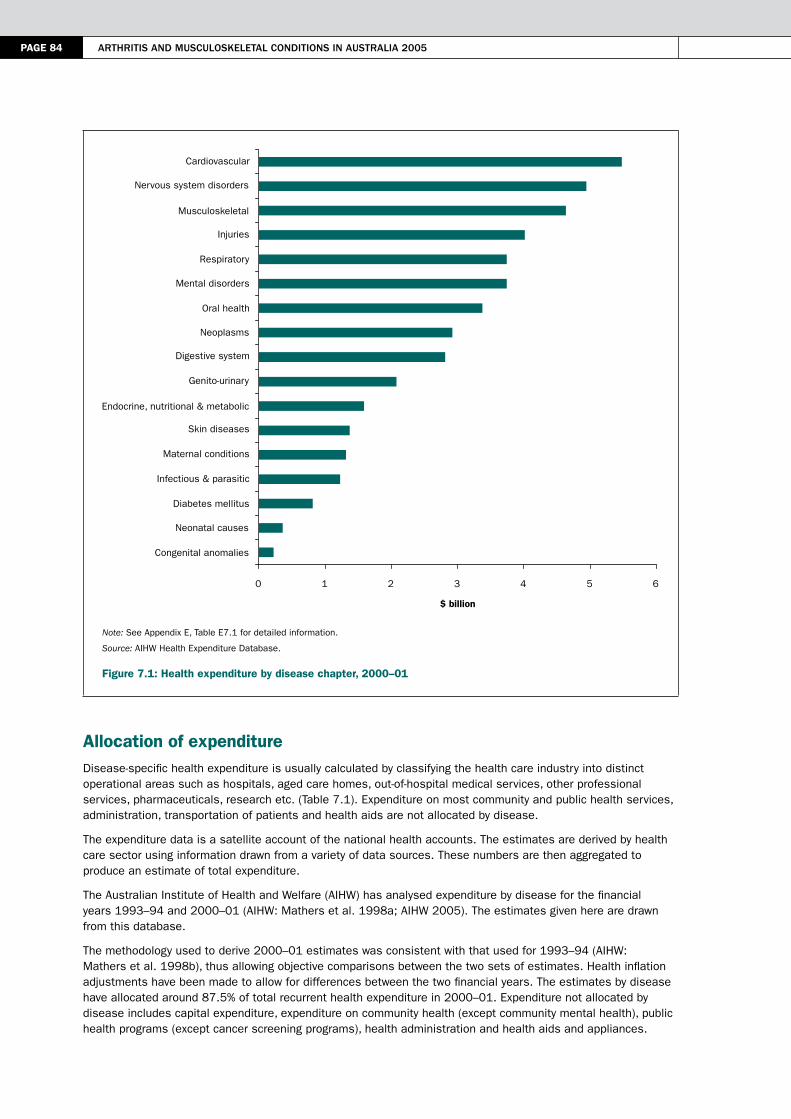
PAGE 84 Arthritis And musculoskeletAl conditions in AustrAliA 2005
Note: See Appendix E, Table E7.1 for detailed information.
Source: AIHW Health Expenditure Database.
Figure 7.1: Health expenditure by disease chapter, 2000–01
Allocation of expenditureDisease-specific health expenditure is usually calculated by classifying the health care industry into distinct operational areas such as hospitals, aged care homes, out-of-hospital medical services, other professional services, pharmaceuticals, research etc. (Table 7.1). Expenditure on most community and public health services, administration, transportation of patients and health aids are not allocated by disease.
The expenditure data is a satellite account of the national health accounts. The estimates are derived by health care sector using information drawn from a variety of data sources. These numbers are then aggregated to produce an estimate of total expenditure.
The Australian Institute of Health and Welfare (AIHW) has analysed expenditure by disease for the financial years 1993–94 and 2000–01 (AIHW: Mathers et al. 1998a; AIHW 2005). The estimates given here are drawn from this database.
The methodology used to derive 2000–01 estimates was consistent with that used for 1993–94 (AIHW: Mathers et al. 1998b), thus allowing objective comparisons between the two sets of estimates. Health inflation adjustments have been made to allow for differences between the two financial years. The estimates by disease have allocated around 87.5% of total recurrent health expenditure in 2000–01. Expenditure not allocated by disease includes capital expenditure, expenditure on community health (except community mental health), public health programs (except cancer screening programs), health administration and health aids and appliances.
0 1 2 3 4 5 6
Congenital anomalies
Neonatal causes
Diabetes mellitus
Infectious & parasitic
Maternal conditions
Skin diseases
Endocrine, nutritional & metabolic
Genito-urinary
Digestive system
Neoplasms
Oral health
Mental disorders
Respiratory
Injuries
Musculoskeletal
Nervous system disorders
Cardiovascular
$ billion
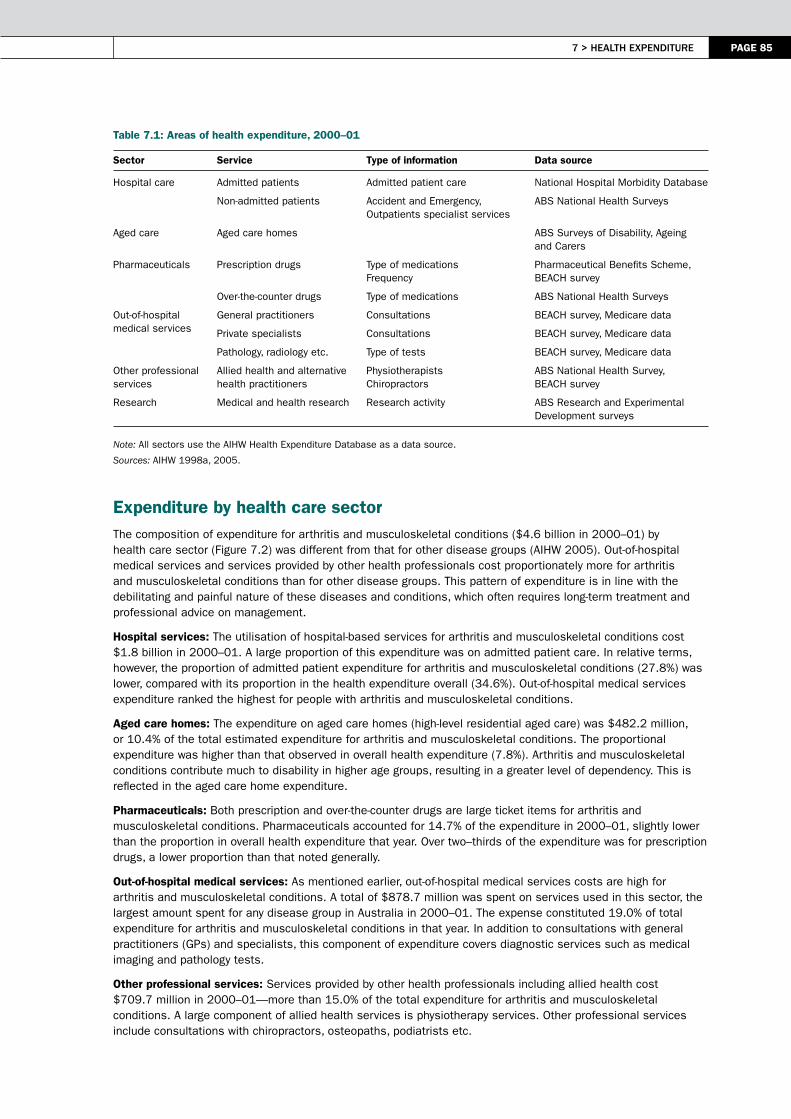
7 > heAlth eXPenditure PAGE 85
Table 7.1: Areas of health expenditure, 2000–01
Sector Service Type of information Data source
Hospital care Admitted patients Admitted patient care National Hospital Morbidity Database
Non-admitted patients Accident and Emergency, Outpatients specialist services
ABS National Health Surveys
Aged care Aged care homes ABS Surveys of Disability, Ageing and Carers
Pharmaceuticals Prescription drugs Type of medications Frequency
Pharmaceutical Benefits Scheme, BEACH survey
Over-the-counter drugs Type of medications ABS National Health Surveys
Out-of-hospital medical services
General practitioners Consultations BEACH survey, Medicare data
Private specialists Consultations BEACH survey, Medicare data
Pathology, radiology etc. Type of tests BEACH survey, Medicare data
Other professional services
Allied health and alternative health practitioners
Physiotherapists Chiropractors
ABS National Health Survey, BEACH survey
Research Medical and health research Research activity ABS Research and Experimental Development surveys
Note: All sectors use the AIHW Health Expenditure Database as a data source.
Sources: AIHW 1998a, 2005.
Expenditure by health care sectorThe composition of expenditure for arthritis and musculoskeletal conditions ($4.6 billion in 2000–01) by health care sector (Figure 7.2) was different from that for other disease groups (AIHW 2005). Out-of-hospital medical services and services provided by other health professionals cost proportionately more for arthritis and musculoskeletal conditions than for other disease groups. This pattern of expenditure is in line with the debilitating and painful nature of these diseases and conditions, which often requires long-term treatment and professional advice on management.
Hospital services: The utilisation of hospital-based services for arthritis and musculoskeletal conditions cost $1.8 billion in 2000–01. A large proportion of this expenditure was on admitted patient care. In relative terms, however, the proportion of admitted patient expenditure for arthritis and musculoskeletal conditions (27.8%) was lower, compared with its proportion in the health expenditure overall (34.6%). Out-of-hospital medical services expenditure ranked the highest for people with arthritis and musculoskeletal conditions.
Aged care homes: The expenditure on aged care homes (high-level residential aged care) was $482.2 million, or 10.4% of the total estimated expenditure for arthritis and musculoskeletal conditions. The proportional expenditure was higher than that observed in overall health expenditure (7.8%). Arthritis and musculoskeletal conditions contribute much to disability in higher age groups, resulting in a greater level of dependency. This is reflected in the aged care home expenditure.
Pharmaceuticals: Both prescription and over-the-counter drugs are large ticket items for arthritis and musculoskeletal conditions. Pharmaceuticals accounted for 14.7% of the expenditure in 2000–01, slightly lower than the proportion in overall health expenditure that year. Over two–thirds of the expenditure was for prescription drugs, a lower proportion than that noted generally.
Out-of-hospital medical services: As mentioned earlier, out-of-hospital medical services costs are high for arthritis and musculoskeletal conditions. A total of $878.7 million was spent on services used in this sector, the largest amount spent for any disease group in Australia in 2000–01. The expense constituted 19.0% of total expenditure for arthritis and musculoskeletal conditions in that year. In addition to consultations with general practitioners (GPs) and specialists, this component of expenditure covers diagnostic services such as medical imaging and pathology tests.
Other professional services: Services provided by other health professionals including allied health cost $709.7 million in 2000–01—more than 15.0% of the total expenditure for arthritis and musculoskeletal conditions. A large component of allied health services is physiotherapy services. Other professional services include consultations with chiropractors, osteopaths, podiatrists etc.

PAGE 86 Arthritis And musculoskeletAl conditions in AustrAliA 2005
Research: Research related to arthritis and musculoskeletal conditions accounted for a small proportion (1.2%) of the total expenditure for arthritis and musculoskeletal conditions. In contrast, 2.4% of the overall health expenditure is allocated to research. This is research conducted by universities and other institutions to understand the cause, extent and impact of arthritis and musculoskeletal conditions, and to further develop and evaluate new and existing treatment methods and public health interventions.
Note: See Appendix E, Table E7.2 for detailed information.
Source: AIHW Health Expenditure Database.
Figure 7.2: Expenditure for arthritis and musculoskeletal conditions by health sector, 2000–01
Trends over timeThe health expenditure for arthritis and musculoskeletal conditions is on the increase in real terms. Adjusting for health price inflation, health expenditure on these conditions in 1993–94 (in 2000–01 prices) was $3.4 billion. The estimated expenditure of $4.6 billion in 2000–01 for these conditions was an average annual increase of 4.3% over eight years. In addition to population ageing and population growth, innovations in surgical techniques, pharmaceuticals and biomedical devices have also contributed to the increase.
The changes in health expenditure for arthritis and musculoskeletal conditions between 1993–94 and 2000–01 showed a high degree of inter-sectoral variability (Figure 7.3). The largest increase was for pharmaceuticals, 105.3% over eight years. High growth was also noted for research, other professional services, out-of-hospital medical services and hospitals. In contrast, expenditure in aged care homes fell between the two periods.
The decrease in aged care home expenditure is partly attributable to the current trend of deinstitutionalisation, both for disability and aged care services. The proportion of people living in cared accommodation, and reporting arthritis or a musculoskeletal condition as their main disabling condition, declined from 1.1% to 0.7% between 1998 and 2003 (ABS 2004).
The increase in expenditure for arthritis and musculoskeletal conditions was relatively smaller than growth in health expenditure overall between 1993–94 and 2000–01 (Figure 7.3). The annual growth in inflation-adjusted expenditure for all diseases in that period was 4.9%, compared with the average rate of 4.3% for arthritis and musculoskeletal conditions. This differential emerged despite much faster expenditure growth for pharmaceuticals and out-of-hospital medical services for arthritis and musculoskeletal conditions. A fall in expenditure on aged care services may have depressed the growth in expenditure.
Pharmaceuticals(14.7%)
Aged care homes(10.4%)
Other professionalservices (15.3%)
Hospitals (39.4%)
Research (1.2%)
Out-of-hospital medical services (19.0%)
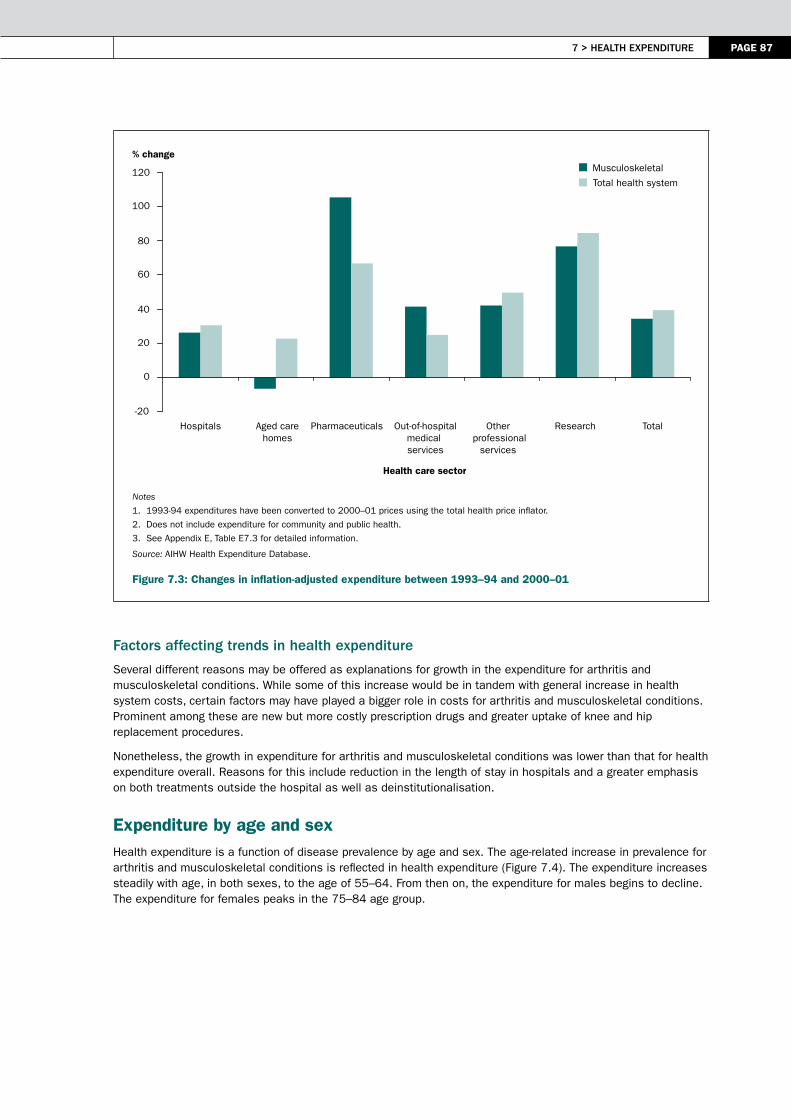
7 > heAlth eXPenditure PAGE 87
Notes
1. 1993-94 expenditures have been converted to 2000–01 prices using the total health price inflator.
2. Does not include expenditure for community and public health.
3. See Appendix E, Table E7.3 for detailed information.
Source: AIHW Health Expenditure Database.
Figure 7.3: Changes in inflation-adjusted expenditure between 1993–94 and 2000–01
Factors affecting trends in health expenditure
Several different reasons may be offered as explanations for growth in the expenditure for arthritis and musculoskeletal conditions. While some of this increase would be in tandem with general increase in health system costs, certain factors may have played a bigger role in costs for arthritis and musculoskeletal conditions. Prominent among these are new but more costly prescription drugs and greater uptake of knee and hip replacement procedures.
Nonetheless, the growth in expenditure for arthritis and musculoskeletal conditions was lower than that for health expenditure overall. Reasons for this include reduction in the length of stay in hospitals and a greater emphasis on both treatments outside the hospital as well as deinstitutionalisation.
Expenditure by age and sexHealth expenditure is a function of disease prevalence by age and sex. The age-related increase in prevalence for arthritis and musculoskeletal conditions is reflected in health expenditure (Figure 7.4). The expenditure increases steadily with age, in both sexes, to the age of 55–64. From then on, the expenditure for males begins to decline. The expenditure for females peaks in the 75–84 age group.
Musculoskeletal
Total health system
-20
0
20
40
60
80
100
120
Hospitals Aged carehomes
Pharmaceuticals Out-of-hospitalmedical services
Other professional
services
Research Total
Health care sector
% change

PAGE 88 Arthritis And musculoskeletAl conditions in AustrAliA 2005
Note: See Appendix E, Table E7.4 for detailed information.
Source: AIHW Health Expenditure Database.
Figure 7.4: Health expenditure for arthritis and musculoskeletal conditions by age and sex, 2000–01
Expenditure by type of arthritis or musculoskeletal conditionThe AIHW Health Expenditure Database categorises arthritis and musculoskeletal conditions into six broad groups, namely osteoarthritis, chronic back pain, slipped disc, rheumatoid arthritis, osteoporosis, and other musculoskeletal conditions. The other musculoskeletal conditions accounted for 45.7% of the health expenditure in 2000–01 (Table 7.2).
Table 7.2: Health expenditure by type of arthritis or musculoskeletal condition, 2000–01
Disease group Expenditure ($ million) Per cent
Osteoarthritis 1,183.0 25.5
Chronic back pain 566.9 12.2
Slipped disc 298.5 6.4
Rheumatoid arthritis 246.2 5.3
Osteoporosis 220.6 4.8
Other musculoskeletal conditions 2,118.0 45.7
Total 4,633.3 100.0
Source: AIHW Health Expenditure Database.
Osteoarthritis accounted for one-quarter of the total expenditure of $4.6 billion in 2000–01 on arthritis and musculoskeletal conditions, followed by that for chronic back pain and slipped disc. Rheumatoid arthritis and osteoporosis accounted for much smaller proportions.
The three focus areas of osteoarthritis, rheumatoid arthritis and osteoporosis accounted for a total of $1.6 billion, or 35.6% of the overall expenditure for arthritis and musculoskeletal conditions, in 2000–01. Osteoarthritis-related expenditure was the largest component (25.5%), followed by that for rheumatoid arthritis (5.3%) and osteoporosis (4.8%).
Males
Females
0
100
200
300
400
500
600
0–4 5–14 15–24 25–34 35–44 45–54 55–64 65–74 75–84 85+
Age group (years)
$ million

7 > heAlth eXPenditure PAGE 89
osteoarthritis
An estimated $1.2 billion was spent on osteoarthritis, representing 25.5% of the total expenditure on arthritis and musculoskeletal conditions in 2000–01. Hospital services accounted for the largest portion of expenditure for osteoarthritis, followed by that for aged care homes and pharmaceuticals (Figure 7.5).
Note: See Appendix E, Table E7.2 for detailed information.
Source: AIHW Health Expenditure Database.
Figure 7.5: Health expenditure for osteoarthritis by health sector, 2000–01
Hospital services: The greatest cost incurred for osteoarthritis was for hospital services. More than 87% of this expenditure was for admitted patient costs. In 2000–01, there were 57,444 hospital separations with the principal diagnosis of osteoarthritis, with an average length of stay (ALOS) of 6.1 days. A large proportion of these separations were for joint replacement surgery (March & Bagga 2004); the high costs associated with these procedures are reflected in overall numbers. Nonetheless, joint replacement surgery is a highly cost-effective treatment for osteoarthritis and results in a reduction in expenditure that would otherwise occur in the other health service areas. In 2000–01, over 30,400 total hip and knee arthroplasty procedures were performed in Australian hospitals. Of these, more than 86% of hip arthroplasty and 94% of knee arthroplasty procedures were performed on people with the principal diagnosis of osteoarthritis.
Aged care homes: Aged care homes accounted for the second largest portion of health expenditure for osteoarthritis. This partly reflects the higher prevalence of osteoarthritis in persons who reside in aged care homes.
Pharmaceuticals and biologics: The management of osteoarthritis, which focuses on controlling pain and improving health-related quality of life, is commonly achieved through medication. In 2000–01, more than 92% of GP encounters for osteoarthritis prescribed, advised or supplied medication to manage the condition. Anti-inflammatory drugs, such as COX-2 inhibitors were the most commonly prescribed or advised, followed by paracetamol.
Out-of-hospital medical services: In 2000–01, osteoarthritis was the tenth most frequent problem managed by GPs (1.7% of all problems managed). Radiology and consultations with specialists were other major contributors to these expenses (AIHW: Britt et al. 2001) .
Other professional services: Physiotherapy is commonly recommended for osteoarthritis. According to the 2001 NHS, 22.5% of people with osteoarthritis had consulted an allied or other health professional in the previous two weeks.
Pharmaceuticals(12.5%)
Out-of-hospitalservices (10.5%)
Other professionalservices (5.4%)
Hospitals (47.5%)
Research (1.2%)
Aged care homes(22.5%)

PAGE 90 Arthritis And musculoskeletAl conditions in AustrAliA 2005
rheumatoid arthritis
An estimated $246 million was spent on rheumatoid arthritis, representing 5.3% of the total expenditure for arthritis and musculoskeletal conditions in 2000–01. The expenditure was relatively evenly distributed across various health care sectors, except research (Figure 7.6). The treatment for rheumatoid arthritis is long term and provided in a variety of settings, resulting in service utilisation across most of the health care sectors. This is reflected in the health expenditure pattern.
Note: See Appendix E, Table E7.2 for detailed information.
Source: AIHW Health Expenditure Database.
Figure 7.6: Health expenditure for rheumatoid arthritis by health sector, 2000–01
Hospital services: The largest component of expenditure for rheumatoid arthritis was for hospital services. However, almost two-thirds of this expenditure was for non-admitted patient services, provided by hospitals through outpatient clinics, emergency departments and a range of other specialised services (AIHW 2004).
Aged care homes: Aged care homes accounted for the second largest proportion of health expenditure for rheumatoid arthritis, reflecting the highly disabling nature of the disease and its increased prevalence in older age groups. Almost 85% of the expenditure in this sector was for females aged 65 and over.
Pharmaceuticals: The treatment for rheumatoid arthritis is changing, and with it the expenses for drugs. Medicines commonly prescribed or advised include disease-modifying anti-rheumatic drugs (DMARDs), non-steroidal anti-inflammatory drugs (NSAIDs) and low-dose corticosteroids.
Out-of-hospital medical services: GPs are commonly consulted at the first stage of rheumatoid arthritis management. From this point, however, the treatment may continue in consultation with the GP or, more commonly, the patient is referred to a rheumatology clinic or specialist.
Other professional services: Consultations with physiotherapists and other allied health professionals are also common. Based on the 2001 NHS, 25.6% of people with rheumatoid arthritis had consulted an allied or other health professional within the previous two weeks of the survey. The proportion was slightly higher than that reported by people with osteoarthritis during the same survey.
osteoporosis
In 2000–01, an estimated $221 million was spent on osteoporosis, representing 4.8% of the total expenditure for arthritis and musculoskeletal conditions. Post-fracture treatment and the ongoing need for care accounted for most of the osteoporosis costs.
Pharmaceuticals(19.2%)
Out-of-hospitalservices (14.5%)
Other professionalservices (13.5%)
Hospitals (27.6%)
Research (1.2%)
Aged care homes(24.0%)

7 > heAlth eXPenditure PAGE 91
Of diagnosed fractures, hip fractures are probably the most debilitating and costly (Randell et al. 1995). Vertebral fractures also have comparatively high costs due their common occurrence among persons with osteoporosis (Gill et al. 2002). In 2000–01, pharmaceuticals accounted for the greatest proportion of the expenditure for osteoporosis, followed by expenditure on aged care homes and hospital services (Figure 7.7). The hospital-based treatment costs for osteoporotic fractures constituted a comparatively smaller component.
Note: See Appendix E, Table E7.2 for detailed information.
Source: AIHW Health Expenditure Database.
Figure 7.7: Health expenditure for osteoporosis by health sector, 2000–01
Pharmaceuticals: The pharmaceutical treatment of diagnosed osteoporosis and osteoporotic fractures comprised the largest proportion of expenditure. Of this, 96.7% was for prescription medications. In 2000–01, in more than 87% of GP encounters for osteoporosis, medication was prescribed, advised or supplied to prevent both the development of osteoporosis and further bone loss and to reduce fracture risk. The bisphosphonate, alendronate, was the most widely prescribed or advised medication, accounting for 33.2% of total prescriptions for osteoporosis. This was followed by calcium carbonate, which contributed 20.8% to the total.
Aged care homes: Aged care homes were the second biggest component of health system expenditure for osteoporosis. Of this, 96.3% was for older females reflecting the higher prevalence of osteoporosis in older age groups and in females.
Bone fracture, an adverse outcome of osteoporosis, plays a large role in the level of expenditure for aged care homes. Of these, hip fractures are probably the most debilitating and costly. It is estimated that up to 50% of those who experience a hip fracture never return to their pre-fracture health status (Gill et al. 2002). In 2000–01, 14.6% of community-based patients aged 55 and over who were admitted to hospitals for osteoporotic hip fractures, were discharged to an aged care home. It is estimated that 20–26% of people with hip fractures are permanently admitted to an aged care institution (DHFS 1996). In comparison, only 5% of older people without a hip fracture are institutionalised (Cumming et al. 1996).
Hospital services: Hospital services accounted for the third largest proportion of allocated health expenditure for osteoporosis. Most of this expenditure (81.7%) was for admitted patient care. There were just over 4,000 hospital separations for patients aged 55 and over with an osteoporotic fracture, at an average length of stay of 13.4 days in 2000–01. Over 39% of the separations were for hip fracture.
Out-of-hospital medical services: Visits to GPs commonly occur following a minor or non-hip fracture, with GPs often providing advice on the treatment and management of osteoporosis. In addition, discharge of public patients with non-hip fractures are commonly followed up by the GP (Harris et al. 1998).
Pharmaceuticals(35.4%)
Out-of-hospitalservices (13.3%)
Other professionalservices (3.0%)
Hospitals (17.7%)
Research (1.2%)
Aged care homes (29.4%)

PAGE 92 Arthritis And musculoskeletAl conditions in AustrAliA 2005
Other professional services: In 2000–01, other professional services, including those provided by allied health professionals, accounted for the second lowest proportion of osteoporosis-related health expenditure. Based on the 2001 NHS, about 22% of people with osteoporosis had consulted an allied or other health professional within two weeks of the survey. Following discharge of private patients with either hip or non-hip fractures to private homes, these people will have at least one outpatient clinic appointment for physiotherapy and one orthopaedic outpatient clinic visit (Harris et al. 1998). In aged residences, patients who experience a hip fracture were more likely to receive physiotherapy and occupational therapy compared with any other fracture type (Zimmerman et al. 2002).
Variation in health expenditure between focus areas Osteoarthritis, rheumatoid arthritis and osteoporosis show not only significant variation between them in total expenditure—reflecting differences in prevalence, duration, disease severity and age distribution—but also variation in expenditure by health care sector. Essentially, the three focus areas have unique expenditure patterns.
Age and sex are strong predictors of health expenditure in all three focus areas. The highest expenditure in any age group was for females with osteoarthritis, with the cost rising steeply from the age of 75 (Figure 7.8). Expenditure for osteoarthritis was also high among males. These high expenditures for osteoarthritis reflect greater and increasing prevalence with age, particularly for females.
Expenditure for females with osteoporosis and rheumatoid arthritis was also high. The greater expenditure for females mirrors sex differences in prevalence for these conditions.
These age-sex-prevalence related differences in expenditure are also reflected in variation in expenditure by health care sector. While hospital services cost the most for osteoarthritis and rheumatoid arthritis, pharmaceuticals topped the list for osteoporosis. On the other hand, aged care was a much larger component of expenditure for osteoporosis and rheumatoid arthritis (Figure 7.9).
Comparisons with other National Health Priority AreasIn comparison with other National Health Priority Areas (NHPAs), the expenditure on arthritis and musculoskeletal conditions is relatively high (AIHW 2004; AIHW: Dixon 2005). The seven NHPAs of cardiovascular health, cancer control, injury prevention and control, mental health, arthritis and musculoskeletal conditions, diabetes mellitus, and asthma, together accounted for $22.3 billion, or 44.4% of allocated health system expenditure in 2000–01. Of these, cardiovascular diseases were responsible for $5.5 billion and musculoskeletal conditions for a total of $4.6 billion. In comparison, diabetes and asthma cost $0.8 billion and $0.7 billion, respectively (Figure 7.10).
Note: See Appendix E, Table E7.5 for detailed information.
Source: AIHW Health Expenditure Database.
Figure 7.8: Expenditure for osteoarthritis, rheumatoid arthritis and osteoporosis by age and sex, 2000–01
0
50
100
150
200
250
35–44 45–54 55–64 65–74 75–84 85+
Age group (years)
$ million
Osteoarthritis (Males)
Osteoarthritis (Females)
Rheumatoid arthritis (Males)
Rheumatoid arthritis (Females)
Osteoporosis (Males)
Osteoporosis (Females)

7 > heAlth eXPenditure PAGE 93
Note: See Appendix E, Table E7.2 for detailed information.
Source: AIHW Health Expenditure Database.
Figure 7.9: Expenditure for osteoarthritis, rheumatoid arthritis and osteoporosis by health sector, 2000–01
Note: See Appendix E, Table E7.6 for detailed information.
Source: AIHW Health Expenditure Database.
Figure 7.10: Health expenditure for NHPA diseases and conditions, 2000–01
Osteoarthritis
Rheumatoid arthritis
Osteoporosis
0
10
20
30
40
50
60
Hospitals Aged carehomes
Pharmaceuticals Out-of-hospital medical services
Other professionalservices
Research
Health sector
Per cent
Cardiovascular($5.5 billion, 24.6%)
Musculoskeletal($4.6 billion, 20.8%)
Asthma($0.7 billion, 3.1%)Diabetes mellitus
($0.8 billion, 3.6%)
Neoplasms($2.9 billion, 13.1%)
Mental disorders($3.7 billion, 16.8%)
injuries($4.0 billion, 18.0%)
PAGE 94 Arthritis And musculoskeletAl conditions in AustrAliA 2005
ReferencesABS (Australian Bureau of Statistics) 2004. Disability, ageing and carers: summary of findings, Australia, 2003. ABS Cat. No. 4430.0. Canberra: ABS.
Access Economics 2001a. The burden of brittle bones: costing osteoporosis in Australia. Canberra: Access Economics.
Access Economics 2001b. The prevalence, cost and disease burden of arthritis in Australia. Canberra: Access Economics.
Access Economics 2005. Arthritis the bottom line – the economic impact of arthritis in Australia. Canberra: Access Economics.
AIHW (Australian Institute of Health and Welfare) 2004. Australia’s health 2004. AIHW Cat. No. AUS 44. Canberra: AIHW.
AIHW 2005. Health system expenditure on disease and injury in Australia, 2000–01. Second ed. AIHW Cat. No. HWE 26. Canberra: AIHW.
AIHW: Britt H, Miller GC, Knox S et al. 2001. General practice activity in Australia 2000–01. AIHW Cat. No. GEP 8. Canberra: AIHW.
AIHW: Dixon T 2005. Costs of diabetes in Australia, 2000–01. AIHW Bulletin No. 26. Canberra: AIHW.
AIHW: Mathers C, Penm R, Carter R et al. 1998a. Health system costs of diseases and injury in Australia 1993–94. AIHW Cat. No. HWE 5. Canberra: AIHW.
AIHW: Mathers C, Stevernson C, Carter R et al. 1998b. Disease costing methodology used in the Disease Costs and Impact Study 1993–94. AIHW Cat. No. HWE 7. Canberra: AIHW.
AIHW: Mathers C & Penm R 1999. Health system costs of injury, poisoning and musculoskeletal disorders in Australia 1993–94. AIHW Cat. No. HWE 12. Canberra: AIHW.
Cumming RG, Klineberg R & Katelaris A 1996. Cohort study of risk of institutionalisation after hip fracture. Australian and New Zealand Journal of Public Health 20(6):579–82.
DHFS (Commonwealth Department of Health and Family Services) 1996. Consensus panel: the prevention and management of osteoporosis. Medical Journal of Australia 167:S1–S15.
Gill T, Taylor A, Leach G et al. 2002. Osteoporosis in South Australia: prevalence, effects & impact. Adelaide: Centre for Population Studies in Epidemiology.
Harris AH, Cumming R, Watts J et al. 1998. The burden of illness and the cost of osteoporosis in Australia. Technical Report No. 8. Melbourne: Centre for Health Program Evaluation.
March L & Bagga H 2004. Epidemiology of osteoarthritis in Australia. Medical Journal of Australia 180(Supplement 5):S6–S10.
Mehrotra A, Dudley RA & Luft HS 2003. What’s behind the health expenditure trends. Annual Review of Public Health 24:385–412.
Randell A, Sambrook PN, Nguyen TV et al. 1995. Direct clinical and welfare costs of osteoporotic fractures in elderly men and women. Osteoporosis International 5:427–32.
Zimmerman S, Chandler JM, Hawkes W et al. 2002. Effect of fracture on the health care use of nursing home residents. Archives of Internal Medicine 162:1502–8.

PAGE 95
8 > Surveillance and monitoring
KEy POINTS
• The national surveillance and monitoring of arthritis and musculoskeletal conditions in Australia is virtually at an incipient stage.
• Many reasons can be advanced for this low priority, but the largely non-fatal nature of the diseases and conditions may have reduced the emphasis.
• The focus in surveillance and monitoring of arthritis and musculoskeletal conditions is on morbidity and functionality. Information on mortality and other severe health outcomes is mostly based on attributable fractions.
• A variety of national and jurisdictional data sources, both administrative and non-administrative, contain information about arthritis and other musculoskeletal conditions; however, this information is generally patchy and non-standard.
• Most of the population data on arthritis and musculoskeletal conditions are based on self-reports, but the information is not backed by radiological or other more objective evidence. The quality and reliability of the available information is also poor.
• Systematic data development through consistent use of defined data items and indicators is required. This is important in view of the aetiological diversity of arthritis and musculoskeletal conditions and the large proportion of the population they affect.
The nature and type of information required for effective surveillance and monitoring of arthritis and musculoskeletal conditions differ both in emphasis and content from that required for other National Health Priority Areas (NHPAs). The National Mortality Database—one of the best sources of information for disease monitoring—is of limited use in monitoring arthritis and musculoskeletal conditions. Similarly, hospital separations constitute only a small proportion of the health service use for these diseases and conditions. Persons with arthritis and musculoskeletal conditions usually seek medical help in primary care settings. Activity limitations associated with these conditions are also varied and considerable.
In view of this restricted range of health outcomes and health service use, much of the information needed for the surveillance and monitoring of arthritis and musculoskeletal conditions is currently obtained through population-based surveys. At a national level, ABS surveys such as the National Health Survey (NHS) and the Survey of Disability, Ageing and Carers (SDAC) have provided some insights into the perceived health status, health behaviours and risks, and use of health services in relation to arthritis and musculoskeletal conditions (ABS 2004a). Some of the state-based surveys have also generated information on the prevalence of arthritis and their impact upon the quality of life at jurisdictional level (Hill et al. 1999). However, the low prevalence of most of the musculoskeletal conditions means that the sampling strategies used for conducting these surveys may not have sufficient power to generate reliable regional estimates. The surveillance and monitoring of arthritis and musculoskeletal conditions in Australia has therefore evolved slowly, and is virtually at an incipient stage.
A variety of reasons may be advanced for the lack of effort in this direction. The largely non-fatal nature of arthritis and musculoskeletal conditions may have reduced their recognition, and therefore priority. The low severity of most of these diseases and conditions may have also reduced the emphasis. The focus in the surveillance and monitoring of arthritis and musculoskeletal conditions is essentially on morbidity and functionality. However, their input to premature mortality and poor quality of life needs to be determined.
For effective surveillance and monitoring, a theoretical framework is required that takes into consideration the development of various diseases and conditions as well as their adverse health outcomes, including activity limitations and functional impairments. The framework can be used to identify relevant datasets and as well as gaps and deficiencies in existing datasets.
8 > surVeillAnce And monitorinG

PAGE 96 Arthritis And musculoskeletAl conditions in AustrAliA 2005
This chapter provides a brief overview of data requirements for effective surveillance and monitoring of arthritis and musculoskeletal conditions in Australia. In addition to describing the currently available information, it also identifies data gaps and deficiencies in the existing information base. The process for developing indicators for regular monitoring of arthritis and musculoskeletal conditions as an NHPA is also described.
Surveillance and monitoring issuesKey terms such as pain, stiffness, swelling, deformity, instability, weakness, fracture, functional loss and altered sensibility are often used to describe arthritis and musculoskeletal conditions. The operationalisation of these key terms into an effective measuring system is complicated, however, because of the diversity of arthritis and musculoskeletal conditions and the large range of functional restrictions associated with them. Prominent issues for coverage are listed in Box 8.1.
Box 8.1: Prominent issues for the surveillance and monitoring of arthritis and musculoskeletal conditions
1. Natural history• causes • classification• disease severity and complications• co-morbidity
2. Risk factors• late diagnosis• aging• immunogenetics• metabolic disorders• health behaviours• biomechanical factors
3. Prevalence and incidence• new episodes• recurrence • exacerbation• life-time prevalence (chronicity)
4. Service use• GP consultations• hospitalisation• other therapies• diagnostics and referrals• health system costs• formal and informal care
5. Effectiveness and cost-effectiveness of treatment• early diagnosis• medicine use• efficacy of primary care• physical therapies including surgery• models of care and their consequences• carer’s health
6. Measuring outcomes• work loss• disability: impairment, activity limitation, participation restriction• pain and discomfort• quality of life• premature mortality
A theoretical frameworkA major feature of arthritis and musculoskeletal conditions is that they are the cause of difficulty in a wide range of tasks compared with most other conditions that appear to have a more specific relationship with certain types of health outcomes. Despite treatment, most arthritis and musculoskeletal conditions result in significant physical disability for many people. This primarily results from persistent pain, although symptoms such as fatigue and depression are also relevant. In view of these diverse outcomes, it is important to take an integrated approach to health outcome issues for arthritis and musculoskeletal conditions.
The International Classification of Functioning, Disability and Health (ICF) Framework, developed by the World Health Organization (WHO), provides a general framework for human functioning and is suitable for arthritis monitoring.
The National Health Performance Framework (NHPC Framework), developed by the National Health Performance Committee (NHPC), is useful to guide the selection of various measures and indicators (AIHW 2004). In itself, the NHPC framework has limited applicability to arthritis and musculoskeletal conditions. However, in combination with the ICF Framework, it can help to identify relevant issues as well as data items for the surveillance and monitoring of arthritis and musculoskeletal conditions.

8 > surVeillAnce And monitorinG PAGE 97
the international classification of Functioning, disability and health Framework
The ICF Framework (Figure 8.1) defines functioning and disability as multi-dimensional concepts relating to:
• the body functions and structures of people
• the activities people do and the life areas in which they participate, and
• the factors in their environment that affect these experiences.
In ICF, functioning and disability are not merely seen as a consequence of the health condition but as associated with it as well as with personal and environmental factors that contribute to it. The ICF also uses a globally accepted language to communicate about functioning at body, person and societal levels. The relationship between disease and disability is influenced by several non-disease factors.
Figure 8.1: The International Classification of Functioning, Disability and Health (ICF) Framework
The various components of the ICF Framework are detailed in Box 8.2.
Box 8.2: Components of the International Classification of Functioning, Disability and Health (ICF) Framework
• Body Functions: the physiological functions of body systems (including psychological functions)• Body structures: anatomical parts of the body, such as organs, limbs and their components• Impairments: problems in body function and structure, such as significant deviation or loss• Activity: the execution of a task or action by an individual• Participation: involvement in a life situation• Activity limitations: difficulties an individual may have in executing activities• Participation restrictions: problems an individual may experience in involvement in life situations• Environmental factors: the physical, social and attitudinal environment in which people live and conduct their lives.
Source: WHO 2001.
Body functions and structures
Activities Participation
Environmental factors Personal factors
Health condition (disorder or disease)
PAGE 98 Arthritis And musculoskeletAl conditions in AustrAliA 2005
identification of datasets
A most important application of ICF in surveillance and monitoring is the identification of relevant data categories (and issues) in various settings, i.e. in the community, in acute hospital settings, in aged care homes and other living arrangements (Cieza et al. 2004a, b; Dreinhofer et al. 2004; Stoll et al. 2005). The ICF contains a hierarchy of classifications and codes for each of its main components:
• Body functions
• Body structures
• Activities, and
• Participation.
A systematic application of the ICF reveals that persons with arthritis and musculoskeletal conditions have a large range of impairments in Body functions and Body structure. The Activities and Participation components also have strong representation. However, the relatively high importance of Environmental factors, in particular those referring to products and technologies, underscores the need for effective management of arthritis and musculoskeletal conditions in many different settings.
‘Core sets’ have been developed, which can serve as the minimum standard requirements for monitoring arthritis and musculoskeletal conditions. The ICF core sets have already been developed for osteoarthritis and osteoporosis in community settings (Cieza et al. 2004a, b). A core set for patients with musculoskeletal conditions in the acute hospital has also been recently developed (Stoll et al. 2005).
national health Performance Framework
The NHPC Framework (Table 8.1) is a multi-dimensional framework. It was developed in 2001 to report on the performance of the Australian health system, and provides a structured approach to system appraisal (AIHW 2004). The Framework can also be adapted to identify indicators for public health surveillance and disease monitoring.
The NHPC framework has three tiers, namely
• Health status and outcomes
• Determinants of health, and
• Health system performance.
Although the three tiers of the framework are not hierarchical, the underlying relationships between the tiers and their various dimensions are well recognised.
The NHPC Framework acknowledges that influences in population health emanate from interventions and determinants both within and outside the health system. It therefore helps to monitor all health system interventions, including acute care, community health and public health sectors. The Framework can be applied at all levels and in all sectors of the health system, including at the individual program level and for particular regions.
The NHPC Framework can also be applied to keep indicators for the surveillance and monitoring of individual diseases in line with current thinking about the general health system and health status of Australians. While this approach has the benefit of enabling movement between sets of indicators and disease inter-comparisons, there are limitations because of the more generalised appeal of the NHPC Framework.

8 > surVeillAnce And monitorinG PAGE 99
Table 8.1: The NHPC Framework
Health status and outcomesHow healthy are Australians? Is it the same for everyone? Where is the most opportunity for improvement?
Health conditions
Human function
Life expectancy and wellbeing
Deaths
Prevalence of disease, disorder, injury or trauma or other health-related states.
Alterations to body, structure or function (impairment), activities (activity limitation) and participation (restrictions in participation).
Broad measures of physical, mental and social wellbeing of individuals and other derived indicators such as Disability Adjusted Life Expectancy (DALE).
Age and/or condition-specific death rates.
Determinants of healthAre the factors determining health changing for the better? Is it the same for everyone?
Where and for whom are they changing?
Environmental factors
Socioeconomic factors
Community capacity Health behaviours
Person-related factors
Physical, chemical and biological factors such as air, water, food and soil quality resulting from chemical pollution and waste disposal.
Socioeconomic factors such as education, employment, per capita expenditure on health, and average weekly earnings.
Characteristics of communities and families such as population density, age distribution, health, literacy, housing, community support services and transport
Attitudes, beliefs knowledge and behaviours, e.g. patterns of eating, physical activity, excess alcohol consumption and smoking.
Genetic-related susceptibility to disease and other factors such as blood pressure, cholesterol levels and body weight.
Health system performanceHow well is the health system performing in delivering quality health actions to improve the health of all Australians?
Is it the same for everyone?
Effective Appropriate Efficient
Care, intervention or action achieves desired outcome.
Care/intervention/action provided is relevant to the client’s needs and based on established standards.
Achieving results with most cost-effective use of resources.
Responsive Accessible Safe
Service provides respect for people; is client orientated; and includes respect for dignity, confidentiality, participation in choices, promptness, quality of amenities, access to social support networks, and choice of provider.
Ability of people to obtain health care at the right place and right time irrespective of income, physical location and cultural background.
The avoidance of or reduction to acceptable limits of actual or potential harm from health care management or the environment in which health care is delivered.
Continuous Capable Sustainable
Ability to provide uninterrupted, coordinated care or service across programs, practitioners, organisations and levels over time.
An individual’s or service’s capacity to provide a health service based on skills and knowledge.
System or organisation’s capacity to provide infrastructure such as workforce, facilities and equipment, and to be innovative and respond to emerging needs (research, monitoring).
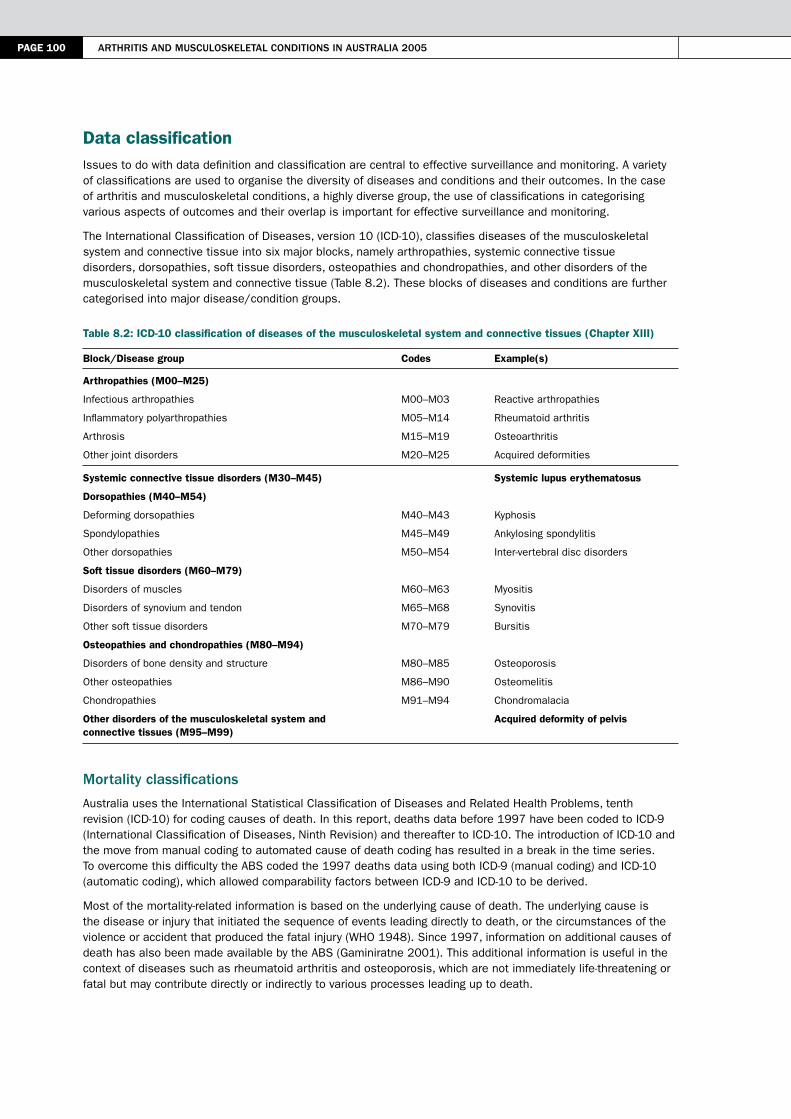
PAGE 100 Arthritis And musculoskeletAl conditions in AustrAliA 2005
Data classificationIssues to do with data definition and classification are central to effective surveillance and monitoring. A variety of classifications are used to organise the diversity of diseases and conditions and their outcomes. In the case of arthritis and musculoskeletal conditions, a highly diverse group, the use of classifications in categorising various aspects of outcomes and their overlap is important for effective surveillance and monitoring.
The International Classification of Diseases, version 10 (ICD-10), classifies diseases of the musculoskeletal system and connective tissue into six major blocks, namely arthropathies, systemic connective tissue disorders, dorsopathies, soft tissue disorders, osteopathies and chondropathies, and other disorders of the musculoskeletal system and connective tissue (Table 8.2). These blocks of diseases and conditions are further categorised into major disease/condition groups.
Table 8.2: ICD-10 classification of diseases of the musculoskeletal system and connective tissues (Chapter XIII)
Block/Disease group Codes Example(s)
Arthropathies (M00–M25)
Infectious arthropathies M00–M03 Reactive arthropathies
Inflammatory polyarthropathies M05–M14 Rheumatoid arthritis
Arthrosis M15–M19 Osteoarthritis
Other joint disorders M20–M25 Acquired deformities
Systemic connective tissue disorders (M30–M45) Systemic lupus erythematosus
Dorsopathies (M40–M54)
Deforming dorsopathies M40–M43 Kyphosis
Spondylopathies M45–M49 Ankylosing spondylitis
Other dorsopathies M50–M54 Inter-vertebral disc disorders
Soft tissue disorders (M60–M79)
Disorders of muscles M60–M63 Myositis
Disorders of synovium and tendon M65–M68 Synovitis
Other soft tissue disorders M70–M79 Bursitis
Osteopathies and chondropathies (M80–M94)
Disorders of bone density and structure M80–M85 Osteoporosis
Other osteopathies M86–M90 Osteomelitis
Chondropathies M91–M94 Chondromalacia
Other disorders of the musculoskeletal system and connective tissues (M95–M99)
Acquired deformity of pelvis
mortality classifications
Australia uses the International Statistical Classification of Diseases and Related Health Problems, tenth revision (ICD-10) for coding causes of death. In this report, deaths data before 1997 have been coded to ICD-9 (International Classification of Diseases, Ninth Revision) and thereafter to ICD-10. The introduction of ICD-10 and the move from manual coding to automated cause of death coding has resulted in a break in the time series. To overcome this difficulty the ABS coded the 1997 deaths data using both ICD-9 (manual coding) and ICD-10 (automatic coding), which allowed comparability factors between ICD-9 and ICD-10 to be derived.
Most of the mortality-related information is based on the underlying cause of death. The underlying cause is the disease or injury that initiated the sequence of events leading directly to death, or the circumstances of the violence or accident that produced the fatal injury (WHO 1948). Since 1997, information on additional causes of death has also been made available by the ABS (Gaminiratne 2001). This additional information is useful in the context of diseases such as rheumatoid arthritis and osteoporosis, which are not immediately life-threatening or fatal but may contribute directly or indirectly to various processes leading up to death.
8 > surVeillAnce And monitorinG PAGE 101
morbidity classifications
For hospital diagnoses and procedures, the international classifications (ICD-9 and ICD-10) have been modified for Australia. The hospital data before 1998–99 were coded using ICD-9-CM (International Classification of Diseases, ninth revision, Clinical Modification) and thereafter using ICD-10-AM (International Statistical Classification of Diseases and Related Health Problems, tenth revision, Australian Modification).
Most of the information related to hospital separations is based on first-listed or principal diagnosis. This is the condition established to be chiefly responsible for the admission to hospital. The principal diagnosis is not necessarily the underlying cause of disease; it may be only a manifestation of the disease (AIHW 2005b). Information on additional diagnoses, whether contributing to the reason of principal diagnosis or not, is also listed and is useful for seeking insight into the contribution of the various conditions to illness and morbidity.
The general practice (GP) data follow the International Classification of Primary Care, second edition (ICPC-2). The ICPC classification has a bi-axial structure, with 17 chapters based on body systems along one axis and seven components covering signs, symptoms, process of care and diagnoses along the other (WICC 1997). The processes of care, including referrals, non-pharmacological treatments and orders (pathology and imaging), were classified by the process components of the ICPC-2 (AIHW: Britt et al. 2004).
disability characterisation
The loss of healthy life due to non-fatal conditions can be categorised using a variety of classifications. The International Classification of Functioning, Disability and Health (ICF) conceptualises disability as multi-dimensional, relating to the body functions and structures of people, the activities they do, the life areas in which they participate and the factors in the environment that affect these experiences (Figure 8.1).
The ABS Survey of Disability, Ageing and Carers operationalises these concepts into 17 different types of limitations, restrictions or impairments, which can be further related to specific diseases and conditions. Questions on difficulty with activities and assistance needed provide further components of the disability picture.
The extent of disability associated with various diseases and conditions can also be categorised using disability weights, or ‘health state’ preferences (Murray & Lopez 1996). However, no Australia-specific disability weights have been generated. Another numerical categorisation of disability is based on the years of healthy life lost due to time lived in states other than the reference state of good health, or YLD (AIHW: Mathers et al. 1999). Both disability weights and the YLD categorisation give a broader interpretation of morbidity or ill health.
A national surveillance and monitoring systemNo prototype currently exists for national surveillance and monitoring of arthritis and musculoskeletal conditions. Describing the status of a particular disease in the population at regular intervals is not a good enough basis for assessing population health care needs. Information needs to be put together from a variety of data sources to generate disease-specific profiles which, in addition to information on incidence, prevalence, mortality and potential years of life lost, also includes a range of evaluative components.
Broadly, a disease-specific surveillance and monitoring system should have three major components, namely:
• an unambiguous conceptualisation of surveillance and monitoring issues and objectives
• a well-developed database and other sources of relevant information, and
• a fully established plan for data analysis and regular information dissemination.
objectives
The major objectives in surveillance and monitoring of arthritis and musculoskeletal conditions need to be set out clearly by extensive consultation with experts in the field and other stakeholders. Since the focus of arthritis and musculoskeletal conditions as an NHPA is on osteoarthritis, rheumatoid arthritis and osteoporosis, the system should concentrate on these three topics initially.
databases and other sources of information
A variety of administrative databases and survey datasets contain useful information about arthritis and other musculoskeletal conditions in Australia. National databases on ambulatory and managed care, such as disease registers, hospital separations, GP encounters, nursing homes, etc., may be a useful source of information.

PAGE 102 Arthritis And musculoskeletAl conditions in AustrAliA 2005
Health surveys, including the national and state health surveys, and Disability, Ageing and Carers’ Survey could provide useful insights into the prevalence and impact of arthritis. Pharmacy data, available through the Pharmaceutical Benefits Scheme (PBS) and BEACH (Bettering the Evaluation and Care of Health) Surveys, should be useful sources of information about the use of medicines for arthritis.
Assessment and validation of various datasets are central to establishing a disease-specific surveillance and monitoring system. Some obvious gaps remain within this mix, with lack of information on risk factors being the most glaring. An information system is required that would link outpatient data with GP referral, specialist’s diagnosis and management plan. This, in turn, could be linked to accident and emergency visits, radiology, physiotherapy, day care admissions and inpatient care data.
A systematic approach is also required to assess the quality of the existing information. A well-established plan should enhance the value and quality of existing and continuing collections for arthritis and musculoskeletal conditions monitoring. A more prudent approach would be to develop a set of indicators and pursue data requirements for that particular set only.
Analysis and reporting
A range of analyses are required to get a clear understanding of the underlying patterns. However, most of the analysis should be guided by issues and objectives of the system. Some of the analysis required is as follows:
Trends and differentials
• underlying trends
• small area variation
• health differentials
Disease attribution
• disease attribution
• disease progression and outcomes
• complications
• acute episodes
• community health
• risk factors
Dissemination of information will also need to be organised through a variety of mechanisms, including:
• indicator-based time series in e-format
• state of arthritis reports
• topical surveillance summaries, and
• Australia’s Health.
major activities
Three major activities of such a system would be:
• generation of baseline information
• indicator and data development, and
• integrated monitoring and reporting.
Generation of baseline information
Since there has been no systematic national reporting of this important set of diseases and conditions, an immediate task is to generate baseline information on arthritis and musculoskeletal conditions in Australia. The baselines should not only cover health outcomes (disease severity, pain, disability, mental health, medicine use etc.) but also include health care information—extracted from hospital separations, GP visits and other related data—and health system costs. This report fulfils that requirement to a certain extent.
The extraction of baseline information for this report has provided an excellent opportunity to explore the potential of various data sources, including administrative collections, for the surveillance and monitoring of arthritis and musculoskeletal conditions. The approach has provided insights into who is affected, who is at

8 > surVeillAnce And monitorinG PAGE 103
increased risk of developing the disease, and how arthritis and musculoskeletal conditions affect physical health, quality of life, economics and other areas. The information so generated should form the basis for initiating time series for regular surveillance and monitoring.
Indicator and data development
National surveillance and monitoring of arthritis and musculoskeletal conditions should be undertaken by using a defined set of indicators. Indicator-based reporting has been the cornerstone of NHPA monitoring and reporting and has proved extremely useful (Appendix F).
Indicator development is a tedious process that requires careful work in consultation with a variety of stakeholders. The task entails not only the design and validation of suitable indicators across the continuum of care—using a well-defined reporting framework, e.g. National Health Performance Framework—but also includes development of appropriate operational definitions and suitable data development.
An indicator development process for arthritis and musculoskeletal conditions is currently underway. A workshop was organised in 2004 to shortlist a set of indicators for further discussion. Consultations regarding the design and use of these indicators, and their data requirements, were occurring at the time of the publication of this report.
Integrated monitoring and reporting
The approaches described above outline both immediate and short-term surveillance and monitoring of arthritis and musculoskeletal conditions in Australia. To achieve an integrated and more complete surveillance and monitoring, a variety of other issues also needs to be addressed. In addition to disease outcomes and risk factors information, there needs to be good data on the quality of life, coping, attitude and behaviours, pain and paths to functional limitation, and effect of arthritis and musculoskeletal conditions on healthy ageing. No population-based data currently exist to help determine how arthritis and musculoskeletal conditions are currently treated in Australia. Efforts would be required to increase understanding of current and future prevention and clinical treatments for arthritis and musculoskeletal conditions.
In addition to standard epidemiological measures for the whole population, differentials between various sub-groups also need to be analysed, especially for rural and remote populations, Indigenous Australians, and various socioeconomic groups. Small area analysis, multivariate analysis and the estimation of attributable fractions are other important approaches to delineate the impact of these diseases on individuals and communities. The possibility of record linkage between data sets may also enhance the analytical capability of the system. These and other related monitoring issues need to be addressed systematically.
Dissemination of suitable information through published reports and the Internet would be central to any strategy aimed at the surveillance and monitoring of arthritis and musculoskeletal conditions. It will be useful to follow this baseline report with special reports on osteoarthritis, rheumatoid arthritis and osteoporosis. Provision of this information and relevant datasets on a dedicated website should be considered. Indicator-based time series should be posted on the website and regularly updated.
Current data sourcesThe data sources interrogated for the preparation of this baseline report include population surveys, administrative collections, registries and epidemiological studies. The major emphasis was on national collections but, where necessary, quasi-national collections were also used. All these collections are described below in brief.
The following section has been structured in terms of impact components of arthritis and musculoskeletal conditions and their management, specifically the data sources used for morbidity (incidence/prevalence, professional encounters), health-related quality of life, disability, health service use and mortality statistics.
national health survey
The NHS is designed to collect information on the health status of Australians, their use of health services and facilities, and health-related aspects of their lifestyle through self-reports. Historical information is available from four NHS surveys, conducted in 1977, 1983, 1989–90 and 1995. The latest NHS was conducted in 2001, covering a sample of 26,900 people from February to November 2001.

PAGE 104 Arthritis And musculoskeletAl conditions in AustrAliA 2005
This ABS survey collects information about various forms of arthritis as well as back pain, osteoporosis and other diseases of the musculoskeletal system and connective tissues. The symptoms covered include some type of swelling in the joints, limitations in motion, pain when moving. The reports are not necessarily based on clinical diagnoses (ABS 2002).
Although the NHS allows differentiation between major forms of arthritis, e.g. osteoarthritis and rheumatoid arthritis, the quality and validity of this information is uncertain. The information on osteoporosis is also unreliable as most of the respondents probably heard of the diagnosis only after having had a fracture.
It may also be noted that the NHS is a community-based survey. Since arthritis and musculoskeletal conditions are much more prevalent in older age groups, absence of information on persons in the institutions tend to underestimate the extent of the problem.
The NHS data do not allow health status or health utilisation information to be attributed to arthritis or other musculoskeletal conditions. For example, even if an individual reports the presence of both arthritis and long-term disability, it cannot be ascertained whether the long-term disability is a direct result of the arthritis.
disability surveys
The disability-related information and information on health-related quality of life was extracted from the Surveys of Disability, Ageing and Carers (SDAC), also conducted by the ABS. The SDAC collects national information on disability levels of Australians, their current and future care needs, and the role of carers. The last survey collected information from a sample of 41,200 people over a six-month period in 2003.
In addition to information on the extent of activity limitations and participation restriction, the disability survey also collects information about the role of various diseases and health conditions as disabling conditions. Multiple conditions are listed. A disease condition may be defined as the main disabling condition— a long-term condition identified by a person as the one causing the most problems—or as another disabling condition (ABS 2004b).
other population surveys
A variety of population health surveys in Australia generate information on arthritis and musculoskeletal conditions at both national and regional levels. This includes not only information on the presence of the disease/condition but also associated functional limitations. All this information is virtually based on self-reports as no Australian survey has included the objective measures of using x-ray changes (conducted for example, through the National Health and Nutrition Examination survey, or NHANES, in the United States).
Professional encounters
General practitioners (GPs) are usually the first point of call for medical services in Australia. Information on GP–patient encounters is collected through the Bettering the Evaluation and Care of Health (BEACH) Survey, an ongoing national data collection looking at the clinical activities of general practitioners (AIHW: Britt et al. 2001). The General Practice Statistics and Classification Unit (an AIHW collaborating unit within the Family Medicine Research Centre, University of Sydney) conducts the survey.
BEACH began in April 1998 and involves a random sample of approximately 1,000 GPs per year, each collecting data on 100 consecutive patient encounters. The information available includes problems managed, medications, referrals, tests and investigations, and patients reasons for professional encounters.
morbidity data
Most morbidity data refer to those who seek medical help in primary care setting and hospitals. However, in the absence of any systematic data collection in primary care settings, in Australia, this information is generated using population-based surveys.
Individuals are a major source of data on incidence/prevalence, risk factors, functional limitations and use of health care services for arthritis and musculoskeletal conditions through surveys.
Information on the extent of illness and morbidity was derived from a variety of data sources. The capacity to gather together various, sometimes disparate, pieces of information is limited by a general lack of incidence/prevalence data, incomplete case ascertainment and limited identification of the clinical stage of the diseases and conditions. Information on the duration of illness or morbidity is also sketchy.

8 > surVeillAnce And monitorinG PAGE 105
Hospital separations
The National Hospital Morbidity Database, maintained at the AIHW, contains demographic, diagnostic, procedural and duration of stay information on episodes of care for patients admitted to hospital (AIHW 2000b). The data items are supplied to the AIHW by the state and territory health authorities, and by the Department of Veterans’ Affairs.
In this report, disease data relate to the principal diagnosis for hospitalisation. Data on procedures are also reported for each condition. The data can be used to provide an indication of morbidity levels in the population, as long as it is noted that admission rates are affected by differing admission practices, multiple admissions for chronic diseases and differing access to services.
mortality data
The cause of death statistics were extracted from the National Mortality Database, maintained at the AIHW. The database contains information on the cause of death supplied by the medical practitioner certifying the death or by a coroner.
Registration of deaths is the responsibility of the state and territory Registrars of Births, Deaths and Marriages. The registrars provide the information to the ABS for coding the cause of death. The AIHW maintains these data without unique identifiers in a national database, updated annually.
On 1 January 1997, the ABS introduced new, automatic coding software that identifies multiple causes of death. This information is useful for monitoring co-morbid conditions and complications. Data for both the underlying cause of death and the additional causes of death have been used in this report.
health expenditure data
Information on the economic impact of arthritis and musculoskeletal conditions is derived from the AIHW Health Expenditure Database, which contains information on direct health expenditure for about 200 different disease and injury categories. Estimates are available by age group, sex and area of expenditure—hospitals, high-level residential aged care, medical services, other professional services, pharmaceuticals and research. Capital expenditures, expenditure on community health (except community mental health), public health programs (except cancer screening), health administration and health aids and appliances, however, are not allocated by disease group.
The AIHW Health Expenditure Database is a secondary collection, based on analysis of data derived from a range of sources. The analytical techniques used and the assumptions made in arriving at these estimates are described in AIHW (2005b).
Data gaps and deficienciesSeveral gaps were identified in the currently available data for arthritis and musculoskeletal conditions. Enhancement of existing and continuing collections through improved comparability and coordination should increase their usefulness for monitoring and surveillance of arthritis and musculoskeletal conditions in Australia.
• Health surveys, based on self-reports, are major sources of national and regional prevalence data in Australia. These surveys provide information on sociodemographic characteristics, medical conditions and health status, although there are questions surrounding the validity of this approach.
– There are no national data, based on radiological or immunological information, to support self-reports.
– The current surveys do not enable one to critically differentiate between the many types of arthritis, e.g. osteoarthritis and rheumatoid arthritis.
– The survey data do not allow health status or health utilisation to be attributed to a specific disease.
• A major gap is the lack of detailed information on the use of health care services by people with arthritis and musculoskeletal conditions. Most of the care for these diseases and conditions, including specialist care, is delivered in community settings for which there are currently no systematic data available.
– Data are available on surgery and hospitalisation, but only a small proportion of those people who have arthritis and musculoskeletal conditions undergo these interventions.
– More information is needed about the factors associated with use of care by patients for their arthritis.
– Information about the use of medical specialists, particularly rheumatologists, by persons with arthritis and musculoskeletal conditions is lacking.

PAGE 106 Arthritis And musculoskeletAl conditions in AustrAliA 2005
• There are no systematic data available on the prescribing of medications; the use of rehabilitation services, such as physical and occupational therapy; or on access to other services, such as helpful devices, therapeutic exercise programs, community support and self-management.
– The need for data on the use of prescription medication is of increasing importance in light of current advances in the development of anti-inflammatory drugs (e.g. Cox-2 inhibitors) and effective, but expensive, drugs for the treatment of rheumatoid arthritis.
– There is a deficit of information on the efficacy and use of alternative health care services and herbal medications. People with arthritis and musculoskeletal conditions are major users of these services and medications.
– Rehabilitation therapy and community support services are a vast but largely uncharted territory in relation to arthritis and musculoskeletal conditions. There are few data about them and, in the case of community services, very little documentation about what services are available and how they are used.
• Some glaring gaps remain in information on risk factors for arthritis and musculoskeletal conditions.
ReferencesABS (Australian Bureau of Statistics) 2002. 2001 National Health Survey: summary of results. ABS Cat. No. 4364.0. Canberra: ABS.
ABS 2004a. Musculoskeletal conditions in Australia: a snapshot. ABS Cat. No. 4823.0. Canberra: ABS.
ABS 2004b. Disability, ageing and carers: summary of findings. ABS Cat. No. 4430.0. Canberra: ABS.
AIHW (Australian Institute of Health and Welfare) 2003. Australia’s welfare 2003. AIHW Cat. No. AUS 41. Canberra: AIHW.
AIHW 2004. Australia’s health 2004. AIHW Cat. No. AUS 44. Canberra: AIHW.
AIHW 2005a. Australian hospital statistics 2003–04. AIHW Cat. No. HSE 37. Canberra: AIHW.
AIHW 2005b. Health system expenditure on disease and injury in Australia, 2000–01. AIHW Cat. No. HWE 26. Canberra: AIHW.
AIHW: Britt H, Miller G, Knox S et al. 2004. General practice activity in Australia 2003–04. AIHW Cat. No. GEP 16. Canberra: AIHW.
AIHW: Mathers C, Vos T & Stevenson C 1999. The burden of disease and injury in Australia. AIHW Cat. No. PHE 17. Canberra: AIHW.
Cieza A, Ewert T, Ustun TB et al. 2004a. Development of ICF core sets for patients with chronic conditions. Journal of Rehabilitation Medicine 44(Supplement):9–11.
Cieza A, Schwarzkopf S, Sigl T et al. 2004b. ICF core sets for osteoporosis. Journal of Rehabilitation Medicine 44(Supplement):81–6.
Dreinhofer K, Stucki G, Ewert T et al. 2004. ICF core sets for osteoarthritis. Journal of Rehabilitation Medicine 44(Supplement):75–80.
Gaminiratne W 2001. Recent developments in causes of death statistics in Australia: automation and multiple cause coding. Genus 57:123–41.
Hill C, Parsons J, Taylor A et al. 1999. Health related quality of life in a population sample with arthritis. Journal of Rheumatology 26:2029–35.
Murray C & Lopez A 1996. Global health statistics. Boston: Harvard School of Public Health.
Stoll T, Brach M & Huber EO 2005. ICF core sets for patients with musculoskeletal conditions in the acute hospital. Disability and Rehabilitation 27:381–7.
WHO (World Health Organization) 1948. Manual of the international statistical classification of diseases, injuries and causes of death. Bulletin on the World Health Organization, Supplement 1. Geneva: WHO.
WHO 2001. International classification of functioning, disability and health. Geneva: WHO.
WICC (Classification Committee of the World Organization of Family Doctors) 1997. ICPC-2: international classification of primary care. Oxford: Oxford University Press.
APPendiX A PAGE 107
Appendix A A National Action Plan for Osteoarthritis, Rheumatoid Arthritis and Osteoporosis, 2004–2006
Osteoarthritis, rheumatoid arthritis and osteoporosis exact a significant burden on the Australian community. The impact of these conditions includes pain and suffering, reduced quality of life, and even reduced longevity, lost productivity, and significant costs associated with ongoing care and management.
People with the conditions, their families, friends and carers are all affected in some way. Around 1.8 million Australians report having osteoarthritis or rheumatoid arthritis, and after the age of 60, about half of all women and a third of all men may have a fracture due to osteoporosis.
Cost estimates for arthritis and osteoporosis range from $1.6 billion per year for direct costs alone to $18.7 billion per year for direct and indirect costs (Access Economics 2001; 2005).
In light of the substantial impact of arthritis and musculoskeletal conditions, they were designated as a National Health Priority Area in July 2002, focusing on osteoarthritis, rheumatoid arthritis and osteoporosis.
This National Action Plan, prepared by the National Arthritis and Musculoskeletal Conditions Advisory Group (NAMSCAG) and informed by advice from its working groups and stakeholders, including people with these conditions, aims to provide a blueprint for national efforts to improve the health-related quality of life of people living with osteoarthritis, rheumatoid arthritis and osteoporosis, reduce the cost and prevalence of those conditions, and reduce the impact on individuals, their carers and communities within Australia (NAMSCAG 2004).
Although several musculoskeletal conditions can affect quality of life, NAMSCAG was set up and this National Action Plan was developed to focus specifically on these three conditions initially, in order to accomplish some achievable improvement, and because of their significant disease burden. The burden of other musculoskeletal conditions and their effect on quality of life is recognised.
The National Action Plan is intended to guide the National Health Priority Action Council and the Australian Government Department of Health and Ageing in determining action for a range of activities of national significance designed to deliver better health outcomes.
It will complement both the National Chronic Disease Strategy (which is broader) and the National Service Improvement Framework for Osteoarthritis, Rheumatoid Arthritis and Osteoporosis (which is an element of the National Action Plan), and other national and state/territory structures.
our GoAl
To decrease the burden of disease and disability associated with osteoarthritis, rheumatoid arthritis and osteoporosis within Australia and improve health-related quality of life.
The National Arthritis and Musculoskeletal Conditions Advisory Group has identified the following areas where urgent action is required:
1. reducing the burden of disease
2. advancing and disseminating knowledge and understanding of osteoarthritis rheumatoid arthritis and osteoporosis
3. reducing disadvantage by considering groups with special needs
4. driving national improvements in systems and services, and
5. measuring and managing performance and outcomes.

PAGE 108 Arthritis And musculoskeletAl conditions in AustrAliA 2005
The main focus of initial efforts will be:
• promoting healthy lifestyles and self-management to optimise health outcomes for osteoarthritis, rheumatoid arthritis and osteoporosis (see 1.1, 1.6, 2.2, 2.5)
• promoting best practice for the optimal management of osteoarthritis, rheumatoid arthritis, and osteoporosis (see 1.1)
• promoting early and optimal management of rheumatoid arthritis to minimise joint damage (see 1.1)
• promoting appropriate post-fracture assessment to minimise further osteoporotic fractures (see 1.1)
• promoting timely joint replacement for osteoarthritis and rheumatoid arthritis (see 1.1), and
• developing, prioritising and progressing a research agenda to support this national health priority. This includes establishing baseline and implementing ongoing data collection systems (see 1.5).
Key to achieving these objectives will be developing and making recommendations for the wider implementation of models for education, service delivery and individual empowerment. This will depend upon building relevant partnerships and strong relationships between people with these conditions, their representative groups and medical and other health resources, and will also involve workforce development.
oBJectiVe
1. To reduce the burden of disease, we aim to:
• promote effective prevention, early intervention, diagnosis and culturally appropriate management
• facilitate the implementation of existing and evolving evidence into practice
• maintain independence and health-related quality of life, including management of pain, disability and psychosocial components
• improve the education of, and communication by, health professionals, and
• identify and promote priority areas for research.
strAteGies
Strategies to achieve these objectives will include:
1.1 Promoting effective disease prevention and management by implementing innovative evidence-based approaches to better managing osteoarthritis, rheumatoid arthritis and osteoporosis, by facilitating the implementation of existing and evolving evidence into practice, and by improving decision support for clinicians and people with these conditions
1.2 Identifying workforce and policy issues which are a barrier to implementing evidence into practice
1.3 Developing links to local, state/territory and national programs and strategies (including school programs) that focus on potentially modifiable risk factors for the prevention of chronic conditions
1.4 Improving training for health professionals in musculoskeletal conditions, with links to undergraduate and postgraduate training in medical and other health professional education
1.5 Developing and prioritising a research agenda to support this national health priority, and
1.6 Supporting education for carers and people with these conditions in self-management, including pain management.
oBJectiVe
2. Through advancing and disseminating knowledge and understanding of osteoarthritis, rheumatoid arthritis and osteoporosis, we aim to:
• improve awareness and the level of understanding in the Australian community of osteoarthritis, rheumatoid arthritis and osteoporosis, and
• improve the quality and availability of education and information for people with these conditions and their carers.

APPendiX A PAGE 109
strAteGies
With a focus on national awareness, strategies to achieve these objectives will include:
2.1 Developing and disseminating quality evidence-based information to the general community, people with these conditions and their carers on medical and related areas, including nutrition and physical activity
2.2 Creating and implementing a strategy for people with these conditions and their carers about self-management and effective treatment and management options, with credible sources of information
2.3 Developing and enhancing carer support and training by establishing links with key stakeholder groups, including health professionals and the community
2.4 Providing credible, independent advice on medicines to the community and establishing links with groups for people with these conditions and carers, to support their greater involvement in individual medicine management, and
2.5 Promoting proven self-management strategies through existing and new programs.
oBJectiVe
3. By considering the special needs of isolated and disadvantaged groups, we aim to:
• reduce barriers to accessing information and multi-disciplinary services, and
• identify gaps in knowledge about specific issues and promote research to address these gaps.
strAteGies
Strategies to achieve these objectives will include:
3.1 Building multi-disciplinary capacity in a range of health care settings
3.2 Linking in to existing work and examining different care models to help build more effective support for health practitioners and non-health community-based services in outer metropolitan, rural, regional and remote areas
3.3 Examining innovative service delivery models, and
3.4 Researching and implementing strategies to reduce health inequality.
oBJectiVe
4. Through driving national improvements in systems and services, we aim to:
• improve access to appropriate evidence-based services and practices
• increase the participation of people with these conditions and their carers in service development and evaluation, and
• promote priority areas for research.
strAteGies
Strategies to achieve these objectives will include:
4.1 Promoting systemic approaches to the management of musculoskeletal conditions
4.2 Improving service delivery and funding
4.3 Consulting and communicating with all stakeholders, and
4.4 Implementing the National Action Plan at national, and state and territory levels, and promoting the development of state and territory action plans.

PAGE 110 Arthritis And musculoskeletAl conditions in AustrAliA 2005
oBJectiVe
5. Through performance measurement and management, we aim to:
• establish and monitor the disease burden in the Australian community
• monitor and evaluate the impact of the National Action Plan strategies on health-related quality of life, burden of disease and disability, and
• provide evidence to inform policy and further planning.
strAteGies
Strategies to achieve these objectives will include:
5.1 Gathering information on the disease burden related to osteoarthritis, rheumatoid arthritis and osteoporosis
5.2 Planning and developing the ongoing collection of comprehensive data
5.3 Developing and monitoring performance indicators that are clearly related to the goals, objectives and strategies of the National Action Plan, and
5.4 Evaluating and projecting the impact of the National Action Plan, including on workforce and other health resources.
ReferencesAccess Economics 2001. The burden of brittle bones: costing osteoporosis in Australia. Canberra: Access Economics.
Access Economics 2005. Arthritis the bottom line – the economic impact of arthritis in Australia. Canberra: Access Economics.
NAMSCAG (National Arthritis and Musculoskeletal Conditions Advisory Group) 2004. Evidence to support the National Action Plan for Osteoarthritis, Rheumatoid Arthritis and Osteoporosis: opportunities to improve health-related quality of life and reduce the burden of disease and disability. Canberra: Department of Health and Ageing. <http://www.nhpac.gov.au>.
APPendiX B PAGE 111
Appendix B Statistical methods and classifications
This appendix describes the methods used to calculate the various estimates presented in this report. Since the focus of the report is on generating baseline information for a variety of population health measures, to be followed up over the years for regular surveillance and monitoring of arthritis and musculoskeletal conditions, an effort is made here to describe the context within which this information has been generated. No attempt is made to describe the epidemiological concepts beyond their basic descriptions.
The baseline information included in this report attempts to answer the following questions:
• How much disease is occurring in the population?
• How does it vary across the population?
• What are the underlying trends?
• What is the extent of pain and functional limitations?
• How much and what type of health service use is there?
• What about the quality of life?
• How do we measure the contribution of arthritis and musculoskeletal conditions to mortality?
• How do we summarise the impact?
how much disease is occurring in the population?
The extent of arthritis and musculoskeletal problems in the population is best measured by the epidemiological parameters of prevalence and incidence. Both national and regional data are available to estimate prevalence for several arthritis and musculoskeletal conditions, including osteoarthritis, rheumatoid arthritis and osteoporosis. The incidence data are, however, difficult to come by.
Prevalence
Prevalence, or point prevalence to be more specific, refers to the number or proportion (of cases, instances, etc.) present in a population at a given time. Prevalence data provide an indication of the extent of the problem and may have implications for the provision of services in a community. The formula for calculating the prevalence rate is:
Prevalence rate = Number of existing cases*
Population at risk *
* during specified time period
Most of the information available on the prevalence of arthritis and musculoskeletal conditions is predicated upon the existence of these conditions long term; that is, that they have been present or are likely to be present for six months or more. Acute, one off cases, lasting less than 6 months, are excluded from the counts.
Since, many forms of arthritis and several other musculoskeletal conditions are intermittent, recurrent and episodic in nature, the long-term specification gives a more reliable estimate of their chronic prevalence.
The above qualification does not allow estimation of period prevalence—the proportion of people who experience the problem in a defined period.
PAGE 112 Arthritis And musculoskeletAl conditions in AustrAliA 2005
Incidence
Incidence refers to the number of new cases (of a disease, condition or event) occurring during a given period, say a year. The incidence rate uses new cases in the numerator; individuals with a history of the condition are not included. Often expressed as X cases per given population base (e.g. 10,000 or 100,000), the formula for calculating incidence is:
Incidence = Number of new cases*
Population at risk *
* during specified time period
Even though individuals who have already developed the condition should be excluded from the denominator, incidence rates are often expressed based on the average population rather than the population at risk. In the case of chronic conditions, where most people appear to be at risk, the distinction between populations at risk and the whole population appears to be less critical (Friis & Sellers 1999).
The incidence/prevalence information may not necessarily be based upon the presence of the disease or condition in the whole population count or a sample. Sometimes this information can be generated from other related sources. For example, information on the incidence of hip fracture can be derived from hospital separations data because everyone with a hip fracture is invariably hospitalised. Mortality data can also be used to obtain estimates of incidence or prevalence; however, this source of information may not be of much use in the surveillance and monitoring of arthritis and musculoskeletal conditions.
Estimated resident population
The denominator used for estimating both prevalence and incidence is usually the estimated resident population (ERP). The estimate is based on the five-yearly ABS Census of Population and Housing to which several adjustments are made. ERP is updated each year using indicators of population change such as births, deaths, net migration and overseas visitors.
how much does it vary across the population?
Both the prevalence and incidence of the disease or condition may vary by age, sex, ethnicity, and location. Age-specific rates may be used to map this variation. However, to remove the influence of varying age structures in comparing sub-populations, the rates need to be age-standardised.
Australian Standard Population
The 2001 Australian population was used as the standard population in all age standardisation procedures, unless otherwise stated. The composition of this population is described in Table B.1. Both AIHW and ABS have agreed to adopt this as the national standard.
The population at 30 June 1991 was the standard used until 2002. For this reason, age-standardised death rates in this publication are not directly comparable with those given in several publications before 2002. For proper comparisons, all estimates were standardised to the 2001 Australian Population.
Age-specific rates
Age-specific rates are calculated by dividing the number of events (such as deaths, disease cases or hospital separations) occurring in each specified age group by the mid-year ERP for the corresponding age group. This is usually expressed as a rate per 100,000 population. The rate may be calculated for particular age and sex groups. For example:
Hospitalisation rate for Column 1 for this age x 100,000
males aged 75–79 Column 2 for this age
11,099 x 100,000
243,536
4,557 per 100,000 population
=
=
=

APPendiX B PAGE 113
Table B1: Age-standardisation of rates (example)
Age group
No. of separations (column 1)
Aust male pop 31 Dec 2003
(column 2)
Age-specific rate per 100,000
(column 3)
Aust Standard Population 2001(a)
(column 4)Expected no.
(column 5)
0–4 1,429 650,022 220 1,282,357 2,819
5–9 1,649 684,586 241 1,351,664 3,256
10–14 2,386 709,516 336 1,353,177 4,551
15–19 5,991 702,165 853 1,352,745 11,542
20–24 8,099 705,889 1,147 1,302,412 14,943
25–29 8,729 684,840 1,275 1,407,081 17,935
30–34 11,336 754,965 1,502 1,466,615 22,022
35–39 12,681 726,138 1,746 1,492,204 26,059
40–44 15,116 765,926 1,974 1,479,257 29,194
45–49 15,572 703,926 2,212 1,358,594 30,054
50–54 16,922 655,650 2,581 1,300,777 33,572
55–59 18,443 595,211 3,099 1,008,799 31,258
60–64 15,731 448,112 3,511 822,024 28,857
65–69 13,819 361,674 3,821 682,513 26,078
70–74 12,936 301,123 4,296 638,380 27,424
75–79 11,090 243,536 4,554 519,356 23,650
80–84 7,076 150,382 4,705 330,050 15,530
>=85 3,658 92,188 3,968 265,235 10,524
Total 182,663 9,935,849 1,838 19,413,240 359,269
(a) Australian Bureau of Statistics 2004b
Age-standardised rate (AS rate)
The rates of prevalence, incidence, hospital separation and death are age standardised to remove the influence of varying age structures when comparing populations spatio-temporally. The procedure is also important in undertaking trend analysis. Age standardisation is done by applying age-specific rates to a standard population. The 2001 Australian population is currently used as the standard in all comparisons, unless otherwise stated.
Direct age standardisation was used in this report for prevalence, incidence, hospital separations and mortality estimates. The calculation of direct age-standardised rates (AS rates) comprises three steps, which can be followed by reference to the example table (Table B1).
Step 1: Calculate the age-specific rate (as shown on page 112) for each age group (column 3).
Step 2: Calculate the expected number of cases in each age group by multiplying the age-specific rate (column 3) by the corresponding standard population for each age group (column 4) and dividing by 100,000, giving the expected number of cases (column 5)
Step 3: Sum the expected number of cases in each age group (total column 5) and divide this sum by the total of the standard population used in the calculation and multiply by 100,000.
Indirect age standardisation was not used for any of the estimates given in this report.
What are the underlying trends?
A major interest in establishing baselines is that over time this information could be viewed in a more meaningful, historical perspective. Regular time series are required to study the underlying trends. This information would be useful in public policy decisions, including the evaluation of health programs and the modifications of existing programs.
PAGE 114 Arthritis And musculoskeletAl conditions in AustrAliA 2005
Several conceptual and methodological problems beset the interpretation of arthritis and musculoskeletal time series. The best national information on these diseases and conditions is limited to illness and disability data. The focus mostly is on the occurrence of the disease. However, even that information is limited in content and consistency between the surveys. The 2001 National Health Survey data, for example, has no information about disease onset. The information regarding their acute presentation or as a long term condition, based on self-reports, is also difficult to tease out. The declaration of osteoarthritis as a long-term condition, regardless of onset, poses another problem for the interpretation of changes in its prevalence.
In view of these and other difficulties, limited time series information has been included in the report.
What is the extent of pain and functional limitations?
Pain, acute or chronic, is the most common outcome of most forms of arthritis and musculoskeletal conditions. The measurement of pain is much more subjective an issue and is dealt with in this report as chronic/recurrent pain. In SDAC, pain was defined as, ‘chronic or recurrent pain or discomfort, limiting activities’. No information is available on acute pain.
The severity of pain may lead to greater functional limitations among people with arthritis and musculoskeletal conditions. Information on functional limitations is derived from SDAC, which enumerates the number of people having disability specifically linked to their condition. This is referred to as the ‘main disabling condition’—a long-term condition identified by a person as the one causing the most problems (ABS 2004a). People with a main disabling condition are identified having ‘specific restriction’. A ‘specific restriction’ is a restriction in core activities (self-care, mobility and communication), schooling or employment. Four levels of core-activity restriction are determined, based on whether a person needs personal assistance with, has difficulty with, or uses aids or equipment for any of the core activities. A person’s overall level of core-activity restriction is determined by the highest level of restriction the person experienced in any of the core-activity areas. A core-activity restriction may be:
• profound—unable to perform, or always needs help with, a core-activity
• severe—sometimes needing assistance to perform a core-activity
• moderate—not needing assistance, but having difficulty performing a core-activity
• mild—having no difficulty performing a core-activity but using aids or equipment because of disability.
It should be noted that activity restriction is equivalent to the ICF concept of ‘activity limitation’. The SDAC categorises all forms of arthritis as ‘arthritis and related disorders’; no information on specific types of arthritis (i.e. osteoarthritis, rheumatoid arthritis) is therefore available. The self-reported numbers for osteoporosis are also low for any meaningful reporting. Given small numbers, the disability and functional limitations associated with arthritis and musculoskeletal conditions have been presented as proportion of persons with a disability.
how do we measure mortality?
Arthritis and musculoskeletal conditions are largely non-fatal in their impact. Four different methods are used to assess this impact:
• as the underlying cause of death
• as an additional cause of death
• death within a defined period after an adverse event
• using aetiological fractions.
Given the small numbers, the mortality associated with arthritis and musculoskeletal conditions has been sometimes presented as the number of deaths, or as crude death rates. The crude death rate is the number of deaths in a year divided by ERP. However, since the risk of dying varies greatly with age, even small differences in the age structure of populations may affect crude death rates. This makes comparisons between different populations and analysis of time trends in the same population difficult and even misleading.
The statistics relating to deaths, therefore, are mostly presented as age-specific death rates and age-standardised death rates. The age-specific death rate is mortality at a particular age; however, this requires that separate comparisons be made for each age group. Variations in age structure, between populations or over time, can be adjusted by age-standardisation, as described earlier. In this report, unless otherwise specified, death rates have been directly age-standardised to the Australian population as at 30 June 2001 (ABS 2004b).

APPendiX B PAGE 115
As an underlying cause of death
The cause of death information provides insights into the events around the end of life that either directly lead to or contribute to death. A single disease, medical condition or event considered to be responsible for each death, termed the underlying cause of death, is commonly used to generate this information. The set of diseases, injuries or complications that contribute to death, other than the underlying cause of death, are termed associated cause(s) of death. Together, the two types are called the multiple causes of death.
As an additional cause of death
The ABS, coders and compilers of national mortality statistics, reported only the underlying cause of death until recently. However, since 1997, both underlying and associated causes listed on the death certificate have been extracted. Consequently, a fuller picture of reasons and circumstances of a death is now available. For external causes of death, it not only identifies the nature of the injury or poisoning but also any other causes of death as well.
Most of this information has been organised by those underlying causes of death for which arthritis and musculoskeletal conditions are listed as an additional cause of death. No attempt is made to seek associations with other additional causes of death.
Death within a defined period after an adverse event
Mortality following an adverse event within a defined period can be sometimes used as an indicator of the severity of that problem. For example, to assess the impact of hip fractures in terms of mortality, all deaths occurring within 12 months of fracture were used to describe the hip fracture mortality in this report. Deaths occurring within 30 days after admission for hip fracture are another source of information. Both these methods have been used in this report for studying the impact of hip fractures attributable to osteoporosis.
Using aetiological fractions
Deaths attributed indirectly to a particular disease or condition can be assessed if the prevalence of the condition and its relative risk for mortality are known. For some of the conditions, information on attributable fractions is available from various epidemiological studies. For example, the attribution of osteoporosis to hip fracture which, in turn, has a certain associated risk for mortality, has been reported by Harris et al. (1998), and was used in this report to gain some insight into osteoporosis mortality.
how much and what type of health service use is there?
Determining how many people with arthritis and musculoskeletal conditions will present to their GP or Emergency Services unit or be hospitalised, is complex. This information can be viewed to indicate both the need and use of medical care and disease prevalence.
General practice visits
All the information on general practice (GP) visits in relation to arthritis and musculoskeletal conditions has been derived from BEACH (Bettering the Evaluation and Care of Health) Survey, an ongoing national data collection looking at the clinical activities of GPs (AIHW: Britt et al. 2004). BEACH began in April 1998 and involves a random sample of approximately 1,000 general practitioners per year, each collecting data on 100 consecutive patient encounters. The information available includes problems managed, medications, referrals, tests and investigations, and the patients, reasons for professional encounters.
GPs provide over 100 million consultations in Australia each year. They are usually the first point of call, also called a GP–patient encounter, for medical services in Australia. Rates per 100 encounters are used as the measure for a particular disease or condition; this includes a patient’s reasons for the encounter, problems managed, or medications prescribed or advised. Rates per 100 problems are used when a management event can occur more than once per problem managed (e.g. prescribed drugs, orders for radiology).
A large proportion of people with arthritis and musculoskeletal conditions may not consult their GPs about their symptoms for an extended period following the onset of their disease. Also, those who consult a GP may not take advantage of other available health services.

PAGE 116 Arthritis And musculoskeletAl conditions in AustrAliA 2005
Hospital separations
The National Hospital Morbidity Database, maintained at the AIHW, contains demographic, diagnostic, procedural and duration of stay information on episodes of care for patients admitted to hospital (AIHW 2005). The data items are supplied to the AIHW by the state and territory health authorities, and by the Department of Veterans’ Affairs.
In this report, disease data relate to the principal diagnosis for hospitalisation. This is the condition established to be chiefly responsible for occasioning the admission to the hospital. The principal diagnosis is not necessarily the underlying cause of disease; it may only be a manifestation of the disease (AIHW 2005). Information on additional diagnoses, whether contributing to the reason of principal diagnosis or not, is also listed and is useful for seeking insight into the contribution of various conditions to illness and morbidity. Data on procedures are also reported for each condition.
A procedure can be surgical or non-surgical and can treat or diagnose a condition or be of a patient-support nature such as anaesthesia. The procedures are usually presented with the procedure blocks that describe procedures at a specific level, beginning with the least invasive procedure through to the most invasive.
The data can be used to provide an indication of morbidity levels in the population, as long as it is noted that admission rates are affected by differing admission practices, multiple admissions for chronic diseases and differing access to services.
Information is also provided on the mean duration of stay at the hospital. Information on in-hospital outcomes such as inpatient mortality as well as transfer to other institutions is also reported.
Quality of life
Information on the quality of life is derived from the quality of life measure in the 2001 NHS –‘The Delighted–Terrible Scale’ (Andrews and Withy 1987). It is a seven-point scale that provides a general indicator of satisfaction of life. Adult respondents were asked to choose from seven options in response to the question: ‘How do you feel about your life as a whole, taking into account what has happened in the last year, and what you expect to happen in the future?’. The response options are:
• 1—Delighted
• 2—Pleased
• 3—Mostly satisfied
• 4—Mixed
• 5—Mostly dissatisfied
• 6—Unhappy
• 7—Terrible
measure of psychological distress
Information on psychological distress is based on ‘The Kessler Psychological Distress Scale-10 (K10)’ in the 2001 NHS. The K10 is a 10-item questionnaire, yielding a measure of psychological distress based on questions about negative emotional states experienced in the four weeks prior to interview. It contains low- through to high-threshold items. For each item, there is a five level response scale based on the amount of time that a respondent experienced the particular problem. The response options are none of the time, a little of the time, some of the time, most of the time, and all of the time. Each of the items is scored from 1 (for none of the time) to 5 (for all of the time). Scores for the 10 items are summed, yielding minimum low levels of psychological distress with high scores indicating high levels of psychological distress. The scores are grouped as follows:
• Low (scores of 10–15, indicating little or no psychological distress)
• Moderate (scores of 16–21)
• High (scores of 22–29), and
• Very high (scores of 30–50), indicating very high levels of psychological distress.

APPendiX B PAGE 117
how do we summarise the impact?
Because of their nature, arthritis and musculoskeletal conditions affect a variety of physical and psychological health domains. The impact is mainly reflected in disability. Based on data from the NHS and SDAC, seven different domains are used to assess the impact:
• overall health status
• quality of life
• functional limitation
• use of aids and home modification
• need for assistance
• employment restriction
• social participation.
summary measures
Summary measures, such as disability-adjusted life years (DALY), years of life lost (YLL) and years of healthy life lost due to disability (YLD), have been quoted throughout this report to describe the burden of chronic diseases. All these estimates are from the AIHW’s Australian Burden of Disease and Injury Study (AIHW: Mathers et al. 1999). The Australian study adapted the methods of the Global Burden of Disease study (Murray & Lopez 1996) to the local context, drawing extensively on Australian sources of health data.
data classification
The statistical methods mentioned previously use different classification methods for coding diseases (Table B2) and conditions. These are described below.
Mortality classifications
Australia uses the International Statistical Classification of Diseases and Related Health Problems, tenth revision (ICD-10) classification system for coding of causes of death. In this report, data on deaths before 1997 have been coded to ICD-9 (International Classification of Diseases, Ninth Revision) and thereafter to ICD-10. The introduction of ICD-10 and the move from manual coding to automated cause of death coding has resulted in a break in the deaths time series. To overcome this difficulty, the ABS coded the 1997 deaths data using both ICD-9 (manual coding) and ICD-10 (automatic coding), which allowed comparability factors between ICD-9 and ICD-10 to be derived.
Table B2: Classification/codes used in various health data sources
AIHW National Mortality Database
Condition ICD-10 codes
Diseases of the musculoskeletal system and connective tissue M00–M99
Rheumatoid arthritis M05, M06
Osteoarthritis M15–M19
Osteoporosis M80–M82
AIHW National Hospital Morbidity Database
Condition ICD-10-AM codes
Diseases of the musculoskeletal system and connective tissue M00–M99
Rheumatoid arthritis M05, M06
Osteoarthritis M15–M19
Osteoporosis M80–M82
(Continued)

PAGE 118 Arthritis And musculoskeletAl conditions in AustrAliA 2005
Table B2: Classification/codes used in various health data sources (continued)
BEACH Survey
Condition ICPC-2-PLUS codes
Diseases of the musculoskeletal system and connective tissue L
Rheumatoid arthritis L88
Osteoarthritis L83011, L84004, L84009, L84010, L84011, L84012, L89001, L90001, L91001, L91003, L91008, L91015, L92007
Osteoporosis L95
2001 National Health Survey
Condition CURF codes (derived from ICD-10 codes)
Diseases of the musculoskeletal system and connective tissue 71–80
Rheumatoid arthritis 72
Osteoarthritis 73
Osteoporosis 80
2003 Survey of Disability, Ageing and Carers
Condition CURF codes (derived from ICD-10 codes)
Diseases of the musculoskeletal system and connective tissue 1301, 1303, 1304, 1306, 1307, 1399
Arthritis and related disorders 1301
Osteoporosis 1304
Morbidity classifications
For hospital diagnosis and procedure the ICD classifications (ICD-9 and ICD-10) have been modified for Australia. Hospital data before 1998–99 were coded using ICD-9-CM (International Classification of Diseases, ninth revision, Clinical Modification) and thereafter using ICD-10-AM (International Statistical Classification of Diseases and Related Health Problems, tenth revision, Australian Modification).
Primary care classifications
The general practice data follow the International Classification of Primary Care Second, edition (ICPC-2) (WICC 1997). Used in more than 45 countries as the standard for data classification in primary care, the ICPC has recently been accepted by WHO in the WHO Family of Classifications and has been declared the national standard in Australia for reporting of health data from general practice and patient self-reported health information (AIHW: Britt et al. 2004).
The ICPC classification has a bi-axial structure, with 17 chapters based on body systems along one axis and seven components covering signs, symptoms, process of care and diagnoses along the other. The processes of care, including referrals, non-pharmacological treatments and orders (pathology and imaging), were classified by the process components of the ICPC-2 (AIHW: Britt et al. 2004).
NHS long-term conditions classifications
In the 2001, NHS information on diseases and conditions are based on long-term conditions. These are defined as medical conditions (illness, injury or disability) which were current at the time of the survey and which have lasted at least six months, or which the respondent expects to last for six months or more, including:
• long-term conditions experienced from which only infrequent attacks may occur
• long-term conditions which may be under control (for example, through the continuing use of medication)
• conditions which, although present, may not be generally considered ‘illness’ because they are not necessarily debilitating, such as reduced sight, and
• long-term or permanent impairments or disability (ICD-10 classification of diseases). This is a derived item. Multiple categories (1–19) are aggregated to obtain the prevalence of a certain long-term condition.

PAGE 119
Disability characterisations
The loss of healthy life due to non-fatal conditions can be categorised using a variety of classifications. The International Classification of Functioning (ICF), a care member of the WHO family of health-related classifications, conceptualises disability as multi-dimensional, relating to the body functions and structures of people, the activities they do, the life areas in which they participate and the factors in the environment that affect these experiences (WHO 2001). The ABS Survey of Disability, Ageing and Carers (ABS 2004a) operationalises these concepts into 17 different types of limitations, restrictions or impairments. These characteristics can be further related to specific diseases and conditions.
The extent of disability associated with various diseases and conditions can also be categorised using disability weights, or health state preferences (Murray & Lopez 1996). However, no Australia-specific disability weights have been generated. The Australian Burden of Disease Study used numerical categorisation of disability based on the years of healthy life lost due to time lived in states other than the reference state of good health, or YLD (AIHW: Mathers et al. 1999). Both disability weights and the YLD categorisation give a broader interpretation of morbidity or ill health, concepts that are not fully picked up by the ABS survey instrument.
ReferencesABS (Australian Bureau of Statistics) 2004a. Basic confidentialised unit record file: Survey of Disability, Ageing and Carers. ABS Cat. No. 4430.0. Canberra: ABS.
ABS 2004b. Australian demographic statistics. ABS Cat. No. 3101.0. Canberra: ABS.
AIHW (Australian Institute of Health and Welfare) 2005. Australian hospital statistics 2003–04. AIHW Cat. No. HSE 37. Canberra: AIHW.
AIHW: Britt H, Miller GC, Knox S et al. 2004. General practice activity in Australia 2003–04. AIHW Cat. No. GEP 16. Canberra: AIHW.
AIHW: Mathers C & Penm R 1999. Health system costs of injury, poisoning and musculoskeletal disorders in Australia 1993–94. AIHW Cat. No. HWE No. 6. Canberra: AIHW.
Andrews FM & Withy SB 1987. The Delighted Terrible Scale. In: McDowell I & Newell C (eds). Measuring health: a guide to rating scales and questionnaires. New York: Oxford University Press.
Friis RH & Sellers TA 1999. Epidemiology for public health practice, 2nd ed. MA: Aspen Publishers, Inc.
Harris AH, Cumming R, Watts J et al. 1998. The burden of illness and the cost of osteoporosis in Australia. Centre for Health Program Evaluation Technical Report no. 8. Melbourne: Monash University.
Murray C & Lopez A 1996. Global health statistics. Boston: Harvard School of Public Health.
WHO (World Health Organization) 2001. International classification of functioning, disability and health. Geneva: WHO.
APPendiX B


APPendiX c PAGE 121
Appendix C Health system costing methodology
Health expenditure is money spent by both governments and individuals to purchase or provide goods and services for health. The Australian Government is the major payer through Medicare, along with state, territory and local governments. The Australian Government also pays for many public health programs and for health insurance through tax incentives. Individuals also pay out of pocket for expenses not covered by Medicare, as well as inputting through the Medicare levy and insurance premiums. In addition to these direct costs, both individuals and the society have indirect costs accruing through work loss, informal care and mortality.
The AIHW Health Expenditure Database is a satellite national account. Satellite accounts enable the linkage of non-monetary data sources and analysis to the monetary accounting system. This database was compiled by allocating the total recurrent health expenditure to various sectors for over 200 diseases and injury categories based on those used in the Australian Burden of Disease Study (AIHW: Mathers et al. 1999). The disease expenditure estimates for 2000–01 have also been derived using a methodology consistent with that used for 1993–94, allowing comparisons between estimates for the two years.
The Health Expenditure Database covers the following health care sectors:
• hospitals (admitted and non-admitted patients)
• aged care homes
• out-of-hospital medical services (including general practitioners (GPs), specialists, imaging and pathology)
• pharmaceuticals (prescription drugs and over-the-counter medications)
• other professional services (such as physiotherapy, chiropractors and osteopaths), and
• health-related research.
Expenditure for admitted hospital patients, aged care homes, out-of-hospital medical services and pharmaceutical prescription drugs were based on analysis of the 2000–01 recurrent health expenditure data. However, expenditure allocation estimates for non-admitted hospital patients, over-the-counter medications, other professional services and health-related research were not available. Instead estimates were calculated by adjusting the 1993–94 estimates (AIHW: Mathers et al. 1998) for changes in both overall expenditure for each sector, and in the age and sex structure of the population. These estimates are approximations and therefore should be used with caution.
Further details of the methodology used to compile the AIHW Health Expenditure Database are available in Health System Expenditure on Disease and Injury in Australia 2000–01 (AIHW 2005).
Areas of health expenditure
Hospital services
Expenditure for the hospital sector is comprised of expenditure for both admitted and non-admitted patients. Admitted patient expenditure for public hospitals is estimated using the admitted patient fractions published in Australian Hospital Statistics 2001–02 (AIHW 2003a). The expenditure for private hospitals is derived from the ABS Private Health Establishments Survey.
The hospital expenditure for admitted patients is estimated by allocating the total admitted patient expenditure to each hospital separation episode, with adjustments for level of resources required for treating a specific episode (using the Diagnostic Related Groups, or DRGs) and length of stay. DRG weights were also used to adjust for costs in the hospital where the treatment was provided; this ensures that the average cost for the hospital was the same as the average for the state. For sub-acute and non-acute patients, cost data were extracted from the sub-acute and non-acute patient (SNAP) study (Eager et al. 1997) and inflated to 2000–01 estimates using the price deflator for government consumption expenditure on hospital and nursing home care (AIHW 2002). Medical services expenditure for private patients is based on the fee charged by private medical practitioners for in-hospital services as collected by the Health Insurance Commission (HIC).

PAGE 122 Arthritis And musculoskeletAl conditions in AustrAliA 2005
The expenditure estimates for non-admitted patients was obtained from Australian Hospital Statistics 2001–02 (AIHW 2003a). Expenditure by disease for 2000–01 was calculated by adjusting the 1993–94 data for demographic changes.
Aged care homes
The aged care system includes both nursing homes and hostels. Expenditure for residents with high levels of dependency is used to estimate services delivered by nursing homes. These estimates are reported in Health Expenditure Australia 2001–02 (AIHW 2003b). Disease allocation is based on data from the ABS 2003 Survey of Disability, Ageing and Carers (ABS 2004).
Out-of-hospital medical services
Expenditure for out-of-hospital medical services includes private medical services that are provided by general practitioners (GPs) and specialists. The Bettering the Evaluation of Care of Health (BEACH) Survey of GPs was used to allocate out-of-hospital medical services expenditure by disease. Expenditure for unreferred attendances, imaging and pathology were allocated according to general practice encounters and expenditure for other medical services on the basis of the referral pattern. When multiple conditions were presented in the general practice encounter, allocation was done on a pro-rata basis. Medical services provided in the hospital were included in admitted patient hospital expenditure.
Pharmaceuticals
Expenditure on pharmaceuticals was estimated from prescribed and over-the–counter (OTC) medication payments. Data on prescription drugs expenditure was provided by the Pharmaceutical Benefits Scheme (PBS) and the Department of Veterans’ Affairs Repatriation Pharmaceutical Benefits Scheme (RPBS). Expenditure data for drugs purchased on private prescriptions, not through PBS or RPBS, and under co-payment drugs were obtained from the Pharmacy Guild survey. The BEACH Survey was used to allocate prescription drug expenditure by diseases, based on the pattern of prescription of a particular drug to the problem managed in general practice encounters. This pattern was assumed to be the same for the specialist-written prescriptions. Pharmaceuticals provided through hospitals were included in hospital expenditure.
Expenditure for OTC medication was calculated by subtracting expenditure on private prescriptions and under co-payment drugs from all non-benefit paid pharmaceutical expenditure estimates reported in Health Expenditure Australia 2001–02 (AIHW 2003b). OTC medication expenditure allocated by disease for 2000–01 was calculated by adjusting the 1993–94 estimates for demographic changes.
Other professional services
Data for expenditure on other professional services were obtained from Health Expenditure Australia 2001–02 report (AIHW 2003b). Disease-specific estimates were made by adjusting the 1993–94 estimates for demographic changes over the period between 1993–94 and 2000–01.
Research
Expenditure on research was also obtained from the Health Expenditure Australia 2001–02 (AIHW 2003b). Data from the ABS Research and Experimental Development Survey allowed the estimate to be allocated by disease.
PAGE 123APPendiX c
references
ABS (Australian Bureau of Statistics) 2004a. Basic confidentialised unit record file: Survey of Disability, Ageing and Carers. ABS Cat. No. 4430.0. Canberra: ABS.
AIHW (Australian Institute of Health and Welfare) 2002. Australian health expenditure 2000–01. AIHW Cat. No. HWE 20. Canberra: AIHW.
AIHW 2003a. Australian hospital statistics 2001–02. AIHW Cat. No. HSE 25. Canberra: AIHW.
AIHW 2003b. Health expenditure Australia 2001–02. AIHW Cat. No. HWE 24. Canberra: AIHW.
AIHW 2005. Health system expenditure on disease and injury in Australia 2000–01. Second ed. AIHW Cat. No. HWE 28. Canberra: AIHW.
AIHW: Mathers C, Penm R, Carter R et al. 1998. Health system costs of diseases and injury in Australia 1993–94. AIHW Cat. No. HWE 5. Canberra: AIHW.
AIHW: Mathers C, Vos T & Stevenson C 1999. The burden of disease and injury in Australia. AIHW Cat. No. PHE 17. Canberra: AIHW.
Eager K , Gordon R, Hodkinson A et al. 1997. The Australian national sub-acute and non-acute patient (AN-SNAP) casemix classification: report of the national sub-acute and non-acute casemix classification study. Wollongong: Centre for Health Service Development, University of Wollongong.


PAGE 125
Appendix DDefinitions of terms and measures
additional diagnosis Conditions or complaints either co-existing with the principal diagnosis or arising during the episode of care. Additional diagnoses give information on factors that result in increased length of stay, more intensive treatment or the use of greater resources.
admitted patient A patient who undergoes a hospital’s formal admission process to receive treatment and/or care. This treatment and/or care is provided over a period of time and can occur in hospital and/or in the person’s home.
age-specific rate A rate for a specific age group. Both the numerator and denominator relate to the same age group.
age-standardisation A method of removing the influence of age when comparing populations with different age structures. This procedure is required because the incidence and prevalence of many diseases varies strongly (usually increasing) with age. The age structures of different populations are converted to the same ‘standard’ structure, and the incidence/prevalence rates are calculated.
appropriate Suitable for a particular person or place or condition; appropriate for achieving a particular end. Implies best practice.
arthritis A group of disorders in which there is inflammation of the joints, which can become stiff, painful, swollen or deformed. The two main types of arthritis are osteoarthritis and rheumatoid arthritis.
associated cause(s) of death Any condition(s), diseases and injuries—other than the underlying cause—contributing to death. See also cause of death.
auto-immune diseases Diseases, such as rheumatoid arthritis and type 1 diabetes in which the immune system reacts against its own body tissues.
average length of stay (ALOS) The average of the length of stay in hospital for admitted patient episodes.
body mass index (BMI) A standardised measure of weight adjusted for person’s height. BMI is calculated by dividing the person’s weight (in kilograms) by their height (in metres) squared, that is, kg ÷ m2. For both men and women, underweight is a BMI below 18.5, acceptable weight is from 18.5 to less than 25, overweight is 25 and above (includes obese), and obese is 30 and over.
capacity building An approach or a set of approaches that seek to enhance the potential that systems, programs and activities will be sustainable long term and will give individuals and services a greater ability to address health issues.
carer Someone who looks after a relative or friend who has a disability, a chronic illness or is a frail, aged person. Carers come from all walks of life, cultural backgrounds and age groups.
cause of death From information reported on the medical certificate of cause of death, each death is classified by the underlying cause of death, according to rules and conventions of various editions of the International Classification of Diseases. The underlying cause is defined as the disease that initiated the train of events leading directly to death. Deaths from injury or poisoning are classified according to the circumstances of the violence that produced the fatal injury, called the external cause(s) of death, rather than to the nature of the injury.
chronic Persistent and long-lasting.
chronic diseases Term applied to a diverse group of diseases, such as heart disease, cancer and arthritis (to name a few), that tend to be long lasting and persistent in their symptoms or development. Although these features also apply to some communicable diseases (infections), the term is usually confined to non-communicable diseases.
APPendiX d

PAGE 126 Arthritis And musculoskeletAl conditions in AustrAliA 2005
clinical guidance document Document designed to provide direction or advice as to a decision or course of action. Based on best evidence in accordance with NHMRC guidelines.
comorbidity The occurrence of two or more health problems in a person at the same time.
cross-sectoral Refers to fields across different sectors of government and the community such as health, education etc.
direct costs Financial costs to the Australian health system for providing prevention and treatment services, such as hospitals, aged care homes, primary care and specialist services, pharmaceuticals and other medications, allied health services, research, health administration etc.
disability A concept of several dimensions relating to an impairment in body structure or function, a limitation in activities (such as mobility and communication), a restriction in participation (involvement in life situations such as work, social interaction and education), and the affected person’s physical and social environments.
disability-adjusted life year (DALy) Years of healthy life lost through either premature death or through living with disability due to illness or injury.
early intervention Timely identification and tailored advice and support for those identified with a condition. ‘Early’ does not necessarily mean early in life but rather early in the time course or progress of a condition; a nexus between prevention and treatment.
effective Care, intervention or action that achieves the desired outcome. Incorporates cost effective–producing the intended effect with consideration of the costs involved.
enhance family and carer support To improve or make more effective or advanced, to augment the support provided to families and/or carers of individuals with a particular condition.
establishing/developing links Creating and developing an element of connection, association or relationship between two or more parties, usually by means of communication.
external cause Environmental event, circumstance and/or condition as the cause of injury, poisoning and/or other adverse effect. The term is used in disease classification.
gross domestic product (GDP) A statistic commonly used to indicate national wealth. It is the total market value of goods and services produced within a given period after deducting the cost of goods and services used up in the process of production but before deducting allowances for the consumption of fixed capital.
health professional A person who helps in identifying, preventing or treating illness or disability such as general practitioners, allied health professionals, specialists etc.
health-related quality of life Complete physical, mental and social wellbeing, including psycho-social components and pain management.
hostel Establishment for people who cannot live independently but who do not need nursing care in a hospital or nursing home. Hostels provide board, lodging or accommodation and cater mostly for the aged, distressed or those with a disability. Residents are generally responsible for their own provisions but may be given domestic assistance such as help with meals, laundry and personal care.
impairment Any loss or abnormality of psychological, physiological or anatomical structure or function.
incidence The number of new cases (of an illness or event etc.) occurring during a given period. Compare with prevalence.
indicator A key statistic chosen to describe (indicate) a situation concisely, help assess progress and performance, and act as a guide to decision making. It may have an indirect meaning as well as a direct one; for example, overall death rate is a direct measure of mortality but is often used as a major indicator of population health.
Indigenous A person of Aboriginal and/or Torres Strait Islander descent who identifies as an Aboriginal and/or Torres Strait Islander and is accepted as such by the community with which he or she is associated.
indirect costs The costs to the community due to the condition other than direct costs, such as the loss of earnings due to absenteeism and early retirement, the loss of potential tax revenue, and the value of volunteer carers.
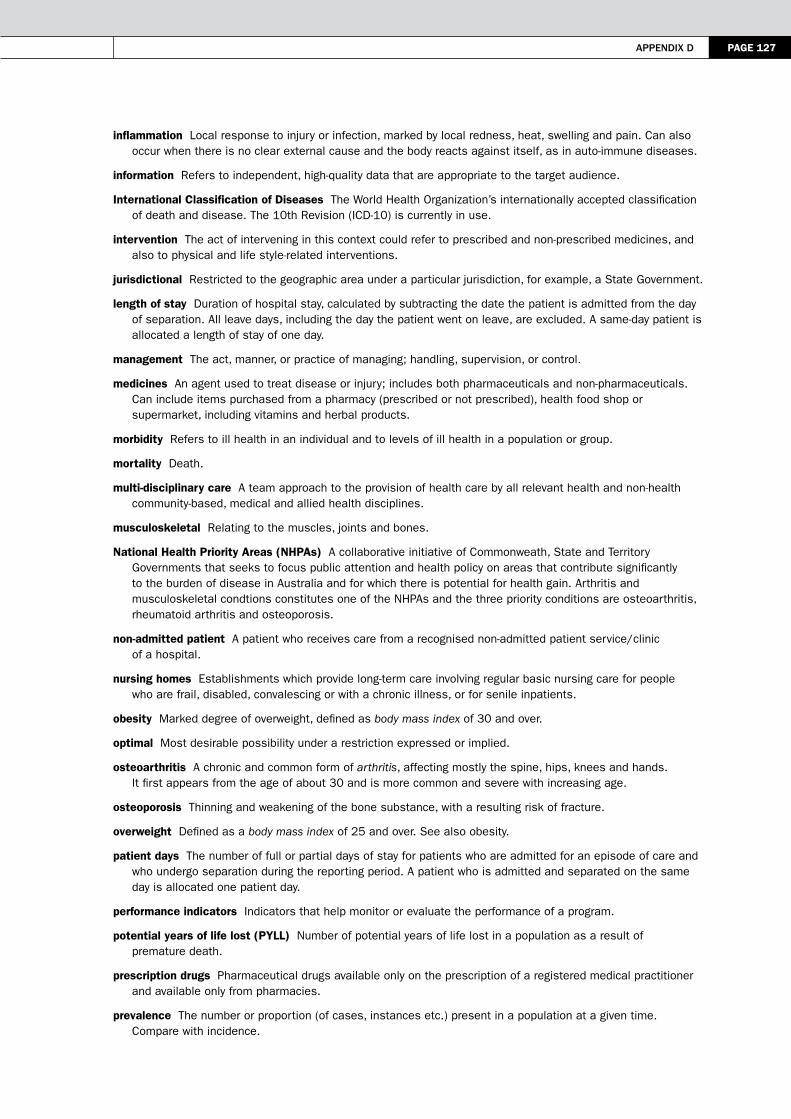
APPendiX d PAGE 127
inflammation Local response to injury or infection, marked by local redness, heat, swelling and pain. Can also occur when there is no clear external cause and the body reacts against itself, as in auto-immune diseases.
information Refers to independent, high-quality data that are appropriate to the target audience.
International Classification of Diseases The World Health Organization’s internationally accepted classification of death and disease. The 10th Revision (ICD-10) is currently in use.
intervention The act of intervening in this context could refer to prescribed and non-prescribed medicines, and also to physical and life style-related interventions.
jurisdictional Restricted to the geographic area under a particular jurisdiction, for example, a State Government.
length of stay Duration of hospital stay, calculated by subtracting the date the patient is admitted from the day of separation. All leave days, including the day the patient went on leave, are excluded. A same-day patient is allocated a length of stay of one day.
management The act, manner, or practice of managing; handling, supervision, or control.
medicines An agent used to treat disease or injury; includes both pharmaceuticals and non-pharmaceuticals. Can include items purchased from a pharmacy (prescribed or not prescribed), health food shop or supermarket, including vitamins and herbal products.
morbidity Refers to ill health in an individual and to levels of ill health in a population or group.
mortality Death.
multi-disciplinary care A team approach to the provision of health care by all relevant health and non-health community-based, medical and allied health disciplines.
musculoskeletal Relating to the muscles, joints and bones.
National Health Priority Areas (NHPAs) A collaborative initiative of Commonweath, State and Territory Governments that seeks to focus public attention and health policy on areas that contribute significantly to the burden of disease in Australia and for which there is potential for health gain. Arthritis and musculoskeletal condtions constitutes one of the NHPAs and the three priority conditions are osteoarthritis, rheumatoid arthritis and osteoporosis.
non-admitted patient A patient who receives care from a recognised non-admitted patient service/clinic of a hospital.
nursing homes Establishments which provide long-term care involving regular basic nursing care for people who are frail, disabled, convalescing or with a chronic illness, or for senile inpatients.
obesity Marked degree of overweight, defined as body mass index of 30 and over.
optimal Most desirable possibility under a restriction expressed or implied.
osteoarthritis A chronic and common form of arthritis, affecting mostly the spine, hips, knees and hands. It first appears from the age of about 30 and is more common and severe with increasing age.
osteoporosis Thinning and weakening of the bone substance, with a resulting risk of fracture.
overweight Defined as a body mass index of 25 and over. See also obesity.
patient days The number of full or partial days of stay for patients who are admitted for an episode of care and who undergo separation during the reporting period. A patient who is admitted and separated on the same day is allocated one patient day.
performance indicators Indicators that help monitor or evaluate the performance of a program.
potential years of life lost (PyLL) Number of potential years of life lost in a population as a result of premature death.
prescription drugs Pharmaceutical drugs available only on the prescription of a registered medical practitioner and available only from pharmacies.
prevalence The number or proportion (of cases, instances etc.) present in a population at a given time. Compare with incidence.

PAGE 128 Arthritis And musculoskeletAl conditions in AustrAliA 2005
prevention Stopping an event or episode from occurring or progressing by performing or avoiding certain activities.
principal diagnosis The diagnosis describing the problem that was chiefly responsible for the patient’s episode of care in hospital.
principal procedure The most significant procedure that was performed for treatment of the principal diagnosis.
recurrent expenditure Expenditure on goods and services that are used up during the year, for example, non-salaries. It contrasts with capital expenditure, such as expenditure on hospital buildings and large-scale diagnostic equipment, the useful life of which extends over several years.
research Refers to research at all levels into osteoarthritis, rheumatoid arthritis and osteoporosis.
rheumatoid arthritis A chronic, multi-system disease whose most prominent feature is joint inflammation, most often affecting the hand joints in symmetrical fashion. Can occur in all age groups but most commonly appears between ages 35 to 45. The causes of rheumatoid arthritis are not certain but involve auto-immune processes.
risk factor Any factor that presents a greater risk of a health disorder or other unwanted condition or event. Some risk factors are regarded as causes of disease, others are not necessarily so.
same-day patients Hospital patients who are admitted and separated on the same day.
self-management Involves [the individual with the condition] engaging in activities that protect and promote health; monitoring and managing of symptoms and signs of illness; managing the impacts of illness on functioning, emotions and interpersonal relationships and adhering to treatment regimes.
separation The formal process by which a hospital records the completion of treatment and/or care for an admitted patient.
separation mode The status at separation of a person from hospital (discharge, transfer or death) and the place to which that person is released (where applicable).
special needs group/at risk group Refers to groups of people who have needs relating to their health that are not always considered initially, or who have particular requirements, or who may be disadvantaged. Examples include people living in outer-metropolitan, rural and remote areas, culturally and linguistically diverse populations, Indigenous communities, socioeconomically or intellectually disadvantaged people, and people in custody.
stakeholder Anyone involved or interested in the subject and wanting to provide feedback on policy and/or activities within it. Stakeholders may differ depending on the context.
statistical significance An indication from a statistical test that an observed difference or association may be significant or ‘real’ because it is unlikely to be due alone to chance. A statistical result is usually said to be ‘significant’ if it would occur by chance only once in 20 times or less often.
sustainability Able to be sustained long term, ideally with independent sources of support.
symptom Any indication of a disorder.
underlying cause of death The condition, disease or injury initiating the sequence of events leading to death; that is, the primary, chief, main or principal cause. Compare with associated cause(s) of death.
underweight Defined as a body mass index of less than 18.5.
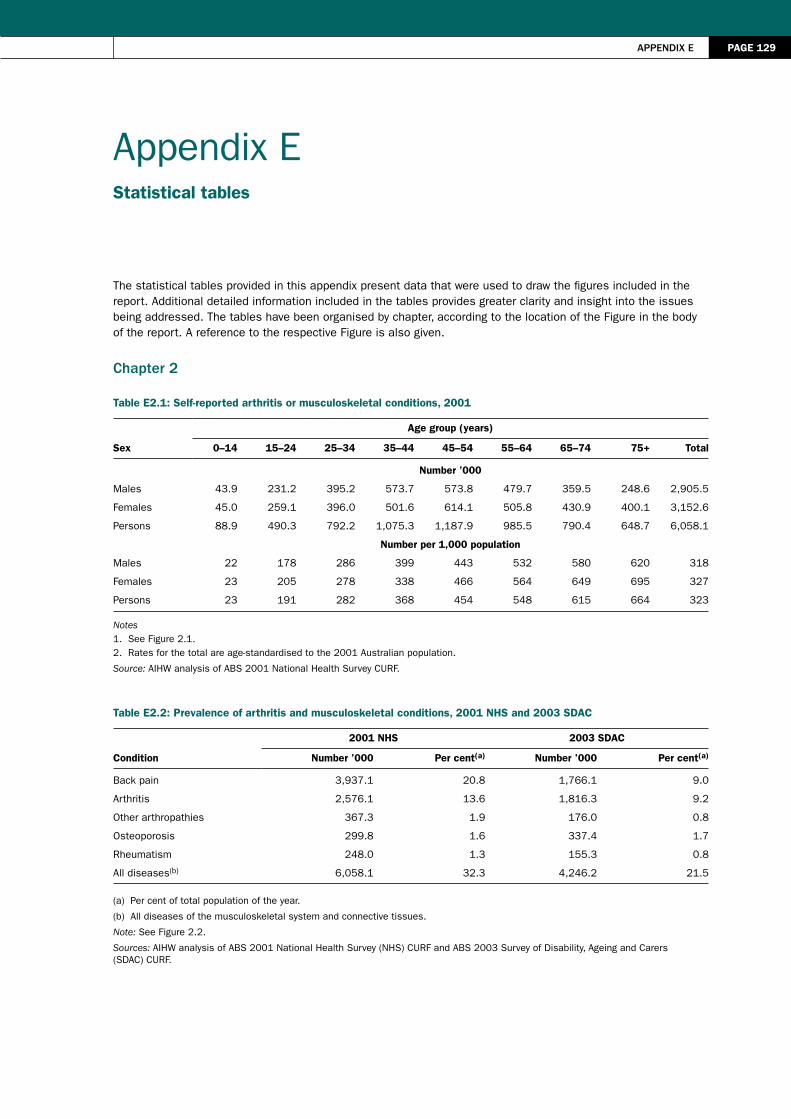
PAGE 129
Appendix E Statistical tables
The statistical tables provided in this appendix present data that were used to draw the figures included in the report. Additional detailed information included in the tables provides greater clarity and insight into the issues being addressed. The tables have been organised by chapter, according to the location of the Figure in the body of the report. A reference to the respective Figure is also given.
chapter 2
Table E2.1: Self-reported arthritis or musculoskeletal conditions, 2001
Sex
Age group (years)
0–14 15–24 25–34 35–44 45–54 55–64 65–74 75+ Total
Number ’000
Males 43.9 231.2 395.2 573.7 573.8 479.7 359.5 248.6 2,905.5
Females 45.0 259.1 396.0 501.6 614.1 505.8 430.9 400.1 3,152.6
Persons 88.9 490.3 792.2 1,075.3 1,187.9 985.5 790.4 648.7 6,058.1
Number per 1,000 population
Males 22 178 286 399 443 532 580 620 318
Females 23 205 278 338 466 564 649 695 327
Persons 23 191 282 368 454 548 615 664 323
Notes1. See Figure 2.1.2. Rates for the total are age-standardised to the 2001 Australian population.
Source: AIHW analysis of ABS 2001 National Health Survey CURF.
Table E2.2: Prevalence of arthritis and musculoskeletal conditions, 2001 NHS and 2003 SDAC
Condition
2001 NHS 2003 SDAC
Number ’000 Per cent(a) Number ’000 Per cent(a)
Back pain 3,937.1 20.8 1,766.1 9.0
Arthritis 2,576.1 13.6 1,816.3 9.2
Other arthropathies 367.3 1.9 176.0 0.8
Osteoporosis 299.8 1.6 337.4 1.7
Rheumatism 248.0 1.3 155.3 0.8
All diseases(b) 6,058.1 32.3 4,246.2 21.5
(a) Per cent of total population of the year.
(b) All diseases of the musculoskeletal system and connective tissues.
Note: See Figure 2.2.
Sources: AIHW analysis of ABS 2001 National Health Survey (NHS) CURF and ABS 2003 Survey of Disability, Ageing and Carers (SDAC) CURF.
APPendiX e

PAGE 130 Arthritis And musculoskeletAl conditions in AustrAliA 2005
Table E2.3: Chronic or recurrent pain in disability associated with arthritis and related disorders, 2003
Age group (years)
Males Females Persons
Number ’000 Per cent(a) Number ’000 Per cent(a) Number ’000 Per cent(a)
0–34 3.4 43.6 3.5 46.1 6.9 44.8
35–44 5.9 47.6 12.2 67.4 18.1 59.3
45–54 14.8 54.6 27.5 53.1 42.3 53.6
55–64 28.7 68.0 55.6 56.4 84.3 59.9
65–74 25.2 51.4 54.7 61.0 79.9 57.6
75+ 25.7 59.4 54.5 47.9 80.2 51.1
Total 103.7 57.0 208.0 54.8 311.7 55.5
(a) Per cent of people with disability associated with arthritis and related disorders in the respective age group.
Note: See Figure 2.3.
Source: AIHW analysis of ABS 2003 Survey of Disability, Ageing and Carers CURF.
Table E2.4: Core-activity restrictions in disability associated with arthritis and related disorders, 2003
Age group (years)
Self-care Mobility Communication
Number ’000 Per cent(a) Number ’000 Per cent(a) Number ’000 Per cent(a)
Males
0–34 3.2 41.0 4.9 62.8 0.9 11.5
35–44 2.5 20.2 7.8 62.9 0.0 0.0
45–54 7.4 27.3 17.6 64.9 0.6 2.2
55–64 12.0 28.4 30.2 71.6 8.3 19.7
65–74 9.4 19.2 33.6 68.6 7.4 15.1
75+ 19.2 44.3 35.2 81.3 19.0 43.9
Total 53.7 29.5 129.3 71.1 36.2 19.9
Females
0–34 2.6 34.2 4.3 56.6 0.3 3.9
35–44 3.8 21.0 12.3 68.0 0.0 0.0
45–54 17.3 33.4 40.0 77.2 2.3 4.4
55–64 37.6 38.1 78.4 79.5 6.9 7.0
65–74 33.5 37.4 71.7 80.0 11.3 12.6
75+ 59.1 52.0 105.7 93.0 41.9 36.9
Total 153.9 40.6 312.4 82.3 62.7 16.5
Persons 207.5 37.0 441.7 78.7 98.9 17.6
(a) Per cent of people with disability associated with arthritis and related disorders in the respective age group.
Note: See Figure 2.4.
Source: AIHW analysis of ABS 2003 Survey of Disability, Ageing and Carers CURF.

PAGE 131
Table E2.5: Psychological distress associated with arthritis and musculoskeletal conditions, ages 25 and over, 2005
Age group (years)
Level pf psychological distress
Low Moderate High Very high Total
Males Number ’000
25–44 90.6 46.2 27.4 11.7 175.9
45–64 277.1 88.8 59.9 31.7 457.5
65–74 163.7 31.7 14.7 4.9 215.0
75+ 119.5 37.1 11.2 6.4 174.3
Total 650.9 203.8 113.2 54.8 1,022.7
Females
25–44 90.2 64.1 31.2 21.0 206.4
45–64 343.2 165.9 89.6 44.0 642.7
65–74 215.3 70.9 28.2 18.6 333.0
75+ 204.8 75.4 37.0 13.2 330.4
Total 853.5 376.2 186.0 96.8 1,512.5
Persons 1,504.3 580.0 299.2 151.5 2,535.1
Males Per cent
25–44 51.5 26.3 15.6 6.7 100.0
45–64 60.6 19.4 13.1 6.9 100.0
65–74 76.1 14.7 6.8 2.3 100.0
75+ 68.6 21.3 6.4 3.7 100.0
Total 63.6 19.9 11.1 5.4 100.0
Females
25–44 43.7 31.1 15.1 10.2 100.0
45–64 53.4 25.8 13.9 6.8 100.0
65–74 64.7 21.3 8.5 5.6 100.0
75+ 62.0 22.8 11.2 4.0 100.0
Total 56.4 24.9 12.3 6.4 100.0
Note: See Figure 2.5.
Source: AIHW analysis of ABS 2001 National Health Survey CURF.
Table E2.6: Hospital separations for arthritis or musculoskeletal conditions, 2003–04
Name of condition ICD-10-AM codeNumber of
separations Per cent
Other primary gonarthrosis M17.1 32,890 9.0
Low back pain M54.5 18,997 5.2
Derangement of meniscus due to old tear or injury (medical collateral ligament) M23.23 18,286 5.0
Other primary coxarthrosis M16.1 14,046 3.8
Rotator cuff syndrome M75.1 12,421 3.4
Lumbar and other intervertebral disc disorders with radiculopathy M51.1 9,969 2.7
Derangement of meniscus due to old tear or injury (posterior cruciate ligament) M23.22 8,095 2.2
Chronic instability of knee (anterior cruciate ligament) M23.51 7,137 1.9
Gonarthrosis, unspecified M17.9 7,088 1.9
Spinal stenosis M48.06 6,459 0.0
Other conditions 231,536 63.0
Total 366,924 100.0
Note: See Figure 2.6.
APPendiX e

PAGE 132 Arthritis And musculoskeletAl conditions in AustrAliA 2005
Source: AIHW National Hospital Morbidity Database.
Table E2.7: Time series for arthroscopy and arthroplasty procedures, 1997–98 to 2003–04
year
Arthroscopy Arthroplasty
Number of separations
Number per 100,000 population
Number of separations
Number per 100,000 population
1997–98 44,242 242 28,998 163
1998–99 21,922 118 28,670 157
1999–00 45,451 241 28,373 152
2000–01 47,898 249 30,414 159
2001–02 49,354 252 35,286 180
2002–03 49,066 246 37,607 187
2003–04 50,222 247 39,913 194
Notes
1. See Figure 2.7.
2. Age-standardised to the 2001 Australian Population.
Source: AIHW National Hospital Morbidity Database.
Table E2.8: Per cent prevalence of diseases of musculoskeletal system and connective tissues by Indigenous status, 2001
Population
Age group (years)
0–4 5–14 15–24 25–34 35–44 45–54 55+
Indigenous 0 0 2 8 14 28 40
Non-Indigenous 0 0 1 4 9 19 41
Note: See Figure 2.8.
Source: ABS 2001 National Health Survey.
Table E2.9: Prevalence of arthritis or musculoskeletal conditions by socioeconomic status, ages 35 and over, 2001
SEIFA quintile OsteoarthritisRheumatoid
arthritis Osteoporosis
All musculoskeletal
conditions All persons
Number ’000
1st quintile 310.9 92.4 68.9 920.9 1,708.2
2nd quintile 253.9 88.9 59.4 937.6 1,856.3
3rd quintile 272.0 74.9 62.9 906.4 1,812.6
4th quintile 273.9 74.7 51.2 1,009.4 2,139.3
5th quintile 231.4 64.4 54.9 895.1 2,076.3
Per cent
1st quintile 23.2 23.4 23.2 19.7 17.8
2nd quintile 18.9 22.5 20.0 20.1 19.4
3rd quintile 20.3 18.9 21.2 19.4 18.9
4th quintile 20.4 18.9 17.2 21.6 22.3
5th quintile 17.2 16.3 18.5 19.2 21.6
Total 100.0 100.0 100.0 100.0 100.0
Notes
1. See Figure 2.9.
2. Socioeconomic status is coded according to Socioeconomic Index for Areas (SEIFA) as described by the ABS.
3. 1st quintile represents the most disadvantaged socioeconomic quintile and the 5th quintile is the least disadvantaged status.
Source: AIHW analysis of ABS 2001 National Health Survey CURF.
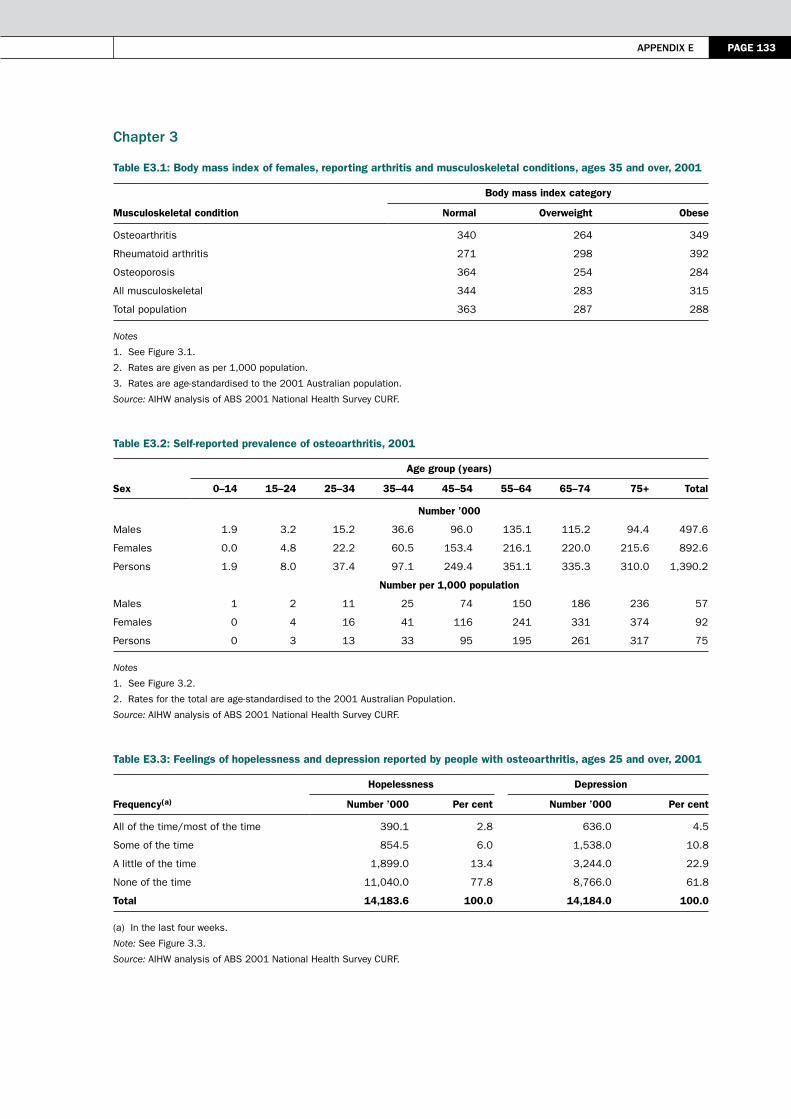
APPendiX e PAGE 133
chapter 3
Table E3.1: Body mass index of females, reporting arthritis and musculoskeletal conditions, ages 35 and over, 2001
Musculoskeletal condition
Body mass index category
Normal Overweight Obese
Osteoarthritis 340 264 349
Rheumatoid arthritis 271 298 392
Osteoporosis 364 254 284
All musculoskeletal 344 283 315
Total population 363 287 288
Notes
1. See Figure 3.1.
2. Rates are given as per 1,000 population.
3. Rates are age-standardised to the 2001 Australian population.
Source: AIHW analysis of ABS 2001 National Health Survey CURF.
Table E3.2: Self-reported prevalence of osteoarthritis, 2001
Sex
Age group (years)
0–14 15–24 25–34 35–44 45–54 55–64 65–74 75+ Total
Number ’000
Males 1.9 3.2 15.2 36.6 96.0 135.1 115.2 94.4 497.6
Females 0.0 4.8 22.2 60.5 153.4 216.1 220.0 215.6 892.6
Persons 1.9 8.0 37.4 97.1 249.4 351.1 335.3 310.0 1,390.2
Number per 1,000 population
Males 1 2 11 25 74 150 186 236 57
Females 0 4 16 41 116 241 331 374 92
Persons 0 3 13 33 95 195 261 317 75
Notes
1. See Figure 3.2.
2. Rates for the total are age-standardised to the 2001 Australian Population.
Source: AIHW analysis of ABS 2001 National Health Survey CURF.
Table E3.3: Feelings of hopelessness and depression reported by people with osteoarthritis, ages 25 and over, 2001
Frequency(a)
Hopelessness Depression
Number ’000 Per cent Number ’000 Per cent
All of the time/most of the time 390.1 2.8 636.0 4.5
Some of the time 854.5 6.0 1,538.0 10.8
A little of the time 1,899.0 13.4 3,244.0 22.9
None of the time 11,040.0 77.8 8,766.0 61.8
Total 14,183.6 100.0 14,184.0 100.0
(a) In the last four weeks.
Note: See Figure 3.3.
Source: AIHW analysis of ABS 2001 National Health Survey CURF.
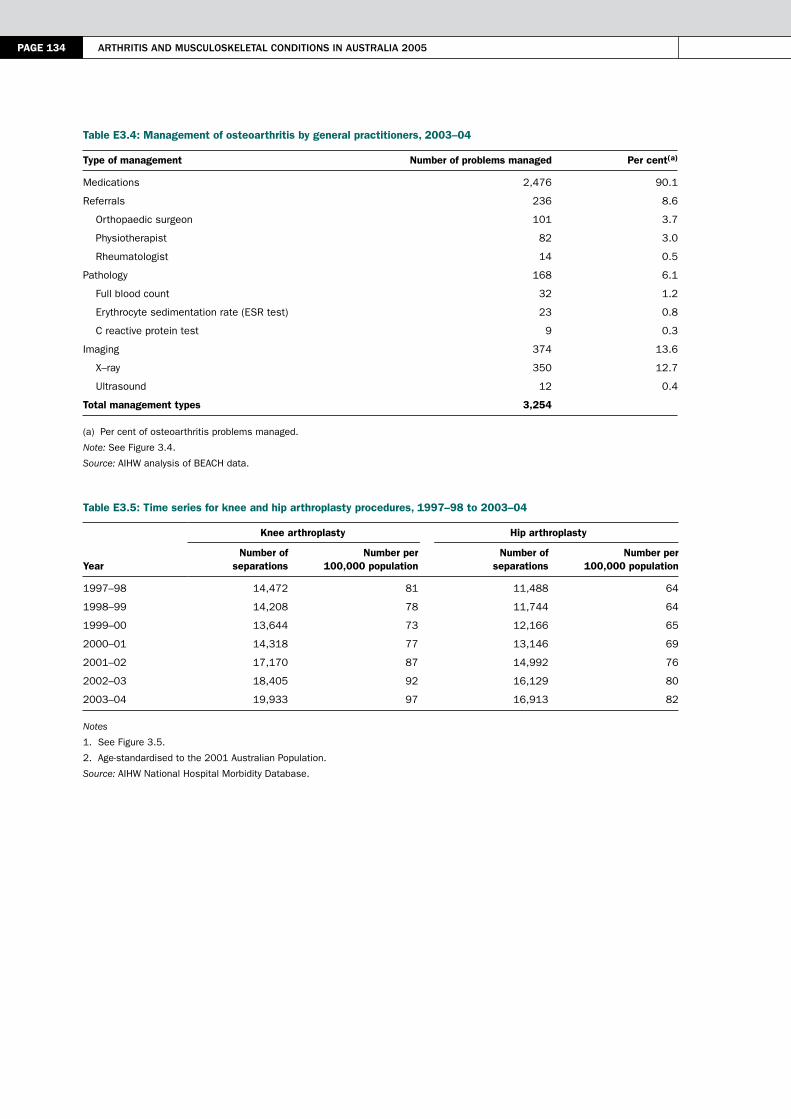
PAGE 134 Arthritis And musculoskeletAl conditions in AustrAliA 2005
Table E3.4: Management of osteoarthritis by general practitioners, 2003–04
Type of management Number of problems managed Per cent(a)
Medications 2,476 90.1
Referrals 236 8.6
Orthopaedic surgeon 101 3.7
Physiotherapist 82 3.0
Rheumatologist 14 0.5
Pathology 168 6.1
Full blood count 32 1.2
Erythrocyte sedimentation rate (ESR test) 23 0.8
C reactive protein test 9 0.3
Imaging 374 13.6
X–ray 350 12.7
Ultrasound 12 0.4
Total management types 3,254
(a) Per cent of osteoarthritis problems managed.
Note: See Figure 3.4.
Source: AIHW analysis of BEACH data.
Table E3.5: Time series for knee and hip arthroplasty procedures, 1997–98 to 2003–04
year
Knee arthroplasty Hip arthroplasty
Number of separations
Number per 100,000 population
Number of separations
Number per 100,000 population
1997–98 14,472 81 11,488 64
1998–99 14,208 78 11,744 64
1999–00 13,644 73 12,166 65
2000–01 14,318 77 13,146 69
2001–02 17,170 87 14,992 76
2002–03 18,405 92 16,129 80
2003–04 19,933 97 16,913 82
Notes
1. See Figure 3.5.
2. Age-standardised to the 2001 Australian Population.
Source: AIHW National Hospital Morbidity Database.

APPendiX e PAGE 135
chapter 4
Table E4.1: Self–reported rheumatoid arthritis, 2001
Sex
Age group (years)
0–14 15–24 25–34 35–44 45–54 55–64 65–74 75+ Total
Number ’000
Males 0.0 3.8 16.8 21.7 29.5 44.2 36.9 27.4 180.2
Females 0.1 6.0 16.2 24.7 52.8 62.5 46.3 49.3 258.0
Persons 0.1 9.8 32.9 46.4 82.2 106.7 83.2 76.7 438.2
Number per 1,000 population
Males 0 3 12 15 23 49 59 68 20
Females 0 5 11 17 40 70 70 86 27
Persons 0 4 12 16 31 59 65 79 24
Notes
1. See Figure 4.1.
2. Rates for the total are age-standardised to the 2001 Australian Population.
Source: AIHW analysis of ABS 2001 National Health Survey CURF.
Table E4.2: Management of rheumatoid arthritis by general practitioners, 2003–04
Type of management Number of problems managed Per cent(a)
Medications 485 96.6
Referrals 66 13.1
Orthopaedic surgeon 6 1.2
Physiotherapist 12 2.4
Rheumatologist 35 7.0
Pathology 361 71.9
Full blood count 94 18.7
Erythrocyte sedimentation rate (ESR test) 68 13.5
Liver function test 54 10.8
Imaging 23 4.6
X–ray 14 2.8
Ultrasound 2 0.4
Total management types 989
(a) Per cent of rheumatoid arthritis problems managed.
Note: See Figure 4.2.
Source: AIHW analysis of BEACH data.

PAGE 136 Arthritis And musculoskeletAl conditions in AustrAliA 2005
chapter 5
Table E5.1: Self–reported prevalence of osteoporosis, ages 35 and over, 2001
Sex
Age group (years)
35–44 45–54 55–64 65–74 75+ Total
Number ’000
Males 2.3 9.0 13.8 12.3 12.8 50.2
Females 13.7 35.8 42.6 67.7 87.2 247.0
Persons 16.1 44.9 56.5 80.0 100.0 297.2
Number per 1,000 population
Males 2 7 15 20 32 11
Females 9 27 47 102 151 50
Persons 6 17 31 62 102 32
Notes
1. See Figure 5.1.
2. Rates for the total are age-standardised to the 2001 Australian Population.
Source: AIHW analysis of ABS 2001 National Health Survey CURF.
Table E5.2: Hospital separations for common fracture sites, 2003–04
Fracture site ICD-10-AM code Number of separations Per cent
Femur S72 23,496 36.6
Forearm S52 9,409 21.4
Lower leg, including ankle S82 7,566 14.7
Shoulder and upper arm S42 6,159 11.8
Wrist and hand level S62 1,928 9.6
Skull and facial bones S02 1,895 3.0
Other sites 13,720 3.0
Total 64,173 100.0
Note: See Figure 5.2.
Source: AIHW National Hospital Morbidity Database.
Table E5.3: Falls as a factor in hospitalisation for fractures, ages 55 and over, 2003–04
Age group (years)
Number of separations
Males Females Persons
Number of separations(a) Per cent(b)
Number of separations(a) Per cent(b)
Number of separations(a) Per cent(b)
55–59 1,445 10.5 2,260 5.8 3,705 7.0
60–64 1,274 9.3 2,262 5.8 3,536 6.7
65–69 1,186 8.7 2,648 6.8 3,834 7.2
70–74 1,601 11.7 3,938 10.0 5,539 10.5
75–79 2,233 16.3 6,347 16.2 8,580 16.2
80–84 2,592 18.9 8,329 21.3 10,921 20.6
85+ 3,369 24.6 13,411 34.2 16,780 31.7
Total 13,700 39,195 52,895
(a) Number of hospital separations for fractures with an external cause of falls.
(b) Per cent of hospital separations for fractures due to falls.
Note: See Figure 5.3.
Source: AIHW National Hospital Morbidity Database.

APPendiX e PAGE 137
Table E5.4: Osteoporosis as the underlying cause of death, ages 55 and over, 2003
Sex
Age group (years)
55–59 60–64 65–69 70–74 75–79 80–84 85+ Total(a)
Number of deaths
Males 1 0 0 2 1 5 14 23
Females 1 0 2 3 18 28 105 157
Persons 2 0 2 5 19 33 119 180
Deaths per 100,000 population
Males 0 0 0 1 0 3 16 1
Females 0 0 1 1 6 13 53 5
Persons 0 0 0 1 4 9 42 4
(a) Ages 55 and over.
Notes
1. See Figure 5.4.
2. Rates for the total are age-standardised to the 2001 Australian Population.
Source: AIHW National Mortality Database.
Table E5.5: Hip fracture as an additional cause of death, ages 55 and over, 2003
Sex
Age group (years)
55–59 60–64 65–69 70–74 75–79 80–84 85+ Total(a)
Number of deaths
Males 2 7 27 40 69 140 324 609
Females 5 6 14 38 88 233 688 1,072
Persons 7 13 41 78 157 373 1,012 1,681
Deaths per 100,000 population
Males 0 2 8 13 29 96 360 37
Females 1 1 4 12 29 105 350 36
Persons 1 1 6 12 29 102 353 37
(a) Ages 55 and over.
Notes1. See Figure 5.5.2. Rates for the total are age-standardised to the 2001 Australian Population.
Source: AIHW National Mortality Database.
Table E5.6: Time series for hip fracture associated mortality in Australia, ages 55 and over, 1997–2003
Sex
year
1997 1998 1999 2000 2001 2002 2003
Number of deaths
Males 529 599 606 572 577 696 609
Females 1,064 1,059 1,085 995 1,043 1,243 1,072
Persons 1,593 1,658 1,691 1,567 1,620 1,939 1,681
Deaths per 100,000 population
Males 42 45 44 40 38 44 37
Females 46 44 43 38 38 44 36
Persons 45 45 43 39 38 44 37
Notes1. See Figure 5.6.2. Rates are age-standardised to the 2001 Australian Population.
Source: AIHW National Mortality Database.

PAGE 138 Arthritis And musculoskeletAl conditions in AustrAliA 2005
chapter 6
Table E6.1: Types of employment restriction due to disability associated with arthritis and related disorders, ages 15–64, 2003
Employment restriction
Males Females Persons
Number ’000 Per cent
Number ’000 Per cent
Number ’000 Per cent
Restricted in type of job 29.7 45.7 44.7 38.9 74.4 41.3
Restricted in number of hours 15.6 24.0 30.0 25.6 46.0 25.6
Difficulty changing jobs or getting a preferred job 27.9 42.9 34.0 29.6 62.0 34.4
Need for time off from work (at least one day per week) 7.1 10.9 13.6 11.8 20.7 11.5
Need for employer provided equipment and/or special arrangements 5.2 4.6 6.3 8.0 11.5 6.4
Need for ongoing supervision or assistance 2.9 1.5 1.4 4.9 4.3 2.4
Notes
1. See Figure 6.1.
2. Persons may report more than one restriction.
3. Per cents are based on the total number of people aged 15–64 years reporting employment restrictions with disability associated with arthritis and related disorders (M=64,958; F=114,499; P=179,456).
Source: AIHW analysis of ABS 2003 Survey of Disability, Ageing and Carers CURF.
Table E6.2: Employment restrictions due to disability associated with arthritis and related disorders, ages 15–64, 2003
Age group Males Females Persons
Number ’000
15–24 0.5 3.1 3.6
25–34 2.5 1.5 4.0
35–44 8.9 11.5 20.4
45–54 16.8 34.6 51.4
55–64 36.3 64.0 100.3
Total 65.0 114.7 179.7
Per cent
15–24 100.0 86.1 87.8
25–34 47.2 41.7 44.9
35–44 84.8 63.5 71.3
45–54 74.7 63.8 67.0
55–64 78.7 63.0 67.9
Total 76.5 63.3 67.6
Notes
1. See Figure 6.2.
2. Per cents are based on the total number of people aged 15-64 years with disability associated with arthritis and related disorders (M=84,914; F=181,089; P=265,606).
Source: AIHW analysis of ABS 2003 Survey of Disability, Ageing and Carers CURF.

APPendiX e PAGE 139
Table E6.3: Employer–made arrangements for disability associated with arthritis and related disorders, ages 15–64, 2003
Employer–made arrangement
Males Females Persons
Number ’000 Per cent
Number ’000 Per cent
Number ’000 Per cent
Allocated different duties 0.7 1.1 1.7 1.5 2.4 1.3
Provided training/retraining 1.6 2.5 2.9 2.5 4.5 2.5
Modified buildings/fittings or provided special/free transport or parking 1.1 1.7 1.0 0.9 2.1 1.2
Provided special equipment 1.3 2.0 5.9 5.1 7.2 4.0
A special support person to assist/train on the job or provided help from someone else 0.4 0.6 1.0 0.9 1.4 0.8
Other 0.0 0.0 0.6 0.5 0.6 0.3
Notes
1. See Figure 6.3.
2. Per cents are based on the total number of people aged 15–64 years reporting employment restrictions with disability associated with arthritis and related disorders (M=64,958; F=114,499; P=179,456).
Source: AIHW analysis of ABS 2003 Survey of Disability, Ageing and Carers CURF.
Table E6.4: Self–reported quality of life by specific type of arthritis or musculoskeletal condition, 2001
Quality of life OsteoarthritisRheumatoid
arthritis OsteoporosisAll
musculoskeletal All persons
Number ’000
Delighted 117.9 26.3 20.9 551.0 1697.1
Pleased 341.8 96.9 60.6 1542.2 4339.6
Mostly satisfied 498.5 139.7 103.7 1980.3 4705.8
Mixed 311.9 117.6 90.4 1313.9 2613.5
Mostly dissatisfied 43.9 28.0 9.6 209.0 362.0
Unhappy 39.9 13.8 9.8 156.9 285.3
Terrible 33.6 14.3 4.2 104.5 182.6
Per cent
Delighted 0.9 0.2 0.2 4.0 12.4
Pleased 2.5 0.7 0.4 11.3 31.7
Mostly satisfied 3.6 1.0 0.8 14.5 34.4
Mixed 2.3 0.9 0.7 9.6 19.1
Mostly dissatisfied 0.3 0.2 0.1 1.5 2.6
Unhappy 0.3 0.1 0.1 1.1 2.1
Terrible 0.2 0.1 0.0 0.8 1.3
Notes
1. See Figure 6.4.
2. Rates are age-standardised to the 2001 Australian population.
Source: AIHW analysis of ABS 2001 National Health Survey CURF.

PAGE 140 Arthritis And musculoskeletAl conditions in AustrAliA 2005
Table E6.5: Self–reported health status, people with arthritis and musculoskeletal conditions, ages 18 and over, 2001
Health status
Age group (years)
18–34 35–44 45–54 55–64 65–74 75+ Total(a)
Number ’000
Excellent/very good 1,973.2 25.1 40.4 41.3 70.5 65.8 2,216.3
Good 1,857.8 15.0 17.5 59.5 27.8 37.4 2,015.0
Fair 1,122.1 5.5 11.6 14.3 12.2 51.9 1,217.6
Poor 492.6 2.1 4.2 5.3 2.4 1.1 507.7
Per cent
Excellent/very good 43.0 0.9 1.5 2.3 5.5 6.7 15.9
Good 40.5 0.5 0.7 3.3 2.2 3.8 14.4
Fair 24.5 0.2 0.4 0.8 1.0 5.3 8.7
Poor 10.7 0.1 0.2 0.3 0.2 0.1 3.6
(a) Ages 18 and over.
Notes
1. See Figure 6.5.
2. Rates for the total population are age-standardised to the 2001 Australian population.
Source: AIHW analysis of ABS 2001 National Health Survey CURF.
Table E6.6: Self–reported health by specific condition, ages 18 and over, 2001
Health status OsteoarthritisRheumatoid
arthritis OsteoporosisAll
musculoskeletal All persons
Number ’000
Excellent/very good 408.2 100.3 65.9 2,216.3 7,138.1
Good 475.4 133.2 86.0 2,015.0 4,388.4
Fair 333.4 127.9 89.0 1,217.6 1,955.8
Poor 169.7 76.6 58.2 507.7 701.7
Per cent
Excellent/very good 2.9 0.7 0.5 15.9 50.2
Good 3.4 1.0 0.6 14.4 31.0
Fair 2.4 0.9 0.6 8.7 13.9
Poor 1.2 0.5 0.4 3.6 5.0
Notes
1. See Figure 6.6.
2. Rates are age-standardised to the 2001 Australian population.
Source: AIHW analysis of ABS 2001 National Health Survey CURF.
Table E6.7: Long–term conditions reported by people with disability associated with arthritis and related disorders, 2003
Long-term condition Number ’000 Per cent(a) Long-term condition Number ’000 Per cent(a)
Glaucoma 8.5 12.4 Cancer 11.7 5.8
Total hearing loss 50.3 12.1 Dementia 3.3 3.6
Total visions loss 10.6 11.4 Stroke 12.2 3.5
Heart disease 29.3 11.3 Parkinson’s disease 0.8 2.4
Diabetes 66.3 10.4 Hypertension 34.5 1.9
Depression 31.6 6.7 Asthma 0.9 0.1
Back problem 102.6 5.8
(a) Per cent of all people who reported a long-term condition.
Note: See Figure 6.7.
Source: AIHW analysis of ABS 2003 Survey of Disability, Ageing and Carers CURF.

APPendiX e PAGE 141
chapter 7
Table E7.1: Health expenditure by disease chapter, 2000–01
Disease chapter Total expenditure ($ million)
Cardiovascular 5,479
Nervous system 4,942
Musculoskeletal 4,634
Injuries 4,013
Respiratory 3,742
Mental disorders 3,741
Oral health 3,372
Neoplasms 2,918
Digestive system 2,811
Genito-urinary 2,076
Endocrine, nutritional & metabolic 1,587
Skin diseases 1,370
Maternal conditions 1,315
Infections & parasitic 1,224
Diabetes mellitus 812
Neonatal causes 358
Congenital anomalies 221
Signs, symptoms, ill-defined conditions(a) 5,530
Total 50,146
(a) ‘Signs, symptoms and ill-defined conditions’ includes diagnostic and other services for signs, symptoms and ill-defined conditions where the cause of the problem is unknown. ‘Other contact with the health system’ includes fertility control, reproduction and development; elective plastic surgery; general prevention, screening and health examination; and treatment and after-care for unspecified disease.
Note: See Figure 7.1.
Source: AIHW Health Expenditure Database.
Table E7.2: Health expenditure on arthritis and musculoskeletal conditions by health sector, 2000–01
Musculoskeletal condition
Hospitals
Admitted patients(a)
Non-admitted services Total
Aged care homes(b)
Out-of-hospital medical services
Allied health services(c)(d)
Rheumatoid arthritis 27.4 40.6 68.0 59.0 35.8 33.2
Osteoarthritis 493.5 73.2 566.8 265.7 124.6 64.2
Chronic back pain 127.4 103.3 230.7 38.5 79.4 134.2
Slipped disc 87.3 26.4 113.7 0.0 15.9 137.2
Osteoporosis 31.8 7.1 38.9 64.8 29.4 6.6
Other musculoskeletal 518.6 291.0 809.6 54.1 593.5 334.2
Total 1286.1 541.6 1827.7 482.2 878.7 709.7
Total allocated health system costs 17,343.4 4,686.5 22,029.9 3,899.0 8,454.4 2,439.9
(Continued)

PAGE 142 Arthritis And musculoskeletAl conditions in AustrAliA 2005
Table E7.2 (continued): Health expenditure on arthritis and musculoskeletal conditions by health sector, 2000–01
Musculoskeletal condition
Pharmaceuticals
Prescription(e)Over-the-
counter(c)(f) Total Research
Total expenditure allocated by
disease
Per cent of total
musculo- skeletal
Per cent of total
allocated health
system
Rheumatoid arthritis 23.9 23.3 47.2 2.9 246.2 5.3 0.5
Osteoarthritis 102.7 45.0 147.8 14.1 1183.0 25.5 2.4
Chronic back pain 42.2 35.1 77.3 6.8 566.9 12.2 1.1
Slipped disc 6.6 21.6 28.2 3.6 298.5 6.4 0.6
Osteoporosis 75.5 2.6 78.1 2.6 220.6 4.8 0.4
Other musculoskeletal 217.0 84.3 301.3 25.2 2118.0 45.7 4.2
Total 467.9 212.0 679.9 55.1 4633.3 9.2
Total allocated health system costs 5,896.1 2,188.6 8,084.7 1,182.0 50,145.6(g)
(a) Includes a preliminary estimate of private medical services provided in hospital.
(b) Includes expenditure on residents that require and receive a level of care that falls within one of the four highest levels in residential aged care services.
(c) Based on preliminary AIHW estimates.
(d) Includes services delivered outside of hospitals by paramedical professionals such as physiotherapists, chiropractors, occupational therapists, audiologists, speech therapists, hydropaths, podiatrists, therapeutic and clinical massage therapists, clinical psychologists, dietitians, osteopaths.
(e) Includes all pharmaceuticals for which a prescription is needed (including private prescriptions and under-copayment prescriptions).
(f) Includes over-the-counter medicaments such as vitamins and minerals, patent medicines, first aid and wound-care products, analgesics, feminine hygiene products, cold sore preparations, and a number of complementary health products that are sold in both pharmacies and other retail outlets.
(g) Includes community and public health and dental ($4,056 million).
Notes
1. See Figures 7.2, 7.5, 7.6, 7.7 and 7.9.
2. Given as $ million.
Source: AIHW Health Expenditure Database.
Table E7.3: Per cent changes in inflation-adjusted expenditure between 1993–94 and 2000–01
Condition/system HospitalAged care
homes Pharmaceuticals
Out-of-hospital medical services
Other professional
services Research Total
Musculoskeletal conditions 26.2 –6.6 105.3 41.4 42.2 76.7 34.4
Total health system 30.6 22.7 66.7 24.9 49.7 84.5 39.4
Note: See Figure 7.3.
Source: AIHW Health Expenditure Database.

APPendiX e PAGE 143
Table E7.4: Health expenditure for arthritis and musculoskeletal conditions, Australia, 2000–01
Sex
Age group (years)
0–4 5–14 15–24 25–34 35–44 45–54 55–64 65–74 75–84 85+ Total
Males 15.5 58.1 112.3 220.4 274.9 318.0 322.3 317.2 241.5 71.9 1,952.1
Females 17.9 37.9 99.0 178.8 272.7 362.0 379.7 443.2 536.5 353.5 2,681.1
Persons 33.4 95.9 211.3 399.2 547.7 680.0 702.1 760.4 778.0 425.4 4,633.3
Notes
1. See Figure 7.4.
2. Given as $ million.
Source: AIHW Health Expenditure Database.
Table E7.5: Health expenditure for osteoarthritis, rheumatoid arthritis and osteoporosis, 2000–01
Musculoskeletal condition
Age group (years)
0–4 5–14 15–24 25–34 35–44 45–54 55–64 65–74 75–84 85+ Total
Rheumatoid arthritis
Males 0.1 0.3 0.5 2.8 5.2 10.4 18.0 17.4 13.3 4.5 72.4
Females 0.1 0.2 1.5 6.3 13.0 17.7 30.4 31.7 37.8 34.9 173.7
Persons 0.2 0.5 2.0 9.1 18.2 28.1 48.4 49.1 51.2 39.4 246.2
Osteoarthritis
Males 0.3 0.4 1.2 4.2 17.5 39.4 89.5 133.7 107.8 27.4 421.3
Females 0.2 0.1 0.6 4.1 16.4 53.7 116.9 176.6 219.6 173.5 761.8
Persons 0.4 0.5 1.8 8.3 33.9 93.1 206.4 310.2 327.4 200.9 1,183.0
Osteoporosis
Males 0.0 0.1 0.1 0.1 0.9 2.0 3.0 5.4 9.5 3.3 24.4
Females 0.1 0.1 0.5 0.6 1.4 8.0 19.4 40.4 71.2 54.3 196.1
Persons 0.1 0.2 0.6 0.7 2.4 10.1 22.4 45.8 80.7 57.6 220.6
Notes
1. See Figure 7.8.
2. Given as $ million.
Source: AIHW Health Expenditure Database.
Table E7.6: NHPA expenditure as a proportion of allocated health expenditure, 2000–01
Disease categoryDisease expenditure
($ million)Each NHPA as per cent
of total expenditurePer cent
of total NHPA costs
Cardiovascular 5,479 10.9 24.6
Musculoskeletal 4,634 9.2 20.8
Injuries 4,013 8.0 18.0
Asthma 692 1.4 3.1
Neoplasms 2,918 5.8 13.1
Mental disorders 3,741 7.5 16.8
Diabetes mellitus 812 1.6 3.6
Total (NHPAs) 22,289 44.4 100.0
All other causes 27,857 55.6
Note: See Figure 7.10.
Source: AIHW Health Expenditure Database.


PAGE 145
Appendix FNational Health Priority Area indicators
The NHPA initiative has taken an indicators-based approach for monitoring and reporting health outcomes in the priority areas. Sets of indicators have been developed for the priority areas of cardiovascular health, cancer control, injury prevention and control, mental health, diabetes mellitus, and asthma. Indicators have also been developed for some of the risk factors common to various NHPAs.
The Australian Health Ministers’ Advisory Council (AHMAC) has asked the Australian Institute of Health and Welfare (AIHW) to monitor and regularly report against the NHPA indicators in its flagship publication Australia’s Health. In addition to providing baseline information, the Institute provides biennial indicator updates. Time series for various indicators are also being maintained in the AIHW databases and will soon be published in e-format on its website. The website address for the NHPA subject area is: <http://www.aihw.gov.au/nhpa/index.cfm>.
The NHPA indicators are one of the most stable sets of indicators used for monitoring and reporting health issues in Australia. The indicators have been developed over the years, as and when a priority area was recognised by the Australian Health Ministers, using multi-step indicator development processes in consultation with various stakeholders. Not only have the validity and stability of the NHPA indicators has not only enhanced their acceptability for use across various jurisdictions but also some of the them are now being used in national health performance assessment.
Operational definitions and time series have been developed for most of the NHPA indicators. While some of the indicators have been revised or fine tuned to improve their sensitivity, the stability of the indicators over time has been maintained. This requirement has allowed data development to catch up. However, many of the NHPA indicators require further refinement in their design and generation of time series for regular reporting.
A characteristic feature of the NHPA indicators has been the size and internal composition of their sets. Developed using agreed frameworks, the indicator sets are well balanced in their composition, focusing on priorities identified by the National Health Priority Action Council (NHPAC). In addition, the upper limits on their numbers (between 20 and 30 for each priority area) has ensured their wider use. This approach has proved cost effective in regular monitoring and reporting.
The indicator development process is currently underway for arthritis and musculoskeletal conditions, as the latest NHPA. The indicators will be tested for validity, and the baselines generated. Time series on indicators for which data are available will be developed soon after. Strategies will also be developed to generate information for those indicators for which the available data are currently limited in content and time depth.
APPendiX F