Functional Interaction of Plasmacytoid Dendritic Cells with Multiple Myeloma Cells: A Therapeutic...
26
Functional Interaction of Plasmacytoid Dendritic Cells with Multiple Myeloma Cells: A Novel Therapeutic Target Dharminder Chauhan 1,¶,* , Ajita V. Singh 1,* , Mohan Brahmandam 1 , Ruben Carrasco 1 , Madhavi Bandi 1 , Teru Hideshima 1 , Giada Bianchi 1 , Klaus Podar 1 , Yu-Tzu Tai 1 , Constantine Mitsiades 1 , Noopur Raje 1 , David L. Jaye 2 , Shaji K Kumar 3 , Paul Richardson 1 , Nikhil Munshi 4 , and Kenneth C. Anderson 1,¶ 1 The LeBow Institute for Myeloma Therapeutics and Jerome Lipper Center for Myeloma Research, Department of Medical Oncology, Dana-Farber Cancer Institute, Harvard Medical School, Boston, MA 2 Department of Pathology and Laboratory Medicine, Emory University, Atlanta, GA 30322 3 Department of Hematology, Mayo Clinic, Rochester, MN 55905 4 Veterans Administration Boston Healthcare System, Harvard Medical School, Boston, MA, USA Summary Multiple Myeloma (MM) remains incurable despite novel therapies, suggesting the need for further identification of factors mediating tumorigenesis and drug resistance. Using both in vitro and in vivo MM xenograft models, we show that plasmacytoid dendritic cells (pDCs) in the bone marrow (BM) microenvironment both mediate immune deficiency characteristic of MM and promote MM cell growth, survival, and drug resistance. Microarray, cell signaling, cytokine profile and immunohistochemical analysis delineate the mechanisms mediating these sequelae. Although pDCs are resistant to novel therapies, targeting Toll-like Receptors with CpG ODNs both restores pDC immune function and abrogates pDC-induced MM cell growth. Our study therefore validates targeting pDC-MM interactions as a therapeutic strategy to overcome drug resistance in MM. ¶Correspondence: [email protected] (K.C.A) and [email protected] (D.C) Phone: 617-632-4563; Fax: 617-632-2140. * Contributed equally to the work Significance Recent reports demonstrate infiltration of dendritic cells (DCs) at tumor sites, but with unclear significance. Here we show the pathophysiologic role of plasmacytoid DCs (pDCs) in multiple myeloma (MM). Our study shows increased numbers and more frequent localization of pDCs in MM patient BM than normal BM. Functional analysis using in vitro and in vivo models of human MM in the BM milieu shows that pDCs confer growth, survival, chemotaxis, and drug resistance. Importantly, targeting Toll-like receptors with CpG ODNs improves immune function of pDCs and abrogates pDC-induced MM cell growth. These findings identify an integral role of pDCs in MM pathogenesis and provide the basis for targeting pDC-MM interactions as therapeutic strategy to improve patient outcome. Authors contributions: DC designed research, analyzed data and wrote the manuscript; AS designed, interpreted, and performed most experiments; MB performed growth/survival assays; GB isolated normal plasma cells; RC and DJ helped in IHC; and TH, SH, PR, YT, NR, CM, and NM provided clinical samples; and KA analyzed data and wrote the manuscript. We also thank Robert Schlossman, Bryan Ciccarelli, and Sagar Lonial for providing blood samples. We are thankful to Lay-Hong Ang for confocal microscopy; John F. Daley for FACS; Sangeetha Battar, Gaurav Chetri, and David Vasir for technical help and insightful discussions. Publisher's Disclaimer: This is a PDF file of an unedited manuscript that has been accepted for publication. As a service to our customers we are providing this early version of the manuscript. The manuscript will undergo copyediting, typesetting, and review of the resulting proof before it is published in its final citable form. Please note that during the production process errors may be discovered which could affect the content, and all legal disclaimers that apply to the journal pertain. NIH Public Access Author Manuscript Cancer Cell. Author manuscript; available in PMC 2010 October 6. Published in final edited form as: Cancer Cell. 2009 October 6; 16(4): 309–323. doi:10.1016/j.ccr.2009.08.019. NIH-PA Author Manuscript NIH-PA Author Manuscript NIH-PA Author Manuscript
-
Upload
independent -
Category
Documents
-
view
3 -
download
0
Transcript of Functional Interaction of Plasmacytoid Dendritic Cells with Multiple Myeloma Cells: A Therapeutic...

Functional Interaction of Plasmacytoid Dendritic Cells withMultiple Myeloma Cells: A Novel Therapeutic Target
Dharminder Chauhan1,¶,*, Ajita V. Singh1,*, Mohan Brahmandam1, Ruben Carrasco1,Madhavi Bandi1, Teru Hideshima1, Giada Bianchi1, Klaus Podar1, Yu-Tzu Tai1, ConstantineMitsiades1, Noopur Raje1, David L. Jaye2, Shaji K Kumar3, Paul Richardson1, NikhilMunshi4, and Kenneth C. Anderson1,¶1 The LeBow Institute for Myeloma Therapeutics and Jerome Lipper Center for Myeloma Research,Department of Medical Oncology, Dana-Farber Cancer Institute, Harvard Medical School, Boston,MA2 Department of Pathology and Laboratory Medicine, Emory University, Atlanta, GA 303223 Department of Hematology, Mayo Clinic, Rochester, MN 559054 Veterans Administration Boston Healthcare System, Harvard Medical School, Boston, MA, USA
SummaryMultiple Myeloma (MM) remains incurable despite novel therapies, suggesting the need for furtheridentification of factors mediating tumorigenesis and drug resistance. Using both in vitro and invivo MM xenograft models, we show that plasmacytoid dendritic cells (pDCs) in the bone marrow(BM) microenvironment both mediate immune deficiency characteristic of MM and promote MMcell growth, survival, and drug resistance. Microarray, cell signaling, cytokine profile andimmunohistochemical analysis delineate the mechanisms mediating these sequelae. Although pDCsare resistant to novel therapies, targeting Toll-like Receptors with CpG ODNs both restores pDCimmune function and abrogates pDC-induced MM cell growth. Our study therefore validatestargeting pDC-MM interactions as a therapeutic strategy to overcome drug resistance in MM.
¶Correspondence: [email protected] (K.C.A) and [email protected] (D.C) Phone:617-632-4563; Fax: 617-632-2140.*Contributed equally to the workSignificanceRecent reports demonstrate infiltration of dendritic cells (DCs) at tumor sites, but with unclear significance. Here we show thepathophysiologic role of plasmacytoid DCs (pDCs) in multiple myeloma (MM). Our study shows increased numbers and more frequentlocalization of pDCs in MM patient BM than normal BM. Functional analysis using in vitro and in vivo models of human MM in theBM milieu shows that pDCs confer growth, survival, chemotaxis, and drug resistance. Importantly, targeting Toll-like receptors withCpG ODNs improves immune function of pDCs and abrogates pDC-induced MM cell growth. These findings identify an integral roleof pDCs in MM pathogenesis and provide the basis for targeting pDC-MM interactions as therapeutic strategy to improve patient outcome.Authors contributions: DC designed research, analyzed data and wrote the manuscript; AS designed, interpreted, and performed mostexperiments; MB performed growth/survival assays; GB isolated normal plasma cells; RC and DJ helped in IHC; and TH, SH, PR, YT,NR, CM, and NM provided clinical samples; and KA analyzed data and wrote the manuscript. We also thank Robert Schlossman, BryanCiccarelli, and Sagar Lonial for providing blood samples. We are thankful to Lay-Hong Ang for confocal microscopy; John F. Daley forFACS; Sangeetha Battar, Gaurav Chetri, and David Vasir for technical help and insightful discussions.Publisher's Disclaimer: This is a PDF file of an unedited manuscript that has been accepted for publication. As a service to our customerswe are providing this early version of the manuscript. The manuscript will undergo copyediting, typesetting, and review of the resultingproof before it is published in its final citable form. Please note that during the production process errors may be discovered which couldaffect the content, and all legal disclaimers that apply to the journal pertain.
NIH Public AccessAuthor ManuscriptCancer Cell. Author manuscript; available in PMC 2010 October 6.
Published in final edited form as:Cancer Cell. 2009 October 6; 16(4): 309–323. doi:10.1016/j.ccr.2009.08.019.
NIH
-PA Author Manuscript
NIH
-PA Author Manuscript
NIH
-PA Author Manuscript
IntroductionMultiple Myeloma (MM) is diagnosed in 15,000 new individuals annually. The mediansurvival has been prolonged from 3–4 to 7 years, especially in patients less than age 50 (Brenneret al., 2008; Kumar et al., 2008). However, despite important advances including biologicalagents bortezomib, thalidomide, and lenalidomide, MM remains incurable due to thedevelopment of drug resistance, which manifests as relapsed/refractory disease (Anderson,2007). The molecular mechanisms whereby MM cells evade drug-induced cytotoxicity andacquire drug-resistant phenotypes include interaction of MM cells with their bone marrow(BM) microenvironment (Dalton and Anderson, 2006; Hideshima et al., 2007). The BM milieucontains stromal cells (BMSCs), osteoclasts (Roodman, 2008), myeloid cells, and immuneeffector cells. BMSCs promote growth and drug resistance in MM cells; however, thefunctional significance of other BM cellular components is unclear.
Macrophages and dendritic cells (DCs) regulate tumor cell growth (Banchereau and Steinman,1998; Kukreja et al., 2006; McKenna et al., 2005; Ribatti et al., 2006). DCs are BM-derivedMNCs that also play an essential role in immune responses (Steinman and Cohn, 1973). Inhumans, two major DC subsets have been identified based on their origin, phenotype, andfunction (Colonna et al., 2004; O’Doherty et al., 1994): Myeloid DCs (mDCs) (CD11c+,CD123−) that include langherhans cells and interstitial DCs; and plasmacytoid DCs (pDCs)(Grouard et al., 1997). pDCs lack lineage cell markers for T, B, NK cells and monocytes; andexpress CD123, HLA-DR and BDCA-2 (Colonna et al., 2004; Dzionek et al., 2002; Grouardet al., 1997; O’Doherty et al., 1994). Stimulated pDCs have strong Ag-presenting potential,and regulate anti-viral innate immunity (Gilliet et al., 2008; Krieg, 2007; Siegal et al., 1999).Prior studies showed that pDCs from MM patients are defective in their antigen presentingfunction (Brimnes et al., 2006; Ratta et al., 2002). Indeed, loss of immune function of tumor-infiltrating DCs has been linked to the suppressive effects of the tumor microenvironmentmediated via vascular endothelial growth factor (VEGF), interleukin-6 (IL-6) or macrophagestimulating factor (MCSF) in cancers (Zou, 2005) including MM (Hayashi et al., 2003).Importantly, pDCs play a role in normal B cell development into plasmablasts, theirdifferentiation into antibody-secreting plasma cells, and their survival (Garcia De Vinuesa etal., 1999; Jego et al., 2003; Poeck et al., 2004; Tabera et al., 2008). However, the role of pDCsin regulating growth and survival of malignant plasma cells is unclear. In the present study,we have characterized the distribution/frequency and function of pDCs in MM.
Results and DiscussionDistribution and frequency of pDCs in MM
MM is characterized by immune dysfunction (Brown et al., 2001; Ratta et al., 2002). We firstexamined the immune function of pDCs derived from normal donors vs. MM patients (definedin Fig 1A as HLA-DR+ CD123+ BDCA-2+ cells) by their ability to stimulate allogeneic T cellresponse. Even though resting pDCs are known poor antigen presenting cells (Liu, 2005), acomparative analysis of MM BM pDCs versus normal pDCs shows markedly decreased abilityof MM BM pDCs to trigger T cell proliferation versus normal pDCs (P = 0.01).
Recent reports linked increased infiltration of pDCs in human tumors (Liu, 2005), but withunclear significance. Studies related to the distribution of pDCs in MM are limited and unclear.For example, one study observed a decreased number of pDCs in peripheral blood (PB) fromMM patients compared to PB from normal donors (Brimnes et al., 2006), whereas anotherstudy showed that PB-derived pDCs from MM patients are numerically within the normalrange (Brown et al., 2001). We therefore next examined the distribution and frequency of pDCsin MM patients vs. normal donors using immunohistochemical analysis of biopsy samples andFACS analysis of freshly obtained samples. For these studies, we utilized antibody against
Chauhan et al. Page 2
Cancer Cell. Author manuscript; available in PMC 2010 October 6.
NIH
-PA Author Manuscript
NIH
-PA Author Manuscript
NIH
-PA Author Manuscript

pDC specific marker BDCA-2 (Dzionek et al., 2001). We examined 10 MM patient and 5normal donor BM biopsies for the expression of BDCA-2 by IHC analysis. Fig 1C is arepresentative photograph showing pDCs as BDCA-2-postively stained cells (brown cells).These cells were then quantified in all MM patient and normal samples (Fig 1D); pDCs wereincreased in MM BM vs. normal BM. We then utilized FACS analysis to determine thefrequency of pDCs in freshly obtained samples using BDCA-2 Ab. BM samples from 32 MMpatients with newly diagnosed and relapsed/refractory disease, as well as from 8 normal donorswere examined. Comparative analysis shows 4.7% ± 0.8% pDCs in MM BM vs. 0.4% ± 0.2%in normal donor BM (Fig 1E). In contrast, no significant difference in pDC number wasobserved between normal BM vs. PB (Fig 1E, 8 normal donors). Furthermore, increased pDCswere noted in MM BM vs. MM PB. Analysis of pDCs in matched BM and PB samples from8 patients confirmed increased numbers of pDCs in BM than in PB (4.4 ± 0.3% in BM vs. 0.62± 0.24% in PB, Fig 1F). These findings suggest that 1) increased numbers of pDCs are presentin MM patient BM vs. normal BM; and 2) pDCs are more frequently localized in MM BMthan MM PB.
pDCs trigger growth and prolong survival of MM cellsWe next examined the functional significance of increased pDC numbers in MM BM. Ourprior studies showed that BMSCs trigger MM cell growth; therefore, we examined whetherpDCs similarly affect MM cells. MM.1S cells and normal PB pDCs were cultured either aloneor together at 1:3, 1:5 or 1:7 (pDC:MM) ratio for 24h, 72h and 120h, and DNA synthesis wasmeasured by 3H-thymidine (3H-Tdr) uptake. A significant increase in DNA synthesis wasnoted when MM cells were cultured with pDCs at 1:5 (pDC/MM) ratio: for example, 3–4 foldincreased 3H-Tdr uptake in MM.1S cells cultured with pDCs for 72h vs. control MM cellsalone, P < 0.005) (Fig 2A). No increase in DNA synthesis was observed in pDCs cultured alone(Fig 2A). Co-culture of pDCs with MM.1S cells at 1:3 or 1:7 (pDC/MM) ratio also inducedMM.1S cell growth (data not shown); however, maximal growth was noted at 1:5 pDC/MMratios. This 1:5 pDC/MM ratio is physiologically relevant, since pDC frequency in MM BMis 4.7 ± 0.8% (Fig 1E) corresponding to 23.5% ± 3% MM cells in BM.Co-culture of GFP-expressing MM.1S cells with pDCs increased number of GFP+ cells, suggesting that pDCsinduce MM.1S cell growth (Fig 2B). Irradiated pDCs retain their ability to trigger MM cellproliferation (Fig 2C). To determine whether pDCs alter the clonogenic growth of MM cells,we plated MM.1S cells with pDCs in methycellulose cultures. pDCs markedly increase thenumber of tumor colonies vs. tumor cells alone (Fig 2D). This MM cell growth promotingactivity of pDCs was further confirmed by additional assays. For example, WST proliferationassay also showed that pDCs trigger proliferation of MM cells (Fig 2E). Finally, pDC-inducedMM cell growth was associated with activation of growth signaling kinase ERK in MM.1Scells (Fig 2F). Together, these findings demonstrate that pDCs can promote MM cell growth.
Our prior studies showed that BMSCs trigger MM cell growth (Hideshima et al., 2007). Arecent study showed that in-vitro generated mDCs enhance clonogenecity of MM cells(Kukreja et al., 2006). We therefore examined the stimulatory effect of normal PB mDCs vs.pDCs vs. MM patient BMSCs on MM cell growth. Culture of MM.1S cells with BMSCstriggered a 2.2 ± 0.7 fold increase in DNA synthesis in MM.1S cells. Importantly, pDCstriggered 3.1 ± 0.3 fold increased DNA synthesis, whereas mDCs induced only 15–20%increased DNA synthesis (Fig 2G). These data suggest that BMSCs and mDCs also stimulateDNA synthesis, albeit to a lesser extent than pDCs. The differences in the potency of pDCvs. mDCs in our study vs. a previous report (Kukreja et al., 2007) may be due to the use ofdifferent MM cell line, sources of pDCs, and/or growth assays. Nonetheless, both studiessuggest a role of DCs in modulating MM cell growth. Additionally, pDCs are more robustgrowth stimulators of MM cells than monocytes under similar experimental conditions(Supplementary Fig 1). Importantly, the pDC-depleted BM cells did not trigger significant
Chauhan et al. Page 3
Cancer Cell. Author manuscript; available in PMC 2010 October 6.
NIH
-PA Author Manuscript
NIH
-PA Author Manuscript
NIH
-PA Author Manuscript
DNA synthesis in MM cells (Fig 2H). Similarly, co-culture of pDC-depleted BM cells withGFP-MM.1S cell showed no increase in GFP+ cell numbers (data not shown), confirming thespecific MM cell growth-promoting activity of pDCs.
Genetic heterogeneity (Bergsagel and Kuehl, 2005) and drug resistance in MM impact theinteraction of tumor cells with BMSCs and its functional sequelae (Hideshima et al., 2007).We examined the growth promoting activity of pDCs in a broader panel of MM cell lines,including those that are drug resistant and cytogenetically distinct. These included Dex-resistant MM.1R cell line with t14;16 translocation; parental RPMI-8266 cell line and itsDoxorubicin-resistant derivative (8226/Dox-6); an IL-6-dependent cell line INA-6; andOPM-2 (t4:14) MM cell line. pDCs stimulated DNA synthesis in all MM cell lines, albeit toa differential extent (Fig 2I). These findings suggest that genetic heterogeneity in MM may beassociated with differential tumor growth responses to pDCs.
Patient MM cells have a low proliferative capacity in vitro, and we similarly examined theeffects of pDCs on primary tumor cells. Our results show that pDCs trigger proliferation ofpatient MM cells (Fig 3A), evidenced by increase in DNA synthesis. In contrast, pDCs hadlittle, if any, effect on DNA synthesis in normal plasma cells (Fig 3A). Similar results wereobtained using viability assays (data not shown).
We next examined whether MM patient pDCs, like normal donor pDCs, trigger proliferationof MM cell line and patient MM cells. MM patient-derived BM pDCs induced growth of bothallogeneic MM.1S cell line (Fig 3B), and autologous tumor cells (Fig 3C). Importantly, wefound a significant increase in the survival of patient MM cells when co-cultured with pDCsfor 3–4 weeks (Fig 3D; 35–50% increase in 5 of 5 patients cells, P < 0.05). Immunostainingwith kappa and lamda IgG Abs confirmed the clonality of MM cells in prolonged cultures withpDCs (Fig 3E).
pDCs confer drug-resistanceBinding of MM cells to BMSCs mediates resistance to conventional (Dexamethasone)therapies; and conversely, novel therapies (bortezomib, lenalidomide) can overcome thisgrowth advantage conferred by BMSCs (Hideshima et al., 2007). We therefore next determinedwhether various anti-MM agents overcome pDC-mediated biologic sequelae in MM cells. Weasked 1) whether anti-MM agent bortezomib directly affects the viability of pDCs; and 2)whether pDC-triggered growth of MM cells is affected by bortezomib. Treatment of normalPB pDCs for 24h with bortezomib (20 nM) did not significantly decrease their viability (Fig4A). Similarly, treatment of pDCs with even higher doses of bortezomib (20–100 nM) did nottrigger significant apoptosis (Fig 4B). Longer periods (48h) and higher dose of bortezomibtriggered cell death of pDCs (data not shown), as also reported in a prior study (Kukreja et al.,2007). However, it is noteworthy that MM cells require many fold lesser concentrations ofbortezomib and shorter periods of exposure to undergo for MM.1S cells is 5 nM at 24 h, as inFig 4A apoptosis (e.g. IC50 and 4B), suggesting that pDCs are relatively resistant to bortezomibcompared to tumor cells. Importantly, and in agreement with a previous report (Kukreja et al.,2007), we found that pDCs protect MM cells against bortezomib-induced cytotoxicity (Fig4C). Furthermore, pDCs triggered MM cell proliferation even in the presence of bortezomib,albeit to a lesser extent than without drug (Fig 4E). As with bortezomib, treatment of pDCswith immunomodulatory drug lenalidomide does not significantly decrease their viability (Fig4D). Moreover, pDCs triggered increased DNA synthesis in MM cells even in the presence oflenalidomide (Fig 4E). Conventional agent Dex (0.5 μM) triggered only 8–10% decreasedviability of pDCs (Fig 4D), with 12–15% apoptosis. Importantly, similar concentrations of Dextriggered 70 ± 3.6% apoptosis in MM cells (data not shown). We therefore conclude that incomparison to tumor cells, pDCs are relatively resistant to botezomib, lenalidomide, and Dextherapies.
Chauhan et al. Page 4
Cancer Cell. Author manuscript; available in PMC 2010 October 6.
NIH
-PA Author Manuscript
NIH
-PA Author Manuscript
NIH
-PA Author Manuscript

We next performed microarray analysis to identify the molecular mechanisms whereby pDCsconfer growth and drug resistance in MM cells. For these studies, we examined pDC-inducedgene changes in MM cells. In particular, we found that pDCs triggered upregulation oftranscripts mediating proteasome function in MM.1S cells, including proteasome 26S subunitand PA200 (ATPase complex) (Supplementary Fig 2). Furthermore, a marked increase inchymotrypsin-like (CT-L), caspase-like (C-L), and trypsin-like (T-L) proteasome activity, wasnoted in MM.1S cells cultured with pDCs vs. MM.1S cells alone (Fig 4F). In concert with thesefindings, pDCs triggered a decrease in protein ubiquitination in MM.1S cells (Fig 4F).Bortezomib primarily blocks CT-L and C-L, but not T-L activity, and pDCs significantlyincrease T-L activity in MM cells. Importantly, bortezomib-induced cytotoxicity is linked toinhibition of proteasome activity (Chauhan et al., 2005), and our data suggest that pDCsupregulate proteasome activity. It is therefore likely that pDCs, of by enhancing proteasomeactivity in MM cells, raise the IC50 bortezomib for MM cells. A recent study also showed thatoverexpression of proteasome subunit confers resistance to bortezomib (Oerlemans et al.,2008). These data suggest a likely mechanism whereby pDCs confer bortezomib resistance inMM cells.
Besides the proteasome components, pDCs also increased transcripts linked to NF-κBsignaling pathway in MM cells including, NF-κB activating protein and genes containing NF-κB consensus binding sites in their promoter regions (e.g. IL-6, VEGF, IL-10). NF-κB mediatesgrowth, survival and drug resistance in MM cells (Chauhan et al., 1996). DNA binding ELISAassays and immunoblotting confirmed pDC-induced NF-κB activation in MM.1S cells (Fig4G and inset). Importantly, blockade of NF-κB using IKK inhibitor PS-1145 decreases pDC-triggered MM.1S and MM.1R cell growth (Fig 4H). To further confirm the role of NF-κB inmediating pDC-induced MM cell growth, we knocked down IKKβ expression in MM cellsusing siRNA. The functional specificity of IKKβ siRNA was evident by a marked decrease inprotein levels of IKKβ (Fig 4I). Transfection of IKKβ siRNA, but not negative-control(scrambled) siRNA, significantly inhibited pDC-induced growth in MM.1S cells (Fig 4J).Together, these findings suggest an obligatory role of NF-κB during pDC-triggered MM cellgrowth.
Chemotaxis/migration during pDC-MM interactionThe frequent localization of pDCs in MM BM and their ability to trigger MM cell growthsuggest involvement of chemotaxis between pDCs and MM cells. Time-lapse live cell imagingdemonstrates increased motility of pDCs and MM cells towards each other, evidenced byformation of filopodia (Figure 5A, and movie S1). In agreement with these data, Transwellinsert assays demonstrate markedly increased migration of MM.1S cells towards pDCs (Fig5B, left panel). Importantly, 2–3 fold greater numbers of MM.1S cells migrated towardssupernatants from pDC-MM cultures compared to those from cultures of pDCs or MM.1S cellsalone (Fig 5B, right panel). Crystal violet staining confirms increased numbers of MM.1S cellsmigrating towards supernatants from pDC-MM cultures (Fig 5B, micrographs). Similarly,pDCs showed increased migration towards supernatants of pDC-MM co-cultures (data notshown). These findings demonstrate chemotaxis between pDCs and MM cells, andimportantly, show that pDC-MM interaction further enhances secretion of chemotactic factors.
Role of soluble factorsWe next directly analyzed secretion of cytokines and chemokines in supernatants from pDCs,MM.1S cells, and pDC-MM.1S cell co-cultures using cytokine bead arrays. pDC-MMinteraction triggers secretion of many known MM cell growth and chemotactic factors(Hideshima et al., 2007) including IL-10, VEGF, CD40L, IL-8, IL-15, IL-6, and MCP-1 orIP10 (Figure 5C–5E). We also found that pDC-MM interaction increased IL-3 and SDF-1α(CXCL12) levels (Fig 5F). Both IL-3 and SDF-1α mediate autocrine growth and chemotaxis
Chauhan et al. Page 5
Cancer Cell. Author manuscript; available in PMC 2010 October 6.
NIH
-PA Author Manuscript
NIH
-PA Author Manuscript
NIH
-PA Author Manuscript

in MM cells (Hideshima et al., 2007; Lee et al., 2004). SDF-1α is involved in in vivo migrationof pDCs into tumors via its ligand CXCR4 (Zou et al., 2001). Importantly, blockade of IL-3or SDF-1α with neutralizing Abs or AMD3100 (drug targeting CXCR4-CXCL12) markedlyabrogates pDC-induced MM cell growth (Fig 5G). IL-3 is a survival factor for pDCs (Grouardet al., 1997). Our finding that MM cells secrete low levels of IL-3 constitutively, which ismarkedly increased upon interaction with pDCs explains, at least in part, prolonged survivalof pDCs when cultured with MM cells in vitro (Figure 3E) and in vivo (Fig 7B and 7C).
We next assessed whether pDCs migrate in response to chemokines identified in cytokine beadarrays. Transwell insert assays show significant chemotaxis of pDCs towards CXCL12(SDF-1α), IL-3, CXCL10 (IP-10), CCL4 (MIP1α), CCL3 (MIP1β) and MCP-1 (Fig 5-I). Thesedata suggest that pDC-MM interaction upregulate many chemokines that may allow for pDCsmigration and homing of pDCs to MM BM.
Requirement of pDC-MM cell contactTo determine whether cell-cell contact between pDCs and MM cells is required, we utilizedTranswell Inserts assays, immunofluorescence (IFC) with confocal microscopy, and IHCanalysis. Culture of pDCs and MM cells in the transwell system, which prevents physicalinteraction of pDCs with MM cells while allowing for proximity and stimulation by solublefactors, significantly attenuated the ability of pDCs to trigger MM cell proliferation (Fig 6A).These findings suggest that contact-dependent secretion of soluble factors accounts for themajority of pDC-induced MM cell growth.
To determine whether pDCs are indeed in close proximity to MM cells in vivo, we examinedBM biopsy samples from MM patients. Patient BM biopsies were subjected to dual IFC stainingwith BDCA-2 (pDCs) and CD138 (MM cells) and DAPI. Results demonstrates direct cell-cellcontact between pDCs and MM cells as well as clusters of pDCs with MM cells (Fig 6B). IHCanalysis with another pDC marker CD123 confirmed these data (Supplementary Fig 3).
Adhesion of MM cells to BMSCs triggers transcription and secretion of soluble factors thatmediate MM cell growth in a paracrine manner (Anderson, 2007). Similarly, we here foundthat pDC-MM interaction upregulates many MM cell growth, survival and chemotactic factors.Importantly, although, MM cells constitutively secrete factors, the direct cell-cell interactionbetween pDCs and MM cells further augments the production of cytokines and chemokineswhich not only confer growth, survival and drug resistance in MM cells, but also prolongsurvival of pDCs. Together these studies suggest a role of both soluble factors and direct pDC-MM cell-cell contact in mediating MM cell growth and pDC survival.
Role of pDC-MM cell surface receptor-ligand interactionsThe above findings implicate cell surface molecules in mediating interactions that trigger MMcell growth/survival. Both pDCs and MM cells express molecules which play a role in B celldifferentiation and serve as co-stimulatory molecules; e.g, BAFF/APRIL and RANK-RANKL(MacLennan and Vinuesa, 2002; Roodman and Dougall, 2008). Indeed, we found significantlyincreased BAFF levels in MM patient vs. normal donor serum (Fig 6C), as in our previousreport (Neri et al., 2007). Importantly, blockade of BAFF with either a small molecule inhibitoror TACI-Fc significantly abrogated pDC-induced MM cell growth (Fig 6D and 6E,respectively). TACI-Fc alone did not affect the viability of MM.1S cells alone (data not shown).On the other hand, inhibition of RANK-RANKL using osteoprotegrin (OPG) also decreasedpDC-induced MM cell growth, albeit to a lesser extent than inhibiting BAFF (Fig 6E). Ourfinding that NF-κB mediates pDC-MM functional sequelae, together with the known role ofboth BAFF and RANKL in activating NF-κB, suggests the therapeutic potential of targeting
Chauhan et al. Page 6
Cancer Cell. Author manuscript; available in PMC 2010 October 6.
NIH
-PA Author Manuscript
NIH
-PA Author Manuscript
NIH
-PA Author Manuscript

BAFF/RANKL in MM. However, it is very likely that other cell surface receptor ligandinteractions are also involved in mediating pDC-MM interactions.
In vivo validation of pDC-induced growth of MM cells using MM xenograft modelsHaving defined the functional role of pDCs in regulation of MM biology in vitro, we nextexamined whether pDCs similarly affect MM cell growth in vivo using murine xenograftmodels of human MM. In order to evaluate the growth-promoting function of human pDCswithin the human BM milieu, we utilized the SCID-hu model (Tassone et al., 2005), whichrecapitulates the human BM milieu in vivo. In this model, MM cells are injected directly intohuman bone chips implanted subcutaneously in SCID mice, and MM cell growth is assessedby serial measurements of circulating levels of soluble human IL-6R and Ig in mouse serum.A more robust growth of tumor occurred in mice receiving human pDCs and INA-6 MM cellsthan in mice injected with INA-6 cells alone (Fig 7A and 7B). pDCs alone did not inducetumors in mice (data not shown). Immunostaining of implanted human bone with BDCA-2showed presence of viable pDCs 30 days after the initial injections (Fig 7C). As in our invitro results, IL-3 was highly expressed in mice injected with pDCs plus INA-6 cells (Fig 7C).The observation that IL-3 is a survival factor for pDCs, coupled with our in vitro and in vivoresults, suggests that IL-3, at least in part, facilitates prolonged survival of pDCs in vivo in thehuman MM BM milieu.
We also observed an increase in Ki-67 and Cyclin D1-positive cells in human bone sectionsfrom mice engrafted with pDCs and INA-6 MM cells compared to mice receiving INA-6 cellsalone (Fig 7D, 7E). Counterstaining of bone sections with CD138 confirmed that Ki-67 andCyclin-D1 positive cells were MM cells (data not shown). These findings are consistent withincreased proliferation of MM cells in vivo triggered by pDCs. Similarly, we noted a markedincrease in p-IκB, a decrease in ubiquitination and enhanced Factor VIII and VEGFR1expression in bone sections from mice injected with pDCs plus INA-6 cells vs. INA-6 MMcells alone (Fig 7F–7H). These in vivo data confirms our in vitro data, and suggest that pDCstrigger activation of growth, survival, and angiogenic signaling pathways in MM cells.
We next utilized a subcutaneous model of human MM in SCID mice to further confirm pDC-induced MM cell growth. An early and rapid growth of tumor occurred within 12 days in micereceiving both pDCs and MM cells, whereas similar tumor growth was noted only at day 21in mice injected with MM cells alone (Fig 7-I). Immunostaining showed increased IL-3 andpresence of pDCs (BDCA-2+ cells) in tumor sections from mice receiving pDCs and MM cellsvs. MM cells alone (data not shown). Together, our findings from two distinct human MMxenograft models suggest that pDCs enhance MM cell growth in vivo.
CpG-ODNs restore MM patient pDCs T cell response and block MM cell growthMM is characterized by immune dysfunction, and pDCs may contribute, at least in part, sinceMM patient BM-pDCs exhibit reduced ability to induce T cell proliferation (Fig 1B). The lossof immune functioning of tumor-infiltrating DCs has been linked to the immunosuppressiveeffects of the tumor-host microenvironment mediated via vascular endothelial growth factor(VEGF), interleukin-6 (IL-6) or macrophage stimulating factor (MCSF) in cancers (Zou,2005) including MM (Hayashi et al., 2003). Prior studies showed that immune function ofpDCs is mediated by production of type I IFNs (Siegal et al., 1999), which in turn, is linkedto expression of toll-like receptor 7 (TLR7) and TLR9 (Gilliet et al., 2008;Krieg,2007;Moseman et al., 2004;Vollmer, 2005). Other studies have targeted TLR-9 usingimmunostimulatory activities of CpG-containing oligodeoxynucleotides (CpG ODNs) toactivate pDCs. Indeed systemic lupus erythematous (SLE) is linked to TLR-9-activated pDCsand IFN-α release (Barrat et al., 2005;Krieg, 2007;Liu et al., 2008;Vollmer, 2005). In light ofthese studies, we next examined whether treatment of MM patient BM-pDCs with CpG-ODNs
Chauhan et al. Page 7
Cancer Cell. Author manuscript; available in PMC 2010 October 6.
NIH
-PA Author Manuscript
NIH
-PA Author Manuscript
NIH
-PA Author Manuscript

alters their T cell stimulatory activity. Importantly, CpG-ODNs restore the ability of MMpatient BM-pDCs to trigger both allogeneic and autologus T cell proliferation (Fig 8A and 8B).Furthermore, CpGs also enhanced IFN-α secretion from MM patient BM-pDCs (Fig 8C) andupregulated TLR9 expression in MM BM pDCs (Fig 8D).
Prior studies showed that pDCs activated via TLR ligation, CD40-L engagement, or HIV canmodulate regulatory T cells (Tregs) (Gilliet and Liu, 2002; Manches et al., 2008; Moseman etal., 2004). Tregs are dysfunctional and decreased in numbers in MM (Prabhalarao et al.,2006). CD4+CD25+FOXP3-high Tregs can be expanded by mDCs in vitro and after injectionof cytokine-matured DCs in MM patients (Banerjee et al., 2006). It is possible that activatedpDCs may restore Tregs homeostasis in MM; however, the functional significance of pDCseffect on Tregs within the human MM BM microenviroment, particularly the biologic sequelaein MM cells, remains to be examined.
We next asked whether CpG-ODNs affects pDC-induced MM cell growth. As shown in Fig8E, CpGs inhibit patient-BM pDC-triggered DNA synthesis in MM.1S cells. CpGs alsoblocked pDC-induced growth of MM cells lines, as assessed by WST proliferation assays (Fig8F). These data demonstrate that 1) activation of pDCs with CpGs both restore their ability totrigger T cell proliferation and reduces their MM cell growth promoting activity; and 2) MMcell interaction with pDCs does not require pDC activation. A recent study in the B16 mousemelanoma tumor model also showed that CpG-activated pDCs are capable of inducing asystemic anti-tumor immunity via activation of NK cells and T cells (Liu et al., 2008). It remainsto be determined whether CpG-activated MM pDCs generate clinically significant effectiveanti-tumor immunity in MM.
In summary, we show the pathophysiologic role of pDCs in MM. Our findings demonstrateincreased numbers and more frequent localization of pDCs in MM patient BM than normalBM. Both in vitro and in vivo models of human MM show that pDCs confer growth, survival,chemotaxis, and drug resistance in MM cells. Targeting Toll-like receptors with CpG ODNsboth improves immune function of pDCs and abrogates pDC-induced MM cell growth.Overall, our findings identify an integral role of pDCs in MM pathogenesis and provide thebasis for targeting pDC-MM interactions with CpG-ODNs as a therapeutic strategy to improvepatient outcome in MM.
Experimental ProceduresIsolation, phenotypic analysis and quantification of pDCs
All studies involving human samples were performed under IRB-approved protocols at Dana-Farber Cancer Institute (Boston), Brigham and Womens Hospital (Boston), and Mayo Clinic(Rochester) through which informed consent was obtained and de-identified samples wereutilized. pDCs were isolated by magnetically activated cell sorting using CD304 (BDCA-4/Neuropilin-1) microbeads kit (Miltenyi Biotec, Auburn, CA). MNCs from normal healthydonors and MM patients were isolated by Ficoll Hypaque density gradient centrifugation. Cellswere then magnetically labeled with anti-BDCA-4 antibody coupled to colloidal paramagneticmicrobeads and passed through a magnetic separation column twice (Mitenyi Biotec). Thecells staining negative for lineage markers and CD11c were FACS sorted (Fig 1A).Polychromatic staining of cells with CD123 PE-Cy5, HLA-DR Pacific Blue, and BDCA-2FITC confirmed the purity of pDCs (≥99%) (Dzionek et al., 2001): BDCA-4-positive pDCsderived in this way are lineage (CD3, CD14, CD20, CD11c−) negative, MHC II-positive, aswell as CD123 and BDCA-2-positive. pDCs were quantified in total MNCs (2 × 10⁶ cells)from PB or BM samples using FACS analysis (100,000 minimum events were gated) withBDCA-2 (CD303)-PE conjugated Ab (Mitenyi Biotec). For some experiments, pDCs werepurified using negative depletion (miltenyi Biotec)(99% BDCA2+ CD123+ cells by FACS).
Chauhan et al. Page 8
Cancer Cell. Author manuscript; available in PMC 2010 October 6.
NIH
-PA Author Manuscript
NIH
-PA Author Manuscript
NIH
-PA Author Manuscript
To obtain pDC-depleted fraction of MM BM cells, we utilized LD columns in combinationwith BDCA-4 Microbeads and MACS separator (Miltenyi Biotec). FACS analysis of pDC-depleted BM cell fraction showed low to undetectable BDCA-2-positive cells (3.8% pDCsbefore and <0.02% pDCs after depletion). Antibody details are in the supplementary file. Flowcytometric analysis was performed on a Beckman Coulter FC 500, and the data was analyzedusing CXP software (BD Biosciences, San Jose, CA).
Cell growth, viability, survival, and apoptosis assaysCells were cultured in complete medium (RPMI-1640 media supplemented with 10% FBS,100 units/mL penicillin, 100 μg/mL streptomycin, and 2 mM L-glutamine). DNA synthesiswas measured by (3H)thymidine uptake (3H-Tdr)(PerkinElmer, Boston, MA), as previouslydescribed (Chauhan et al., 2005). Fold change in DNA synthesis was calculated using followingformula: 3H-TdR uptake of cells in pDC-MM cultures minus 3H-TdR uptake of pDCs alonedivided by 3H-TdR uptake of MM cells alone. Growth was also assessed by WST assay(BioVision, Mountain View, CA). Cell viability was assessed by 3-(4,5-dimethylthiozol-2-yl)-2,5-diphenyltetrazolium bromide (MTT; Chemicon International Inc., Temecula, CA)assay (Chauhan et al., 2005). For cell survival assays; pDCs and patient MM cells were culturedat 1:5 pDC/MM ratio in 6 well plates in DCP-MM culture medium (Mattek Corp. Ashland,MA). After each week of co-culture, tumor cells were separated with CD138 microbeads, andcultured with fresh pDCs. After four weeks of co-culture, cells were triple stained with CD138-FITC conjugated Ab, CD123-PE conjugated Ab, and DAPI, and images were taken by ZeissLSM confocal microscope (Thornwood, NY). Staining with kappa and lamda Abs and DAPIconfirmed clonality of MM cells. Apoptosis was measured by Annexin V/PI staining (Chauhanet al., 2005). T cell proliferation assays were performed as previously described (Hayashi etal., 2003). Briefly, pDCs were cultured with or without T cells, in the presence or absence ofCpG-ODNS (0.4 and 4.0 μg/ml) in complete medium; and DNA synthesis was analyzed byboth 3H-TdR uptake and WST assays.
Live cell imagingpDCs were labeled with MitoFluor Red 594 (1:1000; Invitrogen, Carlsbad, CA); GFP-positiveMM.1S were added to pDCs in a 24 well glass-bottom culture dish (MatTek Inc, Ashland,MA), and live cell images were taken using an Apochromat 40×/1.2W lens on a LSM-510confocal system. Images were taken for 30ms interval for 5–15 mins, and processed usingVolocity software (Improvision Inc, Waltham, MA).
Immunofluorescence and confocal microscopyBM biopsies from MM patients and normal donors were subjected to double IFC staining withBDCA-2 and CD138 Abs. Antigen retrieval was performed by boiling the slides in DIVADecloaker (Biocare, Concord CA) for 10 minutes in a pressure cooker. Slides were incubatedwith 5% normal donkey serum, followed by staining with mouse monoclonal anti-humanCD138 Ab (1:100) and rabbit polyclonal BDCA-2 Ab (1:10). After TBS wash, slides wereincubated with Alexa-488 conjugated Donkey anti-rabbit secondary Ab (1:200) and CY5Donkey anti-mouse secondary Ab (1:200) for 1h at RT. Slides were mounted with Vectashieldcontaining DAPI (Vector lab, Burlingame CA). Confocal images were taken using the ZeissLSM510 confocal system (63×/1.4 apochromat objective) (Thornwood, NY). IHC withprimary antibody specific for pDCs (BDCA-2 at 1:400 dilution) and MM cells (CD138 at 1:500dilution) was conducted using previously described methods (Jaye et al., 2006).
Transwell migration assaysIn vitro migration assays were performed using Transwell Boyden chambers (Chemicon,Billerica, MA). For pDC chemotaxis studies, we utilized 5 μM pore size membranes which
Chauhan et al. Page 9
Cancer Cell. Author manuscript; available in PMC 2010 October 6.
NIH
-PA Author Manuscript
NIH
-PA Author Manuscript
NIH
-PA Author Manuscript

allow for the free passage of pDCs. 5 × 10⁵ pDCs were suspended in serum-free culture medium(RPMI-1640 media supplemented with antibiotics) and plated in the upper chamber; lowerchamber was coated with various chemokines. After 2h incubation at 37°C, pDCs that migratedto the lower chamber were counted. pDCs and MM cell migration: Cell migration was assayedusing a 24-well plate with 8-μm pore size inserts. MM cells (2 × 10⁶ cells/ml) were plated inthe upper and pDCs in the lower chamber or vice versa. Serum free culture medium (as above)was used. The plates were then incubated at 37°C for 4 h, and the non-migrating cells in theupper chamber removed from the Transwell membrane by washing with PBS. Cells migratingto the bottom face of the membrane were stained with Crystal violet. 3 randomly selected fieldswere examined to quantify number of cells migrating from upper to lower chambers. For cell-cell contact-dependent MM cell growth, we utilized two different pore size membranes toseparate cells: 0.4 μM (that does not allow free passage of cells) and 8 μM (that allows cellpassage). pDCs (2 × 10⁴) and MM.1S cells (1 × 10⁵) were added into the upper and lowerchamber, respectively; and incubated for 72h at 37°C; cells from the lower chamber were thenharvested and analyzed for growth by WST assays.
Cytokine bead arrays and ELISAMM.1S cells (5 × 10⁴ cells/200 μL) and pDCs (1 × 10⁴ cells/200 μL) were cultured either aloneor together at 1:5 (pDC/MM) ratio in 96 well plates for indicated intervals in triplicate;supernatants were collected (a total of 600 μL for each condition) and analyzed using HumanCytokine/Chemokine panel-29 Plex (LINCO Res, MO). Cells were cultured in completemedium. BAFF, SDF1-α and IL-3 levels were measured by Quantikine BAFF ELISA kit(R&D, MN). IFN-α levels were assessed by ELISA (PBL, NJ).
Proteasome activity assaysMM.1S cells (2.5 × 10⁶) and pDCs (0.5 × 10⁶) were cultured in complete medium; MM.1Scells were separated from pDC co-cultures by CD138 microbeads (purity >99% CD138+ cells),and proteasome activity assays were performed using fluorogenic peptide substrates, aspreviously described (Chauhan et al., 2005).
Human plasmacytoma xenograft and SCID-hu modelAll animal experiments were approved by and conform to the relevant regulatory standards ofthe Institutional Animal Care and Use Committee at the Dana-Farber Cancer Institute. SCID-hu model has been described previously (Tassone et al., 2005). For SCID-hu model studies,we utilized an IL-6-dependent INA-6 MM cell line. Cells were propagated in vitro in completemedium, and rhIL-6 (2.5 ng/ml). INA-6 cells (2 × 10⁶) without IL-6, pDCs alone (0.4 × 10⁶),or INA-6 cells together with pDCs were injected directly into human bone chips implantedsubcutaneously in SCID mice. Tumor growth was assessed every tenth day by measuringcirculating levels of shIL-6R and IgG levels in mouse blood using ELISA (R & D Systems,MN, USA). Human plasmacytoma xenograft model: CB-17 SCID-mice were subcutaneouslyinjected with pDCs alone, MM.1S cells alone or pDCs and MM.1S cells (5 mice/group) inplain RPMI-1640 medium, and tumor growth was measured as previously described (Chauhanet al., 2005).
ImmunohistochemistryImplanted human bone chips were excised from mice and subjected to IHC analysis using Absagainst Ki-67, Cyclin-D1, p-IkB, Factor VIII, VEGFR1 and Ubiquitin (Abcam, Cambridge,MA), as previously described (Singh et al., 2006).
Chauhan et al. Page 10
Cancer Cell. Author manuscript; available in PMC 2010 October 6.
NIH
-PA Author Manuscript
NIH
-PA Author Manuscript
NIH
-PA Author Manuscript
Statistical AnalysisNon-parametric tests and mixed models were used to analyze the data, including Wilcoxon’ssigned rank and/or students t test to assess proliferation. Significance of differences observedin xenograft studies was assessed using Student t test. The minimal level of significance wasP < 0.05.
Microarray dataThe raw data for expression profiling and the CEL files are provided at the website GeneExpression Omnibus (http://www.ncbi.nlm.nih.gov/geo/). Accession Number “GSE17407”.
Supplementary MaterialRefer to Web version on PubMed Central for supplementary material.
AcknowledgmentsGrant support: This investigation was supported by NIH grants SPORE-P50100707, PO1-CA078378, andRO1CA050947; and MRF funds.
ReferencesAnderson KC. Targeted therapy of multiple myeloma based upon tumor-microenvironmental
interactions. Exp Hematol 2007;35:155–162. [PubMed: 17379101]Banchereau J, Steinman RM. Dendritic cells and the control of immunity. Nature 1998;392:245–252.
[PubMed: 9521319]Banerjee DK, Dhodapkar MV, Matayeva E, Steinman RM, Dhodapkar KM. Expansion of FOXP3high
regulatory T cells by human dendritic cells (DCs) in vitro and after injection of cytokine-matured DCsin myeloma patients. Blood 2006;108:2655–2661. [PubMed: 16763205]
Barrat FJ, Meeker T, Gregorio J, Chan JH, Uematsu S, Akira S, Chang B, Duramad O, Coffman RL.Nucleic acids of mammalian origin can act as endogenous ligands for Toll-like receptors and maypromote systemic lupus erythematosus. J Exp Med 2005;202:1131–1139. [PubMed: 16230478]
Bergsagel PL, Kuehl WM. Molecular pathogenesis and a consequent classification of multiple myeloma.J Clin Oncol 2005;23:6333–6338. [PubMed: 16155016]
Brenner H, Gondos A, Pulte D. Recent major improvement in long-term survival of younger patientswith multiple myeloma. Blood 2008;111:2521–2526. [PubMed: 17901246]
Brimnes MK, Svane IM, Johnsen HE. Impaired functionality and phenotypic profile of dendritic cellsfrom patients with multiple myeloma. Clin Exp Immunol 2006;144:76–84. [PubMed: 16542368]
Brown RD, Pope B, Murray A, Esdale W, Sze DM, Gibson J, Ho PJ, Hart D, Joshua D. Dendritic cellsfrom patients with myeloma are numerically normal but functionally defective as they fail to up-regulate CD80 (B7–1) expression after huCD40LT stimulation because of inhibition by transforminggrowth factor-beta1 and interleukin-10. Blood 2001;98:2992–2998. [PubMed: 11698282]
Chauhan D, Catley L, Li G, Podar K, Hideshima T, Velankar M, Mitsiades C, Mitsiades N, Yasui H,Letai A, et al. A novel orally active proteasome inhibitor induces apoptosis in multiple myeloma cellswith mechanisms distinct from Bortezomib. Cancer Cell 2005;8:407–419. [PubMed: 16286248]
Chauhan D, Uchiyama H, Akbarali Y, Urashima M, Yamamoto K, Libermann TA, Anderson KC.Multiple myeloma cell adhesion-induced interleukin-6 expression in bone marrow stromal cellsinvolves activation of NF-kappa B. Blood 1996;87:1104–1112. [PubMed: 8562936]
Colonna M, Trinchieri G, Liu YJ. Plasmacytoid dendritic cells in immunity. Nat Immunol 2004;5:1219–1226. [PubMed: 15549123]
Dalton W, Anderson KC. Synopsis of a roundtable on validating novel therapeutics for multiple myeloma.Clin Cancer Res 2006;12:6603–6610. [PubMed: 17121878]
Chauhan et al. Page 11
Cancer Cell. Author manuscript; available in PMC 2010 October 6.
NIH
-PA Author Manuscript
NIH
-PA Author Manuscript
NIH
-PA Author Manuscript

Dzionek A, Inagaki Y, Okawa K, Nagafune J, Rock J, Sohma Y, Winkels G, Zysk M, Yamaguchi Y,Schmitz J. Plasmacytoid dendritic cells: from specific surface markers to specific cellular functions.Hum Immunol 2002;63:1133–1148. [PubMed: 12480257]
Dzionek A, Sohma Y, Nagafune J, Cella M, Colonna M, Facchetti F, Gunther G, Johnston I, LanzavecchiaA, Nagasaka T, et al. BDCA-2, a novel plasmacytoid dendritic cell-specific type II C-type lectin,mediates antigen capture and is a potent inhibitor of interferon alpha/beta induction. J Exp Med2001;194:1823–1834. [PubMed: 11748283]
Garcia De Vinuesa C, Gulbranson-Judge A, Khan M, O’Leary P, Cascalho M, Wabl M, Klaus GG, OwenMJ, MacLennan IC. Dendritic cells associated with plasmablast survival. Eur J Immunol1999;29:3712–3721. [PubMed: 10556827]
Gilliet M, Cao W, Liu YJ. Plasmacytoid dendritic cells: sensing nucleic acids in viral infection andautoimmune diseases. Nat Rev Immunol 2008;8:594–606. [PubMed: 18641647]
Gilliet M, Liu YJ. Generation of human CD8 T regulatory cells by CD40 ligand-activated plasmacytoiddendritic cells. J Exp Med 2002;195:695–704. [PubMed: 11901196]
Grouard G, Rissoan MC, Filgueira L, Durand I, Banchereau J, Liu YJ. The enigmatic plasmacytoid Tcells develop into dendritic cells with interleukin (IL)-3 and CD40-ligand. J Exp Med1997;185:1101–1111. [PubMed: 9091583]
Hayashi T, Hideshima T, Akiyama M, Raje N, Richardson P, Chauhan D, Anderson KC. Ex vivoinduction of multiple myeloma-specific cytotoxic T lymphocytes. Blood 2003;102:1435–1442.[PubMed: 12714512]
Hideshima T, Mitsiades C, Tonon G, Richardson PG, Anderson KC. Understanding multiple myelomapathogenesis in the bone marrow to identify new therapeutic targets. Nat Rev Cancer 2007;7:585–598. [PubMed: 17646864]
Jaye DL, Geigerman CM, Herling M, Eastburn K, Waller EK, Jones D. Expression of the plasmacytoiddendritic cell marker BDCA-2 supports a spectrum of maturation among CD4+ CD56+hematodermic neoplasms. Mod Pathol 2006;19:1555–1562. [PubMed: 16998465]
Jego G, Palucka AK, Blanck JP, Chalouni C, Pascual V, Banchereau J. Plasmacytoid dendritic cellsinduce plasma cell differentiation through type I interferon and interleukin 6. Immunity 2003;19:225–234. [PubMed: 12932356]
Krieg AM. TLR9 and DNA ‘feel’ RAGE. Nat Immunol 2007;8:475–477. [PubMed: 17440455]Kukreja A, Hutchinson A, Dhodapkar K, Mazumder A, Vesole D, Angitapalli R, Jagannath S, Dhodapkar
MV. Enhancement of clonogenicity of human multiple myeloma by dendritic cells. J Exp Med2006;203:1859–1865. [PubMed: 16880256]
Kukreja A, Hutchinson A, Mazumder A, Vesole D, Angitapalli R, Jagannath S, O’Connor O A,Dhodapkar MV. Bortezomib disrupts tumour-dendritic cell interactions in myeloma and lymphoma:therapeutic implications. Br J Haematol 2007;136:106–110. [PubMed: 17222199]
Kumar SK, Rajkumar SV, Dispenzieri A, Lacy MQ, Hayman SR, Buadi FK, Zeldenrust SR, Dingli D,Russell SJ, Lust JA, et al. Improved survival in multiple myeloma and the impact of novel therapies.Blood 2008;111:2516–2520. [PubMed: 17975015]
Lee JW, Chung HY, Ehrlich LA, Jelinek DF, Callander NS, Roodman GD, Choi SJ. IL-3 expression bymyeloma cells increases both osteoclast formation and growth of myeloma cells. Blood2004;103:2308–2315. [PubMed: 14615378]
Liu C, Lou Y, Lizee G, Qin H, Liu S, Rabinovich B, Kim GJ, Wang YH, Ye Y, Sikora AG, et al.Plasmacytoid dendritic cells induce NK cell-dependent, tumor antigen-specific T cell cross-primingand tumor regression in mice. J Clin Invest 2008;118:1165–1175. [PubMed: 18259609]
Liu YJ. IPC: professional type 1 interferon-producing cells and plasmacytoid dendritic cell precursors.Annu Rev Immunol 2005;23:275–306. [PubMed: 15771572]
MacLennan I, Vinuesa C. Dendritic cells, BAFF, and APRIL: innate players in adaptive antibodyresponses. Immunity 2002;17:235–238. [PubMed: 12354377]
Manches O, Munn D, Fallahi A, Lifson J, Chaperot L, Plumas J, Bhardwaj N. HIV-activated humanplasmacytoid DCs induce Tregs through an indoleamine 2,3-dioxygenase-dependent mechanism. JClin Invest 2008;118:3431–3439. [PubMed: 18776940]
McKenna K, Beignon AS, Bhardwaj N. Plasmacytoid dendritic cells: linking innate and adaptiveimmunity. J Virol 2005;79:17–27. [PubMed: 15596797]
Chauhan et al. Page 12
Cancer Cell. Author manuscript; available in PMC 2010 October 6.
NIH
-PA Author Manuscript
NIH
-PA Author Manuscript
NIH
-PA Author Manuscript

Moseman EA, Liang X, Dawson AJ, Panoskaltsis-Mortari A, Krieg AM, Liu YJ, Blazar BR, Chen W.Human plasmacytoid dendritic cells activated by CpG oligodeoxynucleotides induce the generationof CD4+CD25+ regulatory T cells. J Immunol 2004;173:4433–4442. [PubMed: 15383574]
Neri P, Kumar S, Fulciniti MT, Vallet S, Chhetri S, Mukherjee S, Tai Y, Chauhan D, Tassone P, VenutaS, et al. Neutralizing B-cell activating factor antibody improves survival and inhibitsosteoclastogenesis in a severe combined immunodeficient human multiple myeloma model. ClinCancer Res 2007;13:5903–5909. [PubMed: 17908986]
O’Doherty U, Peng M, Gezelter S, Swiggard WJ, Betjes M, Bhardwaj N, Steinman RM. Human bloodcontains two subsets of dendritic cells, one immunologically mature and the other immature.Immunology 1994;82:487–493. [PubMed: 7525461]
Oerlemans R, Franke NE, Assaraf YG, Cloos J, van Zantwijk I, Berkers CR, Scheffer GL, DebipersadK, Vojtekova K, Lemos C, et al. Molecular basis of bortezomib resistance: proteasome subunit beta5(PSMB5) gene mutation and overexpression of PSMB5 protein. Blood 2008;112:2489–2499.[PubMed: 18565852]
Poeck H, Wagner M, Battiany J, Rothenfusser S, Wellisch D, Hornung V, Jahrsdorfer B, Giese T, EndresS, Hartmann G. Plasmacytoid dendritic cells, antigen, and CpG-C license human B cells for plasmacell differentiation and immunoglobulin production in the absence of T-cell help. Blood2004;103:3058–3064. [PubMed: 15070685]
Prabhala RH, Neri P, Bae JE, Tassone P, Shammas MA, Allam CK, Daley JF, Chauhan D, Blanchard E,Thatte HS, et al. Dysfunctional T regulatory cells in multiple myeloma. Blood 2006;107:301–304.[PubMed: 16150935]
Ratta M, Fagnoni F, Curti A, Vescovini R, Sansoni P, Oliviero B, Fogli M, Ferri E, Della Cuna GR, TuraS, et al. Dendritic cells are functionally defective in multiple myeloma: the role of interleukin-6.Blood 2002;100:230–237. [PubMed: 12070032]
Ribatti D, Nico B, Vacca A. Importance of the bone marrow microenvironment in inducing the angiogenicresponse in multiple myeloma. Oncogene 2006;25:4257–4266. [PubMed: 16518413]
Roodman GD. Novel targets for myeloma bone disease. Expert Opin Ther Targets 2008;12:1377–1387.[PubMed: 18851694]
Roodman GD, Dougall WC. RANK ligand as a therapeutic target for bone metastases and multiplemyeloma. Cancer Treat Rev 2008;34:92–101. [PubMed: 17964729]
Siegal FP, Kadowaki N, Shodell M, Fitzgerald-Bocarsly PA, Shah K, Ho S, Antonenko S, Liu YJ. Thenature of the principal type 1 interferon-producing cells in human blood. Science 1999;284:1835–1837. [PubMed: 10364556]
Singh AV, Franke AA, Blackburn GL, Zhou JR. Soy phytochemicals prevent orthotopic growth andmetastasis of bladder cancer in mice by alterations of cancer cell proliferation and apoptosis andtumor angiogenesis. Cancer Res 2006;66:1851–1858. [PubMed: 16452247]
Steinman RM, Cohn ZA. Identification of a novel cell type in peripheral lymphoid organs of mice. I.Morphology, quantitation, tissue distribution. J Exp Med 1973;137:1142–1162. [PubMed: 4573839]
Tabera S, Perez-Simon JA, Diez-Campelo M, Sanchez-Abarca LI, Blanco B, Lopez A, Benito A, OcioE, Sanchez-Guijo FM, Canizo C, San Miguel JF. The effect of mesenchymal stem cells on theviability, proliferation and differentiation of B-lymphocytes. Haematologica 2008;93:1301–1309.[PubMed: 18641017]
Tassone P, Neri P, Carrasco DR, Burger R, Goldmacher VS, Fram R, Munshi V, Shammas MA, CatleyL, Jacob GS, et al. A clinically relevant SCID-hu in vivo model of human multiple myeloma. Blood2005;106:713–716. [PubMed: 15817674]
Vollmer J. Progress in drug development of immunostimulatory CpG oligodeoxynucleotide ligands forTLR9. Expert Opin Biol Ther 2005;5:673–682. [PubMed: 15934842]
Zou W. Immunosuppressive networks in the tumour environment and their therapeutic relevance. NatRev Cancer 2005;5:263–274. [PubMed: 15776005]
Zou W, Machelon V, Coulomb-L’Hermin A, Borvak J, Nome F, Isaeva T, Wei S, Krzysiek R, Durand-Gasselin I, Gordon A, et al. Stromal-derived factor-1 in human tumors recruits and alters the functionof plasmacytoid precursor dendritic cells. Nat Med 2001;7:1339–1346. [PubMed: 11726975]
Chauhan et al. Page 13
Cancer Cell. Author manuscript; available in PMC 2010 October 6.
NIH
-PA Author Manuscript
NIH
-PA Author Manuscript
NIH
-PA Author Manuscript

Figure 1. Distribution and frequency of pDCs(A) Total MNCs were subjected to BDCA-4 positive selection using two step purification, andthen labeled with CD123 PE-Cy5, HLA-DR Pacific Blue, BDCA-2 FITC, CD14-PE, CD20PE, CD11c and CD3 APC antibodies. Lin-, and CD11c- (90%) cells were gated and FACSsorted. Analysis of this cell population showed 99% BDCA-2+, 98% HLA-DR+, and 98%CD123+ cells. (B) DNA synthesis in allogeneic T cells stimulated by pDCs from healthy donorsand MM patients (mean ± SD; n=4). (C) IHC analysis on normal donor BM and MM patientBM biopsies was performed using BDCA-2 Ab. Arrows indicate brown BDCA-2-positivepDCs. Micrographs are representative from 10 MM patients and 5 normal donors. Scale bars,10 μM. (D) Quantification of BDCA-2-positive pDCs in MM BM vs. normal BM from C. ThepDC frequency was quantified by selecting 5 random independent high power (X40)microscopic fields for each tissue sample. (E) Quantification of pDCs from normal donors PBand BM vs. MM patient PB and BM by FACS using BDCA-2-PE conjugated Ab. Upper panel:Data shown is derived from analysis of 32 MM patients and 8 normal donors. Lower panel: Arepresentative FACS analysis showing higher percentage of BDCA-2-positive pDCs in MMBM vs. normal BM. (F) Upper panel: Quantification of pDCs from matched paired samples of8 MM patient PB and BM by FACS using BDCA-2 Ab. Lower panel: A representative FACSanalysis from 8 patients analyzed is shown. Error bars indicate standard deviation (SD).
Chauhan et al. Page 14
Cancer Cell. Author manuscript; available in PMC 2010 October 6.
NIH
-PA Author Manuscript
NIH
-PA Author Manuscript
NIH
-PA Author Manuscript

Figure 2. pDCs induce MM cell growth(A) MM.1S cells (5 × 10⁴ cells/200 μL) and pDCs (1 × 10⁴ cells/200 μL) were cultured eitheralone or together for indicated intervals; and then analyzed for DNA synthesis using 3H-TdRuptake (mean ± SD; n=3). (B) GFP+ MM.1S cells were cultured either alone or with pDCs for3 days; GFP+ MM.1S cells were counted under fluorescent microscope (mean ± SD; n=2).(Inset: micrograph from the experiment; Scale bars, 40 μM). (C) MM.1S cells were culturedalone or together with either irradiated or non-irradiated pDCs for indicated intervals, andanalyzed for growth (mean ± SD; n=2). (D) MM.1S cells were plated with or without pDCs.The numbers of tumor colonies were enumerated using microscopy after incubation for 10–14 days (mean ± SD; n=2). (E) MM.1S cells and pDCs were cultured as in “A” for 72h andanalyzed for growth by WST assays (mean ± SD; n=3). (F) MM.1S cells (2.5 × 10⁶) and pDCs(0.5 × 10⁶) were cultured as in “A”; MM.1S cells were separated from pDC co-cultures usingCD138 microbeads and analyzed for ERK activation by immunoblotting. (G) MM.1S cells,pDCs, mDCs or MM patient-BMSCs were cultured either alone or together at 1:5 (pDC/MM,mDC/MM or BMSC/MM) ratio for 3 days, and DNA synthesis was measured using 3H-TdR
Chauhan et al. Page 15
Cancer Cell. Author manuscript; available in PMC 2010 October 6.
NIH
-PA Author Manuscript
NIH
-PA Author Manuscript
NIH
-PA Author Manuscript

uptake (mean ± SD; n=3). (H) pDC-depleted MM BM cells vs. purified MM BM pDCs wereexamined for their stimulatory effect on MM.1S cell growth (mean ± SD; n=2). (I) MM celllines were cultured either alone or together with pDCs for 3 days, and analyzed for DNAsynthesis by 3H-TdR uptake assay. Data is presented as fold change in DNA synthesis in thepresence vs. absence of pDCs (mean ± SD; P < 0.05; n=3). Normal PB pDCs were utilized inexperiments shown in A-I. Co-cultures of pDCs and MM cells were performed using 1:5 (pDC/MM) ratio. Growth assays were performed using 1 × 10⁴ pDCs and 5 × 10⁴ MM cells in 200microliters of media in 96 well plates. Error bars indicate standard deviation (SD).
Chauhan et al. Page 16
Cancer Cell. Author manuscript; available in PMC 2010 October 6.
NIH
-PA Author Manuscript
NIH
-PA Author Manuscript
NIH
-PA Author Manuscript

Figure 3. Effect of pDCs on patient MM cells(A) Purified patient MM cells and normal BM plasma cells from healthy donors were culturedwith or without pDCs for 3 days, and DNA synthesis was measured by 3H-TdR uptake (mean± SD of triplicate cultures; P < 0.05 for all samples; pDC/MM ratios: Pt#1–3 at 1:5; pt#4 at1:2 and pt#5 at 1:3). (B) MM.1S cells were cultured as in Fig 2A with or without patient BMpDCs for 3 days, and analyzed for growth by 3H-TdR uptake (mean ± SD of triplicate cultures;P < 0.005 for all samples). (C) Patient MM cells were cultured with or without autologous BMpDCs for 3 days, and DNA synthesis was measured by 3H-TdR uptake (mean ± SD of triplicatecultures; P < 0.004 for all samples; pDC/MM ratio: Pt#1–4 at 1:5). Data (B and C) is presentedas fold change in DNA synthesis in the presence vs. absence of patient BM pDCs. (D) Normal
Chauhan et al. Page 17
Cancer Cell. Author manuscript; available in PMC 2010 October 6.
NIH
-PA Author Manuscript
NIH
-PA Author Manuscript
NIH
-PA Author Manuscript

PB pDCs and patient MM cells were co-cultured in DCP-MM medium at 1:5 (pDC/MM) ratiofor 3 weeks, and viable cells were quantified by trypan blue exclusion assay. Data is presentedas percent increase in survival of tumor cells in the presence vs. absence of pDCs (mean ± SDof duplicate cultures; P < 0.05). (E) Normal PB pDCs and patient MM cells were co-culturedas in D for 4 weeks and then stained with CD138-FITC Ab, CD123-PE Ab, kappa/lamda Aband DAPI. Micrograph shown is representative of 5 experiments with similar results. Scalebars, 20 M (left three panels) and 10 M (right, upper and lower panels). Error bars indicatestandard deviation (SD).
Chauhan et al. Page 18
Cancer Cell. Author manuscript; available in PMC 2010 October 6.
NIH
-PA Author Manuscript
NIH
-PA Author Manuscript
NIH
-PA Author Manuscript
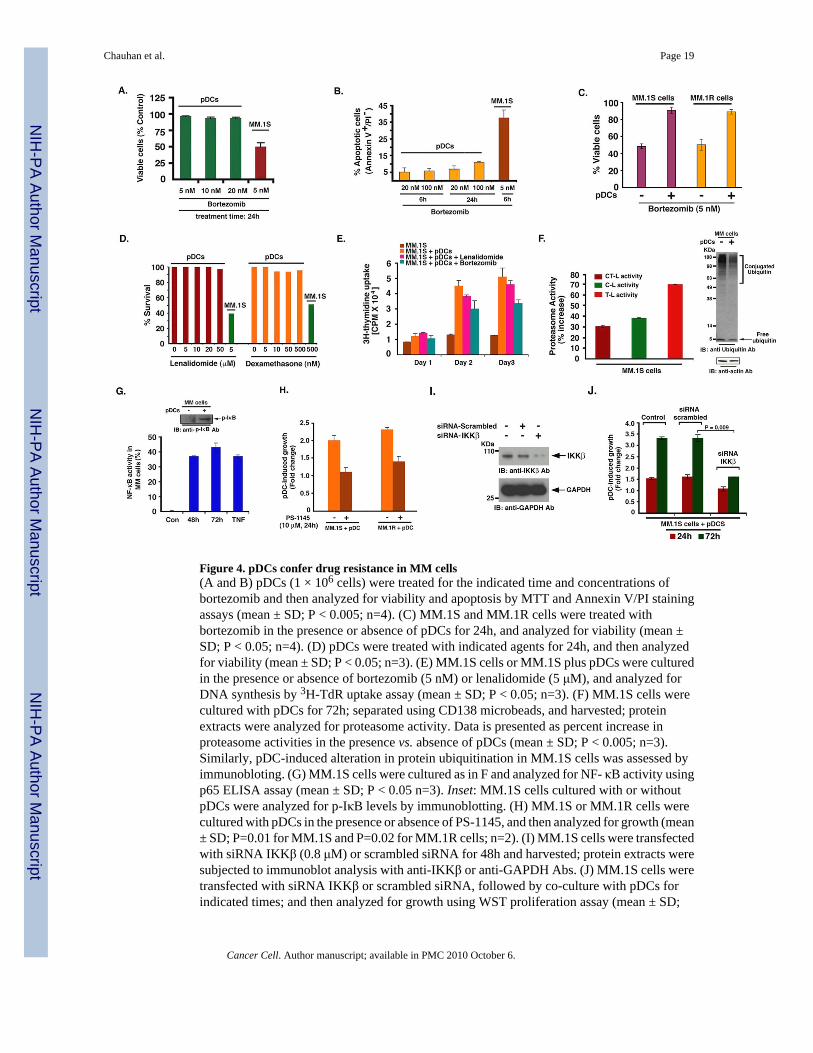
Figure 4. pDCs confer drug resistance in MM cells(A and B) pDCs (1 × 10⁶ cells) were treated for the indicated time and concentrations ofbortezomib and then analyzed for viability and apoptosis by MTT and Annexin V/PI stainingassays (mean ± SD; P < 0.005; n=4). (C) MM.1S and MM.1R cells were treated withbortezomib in the presence or absence of pDCs for 24h, and analyzed for viability (mean ±SD; P < 0.05; n=4). (D) pDCs were treated with indicated agents for 24h, and then analyzedfor viability (mean ± SD; P < 0.05; n=3). (E) MM.1S cells or MM.1S plus pDCs were culturedin the presence or absence of bortezomib (5 nM) or lenalidomide (5 μM), and analyzed forDNA synthesis by 3H-TdR uptake assay (mean ± SD; P < 0.05; n=3). (F) MM.1S cells werecultured with pDCs for 72h; separated using CD138 microbeads, and harvested; proteinextracts were analyzed for proteasome activity. Data is presented as percent increase inproteasome activities in the presence vs. absence of pDCs (mean ± SD; P < 0.005; n=3).Similarly, pDC-induced alteration in protein ubiquitination in MM.1S cells was assessed byimmunobloting. (G) MM.1S cells were cultured as in F and analyzed for NF- κB activity usingp65 ELISA assay (mean ± SD; P < 0.05 n=3). Inset: MM.1S cells cultured with or withoutpDCs were analyzed for p-IκB levels by immunoblotting. (H) MM.1S or MM.1R cells werecultured with pDCs in the presence or absence of PS-1145, and then analyzed for growth (mean± SD; P=0.01 for MM.1S and P=0.02 for MM.1R cells; n=2). (I) MM.1S cells were transfectedwith siRNA IKKβ (0.8 μM) or scrambled siRNA for 48h and harvested; protein extracts weresubjected to immunoblot analysis with anti-IKKβ or anti-GAPDH Abs. (J) MM.1S cells weretransfected with siRNA IKKβ or scrambled siRNA, followed by co-culture with pDCs forindicated times; and then analyzed for growth using WST proliferation assay (mean ± SD;
Chauhan et al. Page 19
Cancer Cell. Author manuscript; available in PMC 2010 October 6.
NIH
-PA Author Manuscript
NIH
-PA Author Manuscript
NIH
-PA Author Manuscript

n=2). Normal PB pDCs were utilized in experiments shown in A–J at 1:5 pDC/MM ratio.Culture medium is described in methods. Error bars indicate standard deviation.
Chauhan et al. Page 20
Cancer Cell. Author manuscript; available in PMC 2010 October 6.
NIH
-PA Author Manuscript
NIH
-PA Author Manuscript
NIH
-PA Author Manuscript

Figure 5. Chemotaxis/migration of MM cells and role of soluble factors in pDC-MM interactions(A) Representative examples of frames from time-lapse imaging of pDC-MM co-culture areshown to demonstrate chemotactic activity between pDCs and MM cells, as evidenced byformation of filopodia (yellow arrowheads). Images were taken for 30 ms interval for 5–15mins. Video is available in supplementary file as movie S1. (B) Migration assays: MM.1S cellswere seeded in the upper compartment; the lower chamber contained medium alone, pDCs,MM.1S cells, supernatants from pDCs, supernatants from MM.1S cells or supernatants from3-day co-cultures of pDCs and MM.1S cells. The migrated cells were quantified and presentedas bar graph (mean ± SD; P < 0.005; n=2). Micrographs shows crystal violet staining ofmigrated cells. Scale bars, 40 μM. (C-E) MM.1S cells were cultured with pDCs for 72h asdescribed in methods; supernatants were collected and subjected to cytokine bead arrays (mean± SD; n=4). (F) MM.1S cells were cultured with or without pDCs for 72h; supernatants wereanalyzed for IL-3 and SDF-1α levels using ELISA (mean ± SD; P = 0.05 for both IL-3 andSDF- 1α; n=5). (G) MM.1S, INA-6 (with rhIL6 2.5 ng/ml), and MM.1R cell lines were culturedwith pDCs in the presence or absence of anti-IL-3 Ab (10 ng/ml) for 72h, and analyzed forgrowth by WST proliferation assays (mean ± SD; P < 0.005; n=3). (H) MM.1S cells werecultured with pDCs in the presence or absence of anti-SDF- 1α (100 ng/ml) or AMD3100 (10μM), and analyzed for growth by WST proliferation assay (mean ± SD; P < 0.005; n=3). (I)Transwell insert assays showing migration of pDCs towards chemokines (described inmethods). The indicated chemokines were added to the lower chamber of transwells, and pDcswere allowed to migrate through 5 μM pore-size filters for 2h. Migrated cells were quantifiedin the fluid phase of the lower chamber (mean ± S.D; n=3). Normal PB pDCs were utilized in
Chauhan et al. Page 21
Cancer Cell. Author manuscript; available in PMC 2010 October 6.
NIH
-PA Author Manuscript
NIH
-PA Author Manuscript
NIH
-PA Author Manuscript

experiments shown in A–I and cultures were at 1:5 (pDC/MM) ratio. Error bars indicatestandard deviation (SD).
Chauhan et al. Page 22
Cancer Cell. Author manuscript; available in PMC 2010 October 6.
NIH
-PA Author Manuscript
NIH
-PA Author Manuscript
NIH
-PA Author Manuscript

Figure 6. Requirement of pDC contact with MM cells(A) Transwell insert assay: Two different pore size membranes were utilized to separate cells:0.4 μM (does not allow free passage of cells) and 8 μM (allows cell passage). Normal PB pDC(2×10⁴) and MM.1S cells (1 × 10⁵) were added into the upper and lower chamber, respectively;and incubated for 72h at 37°C; cells from the lower chamber were then harvested and analyzedfor growth by WST assays (mean ± SD; P=0.001; n=3). (B) Analysis of MM patient BMbiopsies (MM #1-MM #4) to show in vivo cell-cell contact between MM BM pDCs with tumorcells. MM patients BM biopsies were subjected to IFC staining for MM cells (CD138 Ab, red)and pDCs (BDCA-2 Ab, green). Nuclear staining was performed with DAPI (blue). Slideswere mounted using Vectashield with DAPI. Data shown is representative of 10 MM BMsamples analyzed with similar results. Scale bars, 10 μM (MM Pt#1–4). Yellow squarerepresents the 3X zoom areas (Scale bars, 5 μM in upper panel and 10 μM in lower panel). (C)BAFF levels were analyzed in serum obtained from 5 normal and 5 MM patients using ELISA.(D) MM.1S cells were cultured either alone or together with normal PB pDCs at 1:5 (pDC/MM) ratio in the presence or absence of BAFF inhibitor at the indicated concentrations for72h, and then analyzed for growth (mean ± SD; P < 0.005; n=3). (E) MM.1S cells were culturedwith normal PB pDCs at 1:5 pDC/MM ratio in the presence or absence of rhOPG (0.5 μg/ml),TACI-Fc (1 μg/ml) or CD28-Fc (1 μg/ml) for 24h, and then analyzed for proliferation (mean± SD; P < 0.005; n=2). Data is presented as percent growth inhibition in pDC-induced MM.1S cell growth in the presence of agents. Error bars indicate standard deviation (SD).
Chauhan et al. Page 23
Cancer Cell. Author manuscript; available in PMC 2010 October 6.
NIH
-PA Author Manuscript
NIH
-PA Author Manuscript
NIH
-PA Author Manuscript

Figure 7. pDCs enhance growth of xenografted human MM cells in mice(A and B) INA-6 MM cells alone (2 × 10⁶ cells without IL-6), or together with pDCs (0.4 ×10⁶ cells) at 1:5 (pDC/MM) ratio were injected directly into the human fetal bone implant inSCID-hu mice, and mouse sera samples were analyzed for human sIL-6R and Ig by ELISA(mean ± SD; P < 0.05; n=2). C. Human bone chips were removed from mice 30 days afterinjection with pDCs and INA-6 cells and immunostained with anti-BDCA-2 and anti-IL-3 Abs.Scale bar, 5 μM. (D–H) Bone sections were immunostained with Abs against Ki-67, CyclinD1, phospho-IκB, ubiquitin, and Factor VIII, and VEGFR1. Dark brown: marker-positive cellsin all cases. Micrographs are representative of bone sections from two different mice in eachgroup. (E and G) Quantification of Ki-67, Cyclin-D1 and Factor VIII-positive cells fromexperiments in D, and H (upper panel). (I) MM.1S cells alone (2.5 × 10⁶) or together withpDCs (0.5 × 10⁶) (1:5 (pDC/MM) ratio) were implanted subcutaneously in mice; tumor volumewas monitored every 3rd day (P < 0.05). Inset: Tumors from mice with either MM.1S or MM.1S cells + pDC. Error bars indicate standard deviation (SD).
Chauhan et al. Page 24
Cancer Cell. Author manuscript; available in PMC 2010 October 6.
NIH
-PA Author Manuscript
NIH
-PA Author Manuscript
NIH
-PA Author Manuscript
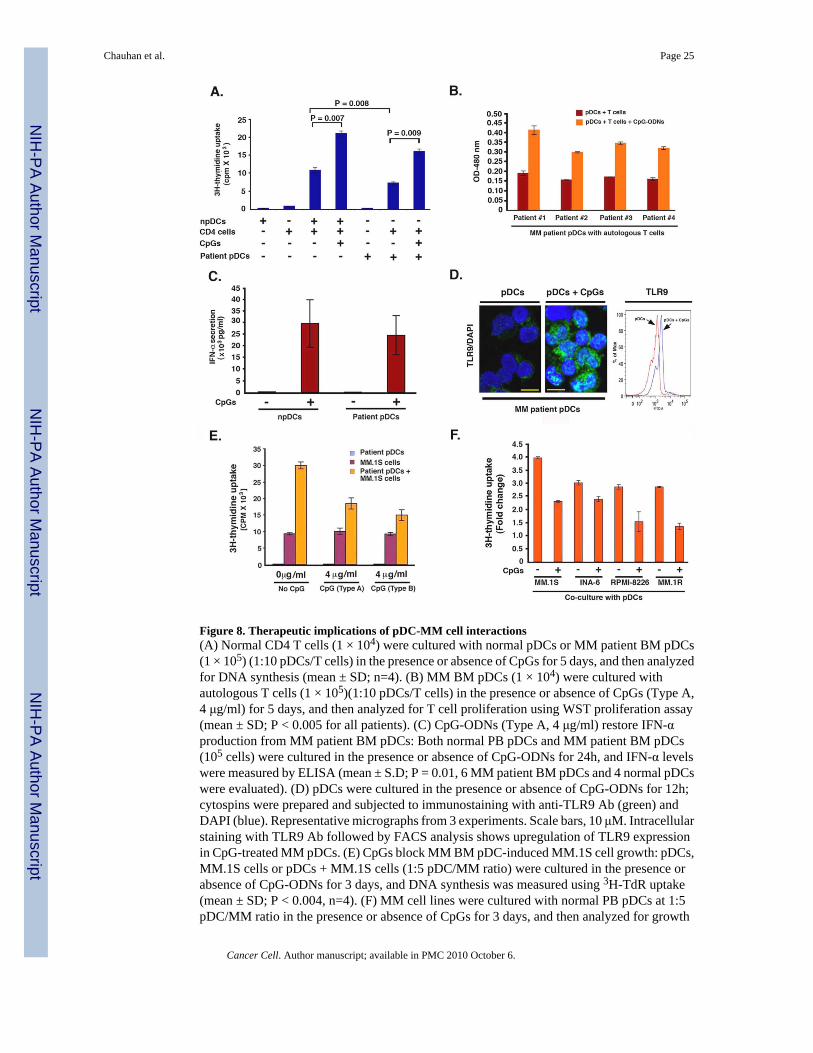
Figure 8. Therapeutic implications of pDC-MM cell interactions(A) Normal CD4 T cells (1 × 10⁴) were cultured with normal pDCs or MM patient BM pDCs(1 × 10⁵) (1:10 pDCs/T cells) in the presence or absence of CpGs for 5 days, and then analyzedfor DNA synthesis (mean ± SD; n=4). (B) MM BM pDCs (1 × 10⁴) were cultured withautologous T cells (1 × 10⁵)(1:10 pDCs/T cells) in the presence or absence of CpGs (Type A,4 μg/ml) for 5 days, and then analyzed for T cell proliferation using WST proliferation assay(mean ± SD; P < 0.005 for all patients). (C) CpG-ODNs (Type A, 4 μg/ml) restore IFN-αproduction from MM patient BM pDCs: Both normal PB pDCs and MM patient BM pDCs(105 cells) were cultured in the presence or absence of CpG-ODNs for 24h, and IFN-α levelswere measured by ELISA (mean ± S.D; P = 0.01, 6 MM patient BM pDCs and 4 normal pDCswere evaluated). (D) pDCs were cultured in the presence or absence of CpG-ODNs for 12h;cytospins were prepared and subjected to immunostaining with anti-TLR9 Ab (green) andDAPI (blue). Representative micrographs from 3 experiments. Scale bars, 10 μM. Intracellularstaining with TLR9 Ab followed by FACS analysis shows upregulation of TLR9 expressionin CpG-treated MM pDCs. (E) CpGs block MM BM pDC-induced MM.1S cell growth: pDCs,MM.1S cells or pDCs + MM.1S cells (1:5 pDC/MM ratio) were cultured in the presence orabsence of CpG-ODNs for 3 days, and DNA synthesis was measured using 3H-TdR uptake(mean ± SD; P < 0.004, n=4). (F) MM cell lines were cultured with normal PB pDCs at 1:5pDC/MM ratio in the presence or absence of CpGs for 3 days, and then analyzed for growth
Chauhan et al. Page 25
Cancer Cell. Author manuscript; available in PMC 2010 October 6.
NIH
-PA Author Manuscript
NIH
-PA Author Manuscript
NIH
-PA Author Manuscript

by WST proliferation assay (mean ± SD; P < 0.005, n=4). Errors bars indicate standarddeviation (SD).
Chauhan et al. Page 26
Cancer Cell. Author manuscript; available in PMC 2010 October 6.
NIH
-PA Author Manuscript
NIH
-PA Author Manuscript
NIH
-PA Author Manuscript