Distinct transcriptional profiles characterize bone microenvironment mesenchymal cells rather than...
13
Distinct transcriptional profiles characterize bone microenvironment mesenchymal cells rather than osteoblasts in relationship with multiple myeloma bone disease Katia Todoerti a , Gina Lisignoli b , Paola Storti c , Luca Agnelli a , Francesca Novara d , Cristina Manferdini b , Katia Codeluppi b , Simona Colla c , Monica Crugnola c , Manuela Abeltino c , Marina Bolzoni c , Valentina Sgobba c , Andrea Facchini b , Giorgio Lambertenghi-Deliliers a , Orsetta Zuffardi d , Vittorio Rizzoli c , Antonino Neri a , and Nicola Giuliani c a Dipartimento di Scienze Mediche, Universita ` di Milano e U.O. Ematologia 1, Fondazione IRCCS Policlinico, Milan, Italy; b Laboratorio di Immunologia e Genetica, Istituti Ortopedici Rizzoli, Bologna, Italy; c Ematologia e Centro Trapianti Midollo Osseo, Dipartimento di Medicina Interna e Scienze Biomediche, Azienda Ospedaliero-Universitaria, Parma, Italy; d Dipartimento di Patologia Umana ed Ereditaria, Sezione Biologia generale e Genetica Medica, University of Pavia, Pavia, Italy (Received 18 August 2009; revised 5 November 2009; accepted 24 November 2009) Objective. Multiple myeloma (MM) is characterized by a high incidence of osteolytic bone lesions, which have been previously correlated with the gene expression profiles of MM cells. The aim of this study was to investigate the transcriptional patterns of cells in the bone micro- environment and their relationships with the presence of osteolysis in MM patients. Materials and Methods. Both mesenchymal (MSC) and osteoblastic (OB) cells were isolated directly from bone biopsies of MM patients and controls to perform gene expression profiling by microarrays and real-time polymerase chain reaction on selected bone-related genes. Results. We identified a series of upregulated and downregulated genes that were differen- tially expressed in the MSC cells of osteolytic and nonosteolytic patients. Comparison of the osteolytic and nonosteolytic samples also showed that the MSC cells and OB had distinct transcriptional patterns. No significantly modulated genes were found in the OBs of the osteo- lytic and nonosteolytic patients. Conclusions. Our data suggest that the gene expression profiles of cells of the bone microen- vironment are different in MM patients and controls, and that MSC cells, but not OBs, have a distinct transcriptional pattern associated with the occurrence of bone lesions in MM patients. These data support the idea that alterations in MSC cells may be involved in MM bone disease. Ó 2010 ISEH - Society for Hematology and Stem Cells. Published by Elsevier Inc. Bone lesions are a hallmark of multiple myeloma (MM) [1]. Growing evidence indicates that relationships between MM cells and the bone marrow (BM) microenvironment are critically involved in development of bone lesions in MM patients. Together with the osteoclast activation mainly due to MM-induced RANKL upregulation in the bone microenvironment, these bone lesions are character- ized by osteoblast (OB) suppression [2–4]. OB formation is impaired in MM patients [4,5], at least partially because the activity of the Runx2 transcription factor is blocked in mesenchymal (MSC)/osteoprogenitor cells, thus inhibit- ing their osteoblastogenic properties [5]. It has also been shown that OBs may inhibit MM cell growth and survival [6]. Gene expression profiling studies of MM plasma cells have been performed in order to identify the factors produced by tumor cells that may correlate with the pres- ence of bone lesions in MM patients [7,8]. These studies have shown that overexpression of Wnt signaling inhibitors, Offprint requests to: Nicola Giuliani, M.D., Ph.D., Department of Internal Medicine and Biomedical Science, University of Parma, Via Gramsci 14, Parma 43100, Italy; E-mail: [email protected] Supplementary data associated with this article can be found in the online version, at doi:10.1016/j.exphem.2009.11.009. 0301-472X/10 $–see front matter. Copyright Ó 2010 ISEH - Society for Hematology and Stem Cells. Published by Elsevier Inc. doi: 10.1016/j.exphem.2009.11.009 Experimental Hematology 2010;38:141–153
-
Upload
independent -
Category
Documents
-
view
1 -
download
0
Transcript of Distinct transcriptional profiles characterize bone microenvironment mesenchymal cells rather than...

Distinct transcriptional profilescharacterize bone microenvironment mesenchymal cells
rather than osteoblasts in relationship with multiple myeloma bone disease
Katia Todoertia, Gina Lisignolib,Paola Stortic, Luca Agnellia, Francesca Novarad, Cristina Manferdinib, Katia Codeluppib,
Simona Collac, Monica Crugnolac, Manuela Abeltinoc, Marina Bolzonic, Valentina Sgobbac,Andrea Facchinib, Giorgio Lambertenghi-Deliliersa, Orsetta Zuffardid, Vittorio Rizzolic,
Antonino Neria, and Nicola Giulianic
aDipartimento di Scienze Mediche, Universita di Milano e U.O. Ematologia 1, Fondazione
IRCCS Policlinico, Milan, Italy; bLaboratorio di Immunologia e Genetica, Istituti Ortopedici Rizzoli, Bologna, Italy; cEmatologia
e Centro Trapianti Midollo Osseo, Dipartimento di Medicina Interna e Scienze Biomediche, Azienda Ospedaliero-Universitaria, Parma,
Italy; dDipartimento di Patologia Umana ed Ereditaria, Sezione Biologia generale e Genetica Medica, University of Pavia, Pavia, Italy
(Received 18 August 2009; revised 5 November 2009; accepted 24 November 2009)
Objective. Multiple myeloma (MM) is characterized by a high incidence of osteolytic bonelesions, which have been previously correlated with the gene expression profiles of MM cells.The aim of this study was to investigate the transcriptional patterns of cells in the bone micro-environment and their relationships with the presence of osteolysis in MM patients.
Materials and Methods. Both mesenchymal (MSC) and osteoblastic (OB) cells were isolateddirectly from bone biopsies of MM patients and controls to perform gene expression profilingby microarrays and real-time polymerase chain reaction on selected bone-related genes.
Results. We identified a series of upregulated and downregulated genes that were differen-tially expressed in the MSC cells of osteolytic and nonosteolytic patients. Comparison ofthe osteolytic and nonosteolytic samples also showed that the MSC cells and OB had distincttranscriptional patterns. No significantly modulated genes were found in the OBs of the osteo-lytic and nonosteolytic patients.
Conclusions. Our data suggest that the gene expression profiles of cells of the bone microen-vironment are different in MM patients and controls, and that MSC cells, but not OBs, havea distinct transcriptional pattern associated with the occurrence of bone lesions in MMpatients. These data support the idea that alterations in MSC cells may be involved in MMbone disease. � 2010 ISEH - Society for Hematology and Stem Cells. Published by ElsevierInc.
Bone lesions are a hallmark of multiple myeloma (MM)[1]. Growing evidence indicates that relationships betweenMM cells and the bone marrow (BM) microenvironmentare critically involved in development of bone lesions inMM patients. Together with the osteoclast activationmainly due to MM-induced RANKL upregulation in the
bone microenvironment, these bone lesions are character-ized by osteoblast (OB) suppression [2–4]. OB formationis impaired in MM patients [4,5], at least partially becausethe activity of the Runx2 transcription factor is blockedin mesenchymal (MSC)/osteoprogenitor cells, thus inhibit-ing their osteoblastogenic properties [5]. It has alsobeen shown that OBs may inhibit MM cell growth andsurvival [6].
Gene expression profiling studies of MM plasma cellshave been performed in order to identify the factorsproduced by tumor cells that may correlate with the pres-ence of bone lesions in MM patients [7,8]. These studieshave shown that overexpression of Wnt signaling inhibitors,
Offprint requests to: Nicola Giuliani, M.D., Ph.D., Department of
Internal Medicine and Biomedical Science, University of Parma, Via
Gramsci 14, Parma 43100, Italy; E-mail: [email protected]
Supplementary data associated with this article can be found in the
online version, at doi:10.1016/j.exphem.2009.11.009.
0301-472X/10 $–see front matter. Copyright � 2010 ISEH - Society for Hematology and Stem Cells. Published by Elsevier Inc.
doi: 10.1016/j.exphem.2009.11.009
Experimental Hematology 2010;38:141–153

such as DKK-1, correlates with the presence of osteolysis[8], suggesting the involvement of Wnt signaling in MM-induced osteoblast suppression. This hypothesis has beenconfirmed by the capacity of an anti�DKK-1 antibody toimprove bone formation and block MM-induced bonedestruction in a mouse model [9].
Some authors [10], but not others [11,12], have foundthat the osteogenic capacity of BMMSC cells is impairedin MM patients, and that the same cells also have alteredgene expression profiles [10]. However, there are no pub-lished data concerning bone lesion-related alterations inthe gene expression patterns of cells in the bone microenvi-ronment. The aim of this study was to profile global geneexpression in isolated MSC and OB cells in a representativecohort of MM patients, and correlate their transcriptionalprofiles with the occurrence of bone lesions.
Materials and Methods
Patients and samplesWe studied 24 consecutive MM patients (9 with and 15 withoutosteolytic bone lesions as revealed by whole-body x-ray scans atthe time of diagnosis), 10 patients with monoclonal gammmop-athy of uncertain significance (MGUS) patients, and 8 healthysubjects (N) who had undergone orthopedic surgery. All of thestudy subjects gave their written informed consent as laid downin the Declaration of Helsinki and by our local Ethics Committee.
Isolation of MSC cellsMSC cells were directly isolated from bone biopsies obtainedfrom all subjects using an adapted version of a method describedpreviously [13,14]. Briefly, the bioptic samples were collected ina V-shaped glass tube and extensively minced using surgical scis-sors. The supernatants were collected, and MSC cells isolatedusing a Ficoll-Hypaque density gradient (Pharmacia Biotech, Up-psala, Sweden). After 1 week, the nonadherent cells were removedand adherent cells were analyzed for their transcriptional profile atthe time of the first passage (p1). Further passages (p2�p4) wereobtained to evaluate the proliferation rate and the presence ofpotential genetic alterations of the MSCs.
Isolation of OBsOBs were isolated from the minced bone chips at the bottom ofa V-shaped glass tube as described previously [13,14]. Theywere not differentiated in vitro from the MSC cells in order toavoid the potential effects of osteogenic differentiation on theirgene expression profiles. The chips were digested using 1 mg/mL collagenase P (Boehringher Mannheim Corporation, Indiana-polis, IN, USA) at 37�C for 2 hours under rotation, washed, andplaced in 100� 20-mm dishes in Dulbecco’s modified Eagle’smedium/Ham’s F-12 K without calcium supplemented medium(Gibco, Invitrogen, Scotland, UK), and then fed with completemedium twice a week. After 2 weeks, they were removed andOBs were allowed to grow until confluence and analyzed at thetime of the first passage (p1) for transcriptional analysis. Acellular pellet of OBs was also obtained at the second passage(p2), whereas OBs rarely reached further passage in culture.
Cell proliferation, population-doublinglevel (PDL), and cell viabilityCell proliferation was evaluated as described previously [14]. ThePDL of the MSCs and OBs (4� 105) was calculated from p1 to p2using the following formula: PDL 5 3.32� (log NH�log Ns),where NH is the number of harvested cells at the end of the growthperiod, and Ns the number of seeded cells. Data were expressed asPDL/day. Cell viability was checked by trypan blue dye exclusionstaining.
Molecular karyotyping of MSC and OB cellsMolecular karyotyping for the genetic characterization of MSCand OB cells was investigated through whole-genome array-comparative genomic hybridization using the 105-K platform(Agilent Technologies, Santa Clara, CA, USA) with an averageresolution of about 60 kb. Experiments were performed accordingto the Agilent’s protocol v 5.0. DNA from CD3þ or CD3� cellsisolated by immunomagnetic method (MACS; Miltenyi, BergischGladbach, Germany) or saliva of every patient was used as controlDNA in all experiments.
Flow cytometry and immunohistochemical stainingIn order to characterize the cells of the bone microenvironment andexclude the presence of contaminating hemopoietic or myelomacells at passage 1, the MSC cells and OBs were fixed in 4% parafor-maldehyde and incubated with the following monoclonal anti-bodies: anti�human-CD3, -CD14, -CD34, -CD16, -CD20, -CD45(Dako Cytomation, Glostrup, Denmark), -CD105 (producedfrom a hybridoma cell line, clone SH2, ATCC, Rockville, MD,USA), �CBFA-1 (Runx2) (R&D Systems, Minneapolis, MN,USA),�alkaline phosphatase (AP), –osteocalcin (OC),�bone sia-loprotein,�collagen type I (Col1) (DSHB, Iowa city, IA, USA), and-CD138 (Becton Dickinson, San Jose, CA, USA). Cells werewashed twice and incubated with secondary-fluorescein isothiocya-nate antibodies (Dako Cytomation) for fluorescein-activated cellsorting analysis (FACStar plus Cytometer; Becton Dickinson) orgoat anti�mouse-biotinylated antibody and AP-conjugated strepta-vidin (kit BioGenex, San Ramon, CA, USA) for immunohistochem-ical assay. The immunohistochemical staining was quantified usinga previously published score (0 5 no expression, 1 5 low expres-sion, 3 5 intermediate expression, 4 5 high expression) [15].
Gene expression profilingEighteen samples (8 MSC and 10 OB, including 6 paired samples)were obtained from 12 MM patients without bone lesions and 14samples (8 MSC and 6 OB, including 6 paired samples) from8 MM patients with more than one osteolytic bone lesion. FourMGUS (only MSC samples) and seven N subjects were alsoincluded in the gene expression analysis.
Total RNA was extracted using the TRIZOL reagent (Invitro-gen, Carlsbad, CA, USA) and purified using the RNeasy totalRNA Isolation Kit (Qiagen, Valencia, CA, USA). The biotin-labeled complementary RNA was prepared and hybridized withGeneChip Human Genome U133A Arrays (Affymetrix Inc., SantaClara, CA, USA), which were scanned (GeneChip Scanner 30007 G; Affymetrix Inc.) in accordance with manufacturer’s protocols[16]. The probe data were converted to expression values using theBioconductor function for the robust multiarray average proce-dure, as described previously [17]. Hierarchical agglomerativeclustering was used to search for natural groupings in the profiles
142 K. Todoerti et al. / Experimental Hematology 2010;38:141–153

of the genes with at least a twofold average change in expressionfrom the mean value across the whole panel using average linkageand the Pearson correlation distance metric. Supervised analyseswere made using Significant Analysis of Microarrays software,version 3.0.2 (Excel front-end publicly available at http://www.stat.stanford.edu/wtibs/SAM/index.html) [18]. The cut-off pointfor significance at a q value of 0 was determined by tuning theD parameter on the false discovery rate and controlling the q valueof the selected probes. dChip software [19] was used to representthe selected probe lists, and the Database for Annotation, Visual-ization and Integrated Discovery (DAVID) 2008 Tool (U.S.National Institutes of Health at http://david.abcc.ncifcrf.gov) andNetAffx (https://www.affymetrix.com/analysis/index.affx) wereused for the functional annotation study of the lists.
Real-time polymerase chain reaction (PCR)Real-time PCR was used to validate the microarray analysis datausing TaqMan Gene Expression Assays in accordance with protocolsof the manufacturer (Applied Biosystems, Foster City, CA, USA) asdescribed previously [20]. RANKL specific primer pair (sense:CGTTGGATCACAGCACATCAG, antisense: TGCTCCTCTTGGCCAGATCT) and 200 nM TaqMan probe (6-FAM-CAGAGAAAGCGATGGTGGATGGCTCAT-MGB) were used to evaluateRANKL messenger RNA (mRNA) levels. The PCR amplificationswere always performed in triplicate wells in an iCycler iQ Real-Time Detection System (Bio-Rad, Segrate (MI), Italy) under thefollowing conditions: 10 minutes at 95�C, followed by a total of40 cycles of 15 seconds at 94�C and 1 minute at 60�C.
TaqMan Gene Expression Assays Hs00270131_M1, Hs01911167_s1, HS00171068_M1, HS00183740_M1, HS00266491_M1, Hs00231692_M1 and HS01104728_M1 were respectivelyused for HOXB7, HOXB2, TNFRSF11B (OPG), DKK-1, decorin(DCN), Runx2 and ABL real-time PCR according to the protocolsof the manufacturer (Applied Biosystems). The comparative Ctmethod using the endogenous reference gene ABL was appliedto normalize the differences in RNA quantity and quality, andthe mRNA was quantified using the comparative 6Ct method asdescribed previously [20].
Statistical analysisData were analyzed using the conventional statistical proceduresin the standard packages for R software (http://www.r-project.org/).
Results
Biological and functional characteristicsof the MSC cells and OBs from MM patientsWe obtained bone specimens whose weight ranged from15 mg to 200 mg from healthy donors, MGUS, and MMpatients. The total number of cells obtained from bonechips at the first passage in the cohort of all patientsanalyzed varied from 50,000 to 2,800,000 for MSC (medianvalue 325,000) and from 50,000 to 850,000 for OB (medianvalue 240,000). The mean 6 standard deviation numbers ofMSC and OB normalized for bone weight are summarizedin the Figure 1A. The differences observed within thedifferent groups did not reach statistical significance. Cell
proliferation and cell doubling/day were higher in theMSC cells than the OBs, although there were no significantdifferences across the three groups (MM, MGUS, and N)(data not shown), or between the osteolytic and nonosteo-lytic patients in terms of the cell-doubling rate (Fig. 1B).Furthermore, the higher proliferative rate of MSCs ascompared to OBs was maintained during a more prolongedperiod of culture expansion, as shown for the p2 (Fig. 1B).No further passages of cell expansion were obtained forOBs, whereas we were able to expand MSCs across furtherpassages (from p2 to p4). To exclude that this could be dueto genetic alterations, we performed a whole-genome array-comparative genomic hybridization analysis of MSC andOB cells at the different passages and compared the respec-tive whole genomic profiles. Overall, our analysis indicatesthe absence of chromosomal abnormalities (data not shown).
By flow cytometry analysis, we found that the MM-MSCcells and OBs were negative for CD3, CD14, CD16, CD20,CD45, and CD138, thus indicating the absence of hemopoi-etic and MM cell contamination in both groups. All of thecells expressed CD105, AP, bone sialoprotein, and Col1,although expression of CD105 and AP was higher in theMSC cells (data not shown); OC was more expressed inthe OBs as described previously [14]. Comparison of theN, MGUS, and MM samples by flow cytometry did notreveal any significant difference in the immunophenotypeof the MSC cells and OBs among the three groups or inrelation to bone status (data not shown). On the otherhand, immunohistochemistry showed that expression ofOB transcription factor Runx2 was higher in the MSC cellsand OBs of the N and MGUS samples than in those isolatedfrom the MM patients (Fig. 1C panel i and ii). Interestingly,Runx2 expression was significantly higher in the MSC cellsand OBs of the nonosteolytic MM patients than in those ofthe patients with osteolysis (Fig. 1D). There were no signif-icant differences in the expression of the other OB markersAP, OC, bone sialoprotein, or Col1 (data not shown)
Transcriptional analysis of thenormal and pathological MSC and OB samplesAn unsupervised analysis of the dataset of 16 MM-MSCand 16 MM-OB samples was made using a conventionalhierarchical clustering algorithm. The dendrogram of the145 most variable probe sets throughout the databaseshowed two major branches that were highly specific forthe two cell types (Fig. 2A). Inclusion of the seven N-MSC, seven N-OB, and four MGUS-MSC samples gener-ated a dendogram (171 probe sets) in which the N-MSCand N-OB samples grouped together in each cell type-specific branch, and the four MGUS-MSC samples weredispersed along the main MSC branch (Fig. 2B).
We next considered each cell type-specific dataset. Thedataset of the 16 MM-MSC samples generated a dendro-gram (59 probe sets) showing preferential grouping intotwo main branches depending on the presence/absence of
143K. Todoerti et al./ Experimental Hematology 2010;38:141–153

pri
nt
&w
eb4C=F
PO
Figure 1. Cell number, proliferation rate, and immunostaining of mesenchymal (MSC) and osteoblast (OB) cells from multiple myeloma (MM) patients and
controls: relationship with osteolysis. (A) The number of both MSC and OB was quantified and normalized for the bone weight. Graphs and bars represent the
mean values 6 standard deviation (SD) of the number of MSC and OB obtained from controls (healthy [N] and monoclonal gammopathy of uncertain signif-
icance [MGUS]) and from MM patients with (MSCMMþ, OBMMþ) or without osteolysis (MSCMM, OBMM�). (B) Cell doubling/day was checked in iso-
lated MSC cells and OBs from MM patients at both first (p1) and second passage (p2). The bar graphs represent the mean values 6 SD of cell doubling/day in
the MSC and OB samples from osteolytic (MSCþ, OBþ) and nonosteolytic (MSC�, OB�) patients. (C) Runx2 immunostaining was performed in isolated
MSC cells and OB obtained from controls (N and MGUS) and from MM patients (MSCMM and OBMM). Runx2 expression was quantified using an immu-
nohistochemical score. Graphs and bars represent the mean values 6 SD of Runx2 expression in the MSC and OB samples (i). Runx2 immunostaining in OBs
and MSCs is shown for two representative MGUS and MM patients (ii). (D) Runx2 immunostaining performed in isolated MSC cells and OB obtained from
MM patients with (þ) or without (�) bone lesions.
144 K. Todoerti et al. / Experimental Hematology 2010;38:141–153

osteolysis (Fig. 2C). Six of the eight osteolytic MM-MSCcases were clustered together and showed the downregula-tion of a number of genes codifying for extracellular matrixstructural constituents (data not shown). No preferentialclustering related to the occurrence of bone lesions wasobserved in the dendrogram of the 16 MM-OB samples(93 probe sets) (Fig. 2D).
A supervised multiclass analysis comparing the N-MSC,MGUS-MSC, and MM-MSC samples identified 43 differen-tially expressed genes that distinguished the normal andpathological samples, but not the MGUS and MM samples.The molecular signature showed the modulation of genesinvolved in cell adhesion, the cell cycle, transcription regula-tion (MAF and HOX) or cell proliferation (SupplementaryFig. E1 and Supplementary Table E1, online only, availableat www.exphem.org). There was a similar transcriptional
pattern of 78 differentially expressed genes between the N-MSC and MM-MSC samples (Supplementary Fig. E2 andSupplementary Table E2, online only, available at www.exphem.org), and there were 29 specifically modulated genesin N-OB and MM-OB samples (Supplementary Fig. E3 andTable E3 [online only, available at www.exphem.org]). Inter-estingly, the HOXB genes (HOXB2, HOXB6, and HOXB7)were more expressed in both the MSC cells and OBs of theMM samples than in the N samples.
Real-time PCR confirmed the different expression ofHOXB2 and HOXB7 mRNA between the MM and Nsamples (median �DCT HOXB2 MM-MSC vs N-MSC:�6.4 vs �11; p ! 0.01; MM-OB vs N-OB: �6.2 vs�9.8; p ! 0.01; and median -DCT HOXB7 MM-MSC vsN-MSC: �5 vs �14; p ! 0.001; MM-OB vs N-OB: �5.3vs �13; p ! 0.001).
pri
nt
&w
eb4C=F
PO
Figure 2. Unsupervised analyses of the transcriptional profiles of isolated mesenchymal cells (MSC) and ostoblast (OB) samples from healthy donors (N),
and MGUS and MM patients. (A) All MSC cells and OBs from the MM, MGUS, and N sample dataset; (B) MSC and OB cells from the MM sample data set;
(C) separate MSC-MM dataset; and (D) OB-MM dataset. In each matrix, each column represents a sample, and each row a gene. In (B), blue represents the
14 N cases, and black the 32 MM cases; in (A), (C), and (D), red represents 14 osteolytic MM samples (8 MSC, 6 OB), and black 18 nonosteolytic samples (8
MSC and 10 OB). The color scale bar represents the related gene expression changes normalized by the standard deviation, and the color changes in each row
represent gene expression in relation to the mean across the samples.
145K. Todoerti et al./ Experimental Hematology 2010;38:141–153

Transcriptional profiles in the MM-MSC and MM-OBsamples in relation to the presence of osteolytic bonelesionsForty-five genes (36 up- and 9 downregulated) were differ-entially expressed between the osteolytic and nonosteolyticMM-MSC samples (Fig. 3A and Table 1). The upregulatedgenes in the osteolytic samples were mainly related to nu-cleic acid metabolism, RNA processing and transcriptionregulation, whereas the downregulated genes includedWNT6 and WW domain-containing oxidoreductase(WWOX) (Table 1). On the contrary, supervised analysisdid not reveal any significantly differentially expressedgenes between the osteolytic and nonosteolytic MM-OBsamples (data not shown).
To investigate whether osteolysis affects the identifica-tion of the transcriptional patterns distinguishing the MM-MSC samples from the MM-OB samples, we used super-vised analyses to investigate the MM-MSC and MM-OBsamples within (i) the nonosteolytic group (8 and 10samples, respectively) and (ii) the osteolytic group (8 and6 cases). The two analyses revealed 143 well-characterizedand differentially expressed genes between the MM-MSCand MM-OB samples in the nonosteolytic group(Fig. 3B), and 267 in the osteolytic group (Fig. 3C). Todefine the specific osteolysis-associated genes, the commontranscripts in the two analyses were discarded, i.e., thosemost likely related to differential expression between
MSC and OB cell-types, which led to 118 (SupplementaryTable E4, online only, available at www.exphem.org) and240 (Supplementary Table E5, online only, available atwww.exphem.org) genes exclusively modulated in the non-osteolytic and osteolytic groups, respectively. Finally, tocharacterize the osteolysis-associated transcriptional char-acteristics further, we performed supervised paired analyses(i) between the six paired MSC and OB samples from non-osteolytic patients, and (ii) between the six paired MSC andOB samples from osteolytic patients The first comparisonidentified the differential expression of 91 well-character-ized genes, 64% of which (58 of 91 genes) were recognizedas commonly modulated in the previous global supervisedanalysis of OB vs MSC samples (Supplementary TableE6, online only, available at www.exphem.org); the secondcomparison identified the differential expression of 227well-characterized genes, 56% of which (127 of 227)were commonly found in the global comparison (Supple-mentary Table E7, online only, available at www.exphem.org). Functional annotation analysis indicated marginaldifferences in the molecular signatures described by boththe unpaired and paired supervised analyses. Overall, theidentified signatures were mainly independent of individualfeatures and specifically characterized MSC cells and OBsin relation to the occurrence of bone lesions.
Positive modulation of the genes involved in cytoskel-eton organization, biogenesis, and apoptotic alterations
pri
nt
&w
eb4C=F
PO
Figure 3. Specific expression profiles in isolated mesenchymal (MSC) and osteoblast (OB) samples, depending on the presence or absence of osteolysis in
multiple myeloma (MM) patients. Different expression profiles of differentially expressed genes in (A) nonosteolytic (OSTL�) vs osteolytic MSC (OSTLþ)
MSC cells; (B) MSC cells vs OBs in the nonosteolytic group; and (C) MSC cells vs OBs in the osteolytic group. In each matrix, each column represents
a sample, and each row a gene. The color scale bar represents the relative gene-expression changes normalized by the standard deviation, and the color
changes in each row represent gene expression in relation to the mean across the samples.
146 K. Todoerti et al. / Experimental Hematology 2010;38:141–153

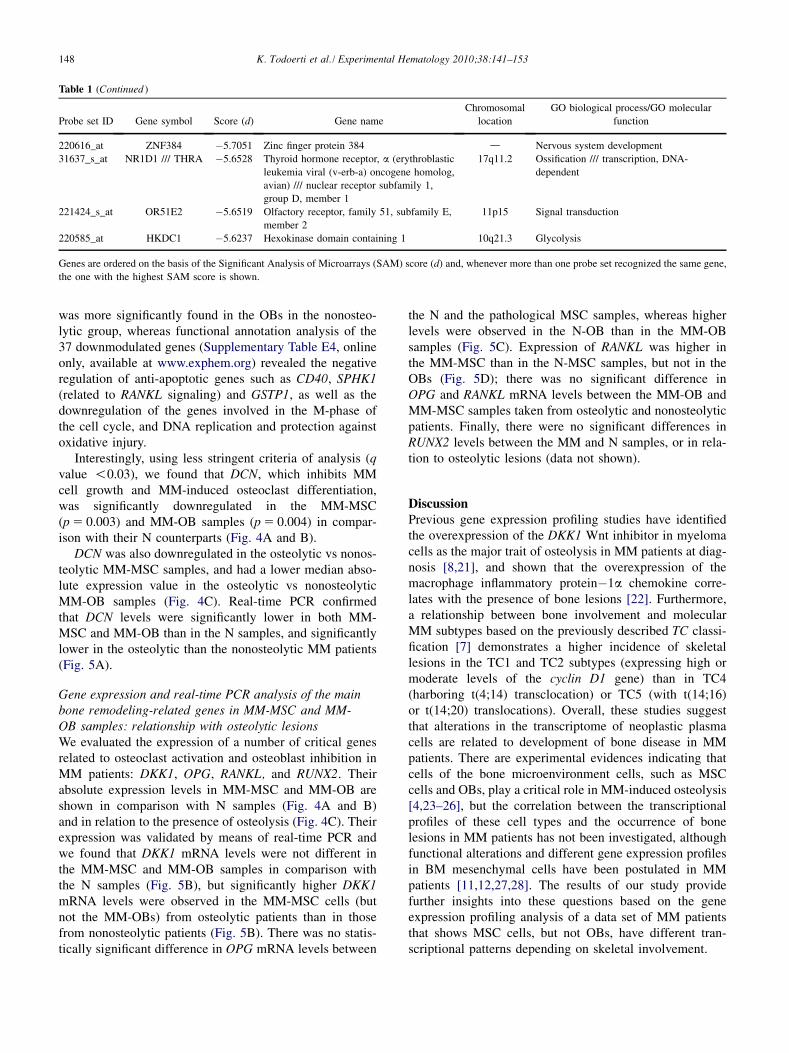
Table 1. Functional annotations of the 35 upregulated and 9 downregulated genes in the osteolytic vs nonosteolytic multiple myeloma mesenchymal stem
cell groups identified by SAM supervised analysis
Probe set ID Gene symbol Score (d) Gene name
Chromosomal
location
GO biological process/GO molecular
function
217986_s_at BAZ1A 8.1708 Bromodomain adjacent to zinc finger
domain, 1A
14q12-q13 Regulation of transcription, DNA-dependent
205034_at CCNE2 6.7199 Cyclin E2 8q22.1 Regulation of progression through cell cycle
211270_x_at PTBP1 6.4010 Polypyrimidine tract binding protein 1 19p13.3 mRNA processing
209129_at TRIP6 6.0297 Thyroid hormone receptor interactor 6 7q22 Positive regulation of cell migration
221536_s_at LSG1 6.0196 Large subunit GTPase 1 homolog (S.
cerevisiae)
3q29 GTP binding
209025_s_at SYNCRIP 5.8756 Synaptotagmin binding, cytoplasmic RNA
interacting protein
6q14-q15 RNA processing
221059_s_at COTL1 5.8655 Coactosin-like 1 (Dictyostelium) 16q24.1 Carbohydrate metabolic process
202420_s_at DHX9 5.8333 DEAH (Asp-Glu-Ala-His) box polypeptide 9 1q25 mRNA_processing_Reactome
200054_at ZNF259 5.8195 Zinc finger protein 259 11q23.3 Cell proliferation
218447_at C16orf61 5.7001 Chromosome 16 open reading frame 61 16q23.2 d209152_s_at TCF3 5.5395 Transcription factor 3 (E2A immunoglobulin
enhancer binding factors E12/E47)
19p13.3 Regulation of transcription, DNA-dependent
208753_s_at NAP1L1 5.5338 Nucleosome assembly protein 1-like 1 12q21.2 Nucleosome assembly /// positive regulation
of cell proliferation
205258_at INHBB 5.5067 Inhibin, b B (activin AB b polypeptide) 2cen-q13 Defense response /// response to external
stimulus
201521_s_at NCBP2 5.4948 Nuclear cap binding protein subunit 2,
20 kDa
3q29 Positive regulation of RNA export from
nucleus
210378_s_at SSNA1 5.4186 Sjogren’s syndrome nuclear autoantigen 1 9q34.3 Identical protein binding
218969_at Magmas 5.3641 Mitochondria-associated protein involved in
granulocyte-macrophage colony-stimulating
factor signal transduction
16p13.3 Protein transport
201579_at FAT1 5.3452 FAT tumor suppressor homolog 1
(Drosophila)
4q35 Cell adhesion /// cell-cell signaling
201038_s_at ANP32A 5.3425 Acidic (leucine-rich) nuclear phosphoprotein
32 family, member A
15q22.3-q23 Nucleocytoplasmic transport
221823_at C5orf30 5.3210 Chromosome 5 open reading frame 30 5q21.1 d
222036_s_at MCM4 5.3175 Minichromosome maintenance complex
component 4
8q11.2 DNA replication
209729_at GAS2L1 5.2803 Growth arrest-specific 2 like 1 22q12.2 Cell cycle arrest
200783_s_at STMN1 5.2651 Stathmin 1/oncoprotein 18 1p36.1-p35 Microtubule depolymerization /// mitotic
spindle organization and biogenesis
200768_s_at MAT2A 5.2467 Methionine adenosyltransferase II, a 2p11.2 One-carbon compound metabolic process
218294_s_at NUP50 5.2338 Nucleoporin 50 kDa 22q13.31 Intracellular transport
201585_s_at SFPQ 5.2236 Splicing factor proline/glutamine-rich
(polypyrimidine tract binding protein
associated)
1p34.3 DNA repair /// RNA splicing
200044_at SFRS9 5.1903 Splicing factor, arginine/serine-rich 9 12q24.31 RNA splicing
203302_at DCK 5.1498 Deoxycytidine kinase 4q13.3-q21.1 Nucleic acid metabolic process
209181_s_at RABGGTB 5.1338 Rab geranylgeranyltransferase, b subunit 1p31 Protein modification process
209214_s_at EWSR1 5.1178 Ewing sarcoma breakpoint region 1 22q12.2 Regulation of transcription, DNA-dependent
214092_x_at SFRS14 5.0308 Splicing factor, arginine/serine-rich 14 19p12 RNA splicing
221505_at ANP32E 5.0028 Acidic (leucine-rich) nuclear phosphoprotein
32 family, member E
1q21.2 Phosphatase inhibitor activity
212402_at ZC3H13 4.9810 Zinc finger CCCH-type containing 13 13q14.12 Nucleic acid binding
219065_s_at MEMO1 4.9241 Mediator of cell motility 1 2p22-p21 d
214214_s_at C1QBP 4.9222 Complement component 1, q subcomponent
binding protein
17p13.3 Immune response
220525_s_at AUP1 4.8783 Ancient ubiquitous protein 1 2p13 Metabolic process
219716_at APOL6 �7.9872 Apolipoprotein L, 6 22q12.3 Lipoprotein metabolic process
220712_at C8orf60 �6.5346 Chromosome 8 open reading frame 60 8q24.3 d
208344_x_at IFNA1 /// IFNA13 �6.0170 Interferon, a 1/// interferon, a 13 9p22 Defense response
71933_at WNT6 �6.0004 Wingless-type MMTV integration site
family, member 6
2q35 Wnt receptor signaling pathway
210695_s_at WWOX �5.7720 WW domain containing oxidoreductase 16q23.3-q24.1 Negative regulation of progression through
cell cycle
(continued)
147K. Todoerti et al./ Experimental Hematology 2010;38:141–153
was more significantly found in the OBs in the nonosteo-lytic group, whereas functional annotation analysis of the37 downmodulated genes (Supplementary Table E4, onlineonly, available at www.exphem.org) revealed the negativeregulation of anti-apoptotic genes such as CD40, SPHK1(related to RANKL signaling) and GSTP1, as well as thedownregulation of the genes involved in the M-phase ofthe cell cycle, and DNA replication and protection againstoxidative injury.
Interestingly, using less stringent criteria of analysis (qvalue !0.03), we found that DCN, which inhibits MMcell growth and MM-induced osteoclast differentiation,was significantly downregulated in the MM-MSC(p 5 0.003) and MM-OB samples (p 5 0.004) in compar-ison with their N counterparts (Fig. 4A and B).
DCN was also downregulated in the osteolytic vs nonos-teolytic MM-MSC samples, and had a lower median abso-lute expression value in the osteolytic vs nonosteolyticMM-OB samples (Fig. 4C). Real-time PCR confirmedthat DCN levels were significantly lower in both MM-MSC and MM-OB than in the N samples, and significantlylower in the osteolytic than the nonosteolytic MM patients(Fig. 5A).
Gene expression and real-time PCR analysis of the mainbone remodeling-related genes in MM-MSC and MM-OB samples: relationship with osteolytic lesionsWe evaluated the expression of a number of critical genesrelated to osteoclast activation and osteoblast inhibition inMM patients: DKK1, OPG, RANKL, and RUNX2. Theirabsolute expression levels in MM-MSC and MM-OB areshown in comparison with N samples (Fig. 4A and B)and in relation to the presence of osteolysis (Fig. 4C). Theirexpression was validated by means of real-time PCR andwe found that DKK1 mRNA levels were not different inthe MM-MSC and MM-OB samples in comparison withthe N samples (Fig. 5B), but significantly higher DKK1mRNA levels were observed in the MM-MSC cells (butnot the MM-OBs) from osteolytic patients than in thosefrom nonosteolytic patients (Fig. 5B). There was no statis-tically significant difference in OPG mRNA levels between
the N and the pathological MSC samples, whereas higherlevels were observed in the N-OB than in the MM-OBsamples (Fig. 5C). Expression of RANKL was higher inthe MM-MSC than in the N-MSC samples, but not in theOBs (Fig. 5D); there was no significant difference inOPG and RANKL mRNA levels between the MM-OB andMM-MSC samples taken from osteolytic and nonosteolyticpatients. Finally, there were no significant differences inRUNX2 levels between the MM and N samples, or in rela-tion to osteolytic lesions (data not shown).
DiscussionPrevious gene expression profiling studies have identifiedthe overexpression of the DKK1 Wnt inhibitor in myelomacells as the major trait of osteolysis in MM patients at diag-nosis [8,21], and shown that the overexpression of themacrophage inflammatory protein�1a chemokine corre-lates with the presence of bone lesions [22]. Furthermore,a relationship between bone involvement and molecularMM subtypes based on the previously described TC classi-fication [7] demonstrates a higher incidence of skeletallesions in the TC1 and TC2 subtypes (expressing high ormoderate levels of the cyclin D1 gene) than in TC4(harboring t(4;14) transclocation) or TC5 (with t(14;16)or t(14;20) translocations). Overall, these studies suggestthat alterations in the transcriptome of neoplastic plasmacells are related to development of bone disease in MMpatients. There are experimental evidences indicating thatcells of the bone microenvironment cells, such as MSCcells and OBs, play a critical role in MM-induced osteolysis[4,23–26], but the correlation between the transcriptionalprofiles of these cell types and the occurrence of bonelesions in MM patients has not been investigated, althoughfunctional alterations and different gene expression profilesin BM mesenchymal cells have been postulated in MMpatients [11,12,27,28]. The results of our study providefurther insights into these questions based on the geneexpression profiling analysis of a data set of MM patientsthat shows MSC cells, but not OBs, have different tran-scriptional patterns depending on skeletal involvement.
Table 1 (Continued )
Probe set ID Gene symbol Score (d) Gene name
Chromosomal
location
GO biological process/GO molecular
function
220616_at ZNF384 �5.7051 Zinc finger protein 384 d Nervous system development
31637_s_at NR1D1 /// THRA �5.6528 Thyroid hormone receptor, a (erythroblastic
leukemia viral (v-erb-a) oncogene homolog,
avian) /// nuclear receptor subfamily 1,
group D, member 1
17q11.2 Ossification /// transcription, DNA-
dependent
221424_s_at OR51E2 �5.6519 Olfactory receptor, family 51, subfamily E,
member 2
11p15 Signal transduction
220585_at HKDC1 �5.6237 Hexokinase domain containing 1 10q21.3 Glycolysis
Genes are ordered on the basis of the Significant Analysis of Microarrays (SAM) score (d) and, whenever more than one probe set recognized the same gene,
the one with the highest SAM score is shown.
148 K. Todoerti et al. / Experimental Hematology 2010;38:141–153

Actually, there are no published studies of isolated OBsin MM patients, but in our study we isolated both MSCcells and OBs directly from bone at the first passage ratherthan from the previously used BM aspirates [10–12,27,28].We have chosen the direct isolation of mature OB frombone instead of proosteoblastic cells obtained after in vitrodifferentiation from BM cells to prevent the potential effectof the osteogenic differentiation process on gene expressionprofiles of the cells as widely demonstrated [29,30]. More-over, the direct OB isolation from bone instead of by meansof in vitro differentiation from BM cells is an establishedprocedure [13] that we have recently adapted and used inpatients with osteoarthritis [14].
Regarding MSCs, previous studies have demonstratedthe feasibility of isolating MSC cells from trabecularbone by showing that the amount and differentiation prop-erties of such cells are similar to those of cells obtainedfrom BM aspirates [31,32].
We have previously reported that the immunohisto-chemical profiles and immunophyenotypes of MSC cells
and OBs are comparable with those described in theliterature [14,33,34], and there were no significant differ-ences in the immunophenotypes of the present data setbetween the normal and pathological samples, or in rela-tion to the presence or absence of osteolysis, which is inline with previous findings in MM patients and normalsubjects [10–12,27]. Furthermore, there was little or nocontamination because the MSC cells were isolatedfrom nonadherent bone marrow cells and the OBs fromdigested bone.
Our high-resolution microarray analyses clearly showeddifferences in the expression profiles of MSC cells andOBs. In particular, the hierarchical agglomerative clus-tering of the transcriptional profiles of the samples includedin our dataset showed that the two cell types were clearlydistinguishable, further indicating that any possiblecontamination between the two cell types was negligible.The differences in the expression profiles are all the moresignificant because most of the MSC cells and OBs camefrom the same patients, and so the impact of case-specific
Figure 4. Microarray expression levels of bone-related genes in isolated
mesenchymal (MSC) and osteoblast (OB) cell samples. The absolute expres-
sion levels of DCN, DKK1, OPG, RANKL, and RUNX2 transcripts were as-
sessed by means of microarray analysis. Box plot representations of
messenger RNA expression levels in (A) 7 healthy (N)-MSC and 16 multiple
myeloma (MM)-MSC samples; (B) 7 N-OB and 16 MM-OB samples; and
(C) in osteolytic (þ) and nonosteolytic (�) MM-MSC and MM-OB samples.
The different probe sets represented on the array are shown for each gene.
149K. Todoerti et al./ Experimental Hematology 2010;38:141–153
WongK
Rectangle
WongK
Sticky Note
comp: center text in white space available

signatures on the natural grouping of the samples was lessthan that of the cell type-specific signatures.
The cell proliferation rate was not different between MMpatients and controls, as reported by others [27], nor was itrelated to the presence or absence of bone lesions. On theother hand, immunohistochemistry showed that the expres-sion of the RUNX2 transcription factor was lower in theMM patients than in the normal subjects, and lower in os-teolytic than in nonosteolytic MM patients. This finding infreshly isolated MSC cells and OBs confirms our previousfindings in bone biopsies of MM patients [5], thus suggest-ing that MM patients have fewer osteoprogenitor cells than
normal subjects and those with osteolytic lesions havefewer than those without. In the present study, we did notfind a significant difference between the number of OBs ob-tained after purification in osteolytic and nonosteolytic MMpatients. This could be most likely due to the high vari-ability in the procedure of cell obtainments from the bonechips and to the lesser accuracy of the OBs counts from iso-lated cells as compared to those observed in histomorphom-etry studies [35,36], which are able to identify differencesin the number of OBs in relationship with the occurrenceof osteolytic lesions [3,5,37]. In addition, in isolated OBcells the lack of difference in the expression of OC, ALP,
Figure 5. Real-time polymerase chain reaction analyses of bone-related gene transcripts in isolated mesenchymal (MSC) and osteoblast (OB) cell samples.
(A) DCN messenger RNA (mRNA) levels in MSC cells and OBs from healthy (N), all multiple myeloma (MM) patients and osteolytic/nonosteolytic MM
patients; the graphs show the �DCt: �(mean Ct DCN�mean Ct ABL) 6 standard deviation (SD). (*p ! 0.05). (B) DKK1 mRNA levels in MSC cells and OBs
from N, all MM patients, and osteolytic/nonosteolytic MM patients; the graphs show the �DCt: �(mean Ct DKK1�mean Ct ABL) 6 SD (*p ! 0.05). OPG (C)
and RANKL mRNA levels (D) in MSC and OB cells from N and all MM patients; the graphs show the �DCt 6 SD for OPG and RANKL calculated as
described for (A) and (B) (*p ! 0.05).
150 K. Todoerti et al. / Experimental Hematology 2010;38:141–153

and Col1 osteoblast markers between MM and N subjectsand between osteolytic and nonosteolytic MM patients indi-cated similar presence of mature OBs in MM patients withregard to what observed in N subjects. This may notexclude the occurrence of a blockage of the osteogenicdifferentiation process induced by MM cells in the areaof close contact between MM cell and osteoblasts, aswell as the reduction in the number of osteoprogenitor cells,as described previously [5]. Finally, our results are in linewith recent evidences in isolated MSC cells showing thelack of difference in the osteogenic differentiation proper-ties between MM patients and N subjects [11,12].
In this study, we first compared the gene expressionprofiles of MSC cells and OBs from MM patients andnormal controls. Previous findings indicate that MM-MSCand N-MSC cells have different transcriptional fingerprints,and suggest the differential expression of 145 genes [10].More recently, a number of gains and losses of geneticmaterial, together with a specific pattern of hot-spot regionswith discrete genomic alterations, have been reported in theMSC cells of MM patients [28]. Results of the presentstudy confirmed that the MSC cells of MM patients havedifferent transcriptional characteristics from those ofnormal cells, and that the same is true of OBs. Interestingly,the transcription factors belonging to the HOXB genefamily were differentially expressed in both MM-MSCcells and MM-OBs in comparison with normal controls.It is known that the identified HOXB2, HOXB6, andHOXB7 genes influence self-renewal, proliferation, anddifferentiation of MSC cells [38], and are involved in theangiogenic differentiation process [39] associated withMM [40,41]. Like others [10], we also found that theMAF transcription factor was downregulated in MM-MSCcells. Although its role in the osteogenic process remainsunknown, MAF is expressed in OBs [42], and is alsoinvolved in MSC cell differentiation as it is downregulatedduring adipogenic differentiation [43] and upregulatedduring chondrogenic differentiation [43]. The MAF down-regulation observed in MM-MSC cells, therefore, suggestsa possible alteration in the differentiation properties ofMSC cells in MM patients.
The gene expression profiling analyses of MM-MSCcells and MM-OBs from patients with and without osteoly-sis revealed a number of differentially expressed genes inthe MSC cells but not in the OBs, thus indicating thatMSC cells rather than OBs are altered in osteolytic MMpatients. This is in line with experimental in vitro data indi-cating the involvement of MSC cells rather than matureOBs in the increased osteoclastogenesis and decreasedbone formation observed in the MM microenvironment[5,44]. Interestingly, the WWOX tumor suppressor genewas downregulated in the MSC cells of our osteolyticMM patients, and it has recently been demonstrated thatWWOX-deficient mice show delayed bone formation andincreased osteoclast activity and bone resorption [45].
The WNT6 gene belonging to the canonical Wnt signalingpathway was also downregulated in the MSC cells of osteo-lytic patients, although its role in bone formation has still tobe clarified.
The MSC cells and OBs from the osteolytic and nonos-teolytic MM patients had distinctive gene expressionpatterns and, interestingly, this was also true when consid-ered only the MSC cell and OB samples of the samepatients. Among the genes differentially expressed inMSC cells and potentially involved in inhibiting boneformation or activating osteoclasts, the extracellular matrixprotein DCN was downregulated in comparison with thecontrols, and downregulated in the osteolytic samples incomparison with the nonosteolytic samples. It has recentlybeen discovered that DCN is produced by MSC cells andOBs, and inhibits MM cell growth and MM-induced osteo-clast formation [46].
The stringent criteria of the microarray analyses did notallow us to identify among the most differentially expressedgenes either RANKL known to be involved in MM-inducedosteoclast activation [47] or DKK1, associated with osteo-genic differentiation [10]. However, we further evaluatedthe expression of these genes using quantitative reverse tran-scriptase�PCR, which showed higher levels of RANKLexpression in MM-MSC cells than in normal controls, butnot in MM-OBs, thus confirming our previous results [44].In line with this, it has been reported that RANKL expressiondepends on the degree of OB differentiation, being higher inimmature than in mature OBs [47] and in the mesenchymal/osteoprogenitor cells that mainly involved in RANKLproduction in MM [44]. The levels of DKK1 were not signif-icantly different between our MM and N subjects, unlikethose recently reported in MSC cells [10], which may be atleast partially due to the different methods used to isolatethe cells given that we used MSC cells and OBs isolatedfrom bone rather than BM aspirates. However, we did findsignificantly higher DKK1 mRNA levels in the MSC cellsof our osteolytic patients than in those of our nonosteolyticpatients, thus supporting the hypothesis that microenviron-ment-derived DKK1 may be a potential target in osteolyticMM patients and MM bone disease. It has recently beenfound in murine models of MM that anti-DKK1 antibody[9] and canonical Wnt activation by Wnt3a [48] or lithium[49] blunt the inhibitory effect of MM cells on osteoblastformation regardless of the production of DKK1 by MMcells, thus suggesting that the target of anti�DKK-1 therapyis the bone microenvironment rather than MM cells.
It has recently been demonstrated that RUNX2 [5] and itsregulator TAZ [50] are among the critical factors involvedin the blockade of osteogenic differentiation in MM. Wedid not find any difference in expression of the RUNX2gene in the MSC cells of our osteolytic and nonosteolyticMM patients, despite evidence of lower RUNX2 proteinexpression in the osteolytic group. This could suggest thatposttranscriptional modifications may regulate RUNX2, as
151K. Todoerti et al./ Experimental Hematology 2010;38:141–153

demonstrated previously [51–53], and further studies maybe warranted to clarify this issue. Consistently, we havepreviously shown that MM cells do not modify RUNX2expression in in vitro coculture, but suppress its activity [5].
In conclusion, our data indicate that both MSC cells andOBs have altered gene expression profiles in MM patients,and that MSC cells (but not OBs) have different molecularsignatures, depending on the presence or absence of osteoly-sis. These data support the hypothesis that alterations in theMSC cells of the bone microenvironment may be associatedwith the presence of osteolysis in MM patients, and are there-fore potential therapeutic targets in MM bone disease.
AcknowledgmentsThis article was supported by grants from Progetti Regione-Universita Emilia-Romagna (Italy), the Italian Ministry of Health(Italy) (to N.G. and V.R), the Associazione Italiana Ricerca sulCancro (Italy) (to A.N.), the Italian Ministry of Universities(MIUR) (Milan, Italy), Progetto PRIN 2006 (Italy), and the Asso-ciazione Italiana Contro le Leucemie (AIL) (Parma, Italy). K.T.and L.A. were supported by a fellowship from the FondazioneItaliana Ricerca sul Cancro (Milan, Italy).
Conflict of Interest DisclosureNo financial interest/relationships with financial interest relatingto the topic of this article have been declared.
References1. Kyle RA, Rajkumar SV. Multiple myeloma. N Engl J Med. 2004;351:
1860–1873.
2. Lentzsch S, Ehrlich LA, Roodman GD. Pathophysiology of multiple
myeloma bone disease. Hematol Oncol Clin North Am. 2007;21:
1035–1049.
3. Bataille R, Chappard D, Marcelli C, et al. Mechanisms of bone
destruction in multiple myeloma: the importance of an unbalanced
process in determining the severity of lytic bone disease. J Clin Oncol.
1989;7:1909–1914.
4. Giuliani N, Rizzoli V, Roodman GD. Multiple myeloma bone disease:
pathophysiology of osteoblast inhibition. Blood. 2006;108:3992–
3996.
5. Giuliani N, Colla S, Morandi F, et al. Myeloma cells block RUN-
X2/CBFA1 activity in human bone marrow osteoblast progenitors
and inhibit osteoblast formation and differentiation. Blood. 2005;
106:2472–2483.
6. Yaccoby S, Wezeman MJ, Zangari M, et al. Inhibitory effects of oste-
oblasts and increased bone formation on myeloma in novel culture
systems and a myelomatous mouse model. Haematologica. 2006;91:
192–199.
7. Robbiani DF, Chesi M, Bergsagel PL. Bone lesions in molecular
subtypes of multiple myeloma. N Engl J Med. 2004;351:197–198.
8. Tian E, Zhan F, Walker R, et al. The role of the Wnt-signaling antag-
onist DKK1 in the development of osteolytic lesions in multiple
myeloma. N Engl J Med. 2003;349:2483–2494.
9. Yaccoby S, Ling W, Zhan F, Walker R, Barlogie B, Shaughnessy JD Jr.
Antibody-based inhibition of DKK1 suppresses tumor-induced bone
resorption and multiple myeloma growth in vivo. Blood. 2007;109:
2106–2111.
10. Corre J, Mahtouk K, Attal M, et al. Bone marrow mesenchymal stem
cells are abnormal in multiple myeloma. Leukemia. 2007;21:1079–1088.
11. Garderet L, Mazurier C, Chapel A, et al. Mesenchymal stem cell
abnormalities in patients with multiple myeloma. Leuk Lymphoma.
2007;48:2032–2041.
12. Arnulf B, Lecourt S, Soulier J, et al. Phenotypic and functional char-
acterization of bone marrow mesenchymal stem cells derived from
patients with multiple myeloma. Leukemia. 2007;21:158–163.
13. Robey PG, Termine JD. Human bone cells in vitro. Calcif Tissue Int.
1985;37:453–460.
14. Lisignoli G, Piacentini A, Toneguzzi S, et al. Osteoblasts and stromal
cells isolated from femora in rheumatoid arthritis (RA) and osteoar-
thritis (OA) patients express IL-11, leukaemia inhibitory factor and
oncostatin M. Clin Exp Immunol. 2000;119:346–353.
15. Giuliani N, Lisignoli G, Colla S, et al. CC-chemokine ligand
20/macrophage inflammatory protein-3alpha and CC-chemokine
receptor 6 are overexpressed in myeloma microenvironment related
to osteolytic bone lesions. Cancer Res. 2008;68:6840–6850.
16. Mattioli M, Agnelli L, Fabris S, et al. Gene expression profiling of plasma
cell dyscrasias reveals molecular patterns associated with distinct IGH
translocations in multiple myeloma. Oncogene. 2005;24:2461–2473.
17. Agnelli L, Bicciato S, Mattioli M, et al. Molecular classification of
multiple myeloma: a distinct transcriptional profile characterizes
patients expressing CCND1 and negative for 14q32 translocations.
J Clin Oncol. 2005;23:7296–7306.
18. Tusher VG, Tibshirani R, Chu G. Significance analysis of microarrays
applied to the ionizing radiation response. Proc Natl Acad Sci U S A.
2001;98:5116–5121.
19. Schadt EE, Li C, Su C, Wong WH. Analyzing high-density oligonucle-
otide gene expression array data. J Cell Biochem. 2000;80:192–202.
20. Giuliani N, Colla S, Morandi F, Barille-Nion S, Rizzoli V. Lack of
receptor activator of nuclear factor-kB ligand (RANKL) expression
and functional production by human multiple myeloma cells. Haema-
tologica. 2005;90:275–278.
21. Haaber J, Abildgaard N, Knudsen LM, et al. Myeloma cell expression
of 10 candidate genes for osteolytic bone disease. Only overexpression
of DKK1 correlates with clinical bone involvement at diagnosis. Br J
Haematol. 2008;140:25–35.
22. Magrangeas F, Nasser V, Avet-Loiseau H, et al. Gene expression
profiling of multiple myeloma reveals molecular portraits in relation
to the pathogenesis of the disease. Blood. 2003;101:4998–5006.
23. Edwards CM, Zhuang J, Mundy GR. The pathogenesis of the bone
disease of multiple myeloma. Bone. 2008;42:1007–1013.
24. Mitsiades CS, McMillin DW, Klippel S, et al. The role of the bone
marrow microenvironment in the pathophysiology of myeloma and
its significance in the development of more effective therapies. Hem-
atol Oncol Clin North Am. 2007;21:1007–1034.
25. Giuliani N, Rizzoli V. Myeloma cells and bone marrow osteoblast
interactions: role in the development of osteolytic lesions in multiple
myeloma. Leuk Lymphoma. 2007;48:2323–2329.
26. Roodman GD. Mechanisms of bone lesions in multiple myeloma and
lymphoma. Cancer. 1997;80(Suppl):1557–1563.
27. Wallace SR, Oken MM, Lunetta KL, Panoskaltsis-Mortari A, Masellis
AM. Abnormalities of bone marrow mesenchymal cells in multiple
myeloma patients. Cancer. 2001;91:1219–1230.
28. Garayoa M, Garcia JL, Santamaria C, et al. Mesenchymal stem cells from
multiple myeloma patients display distinct genomic profile as compared
with those from normal donors. Leukemia. 2009;23:1515–1527.
29. Tanabe S, Sato Y, Suzuki T, Suzuki K, Nagao T, Yamaguchi T. Gene
expression profiling of human mesenchymal stem cells for identifica-
tion of novel markers in early- and late-stage cell culture. J Biochem.
2008;144:399–408.
30. Schilling T, Kuffner R, Klein-Hitpass L, Zimmer R, Jakob F, Schutze
N. Microarray analyses of transdifferentiated mesenchymal stem cells.
J Cell Biochem. 2008;103:413–433.
31. Sakaguchi Y, Sekiya I, Yagishita K, Ichinose S, Shinomiya K, Muneta
T. Suspended cells from trabecular bone by collagenase digestion
152 K. Todoerti et al. / Experimental Hematology 2010;38:141–153
become virtually identical to mesenchymal stem cells obtained from
marrow aspirates. Blood. 2004;104:2728–2735.
32. Sanchez-Guijo FM, Blanco JF, Cruz G, et al. Multiparametric
comparison of mesenchymal stromal cells obtained from trabecular
bone by using a novel isolation method with those obtained by iliac
crest aspiration from the same subjects. Cell Tissue Res. 2009;336:
501–507.
33. Lisignoli G, Codeluppi K, Todoerti K, et al. Gene array profile iden-
tifies collagen type XV as a novel human osteoblast-secreted matrix
protein. J Cell Physiol. 2009;220:401–409.
34. Lisignoli G, Cristino S, Toneguzzi S, et al. IL1beta and TNFalpha
differently modulate CXCL13 chemokine in stromal cells and osteo-
blasts isolated from osteoarthritis patients: evidence of changes asso-
ciated to cell maturation. Exp Gerontol. 2004;39:659–665.
35. Jilka RL, Weinstein RS, Parfitt AM, Manolagas SC. Quantifying oste-
oblast and osteocyte apoptosis: challenges and rewards. J Bone Miner
Res. 2007;22:1492–1501.
36. Gruber HE, Ivey JL, Thompson ER, Chesnut CH 3rd, Baylink DJ.
Osteoblast and osteoclast cell number and cell activity in postmeno-
pausal osteoporosis. Miner Electrolyte Metab. 1986;12:246–254.
37. Bataille R, Chappard D, Marcelli C, et al. Recruitment of new osteo-
blasts and osteoclasts is the earliest critical event in the pathogenesis
of human multiple myeloma. J Clin Invest. 1991;88:62–66.
38. Phinney DG, Gray AJ, Hill K, Pandey A. Murine mesenchymal and
embryonic stem cells express a similar Hox gene profile. Biochem Bi-
ophys Res Commun. 2005;338:1759–1765.
39. Chung N, Jee BK, Chae SW, Jeon YW, Lee KH, Rha HK. HOX gene
analysis of endothelial cell differentiation in human bone marrow-
derived mesenchymal stem cells. Mol Biol Rep. 2009;36:227–235.
40. Ria R, Piccoli C, Cirulli T, et al. Endothelial differentiation of hema-
topoietic stem and progenitor cells from patients with multiple
myeloma. Clin Cancer Res. 2008;14:1678–1685.
41. Vacca A, Ria R, Semeraro F, et al. Endothelial cells in the bone
marrow of patients with multiple myeloma. Blood. 2003;102:3340–
3348.
42. Serria MS, Ikeda H, Omoteyama K, Hirokawa J, Nishi S, Sakai M.
Regulation and differential expression of the c-maf gene in differen-
tiating cultured cells. Biochem Biophys Res Commun. 2003;310:
318–326.
43. MacLean HE, Kim JI, Glimcher MJ, Wang J, Kronenberg HM,
Glimcher LH. Absence of transcription factor c-maf causes abnormal
terminal differentiation of hypertrophic chondrocytes during endo-
chondral bone development. Dev Biol. 2003;262:51–63.
44. Giuliani N, Bataille R, Mancini C, Lazzaretti M, Barille S. Myeloma cells
induce imbalance in the osteoprotegerin/osteoprotegerin ligand system
in the human bone marrow environment. Blood. 2001;98:3527–3533.
45. Aqeilan RI, Hassan MQ, de Bruin A, et al. The WWOX tumor
suppressor is essential for postnatal survival and normal bone metab-
olism. J Biol Chem. 2008;283:21629–21639.
46. Li X, Pennisi A, Yaccoby S. Role of decorin in the antimyeloma
effects of osteoblasts. Blood. 2008;112:159–168.
47. Atkins GJ, Kostakis P, Pan B, et al. RANKL expression is related to
the differentiation state of human osteoblasts. J Bone Miner Res.
2003;18:1088–1098.
48. Qiang YW, Shaughnessy JD Jr, Yaccoby S. Wnt3a signaling within
bone inhibits multiple myeloma bone disease and tumor growth.
Blood. 2008;112:374–382.
49. Edwards CM, Edwards JR, Lwin ST, et al. Increasing Wnt signaling in
the bone marrow microenvironment inhibits the development of
myeloma bone disease and reduces tumor burden in bone in vivo.
Blood. 2008;111:2833–2842.
50. Li B, Shi M, Li J, et al. Elevated tumor necrosis factor-alpha
suppresses TAZ expression and impairs osteogenic potential of Flk-
1þ mesenchymal stem cells in patients with multiple myeloma.
Stem Cells Dev. 2007;16:921–930.
51. Franceschi RT, Xiao G. Regulation of the osteoblast-specific transcrip-
tion factor, Runx2: responsiveness to multiple signal transduction
pathways. J Cell Biochem. 2003;88:446–454.
52. Suh JH, Lee HW, Lee JW, Kim JB. Hes1 stimulates transcriptional
activity of Runx2 by increasing protein stabilization during osteoblast
differentiation. Biochem Biophys Res Commun. 2008;367:97–102.
53. Li X, Huang M, Zheng H, et al. CHIP promotes Runx2 degradation
and negatively regulates osteoblast differentiation. J Cell Biol. 2008;
181:959–972.
153K. Todoerti et al./ Experimental Hematology 2010;38:141–153