ANCIENT TEPUI SUMMITS HARBOR YOUNG RATHER THAN OLD LINEAGES OF ENDEMIC FROGS
14
ORIGINAL ARTICLE doi:10.1111/j.1558-5646.2012.01666.x ANCIENT TEPUI SUMMITS HARBOR YOUNG RATHER THAN OLD LINEAGES OF ENDEMIC FROGS Patricia E. Salerno, 1,2 Santiago R. Ron, 3 J. Celsa Se ˜ naris, 4 Fernando J. M. Rojas-Runjaic, 4 Brice P. Noonan, 5 and David C. Cannatella 1 1 Section of Integrative Biology, University of Texas at Austin, 1 University Station, C0900, Austin, Texas 78712 2 E-mail: [email protected] 3 Museo de Zoolog´ ıa, Escuela de Biolog´ ıa, Pontificia Universidad Cat ´ olica del Ecuador, Av. 12 de Octubre y Roca, Aptdo. 17–01-2184, Quito, Ecuador 4 Museo de Historia Natural La Salle, Apartado postal 1930, Caracas 1010-A, Venezuela 5 Department of Biology, The University of Mississippi, Box 1848, Mississippi 38677 Received December 7, 2011 Accepted March 23, 2012 The flattop mountains (tepuis) of South America are ancient remnants of the Precambrian Guiana Shield plateau. The tepui summits, isolated by their surrounding cliffs that can be up to 1000 m tall, are thought of as “islands in the sky,” harboring relict flora and fauna that underwent vicariant speciation due to plateau fragmentation. High endemicity atop tepui summits support the idea of an ancient “Lost World” biota. However, recent work suggests that dispersal between lowlands and summits has occurred long after tepui formation indicating that tepui summits may not be as isolated from the lowlands as researchers have long suggested. Neither view of the origin of the tepui biota (i.e., ancient vicariance vs. recent dispersal) has strong empirical support owing to a lack of studies. We test diversification hypotheses of the Guiana Shield highlands by estimating divergence times of an endemic group of treefrogs, Tepuihyla. We find that diversification of this group does not support an ancient origin for this taxon; instead, divergence times among the highland species are 2–5 Ma. Our data indicate that most highland speciation occurred during the Pliocene. Thus, this unparalleled landscape known as “The Lost World” is inhabited, in part, not by Early Tertiary relicts but neoendemics. KEY WORDS: Diversification hypotheses, Guiana Shield, Hylidae, Lost World, sky islands, tepuis. The tepuis (flattop mountains) of northern South America are arguably the most dramatic example of sky islands on Earth. With relatively flat summit plateaus sitting atop sheer cliffs of up to 1000 m, these tabletop mountains form a discontinuous ecosystem called Pantepui (Huber 1988) and harbor numerous endemic lineages. For example, within the Pantepui, 60% of the vascular plant species and 87% of the frog species are endemics, often to a single tepui summit (Duellman 1999; Berry and Ri- ina 2005; McDiarmid and Donnelly 2005). The tepuis are part of the Guiana Shield, which is situated between the Orinoco and Amazon Basins, accounts for 9% of the land area of South Amer- ica, and shows biogeographic affinities with the Amazon and Andes. Early reports of the unique topography and biodiversity of the Pantepui inspired Sir Arthur Conan Doyle to write of long- isolated dinosaur populations surviving to the present day in his novel “The Lost World,” which inspired the namesake Lost World hypothesis (Rull 2004a; or Plateau hypothesis, Chapman 1931). This is the main biogeographic hypothesis put forward to explain the highly endemic fauna and flora of this region 3000 C 2012 The Author(s). Evolution C 2012 The Society for the Study of Evolution. Evolution 66-10: 3000–3013
-
Upload
fundacionlasalle -
Category
Documents
-
view
1 -
download
0
Transcript of ANCIENT TEPUI SUMMITS HARBOR YOUNG RATHER THAN OLD LINEAGES OF ENDEMIC FROGS

ORIGINAL ARTICLE
doi:10.1111/j.1558-5646.2012.01666.x
ANCIENT TEPUI SUMMITS HARBOR YOUNGRATHER THAN OLD LINEAGES OF ENDEMICFROGSPatricia E. Salerno,1,2 Santiago R. Ron,3 J. Celsa Senaris,4 Fernando J. M. Rojas-Runjaic,4 Brice P. Noonan,5
and David C. Cannatella1
1Section of Integrative Biology, University of Texas at Austin, 1 University Station, C0900, Austin, Texas 787122E-mail: [email protected]
3Museo de Zoologıa, Escuela de Biologıa, Pontificia Universidad Catolica del Ecuador, Av. 12 de Octubre y Roca, Aptdo.
17–01-2184, Quito, Ecuador4Museo de Historia Natural La Salle, Apartado postal 1930, Caracas 1010-A, Venezuela5Department of Biology, The University of Mississippi, Box 1848, Mississippi 38677
Received December 7, 2011
Accepted March 23, 2012
The flattop mountains (tepuis) of South America are ancient remnants of the Precambrian Guiana Shield plateau. The tepui
summits, isolated by their surrounding cliffs that can be up to 1000 m tall, are thought of as “islands in the sky,” harboring relict
flora and fauna that underwent vicariant speciation due to plateau fragmentation. High endemicity atop tepui summits support
the idea of an ancient “Lost World” biota. However, recent work suggests that dispersal between lowlands and summits has
occurred long after tepui formation indicating that tepui summits may not be as isolated from the lowlands as researchers have
long suggested. Neither view of the origin of the tepui biota (i.e., ancient vicariance vs. recent dispersal) has strong empirical
support owing to a lack of studies. We test diversification hypotheses of the Guiana Shield highlands by estimating divergence
times of an endemic group of treefrogs, Tepuihyla. We find that diversification of this group does not support an ancient origin
for this taxon; instead, divergence times among the highland species are 2–5 Ma. Our data indicate that most highland speciation
occurred during the Pliocene. Thus, this unparalleled landscape known as “The Lost World” is inhabited, in part, not by Early
Tertiary relicts but neoendemics.
KEY WORDS: Diversification hypotheses, Guiana Shield, Hylidae, Lost World, sky islands, tepuis.
The tepuis (flattop mountains) of northern South America are
arguably the most dramatic example of sky islands on Earth.
With relatively flat summit plateaus sitting atop sheer cliffs of
up to 1000 m, these tabletop mountains form a discontinuous
ecosystem called Pantepui (Huber 1988) and harbor numerous
endemic lineages. For example, within the Pantepui, 60% of the
vascular plant species and 87% of the frog species are endemics,
often to a single tepui summit (Duellman 1999; Berry and Ri-
ina 2005; McDiarmid and Donnelly 2005). The tepuis are part
of the Guiana Shield, which is situated between the Orinoco and
Amazon Basins, accounts for 9% of the land area of South Amer-
ica, and shows biogeographic affinities with the Amazon and
Andes.
Early reports of the unique topography and biodiversity of
the Pantepui inspired Sir Arthur Conan Doyle to write of long-
isolated dinosaur populations surviving to the present day in
his novel “The Lost World,” which inspired the namesake Lost
World hypothesis (Rull 2004a; or Plateau hypothesis, Chapman
1931). This is the main biogeographic hypothesis put forward
to explain the highly endemic fauna and flora of this region
3 0 0 0C© 2012 The Author(s). Evolution C© 2012 The Society for the Study of Evolution.Evolution 66-10: 3000–3013

ENDEMIC FROGS ON ANCIENT TEPUI SUMMITS
(Chapman 1931; Maguire 1970; Hoogmoed 1979; McDiarmid
and Donnelly 2005; Heinicke et al. 2009). This hypothesis pre-
dicts that highland species, which are often endemic to a single
tepui, are relicts of formerly widespread plateau taxa and arose
through vicariance following ancient fragmentation of the plateau.
Thus, summit taxa are hypothesized to have been isolated for mil-
lions of years. In examining the especially high endemism levels
of Pantepui frog genera, most researchers support the idea that
diversification must be explained, at least partially, by long-term
isolation of Plateau paleoendemics (Hoogmoed 1979; MacCul-
loch and Lathrop 2002; McDiarmid and Donnelly 2005; Heinicke
et al. 2009). However, to date, it is unclear what fraction of the
highland endemism, in frogs or other groups, is explained by the
Lost World hypothesis.
Many global biodiversity hotspots are tropical mountainous
areas, suggesting that highland areas promote higher rates of di-
versification (Orme et al. 2005). In most uplifted mountain ranges
such as the Andes, the summits are the most recently exposed
surfaces, and these seem to be associated with recent species di-
vergences (Hughes and Eastwood 2006). In contrast, the tepui
summits are of Precambrian origin and are thought to harbor an-
cient lineages (Chapman 1931; Maguire 1970; Hoogmoed 1979;
McDiarmid and Donnelly 2005; Heinicke et al. 2009). The tepuis
were formed about 70–90 Ma, after the Guiana Shield plateau
underwent several periods of erosion and plateau uplift and frag-
mentation starting around 300 Ma, resulting in isolated sky is-
lands (Briceno et al. 1990; Briceno and Schubert 1990; Gibbs and
Barron 1993). Because the tepuis were formed mostly by erosion
rather than uplift, the summit surfaces are geologically older than
the adjacent slopes.
Many studies have suggested that vicariance alone (i.e., the
Lost World hypothesis) cannot explain the current distribution
of highland vascular plants (Huber 1988; Givnish et al. 1997),
birds (Mayr and Phelps 1967), and ants (Jaffe et al. 1993), nor the
available pollen deposits (Rull 2005; Rull and Nogue 2007). A set
of alternative hypotheses states that diversification occurred more
recently, after the summits were colonized by lowland species
through various mechanisms such as habitat shifts, vertical (cool
climate) displacement, and island hopping (Huber 1988; Mayr
and Phelps 1967; Rull 2004a). The Island-Hopping hypothesis
(Chapman 1931) suggests aerial dispersal among the tepuis. This
hypothesis seems plausible (though not obligatory) for organisms
with higher dispersal abilities (e.g., birds, vascular plants, insects;
Mayr and Phelps 1967; Jaffe et al. 1993; Givnish et al. 1997;
Rull and Nogue 2007) but unlikely for low-vagility organisms.
The Habitat Shift hypothesis (Mayr and Phelps 1967) suggests
that lowland species adapted to cooler climates, allowing colo-
nization of the highlands (Mayr and Phelps 1967; Huber 1988;
McDiarmid and Donnelly 2005). The Vertical Displacement hy-
pothesis (Rull 2004a,c, 2005), which is not exclusive of the Habi-
tat Shift hypothesis, suggests that cooler climates, especially dur-
ing Quaternary climate oscillations, promoted downward eleva-
tional shifts of habitat and range expansion of highland species
into the lowlands, thus connecting previously isolated popula-
tions. Subsequent warmer interglacials promoted upward shifts
of these cold-adapted populations, isolating them on the summits.
Thus, the Vertical Displacement hypothesis specifically invokes
historical climate change, whereas the Habitat Shift hypothesis
focuses on populations adapting to new habitats.
The Vertical Displacement hypothesis is similar to the well-
known Forest Refuge hypothesis of Haffer (1969) in that both
invoke glacial–interglacial climate fluctuations resulting in al-
ternation between isolated refugia and widespread habitat types.
Hypotheses of Pleistocene refugia have been extremely popular,
though also highly disputed, for explaining biogeographic pat-
terns both in temperate (Knowles 2000; Johnson and Cicero 2004;
Galbreath et al. 2009) and tropical regions (Mayr and O’Hara
1986; Hooghiemstra and Van der Hammen 2004; Carnaval and
Moritz 2008). The postulated Pleistocene refugia of the Guiana
Shield are not restricted to tepui summits. For example, in low-
elevation mountains in the eastern Guiana Shield, the effects of
Pleistocene climatic fluctuation have been posited to promote
extensive secondary contact among species typically found in
mid-elevations (Noonan and Gaucher 2005, 2006).
Debate on the origins of the Pantepui biota thus focuses on
the relative importance of recent dispersal versus ancient vicari-
ance. Not unexpectedly, the Pantepui biota is likely to be a mosaic
of remnant Guiana Shield lineages and more recent colonizers
(Rull 2004b). Divergence times from molecular analyses of tepui
species, and between these tepui inhabitants and their closest low-
land relatives, can differentiate among these alternatives. To date,
however, few studies have tested these hypotheses using phyloge-
netic approaches (but see Givnish et al. 1997, 2004), largely due
to the great difficulty and expense of conducting fieldwork in the
Pantepui ecosystem. To our knowledge, we offer the first explicit
test of diversification hypotheses of a Pantepui-endemic vertebrate
group by inferring the phylogenetic relationships and divergence
times for species of Tepuihyla, which comprises seven allopatric
treefrog species that occur only at mid- to high-elevations (Fig. 1).
Materials and MethodsTERMINOLOGY
The flattop mountains that make up the Pantepui ecosystem
are remnants of the Guiana Shield Plateau and derived from
Roraima Group sandstones (Huber 1987). The Pantepui occupies
mainly southern Venezuela but also adjacent regions of north-
eastern Guyana, southern Suriname, and northern Brazil (Huber
1987). The concept of Pantepui that we follow is the association
EVOLUTION OCTOBER 2012 3 0 0 1

PATRICIA E. SALERNO ET AL.
Figure 1. Map of the distribution of Tepuihyla within the Pantepui of the Guiana Shield: (1) T. aecii on Duida tepui; (2) T. luteolabris on
Marahuaka tepui; (3) T. edelcae on Auyan tepui; (4) T. edelcae on Chimanta massif; (5) T. rimarum on Ptari tepui; (6) T. rodriguezi on Sierra
de Lema; (7) T. galani on Guadacapiapu tepui; (8) T. talbergae at Kaieteur falls.
with the geological formation and not a particular elevation or
floristic composition.
SAMPLES AND SEQUENCES
We sampled four of the seven recognized species of Tepuihyla.
All Tepuihyla species are allopatric and inhabit montane and sub-
montane areas. Of the seven species, four are known only from a
single tepui, one (T. edelcae) from several adjacent tepui summits,
and two (T. rodriguezi and T. talbergae) from lower elevation lo-
calities (Fig. 1). One nominal species, T. celsae, is not considered
in our discussions. It is known only from a single locality well
outside the Pantepui region. Barrio-Amoros (2004) noted that the
specimens of T. celsae, which were not collected by the authors
who described the species, have a doubtful locality and he at-
tributed this new species and locality to mislabeling. Although
the poor condition of the specimens makes identification chal-
lenging, the specimen is likely a mislabeled T. luteolabris from
Duida tepui (C. Barrio-Amoros, pers. comm.).
Tissue samples were obtained from the Pontificia Universi-
dad Catolica del Ecuador (QCAZ), Museo de Historia Natural
La Salle, Venezuela (MHNLS), and United States National Mu-
seum (USNM). See Appendix for GenBank accession numbers.
The entire ingroup sample includes sequences of 86 individuals
of Lophiohylini (Hylidae; Trueb 1970; Faivovich et al. 2005),
of which 43 were generated by us and 43 were downloaded from
GenBank. The outgroup consists of nine species of the sister clade
Hylini.
Extraction and isolation of DNA, and amplification and se-
quencing of mitochondrial (mtDNA) and nuclear (nDNA) genes
were done using standard techniques. Genomic DNA was ex-
tracted with the Viogene Blood and Tissue Genomic DNA Ex-
traction Kit. Two different polymerase chain reaction protocols
were used, one for the nDNA (the proopiomelanocortin gene
POMC, approx. 460 bp) and another for the mtDNA (12S,
valine tRNA, and 16S; approx. 2400 bp). The T. aecii tissue
was from an old museum specimen, and extraction yielded low
DNA concentrations, so only part of the 12S–16S could be
amplified.
The mtDNA was amplified in four overlapping segments
and using nine primers (MVZ59: 5′ATAGCACTGAAAAYGC
TDAGATG3′ [Goebel 1999, #29], tRNA-phe: 5′GCRCTG
AARATGCTGAGATGARCCC3′ [Goebel 1999, #30], 12LI:
5′AAAAAGCTTCAAACTGGGATTAGATACCCCACTAT3′
[Goebel 1999, #46], 12SM: 5′GGCAAGTCGTAACATGG
TAAG3′ [Pauly et al. 2004], tRNA-val: 5′GGTGTAAGC
GAGAGGCTT3′ [Goebel 1999, #73], 16SH: 5′GCTAG
ACCATKATGCAAAAGGTA3′ [Goebel 1999, #76], 16SC:
5′GTRGGCCTAAAAGCAGCCAC3′ [Pauly et al. 2004], 16SA:
5′ATGTTTTTGGTAAACAGGCG3′ [Goebel 1999, #87], 16SD:
5′CTCCGGTCTGAACTCAGATCACGTAG3′ [Goebel 1999]).
The nDNA was amplified in one fragment (POMCR1: GGCRT-
TYTTGAAWAGAGTCATTAGWGG [Vieites et al. 2007],
POMCF1: ATATGTCATGASCCAYTTYCGCTGGAA [Vieites
et al. 2007]) .
3 0 0 2 EVOLUTION OCTOBER 2012

ENDEMIC FROGS ON ANCIENT TEPUI SUMMITS
The thermocycler protocol for POMC was 2 min at 94˚C
followed by 12 cycles of 30 s at 94˚C, 30 s at 65˚C (–5˚C every
two cycles), and 60 s at 72˚C. The thermocycler protocol for the
mtDNA was 2 min at 94˚C followed by 34 cycles of 30 s at
94˚C, 30 s at 46˚C, and 60 s at 72˚C. Amplified products were
purified using the Viogene Gel-M Extraction Kit. Sequencing was
performed using an ABI3100 PRISM sequencer.
Contiguous sequences were assembled for 12S–16S in Se-
quencher 4.8 and alignments were constructed using ClustalX
2.0 with default parameters (Thompson et al. 1997) followed
by manual editing in MacClade 4.08 (Maddison and Maddison
2001). Several regions in the mitochondrial dataset totaling 194
bases were judged to be unalignable and were excluded.
PHYLOGENETIC ANALYSES
The combined dataset of mtDNA and POMC included 3039 bases.
All individuals were represented in the mtDNA alignment, but se-
quences of POMC were not available for all individuals so three
analyses were performed. The first included 84 ingroup individ-
uals plus outgroups (95 individuals total) with complete mtDNA
data. To minimize missing data, the second included 46 individ-
uals plus seven outgroup species with complete data for mtDNA
and POMC (53 individuals). The third included only POMC se-
quences (53 individuals), so that the nDNA and mtDNA topolo-
gies could be compared. Three partitioning schemes were used
in MrBayes (Ronquist and Huelsenbeck 2003): a single partition
including all data; two partitions, by locus (mtDNA and POMC);
and three partitions, by gene and codon position (separating third
codon position for POMC). Bayes factors were used to deter-
mine the preferred partition (Kass and Raftery 1995), which was
by gene and codon position. This partition was used in all sub-
sequent analyses. The best-fitting model of evolution for each
of the four partitions, GTR + G + I, was determined using MR-
MODELTEST (Nylander 2004). Maximum likelihood analyses were
performed using RAXML using the model GTR + G rather than
GTR + G + I (Stamatakis 2006). Node support was measured
by standard nonparametric bootstrapping (1000 replicates) using
RAXML, and by Bayesian posterior probabilities using MRBAYES
(two independent runs, 10 million generations, sampled every
1000, with burn-in of 1000 out of 10,000 samples). Convergence
and stationarity of runs was assessed in TRACER (Drummond and
Rambaut 2007).
We compared the results for Tepuihyla to another frog group,
Stefania, with similar Pantepui distribution. Stefania is a Pantepui
endemic clade, but only two of the species available on Gen-
Bank occur on tepui summits. We added all available GenBank
data for 12S and 16S (1510 bp total) for five of the 19 described
species of Stefania (Hylidae). The sequences included were the
following: Flectonotus fitzgeraldi (AY819355, DQ679381), Ste-
fania coxi (DQ679265, DQ679415), Stefania ginesi (DQ679266,
DQ679417), Stefania scalae (DQ679267, DQ679418), Stefania
schuberti (AY843768), Stefania evansi (AY843767), and Stefa-
nia evansi (AY819359). The sequences were aligned and analyzed
using the same protocols and programs as for Tepuihyla.
DIVERGENCE TIME ESTIMATES
Divergence times were estimated using BEAST (Drummond and
Rambaut 2007), which allows for simultaneous inference of topol-
ogy and divergence times. We used two general methods of cali-
bration to test for consistency among divergence estimates: fossils
and paleobiogeography, and published substitution rates. The fos-
sil calibrations included five hylid frogs (Smith et al. 2005). These
are problematic for several reasons. First, only one pre-Holocene
fossil is assigned to Lophiohylini (Osteopilus septentrionalis from
the Pleistocene of the Bahamas; Sanchız 1998) and none for the
group under study (Osteocephalus and Tepuihyla). Second, for
many frog fossils, the only recovered elements are ilia; rarely
are even partially articulated frogs found, rendering identification
less certain. Third, assignment of frog fossils to species or genera
is often done from overall similarity rather than evidence of phy-
logenetic relationship from synapomorphies (Bell et al. 2010).
Nonetheless, dates of occurrence of some frog fossils, assigned
only on the basis of general similarity (Holman 1998, 2003) have
been used to calibrate chronograms of hylid frogs (Smith et al.
2005; Lemmon et al. 2007).
We also used a paleobiogeographic calibration to the com-
mon ancestor of Osteopilus and Phyllodytes auratus, using the
GAARlandia or Aves Ridge landbridge hypothesis (Iturralde-
Vinent and MacPhee 1999). GAARlandia is a hypothesized
Caribbean landbridge that connected the Greater Antilles to north-
ern South America between 33 and 35 Ma. The support for this
hypothesis is mixed; some authors support it as a major means of
dispersal to the Caribbean islands (i.e., mammals, spiders, frogs;
Davalos 2004; Crews and Gillespie 2010; Alonso et al. 2012)
whereas others strongly oppose it (Hedges 2006). However, Moen
and Wiens (2009) found that the divergence of Osteopilus from
other mainland Lophiohylini overlapped with the 33–35 Ma time-
frame of this hypothesis. The prior for the GAARlandia node was
drawn from a normal distribution with a mean of 34 Ma and stan-
dard deviation of 1 Ma, based on the proposed range of 33–35 Ma
(Iturralde-Vinent and MacPhee 1999). Although the GAARlandia
hypothesis is highly debated, we believe the inclusion of this cal-
ibration did not bias our results, since it did not change overall es-
timates. Furthermore, it substantially improved the computational
performance of the analysis, in that good effective sample sizes
(ESS > 200) were never reached (>80 M generations) without the
GAARlandia calibration. With the calibrations, we analyzed the
mtDNA dataset only as well as the combined mtDNA and nDNA
datasets. Data partitioning was identical to that in the MRBAYES
analysis.
EVOLUTION OCTOBER 2012 3 0 0 3

PATRICIA E. SALERNO ET AL.
We compared chronograms obtained from fossil and paleo-
biogeographic calibrations to chronograms generated using two
estimates of rates of evolution for anuran mitochondrial 12S and
16S genes, one from Xenopus (0.00249 substitutions per site per
lineage per Myr, hereafter the “Xenopus rate”; Evans et al. 2004)
and one from Pseudacris (0.00277 substitutions per site per lin-
eage per Myr, the “Pseudacris rate”; Lemmon et al. 2007). The
Pseudacris rate also relied in part on the hylid frog fossil cali-
brations (Smith et al. 2005) so it is not independent of our rate
estimates. For these analyses, only the mitochondrial dataset was
used because the published rates of evolution (Evans et al. 2004;
Lemmon et al. 2007) were not estimated using POMC.
The BEAST analyses were run with sufficient generations
(35–60 million) to yield ESS of at least 200 for all parameters.
The GTR + G model was used with uncorrelated lognormal dis-
tributions of branch lengths and with no specification of a prior
tree. Every 1000th generation was sampled, and the first 10%
of the samples were discarded as burn-in based on examination of
all parameter estimates in TRACER. Trees were summarized using
TREEANNOTATOR (in the BEAST package) with the target tree type
set as maximum clade credibility.
The analyses of the Stefania GenBank sequences were con-
ducted similarly as in Tepuihyla/Osteocephalus. Two separate
analyses were performed using the Xenopus and Pseudacris rates.
Given that the Stefania dataset is small (compared to Tepuihyla),
we only used BEAST (and exclude RAxML and MrBayes analy-
ses) to estimate tree topology and divergence times.
ResultsPHYLOGENETIC ANALYSES
Maximum likelihood and Bayesian analyses indicate that species
of Tepuihyla (four out of seven recognized species; 11 individu-
als) form a strongly supported clade for both mitochondrial and
nuclear data (1.0 Bayesian posterior probability, BPP; Figs. 2 and
3; 100% likelihood bootstrap support, BS; Fig. 3). The samples
of Osteocephalus (11 out of 24 species) revealed that Tepuihyla
and Osteocephalus exophthalmus form a strongly supported clade
(100% BS, 1.0 BPP; Figs. 2 and 3) that is the sister group of
all other Osteocephalus. Thus Osteocephalus as currently delim-
ited is paraphyletic, and henceforth, we denote this by referring
to “Osteocephalus” exophthalmus with quotation marks pending
our resolution of this taxonomic issue, which is in progress.
We also analyzed all genera within the Lophiohylini, which
includes Osteocephalus and Tepuihyla. Although the Lophio-
hylini was strongly supported as monophyletic, relationships
among the deeper nodes of the lophiohyline clades (Fig. 3) are
generally poorly supported and our topology is somewhat incon-
sistent with other studies (Salducci et al. 2002; Faivovich et al.
2005; Wiens et al. 2010). However, the sister-group relationship
between Tepuihyla and Osteocephalus holds in all studies.
The divergences among the T. edelcae samples from the sum-
mits of Auyan Tepui and the Chimanta Massif (Fig. 1) are sim-
ilar to the among-species divergences within Tepuihyla. Further,
the mtDNA and nDNA phylogenies are incongruent regarding
the monophyly of T. edelcae. The mtDNA only (Fig. 2) and the
combined mtDNA and POMC (Fig. 3A) topologies both group
T. edelcae from Chimanta as more closely related to the mid-
elevation T. rodriguezi/T. talbergae than to the T. edelcae from
Auyan indicating that T. edelcae is paraphyletic. However, based
on nDNA only (Fig. 3B), T. edelcae is monophyletic, though this
is poorly supported (44 BS, 0.81 BPP). The low variability in
the nuclear locus does not resolve the species-level relationships
within Tepuihyla. Thus, the apparent discrepancy between the
nuclear and mitochondrial trees for T. edelcae might be due to
mitochondrial introgression from recent hybridization between T.
edelcae and T. rodriguezi/T. talbergae or to incomplete lineage
sorting.
DIVERGENCE TIME ESTIMATES
Divergence time estimates based on calibrations from either fos-
sils or substitution rates showed similar results (Fig. 4). Taking
into account all results from different datasets and calibrations,
divergences between the Pantepui-endemic Tepuihyla and its sis-
ter taxon were estimated to be 14.7–23.6 Ma, which is far more
recent than the formation of the tepuis. Furthermore, the oldest es-
timates for the divergence between this clade (Tepuihyla + “O.”
exophthalmus) and Osteocephalus are still at least 20 Ma more re-
cent than tepui formation. Divergences among Tepuihyla species
or populations inhabiting different tepuis are also relatively re-
cent, from 0.7 to 8.1 Ma, with several divergences overlapping
the Quaternary.
The divergence times from the Xenopus estimate were the
oldest, possibly because Xenopus is very distantly related. The
rates found using the hylid fossil calibrations are all in close
agreement, the only difference being that the estimates obtained
from the fossil calibrations (compared to the Pseudacris es-
timate) had much higher variance, probably because none of
the calibrations lies within the group of interest (Tepuihyla and
Osteocephalus). The only calibration within Lophiohylini is the
paleobiogeographic calibration of Osteopilus. Given this, we fo-
cus the discussion on the analysis using the Pseudacris estimate.
Estimated divergence times among Tepuihyla species range from
0.7–5.3 Ma. The oldest node, the split between T. aecii and all
other Tepuihyla, is estimated at 5.3 Ma (Fig. 2, node A). No-
tably, this split corresponds to the geographic division between
the western tepui group and the eastern tepui group (Huber 1988).
Tepuihyla aecii is from Cerro Duida in the western group, and the
remaining species are from the eastern group.
3 0 0 4 EVOLUTION OCTOBER 2012

ENDEMIC FROGS ON ANCIENT TEPUI SUMMITS
B
C
A
Tepuihyla Osteocephalus
Outgroups30
10
20
Myr
0
16.7
9.8
18.8
9.6
5.3
1.0
24.7
14.7
13.0
8.8
4.13.2
0.5 0.7
15.5
*
*
* * **
*
*
**
*
*
*
*
*
*
*
*
*
**
*
*
**
*
**
*
*
O. t
aurin
us
O. a
lbog
utta
tus
O. b
uckl
eyi
O. l
eprie
urii
O. v
erru
cige
r
O. t
aurin
us
O. c
f. ta
urin
us
O. l
eprie
urii
T. ro
drig
uezi
O. m
utab
or
T. ro
drig
uezi
O. t
aurin
us
T. ta
lber
gae
“O.”
exop
htha
lmus
O. o
opha
gus
O. c
abre
rai
O. p
lani
ceps
T. e
delc
ae (A
u)
O. o
opha
gus
O. f
usci
faci
es
O. d
erid
ens
O. y
asun
i
T. e
delc
ae (C
h)
O. s
p.
T. s
p.
T. a
ecii
O. s
p.
19 2021 65 67 69 68 66 70 71 72 74 73 76 75 40 39 37 38 45 48 30 44 41 42 43 35 15 18 23 22 24 25 34 33 32 31 52 26 27 28 36 29 17 16 49 51 50
Figure 2. Divergence time estimates and 95% confidence bars for Tepuihyla (node A), the sister species “O.” exophthalmus (node B),
and their lowland closest relatives, Osteocephalus (node C) for the mtDNA dataset. Divergence estimates of major clades are shown for
outgroups. Estimates were obtained using the Lemmon et al. (2007) rate of substitution. Asterisks indicate Bayesian posterior probabilities
greater than 95%. The tree and estimates were obtained from BEAST. Numbers next to terminal taxa refer to individual specimens in
Appendix.
The youngest split (0.7 Ma) is between T. talbergae (Kaieteur
National Park, Guyana, 366 m, but known from higher elevations)
and T. rodriguezi (Gran Sabana, Venezuela, 800–1200 m); both
species inhabit the lowest elevations known for Tepuihyla. Not
all analyses recovered this poorly supported node; in the mtDNA
tree (Fig. 2) T. rodriguezi was paraphyletic, which suggests either
incomplete lineage sorting, or simply that they are a single species.
We refer to this complex hereafter as T. talbergae/rodriguezi.
The divergence between Tepuihyla and its sister species “O.”
exophthalmus is estimated at 14.7 Ma (Fig. 2; node B), and that
between Tepuihyla + “O.” exophthalmus and Osteocephalus is
estimated at 24.7 Ma (Fig. 2; node C).
The results of the Stefania analyses using the Xenopus and
Pseudacris rates were very similar, so we only report the diver-
gence times from the Pseudacris rate. The deepest divergence
found is 34.4 Ma, between S. ginesi and all other included species
(Fig. 5). The most recent divergence is estimated at 7.1 Ma, be-
tween S. scalae and S. evansi.
DiscussionMONOPHYLY AND DIVERGENCES AMONG TEPUIHYLA
SPECIES
The low divergence estimates among Tepuihyla species (<5.3
Ma) indicate that this Pantepui clade did not speciate under a Lost
World vicariance scenario. Even when accounting for uncertainty
in rates of molecular evolution, credibility intervals, and time
calibrations, it is evident that species diversity within this clade is
not the product of ancient dissection of the Guiana Shield plateau.
Furthermore, the origin of the Pantepui-endemic treefrogs does
not predate the formation of the tepuis, which is another prediction
of the Lost World hypothesis.
EVOLUTION OCTOBER 2012 3 0 0 5

PATRICIA E. SALERNO ET AL.
Figure 3. Maximum likelihood topology for: (A) the combined dataset of 12S, 16S, and POMC (present in all terminals), and (B) the
POMC only dataset. Bootstrap values are shown above the nodes and Bayesian posterior probabilities are shown below. Support values
are omitted for the outgroups for simplicity. Numbers next to terminal taxa refer to individual specimens in Appendix.
3 0 0 6 EVOLUTION OCTOBER 2012

ENDEMIC FROGS ON ANCIENT TEPUI SUMMITS
6
5
43
21
Pseudacris Estimate(0.00277 subs/site/Myr)12S–16S; 35M gen.
Xenopus Estimate(0.00249 subs/site/Myr)12S–16S; 35M gen.
Hylid Fossil Calibrations + GAARlandia12S–16S; 60M gen.
Hylid Fossil Calibrations + GAARlandia12S–16S + POMC; 50M gen.
0.7*0.2–1.4
1.10.3–2.2
0.8*0.2–1.6
0.71.1–1.4
3.21.6–4.9
5.02.5–8.1
3.31.5–5.6
3.41.8–5.4
4.12.4–6.2
6.43.5–9.9
4.42.2–7.1
4.42.4–6.6
5.33.1–7.7
8.14.5–12.4
5.73.0–9.1
5.63.2–8.5
14.79.2–20.2
23.613.4–34.1
17.09.6–24.9
17.110.3–24.3
24.720.8–29.2
41.532.9–51.0
31.126.5–35.0
29.123.5–34.2
Node 1Calibration Node 2 Node 3 Node 4 Node 5 Node 6
T. rodrigueziT. talbergae
“O.” exophthalmus
T. edelcae (Au)T. aecii
T. edelcae (Ch)
Osteocephalus
Figure 4. Divergence time estimates (top) in millions of years and 95% confidence intervals (bottom) obtained in all BEAST analyses
for the main clades of the highland group, Tepuihyla, and its closest relatives, “O.” exophthalmus and Osteocephalus. The clades are
numbered in the simplified cladogram to the right. Node 1 was not always recovered, and thus we report the deepest divergence within
that group and indicate the unrecovered node with ∗. The differences in number of generations in the left column are due to the fact
that different analyses required different numbers of samples to reach stationarity. All divergence time estimates obtained with the
calibrations of the outgroup fall within the 95% confidence intervals obtained with the previously estimated rates of evolution.
Tepui Fragmentation
0.010.020.0Ma
30.040.050.060.070.080.090.0100.0
Stefania scalae
Stefania evansi
F. fitzgeraldi
Stefania schuberti
Stefania evansi
Stefania ginesi
Stefania coxi
49.834.4
4.27.1
20.325.7
Figure 5. Divergence time estimates and 95% confidence intervals for Stefania. Divergence time estimates are shown in millions of
years. Time of tepui fragmentation is shown as a reference. Estimates were obtained using the Lemmon et al. (2007) rate of substitution.
Previous phylogenetic analyses that included lophiohyline
taxa (Faivovich et al. 2005; Wiens et al. 2010) sampled only one
species of Tepuihyla so the monophyly of this group had never
been tested. With our increased sampling (four out of seven recog-
nized species), we found Tepuihyla to be monophyletic. However,
Osteocephalus as currently delimited (Trueb 1970; Faivovich
et al. 2005) is not monophyletic because “O.” exophthalmus was
found to be the sister taxon to Tepuihyla. “Osteocephalus” ex-
ophthalmus is a Pantepui-endemic known from low and middle
elevations in Guyana. In contrast to this clade of Guiana shield en-
demics (i.e., “O.” exophthalmus + Tepuihyla), Osteocephalus is
primarily a lowland Amazonian clade; a few species occur in the
lowlands of the Guiana Shield. Thus, the key node to understand-
ing the divergence of the Pantepui clade is that between Tepuihyla
+ “O.” exophthalmus and Osteocephalus (node 6, Fig. 4).
Tepuihyla + “O.” exophthalmus diverged from Osteo-
cephalus about 24.7 Ma (Figs. 2 and 4, node 6). This timing of sep-
aration between Osteocephalus and Tepuihyla overlaps with that
of a marine incursion into the present Amazon Basin starting in
the Early Miocene, 23–16 Ma (Hoorn 1993). This may explain the
largely allopatric distributions of Osteocephalus and Tepuihyla.
OTHER BIOGEOGRAPHIC HYPOTHESES
Having rejected the Lost World hypothesis for Tepuihyla, it is
now clear that the divergence times among Tepuihyla species re-
quire dispersal between the lowlands and the summits. All three
dispersal hypotheses (Island-Hopping, Habitat Shift, and Vertical
Displacement) generate predictions related to dispersal frequen-
cies and times of divergence. The Island-Hopping hypothesis is
unlikely because island hopping should be a rare event for Tepui-
hyla given its low vagility. In addition, our finding of multiple rel-
atively recent dispersal events is inconsistent with the predictions
of Island Hopping. However, given our estimates of divergence
times and phylogenetic relationships, the biogeographic history
of Tepuihyla does not definitively reject either of the remaining
dispersal hypotheses.
Given the occurrence of Tepuihyla in mostly middle and
high elevations, as well as the recent divergence times, the estab-
lishment of the current distribution probably involved elements
of both the Habitat Shift and Vertical Displacement hypotheses.
Because all known Tepuihyla species are associated with the Pan-
tepui, we infer that the common ancestor of Tepuihyla was also a
Pantepui inhabitant that adapted to these conditions (as the Habitat
EVOLUTION OCTOBER 2012 3 0 0 7

PATRICIA E. SALERNO ET AL.
Shift hypothesis suggests). However, the sympatry of “O.” exoph-
thalmus with T. rodriguezi/T. talbergae throughout their limited
distributions in lower Pantepui elevations of the eastern Guiana
Shield suggests that the association of this clade (“O.” exoph-
thalmus + Tepuihyla) with the tepuis and possible adaptation to
higher elevations occurred as far back as 14.7 Ma (Fig. 2).
It is unlikely that Pleistocene climatic shifts were the only
processes involved in divergences within Tepuihyla. The three
deepest divergences within Tepuihyla predate the Quaternary, sup-
porting the overlooked importance of pre-Quaternary diversifica-
tion (Rull 2008). On the other hand, large confidence intervals
among Tepuihyla divergences that overlap part of the Pleistocene,
plus the small divergences between T. edelcae and T. rodriguezi/T.
talbergae suggest that Pleistocene glacial cycles may have shaped
the current distributions of these species. However, to determine
the general significance of Pleistocene climate fluctuations, ex-
tensive sampling within recently diverged Tepuihyla species is
needed to estimate recent gene flow using coalescent analyses.
COMPARISONS WITH PHYLOGENIES OF OTHER TEPUI
TAXA
This analysis is the first to estimate DNA-based divergence times
of a Pantepui-endemic animal taxon. Our analyses of Tepuihyla re-
cover relatively recently diverged species (Plio-Pleistocene) with
good species sampling (4/7 species). Although small samples of
two other Pantepui frog groups have been analyzed phylogeneti-
cally (Stefania and Ceuthomantis, see below), the only other stud-
ies (to our knowledge) that explicitly treat the historical biogeog-
raphy of a Pantepui clade include members of the Bromeliaceae
and Rapateaceae (Givnish et al. 1997, 2000, 2004, 2011).
Bromeliaceae and Rapateaceae are families of flowering
plants within the order Poales. Within the Rapataceae, the tepui-
endemic crown clade Stegolepidieae (Stegolepis, Amphiphyllum,
and Epidryos) diversified 10 Ma (Givnish et al. 2004). Dispersal,
and not vicariance, is argued to be the principal correlate of diver-
gence among these lineages (Givnish et al. 2004). Furthermore,
the presence of some Stegolepis in lowland as well as intermediate
and summit habitats corroborates recent dispersal.
Similarly, divergence times for many clades within Bromeli-
aceae have been estimated. The most recent common ancestor
of crown-group Bromeliaceae likely inhabited the Pantepui at
19.1 Ma (Givnish et al. 2011: Fig. 7). Brocchinioideae and Lind-
manioideae, the two earliest branching lineages within Bromeli-
aceae, are tepui endemics. The range of divergences between these
clades is 8.9–19.0 Ma. The Bromeliaceae, then, does not owe its
diversification (as a crown group) to the vicariant dissection of
Pantepui, but more likely to late Cenozoic dispersal across a dis-
sected landscape, a scenario similar to that observed for Tepuihyla.
The Pantepui endemic bromeliads in the genus Brocchinia
are incredibly diverse in morphology and ecology (Givnish et al.
1997). This diversity could suggest that this clade is an “ancient”
lineage. However, species within Brocchinia diverged relatively
recently; the age of the crown group is at least 13.1 Ma (Givnish
et al. 2011). Interestingly, Tepuihyla species seem to depend on
water accumulation in phytotelmata of some species of Brocchinia
(B. hectiodes and B. acuminata; Ayarzaguena et al. 1992), but no
hypothesis of co-divergence of Tepuihyla and Brocchinia has been
put forward.
We also examined divergence times of another Pantepui-
endemic group, Stefania, for comparison to the Tepuihyla results.
Stefania, like Tepuihyla, are highly dependent on the phytotelmata
of pitcher plants. However, the reproductive biology of Stefania
is quite distinct in that females are obligate dorsal egg brooders
and the embryos undergo direct development (Salerno and Pauly
2012). In contrast, Tepuihyla have the more common reproductive
mode of depositing eggs in bodies of water with the eggs hatch-
ing into a larval (tadpole) stage that undergoes metamorphosis
(Ayarzaguena et al. 1992). Several authors have suggested that
distributions and phylogenetic relationships in Stefania support a
vicariant speciation scenario following the Lost World hypothe-
sis (Hoogmoed 1979; MacCulloch and Lathrop 2002; McDiarmid
and Donnelly 2005). However, as is the case for most Pantepui
groups, these assessments were based on limited sampling and
distributional data with relationships among individuals solely
based on morphological comparisons. Our analysis of the avail-
able sequences (five out of 19 species) shows that the deepest
divergence within Stefania is 34.4 Ma, and the youngest is 7.1
(Fig. 5). Interestingly, the youngest divergence is found between
two lowland/midland species (S. scalae and S. evansi), which
is the same pattern, though different timing, observed for the
two Tepuihyla lowland/midland clades, T. rodriguezi/T. talbergae.
Furthermore, these two species pairs have similar geographic dis-
tributions, which may indicate shared biogeographic histories.
Even though the divergence estimates for Stefania clades are
on average more deeply diverged than Tepuihyla, Stegolepidae,
Brocchinia, and Lindmania, the divergences within Stefania in-
dicate that this lineage radiated more recently than the dis-
section of the tepui summits (70–90 Ma). Thus, Stefania
follows the general diversification pattern in Tepuihyla and
Bromeliaceae.
Many endemic representatives of the “Lost World” are touted
as “living fossils,” that is, a species or group of species that
was formerly speciose or widespread in time and/or space, but
has suffered extinction (Brown and Lomolino 1998). However,
highly endemic clades are not necessarily “living fossils.” There
is no evidence that the clades Tepuihyla, Stefania, Lindmania,
Brocchinia, and Stegolepidae are remnants of ancient widespread
lineages. These taxa are more appropriately termed neoendemics,
that is, endemic taxa of relatively recent autochthonous origin
(Brown and Lomolino 1998).
3 0 0 8 EVOLUTION OCTOBER 2012
ENDEMIC FROGS ON ANCIENT TEPUI SUMMITS
The frog Ceuthomantis smaragdinus from Mt. Kopinang,
Guyana also is claimed to be a “living fossil” (Heinicke et al.
2009). In contrast to the previous examples, this species is deeply
diverged from its extremely speciose sister taxon at about 60 Ma
(Heinicke et al. 2009). Two other species are tentatively referred
to this genus, but no sequences are available. Although this diver-
gence time is much greater than that of the other taxa considered
here, the divergence of only one species makes it difficult to de-
termine the minimal age at which that lineage (one species) was
present within the Pantepui. Thus, further work is needed to assess
whether this lineage is a paleoendemic.
TEPUIS AS CURRENT PHYSICAL AND ECOLOGICAL
BARRIERS
Many tepuis have sheer cliffs that have been proposed to be phys-
ical barriers to dispersal between low and high elevations, thus
isolating summit taxa (Chapman 1931; Maguire 1970; Hoog-
moed 1979). However, divergences among Tepuihyla species took
place relatively recently, at least 60 Ma after the tepuis were fully
formed, indicating that tepui walls are not a complete physical
barrier between the summits and lowland forest even for organ-
isms with low vagility.
Tepuihyla has an extremely fragmented distribution, but it is
widespread in the Guiana Shield, occurring in three of the four
Tepui provinces (Huber 1988). All species are endemic either to
the summits or to mid-elevation regions of tepui remnants and
are generally found in Rapateaceae- or Bromeliaceae-dominated
meadows (Ayarzaguena et al. 1992). That Tepuihyla is absent
from the lowlands between the tepuis suggests the habitat is cur-
rently unsuitable. Physiological constraints associated with in-
creasing elevation (and thus decreasing temperature and increas-
ing daily and yearly temperature variation) have been shown to
enhance isolation among populations at different elevations, es-
pecially in ectothermic vertebrates (Navas 2006). The drastic el-
evational differences between tepui summits and the surrounding
lowlands result in extreme differences in annual mean tempera-
ture, precipitation, soil composition, and phytogeographic regions
(Steyermark 1979; Huber 2006). Drastic microclimatic and habi-
tat differences between summits and lowlands may create a chal-
lenge for dispersal, thus restricting Tepuihyla to suitable mid- and
high-elevation conditions. However, as stated in the Vertical Dis-
placement hypothesis, these climatic conditions may have been
different in the past, allowing for a more widespread lowland
existence.
Our results indicate that the sheer escarpments of tepuis have
not prevented dispersal of Tepuihyla species across the lowlands
between the summits during the last 5.3 Ma. Furthermore, the first
association of the ancestor of Tepuihyla + “O.” exophthalmus with
the Pantepui likely occurred around 14.7 Ma, which deeply post-
dates tepui fragmentation. Because most Tepuihyla divergences
are during the Pliocene (5.3–2.6 Ma), our results also highlight the
importance of pre-Quaternary speciation (Rull 2008). However,
we cannot completely reject the effects of Pleistocene glaciation,
because the timing of the most recent divergences is consistent
with climatic fluctuations. Our analysis clearly demonstrates dis-
persal of Tepuihyla to and/or from the tepui summits long after
their formation. Furthermore, comparisons to other taxa such as
Stefania and Bromeliaceae seem to indicate that dispersal has oc-
curred across widely different tepui taxa, from pollen-dispersing
plants to low-vagility organisms such as frogs. Thus, even though
the Lost World hypothesis is attractive in nature and has been
largely popular in the literature, so far there is no empirical dataset
that shows unambiguous support for it.
ACKNOWLEDGMENTSWe thank A. Wynn (United States National Museum) for tissue sampleloans, the Ministerio del Poder Popular para el Ambiente (no. 2373,no. 0076, no. 41–0088) and Inparques (no. 0271) for permits, and C.Barrio-Amoros, G. Pauly, and members of the Cannatella laboratory forcomments on the manuscript. This work was supported by funds from theAmerican Philosophical Society, Explorers Club Exploration Grant, andthe Ecology, Evolution and Behavior Graduate Program of the Universityof Texas to PES, and by U.S. National Foundation Grant EF0334952 toDCC and D. M. Hillis.
LITERATURE CITEDAlonso, R., A. J. Crawford, and E. Bermingham. 2012. Molecular phylogeny
of an endemic radiation of Cuban toads (Bufonidae: Peltophryne) basedon mitochondrial and nuclear genes. J. Biogeogr. 39:434–451.
Ayarzaguena, J., J. C. Senaris, and S. Gorzula. 1992. The group Osteocephalus
rodriguezi from the highlands of the Venezuelan Guayana: descriptionof five new species. Mem. Soc. Cien. Natur. La Salle 52:113–142.
Barrio-Amoros, C. L. 2004. Amphibians of Venezuela. Systematic list, distri-bution and references, an update. Rev. Ecol. Lat. Amer. 9:1–48.
Bell, C. J., J. A. Gauthier, and G. S. Bever. 2010. Covert biases, circularity,and apomorphies: a critical look at the North American QuaternaryHerpetofaunal Stability Hypothesis. Quat. Int. 217:30–36.
Berry, P. E. and R. Riina. 2005. Insights on the diversity of the Pantepui floraand the biogeographic complexity of the Guayana Shield. BiologiskeSkrifter 55:145–167.
Briceno, H. O., and C. Schubert. 1990. Geomorphology of the Gran Sabana,Guayana Shield, southeastern Venezuela. Geomorphology 3:125–141.
Briceno, H. O., C. Schubert, and J. Paolini. 1990. Table-mountain geology andsurficial geochemistry: Chimanta Massif, Venezuelan Guayana shield.J. South Amer. Earth Sci. 3:179–194.
Brown, J. H., and M. V. Lomolino. 1998. Biogeography. 2nd ed. SinauerAssociates, Sunderland, MA.
Carnaval, A. C., and C. Moritz. 2008. Historical climate modeling predicts pat-terns of current biodiversity in the Brazilian Atlantic forest. J. Biogeogr.35:1187–1201.
Chapman, F. M. 1931. The upper zonal bird-life of Mts. Roraima and Duida.Bull. Am. Mus. Nat. Hist. 63:1–135.
Crews, S. C., and R. G. Gillespie. 2010. Molecular systematics of Selenops
spiders (Araneae: Selenopidae) from North and Central America: impli-cations for Caribbean biogeography. Biol. J. Linn. Soc. 101:288–322.
Davalos, L. M. 2004. Phylogeny and biogeography of Caribbean mammals.Biol. J. Linn. Soc. 81:373–394.
EVOLUTION OCTOBER 2012 3 0 0 9

PATRICIA E. SALERNO ET AL.
Drummond, A. J., and A. Rambaut. 2007. BEAST: Bayesian evolutionaryanalysis by sampling trees. BMC Evol. Biol. 7:214.
Duellman, W. E. 1999. Patterns of distribution of amphibians: a global per-spective. Johns Hopkins University Press, Baltimore, MD.
Evans, B. J., D. B. Kelley, R. C. Tinsley, D. J. Melnick, and D. C. Cannatella.2004. A mitochondrial DNA phylogeny of African clawed frogs: phy-logeography and implications for polyploid evolution. Mol. Phylogenet.Evol. 33:197–213.
Faivovich, J., C. F. B. Haddad, P. C. A. Garcia, D. R. Frost, J. A. Campbell,and W. C. Wheeler. 2005. Systematic review of the frog family Hylidae,with special reference to Hylinae: phylogenetic analysis and taxonomicrevision. Bull. Amer. Mus. Nat. Hist. 294:1–240.
Galbreath, K. E., D. J. Hafner, and K. R. Zamudio. 2009. When cold is better:climate-driven elevation shifts yield complex patterns of diversificationand demography in an alpine specialist (American Pika, Ochotona prin-
ceps). Evolution 63:2848–2863.Gibbs, A. K., and C. N. Barron. 1993. The geology of the Guiana Shield.
Oxford Univ. Press, Oxford, U.K.Givnish, T. J., K. Sytsma, J. F. Smith, W. J. Hahn, D. H. Benzing,
and E. M. Burkhardt. 1997. Molecular evolution and adaptive radia-tion in Brocchinia (Bromeliaceae: Pitcairnioideae) atop tepuis of theGuayana Shield. Pp. 259–312 in T. J. Givnish and K. J. Sytsma, eds.Molecular evolution and adaptive radiation. Univ. Press, Cambridge,Cambridge, U.K.
Givnish T. J., T. M. Evans, M. L. Zjhra, T. B. Patterson, P. E. Berry, and K. J.Sytsma. 2000. Molecular evolution, adaptive radiation, and geographicdiversification in the amphiatlantic family Rapateaceae: evidence fromndhF sequences and morphology. Evolution 54:1915–1937.
Givnish, T. J., K. C. Millam, T. M. Evans, L. C. Hall, J. C. Pires, P. E. Berry, andK. J. Sytsma. 2004. Ancient vicariance or recent long-distance dispersal?Inferences about phylogeny and South American-African disjunctionsin Rapateaceae and Bromeliaceae based on ndhF sequence data. Int. J.Plant Sci. 165(Suppl.):S35–S54.
Givnish, T. J., M. H. J. Barfuss, B. Van Ee, K. Schulte, R. Horres, P. A. Gon-siska, R. S. Jabaily, D. M. Crayn, J. A. Smith, K. Winter, et al. 2011. Phy-logeny, adaptive radiation, and historical biogeography in Bromeliaceae:insights from an eight-locus plastid phylogeny. Am. J. Bot. 98:872–895.
Goebel, A. M., J. M. Donnelly, and M. E. Atz. 1999. PCR primers and amplifi-cation methods for 12S ribosomal DNA, the control region, cytochromeoxidase I, and cytochrome b in bufonoids and all other frogs, an overviewof PCR primers which have amplified DNA in amphibians successfully.Mol. Phylogenet. Evol. 11:163–199.
Haffer, J. 1969. Speciation in Amazonian forest birds. Science 165:131–137.Hedges, S. B. 2006. Paleogeography of the Antilles and origin of West Indian
terrestrial vertebrates. Ann. Miss. Bot. Gard. 93:231–244.Heinicke, M. P., W. E. Duellman, L. Trueb, D. B. Means, R. D. MacCulloch,
and S. B. Hedges. 2009. A new frog family (Anura: Terrarana) fromSouth America and an expanded direct-developing clade revealed bymolecular phylogeny. Zootaxa 2211:1–35.
Holman, J. A. 1998. Pleistocene amphibians and reptiles in Britain and Europe.Oxford Univ. Press, New York.
———. 2003. Fossil frogs and toads of North America. Indiana Univ. Press,Bloomington, IN.
Hoogmoed, M. S. 1979. The herpetofauna of the Guianan region. Pp. 241–280in W. E. Duellman, ed. The South American herpetofauna: its origin,evolution and dispersal Monogr. Mus. Nat. Hist. Univ. Kansas 7:1–485.
Huber, O. 1987. Consideraciones sobre el concepto de Pantepui. Pantepui2:2–10.
———. 1988. Guayana highlands versus Guayana lowlands, a reappraisal.Taxon 37:595–614.
———. 2006. Herbaceous ecosystems on the Guayana Shield, a regionaloverview. J. Biogeogr. 33:464–475.
Hughes, C., and R. Eastwood. 2006. Island radiation on a continental scale:exceptional rates of plant diversification after uplift of the Andes. Proc.Natl. Acad. Sci. USA 103:10334–10339.
Hooghiemstra, H., and T. Van der Hammen. 2004. Quaternary ice-age dynam-ics in the Colombian Andes: developing an understanding of our legacy.Phil. Trans. R. Soc. Lond. B 359:173–181.
Hoorn, C. 1993. Marine incursions and the influence of Andean tectonicson the Miocene depositional history of northwestern Amazonia: resultsof a palynostratigraphic study. Palaeogeogr. Palaeoclimatol. Palaeoecol.105:267–309.
Iturralde-Vinent, M. A., and R. MacPhee. 1999. Paleogeography of theCaribbean region: implications for Cenozoic biogeography. Bull. Amer.Mus. Nat. Hist. 238:1–95.
Jaffe, K., J. Lattke, and R. Perez Hernandez. 1993. Ants on the tepuis of theGuiana Shield: a zoogeographic study. Ecotropicos 6:22–29.
Johnson, N. K., and C. Cicero. 2004. New mitochondrial DNA data affirm theimportance of Pleistocene speciation in North American birds. Evolution58:1122–1130.
Kass R. E., and A. E. Raftery. 1995. Bayes factors. J. Amer. Statist. Assoc.90:773–795.
Knowles, L. L. 2000. Tests of Pleistocene speciation in montane grasshoppers(genus Melanoplus) from the sky islands of western North America.Evolution 54:1337–1348.
Lemmon, E. M., A. R. Lemmon, and D. C. Cannatella. 2007. Geological andclimatic forces driving speciation in the continentally distributed trillingchorus frogs (Pseudacris). Evolution 61:2086–2103.
MacCulloch, R. D., and A. Lathrop. 2002. Exceptional diversity of Stefania
(Anura: Hylidae) on Mount Ayanganna, Guyana: three new species andnew distribution records. Herpetologica 58:327–346.
Maddison, D., and W. Maddison. 2001. MacClade 4: analysis of phy-logeny and character evolution. Version 4.08. Sinauer Associates,Sunderland, MA.
Maguire, B. 1970 On the flora of the Guayana Highland. Biotropica 2:85–100.Mayr, E., and W. H. Phelps. 1967. The origin of the bird fauna of the south
Venezuelan highlands. Bull. Am. Mus. Nat. Hist. 136:273–327.Mayr, E. and R. J. O’Hara. 1986. The biogeographic evidence supporting the
Pleistocene forest refuge hypothesis. Evolution 40:55–67.McDiarmid, R. W., and M. A. Donnelly. 2005. The herpetofauna of the
Guayana highlands: amphibians and reptiles of the Lost World. Pp.461–560 in M. A. Donnelly, B. I. Crother, C. Guyer, M. H. Wake, andM. E. White, eds. Ecology and evolution in the tropics: a herpetologicalperspective. Univ. Chicago Press, Chicago, IL.
Moen, D. S., and J. J. Wiens. 2009. Phylogenetic evidence for competitivelydriven divergence: body-size evolution in Caribbean treefrogs (Hylidae:Osteopilus). Evolution 63:195–214.
Navas, C. A. 2006. Patterns of distribution of anurans in high Andean tropi-cal elevations: insights from integrating biogeography and evolutionaryphysiology. Integr. Comp. Biol. 46:82–91.
Noonan, B. P., and P. Gaucher. 2005. Phylogeography and demography ofGuianan harlequin toads (Atelopus): diversification within a refuge. Mol.Ecol. 14:3017–3031.
———. 2006. Refugial isolation and secondary contact in the Dyeing PoisonFrog Dendrobates tinctorius. Mol. Ecol. 15:4425–4435.
Nylander, J. A. A. 2004. MrModeltest v2. Evolutionary Biology Centre,Uppsala Univ., Uppsala.
Orme, C., R. Davies, M. Burgess, F. Eigenbrod, N. Pickup, V. Olson, A.Webster, T. Ding, P. Rasmussen, and R. Ridgely. 2005. Global hotspotsof species richness are not congruent with endemism or threat. Nature436:1016–1019.
3 0 1 0 EVOLUTION OCTOBER 2012

ENDEMIC FROGS ON ANCIENT TEPUI SUMMITS
Pauly, G., D. Hillis, and D. Cannatella. 2004. The history of a Nearcticcolonization: molecular phylogenetics and biogeography of the Nearctictoads (Bufo). Evolution 58:2517–2535
Ronquist, F., and J. P. Huelsenbeck. 2003. MrBayes 3: Bayesianphylogenetic inference under mixed models. Bioinformatics 19:1572–1574.
Rull, V. 2004a. An evaluation of the Lost World and Vertical Displacementhypotheses in the Chimanta Massif, Venezuelan Guayana. Glob. Ecol.Biogeogr. 13:141–148.
———. 2004b. Is the “Lost World” really lost? Palaeoecological insights intothe origin of the peculiar flora of the Guayana Highlands. Naturwis-senschaften 91:139–142.
———. 2004c. Biogeography of the Lost World, a palaeoecological perspec-tive. Earth-Sci. Rev. 67:125–137.
———. 2005. Biotic diversification in the Guayana Highlands: a proposal. J.Biogeogr. 32:921–927.
———. 2008. Speciation timing and Neotropical biodiversity: the Tertiary-Quaternary debate in the light of molecular phylogenetic evidence. Mol.Ecol. 17:2722–2729.
Rull, V., and S. Nogue. 2007. Potential migration routes and barriers for vas-cular plants of the Neotropical Guyana Highlands during the Quaternary.J. Biogeogr. 34:1327–1341.
Salducci, M. D., C. Marty, R. Chappaz, and A. Gilles. 2002. Molecularphylogeny of French Guiana Hylinae: implications for the systematicand biodiversity of the Neotropical frogs. Comptes Rendus Biol. 325:141–153.
Salerno, P. E., and G. B. Pauly. 2012. Clutch size variation in egg-broodingStefania. South Amer. J. Herp. 7:47–54.
Sanchız, B. 1998. Salientia. Vol. 4. Verlag F. Pfeil, Munchen, Germany.Smith, S. A., P. R. Stephens, and J. J. Wiens. 2005. Replicate patterns of
species richness, historical biogeography, and phylogeny in Holarctictreefrogs. Evolution 59:2433–2450.
Stamatakis, A. 2006. RAxML-VI-HPC: maximum likelihood-based phyloge-netic analyses with thousands of taxa and mixed models. Bioinformatics22:2688–2690.
Steyermark, J. A. 1979. Flora of the Guayana Highland: endemicity of thegeneric flora of the summits of the Venezuela tepuis. Taxon 28:45–54.
Thompson, J. D., T. J. Gibson, F. Plewniak, F. Jeanmougin, and D. G. Higgins.1997. The CLUSTAL_X windows interface: flexible strategies for mul-tiple sequence alignment aided by quality analysis tools. Nucleic AcidsRes. 25:4876–4882.
Trueb, L. 1970. Evolutionary relationships of casque-headed tree frogs withco-ossified skulls (family Hylidae). Univ. Kans. Publ. Mus. Nat. Hist.18:547–716.
Vieites, D. R., M. S. Min, and D. B. Wake. 2007. Rapid diversification anddispersal during periods of global warming by plethodontid salamanders.Proc. Natl. Acad. Sci. USA 104:19903–19907.
Wiens, J. J., C. A. Kuczynski, X. Hua, and D. S. Moen. 2010. An expandedphylogeny of treefrogs (Hylidae) based on nuclear and mitochondrialsequence data. Mol. Phylogenet. Evol. 55:871–882.
Associate Editor: B. Fitzpatrick
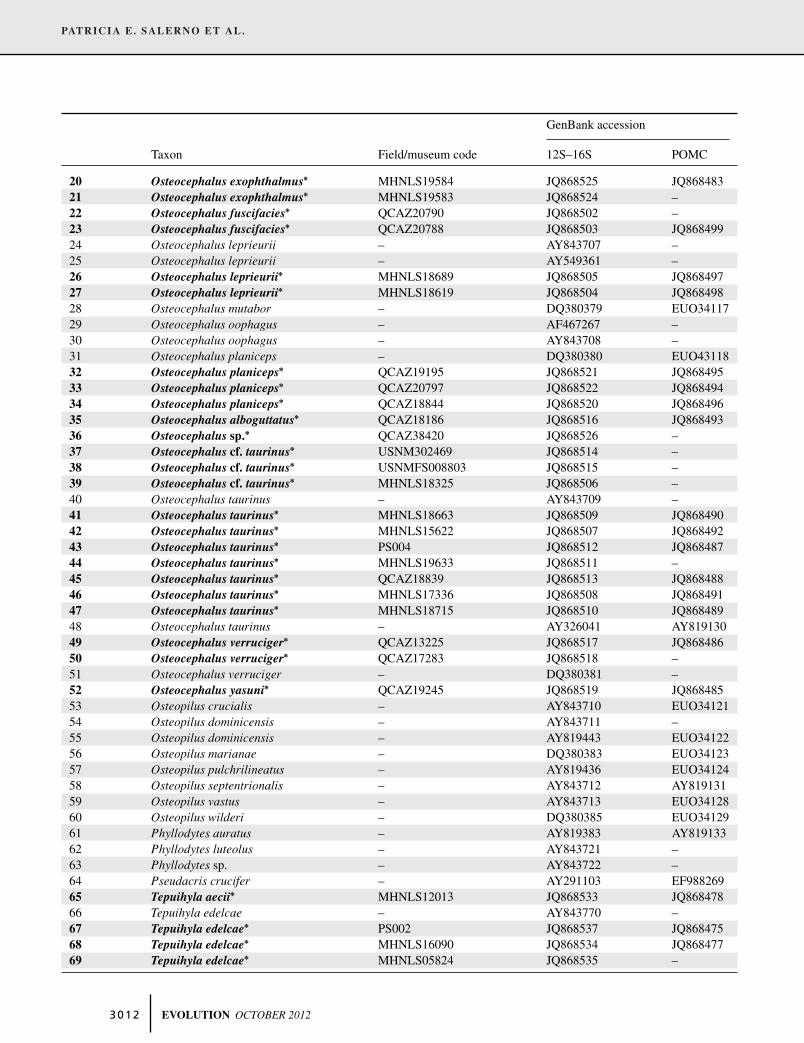
AppendixList of specimens. Specimens that were sequenced are bold and
marked with an asterisk. All other specimens were obtained from
GenBank. Field/museum codes are only shown for specimens se-
quenced herein. Field numbers correspond to Brice P. Noonan
(BPN) and Patricia Salerno (PS). [Corrections added after on-
line publication May 4, 2012: the numbers in column one of the
Appendix were updated].
GenBank accession
Taxon Field/museum code 12S–16S POMC
1 Acris crepitans – EF566969 AY8191092 Aparasphenodon brunoi – AY843567 –3 Argenteohyla siemersi – AY843570 –4 Corythomantis greeningi – AY843578 –5 Hyla arborea – AY843601 DQ577876 Hyla arenicolor – EF566960 –7 Hyla cinerea – AY680271 AY8191168 Hyla gratiosa – AY843630 GQ3749159 Hyla meridionalis – EF566953 GQ37491510 Hyla squirella – AY843678 AY81912011 Hyla versicolor – EF566953 DQ5580512 Itapotihyla langsdorffii – AY843706 AY84370613 Itapotihyla langsdorffii∗ USNM303287 JQ686500 JQ86847014 Nyctimantis rugiceps – AY843781 –15 Osteocephalus alboguttatus – DQ380347 –16 Osteocephalus buckleyi – DQ380378 EUO3411617 Osteocephalus cabrerai – AY843705 –18 Osteocephalus deridens∗ QCAZ20868 JQ868501 JQ86848419 Osteocephalus exophthalmus∗ BPN166 JQ868523 –
EVOLUTION OCTOBER 2012 3 0 1 1
PATRICIA E. SALERNO ET AL.
GenBank accession
Taxon Field/museum code 12S–16S POMC
20 Osteocephalus exophthalmus∗ MHNLS19584 JQ868525 JQ86848321 Osteocephalus exophthalmus∗ MHNLS19583 JQ868524 –22 Osteocephalus fuscifacies∗ QCAZ20790 JQ868502 –23 Osteocephalus fuscifacies∗ QCAZ20788 JQ868503 JQ86849924 Osteocephalus leprieurii – AY843707 –25 Osteocephalus leprieurii – AY549361 –26 Osteocephalus leprieurii∗ MHNLS18689 JQ868505 JQ86849727 Osteocephalus leprieurii∗ MHNLS18619 JQ868504 JQ86849828 Osteocephalus mutabor – DQ380379 EUO3411729 Osteocephalus oophagus – AF467267 –30 Osteocephalus oophagus – AY843708 –31 Osteocephalus planiceps – DQ380380 EUO4311832 Osteocephalus planiceps∗ QCAZ19195 JQ868521 JQ86849533 Osteocephalus planiceps∗ QCAZ20797 JQ868522 JQ86849434 Osteocephalus planiceps∗ QCAZ18844 JQ868520 JQ86849635 Osteocephalus alboguttatus∗ QCAZ18186 JQ868516 JQ86849336 Osteocephalus sp.∗ QCAZ38420 JQ868526 –37 Osteocephalus cf. taurinus∗ USNM302469 JQ868514 –38 Osteocephalus cf. taurinus∗ USNMFS008803 JQ868515 –39 Osteocephalus cf. taurinus∗ MHNLS18325 JQ868506 –40 Osteocephalus taurinus – AY843709 –41 Osteocephalus taurinus∗ MHNLS18663 JQ868509 JQ86849042 Osteocephalus taurinus∗ MHNLS15622 JQ868507 JQ86849243 Osteocephalus taurinus∗ PS004 JQ868512 JQ86848744 Osteocephalus taurinus∗ MHNLS19633 JQ868511 –45 Osteocephalus taurinus∗ QCAZ18839 JQ868513 JQ86848846 Osteocephalus taurinus∗ MHNLS17336 JQ868508 JQ86849147 Osteocephalus taurinus∗ MHNLS18715 JQ868510 JQ86848948 Osteocephalus taurinus – AY326041 AY81913049 Osteocephalus verruciger∗ QCAZ13225 JQ868517 JQ86848650 Osteocephalus verruciger∗ QCAZ17283 JQ868518 –51 Osteocephalus verruciger – DQ380381 –52 Osteocephalus yasuni∗ QCAZ19245 JQ868519 JQ86848553 Osteopilus crucialis – AY843710 EUO3412154 Osteopilus dominicensis – AY843711 –55 Osteopilus dominicensis – AY819443 EUO3412256 Osteopilus marianae – DQ380383 EUO3412357 Osteopilus pulchrilineatus – AY819436 EUO3412458 Osteopilus septentrionalis – AY843712 AY81913159 Osteopilus vastus – AY843713 EUO3412860 Osteopilus wilderi – DQ380385 EUO3412961 Phyllodytes auratus – AY819383 AY81913362 Phyllodytes luteolus – AY843721 –63 Phyllodytes sp. – AY843722 –64 Pseudacris crucifer – AY291103 EF98826965 Tepuihyla aecii∗ MHNLS12013 JQ868533 JQ86847866 Tepuihyla edelcae – AY843770 –67 Tepuihyla edelcae∗ PS002 JQ868537 JQ86847568 Tepuihyla edelcae∗ MHNLS16090 JQ868534 JQ86847769 Tepuihyla edelcae∗ MHNLS05824 JQ868535 –
3 0 1 2 EVOLUTION OCTOBER 2012

ENDEMIC FROGS ON ANCIENT TEPUI SUMMITS
GenBank accession
Taxon Field/museum code 12S–16S POMC
70 Tepuihyla edelcae∗ PS001 JQ868536 JQ86847671 Tepuihyla edelcae∗ PS268 JQ868538 –72 Tepuihyla rodriguezi∗ PS003 JQ868540 JQ86847473 Tepuihyla rodriguezi∗ MHNLS19575 JQ868539 –74 Tepuihyla sp. – DQ380389 EUO3413175 Tepuihyla talbergae∗ BPN1101 JQ868541 –76 Tepuihyla talbergae∗ BPN1219 JQ868542 JQ86847377 Trachycephalus coriaceus – DQ380386 EUO3413078 Trachycephalus hadroceps – AY843717 –79 Trachycephalus jordani∗ QCAZ17509 JQ868527 JQ86847180 Trachycephalus jordani – AY819395 AY81914581 Trachycephalus jordani – AY326042 –82 Trachycephalus jordani – AY843771 –83 Trachycephalus mesophaeus – AY843718 –84 Trachycephalus nigromaculatus – AY843772 –85 Trachycephalus resinifictrix∗ QCAZ20808 JQ868528 JQ86848186 Trachycephalus resinifictrix – AY843719 –87 Trachycephalus resinifictrix∗ QCAZ19304 JQ868529 JQ86848288 Trachycephalus sp.∗ QCAZ21282 JQ868530 JQ86847989 Trachycephalus venulosus∗ QCAZ21283 JQ868531 JQ86848090 Trachycephalus venulosus∗ PS013 JQ868532 JQ86847291 Trachycephalus venulosus – AY549362 –92 Trachycephalus venulosus – AY326048 –93 Trachycephalus venulosus – AY819382 –94 Trachycephalus venulosus – DQ347027 –95 Trachycephalus venulosus – AY364350 –
EVOLUTION OCTOBER 2012 3 0 1 3