High mitochondrial diversity within and among populations of Malagasy poison frogs
13
High mitochondrial diversity within and among populations of Malagasy poison frogs Miguel Vences, a, * Ylenia Chiari, b Liliane Raharivololoniaina, c and Axel Meyer b a Institute for Biodiversity and Ecosystem Dynamics, Zoological Museum, University of Amsterdam, P.O. Box 94766, Amsterdam 1090 GT, The Netherlands b Department of Biology (Evolutionary Biology), University of Konstanz, Constance 78457, Germany c D epartement de Biologie Animale, Universit e d’Antananarivo, Antananarivo 101, Madagascar Received 17 January 2003; revised 12 May 2003 Abstract The diurnal, brightly colored, and toxic frogs of the genus Mantella are among the most prominent representatives of the en- demic anuran fauna of Madagascar. Especially three closely related species, M. aurantiaca, M. crocea, and M. milotympanum, are intensively collected for the pet trade, although basic data on their natural history and genetic diversity are still lacking. Our phylogenetic analyses based on 2.8 kbp of partial 16S rRNA, 12S rRNA, cytochrome b, and rhodopsin DNA sequences confirmed that these species belong to one of the five major clades in Mantella, the M. madagascariensis group. A haplotype network con- structed using 830 bp of cytochrome b in 49 individuals from seven populations revealed that M. milotympanum and M. crocea have largely similar haplotypes sharing, confirming doubts about the species validity of M. milotympanum and indicating independent evolution of bright orange pattern in M. milotympanum and M. aurantiaca. Further, clustering of four individuals of M. aurantiaca from Andranomena with M. crocea suggests incomplete lineage sorting or introgression resulting from secondary contact of refugial populations. AMOVA confirmed significant intrapopulation nucleotide diversity (>20%). These diversity patterns and our field observations indicate relatively large population sizes. Hence, overcollecting is probably a minor problem and conservation efforts should rather focus on saving some large populations from habitat destruction through logging and forest fires. Ó 2003 Elsevier Inc. All rights reserved. Keywords: Amphibia; Mantellidae; Mantella; Phylogeny; Conservation; Population differentiation; Color pattern; 16S rRNA; 12S rRNA; Cytochrome b; Rhodopsin 1. Introduction MadagascarÕs biotas are characterised by extremely high levels of endemism and a high species diversity. The almost 200 nominal species of Malagasy amphibians currently recognised show a degree of endemism greater than 99% (Glaw and Vences, 2000). Because the rates of habitat destruction in Madagascar are alarming (Green and Sussman, 1990), the region has been classified as one of the most important ÔhotspotsÕ for conservation of biodiversity (Myers et al., 2000). Malagasy frogs belong to a number of endemic clades. The most species-rich of these is the family Mantellidae, which currently contains about 130 species. Malagasy poison frogs, classified as genus Mantella in the Mantellidae, thus far comprise 17 species of di- urnal, terrestrial frogs of mostly aposematic coloration (Vences et al., 1999). Similar to several other groups of aposematic frogs, Mantella are characterised by toxic skin alkaloids (Daly et al., 1996), which probably ac- cumulate through the uptake of arthropod prey (Daly et al., 1997). In conjunction with morphological features related to the feeding mechanism, and complex mating strategies and behaviour, these features imply a re- markable case of convergence with the poison-dart frogs (Dendrobatidae) of South and Central America (Cald- well, 1996; Summers and Clough, 2001; Vences et al., 1998a). Such unusual characteristics have resulted in Molecular Phylogenetics and Evolution 30 (2004) 295–307 MOLECULAR PHYLOGENETICS AND EVOLUTION www.elsevier.com/locate/ympev * Corresponding author. Fax: +31-20-525-7238. E-mail address: [email protected] (M. Vences). 1055-7903/$ - see front matter Ó 2003 Elsevier Inc. All rights reserved. doi:10.1016/S1055-7903(03)00217-3
-
Upload
tu-braunschweig -
Category
Documents
-
view
0 -
download
0
Transcript of High mitochondrial diversity within and among populations of Malagasy poison frogs

MOLECULARPHYLOGENETICSAND
Molecular Phylogenetics and Evolution 30 (2004) 295–307
EVOLUTION
www.elsevier.com/locate/ympev
High mitochondrial diversity within and among populationsof Malagasy poison frogs
Miguel Vences,a,* Ylenia Chiari,b Liliane Raharivololoniaina,c and Axel Meyerb
a Institute for Biodiversity and Ecosystem Dynamics, Zoological Museum, University of Amsterdam, P.O. Box 94766,
Amsterdam 1090 GT, The Netherlandsb Department of Biology (Evolutionary Biology), University of Konstanz, Constance 78457, Germany
c D�epartement de Biologie Animale, Universit�e d’Antananarivo, Antananarivo 101, Madagascar
Received 17 January 2003; revised 12 May 2003
Abstract
The diurnal, brightly colored, and toxic frogs of the genus Mantella are among the most prominent representatives of the en-
demic anuran fauna of Madagascar. Especially three closely related species, M. aurantiaca, M. crocea, and M. milotympanum, are
intensively collected for the pet trade, although basic data on their natural history and genetic diversity are still lacking. Our
phylogenetic analyses based on 2.8 kbp of partial 16S rRNA, 12S rRNA, cytochrome b, and rhodopsin DNA sequences confirmed
that these species belong to one of the five major clades in Mantella, the M. madagascariensis group. A haplotype network con-
structed using 830 bp of cytochrome b in 49 individuals from seven populations revealed that M. milotympanum and M. crocea have
largely similar haplotypes sharing, confirming doubts about the species validity of M. milotympanum and indicating independent
evolution of bright orange pattern in M. milotympanum and M. aurantiaca. Further, clustering of four individuals of M. aurantiaca
from Andranomena withM. crocea suggests incomplete lineage sorting or introgression resulting from secondary contact of refugial
populations. AMOVA confirmed significant intrapopulation nucleotide diversity (>20%). These diversity patterns and our field
observations indicate relatively large population sizes. Hence, overcollecting is probably a minor problem and conservation efforts
should rather focus on saving some large populations from habitat destruction through logging and forest fires.
� 2003 Elsevier Inc. All rights reserved.
Keywords: Amphibia; Mantellidae; Mantella; Phylogeny; Conservation; Population differentiation; Color pattern; 16S rRNA; 12S rRNA;
Cytochrome b; Rhodopsin
1. Introduction
Madagascar�s biotas are characterised by extremely
high levels of endemism and a high species diversity. The
almost 200 nominal species of Malagasy amphibianscurrently recognised show a degree of endemism greater
than 99% (Glaw and Vences, 2000). Because the rates of
habitat destruction in Madagascar are alarming (Green
and Sussman, 1990), the region has been classified as
one of the most important �hotspots� for conservation of
biodiversity (Myers et al., 2000). Malagasy frogs belong
to a number of endemic clades. The most species-rich of
* Corresponding author. Fax: +31-20-525-7238.
E-mail address: [email protected] (M. Vences).
1055-7903/$ - see front matter � 2003 Elsevier Inc. All rights reserved.
doi:10.1016/S1055-7903(03)00217-3
these is the family Mantellidae, which currently contains
about 130 species.
Malagasy poison frogs, classified as genus Mantella
in the Mantellidae, thus far comprise 17 species of di-
urnal, terrestrial frogs of mostly aposematic coloration(Vences et al., 1999). Similar to several other groups of
aposematic frogs, Mantella are characterised by toxic
skin alkaloids (Daly et al., 1996), which probably ac-
cumulate through the uptake of arthropod prey (Daly
et al., 1997). In conjunction with morphological features
related to the feeding mechanism, and complex mating
strategies and behaviour, these features imply a re-
markable case of convergence with the poison-dart frogs(Dendrobatidae) of South and Central America (Cald-
well, 1996; Summers and Clough, 2001; Vences et al.,
1998a). Such unusual characteristics have resulted in

296 M. Vences et al. / Molecular Phylogenetics and Evolution 30 (2004) 295–307
Mantella being highly priced by hobbyists, particularlythe more brilliantly colored species, such that large
numbers of specimens are exported from Madagascar
every year (Behra, 1993). In a concerted effort to mon-
itor the trade, all Mantella species have been placed on
Appendix II of the Convention on International Trade
in Endangered Species of Wild Fauna and Flora
(CITES). Some species (M. aurantiaca, M. crocea, M.
bernhardi, M. cowani, M. viridis, and M. expectata) areconsidered to merit high conservation priority (Rax-
worthy and Nussbaum, 2000; Vences et al., 1999),
mainly because of their limited distribution areas (for
distribution maps, see Vences et al., 1999). Malagasy
amphibians are known to be vulnerable to forest frag-
mentation (Vallan, 2000, 2002) although data for
Mantella are so far lacking.
To determine conservation priorities and effectivelymanage an endangered taxon, it is important to under-
stand the taxonomy and evolutionary history of the
group to which it belongs. Although several Mantella
species are easily distinguished based on their coloration
patterns, previous studies on osteology (Vences et al.,
1998b), allozymes (Vences et al., 1998c), and karyologi-
cal data (Odierna et al., 2001; Pintak et al., 1998) have
either produced conflicting phylogenetic results or anunsatisfactory level of resolution. This is particularly
true of the Golden Mantella (Mantella aurantiaca),
which is the most distinctive representative of its genus,
and a well-established flagship species for habitat con-
servation in central eastern Madagascar (Zimmermann,
1996). Even now, only the Torotorofotsy swamp and its
surroundings have been reliably reported as locality for
this species, and its relationships to other species remainunclear. Allozyme data (Vences et al., 1998c) and anal-
ysis of mitochondrial 16S rRNA sequences (Schaefer
et al., 2002) suggest that M. aurantiaca forms a well-
corroborated clade with four other species, M. crocea,
M.milotympanum,M. madagascariensis, andM. pulchra,
but conflicting results were obtained on the relationships
within this clade which was named the M. madagascar-
iensis group (Schaefer et al., 2002). This group is char-acterised by a high diversity in color phenotypes
exemplified by the black and yellow M. madagascarien-
sis, the uniformly golden-orange M. aurantiaca, and the
more cryptic M. crocea.
The goal of this study was to contribute to the
knowledge on phylogenetic relationships of, and phy-
logeography within, the species of the M. madagascari-
ensis group. To this end, we produced a highly resolvedphylogeny for 15 Mantella species based on 2.8 kbp of
mitochondrial and nuclear genes. In addition, we ex-
amined haplotype variation in the cytochrome b gene
both among and within seven populations of the group,
encompassing the complete known distribution area of
M. aurantiaca, M. crocea, and M. milotympanum. We
discuss these data not only to provide a framework on
which to base future conservation efforts, but also tofurther our understanding of speciation processes and
character evolution in aposematic amphibians.
2. Materials and methods
2.1. Sampling localities and methods
Specimens from 15 species comprising 5 species
groups (as defined in Schaefer et al., 2002), including the
Mantella betsileo group (M. betsileo, M. aff. betsileo, M.
expectata, and M. viridis), the M. cowani group (M.
cowani, M. nigricans, M. haraldmeieri, and M. baroni),
the M. madagascariensis group (M. aurantiaca, M. cro-
cea, M. milotympanum, M. madagascariensis, and M.
pulchra), the M. bernhardi group (M. bernhardi), and theM. laevigata group (M. laevigata), were available from
previous studies (Schaefer et al., 2002; Vences et al.,
1998c). The family Mantellidae contains five genera
(Aglyptodactylus, Boophis, Laliostoma, Mantella, and
Mantidactylus), all of which are endemic to the Mala-
gasy region (Vences and Glaw, 2001).Mantella is known
to be nested within the paraphyletic Mantidactylus and
species of the subgenus Blommersia are the sister groupof Mantella (Schaefer et al., 2002). One of these Blom-
mersia species, Mantidactylus wittei, was used as the
outgroup in our study.
Fieldwork was carried out in December 2001 during
which six populations were sampled and geographical
coordinates and the altitude above sea level were re-
corded using GPS instruments: (1) Sahamarolambo
forest, south of Fierenana (M. milotympanum),18�3203600E, 48�2605600S; 948m; (2) Ihofa, west of
Mantadia National Park (M. crocea), 18�4600600S,48�2201800E; 1017m; (3) forest east of Ambohimanarivo
(M. crocea), 18�4803400S, 48�1605200E; 1057m; (4) To-
rotorofotsy, swamp site 1 (M. aurantiaca), 18�5202900S,48�2202100E; 960m; (5) Torotorofotsy, swamp site 2,
north of Maromitsinjo (M. aurantiaca), 18�5101900S,48�2103600E; 950m; and (6) Andromena forest at Sa-marirana river (M. aurantiaca), 19�01:50S, 48�10:00E;921m. These localities extend along a north-south
stretch of ca. 70 km in central eastern Madagascar
(Fig. 1) that encompasses the complete distribution ar-
eas of all three species. No other localities of these
species are reliably known at present.
All specimens captured could be unambiguously
identified using the determination key of Vences et al.(1999). From each population, 7–40 Mantella individu-
als were collected, their sex and snout–vent length re-
corded, and released after clipping off 1–2 toes of each
specimen. Samples of M. madagascariensis were ob-
tained from the pet trade in Madagascar; all were
collected in the Marolambo region on the same day by
the same local collector, and therefore were likely to

Fig. 1. Map of central eastern Madagascar with sampled populations
of the M. madagascariensis group. Dark grey, lake or swamp areas;
light grey, rainforest cover according to maps of the National Geo-
graphic Institute (FTM) of Madagascar (the present rainforest area is
much further reduced according to recent satellite pictures), major
roads in black. Localities are numbered as follows. M. milotympanum:
1, Fierenana; M. crocea: 2, Ihofa; 3, Ambohimanarivo; M. aurantiaca:
4–5, Torotorofotsy, 6 Andranomena. See Table 2 for sample sizes at
each locality.
M. Vences et al. / Molecular Phylogenetics and Evolution 30 (2004) 295–307 297
originate from a single population. All confirmed sam-
pling localities are shown in Fig. 1.
2.2. DNA sequencing
Genomic DNA was extracted from muscle tissue and
toeclips using the Qiagen DNEasy tissue extraction kit
following the manufacturer�s instructions. Fragments of
three mitochondrial genes (12S and 16S rRNA, cyto-
chrome b) and one nuclear gene (rhodopsin exon 1) wereamplified via the polymerase chain reaction (PCR) in
one specimen of each of the 15 species available. For thepopulation genetic part of our study, we developed
variants of universal primers that succeeded amplifying
a large part of the moderately variable cytochrome b
gene in Mantella. Attempts of amplifying and sequenc-
ing the presumably more variable control region in
Mantella were unsuccessful, probably because ranoid
frogs can be characterised by important length poly-
morphisms of this gene (Sumida et al., 2000) and by agenomic rearrangement that led to the absence of con-
servative priming sites between the cytochrome b and
control region genes (Macey et al., 1997; Sumida et al.,
2000, 2001).
One fragment of the 12S rRNA gene and two frag-
ments of the 16S rRNA gene (together ca. 1600 bp) were
amplified using primers 12SA-L and 12SB-H, 16SA-L
and 16SB-H, and 16SAH (reverse of 16SAL) and16SL3, as previously published by Vences et al. (2000),
Mausfeld et al. (2000), and Schaefer et al. (2002). A
fragment of 925 bp of the cytochrome b gene was am-
plified using modified versions of the primers MVZ15-L
and cytbAR-H from Goebel et al. (1999) (AAC TWA
TGG CCC MCA CMA TMC GWA A and TAW ARG
GRT CYT CKA CTG GTT G). Approximately 350 bp
of rhodopsin exon 1 was sequenced using primersRhod1A and Rhod1D (Bossuyt and Milinkovitch,
2000).
PCRs were performed using the following conditions:
an initial denaturation at 95 �C for 1:30min; 27–35 cy-
cles at 95 �C for 0:35min, primer-specific annealing
temperatures for 0:35min, extension at 72 �C for
1:30min; and final extension of 5:00min at 72 �C. Theprimer specific annealing temperatures were 58 �C (12SrRNA), 55 �C (rhodopsin and 16S rRNA), and 45 �C(cytochrome b). In cases where amplification was
problematic, a touchdown approach from 55 to 45 �Cfor 10 cycles was followed by 25 cycles at 45 �C.
PCR products were loaded onto 1.2% agarose gels,
stained with ethidium bromide, and visualised on a ‘‘Gel
Doc’’ system (Bio-Rad). If results were satisfying,
products were purified using QIAquick spin columns(Qiagen) prior to cycle sequencing. A 10 ll sequencingreaction included 1–2 ll template, 2.5 ll sequencing
buffer, 1 ll of 2 pmol/ ll primer, 2 ll ABI sequence mix,
and 2.5–3.5 ll water. The sequence reaction was 27–35
cycles of 0:10min at 92 �C, 0:10min at 45 �C, and
4:00min at 60 �C. Sequence data collection, visualisa-
tion, and analysis were performed on an ABI 3100
automated sequencer.We obtained cytochrome b sequences of 5–10 speci-
mens from each population of the M. madagascariensis
group sampled. Considering the relatively high differ-
entiation and apparent haplotype sharing among species
as observed in this data set, we performed a number of
additional analyses to exclude the possibility of having
sequenced nuclear pseudogene copies of the original

298 M. Vences et al. / Molecular Phylogenetics and Evolution 30 (2004) 295–307
mitochondrial gene (Bensasson et al., 2001): (a) thenucleotide sequences were translated into amino acids to
exclude the possibility of frameshifts or stopcodons; (b)
we ascertained that third positions displayed a deficit in
guanine as typical for mitochondrial coding DNA
fragments (guanine made up only 2.42% of third posi-
tions); (c) for all individuals of M. madagascariensis, we
sequenced a shorter fragment (ca. 600 bp) using the
primers Cytb-c and CBJ10933 from Bossuyt and Mil-inkovitch (2000), so as to verify that the overlapping
parts were congruent with the sequences obtained using
the MVZ-15L and CytbARH primers; and (d) for four
M. aurantiaca specimens which had M. crocea-like
haplotypes, we additionally sequenced 16S rDNA and
verified that also the 16S rDNA haplotypes of these
specimens clustered with M. crocea rather than with
other M. aurantiaca. Sequences were deposited in Gen-Bank (Accession Nos. AY263270–AY263322).
2.3. Phylogenetic analyses
Sequences were checked in BioEdit (North Carolina
State University) or Sequence Navigator (Applied Bio-
systems) software and imported for alignment into
Clustal X. Saturation plots were drawn using STATIS-TICA 6.0 (Statsoft, Inc. 2002) by plotting percent un-
corrected sequence divergence against the number of
transitions and transversions (rDNA) or substitutions at
first, second, and third codon positions (cytochrome b,
rhodopsin). Sequence alignment was straightforward.
The cytochrome b and rhodopsin sequences contained
no indels and only few gaps were necessary to align to
12S and 16S rRNA sequences: 11 unambiguous gaps(single and isolated from others), one double gap in the
outgroup, and one position in which a variable number
of 1–3 gaps was needed. Because this low amount of
indels was unlikely to provide much additional phylo-
genetic information, and because of the lack of general
consensus of how to deal with gaps in phylogenetic
analysis, we considered gapped positions as unreliable
characters and excluded them from further analysis(Swofford et al., 1996).
Partition homogeneity was tested using the ILD test
implemented in PAUP*, beta version 4b08 (Swofford,
2001), using heuristic searches with 1000 replicates. Be-
cause this test indicated inhomogeneity of the data
partitions, we performed (1) separate analyses of each of
the four genes as well as (2) a combined analysis of the
complete data set concatenating all four genes (Yoderet al., 2001).
Maximum Parsimony (MP) and Maximum Likeli-
hood (ML) analyses were carried out using PAUP*,
using the heuristic search option with tree-bisection–
reconnection (TBR) branch swapping and 100 random
addition sequence replicates, following substitution
model parameter estimatation with Modeltest version
3.06 (Posada and Crandall, 1998). SH-tests (Shimodairaand Hasegawa, 1999) as implemented in PAUP* were
used to test alternative phylogenetic hypotheses.
Two thousand bootstrap replicates were calculated
under the MP optimality criterion, while only 500 ML
bootstrap replicates were performed due to computa-
tional constraints. All bootstrapping was carried out
using heuristic searches with 10 random addition se-
quence replicates and TBR branch swapping. Bayesianposterior probabilities were calculated using MrBayes,
version 2.01 (Huelsenbeck and Ronquist, 2001) under a
GTR substitution model with parameters estimated
from the data. As much as 300,000 generations were
run, every 10th tree was collected, and the number of
initial generations needed before convergence on stable
likelihood values was empirically estimated at 30,000;
the burnin parameter was consequently set at 10%.
2.4. Phylogeography and population genetics
This part of our study was based on cytochrome b
sequences from 49 individuals of the M. madagascari-
ensis group. Some of these sequences had missing data
at the beginning and end. These regions were excluded
and the analyses were based on a 830 bp segment thatwas available from all specimens and that contained no
indels.
A minimum spanning network was constructed using
the TCS software package (Clement et al., 2000), which
employs the method of Templeton et al. (1992). It cal-
culates the number of mutational steps by which pair-
wise haplotypes differ and computes the probability of
parsimony (Templeton et al., 1992) for pairwise differ-ences until the probability exceeds 0.95. The number of
mutational differences associated with the probability
just before the 0.95 cut-off is then the maximum number
of mutational connections between pairs of sequences
justified by the �parsimony� criterion, and these justified
connections are applied in a haplotype network (Clem-
ent et al., 2000).
Hierarchical structuring of genetic variation was de-termined using analysis of molecular variance (AM-
OVA; Excoffier et al., 1992) as implemented in the
Arlequin 2.0 software (Schneider et al., 2000). This
analysis produces an output similar to conventional F
statistics, which describes the variation of haplotypes
within single populations (UST), among populations of a
given group of populations, (USC), and among species
(UCT) both hierarchically and relative to all haplotypes(Barber, 1999). It should be noted that we define Man-
tella species here sensu Vences et al. (1999). Levels of
significance were determined through 20,000 random
permutations.
Population differentiation was analysed by testing the
hypothesis of random distribution of individuals be-
tween pairs of populations (Raymond and Rousset,

M. Vences et al. / Molecular Phylogenetics and Evolution 30 (2004) 295–307 299
1995) using Arlequin 2.0 and computing 300,000 steps inthe Markov chain.
3. Results
3.1. Phylogenetic analyses
Saturation plots were constructed in order to deter-mine whether or not positions needed to be excluded
prior to phylogenetic analyses. Fig. 2 shows that neither
16S rRNA nor 12S rRNA genes were saturated for
transitions or transversions. Likewise, there was no ev-
idence for saturation at third codon positions for cyto-
chrome b (R2 ¼ 0:99) or rhodopsin (R2 ¼ 0:74; no
tapering of slope at largest divergences). Therefore, all
data were used in subsequent phylogenetic analyses. Inaddition, cytochrome b and 16S rRNA showed gaps
between clusters of points between approximately 8.0
and 13.0%, and 0.75 and 2.0% sequence divergence, re-
spectively, that largely corresponded to the divergences
between and within species groups.
The partition homogeneity test rejected the null hy-
pothesis of congruence of the included gene fragments at
Fig. 2. Saturation plots for fragments of 16S rRNA, 12S rRNA, cytochrom
included). For 16S rRNA and 12S rRNA, percent uncorrected sequence div
versions (Tv). Percent uncorrected sequence divergence was plotted against th
cytochrome b and rhodopsin genes.
low significance (P ¼ 0:04), indicating the need for theirseparate analyses. However, based on recent evidence
provided by Yoder et al. (2001) and common practice
with the same gene fragments in anurans (e.g., Bossuyt
and Milinkovitch, 2000), we also performed a combined
analysis of the concatenated sequences (Table 1).
After the exclusion of gapped sites, the complete data
set of 12S and 16S rDNAs, cytochrome b, and rho-
dopsin consisted of 2840 characters, of which 2117 wereinvariant; 896 characters were variable, and of these, 484
were parsimony-informative.
Hierarchical likelihood tests implemented inModeltest
(Posada and Crandall, 1998) selected a Tamura–Nei
substitution model (TRN+I+G) as best fitting the com-
bined data (� lnL ¼ 11369:4961), with base frequencies
(freqA¼0.2934; freqC¼0.2293; freqG¼0.1628; freqT¼0.3144) and substitution rates (R½A–G� ¼7:0129; R½C–T� ¼8:7806; other rates¼ 1) estimated from the data, a
proportion of invariable sites of 0.4171, and a gamma
distribution shape parameter of 0.5396.
The single obtained ML phylogram from the com-
bined analysis (likelihood score 10481.49) is shown in
Fig. 3. Maximum Parsimony searches recovered a single
most parsimonious tree (1476 steps; consistency
e b, and rhodopsin genes among species of Mantella (outgroup not
ergence was plotted against the number of transitions (Ti) and trans-
e number of substitutions at first, second, and third codon positions for

Table 1
Summary of combined and separate phylogenetic analyses of gene fragments
Node Description ML
(all)
MP
(all)
Bayesian
(all)
ML
(rRNA)
MP
(rRNA)
ML
(Cyt b)
MP
(Cyt b)
ML
(Rhod)
MP
(Rhod)
1 M. bernhardi most basal + (67) + + (99) + (88) + ) ) ) )1a M. laevigata most basal ) ) ) ) ) + + (72) + +
1b M. bernhardi in a clade
with M. cowani group
) ) ) ) ) + (66) ) + (56) + (54)
2 M. madagascariensis
group in a clade with
M. laevigata/M. betsileo
groups
+ (67) + (59) + (100) + (85) + (72) ) ) ) ())
3 M. laevigata sister to
M. betsileo group
+ (88) + + (100) + (97) + (92) ) ) ) ())
3a M. madagascariensis
group sister to M. betsileo
group
) ) ) ) ) + + (68) ) )
4 M. cowani group + (100) + (100) + (100) + (99) + (100) + (98) + (100) + ())5 M. madagascariensis
group
+ (98) + (100) + (100) + (97) + (100) + (70) + (100) ) ())
6 M. betsileo group + (100) + (100) + (100) + (97) + (100) + (96) + (100) ) )7 M. aff. betsileo sister to
M. expectata
+ (84) + + (100) + (53) ) ) ()) ) )
7a M. expectata most basal
in M. betsileo group
) ) ) ) + (69) ) ()) ()) )
8 M. betsileo sister to
M. viridis
+ (99) + (100) + (100) + (81) + (98) + (99) + (99) ) )
9 M. crocea sister to
M. milotympanum
+ (100) + (100) + (100) + (99) + (100) + (98) + (100) ) +
10 M. pulchra sister to
M. madagascariensis
+ (99) + (98) + (100) ) ) + (93) + (100) ()) ())
10a M. aurantiaca sister to
M. madagascariensis
) ) ) + (72) + (64) ) ) ()) ())
11 M. aurantiaca most basal
in M. madagascariensis
group
+ (64) + (69) + (83) ) ) + (73) + (78) ) ())
11a M. pulchra most basal in
M. madagascariensis
group
) ) ) + (56) + (72) ) ) ) ())
12 M. nigricans sister to
M. baroni
+ (99) + (100) + (100) + (92) + (94) + (86) + (100) ) ())
13 M. cowani most basal in
M. cowani group
+ (88) + (97) + (99) ()) + (76) + (78) + (96) ) ())
+, a certain topology was supported in the analysis; ), the topology was not supported; and ()), the topology was not resolved but was
compatible with the node. Numbers in parentheses are bootstrap support values (ML, MP) and Bayesian posterior probabilities (only given if
>50%). Numbering of nodes corresponds to Fig. 3; numbers followed by a or b are alternative topologies not favored by the combined analysis.
300 M. Vences et al. / Molecular Phylogenetics and Evolution 30 (2004) 295–307
index¼ 0.622, retention index¼ 0.694) that completely
agreed with this topology. These trees as well as the
Bayesian analysis supported monophyly of named spe-
cies groups (Schaefer et al., 2002: M. betsileo group, M.
cowani group, and M. madagascariensis group). Boot-
strap values for these groups were >95% and posterior
probabilities were 100%. ML searches constraining the
topology to monophyletic groups containing either the
two uniformly colored orange Mantella species (M.
aurantiaca and M. milotympanum) or the two species
with distinct dorsal black–yellow–orange color contrast
(M. madagascariensis and M. baroni) recovered treeswith significantly lower likelihood values. These were
10988.47 (M. madagascariensis placed sister to M. ba-
roni; remaining topology as in Fig. 3) and 10543.54
(M. aurantiaca placed sister to M. milotympanum). Both
topologies were significantly worse than the preferred
topology (Fig. 3) as assessed by SH tests (P < 0:001 and
P < 0:05, respectively).Although almost all nodes were well supported in the
combined analysis (Fig. 3), the separate analyses as
summarised in Table 1 revealed conflicts between the
major data sets. Modeltest suggested different substitu-
tion models for the three data partitions: a general time-
reversible (GTR+G) model with a gamma distribution
shape parameter of 0.1469 for the rRNA genes, a
Tamura–Nei (TrN+ I+G) model with a proportion ofinvariable sites of 0.5683 and a gamma distribution shape
parameter of 1.7085 for the cytochrome b gene, and a
Kimura model (K80+G) with a gamma distribution

Fig. 3. Maximum Likelihood phylogram of 15 species of Mantella, based on 2840 bp of the rhodopsin, cytochrome b, 12S rRNA, and 16S rRNA
genes. The tree was obtained by heuristic searches in PAUP* based on a GTR+ I+G substitution model suggested by Modeltest (Posada and
Crandall, 1998). For bootstrap values and Bayesian posterior probabilities of the numbered nodes, see Table 1. All nodes except for No. 11 received
ML bootstrap values P75% and posterior probabilities P99%. Nodes numbered in boldface were congruently supported by separate analyses of
rRNA genes and cytochrome b.
M. Vences et al. / Molecular Phylogenetics and Evolution 30 (2004) 295–307 301
shape parameter of 0.0141 for rhodopsin. Separate ML
searches recovered single trees with likelihoods of
5078.72 (rDNA), 4450.06 (cytochrome b), and 755.66
(rhodopsin). These largely agreed with the obtained MP
trees (Table 1): rDNA, a single most parsimonious tree
of 635 steps (216 parsimony-informative characters);cytochrome b, three trees of 778 steps (252 parsimony-
informative characters); and rhodopsin, 55 trees of 41
steps (16 parsimony-informative characters).
The rhodopsin tree did not resolve most phylogenetic
relationships, almost certainly because of the low num-
ber of phylogenetically informative characters. The cy-
tochrome b and rDNA trees differed in two major
aspects (Table 1): (1) the rDNA analysis placed M.
bernhardi as most basal species, whereas the cytochrome
b analysis placedM. laevigata at the most basal position;
(2) the rDNA analysis placed M. madagascariensis as
sister species of M. aurantiaca, whereas the cytochrome
b data favored a sister-group relationship between
M. madagascariensis and M. pulchra.
3.2. Phylogeography and population genetics
Three haplotype networks were recovered by TCS
based on cytochrome b sequences of 49 individuals from
seven populations (Fig. 4). These networks largely cor-
responded to individuals of (1) M. madagascariensis, (2)
M. aurantiaca, and (3)M. crocea andM. milotympanum.
They were not connected with each other due to the
large genetic distance (�12 steps at 95% probabilitythreshold) between their haplotypes. The number of
pairwise substitutions was 44–51 between M. madaga-
scariensis and M. aurantiaca, 39–46 between M. mad-
agascariensis and M. milotympanum/crocea, and 38–47
between haplotypes of the M. aurantiaca and M. milo-
tympanum/crocea networks. These differences translated
into a maximum of three amino acid substitutions
among taxa, 0–3 amino acid substitutions within
M. madagascariensis, and 0–1 within M. aurantiaca.
No amino acid substitution was detected within theM. milotympanum/M. crocea clade.
The first haplotype network contained the seven
M. madagascariensis individuals. Among these, four
haplotypes were identified, with a maximum divergence
of six steps.
The second network contained six haplotypes from
17 out of 21 M. aurantiaca individuals. It consisted of
two major groups that differed by a minimum of sevensubstitutions. One of these groups corresponded to the
individuals from Andranomena, the other to the spec-
imens from the first site sampled in the Torotorofotsy
swamp. The second site in this swamp harboured
haplotypes belonging to both groups. Four other
M. aurantiaca (from Andranomena) belonged to the
M. milotympanum–M. crocea haplotype network and
one of these (from a single individual) was identicalto the most common haplotype found in M. crocea
from Ihofa.
This third haplotype network connected M. milo-
tympanum with the two populations of M. crocea. The
Ihofa and Ambohimanarivo populations of M. crocea
differed by a maximum of seven steps and a minimum of
one step, although no haplotype sharing was observed.
A single M. milotympanum had a sequence identical tothe second M. crocea haplotype from Ihofa, while the
other M. milotympanum haplotypes were unique to this
species and differed by 1–5 steps from the nearest
M. crocea haplotype.

Fig. 4. Haplotype networks of species and populations of the M. madagascariensis group (49 individuals), based on 830 bp of the cytochrome b gene.
Networks were not joined if haplotypes were separated by more than 12 mutations. Each circle represents one haplotype; size of circles is pro-
portional to haplotype frequency. Circles within larger circles (with dotted outline) represent haplotype sharing between two populations. Small
black dots represent putative haplotypes that were not observed. Haplotypes are named aur1–aur6, cro1–cro4, mil1–mil4, and mad1–mad4 according
to the species in which they were found (or in which they occur most frequently. Populations are numbered (in parentheses) according to Fig. 1.
Table 2
Summary of haplotype diversity in the M. madagascariensis group populations examined
Species and population Sample size Haplotypes Polymorphic sites Gene diversity Nucleotide diversity (100�)
M. milotympanum
Fierenana (1) 9 6 12 0.83� 0.13 0.42� 0.27
M. crocea
Ihofa (2) 5 2 4 0.60� 0.18 0.29� 0.22
Ambohimanarivo (3) 7 2 4 0.57� 0.12 0.28� 0.20
M. aurantiaca
Torotorofotsy 1 (4) 6 2 7 0.53� 0.17 0.45� 0.31
Torotorofotsy 2 (5) 5 2 2 0.40� 0.24 0.10� 0.10
Andranomena (6) 10 4 48 0.71� 0.12 2.86� 1.56
M. madagascariensis
Marolambo 7 4 6 0.81� 0.13 0.32� 0.22
Populations are labelled (numbers in parentheses) according to Fig. 1. Data refer to a fragment of 830 bp of the cytochrome b gene. Indices and
sampling variances in the last two columns were computed using Arlequin 2.0 software; they represent the probability that two randomly chosen
haplotypes are different in the sample (gene diversity) and that two randomly chosen homologous nucleotides are different in the sample (nucleotide
diversity; given in percent).
302 M. Vences et al. / Molecular Phylogenetics and Evolution 30 (2004) 295–307
Haplotype diversity in the studied populations of the
M. madagascariensis group is summarised in Table 2.
Within populations we found 2–6 haplotypes, with a
nucleotide diversity of 0.10–0.45% in all populations
except Andranomena. In this M. aurantiaca population,
nucleotide diversity was 2.86% due to haplotype sharing
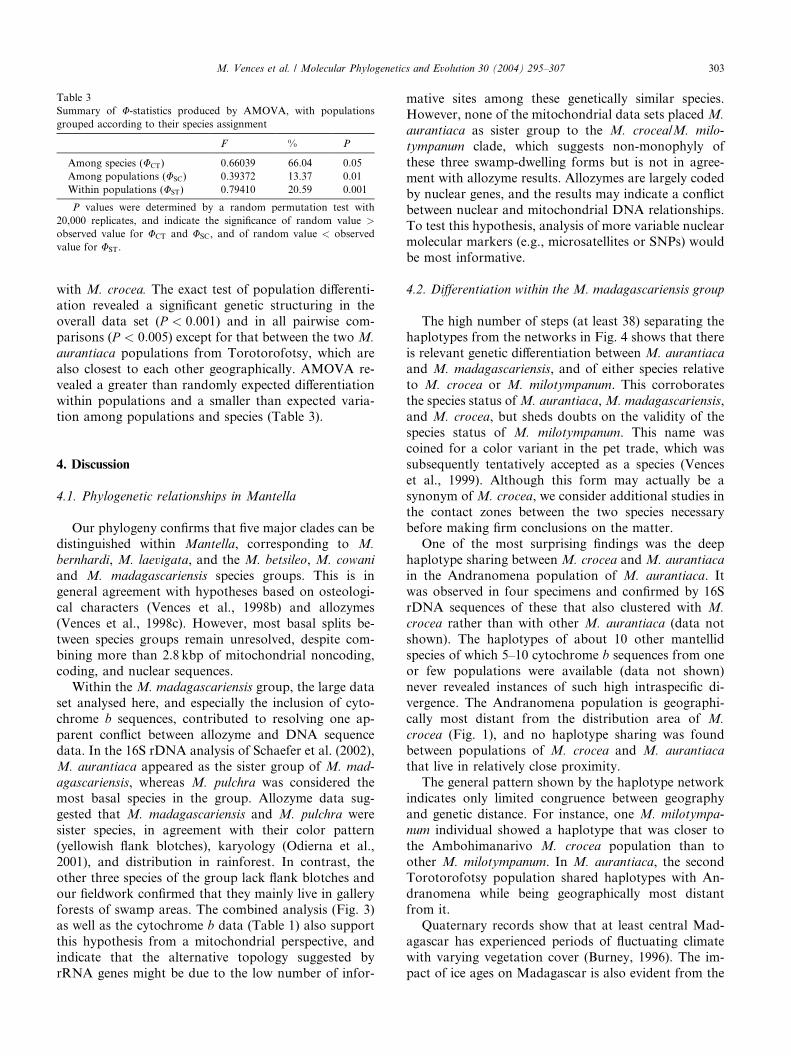
Table 3
Summary of U-statistics produced by AMOVA, with populations
grouped according to their species assignment
F % P
Among species (UCT) 0.66039 66.04 0.05
Among populations (USC) 0.39372 13.37 0.01
Within populations (UST) 0.79410 20.59 0.001
P values were determined by a random permutation test with
20,000 replicates, and indicate the significance of random value >
observed value for UCT and USC, and of random value < observed
value for UST.
M. Vences et al. / Molecular Phylogenetics and Evolution 30 (2004) 295–307 303
with M. crocea. The exact test of population differenti-
ation revealed a significant genetic structuring in the
overall data set (P < 0:001) and in all pairwise com-
parisons (P < 0:005) except for that between the two M.
aurantiaca populations from Torotorofotsy, which are
also closest to each other geographically. AMOVA re-
vealed a greater than randomly expected differentiation
within populations and a smaller than expected varia-tion among populations and species (Table 3).
4. Discussion
4.1. Phylogenetic relationships in Mantella
Our phylogeny confirms that five major clades can bedistinguished within Mantella, corresponding to M.
bernhardi, M. laevigata, and the M. betsileo, M. cowani
and M. madagascariensis species groups. This is in
general agreement with hypotheses based on osteologi-
cal characters (Vences et al., 1998b) and allozymes
(Vences et al., 1998c). However, most basal splits be-
tween species groups remain unresolved, despite com-
bining more than 2.8 kbp of mitochondrial noncoding,coding, and nuclear sequences.
Within the M. madagascariensis group, the large data
set analysed here, and especially the inclusion of cyto-
chrome b sequences, contributed to resolving one ap-
parent conflict between allozyme and DNA sequence
data. In the 16S rDNA analysis of Schaefer et al. (2002),
M. aurantiaca appeared as the sister group of M. mad-
agascariensis, whereas M. pulchra was considered themost basal species in the group. Allozyme data sug-
gested that M. madagascariensis and M. pulchra were
sister species, in agreement with their color pattern
(yellowish flank blotches), karyology (Odierna et al.,
2001), and distribution in rainforest. In contrast, the
other three species of the group lack flank blotches and
our fieldwork confirmed that they mainly live in gallery
forests of swamp areas. The combined analysis (Fig. 3)as well as the cytochrome b data (Table 1) also support
this hypothesis from a mitochondrial perspective, and
indicate that the alternative topology suggested by
rRNA genes might be due to the low number of infor-
mative sites among these genetically similar species.However, none of the mitochondrial data sets placed M.
aurantiaca as sister group to the M. crocea/M. milo-
tympanum clade, which suggests non-monophyly of
these three swamp-dwelling forms but is not in agree-
ment with allozyme results. Allozymes are largely coded
by nuclear genes, and the results may indicate a conflict
between nuclear and mitochondrial DNA relationships.
To test this hypothesis, analysis of more variable nuclearmolecular markers (e.g., microsatellites or SNPs) would
be most informative.
4.2. Differentiation within the M. madagascariensis group
The high number of steps (at least 38) separating the
haplotypes from the networks in Fig. 4 shows that there
is relevant genetic differentiation between M. aurantiaca
and M. madagascariensis, and of either species relative
to M. crocea or M. milotympanum. This corroborates
the species status ofM. aurantiaca,M. madagascariensis,
and M. crocea, but sheds doubts on the validity of the
species status of M. milotympanum. This name was
coined for a color variant in the pet trade, which was
subsequently tentatively accepted as a species (Vences
et al., 1999). Although this form may actually be asynonym of M. crocea, we consider additional studies in
the contact zones between the two species necessary
before making firm conclusions on the matter.
One of the most surprising findings was the deep
haplotype sharing between M. crocea and M. aurantiaca
in the Andranomena population of M. aurantiaca. It
was observed in four specimens and confirmed by 16S
rDNA sequences of these that also clustered with M.
crocea rather than with other M. aurantiaca (data not
shown). The haplotypes of about 10 other mantellid
species of which 5–10 cytochrome b sequences from one
or few populations were available (data not shown)
never revealed instances of such high intraspecific di-
vergence. The Andranomena population is geographi-
cally most distant from the distribution area of M.
crocea (Fig. 1), and no haplotype sharing was foundbetween populations of M. crocea and M. aurantiaca
that live in relatively close proximity.
The general pattern shown by the haplotype network
indicates only limited congruence between geography
and genetic distance. For instance, one M. milotympa-
num individual showed a haplotype that was closer to
the Ambohimanarivo M. crocea population than to
other M. milotympanum. In M. aurantiaca, the secondTorotorofotsy population shared haplotypes with An-
dranomena while being geographically most distant
from it.
Quaternary records show that at least central Mad-
agascar has experienced periods of fluctuating climate
with varying vegetation cover (Burney, 1996). The im-
pact of ice ages on Madagascar is also evident from the

304 M. Vences et al. / Molecular Phylogenetics and Evolution 30 (2004) 295–307
recent discovery of signs of past glacial activity in theAndringitra Massif (Vidal-Roman�ı et al., 1997). BecauseM. aurantiaca, M. crocea, and M. milotympanum pre-
dominantly live in swamp gallery forests at the edge of
the main eastern rainforest block, it would be sound to
hypothesise that these frogs have repeatedly been iso-
lated in small refugia there and then evolved distinct
color patterns and haplotypes, and subsequently ex-
panded their population sizes again, with intensive in-trogression of haplotypes in the contact zones. This
scenario is not improbable because successful hybridi-
sation of species of the M. madagascariensis group has
been regularly observed in captivity (Glaw et al., 2000).
An alternative scenario would assume an old origin of
the haplotype divergences, and a more recent differen-
tiation of the population into different color morphs and
species with incomplete lineage sorting.The haplotype diversity found within populations of
the M. madagascariensis group is relatively high when
compared to other amphibians. Riberon et al. (2002)
observed an extreme instance of lack of genetic diversity
in Salamandra lanzai, with 44 specimens from 12 pop-
ulations being totally invariant over 1050 bp of cyto-
chrome b. Similarly, in 50 individuals from 13
populations of the highland Salamandra atra, no geneticvariation was found within populations, while inter-
population genetic distance was 0–3.1% (Riberon et al.,
2001). Garc�ıa-Paris and Jockusch (1999) found only
four haplotypes in seven populations of painted frogs
(Discoglossus galganoi) over a wide geographic area,
with haplotype divergences of 0.3–1.6%. Tan and Wake
(1995) sequenced two individuals for most studied
populations of Taricha newts and assessed that mostindividuals from the same population had identical
DNA sequences. Tarkhnishvili et al. (2000) sequenced a
350 bp fragment in 73 Mertensiella salamanders and
found two different haplotypes (0.6% divergence) in only
one out of 10 populations while all other populations
had unique haplotypes. Garc�ıa-Paris et al. (2000) em-
phasise high levels of genetic differentiation among
Neotropical salamanders (Bolitoglossa), referring tonine haplotypes in three populations of one species (16
individuals sequenced for 647 bp) which still is less
variation than that encountered by us in species of the
M. madagascariensis group.
However, some other examples of high cytochrome b
variability in amphibians also do exist. Analysing a
fragment of only 329 bp in 17 populations of the golden-
striped salamander Chioglossa lusitanica, Alexandrinoet al. (2000) found 1–4 haplotypes per population (mean
1.76), with a sequence divergence between haplotypes of
up to 3.2% and an overall nucleotide diversity of 1.4%.
A subsequent study in which 700 bp was sequenced in
124 individuals from 17 localities identified 30 haplo-
types with sequence divergence ranging from 0.14 to
2.14% and an overall nucleotide diversity of 0.99%
(Alexandrino et al., 2002). They found that 10 out of 12localities with samples of n > 5 were polymorphic with
2–5 haplotypes differing by 1–5 mutations. Barber
(1999) observed up to six different haplotypes within
populations of the Canyon treefrog Hyla arenicolor
(360 bp analysed), and AMOVA revealed that up to 30%
of the overall variation was explained by within-
population variance. These values compare well with
those we found in our study of Mantella, with 2–6haplotypes per population, an average nucleotide di-
versity of 0.67% and for which >20% of intrapopulation
variance accounted for the overall genetic variation
(p < 0:001).
4.3. Homoplasy of color patterns
The phylogenetic hypothesis presented here, in con-junction with the phylogeographic structuring among
populations within the M. madagascariensis group,
suggests that coloration is an evolutionarily labile trait
among Mantella. The hypothesis of homoplastic evolu-
tion of dorsal pigment pattern in M. baroni and M.
madagascariensis based on 16S rDNA sequences
(Schaefer et al., 2002) is corroborated further by the
distant placement of these two taxa in the cytochrome banalysis, and in a limited way also in the rhodopsin
analysis herein. These two species show a pattern that is
extremely similar in the arrangement of black, yellow,
and orange aposematic elements and is very unlikely to
represent a retainment of ancestral features. Our data
provide with sufficient probability a second instance of
such convergent color evolution in Mantella: M. milo-
tympanum and M. aurantiaca are both uniformly or-ange-golden, with M. milotympanum having some black
pigment around the tympanum and nostril. These two
species are not sister to each other, and no haplotype
sharing was observed between them. Geographically,
they are most separated, with differently colored M.
crocea populations intercalated between their distribu-
tion areas. Because the non-uniform color is ancestral
also for M. aurantiaca based on ontogenetic observa-tions (Glaw et al., 2000), it can be assumed that the
uniform orange color of M. aurantiaca and M. milo-
tympanum has arisen twice.
Mate recognition in most frogs is largely based on the
advertisement calls of males, but in some diurnal spe-
cies, optical communication has been demonstrated
(H€odl and Amezquita, 2001). The conspicuous and
contrasting white or black color of vocal sacs in males ofseveral species of mantellids, among them Mantella
betsileo, Mantidactylus liber, and Mantidactylus granul-
atus (Glaw and Vences, 1994), may be related to mate
recognition as well. The same might be true for other,
sexually non-dimorphic traits such as the conspicuous
eye coloration of many otherwise cryptic arboreal spe-
cies (Glaw and Vences, 1997).

M. Vences et al. / Molecular Phylogenetics and Evolution 30 (2004) 295–307 305
Species within the M. madagascariensis group showlittle bioacoustic differentiation (Andreone, 1992; Glaw
and Vences, 1994). Assortative mating based on color
pattern would be plausible in diurnal frogs such as
Mantella. Selection on coloration could act as a repro-
ductive barrier over small geographic scales, in combi-
nation with its function in predator-deterrence, and
could provide at least a partial explanation for the fast
evolution of the strikingly divergent patterns in the M.
madagascariensis group. However, so far there has been
no observation of such a mechanism in Mantella or in
other anurans, and this hypothesis therefore remains
entirely speculative.
4.4. Conservation implications
Prior to the sampling carried out for the presentstudy, the only precisely known locality for any of the
three species M. aurantiaca, M. crocea, and M. milo-
tympanum was the Torotorofotsy area (for M. auranti-
aca; including Ambatodradama which is probably in the
same region), whereas all other distributional knowledge
relied on unpublished reports or unconfirmed personal
communications of commercial exporters (Vences et al.,
1999; Zimmermann and Hetz, 1992). Our field obser-vations therefore provide the first accurate locality data
for M. crocea and M. milotympanum, and demonstrate
that M. aurantiaca is not confined to Torotorofotsy but
also occurs at least at one additional locality, Andra-
nomena. The existence of further populations is to be
expected, but there is no indication that the general
distribution of these species will extend far north or
south of the known area. Despite recent efforts to extendthe borders of Mantadia National Park to include the
Torotorofotsy area (Zimmermann, 1996), currently
none of the known localities benefit from any legal
protection. Two major threats are conceivable for these
frogs: destruction of their habitats and overcollecting.
Unprotected forests are known to be under strong
human pressure in Madagascar and may completely
disappear in the near future with continued deforesta-tion rates (Green and Sussman, 1990). One of the major
causes for forest destruction is slash- and burn-agricul-
ture which, for instance, has led to the near complete
disappearance of the habitat at the type locality of M.
bernhardi in south-eastern Madagascar (Raxworthy and
Nussbaum, 2000). Our observations in the habitats of
Mantella aurantica, M. crocea, and M. milotympanum
conform to this observation. In December 2001, wewitnessed the aftermath of an uncontrolled forest fire at
Torotorofotsy that destroyed at least 30% of the swamp
gallery forest populated by M. aurantiaca in this area.
In addition, small-scale logging was observed at all sites
visited.
By interviewing local collectors at Andranomena and
Ambohimanarivo, we learned that large numbers of
specimens of M. aurantiaca and M. crocea are beingcollected from these sites. Estimates ranged from 5000
to 20,000 individuals collected yearly from each popu-
lation for the past 5–10 years. Nevertheless, all visited
populations appeared to be healthy and many frogs
were observed during our short visits (e.g., over 50 M.
aurantiaca specimens in Andranomena in less than 1 h).
From these observations, habitat destruction through
logging and forest fires seems to be the most importantthreats for the populations of these three species, while
collecting does not appear to have disastrous conse-
quences for the populations involved. The genetic results
herein contribute threefold to assessing the threats and
outlining a conservation strategy for these frogs:
First, our data show that M. aurantiaca and M.
crocea/milotympanum constitute two genetically well
differentiated entities—most probably at the species le-vel—and thus that each merits intensive conservation
measures.
Second, the high genetic diversity found in all popu-
lations indicates a moderate to high effective population
size in past generations. Considering that Mantella have
short generation times and can reproduce within one
year after metamorphosis (Glaw et al., 2000), our data
provide no evidence for bottleneck events that couldhave resulted from overcollecting during the past 10
years.
Third, the relatively high degree of haplotype sharing
in our limited sample indicates that gene flow between
populations took place until recently. This agrees with
past habitat continuity as visible from topographic
maps. A future discovery of isolated populations with
strongly divergent haplotypes seems unlikely, and theconservation of a few large populations will save a sig-
nificant part of the species� genetic diversity.
Acknowledgments
This study was carried out in the framework of a
cooperation accord between the University of Antan-anarivo, Madagascar, and the University of Amster-
dam, Netherlands. We are grateful to Ildiko Somorjai
who contributed many data and was of help in the field,
to Euan Edwards for his invaluable logistic assistance,
and to the Malagasy authorities for research and export
permits. The work was supported by grants of the
Deutsche Forschungsgemeinschaft DFG (VE247/1-1
and VE247/1-2).
References
Alexandrino, J., Froufe, E., Arntzen, J.W., Ferrand, N., 2000. Genetic
subdivision, glacial refugia and postglacial recolonization in the

306 M. Vences et al. / Molecular Phylogenetics and Evolution 30 (2004) 295–307
golden-striped salamander, Chioglossa lusitanica (Amphibia: Uro-
dela). Mol. Ecol. 9, 771–781.
Alexandrino, J., Arntzen, J.W., Ferrand, N., 2002. Nested clade
analysis and the genetic evidence for population expansion in the
phylogeography of the golden-striped salamander, Chioglossa
lusitanica (Amphibia: Urodela). Heredity 88, 66–74.
Andreone, F., 1992. Syntopy of Mantella cowani Boulenger and
Mantella madagascariensis (Grandidier) in central-eastern Mada-
gascar, with notes on the coloration in the genus Mantella (Anura:
Mantellidae). Boll. Mus. Reg. Sci. Nat. Torino 10, 421–450.
Barber, P.H., 1999. Patterns of gene flow and population genetic
structure in the canyon treefrog,Hyla arenicolor (Cope). Mol. Ecol.
8, 563–576.
Behra, O., 1993. The export of reptiles and amphibians from
Madagascar. TRAFFIC Bull. 13, 115–116.
Bensasson, D., Zhang, D.-X., Hartl, D.L., Hewitt, G.M., 2001.
Mitochondrial pseudogenes: evolution�s misplaced witnesses.
Trends Ecol. Evol. 16, 314–321.
Bossuyt, F., Milinkovitch, M.C., 2000. Convergent adaptive radiations
in Madagascan and Asian ranid frogs reveal covariation between
larval and adult traits. Proc. Natl. Acad. Sci. USA 97, 6585–6590.
Burney, D.A., 1996. Climate and fire ecology as factors in the
quaternary biogeography of Madagascar. In: Lourenc�o, W.R.
(Ed.), Actes du Colloque International Biog�eographie de Mada-
gascar. Soci�et�e de Biog�eographie, Paris, pp. 49–58.
Caldwell, J.P., 1996. The evolution of myrmecophagy and its correlates
in poison frogs (Family Dendrobatidae). J. Zool. (Lond.) 240, 75–
101.
Clement, X., Posada, D., Crandall, K., 2000. TCS: A computer
program to estimate gene genealogies. Mol. Ecol. 9, 1657–1659.
Daly, J.W., Andriamaharavo, N.R., Andriantsiferana, M., Myers,
C.W., 1996. Madagascan poison frogs (Mantella) and their skin
alkaloids. Am. Mus. Novit. 3177, 1–34.
Daly, J.W., Garraffo, H.M., Hall, G.S.H., Cover Jr., J.F., 1997.
Absence of skin alkaloids in captive-raised Madagascan mantelline
frogs (Mantella) and sequestration of dietary alkaloids. Toxicon 35,
1131–1135.
Excoffier, L., Smouse, P.E., Quattro, J.M., 1992. Analysis of molecular
variance inferred from metric distances among DNA haplotypes:
application to human mitochondrial restriction data. Genetics 131,
479–491.
Garc�ıa-Paris, M., Jockusch, E.L., 1999. A mitochondrial DNA
perspective on the evolution of Iberian Discoglossus (Amphibia:
Anura). J. Zool. (Lond.) 248, 209–218.
Garc�ıa-Paris, M., Good, D.A., Parra-Olea, G., Wake, D.B., 2000.
Biodiversity of Costa Rican salamanders: implications of high
levels of genetic differentiation and phylogeographic structure for
species formation. Proc. Natl. Acad. Sci. USA 97, 1640–1647.
Glaw, F., Vences, M., 1994. A Fieldguide to the Amphibians and
Reptiles of Madagascar, second ed. Vences and Glaw, K€oln.Glaw, F., Vences, M., 1997. A review of anuran eye colouration:
definitions, taxonomic implications and possible functions. In:
B€ohme, W., Bischoff, W., Ziegler, T. (Eds.), Herpetologia Bonn-
ensis (Proceedings of the Eigth Ordinary General Meeting of the
Societas Herpetologica Europaea). Bonn (SEH), pp. 125–138.
Glaw, F., Vences, M., 2000. Current counts of species diversity and
endemism of Malagasy amphibians and reptiles. In: Lourenc�o,W.R., Goodman, S.M. (Eds.), Diversit�e et end�emisme a Madagas-
car. M�emoires de la Soci�et�e de Biog�eographie, Paris, pp. 243–248.
Glaw, F., Schmidt, K., Vences, M., 2000. Nachzucht, Juvenilf€arbung
und Oophagie von Mantella laevigata im Vergleich zu anderen
Arten der Gattung (Amphibia: Ranidae). Salamandra 36, 1–24.
Goebel, A.M., Donnelly, J.M., Atz, M.E., 1999. PCR primers and
amplification methods for 12S ribosomal DNA, the control region,
cytochrome oxidase I, and cytochrome b in bufonids and other
frogs, and an overview of PCR primers which have amplified DNA
in amphibians successfully. Mol. Phylogenet. Evol. 11, 163–199.
Green, G.M., Sussman, R.W., 1990. Deforestation history of the
eastern rain forest of Madagascar from satellite images. Science
248, 212–215.
H€odl, W., Amezquita, A., 2001. Visual signalling in anuran amphib-
ians. In: Ryan, M. (Ed.), Frogs Speaking. Recent Advances in the
Study of Anuran Communication. Smithsonian Institution Press,
Washington, pp. 221–241.
Huelsenbeck, J.P., Ronquist, F., 2001. MrBayes: Bayesian inference of
phylogenetic trees. Bioinformatics 17, 754–755.
Macey, J.R., Larson, A., Ananjeva, N.B., Fang, Z., Papenfuss, T.J.,
1997. Two novel gene orders and the role of light-strand replication
in rearrangement of the vertebrate mitochondrial genome. Mol.
Biol. Evol. 14, 91–104.
Mausfeld, P., Vences, M., Schmitz, A., Veith, M., 2000. First data on
the molecular phylogeography of scincid lizards of the genus
Mabuya. Mol. Phylogenet. Evol. 17, 11–14.
Myers, N., Mittermeier, R.A., Mittermeier, C.G., de Fonseca, G.A.B.,
Kent, J., 2000. Biodiversity hotspots for conservation priorities.
Nature 403, 853–858.
Odierna, G., Vences, M., Aprea, G., L€otters, S., Andreone, F., 2001.
Chromosome data for Malagasy poison frogs (Amphibia: Ranidae:
Mantella) and their bearing on taxonomy and phylogeny. Zool. Sci.
18, 505–514.
Pintak, T., Vences, M., Glaw, F., B€ohme, W., 1998. Comparative
chromosome morphology of Malagasy poison frogs (Amphibia:
Ranidae: Mantella). Folia Zool. 47, 197–204.
Posada, D., Crandall, K.A., 1998. Modeltest: testing the model of
DNA substitution. Bioinformatics 14, 817–818.
Raxworthy, C.J., Nussbaum, R.A., 2000. Extinction and extinction
vulnerability of amphibians and reptiles in Madagascar. Amph.
Rept. Conserv. 2, 15–23.
Raymond, M., Rousset, F., 1995. An exact test for population
differentiation. Evolution 49, 608–615.
Riberon, A., Miaud, C., Grossenbacher, H., Taberlet, P., 2001.
Phylogeography of the Alpine salamander, Salamandra atra
(Salamandridae) and the influence of the Pleistocene climatic
oscillations on population divergence. Mol. Ecol. 10, 2555–2560.
Riberon, A., Sotiriou, E., Miaud, C., Andreone, F., Taberlet, P., 2002.
Lack of genetic diversity in Salamandra lanzai revealed by
cytochrome b gene sequences. Copeia 2002, 229–232.
Schaefer, H.-C., Vences, M., Veith, M., 2002. Molecular phylogeny of
Malagasy poison frogs, genus Mantella (Anura: Mantellidae):
homoplastic evolution of colour pattern in aposematic amphibians.
Org. Divers. Evol. 2, 97–105.
Schneider, S., Roessli, D., Excoffier, L., 2000. ARLEQUIN v. 2.000; A
Software for Population Genetic Data Analysis. Genetics and
Biometry Laboratory, University of Geneva, Switzerland.
Shimodaira, H., Hasegawa, M., 1999. Multiple comparison of log-
likelihoods with applications to phylogenetic inference. Mol. Biol.
Evol. 16, 1114–1116.
Sumida, M., Kaneda, H., Kato, Y., Kanamori, Y., Yonekawa, H.,
Nishioka, M., 2000. Sequence variation and structural conserva-
tion in the D-loop region and flanking genes of mitochondrial
DNA from Japanese pond frogs. Genes Genet. Syst. 75,
79–92.
Sumida, M., Kanamori, Y., Kaneda, H., Kato, Y., Nishioka, M.,
Hasegawa, M., Yonekawa, H., 2001. Complete nucleotide se-
quence and gene rearrangement of the mitochondrial genome of
the Japanese pond frog Rana nigromaculata. Genes Genet. Syst. 76,
311–325.
Summers, K., Clough, M.E., 2001. The evolution of coloration and
toxicity in the poison frog family (Dendrobatidae). Proc. Natl.
Acad. Sci. USA 98, 6227–6232.
Swofford, D.L., Olsen, G.J., Waddell, P.J., Hillis, D.M., 1996.
Phylogenetic inference. In: Hillis, D.M., Moritz, C., Mable, B.K.
(Eds.), Molecular Systematics, second ed. Sinauer, Sunderland, pp.
407–514.

M. Vences et al. / Molecular Phylogenetics and Evolution 30 (2004) 295–307 307
Swofford, D.L., 2001. PAUP*. Phylogenetic Analysis Using Parsi-
mony (*and other methods), version 4b8. Sinauer, Sunderland,
MA.
Tan, A.M., Wake, D.B., 1995. MtDNA phylogeography of the
California newt, Taricha torosa (Caudata, Salamandridae). Mol.
Phylogenet. Evol. 4, 383–394.
Tarkhnishvili, D., Thorpe, R.S., Arntzen, J.W., 2000. Pre-Pleistocene
refugia and differentiation between populations of the Caucasian
salamander (Mertensiella caucasica). Mol. Phylogenet. Evol. 14,
414–422.
Templeton, A.R., Crandall, K.A., Sing, C.F., 1992. A cladistic analysis
of phenotypic associations with haplotypes inferred from restric-
tion endonuclease mapping and DNA sequence data. III. Clado-
gram estimation. Genetics 132, 619–633.
Vallan, D., 2000. Influence of forest fragmentation on amphibian
diversity in the nature reserve of Ambohitantely, highland Mad-
agascar. Biol. Conserv. 96, 31–43.
Vallan, D., 2002. Effects of anthropogenic environmental changes on
amphibian diversity in the rain forests of eastern Madagascar. J.
Trop. Ecol. 18, 725–742.
Vences, M., Glaw, F., 2001. When molecules claim for taxonomic
change: new proposals on the classification of Old World treefrogs.
Spixiana 24, 85–92.
Vences, M., Glaw, F., B€ohme, W., 1998a. Evolutionary correlates of
microphagy in alkaloid-containing frogs (Amphibia: Anura). Zool.
Anz. 236, 217–230.
Vences, M., Glaw, F., Mausfeld, P., B€ohme, W., 1998b. Comparative
osteology of Malagasy poison frogs of the genus Mantella
(Amphibia: Ranidae: Mantellinae). Bonn. zool. Beitr. 48, 205–215.
Vences, M., Hille, A., Glaw, F., 1998c. Allozyme differentiation in the
genus Mantella (Amphibia: Anura: Mantellinae). Folia Zool. 47,
261–274.
Vences, M., Glaw, F., B€ohme, W., 1999. A review of the genus
Mantella (Anura, Ranidae, Mantellinae): taxonomy, distribution
and conservation of Malagasy poison frogs. Alytes 17, 3–72.
Vences,M., Kosuch, J., L€otters, S.,Widmer, A., K€ohler, J., Jungfer, K.-
H., Veith, M., 2000. Phylogeny and classification of poison frogs
(Amphibia: Dendrobatidae), based on mitochondrial 16S and 12S
ribosomal RNA gene sequences. Mol. Phylogenet. Evol. 15, 34–40.
Vidal-Roman�ı, J.R., Ramanhison, H., Rabenandrasana, S., 1997.
Geomorphologie granitique du Massif de l�Andringitra: sa relation
avec l�evolution de l�Ile pendant le Cenozoique. Cadernos do
Laboratorio Xeoloxico de Laxe 22, 183–208.
Yoder, A.D., Irwin, J.A., Payseur, B.A., 2001. Failure of the ILD to
determine data combinability for slow loris phylogeny. Syst. Biol.
50, 408–424.
Zimmermann, H., Hetz, P., 1992. Vorl€aufige Bestandsaufnahme und
Kartierung des gef€ahrdeten Goldfr€oschchen, Mantella aurantiaca,
im tropischen Regenwald Ost-Madagaskars. Herpetofauna 14, 33–
34.
Zimmermann, H., 1996. Der Schutz des tropischen Regenwaldes und
ein kleines Fr€oschchen in Ost-Madagaskar. Stapfia 47, 189–218.