CHROMOSOME BANDING OF SIX DENDROBATID FROGS (COLOSTETHUS, MANNOPHRYNE
Natural Stressors and Ranavirus Susceptibility in Larval WoodFrogs (Rana sylvatica)
Brooke C. Reeve,1 Erica J. Crespi,2 Christopher M. Whipps,1 and Jesse L. Brunner1,2
1Department of Environmental and Forest Biology, State University of New York College of Environmental Science and Forestry (SUNY-ESF),
Syracuse, NY2School of Biological Sciences, Washington State University, P.O. Box 644236, Pullman, WA 99164
Abstract: Chronic exposure to stressors has been shown to suppress immune function in vertebrates, making
them more susceptible to pathogens. It is less clear, however, whether many natural stressors are immuno-
suppressive. Moreover, whether stressors make disease more likely or more severe in populations is unclear
because animals respond to stressors both behaviorally and physiologically. We tested whether chronic
exposure to three natural stressors of wood frog tadpoles—high-densities, predator-cues, and low-food con-
ditions—influence their susceptibility to a lethal ranavirus both individually in laboratory experiments, and
collectively in outdoor mesocosms. Prior to virus exposure, we observed elevated corticosterone only in low-
food treatments, although other treatments altered rates of growth and development as well as tadpole
behavior. None of the treatments, however, increased susceptibility to ranavirus as measured by the proportion
of tadpoles that became infected or died, or the time to death compared to controls. In fact, mortality in the
mesocosms was actually lower in the high-density treatment even though most individuals became infected,
largely because of increased rates of metamorphosis. Overall we find no support for the hypothesis that chronic
exposure to common, ecologically relevant challenges necessarily elevates corticosterone levels in a population
or leads to more severe ranaviral disease or epidemics. Conditions may, however, conspire to make ranavirus
infection more common in metamorphosing amphibians.
Keywords: crowding, immunosuppression, nutritional stress, predator cue, ranavirus, stress
INTRODUCTION
Prolonged environmental stress is widely thought to sup-
press immune function, decreasing resistance to and
increasing the severity of infectious disease, and thus ele-
vating the risk of disease outbreaks (Pickering and
Pottinger 1989; Sheridan et al. 1994). Stress has therefore
been implicated as a driver of disease emergence in wildlife
(Carey et al. 1999; Acevedo-Whitehouse and Duffus 2009;
Martin et al. 2010). In light of the growing impacts of
emerging infectious diseases on wildlife populations
(Daszak et al. 2001; Plowright et al. 2008), there is a need to
relate environmental conditions—both natural and
anthropogenic—to stress responses and disease suscepti-
bility.
Stress can be defined in ecological terms as a physical
or behavioral state engaged to endure, avoid, or recover
Published online: April 12, 2013
Correspondence to: Jesse L. Brunner, e-mail: [email protected]
EcoHealth 10, 190–200, 2013DOI: 10.1007/s10393-013-0834-6
Original Contribution
� 2013 International Association for Ecology and Health

from adverse condition (Martin 2009). Physiologically, this
state is partially mediated by glucocorticoids, the peripheral
hormones of the neuroendocrine stress axis (hypotha-
lamic–pituitary–interrenal [HPI] axis in amphibians). In
the short term, glucocorticoids induce nutrient mobiliza-
tion, increased heart rate, intensified reflexes, redistribution
of leukocytes to peripheral tissues, and increased innate
immune responses (Sapolsky et al. 2000; Dhabhar 2002;
Hopkins and DuRant 2011). These responses enhance an
organism’s ability to deal with changes in environmental
conditions and improve wound healing and infection
resistance (Webster Marketon and Glaser 2008; Dhabhar
2009). In contrast, prolonged elevation of circulating glu-
cocorticoids reduces numbers of circulating leukocytes,
decreases cytokine production, and suppresses cell-medi-
ated immunity (Elenkov and Chrousos 1999; Haddad et al.
2002; Dhabhar 2009). Elevated levels of plasma glucocor-
ticoids are also associated with increased disease severity in
many host–pathogen systems (Sheridan et al. 1994; Pick-
ering and Pottinger 1989).
Natural environmental challenges, such as predation
risk or competition, can chronically elevate glucocorticoid
levels (Boonstra et al. 1998), and have therefore been
implicated as possible drivers of disease emergence in
wildlife (Bosch et al. 2001; Gray et al. 2009). Still, there is a
need to explicitly link variation in glucocorticoid levels
caused by environmental challenges to differences in dis-
ease susceptibility. Natural variation in food resources or
conspecific density, for instance, may cause significant, if
subtle increases in circulating glucocorticoids that adjust
energy balance in animals (Sapolsky et al. 2000), but have
no negative effects on the immune system. Alternatively,
animals may have adapted to retain immune function in
the face of common environmental challenges or modify
their behavior to alter exposure (Wingfield et al. 1983;
Sapolsky et al. 2000; McEwen and Wingfield 2003). In other
words, what seems ‘‘stressful’’ a priori may not necessarily
have deleterious effects on animals in the wild.
Understanding the relationship between environmental
challenges, glucocorticoid responses, and disease suscepti-
bility is a pressing issue for amphibians as emerging fungal
and viral infections are leading to mass mortality events,
local extinctions, and species declines (Collins and Storfer
2003; Gray et al. 2009; Teacher et al. 2010). As a result,
studies have recently focused on how natural and anthro-
pogenic environmental challenges influence disease in
amphibians, with mixed results (Echaubard et al. 2010;
Kerby et al. 2011; Koprivnikar 2010; Raffel et al. 2010;
Haislip et al. 2012). While the negative effects of glucocor-
ticoids on the tadpole immune system are well documented
in the context of metamorphosis (Rollins-Smith 1998), and
experimental elevation of glucocorticoids resulted in higher
trematode burdens in gray tree frogs in one study (Belden
and Kiesecker 2005), the links between environmental
challenges, stress responses, and individual- and popula-
tion-level susceptibility to disease are far from clear.
The objectives of the current study were to determine
(1) whether three common environmental challenges—low
food, high density, and predator cues—alter wood frog
tadpole (Rana sylvatica) stress levels as measured by growth
(development rates and size), whole-body concentrations
of corticosterone (the primary glucocorticoid in amphibi-
ans), and behavior; and (2) whether chronic exposure to
these challenges make tadpoles more susceptible to rana-
virus infection. Tadpoles were challenged for several weeks
and then exposed to a ranavirus—an often lethal emerging
pathogen—in laboratory and mesocosm experiments. This
study is the first to relate larval amphibian corticosterone
concentrations to ranavirus infection susceptibility with
multiple natural challenges, and among the first to do so at
both the individual- and the population-level.
METHODS
In April 2010, wood frog egg masses were collected from vernal
pools at the SUNY-ESF Adirondack Ecological Center (AEC)
in New York and transported to the Syracuse campus. Tad-
poles were reared to feeding stages (stage 25; Gosner 1960) in
aged tap water, at which point they were fed algae discs
(Hikari, Kyorin Co., Ltd., Japan) ad libitum. These experi-
ments used an FV3-like virus (AEC37) isolated in a previous
study (Brunner et al. 2011) from a wood frog tadpole die-off
at the AEC and passed twice from the original animal. This
research was approved by SUNY-ESF’s Institutional Animal
Care and Use Committee, protocol 2009–2011.
Laboratory Experiment
Experimental tanks were 80 9 43 9 12 cm3 semi-opaque,
plastic containers filled with aged tap water. Tadpoles were
maintained at *18�C to prevent rapid development
(Moore 1939) and a 13:11 h light:dark cycle. Tadpoles were
fed algae discs at a rate of *10% of the average body mass
per tadpole per day (Werner 1992), recalibrated weekly,
which is effectively ad libitum.
Stress and Ranavirus Susceptibility in Wood Frogs 191

Tadpoles were weighed, assigned to one of 18 groups of
20, and relocated to an experimental tank. Each tank was
randomly assigned one of four natural environmental
challenges (low food, high density, predator cue, or high
density plus predator cue), or to one of two control groups
(one exposed to ranavirus and one that was not), with three
replicate groups per treatment. At this point mean body
mass was similar among groups (mean = 0.062 g,
F = 0.296, P = 0.586). Tadpoles in the low food treatment
were fed *5% of the average body mass per tadpole twice a
week (rather than *10% daily) for the first three weeks of
the experiment, then every 3 days for the last five weeks
because some of the smallest individuals had died, appar-
ently of starvation. Similar food restriction in stage 25 R.
pipiens increased glucocorticoid levels (Glennemeier and
Denver 2002).
High-density treatments tanks had an additional 40
tadpoles to triple their density (and were provided with
triple the food to maintain per capita food levels), which
equates to 174 versus 59 m-2 in all other treatments. While
tadpole population densities can reach 400 m-2 in nature,
morphological and behavioral differences have been noted
between tadpoles raised at 25 and 75 m-2 (Relyea 2002).
High densities can increase corticosterone levels in tadpoles
(Glennemeier and Denver 2002; Rot-Nikcevic et al. 2005)
and has been hypothesized to be immunocompromising
(Gray et al. 2009).
Predator cues were generated by feeding wood frog
tadpoles to a dytiscid beetle larvae (Dytiscidae) or drag-
onfly larvae (families Libellulidae, Aeshnidae, and Cor-
dululiidae), each in 400 mL of water. Water from multiple
predators was pooled within 24 h of prey consumption and
400 mL added daily to each predator tank (similar to
Fraker et al. 2009). The cue concentrations in the tanks
were *1.5–4.0 mg of consumed tadpole L-1, within the
range that has previously produced behavioral and mor-
phological responses in larval anurans (Relyea 2002; Van
Buskirk 2001).
When the majority of the tadpoles in a replicate had
reached Gosner stages 33–35 (21 ± 1 days in all treatments
except the low-food treatment, which took 40 days) 20
haphazardly selected tadpoles in each tank were euthanized
Mass (g)
CO
RT
(ng
/g b
ody
mas
s)
0.01
0.1
1
0.01
0.1
1
Control Low Food High Density Predator Cue Hi Dens + Pred Cue
0.2 0.6 1.0 0.2 0.6 1.0 0.2 0.6 1.0 0.2 0.6 1.0 0.2 0.6 1.0
LaboratoryM
esocosm
LaboratoryM
esocosm
C LF HD PC HD+PC
Figure 1. Relationship between log-transformed whole-body corticosterone (CORT) concentration (ng g-1 body mass) and body mass after
21 days (lab) or 14 days (mesocosm) of exposure to experimental treatments. Each point is an individual. Shapes represent replicates within the
treatment. Lines are linear regressions fit to each replicate and the shaded areas are their associated 95% confidence intervals. The marginal
figures show the mean corticosterone concentration for each treatment adjusted for mass with 95% confidence intervals.
192 Brooke C. Reeve et al.

with an overdose of MS-222 (Finquel�, Argent Chemical
Laboratories, Redmond, WA) followed by severing the
spinal cord, weighed, and then frozen at -20�C until the
corticosterone assay. These stages were selected because
corticosterone has yet to increase as it will during meta-
morphosis (Rollins-Smith 1998), so we can look for ele-
vated corticosterone before it surges for other reasons, and
because tadpoles at these stages are highly susceptible to
ranavirus infection (Warne et al. 2011).
The remaining 20 tadpoles in each replicate were
weighed and staged, and then exposed as a group to
1.25 9 104 plaque forming units (pfu) of ranavirus mL-1
in 1 L. We used water-bath exposures to ensure consistency
in exposure and because ranaviruses are naturally trans-
mitted through the water (Brunner et al. 2007). Control
tadpoles were mock-exposed in water. After the 24 h the
tadpoles were individually housed in 500 mL containers
with clean, aged tap water and the experimental treatments
were continued. Approximately, 30 mL of predator cue
water was added daily to each container in the predator cue
treatment. Two additional tadpoles were added to each
high-density container in order to maintain their threefold
greater density (equivalent to 275 tadpoles m-2). These
extra tadpoles were marked with fluorescent visible implant
elastomer (VIE; Northwest Marine Technology, Shaw Island,
WA) while anesthetized to distinguish them from the
unmarked focal animals. Containers and water were
changed every 3 days, at which point the extra tadpoles
were removed, euthanized, and replaced to preclude the
possibility that they would become infected and shed virus
into the containers. Tadpoles were checked daily and dead
animals frozen at -80�C until virus screening. Those that
survived 21 days post-virus exposure were euthanized with
an overdose of MS-222 and frozen at -80�C.
Mesocosm Experiment
The laboratory experiments examined the effects of the
three challenges on individual wood frog tadpoles. In order
to determine whether individual-level responses to these
challenges predict those of a whole population, particularly
in light of how these challenges might influence tadpole
movements, contacts, and thus ranavirus transmission, we
replicated the basic design of the laboratory experiments in
mesocosms.
On 2 June 2010 tadpoles were transported to the
Collins Field Station at Vassar College, Poughkeepsie, New
York and housed in eight black, 1,135 L cattle tanks
(Rubbermaid� 300 gallon Livestock tanks, Newell Rub-
bermaid, Atlanta, GA) with a white marble chip substrate
(to facilitate visual observations) and well water to a depth
of 10 cm (*350 L). Water was continuously pumped
through ultraviolet sterilizers (Turbo Twister 2X, Coralife,
Wisconsin, USA) using Eheim pumps with coarse pre-fil-
ters (EHEIM GmbH, Germany) to clarify the water and
inactivate pathogens. Mesh barriers were used to prevent
tadpoles from being sucked into the pumps. The tanks were
sheltered from direct sunlight and rain by tarps, but were
otherwise exposed to the elements. Ambient temperatures
during the experiment were greater than in the laboratory
(mean average daily temperature at the nearby Duchess
County Airport weather station = 23�C, mean maximum
daily temperature = 30�C).
Pairs of mesocosms were randomly assigned to control,
high density, food limitation, or predator cue treatments.
There were 80 tadpoles in each of six tanks (den-
sity = 31 m-2) and 340 tadpoles in the two high-density
tanks (density = 133 m-2). Prior to their addition, a
sample of 15 tadpoles from each treatment group was
Table 1. The Proportion of Early Mortality (Before Virus Exposure), Mean Mass in Grams, and Mean Gosner Stage and Their
Associated Standard Errors for Each Treatment in the Laboratory and Mesocosm Experiments.
Laboratory experiment Mesocosm experiment
Control Low food High
density
Predator
cue
Density +
predator
Control Low
food
High
density
Predator
cue
Mortality
(pre-RV)
0.063 0.218 0.006 0.050 0.011 0.219 0.513 0.077 0.319
Mass 0.54 ± 0.02a 0.36 ± 0.03b 0.47 ± 0.03a 0.60 ± 0.03a 0.62 ± 0.04a 0.53 ± 0.02a 0.39 ± 0.02a 0.60 ± 0.03a 0.66 ± 0.04a
Stage 33.0 ± 0.3a 31.4 ± 0.8a 32.8 ± 0.3a 33.6 ± 0.2a 33.4 ± 0.4a 34.8 ± 0.6ab 32.3 ± 0.7a 37.0 ± 0.5b 35.0 ± 0.3a,b
The mass and stage means were measured from the tadpoles that were euthanized for corticosterone analysis just prior to ranavirus exposure. Treatments
within each experiment that do not share letters have significantly different treatment means based on post-hoc Tukey tests.
Stress and Ranavirus Susceptibility in Wood Frogs 193

staged and weighed. Neither body mass (mean = 0.14 g,
F = 0.011, P = 0.917) nor stage (mean & 27, range = 25–34,
F = 0.100, P = 0.752) differed between replicates.
Tadpoles were fed algae disks at a rate of 10% of the
average body mass per tadpole, per day. The low food
mesocosms were fed the control ration every third day.
Predator cues were generated by feeding wood frog larvae
to five individually housed dragonfly larvae (Aeshnidae and
Corduliidae) in mesh bags in each tank. The cages were
checked daily and those in which the tadpole had been
consumed had a new tadpole added. To establish condi-
tions of chronic stress, these manipulations continued for
14 days before sampling for glucocorticoids and were
maintained for the entire duration of the experiment.
When the majority of the tadpoles had reached Gosner
stage 33–35 (mean = 35, range = 28–41; Table 1), 14 days
after treatments were initiated, 12 tadpoles were removed
from each tank, euthanized, and frozen for corticosterone
analyses. The 12 tadpoles taken from the low-food meso-
cosms were less developed than those from the high density
mesocosms, but no other between treatment comparisons
were significant (Table 1). By this time many tadpoles had
died (13% in high density, 22% in control, 32% in predator
cue, and 51% in low food tanks; Table 1). To equilibrate
densities, tadpoles were moved between tanks in the same
treatment and then extra tadpoles from the same popula-
tion held in outside mesocosms were added until each
replicate had a density of 60 tadpoles per tank (25 m-2), or
300 (117 m-2) in the high-density tanks. Since these extra
tadpoles were added late in the experiment, they were
marked with VIE so that they could be distinguished from
the original tadpoles that had been exposed to the treat-
ments for the duration of the experiment. Only the origi-
nal, ‘‘focal’’ animals were included in the analyses.
After tadpoles were removed for corticosterone anal-
ysis, ranavirus epidemics were initiated by introducing into
each tank 12-infected conspecifics, which had been marked
with a unique VIE tag and exposed to a high dose of
ranavirus (2.5 9 105 pfu mL-1) via water bath for 24 h
prior. This was meant to simulate the early stages of epi-
demics in vernal pools, emphasizing transmission by direct
contact while minimizing stochastic loss of the infection
that might result from fewer infected individuals being
introduced (Brunner et al. 2007).
Mesocosms were checked three times a day for mor-
tality and metamorphosing animals. Tadpoles found dead
were removed and frozen at -80�C. Metamorphosing
tadpoles (forelimb emergence; Gosner stage 42) were
removed, euthanized with an overdose of MS-222, and
frozen. The experiment continued until no tadpoles were
left in a tank, or until no deaths had been observed for
10 days, at which point the remaining tadpoles were
euthanized and frozen for virus screening.
Twenty days after the initiation of stress treatments
(6 days after the addition of infected conspecifics) remote
surveillance cameras (LHU31 4501, Lorex, Plainfield, IN,
USA) were placed above each mesocosm to record the
movements of the tadpoles. The paths of 20 haphazardly
selected tadpoles in each tank were tracked frame-by-frame
(every 0.5 s) for 5 min using ImageJ (Rasband 1997) with
the manual-tracking module. These tracks were used to
estimate the average velocity of tadpoles in each mesocosm
as a surrogate for movement and contact rates. Unfortu-
nately, it was not possible to distinguish in these videos the
original focal from the extra tadpoles that had been added
later, but the majority of tadpoles in each tank were there
from the start of the experiment and so most tracks should
be from focal tadpoles.
Corticosterone Radioimmunoassay
Whole-body corticosterone concentrations of the focal
tadpoles from both experiments were analyzed by radio-
immunoassay (RIA) following the methods of Ledon-Rettig
et al. (2009). In brief, tadpoles were homogenized, lipids
extracted by a series of purifications in ethyl acetate, and
corticosterone isolated by thin layer chromatography with a
final ether extraction. After drying under nitrogen flow,
samples were resuspended in phosphate-buffered saline,
400 lL of which was added into the RIA. We obtained
estimates of corticosterone content from an average of 10
tadpoles from each laboratory tank and 12 tadpoles from
each mesocosm, which were analyzed in two separate sets
of assays. For the laboratory experimental samples, the RIA
inter-assay coefficient of variation (CV) among five assays
was 15.7% and the mean intra-assay CV was 2.4%. For the
mesocosm experiment samples, the RIA inter-assay CV
among three assays was 12.7% and the mean intra-assay CV
was 6.8%. All corticosterone estimates were adjusted for
body weight of the tadpole and reported in ng g-1 body
mass.
Virus Screening
Livers were dissected from tadpoles in the laboratory
experiment and digested in cell lysis buffer (0.1 M NaCl,
194 Brooke C. Reeve et al.

0.05 M Tris–HCl, 0.001 M EDTA) with Proteinase K.
Genomic DNA was then extracted using a salt extraction
protocol (Sambrook and Russell 2001) and tested for rana-
virus DNA using polymerase chain reaction (PCR) with
primers specific to Ranavirus major capsid protein (MCP 4/5;
Mao et al. 1999). PCR products were visualized on a 1.5%
agarose gel stained with 0.1 lg/mL ethidium bromide. Each
extracted DNA sample was screened twice by PCR; negative
and inconsistent samples were run a third time.
We used the DNeasy Blood and Tissue kits to extract
DNA from the livers of the mesocosm tadpoles (Qiagen,
Valencia, CA). Samples were diluted to 20 ng DNA lL-1
with elution buffer using measurements from a NanoDrop
1000 (Thermo Fisher Scientific) and then screened in
duplicate 20 lL reactions using a quantitative Taqman
realtime PCR (qPCR) reaction with primers and probe
internal to MCP 4/5 (Brunner and Collins 2009). Negative
samples from both the laboratory and mesocosm experi-
ments were rerun in duplicate with qPCR. Any sample that
tested positive in at least two reactions was scored as
ranavirus-positive.
Statistical Analyses
Whole-body corticosterone concentrations and tadpole
average velocities were natural log-transformed to achieve
normality. We used linear models to determine whether
pre-exposure mass, velocity, prevalence of infection, and
case mortality (the proportion of infected animals that
died) varied among treatments. Pearson’s correlation
coefficients were calculated to test for correlations between
stage, mass, and corticosterone concentrations. Because
tadpoles within a tub or mesocosm are not independent, we
used linear mixed models to determine differences in cor-
ticosterone concentrations, mass, and stage across treat-
ments, with tub or mesocosm as the random effect
(random intercepts) using the lmer() function in the lme4
package (Bates et al. 2011) in R 2.11.1 (R Development
Core Team 2011). The variation explained by these random
effects were very small (e.g., s < 0.0001 for corticosterone
in both experiments) so we used Tukey contrasts for
pairwise comparisons of adjusted means among treatments.
We used Kaplan–Meier curves, Cox proportional hazard
models (survival package; Therneau et al. 2011), and, in the
case of the mesocosm experiment where tadpoles were both
dying and metamorphosing, competing risks models
(cmprsk package; Gray 2010) to test for treatment effects
on rates of mortality and metamorphosis.
RESULTS
Laboratory Experiment
Corticosterone varied among treatments (F1,4 = 4.94,
P < 0.001), with concentrations two to three times higher
in the low-food treatment compared to all other treatments
(all P < 0.05, except compared to high density where
P = 0.091; Fig. 1). The low-food treatment had more than
twice the pre-virus exposure mortality (30%) and signifi-
cantly lower body masses relative to all other treatments
(Table 1), suggesting our manipulation was very strong.
Final mass was negatively correlated with corticosterone
(r = -0.44, t = -6.34, P < 0.001; Fig. 1); smaller animals,
like those in low-food treatment, had higher levels of cor-
ticosterone. The difference among treatments in cortico-
sterone concentrations was largely accounted for by the
masses of individual animals: in the full model with treat-
ment and mass the effect of mass is strongly significant
(F1,4 = 41.35, P < 0.001), but the treatment effect was no
longer significant (F1,4 = 1.71, P = 0.150).
Although low-food tadpoles were smaller, had higher
corticosterone concentrations and died in greater numbers
before pathogen exposure, we observed no differences
among treatments in outcome of ranavirus exposure. Of
the 129 exposed tadpoles, 123 (95%) tested positive, and 65
(50%) died during the 21-day experiment. Infection prev-
alence exceeded 83% in every tub and did not vary sig-
nificantly between treatments (F4,10 = 1.20, P = 0.371), nor
did case mortality (F4,10 = 2.0, P = 0.172) or time to death
(F4,10 = 0.81, P = 0.550; Fig. 2).
Pro
port
ion
died
0.0
0.2
0.4
0.6
0.8
1.0
Pro
port
ion
infe
cted
0.0
0.2
0.4
0.6
0.8
1.0
Cas
e m
orta
lity
0.0
0.2
0.4
0.6
0.8
1.0
Co
ntr
ol
Lo
w f
oo
dH
igh
den
sity
Pre
dat
or
cue
Hig
h d
ens
+ P
red
cu
e
Co
ntr
ol
Lo
w f
oo
dH
igh
den
sity
Pre
dat
or
cue
Hig
h d
ens
+ P
red
cu
e
Co
ntr
ol
Lo
w f
oo
dH
igh
den
sity
Pre
dat
or
cue
Hig
h d
ens
+ P
red
cu
e
s
+
Figure 2. Proportion of tadpoles that died following ranavirus
exposure in the laboratory experiment, the proportion that became
infected, and the proportion of the infected animals that died (case
mortality). Bars show the mean values and the points show the values
for individual replicates.
Stress and Ranavirus Susceptibility in Wood Frogs 195
Mesocosm Experiment
As in the laboratory experiment, more tadpoles died prior
to virus exposure in the low-food mesocosms (51%) than
in other treatments (�32%; Table 1), although their mass
was only significantly smaller compared to high-density
tadpoles (P = 0.043). The pattern of whole-body cortico-
sterone concentrations was similar to that of the laboratory
experiment (Fig. 1), although the laboratory data were
more variable than the mesocosm data (mean residual
SD = 0.177 among the mesocosms and 0.279 among the
laboratory tubs; t = 2.72, P = 0.013). Tadpoles in the low-
food treatment had slightly, but not significantly higher
levels of corticosterone compared to controls (F3,92 = 2.91,
P = 0.098). No other treatments differed in corticosterone.
As in the laboratory experiment, (log-transformed) corti-
costerone concentrations were negatively correlated with
mass (r = -0.519, t = -5.90, df = 94, P < 0.001) and
again the effect of treatment on corticosterone was signif-
icant only when mass was not included in the model
(treatment only: F3 = 2.91, P = 0.039; treatment effect
when mass was included in the model: F3 = 0.026,
P = 0.994). Thus, nearly all of the influence of treatments
on whole-body corticosterone concentrations could be
explained by their effects on tadpole mass.
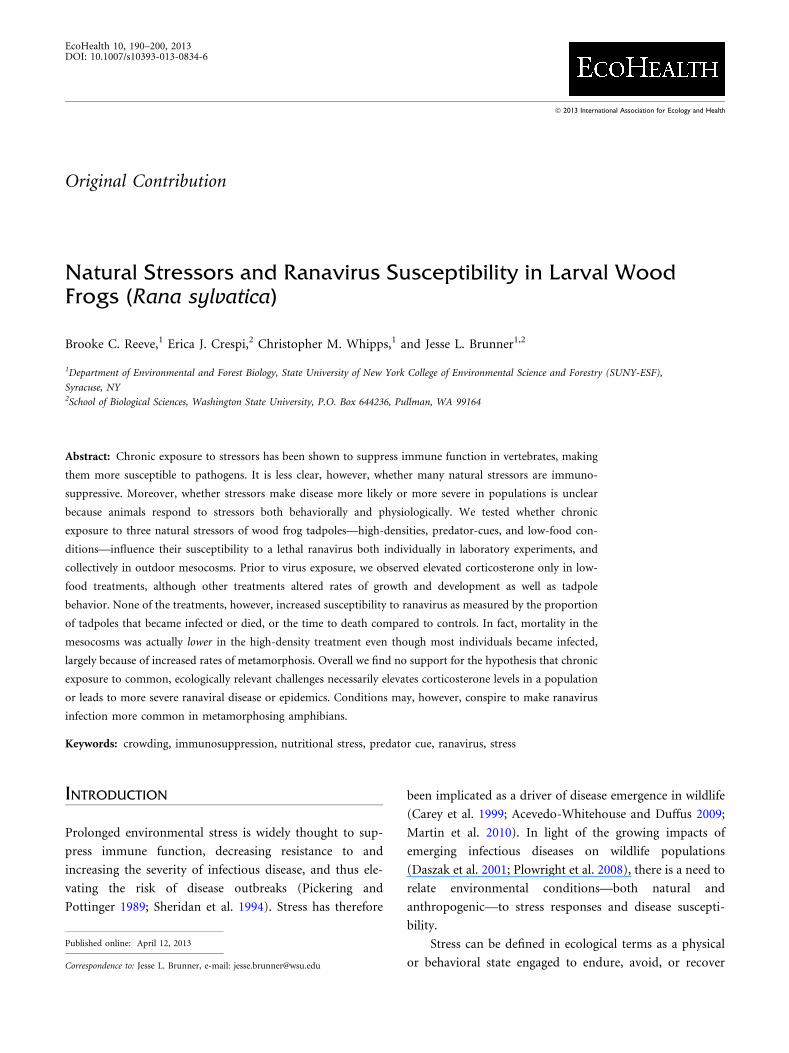
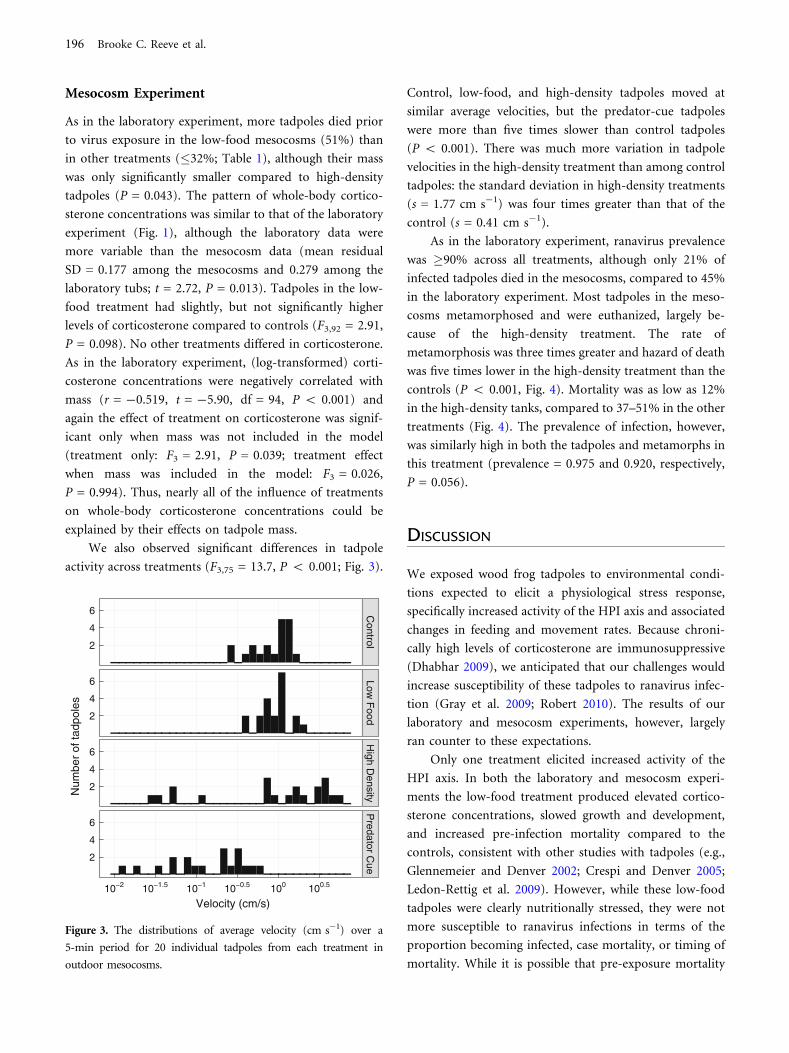
We also observed significant differences in tadpole
activity across treatments (F3,75 = 13.7, P < 0.001; Fig. 3).
Control, low-food, and high-density tadpoles moved at
similar average velocities, but the predator-cue tadpoles
were more than five times slower than control tadpoles
(P < 0.001). There was much more variation in tadpole
velocities in the high-density treatment than among control
tadpoles: the standard deviation in high-density treatments
(s = 1.77 cm s-1) was four times greater than that of the
control (s = 0.41 cm s-1).
As in the laboratory experiment, ranavirus prevalence
was �90% across all treatments, although only 21% of
infected tadpoles died in the mesocosms, compared to 45%
in the laboratory experiment. Most tadpoles in the meso-
cosms metamorphosed and were euthanized, largely be-
cause of the high-density treatment. The rate of
metamorphosis was three times greater and hazard of death
was five times lower in the high-density treatment than the
controls (P < 0.001, Fig. 4). Mortality was as low as 12%
in the high-density tanks, compared to 37–51% in the other
treatments (Fig. 4). The prevalence of infection, however,
was similarly high in both the tadpoles and metamorphs in
this treatment (prevalence = 0.975 and 0.920, respectively,
P = 0.056).
DISCUSSION
We exposed wood frog tadpoles to environmental condi-
tions expected to elicit a physiological stress response,
specifically increased activity of the HPI axis and associated
changes in feeding and movement rates. Because chroni-
cally high levels of corticosterone are immunosuppressive
(Dhabhar 2009), we anticipated that our challenges would
increase susceptibility of these tadpoles to ranavirus infec-
tion (Gray et al. 2009; Robert 2010). The results of our
laboratory and mesocosm experiments, however, largely
ran counter to these expectations.
Only one treatment elicited increased activity of the
HPI axis. In both the laboratory and mesocosm experi-
ments the low-food treatment produced elevated cortico-
sterone concentrations, slowed growth and development,
and increased pre-infection mortality compared to the
controls, consistent with other studies with tadpoles (e.g.,
Glennemeier and Denver 2002; Crespi and Denver 2005;
Ledon-Rettig et al. 2009). However, while these low-food
tadpoles were clearly nutritionally stressed, they were not
more susceptible to ranavirus infections in terms of the
proportion becoming infected, case mortality, or timing of
mortality. While it is possible that pre-exposure mortality
Velocity (cm/s)
Num
ber
of ta
dpol
es
2
4
6
2
4
6
2
4
6
2
4
6
Control
Low F
oodH
igh Density
Predator C
ue
10−2 10−1.5 10−1 10−0.5 100 100.5
Figure 3. The distributions of average velocity (cm s-1) over a
5-min period for 20 individual tadpoles from each treatment in
outdoor mesocosms.
196 Brooke C. Reeve et al.

selectively eliminated tadpoles with the highest corticoste-
rone levels, which might have showed increased suscepti-
bility to infection, this suggests that starvation itself
presents a greater risk to tadpoles than any associated
immunosuppression. No other challenges increased sus-
ceptibility to ranavirus infection.
The apparent lack of immunosuppression is surprising
given the well-documented observation in mammals and
other vertebrates that nutrient restriction or alterations
in energy balance signals associated with food restriction
(e.g., glucocorticoids, leptin; Demas 2010) have negative
effects on the immune system. For example, cell-mediated
immunity was suppressed and lymphocyte numbers
decreased in nutritionally stressed bobwhite chicks
(Lochmiller et al. 1993) and young cotton rats fed a low-
protein diet had fewer splenocytes (Davis et al. 1995). In
addition, amphibian tadpoles given a higher quality diet
had enhanced immune responses and higher survival when
exposed to the fungal pathogen, Batrachochytrium dendro-
batidis (Venesky et al. 2012).
There are several potential explanations for the lack of
difference in susceptibility. First, it is possible that wood
frog tadpoles mount weak, ineffective responses to rana-
virus infection regardless of nutritive condition or gluco-
corticoid levels. Anurans do not have a fully functioning
adaptive immune system until after metamorphosis (Rollins-
Smith 1998). Yet amphibian larvae do respond to and clear
ranavirus infections (Brunner et al. 2004; Robert 2010),
and a sizeable fraction of the infected tadpoles in our
experiments survived for several weeks (Figs. 2, 4), which
suggests a moderately robust response in at least some
tadpoles. Alternatively, the response to ranaviruses might
involve components of the immune system that are not
modulated by physiological stress. Again, the evidence does
not support this hypothesis. While the response to rana-
virus in Xenopus laevis tadpoles is largely innate, including
up-regulation of inflammation factors and immunoglobin
expression (Robert 2010; Chen and Robert 2011), innate
immune functions are modulated by glucocorticoids
(Chinenov and Rogatsky 2007) as well as other factors
related to nutritional condition (Demas 2010). Perhaps,
then, food restriction does not elicit a large enough ele-
vation in glucocorticoids to be immunosuppressive, or
maybe wood frogs have evolved mechanisms to avoid the
immunosuppressive effects of this common environmental
challenge.
While we had expected predator cues and high densi-
ties to elicit stress responses as well, results from previous
studies have been inconsistent. Glennemeier and Denver
(2002) and Rot-Nikcevic et al. (2005) found that conspe-
cific density alters corticosterone concentrations, but Bel-
den et al. (2007), like us, did not detect any relationship
between wood frog tadpole density and corticosterone
levels in experimental mesocosms, or among natural ponds.
Time from virus exposure (days)
Cum
ulat
ive
inci
denc
e
0.0
0.2
0.4
0.6
0.8
1.0
Death Metamorphosis
0 5 10 15 20 25 30 0 5 10 15 20 25 30
Control
Low food
High density
Predator cue
Figure 4. Cumulative hazard of death (left) or metamorphosis (right) for each treatment following virus exposure in outdoor mesocosms.
Stress and Ranavirus Susceptibility in Wood Frogs 197

Similarly, the glucocorticoid responses to predators vary in
the literature, possibly due to difference in experimental
design. Fraker et al. (2009) showed reduced activity at 4 h
in response to predator cues, in concert with reduced
corticosterone concentrations, while Dahl et al. (2012)
showed increased corticosterone levels within 24 h of
predator exposure, but no predator-induced elevation of
corticosterone 2 weeks later. Perhaps our tadpoles habitu-
ated to the predator cues over the 2 weeks before we
measured corticosterone.
The effects of predators on disease susceptibility
reported in the literature have also been mixed. Kerby et al.
(2011), for instance, observed that tiger salamander larvae
exposed to predator cues were more likely to succumb to
ranavirus infection, and Belden and Wojdak (2011) showed
that mortality was significantly increased when tadpoles were
exposed to both predators and trematode parasites com-
pared to parasites alone. By contrast, Raffel et al. (2010)
found no difference in trematode burden between predator-
exposed and non-exposed American toad tadpoles, and a
recent study by Haislip et al. (2012) found that while pred-
ator exposure strongly influenced the behavior and survival
of four species of anuran tadpoles, predator cues did not
increase their susceptibility to a ranavirus. The differences in
outcomes may again be a result of the timing and duration of
exposure to predator cues. Both Kerby et al. (2011) and
Belden and Wojdak (2011) introduced the predator cues at
the same time as the pathogens, whereas we and Haislip et al.
(2012) introduced predator cues for over a week before the
virus exposure and, like Raffel et al. (2010), maintained the
exposure throughout the experiment. Interestingly, this
would seem to suggest that contrary to expectations from
mammalian and avian systems, acute exposure to predators
may increase susceptibility while chronic exposure has little
effect in amphibian tadpoles.
We had also expected that, separate from individual-level
susceptibility, behavioral responses to these challenges—
changes in feeding and movement rates—would influence
transmission dynamics in our mesocosm experiment. In
particular, we expected predator-induced reductions in
activity and movement that we and others have observed (e.g.,
Van Buskirk 2001; Raffel et al. 2010; Haislip et al. 2012) would
reduce contact rates and thus transmission since ranavirus is
spread by close contact (Brunner et al. 2007). Similarly, we
expected that transmission would be highest in the high-
density treatment where there were more than four times as
many tadpoles crowded into the mesocosm because trans-
mission of animal disease is often thought to be density-
dependent (McCallum et al. 2001, but see Harp and Petranka
2006). With �90% infection prevalence across all treatments
it is difficult to determine how or whether tadpole density-
influenced ranavirus transmission. A separate experiment
currently being analyzed will address this question.
The high-density mesocosms did see significantly lower
mortality, but apparently not because they were less sus-
ceptible or less likely to become infected. Rather, propor-
tionally fewer infected tadpoles died of ranavirus infection
in the high-density mesocosms because they metamor-
phosed at a much greater rate. For logistical reasons
metamorphosing tadpoles in the mesocosms were eutha-
nized and thus censored (not counted as having died) in
our analyses. We cannot be certain whether these individ-
uals would have died soon after metamorphosis or, had
they survived, whether they would have cleared the infec-
tion. Larval and metamorphosed tiger salamanders can
maintain sublethal infections for several months (Brunner
et al. 2004), so it is possible that these wood frog meta-
morphs would have survived with infections.
This finding illustrates how physiological and devel-
opmental responses to infection in tadpoles can influence
ranavirus epidemiology. We previously showed that rana-
virus infection activates the HPI axis, resulting in increased
corticosterone concentrations and development rates, in
late-staged wood frog tadpoles (Warne et al. 2011). In our
mesocosm experiment, more tadpoles in the high-density
treatment were prometamorphic (i.e., at later develop-
mental stages, Table 1). They could therefore mount a
stress-induced acceleration of metamorphosis, here caused
by the stress of ranavirus infection rather than increasing
density or water volume reductions that signal pond drying
in temporary ponds (Denver et al. 2002). High-density
conditions, which accelerate development, might then lead
to a greater proportion of infected tadpoles metamor-
phosing and dispersing from a pond, which could initiate
epidemics in following years (Brunner et al. 2004) and in
nearby ponds. While we did not measure corticosterone
after ranavirus exposure, this result highlights the need to
examine how environmental conditions alter the stress
response of anuran tadpoles to ranavirus infection.
In summary, chronic exposure to three ecologically
important natural stressors did not make wood frog tad-
poles more susceptible to ranavirus infection individually
or as a population. Although we observed changes in
growth, development and activity caused by our challenges,
corticosterone was elevated only under low-food condi-
tions, and even then the risks of infection or mortality were
198 Brooke C. Reeve et al.
no greater than in controls. It is possible that combinations
of stressors or evolutionarily novel stressors (e.g., intro-
duced predators, pesticides) elicit stronger physiological
changes (e.g., increases in glucocorticoids) and are more
immunosuppressive; most studies identifying immuno-
suppression or worsened disease outcomes from environ-
mental factors have focused on anthropogenic stressors,
particularly chemicals (Forson and Storfer 2006; Kerby
et al. 2011; Nain et al. 2011). Yet our results caution against
the common assumption that what seems ‘‘stressful’’ a
priori necessarily increases physiological stress or suscep-
tibility to disease in wild amphibians.
ACKNOWLEDGMENTS
We thank Robin Warne for providing RIA training and
Keri VanCamp and Vassar College for the use of the Collins
Field Station. Thanks also to Lynne Beatty, Deanna Russell,
and Alex Guitard for their assistance with the mesocosm
experiment. This research was funded by National Science
Foundation grant IOS-0818212 to EJC and DEB1139199 to
JLB and a Sigma Xi Grant in Aid of Research to BCR.
REFERENCES
Acevedo-Whitehouse KA, Duffus A (2009) Effects of environ-mental change on wildlife health. Philosophical Transactions ofthe Royal Society B 364:3429–3438
Bates D, Maechler M, Bolker B (2011) lme4: Linear Mixed-EffectsModels Using S4 Classes. R package version 0.999375-39.Available: http://CRAN.R-project.org/package=lme4
Belden LK, Kiesecker JM (2005) Glucocorticosteroid hormonetreatment of larval treefrogs increases infection by Alaria sp.trematode cercariae. Journal of Parasitology 91(3):686–688
Belden LK, Wojdak JM (2011) The combined influence of trem-atode parasites and predatory salamanders on wood frog (Ranasylvatica) tadpoles. Oecologia 166:1077–1086
Belden LK, Rubbo MJ, Wingfield JC, Kiesecker JM (2007)Searching for the physiological mechanism of density-depen-dence: does corticosterone regulate tadpole responses to den-sity? Physiological and Biochemical Zoology 80(4):444–451
Boonstra R, Hik D, Singleton GR, Tinnikov A (1998) The impactof predator-induced stress on the snowshoe hare cycle. Ecolog-ical Monographs 68:371–394
Bosch J, Martınez-Solano I, Garcia-Paris M (2001) Evidence of achytrid fungus infection involved in the decline of the commonmidwife toad (Alytes obstetricans) in protected areas in centralSpain. Biological Conservation 97(3):331–337
Brunner JL, Collins JC (2009) Testing assumptions of the trade-offtheory of the evolution of parasite virulence. EvolutionaryEcology Research 11:1169–1188
Brunner JL, Schock DM, Collins JP (2007) Transmissiondynamics of the amphibian ranavirus Ambystoma tigrinumvirus. Diseases of Aquatic Organisms 77:87–95
Brunner JL, Schock DM, Collins JP, Davidson EW (2004) The roleof an intraspecific reservoir in the persistence of a lethal rana-virus. Ecology 85(2):560–566
Brunner JL, Barnett KE, Gosier CJ, McNulty SA, Rubbo MJ,Kolozsvary MB (2011) Ranavirus infection in die-offs of vernalpool amphibians in New York, USA. Herpetological Review42:76–79
Carey C, Cohen N, Rollins-Smith L (1999) Amphibian declines:an immunological perspective. Developmental and ComparativeImmunology 23(6):459–472
Chen G, Robert J (2011) Antiviral immunity in amphibians.Viruses 3(11):2065–2086
Chinenov Y, Rogatsky I (2007) Glucocorticoids and the innateimmune system: crosstalk with the toll-like receptor signalingnetwork. Molecular and Cellular Endocrinology 275(1–2):30–42
Collins JP, Storfer A (2003) Global amphibian declines: sortingthe hypotheses. Diversity and Distributions 9(2):89–98
Crespi EJ, Denver RJ (2005) Roles of stress hormones in foodintake regulation in anuran amphibians throughout the lifecycle. Comparative Biochemistry and Physiology 141(4):381–390
Dahl E, Orizoala G, Winberg S, Laurila A (2012) Geographicvariation in corticosterone response to chronic predator stressin tadpoles. Journal of Evolutionary Biology 25:1066–1076
Daszak P, Cunningham AA, Hyatt AD (2001) Anthropogenicenvironmental change and the emergence of infectious diseasesin wildlife. Acta Tropica 78(2):103–116
Davis RL, Lochmiller RL, Warde WD (1995) Spleenocyte sub-populations of weanling cotton rats (Sigmodon hispidus) areinfluenced by moderate protein intake. Journal of Mammalogy76(3):912–924
Demas GE (2010) In vivo but not in vitro leptin enhances lym-phocyte proliferation in Siberian hamsters (Phodopus sungorus).General and Comparative Endocrinology 166(2):314–319
Denver RJ, Glennemeier KA, Boorse GC (2002) Endocrinology ofcomplex life cycles: Amphibians. In: Hormones, Brain andBehavior, Pfaff D, Arnold A, Etgen A, Fahrbach S, Moss R,Rubin R (editors), San Diego: Academic Press, Inc., pp 469–513
Dhabhar FS (2002) Stress-induced augmentation of immunefunction—the role of stress hormones, leukocyte trafficking,and cytokines. Brain, Behavior, and Immunity 16(6):785–798
Dhabhar FS (2009) Enhancing versus suppressive effects of stresson immune function: implications for immunoprotection andimmunopathology. Neuroimmunomodulation 16(5):300–317
Echaubard P, Little K, Pauli B, Lesbarreres D (2010) Context-dependent effects of ranaviral infection on northern leopardfrog life history traits. PLoS ONE 5(10):e13723
Elenkov IJ, Chrousos GP (1999) Stress hormones, Th1/Th2 pat-terns, pro/anti-inflammatory cytokines and susceptibility todisease. Trends in Endocrinology and Metabolism 10(9):359–368
Forson DD, Storfer A (2006) Atrazine increases ranavirus sus-ceptibility in the tiger salamander, Ambystoma tigrinum. Eco-logical Applications 16:2325–2332
Fraker ME, Hu F, Cuddapah V, McCollum SA, Relyea RA,Hempel J, et al. (2009) Characterization of an alarm pheromonesecreted by amphibian tadpoles that induces behavioral inhi-bition and suppression of the neuroendocrine stress axis. Hor-mones and Behavior 55(4):520–529
Stress and Ranavirus Susceptibility in Wood Frogs 199

Glennemeier KA, Denver RJ (2002) Role for corticoids in medi-ating the response of Rana pipiens tadpoles to intraspecificcompetition. Journal of Experimental Zoology 292(1):32–40
Gosner KL (1960) A simplified table for staging anuran embryosand larvae with notes on identification. Herpetologica 16:183–190
Gray B (2010) cmprsk: Subdistribution Analysis of CompetingRisks. R Package Version 2.2-1. Available: http://CRAN.R-project.org/package=cmprsk
Gray MJ, Miller DL, Hoverman JT (2009) Ecology and pathologyof amphibian ranaviruses. Diseases of Aquatic Organisms87(3):243–266
Haddad J, Saade N, Safieh-Garabedian B (2002) Cytokines andneuro–immune–endocrine interactions: a role for the hypo-thalamic–pituitary–adrenal revolving axis. Journal of Neuroim-munology 133:1–19
Haislip NA, Hoverman JT, Miller DL, Gray MJ (2012) Naturalstressors and disease risk: does the threat of predation increaseamphibian susceptibility to ranavirus? Canadian Journal ofZoology 90:893–902
Harp EM, Petranka JW (2006) Ranavirus in wood frogs (Ranasylvatica): potential sources of transmission within and betweenponds. Journal of Wildlife Diseases 42(2):307–318
Hopkins WA, DuRant SE (2011) Innate immunity and stressphysiology of eastern hellbenders (Cryptobranchus alleganiensis)from two stream reaches with differing habitat quality. Generaland Comparative Endocrinology 174:107–115
Kerby JL, Hart AJ, Storfer A (2011) Combined effects of virus,pesticide, and predator cue on the larval tiger salamander(Ambystoma tigrinum). EcoHealth 8(1):46–54
Koprivnikar J (2010) Interactions of environmental stressors im-pact survival and development of parasitized larval amphibians.Ecological Applications 20(8):2263–2272
Ledon-Rettig CC, Pfennig DW, Crespi EJ (2009) Stress hormonesand the fitness consequences associated with the transition to anovel diet in larval amphibians. The Journal of ExperimentalBiology 212:3743–3750
Lochmiller RL, Vestey MR, Boren JC (1993) Relationship betweenprotein nutritional status and immunocompetence in northernbobwhite chicks. The Auk 110(3):503–510
Mao J, Green DE, Fellers G, Chinchar VG (1999) Molecularcharacterization of iridoviruses isolated from sympatricamphibians and fish. Virus Research 63(1–2):45–52
Martin LB (2009) Stress and immunity in wild vertebrates: timingis everything. General and Comparative Endocrinology163(1–2):70–76
Martin LB, Hopkins WA, Mydlarz LD, Rohr JR (2010) The effectsof anthropogenic global changes on immune functions anddisease resistance. Annals of the New York Academy of Sciences1195:129–148
McCallum H, Barlow N, Hone J (2001) How should pathogentransmission be modelled? Trends in Ecology and Evolution16(6):295–300
McEwen BS, Wingfield JC (2003) The concept of allostasis inbiology and biomedicine. Hormones and Behavior 43:2–15
Moore JA (1939) Temperature tolerance and rates of developmentin the eggs of Amphibia. Ecology 20(4):459–478
Nain S, Bour A, Chalmers C, Smits J (2011) Immunotoxicity anddisease resistance in Japanese quail (Corturnix corturnix japon-ica) exposed to malathion. Ecotoxicology 20(4):892–900
Pickering AD, Pottinger TG (1989) Stress responses and diseaseresistance in salmonid fish: effects of chronic elevation of plasmacortisol. Fish Physiology and Biochemistry 7(1–6):253–258
Plowright RK, Sokolow SK, Gorman ME, Daszak P, Foley JE(2008) Causal inference in disease ecology: investigating eco-logical drivers of disease emergence. Frontiers in Ecology and theEnvironment 6(8):420–429
R Development Core Team (2011) R: A language and environ-ment for statistical computing. R Foundation for StatisticalComputing, Vienna, Austria. http://www.R-project.org/
Raffel TR, Hoverman JT, Halstead NT, Michel PJ, Rohr JR (2010)Parasitism in a community context: trait-mediated interactionswith competition and predation. Ecology 91(7):1900–1907
Rasband WS (1997–2011) ImageJ. Bethesda, MD: US NationalInstitutes of Health. http://imagej.nih.gov/ij/
Relyea RA (2002) Competitor-induced plasticity in tadpoles:consequences, cues, and connections to predator-inducedplasticity. Ecological Monographs 72(4):523–540
Robert J (2010) Emerging ranaviral infectious diseases andamphibian decline. Diversity 2(3):314–330
Rollins-Smith LA (1998) Metamorphosis and the amphibianimmune system. Immunological Reviews 166:221–230
Rot-Nikcevic I, Denver RJ, Wassersug RJ (2005) The influence ofvisual and tactile stimulation on growth and metamorphosis inanuran larvae. Functional Ecology 19:1008–1016
Sambrook J, Russell DW (2001) Molecular Cloning: A LaboratoryManual, 3rd ed., New York: Cold Spring Harbor Laboratory Press
Sapolsky RM, Romero LM, Munck AU (2000) How do gluco-corticoids influence stress responses? Integrating permissive,suppressive, stimulatory, and preparative actions EndocrineReviews 21(1):55–89
Sheridan JF, Dobbs C, Brown D, Zwilling B (1994) Psychoneu-roimmunology: stress effects on pathogenesis and immunityduring infection. Clinical Microbiology Reviews 7(2):200–212
Teacher AGF, Cunningham AA, Garner TWJ (2010) Assessing thelong-term impact of ranavirus infection in wild common frogpopulations. Animal Conservation 13(5):514–522
Therneau T, original Splus->R port by Lumley T (2011) Survival:Survival Analysis, Including Penalised Likelihood. R Package Ver-sion 2.36-5. Available: http://CRAN.R-project.org/package=survival
Van Buskirk J (2001) Specific induced responses to differentpredator species in anuran larvae. Journal of Evolutionary Biol-ogy 14:482–489
Venesky MD, Wilcoxen TE, Rensel MA, Rollins-Smith L, Kirby JL,Parris MJ (2012) Dietary protein restriction impairs growth,immunity, and disease resistance in southern leopard frogtadpoles. Oecologia 169:23–31
Warne RW, Crespi EJ, Brunner JL (2011) Escape from the pond:stress and developmental responses to ranavirus infection inwood frog tadpoles. Functional Ecology 25(1):139–146
Webster Marketon JI, Glaser R (2008) Stress hormones and im-mune function. Cellular Immunology 252(1–2):16–26
Werner EE (1992) Competitive interactions between wood frogand northern leopard frog larvae: the influence of size andactivity. Copeia 1992(1):26–35
Wingfield JC, Moore MC, Farner DS (1983) Endocrine responsesto inclement weather in naturally breeding populations ofwhite-crowned sparrows (Zonotrichia leucophrys pugetensis). TheAuk 100:56–62
200 Brooke C. Reeve et al.
Copyright © 2022 FDOKUMEN