HYPERSPECTRAL BIDIRECTIONAL REFLECTANCE MEASUREMENTS OF FAGUS SYLVATICA LEAVES
11
© EARSeL and Warsaw University, Warsaw 2005. Proceedings of 4th EARSeL Workshop on Imaging Spectroscopy. New quality in environmental studies. Zagajewski B., Sobczak M., Wrzesień M., (eds) HYPERSPECTRAL BIDIRECTIONAL REFLECTANCE MEASUREMENTS OF FAGUS SYLVATICA LEAVES Dimitrios Biliouris 1 , Karl vom Berge 2 , Jan Van Aardt 1 , Bart Muys 1 , and Pol Coppin 1 1. Katholieke Universiteit Leuven, Department of Land Management, Leuven 3000, Belgium; [email protected];[email protected]; [email protected]; [email protected] 2. Katholieke Universiteit Leuven, Departments of Computer Science, Heverlee 3001, Belgium; [email protected] ABSTRACT This research focused on bidirectional reflectance distribution function (BRDF) measurements of Fagus sylvatica leaves, using a state of the art new multispectral Compact Laboratory Spectro- Gonioreflectometer (CLabSpeG). The BRDF was based on 4356 reflectance measurements cover- ing the electromagnetic spectrum from 350 nm to 2500 nm. These measurements were acquired by independent positioning of the sensor, sample holder, and light source, with an azimuth and zenith resolution of 30 and 15 degrees, respectively. A series of BRDF data of leaves were col- lected using CLabSpeG in a limited acquisition time of 2 hours and 36 minutes. Data were col- lected from 12 leaves for two seven year old Fagus trees. Our methodology protocol focused on BRDF behavior and modeling of leaves. The primary research objective was to represent the non- lambertian state of leaf reflectance, while investigating which wavelengths produce a more pro- found reflectance effect at certain angular positions. The topological position of leaves in a tree was found to be significant in terms of BRDF variation, resulting in reflectance differences between varying leaf positions at certain wavelengths, especially in the visible domain. A reflectance change also was recorded during the BRDF measurements due to drying effects from the labora- tory illumination source. Moreover, when goniometric changes are involved we found inadequate the collection of data in reflectance mode, due to sensor’s software rounding errors, and we sug- gest the use of raw digital number values. INTRODUCTION Our ability to both interpret remotely sensed optical data and develop new vegetation remote sens- ing approaches depend directly on our understanding of the multitude of factors controlling canopy and landscape reflectance signals (i). A fundamental understanding of the energy-matter interac- tions at the earth’s must be established in order for a meaningful analysis and processing of data obtained via remote sensing techniques (ii). Such an understanding needs to account for varia- tions in the quantity and quality of radiation recorded by the air- and space-borne sensors. Plant structural attributes control canopy reflectance characteristics by orienting the scattering in three-dimensional space, allowing the interaction of photons with multiple surfaces such as leaves, woody material, and soils (iii). The amount of reflectance in a vegetation canopy is directly linked to the scattering processes at the leaf level. Although this leaf-level scattering varies with leaf struc- ture, water content, and the biochemical constituents concentration (iv), it is highly dependent on canopy structural characteristics such as leaf area index and leaf angle distribution (v).The reflec- tance within a leaf furthermore varies between electromagnetic spectrum regions, with the visible domain (mainly driven by the absorption of chlorophylls) exhibiting different reflectance character- istics from the infrared domain (water absorption and cell structure dominating) (vi). As a result, accurate estimates of leaf spectral properties for reflectance, transmittance, and absorbance are critical for relating radiative transfer properties of leaves to their phenological and physiological state (vii).
-
Upload
independent -
Category
Documents
-
view
1 -
download
0
Transcript of HYPERSPECTRAL BIDIRECTIONAL REFLECTANCE MEASUREMENTS OF FAGUS SYLVATICA LEAVES

© EARSeL and Warsaw University, Warsaw 2005. Proceedings of 4th EARSeL Workshop on Imaging Spectroscopy. New quality in environmental studies. Zagajewski B., Sobczak M., Wrzesień M., (eds)
HYPERSPECTRAL BIDIRECTIONAL REFLECTANCE MEASUREMENTS OF FAGUS SYLVATICA LEAVES
Dimitrios Biliouris1, Karl vom Berge2, Jan Van Aardt1, Bart Muys1, and Pol Coppin1
1. Katholieke Universiteit Leuven, Department of Land Management, Leuven 3000, Belgium; [email protected];[email protected]; [email protected]; [email protected]
2. Katholieke Universiteit Leuven, Departments of Computer Science, Heverlee 3001, Belgium; [email protected]
ABSTRACT This research focused on bidirectional reflectance distribution function (BRDF) measurements of Fagus sylvatica leaves, using a state of the art new multispectral Compact Laboratory Spectro-Gonioreflectometer (CLabSpeG). The BRDF was based on 4356 reflectance measurements cover-ing the electromagnetic spectrum from 350 nm to 2500 nm. These measurements were acquired by independent positioning of the sensor, sample holder, and light source, with an azimuth and zenith resolution of 30 and 15 degrees, respectively. A series of BRDF data of leaves were col-lected using CLabSpeG in a limited acquisition time of 2 hours and 36 minutes. Data were col-lected from 12 leaves for two seven year old Fagus trees. Our methodology protocol focused on BRDF behavior and modeling of leaves. The primary research objective was to represent the non-lambertian state of leaf reflectance, while investigating which wavelengths produce a more pro-found reflectance effect at certain angular positions. The topological position of leaves in a tree was found to be significant in terms of BRDF variation, resulting in reflectance differences between varying leaf positions at certain wavelengths, especially in the visible domain. A reflectance change also was recorded during the BRDF measurements due to drying effects from the labora-tory illumination source. Moreover, when goniometric changes are involved we found inadequate the collection of data in reflectance mode, due to sensor’s software rounding errors, and we sug-gest the use of raw digital number values.
INTRODUCTION Our ability to both interpret remotely sensed optical data and develop new vegetation remote sens-ing approaches depend directly on our understanding of the multitude of factors controlling canopy and landscape reflectance signals (i). A fundamental understanding of the energy-matter interac-tions at the earth’s must be established in order for a meaningful analysis and processing of data obtained via remote sensing techniques (ii). Such an understanding needs to account for varia-tions in the quantity and quality of radiation recorded by the air- and space-borne sensors.
Plant structural attributes control canopy reflectance characteristics by orienting the scattering in three-dimensional space, allowing the interaction of photons with multiple surfaces such as leaves, woody material, and soils (iii). The amount of reflectance in a vegetation canopy is directly linked to the scattering processes at the leaf level. Although this leaf-level scattering varies with leaf struc-ture, water content, and the biochemical constituents concentration (iv), it is highly dependent on canopy structural characteristics such as leaf area index and leaf angle distribution (v).The reflec-tance within a leaf furthermore varies between electromagnetic spectrum regions, with the visible domain (mainly driven by the absorption of chlorophylls) exhibiting different reflectance character-istics from the infrared domain (water absorption and cell structure dominating) (vi). As a result, accurate estimates of leaf spectral properties for reflectance, transmittance, and absorbance are critical for relating radiative transfer properties of leaves to their phenological and physiological state (vii).
© EARSeL and Warsaw University, Warsaw 2005. Proceedings of 4th EARSeL Workshop on Imaging Spectroscopy. New quality in environmental studies. Zagajewski B., Sobczak M., Wrzesień M., (eds)
The incoming solar irradiance (direct and diffuse) and outgoing reflected radiance for a measured surface such as a plant canopy or leaf, can be described as two hemispherical distributions of electromagnetic radiation, specifically the Bidirectional Reflectance Distribution Function (BRDF) (viii). Considering the lack and difficulty of capturing the reflectance properties of leaves, a gonio-spectroradiometric device (CLabSpeG) was constructed to allow for an accurate measurement of the BRDF of vegetation elements. Bidirectional reflectance data of leaves were obtained under specific mechanical and natural specifications and limitations, resulting in a total 4356 reflectance measurements. These data were collected for every leaf at a variety of angles, covering a hemi-sphere, with 30 degrees and 15 degrees resolution in azimuth and zenith, respectively.
The BRDF data will be applied in combination with tree architecture measurements in order to build a Virtual Forest Imaging system that will allow investigation of solar radiation interaction with forest canopies for remote sensing and virtual imaging purposes. It is our intention to use these data as hyper-spectral BRDF libraries of vegetation as well as ground reference data for multi-angular remote sensing applications.
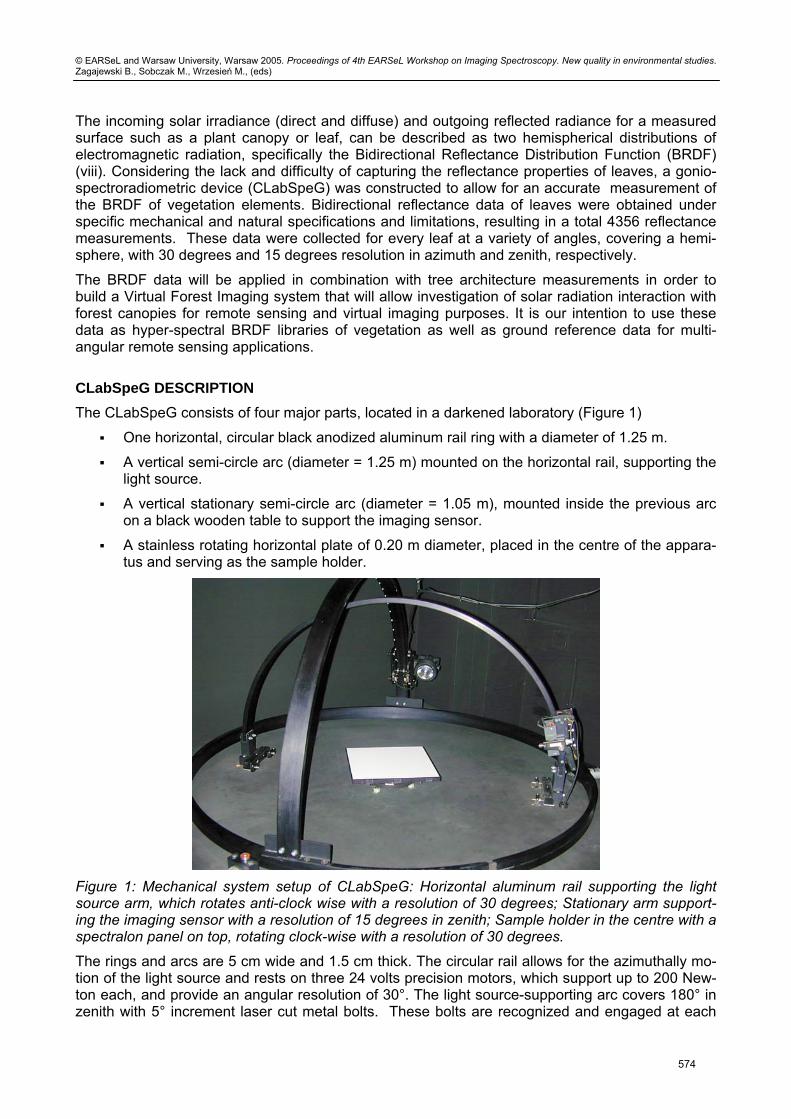
CLabSpeG DESCRIPTION The CLabSpeG consists of four major parts, located in a darkened laboratory (Figure 1)
One horizontal, circular black anodized aluminum rail ring with a diameter of 1.25 m.
A vertical semi-circle arc (diameter = 1.25 m) mounted on the horizontal rail, supporting the light source.
A vertical stationary semi-circle arc (diameter = 1.05 m), mounted inside the previous arc on a black wooden table to support the imaging sensor.
A stainless rotating horizontal plate of 0.20 m diameter, placed in the centre of the appara-tus and serving as the sample holder.
Figure 1: Mechanical system setup of CLabSpeG: Horizontal aluminum rail supporting the light source arm, which rotates anti-clock wise with a resolution of 30 degrees; Stationary arm support-ing the imaging sensor with a resolution of 15 degrees in zenith; Sample holder in the centre with a spectralon panel on top, rotating clock-wise with a resolution of 30 degrees.
The rings and arcs are 5 cm wide and 1.5 cm thick. The circular rail allows for the azimuthally mo-tion of the light source and rests on three 24 volts precision motors, which support up to 200 New-ton each, and provide an angular resolution of 30°. The light source-supporting arc covers 180° in zenith with 5° increment laser cut metal bolts. These bolts are recognized and engaged at each
574

© EARSeL and Warsaw University, Warsaw 2005. Proceedings of 4th EARSeL Workshop on Imaging Spectroscopy. New quality in environmental studies. Zagajewski B., Sobczak M., Wrzesień M., (eds)
incremental position by a precision motorized chariot. Micro switches control the movement of the motors by providing position feedback for the controller software.
The light source is mounted on a chariot while its optical axis is aligned with the centre of the sam-ple holder. The arc that supports the chariot carrying the fiber optic cable of the detector is similar in construction, and has the same angular resolution covering 90° in zenith. The rotating sample holder is driven by a precision motor that allows rapid rotations with an angular resolution of 30°. It also can be adjusted, upwards or downwards up to 3 cm, so as to align the sample surface with the horizontal plane of the detector and light. The instrument achieves a full hemispherical cover-age with a resolution of 30° in azimuth and 15° in zenith, which is adequate for capturing the BRDF of most natural and man-made surfaces (ix).
The apparatus captures the target reflectance following a repetitive pattern for every azimuthally position of the light source. Initially the system records all the responses for the sensor and light source at a zenith of 75° while the sample holder rotates 12 times to cover the azimuthally posi-tions of the stationary sensor. The light source then is advanced to 60° zenith and again 12 meas-urements are recorded by rotating the sample holder. This sequence is repeated until the light source reaches the final zenith position at -75°, where the sensor then shifts to 60° zenith and the light initiates its descend until it reaches a zenith of 75°. The process is repeated after the sensor has completed the measurements at the 0°zenith (nadir), with the light source subsequently mov-ing to 30° azimuth. Since the repetitive pattern is known, each measured reflectance is attributed an arithmetic value that corresponds to a known angular configuration.
The light source mounted on the apparatus is a tungsten halogen 50 W Ushio lamp, inside a Lowel assembly of 12.7 cm diameter, and points to the sample centre with a 13-degree beam angle. The lamp, which produces 1250 lumen, covers the electromagnetic spectrum in the region of 350 to 2500nm and provides a sufficiently strong signal for the detector.
The detector is an ASD (Analytical Spectral Devices) spectroradiometer and measures the wave-length range from 350 to 2500 nm using 3 detectors for the visible, near-infrared, and middle-infrared part of the spectrum, respectively. The spectral resolution is 3 nm in the visible and 30 nm in the infrared, with associated sampling interval of 1.4 nm for the 350-1000 nm range and 2 nm for the 1000-2500 nm range. Each measurement scan has duration of 0.1 second for the full operating spectrum and for each measurement an average of ten reflectance readings are used. The move-ment and positioning of GLabSpeG’s components, as well as the operation of the spectroradiome-ter, are fully remotely-controlled by specialized software (Labview).
The apparatus presents a high reproducibility in measurements with a mean relative reflectance difference of 0.54%. Reflectance observations obey the Lamberts cosine law per zenith move-ment, with relative differences between measured signal and expected (Lambert cosine) signal less than 0.02%. Reflectance correlations between adjacent light source positions were, as ex-pected, higher at greater zenith light angles. However, a light footprint asymmetry is present for different azimuthal positions of the light source that needs to be corrected. This can be done by using a ratio of measured raw digital number response values and spectralon measured values for each geometric position in the hemisphere.
LEAF REFLECTANCE The reflectance behavior of a leaf under natural conditions is well documented and the processes taking place at a molecular level has been defined. Light entering a leaf is subject to multiple inter-actions at the cell walls within the leaf, ranging from scattering within the epidermis and chloro-plasts of the palisade cells, to absorption due to plant pigments and leaf water (x). These multiple reflection and scattering effects ensure that light reflected from leaves is approximately Lambertian in character (xi). The leaf surface reflectance, in contrast, is a combination of diffuse and specular reflectance, resulting in a non-Lambertian reflectance response (xii).
A plant leaf typically has a low reflectance in the visible spectral region due to strong absorption by chlorophyll pigments, a relatively high reflectance in the near-infrared because of internal leaf scat-
575

© EARSeL and Warsaw University, Warsaw 2005. Proceedings of 4th EARSeL Workshop on Imaging Spectroscopy. New quality in environmental studies. Zagajewski B., Sobczak M., Wrzesień M., (eds)
tering, and a fairly low reflectance in the infrared beyond 1300 nm due to water absorption. The reflectance of a plant canopy is similar in nature, but is modified by the lack of uniformity in incident solar radiation, plant structures, leaf areas, shadows, and background reflectivity.
The visible region (400-700 nm) of the vegetation reflectance spectrum is characterized by low reflectance and transmittance due to strong absorptions by foliar pigments. Absorption peaks are found at approximately 420, 490, and 660 nm, and are mainly due to chlorophyll. As the leaf dies, brown pigments appear and the leaf reflectance and transmittance at wavelengths greater than 400 nm to 750 nm wavelength decrease (xiii). The red edge (690-720 nm) is dominated by high absorbance in the red spectral region due to chlorophyll, while reflectance increases at wave-lengths greater than 800 nm, caused mainly by internal leaf structure and water content. Leaves have higher reflectance and transmittance in the near-infrared region (700-1300 nm), while in the mid-infrared domain (1300-2500 nm) water absorption features dominate leaf reflectance. These water absorption features are centered at 1200, 1450, 1940 and 2500 nm.
The combination of narrow-band absorption features and reflectance continua provides a unique avenue for understanding changes in the biophysical and biochemical characteristics of ecosys-tems. However, the vegetation reflectance signal is the integrated outcome of a complex interac-tion between tissue chemical, canopy structural, and landscape organization factors. Leaf spectral properties and their interrelationships over the full optical range (400-2500 nm) have not been well quantified under field conditions for a wide range of species. Even less is known of the variability across environmental gradients. These shortcomings significantly limit canopy BRDF model inver-sion efforts (1).
Increased shade components in a scene, such as that experienced when looking toward the azi-muth of the sun, cause a decrease in reflectance. An increased sunlit component, found when looking away from the azimuth of the sun, results in an increase in reflectance. The amount of shade component reaches zero at the retro-reflectance, or hot spot view angle, resulting in a marked increase in reflectance. However, at wavelengths where multiple scattering dominates, the hot spot may be less pronounced (xiv).
Laboratory measurement of directional reflectance has several distinct advantages over field measurements. First, by using a single collimated light source, irradiance can be restricted to the direct beam only, thereby eliminating the effects of diffuse radiation that are present in field meas-urements. Second, the effects of wind also are eliminated, allowing accurate measurement of leaf angle distribution. A third advantage is that the position of the source of irradiance in the hemi-sphere can be fixed in position (xv).
MATERIALS AND METHODS It has been shown that all leaves do not exhibit the same reflectance properties; leaves from the same species and even from the same tree exhibit variations in their reflectance spectra (1). The shadow tolerant specie, Fagus sylvatica, is known for having two types of leaves, sunny and shadow, that differ both in biochemical synthesis as well as in reflectance behavior. We therefore tested the variability in reflectance of a number of leaves, collected throughout the vertical profile of the tree. A plant probe and the ASD spectroradiometer were used to measure reflectance spectra for 231 leaves from all branches of a single tree. The geometric position and bearing of each branch and the position of the leaf on the branch were collected as auxiliary data. The first objec-tive focused on determining if two distinct reflectance groupings of leaves existed, while the sec-ond objective was to investigate the variability in reflectance among adjacent leaves.
A specific concern stemming from the measurement methodology was related to the duration a leaf has to spend on the sample plate and by extension, under the light source. The reflectance behavior of a leaf under strong light source conditions and the change in reflectance through time were evaluated before any BRDF measurements were taken. The reflectance from a leaf therefore was periodically measured to gauge changes in reflection due to moisture loss. This was done at a static geometric position of light source and sensor and for the full measurement cycle of approxi-mately 2.5 hours.
576

© EARSeL and Warsaw University, Warsaw 2005. Proceedings of 4th EARSeL Workshop on Imaging Spectroscopy. New quality in environmental studies. Zagajewski B., Sobczak M., Wrzesień M., (eds)
The stated objectives would serve to verify whether the measurement protocol was indeed valid. If there are not significant reflectance differences among the leaves of a tree, or if there are reflec-tance groups of leaves, we likely could change the drying leaf periodically during the BRDF meas-urements with a similar one, so as to minimize reflectance variation caused by water drying effects. Three Fagus trees furthermore were transplanted from a forest stand to an area next to the gonio-reflectometer facilities, so as to eliminate error factors due to sample transfer time. This resulted in a time-span of less than two minutes between the actual cutting of a leaf and the initia-tion/continuation of measurements.
VERTICAL REFLECTANCE PROFILE OF FAGUS SYLVATICA LEAVES There can be variation in the spectral reflectance of leaves of tree species as a function of position in the canopy (e.g., tree and branch level) (xvi,xvii). Price (17) suggested that several species may actually have quantitatively similar spectra due to spectral signature variation within species.
The reflectance of 231 leaves of one Fagus tree was measured (Figure 2) with a plant probe and the standard deviation among their reflectances between 350 and 2500 nm was calculated (Figure 3). Two specific leaf measurements had distinctly higher reflectance in the infrared part (800 nm) of the electromagnetic spectrum and were identified as extreme outliers. These individuals were excluded, along with 20 more leaf measurements that exhibited values greater than 3 standard deviations from the mean reflectance values.
Figure 2: Reflectance profile of 231 leaves of a Fagus sylvatica tree. The measured spectrum cov-ers the region between 350 nm and 2500 nm. Two leaves exhibited distinctly higher reflectance in the infrared at 800 nm.
577
© EARSeL and Warsaw University, Warsaw 2005. Proceedings of 4th EARSeL Workshop on Imaging Spectroscopy. New quality in environmental studies. Zagajewski B., Sobczak M., Wrzesień M., (eds)
0
5
10
15
20
25
350
409
468
527
586
645
704
763
822
881
940
999
1058
1117
1176
1235
1294
1353
1412
1471
1530
1589
1648
1707
1766
1825
1884
1943
2002
2061
2120
2179
2238
2297
2356
2415
2474
wavelength
St. d
evia
tion
in %
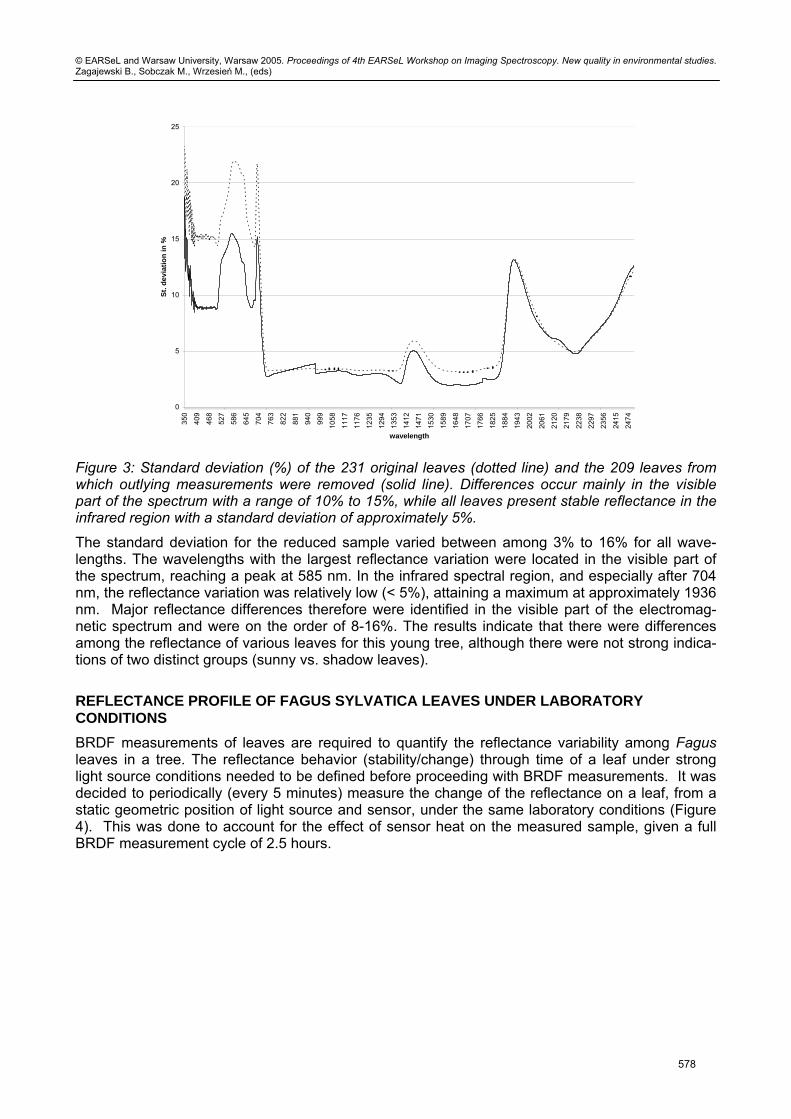
Figure 3: Standard deviation (%) of the 231 original leaves (dotted line) and the 209 leaves from which outlying measurements were removed (solid line). Differences occur mainly in the visible part of the spectrum with a range of 10% to 15%, while all leaves present stable reflectance in the infrared region with a standard deviation of approximately 5%.
The standard deviation for the reduced sample varied between among 3% to 16% for all wave-lengths. The wavelengths with the largest reflectance variation were located in the visible part of the spectrum, reaching a peak at 585 nm. In the infrared spectral region, and especially after 704 nm, the reflectance variation was relatively low (< 5%), attaining a maximum at approximately 1936 nm. Major reflectance differences therefore were identified in the visible part of the electromag-netic spectrum and were on the order of 8-16%. The results indicate that there were differences among the reflectance of various leaves for this young tree, although there were not strong indica-tions of two distinct groups (sunny vs. shadow leaves).
REFLECTANCE PROFILE OF FAGUS SYLVATICA LEAVES UNDER LABORATORY CONDITIONS BRDF measurements of leaves are required to quantify the reflectance variability among Fagus leaves in a tree. The reflectance behavior (stability/change) through time of a leaf under strong light source conditions needed to be defined before proceeding with BRDF measurements. It was decided to periodically (every 5 minutes) measure the change of the reflectance on a leaf, from a static geometric position of light source and sensor, under the same laboratory conditions (Figure 4). This was done to account for the effect of sensor heat on the measured sample, given a full BRDF measurement cycle of 2.5 hours.
578

© EARSeL and Warsaw University, Warsaw 2005. Proceedings of 4th EARSeL Workshop on Imaging Spectroscopy. New quality in environmental studies. Zagajewski B., Sobczak M., Wrzesień M., (eds)
Figure 4: Thirty-four measurements of a leaf under a tungsten halogen lamp for a period of 152 minutes. Changes in the reflectance values especially are visible in the infrared region of the spec-trum with profound changes at the water absorption bands.
A total of 8 from 2151 original wavelengths were chosen to demonstrate the changes of general reflectance behavior through time and illumination (Figure 5).
0
0.05
0.1
0.15
0.2
0.25
0.3
0.35
0.4
0.45
0.5
7 9 20 29 35 41 51 60 70 81 90 100
109
121
134
145
148
minutes
refle
ctan
ce
550nm585nm680nm705nm850nm1650nm1936nm2200nm
Figure 5: The change in reflectance in several wavelengths (550, 585, 680, 705, 850, 1650, 1936, and 2200 nm) of a leaf under laboratory illumination conditions during a 152 minute measurement cycle.
579
© EARSeL and Warsaw University, Warsaw 2005. Proceedings of 4th EARSeL Workshop on Imaging Spectroscopy. New quality in environmental studies. Zagajewski B., Sobczak M., Wrzesień M., (eds)
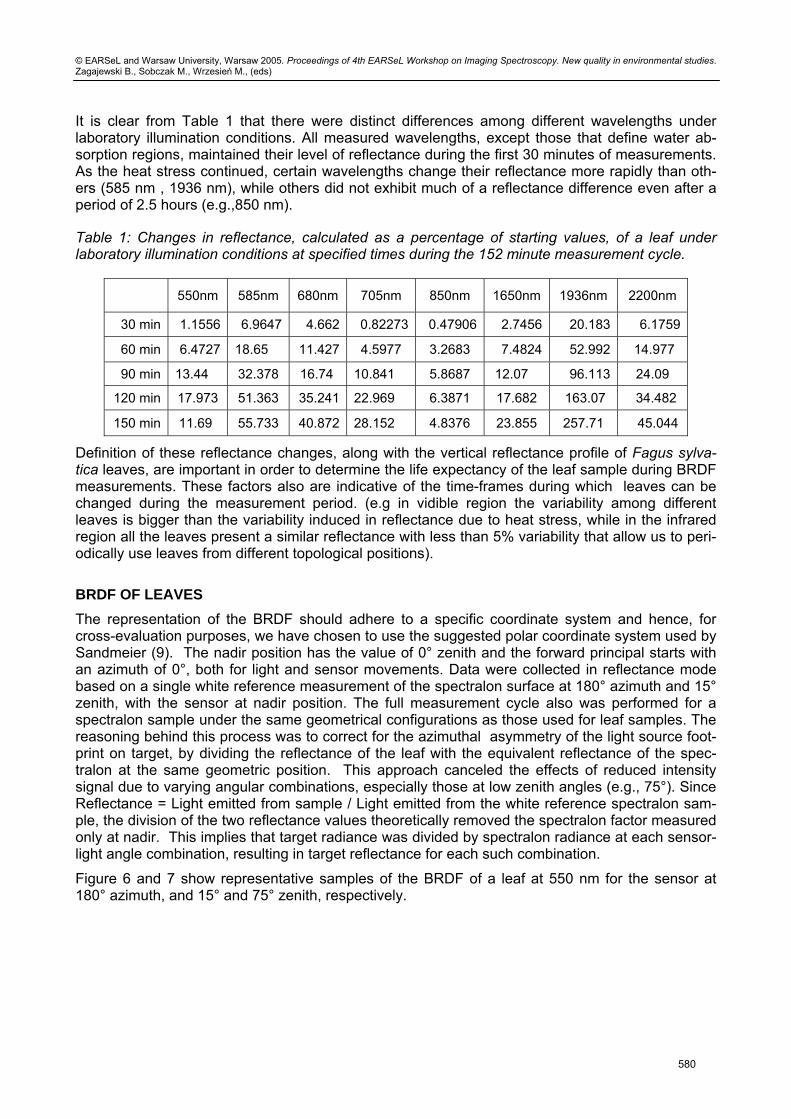
It is clear from Table 1 that there were distinct differences among different wavelengths under laboratory illumination conditions. All measured wavelengths, except those that define water ab-sorption regions, maintained their level of reflectance during the first 30 minutes of measurements. As the heat stress continued, certain wavelengths change their reflectance more rapidly than oth-ers (585 nm , 1936 nm), while others did not exhibit much of a reflectance difference even after a period of 2.5 hours (e.g.,850 nm).
Table 1: Changes in reflectance, calculated as a percentage of starting values, of a leaf under laboratory illumination conditions at specified times during the 152 minute measurement cycle.
550nm 585nm 680nm 705nm 850nm 1650nm 1936nm 2200nm
30 min 1.1556 6.9647 4.662 0.82273 0.47906 2.7456 20.183 6.1759
60 min 6.4727 18.65 11.427 4.5977 3.2683 7.4824 52.992 14.977
90 min 13.44 32.378 16.74 10.841 5.8687 12.07 96.113 24.09
120 min 17.973 51.363 35.241 22.969 6.3871 17.682 163.07 34.482
150 min 11.69 55.733 40.872 28.152 4.8376 23.855 257.71 45.044
Definition of these reflectance changes, along with the vertical reflectance profile of Fagus sylva-tica leaves, are important in order to determine the life expectancy of the leaf sample during BRDF measurements. These factors also are indicative of the time-frames during which leaves can be changed during the measurement period. (e.g in vidible region the variability among different leaves is bigger than the variability induced in reflectance due to heat stress, while in the infrared region all the leaves present a similar reflectance with less than 5% variability that allow us to peri-odically use leaves from different topological positions).
BRDF OF LEAVES The representation of the BRDF should adhere to a specific coordinate system and hence, for cross-evaluation purposes, we have chosen to use the suggested polar coordinate system used by Sandmeier (9). The nadir position has the value of 0° zenith and the forward principal starts with an azimuth of 0°, both for light and sensor movements. Data were collected in reflectance mode based on a single white reference measurement of the spectralon surface at 180° azimuth and 15° zenith, with the sensor at nadir position. The full measurement cycle also was performed for a spectralon sample under the same geometrical configurations as those used for leaf samples. The reasoning behind this process was to correct for the azimuthal asymmetry of the light source foot-print on target, by dividing the reflectance of the leaf with the equivalent reflectance of the spec-tralon at the same geometric position. This approach canceled the effects of reduced intensity signal due to varying angular combinations, especially those at low zenith angles (e.g., 75°). Since Reflectance = Light emitted from sample / Light emitted from the white reference spectralon sam-ple, the division of the two reflectance values theoretically removed the spectralon factor measured only at nadir. This implies that target radiance was divided by spectralon radiance at each sensor-light angle combination, resulting in target reflectance for each such combination.
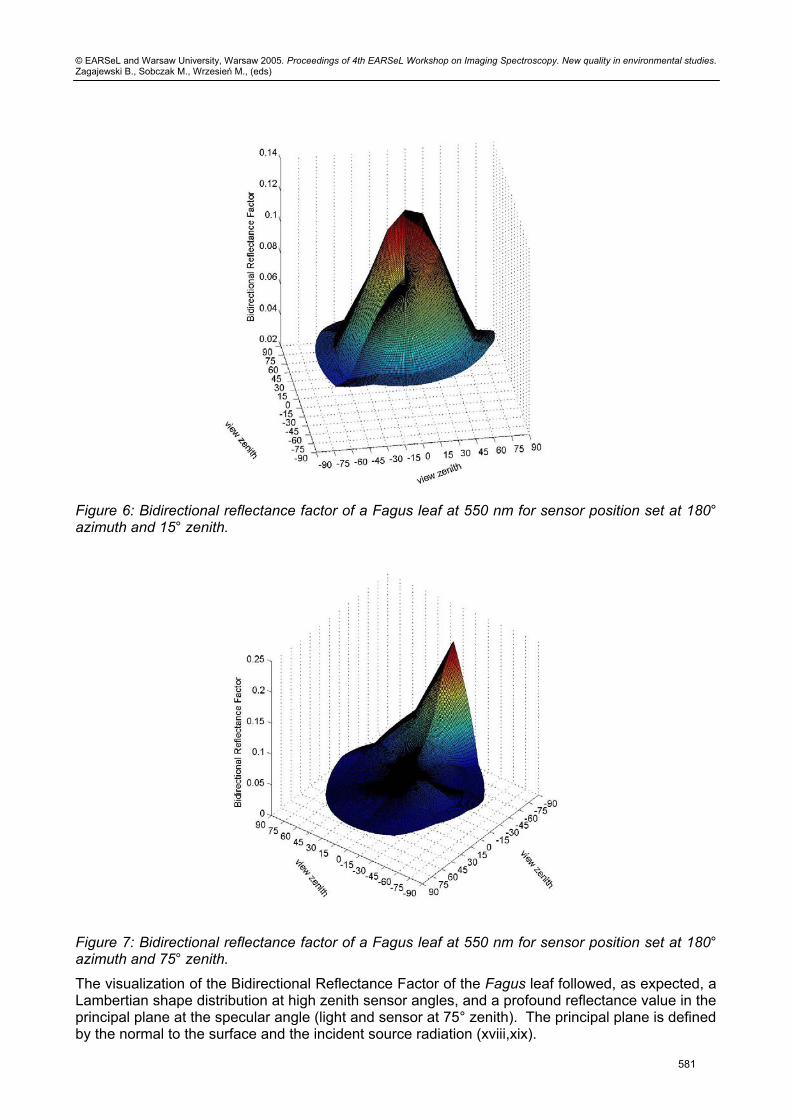
Figure 6 and 7 show representative samples of the BRDF of a leaf at 550 nm for the sensor at 180° azimuth, and 15° and 75° zenith, respectively.
580
© EARSeL and Warsaw University, Warsaw 2005. Proceedings of 4th EARSeL Workshop on Imaging Spectroscopy. New quality in environmental studies. Zagajewski B., Sobczak M., Wrzesień M., (eds)
Figure 6: Bidirectional reflectance factor of a Fagus leaf at 550 nm for sensor position set at 180° azimuth and 15° zenith.
Figure 7: Bidirectional reflectance factor of a Fagus leaf at 550 nm for sensor position set at 180° azimuth and 75° zenith.
The visualization of the Bidirectional Reflectance Factor of the Fagus leaf followed, as expected, a Lambertian shape distribution at high zenith sensor angles, and a profound reflectance value in the principal plane at the specular angle (light and sensor at 75° zenith). The principal plane is defined by the normal to the surface and the incident source radiation (xviii,xix).
581

© EARSeL and Warsaw University, Warsaw 2005. Proceedings of 4th EARSeL Workshop on Imaging Spectroscopy. New quality in environmental studies. Zagajewski B., Sobczak M., Wrzesień M., (eds)
However, there were certain irregularities in our presented results, such as drops in the reflectance signal. Since data were collected in reflectance mode and due to rounding and precision errors of the ASD software, the ratio of leaf reflectance and spectralon reflectance did not provide the ex-pected correction results. It was concluded that data should be collected in raw digital (or radiance) numbers for both leaf and spectralon samples at all sensor-light angle combinations, followed by division of sample by spectralon values. This post-processing step would in effect correct for the light source shift without any mathematical artifacts induces by ASD software. BRDF collection of leaf samples was performed during September 2004 and only in reflectance mode, hence further analysis on wavelength significance and angle configuration are planned after additional meas-urements (spring 2005) have been collected.
CONCLUSIONS An attempt was made to demonstrate and quantify the non-Lambertian properties of Fagus sylva-tica leaves by measuring the bidirectional reflectance distribution function. A newly constructed spectrogoniometer was used for acquisition of the data. Compact Laboratory SpectroGoniometer (CLabSpeG) provides the unique capability of investigating a truly full BRDF of a material by pro-viding data in all possible light-sensor zenith-azimuth hemispherical combinations. A protocol of measuring leaf reflectance behavior was established and certain issues, such as leaf reflectance variability within a single species and drying effects, were investigated. Future work will focus on acquiring reflectance data in raw digital number (or radiance) values, while periodically changing the leaf under the light source at specific time intervals (30 min) to avoid excessive leaf moisture loss. It is recommended that future work focuses on classifying leaves of a single species, based on age, type, and position in the tree. Such a classification likely will provide an insight to the re-flectance homogeneity of leaf types and groupings within a tree, thereby enabling low-variance BRDF measurements.
ACKNOWLEDGEMENT We would like to thank B. Hosgood and B. Pinty of the EGO at Ispra, Italy, M. Schaepman of the RSL at Zurich University for helpful discussions about gonioreflectometer construction and calibra-tion issues. We also like to thank CIT Engineering Geel, Belgium, for the mechanical construction of the device. Last but not least, Katholieke Universiteit Leuven for funding the project OT/01/34.
References
i. Asner G.P., 1998. Biophysical and Biochemical Sources of Variability in Canopy Reflectance.
Remote Sensing of Environment, 64: 234 – 253.
ii. Knipling E. B., 1970. Physical and physiological basis for the reflectance of visible and near-infrared radiation from vegetation. Remote Sensing of Environment, 1: 155-159.
iii. Gilabert M. A., Garcia-Haro F. J., and Melia J., 2000. A mixture modelling approach to esti-mate vegetation parameters for heterogeneous canopies in remote sensing. Remote Sensing of Environment, 72: 328 – 345.
iv Jacquemoud S., Frangi J. -P., Govaerts Y. and Ustin S.L., 1996. Three-dimensional represen-tation of leaf anatomy- Application of photon transport. Physical Measurements & Signatures in Remote Sensing, 295 – 302.
582

© EARSeL and Warsaw University, Warsaw 2005. Proceedings of 4th EARSeL Workshop on Imaging Spectroscopy. New quality in environmental studies. Zagajewski B., Sobczak M., Wrzesień M., (eds)
v Goel N. S., 1988. Models of vegetation canopy reflectance and their use in estimation of bio-
physical parameters from reflectance data. Remote Sensing Reviews, 4: 1 – 212.
vi Maier W., Liideker W., and Gunther K.P., 1999. SLOP: A Revised Version of the Stochastic Model for Leaf Optical Properties. Remote Sensing of Environment, 68: 273-280.
vii Middleton E. M., Chan S. S., Mesarch M. A., and Walter-Shea E. A., 1996. A Revised Meas-urement Methodology for Spectral Optical Properties of Conifer Needles. IGARSS Proceed-ings.
viii Nicodemus F. E., Richmond J.C., Hsia J.J., Ginsberg I.W. and Limperis T., 1977. Geometrical Considerations and Nomenclature for Reflectance, NBS Monograph, 160, National Bureau of Standards, US Department of Commerce, Washington, D.C.
ix Sandmeier St., 2000. Acquisition of Bidirectional Reflectance Factor Data with Field Goniome-ters. Remote Sensing of Environment, 73: 257-269.
x Leopold, A.C. and Kriedemann, P.E., 1975. Plant Growth and Development. New York: McGraw-Hill.
xi Kumar, L., Schmidt, K.S., Dury, S. and Skidmore, A.K., 2001. Imaging spectrometry and vege-tation science. In: Imaging spectrometry : basic principles and prospective applications / F.D. van der Meer and S.M. de Jong (eds.) 2001. pp. 111-155.
xii Fourty Th., Baret F., Jacquemoud S., Schmuck G., Verdebout J., 1996, Optical properties of dry plant leaves with explicite description of their biochemical composition: direct and inverse problems, Remote Sens. Environ., 56(2):104-117.
xiii Boyer M., Miller J., Belanger M., Hare E., Wu J. (1988), Senescence and spectral reflectance in leaves in Northen Pin Oak (Quercus palustris Muenchh.), Remote Sensing of Environment, 25:71-87.
xiv Walthall C. L., 1997. A study of reflectance anisotropy and canopy structure using a simple empirical model. Remote Sensing of Environment, 61:118-128.
xv Liang S., Strahler A.H., Jin X., and Zhu Q., 1997. Comparisons of radiative transfer models of vegetation canopies and laboratory measurements. Remote Sensing of Environment, 61:129-138.
xvi Price J.C., 1992. Variability of high-resolution crop reflectance spectra. International Journal of Remote Sensing, 13(14): 2593-2610.
xvii Cochrane M. A., 2000. Using vegetation reflectance variability for species level classification of hyperspectral data. International Journal of Remote Sensing, 21(10): 2075-2087.
xviii Walter-Shea E.A., Norman J. M., and Blad B. L., 1989. Leaf Bidirectional Reflectance and Transmittance in Corn and Soybean. Remote Sensing of Environment, 29:161-174.
xix Brakke T.W. Smith J.A., and Harnden J., 1989. Bidirectional Scattering of Light from Tree Leaves. Remote Sensing of Environment, 29: 175-183.
583