Comparison of pollen gene flow among four European beech (Fagus sylvatica L.) populations...
10
ORIGINAL ARTICLE Comparison of pollen gene flow among four European beech (Fagus sylvatica L.) populations characterized by different management regimes A Piotti 1 , S Leonardi 1 , J Buiteveld 2 , T Geburek 3 , S Gerber 4,5 , K Kramer 2 , C Vettori 6 and GG Vendramin 6 The study of the dispersal capability of a species can provide essential information for the management and conservation of its genetic variability. Comparison of gene flow rates among populations characterized by different management and evolutionary histories allows one to decipher the role of factors such as isolation and tree density on gene movements. We used two paternity analysis approaches and different strategies to handle the possible presence of genotyping errors to obtain robust estimates of pollen flow in four European beech (Fagus sylvatica L.) populations from Austria and France. In each country one of the two plots is located in an unmanaged forest; the other plots are managed with a shelterwood system and inside a colonization area (in Austria and France, respectively). The two paternity analysis approaches provided almost identical estimates of gene flow. In general, we found high pollen immigration (B75% of pollen from outside), with the exception of the plot from a highly isolated forest remnant (B50%). In the two unmanaged plots, the average within-population pollen dispersal distances (from 80 to 184 m) were higher than previously estimated for beech. From the comparison between the Austrian managed and unmanaged plots, that are only 500 m apart, we found no evidence that either gene flow or reproductive success distributions were significantly altered by forest management. The investigated phenotypic traits (crown area, height, diameter and flowering phenology) were not significantly related with male reproductive success. Shelterwood seems to have an effect on the distribution of within-population pollen dispersal distances. In the managed plot, pollen dispersal distances were shorter, possibly because adult tree density is three-fold (163 versus 57 trees per hectare) with respect to the unmanaged one. Heredity (2012) 108, 322–331; doi:10.1038/hdy.2011.77; published online 7 September 2011 Keywords: genetic diversity; paternity analysis; neighbourhood model; reproductive success; null alleles; nuclear microsatellites INTRODUCTION Maintaining genetic diversity within a population heavily depends on genetic connectivity with surrounding populations. Moreover, the adaptability of a population to climate or anthropic changes is enhanced by the arrival of genes from areas where present climatic conditions mimic future ones (Jump and Pen ˜uelas, 2005). It is known that forest trees show extensive gene flow, especially when pollen or seeds are wind-dispersed (for example, Robledo-Arnuncio and Gil, 2005; Piotti et al., 2009; Williams, 2010). This statement has been largely based on the fact that, until now, gene flow was mainly studied by means of indirect genetic methods (that is, F st -based methods) or inferred from the comparison of genetic variability measures (see Aguilar et al., 2008; Eckert et al., 2008, and references therein). The thus obtained patterns are the result of population past evolutionary histories and do not shed light on current gene flow patterns. On the contrary, direct methods (that is, paternity and parentage analyses) provide accurate estimates of contemporary gene flow (Jones and Ardren, 2003). Such estimates allow detecting instantaneous signals produced by current conditions characterizing a population. Different analytical approaches are currently available to study contemporary gene flow. They differ in rationale, assumptions on the genetic variability of the background population and ways to handle possible errors due to low discriminatory power of the marker set or the presence of genotyping errors (Burczyk and Chybicki, 2004; Slavov et al., 2005; Jones et al., 2010). Recent methodological improvements allow to estimate the statistical precision of a parentage/paternity assignment for a given sample of a reproductive population (Gerber et al., 2003; Burczyk and Chybicki, 2004). In any case, both Oddou-Muratorio et al. (2003) and Bacles and Ennos (2008) claimed that it is better to use several approaches together to estimate genetic exchange among populations. Contemporary gene flow estimates can vary greatly among popula- tions for the same species. Hoebee et al. (2007) comparing pollen flow patterns between a small, isolated population and a large, continuous population of Sorbus torminalis found differences in the pollination distance curve, the self-pollination rate and the number of contribut- ing fathers per progeny. In particular, they showed a substantial pollen immigration reduction in the smaller, and more isolated, population (B4 versus B38%). Similarly, Slavov et al. (2009) recorded discre- pancies in immigration rates, pollen pool differentiation among Received 12 March 2011; revised 5 July 2011; accepted 2 August 2011; published online 7 September 2011 1 Department of Environmental Sciences, University of Parma, Parma, Italy; 2 Alterra, Wageningen UR, Wageningen, The Netherlands; 3 Federal Research Centre for Forests, Vienna, Austria; 4 INRA, UMR 1202 Biogeco, Cestas, France; 5 Universite ´ de Bordeaux, UMR 1202 Biogeco, Cestas, France and 6 Plant Genetics Institute, CNR, Sesto Fiorentino (FI), Italy Correspondence: Dr GG Vendramin, Plant Genetics Institute, CNR, Via Madonna del Piano 10, Sesto Fiorentino (FI) 50019, Italy. E-mail: [email protected] Heredity (2012) 108, 322–331 & 2012 Macmillan Publishers Limited All rights reserved 0018-067X/12 www.nature.com/hdy
-
Upload
independent -
Category
Documents
-
view
0 -
download
0
Transcript of Comparison of pollen gene flow among four European beech (Fagus sylvatica L.) populations...

ORIGINAL ARTICLE
Comparison of pollen gene flow among four European beech(Fagus sylvatica L.) populations characterized by differentmanagement regimes
A Piotti1, S Leonardi1, J Buiteveld2, T Geburek3, S Gerber4,5, K Kramer2, C Vettori6 and GG Vendramin6
The study of the dispersal capability of a species can provide essential information for the management and conservation of itsgenetic variability. Comparison of gene flow rates among populations characterized by different management and evolutionaryhistories allows one to decipher the role of factors such as isolation and tree density on gene movements. We used two paternityanalysis approaches and different strategies to handle the possible presence of genotyping errors to obtain robust estimates ofpollen flow in four European beech (Fagus sylvatica L.) populations from Austria and France. In each country one of the twoplots is located in an unmanaged forest; the other plots are managed with a shelterwood system and inside a colonization area(in Austria and France, respectively). The two paternity analysis approaches provided almost identical estimates of gene flow. Ingeneral, we found high pollen immigration (B75% of pollen from outside), with the exception of the plot from a highly isolatedforest remnant (B50%). In the two unmanaged plots, the average within-population pollen dispersal distances (from 80 to184 m) were higher than previously estimated for beech. From the comparison between the Austrian managed and unmanagedplots, that are only 500 m apart, we found no evidence that either gene flow or reproductive success distributions weresignificantly altered by forest management. The investigated phenotypic traits (crown area, height, diameter and floweringphenology) were not significantly related with male reproductive success. Shelterwood seems to have an effect on thedistribution of within-population pollen dispersal distances. In the managed plot, pollen dispersal distances were shorter,possibly because adult tree density is three-fold (163 versus 57 trees per hectare) with respect to the unmanaged one.Heredity (2012) 108, 322–331; doi:10.1038/hdy.2011.77; published online 7 September 2011
Keywords: genetic diversity; paternity analysis; neighbourhood model; reproductive success; null alleles;nuclear microsatellites
INTRODUCTION
Maintaining genetic diversity within a population heavily depends ongenetic connectivity with surrounding populations. Moreover, theadaptability of a population to climate or anthropic changes isenhanced by the arrival of genes from areas where present climaticconditions mimic future ones (Jump and Penuelas, 2005). It is knownthat forest trees show extensive gene flow, especially when pollen orseeds are wind-dispersed (for example, Robledo-Arnuncio and Gil,2005; Piotti et al., 2009; Williams, 2010). This statement has beenlargely based on the fact that, until now, gene flow was mainly studiedby means of indirect genetic methods (that is, Fst-based methods) orinferred from the comparison of genetic variability measures (seeAguilar et al., 2008; Eckert et al., 2008, and references therein). Thethus obtained patterns are the result of population past evolutionaryhistories and do not shed light on current gene flow patterns. On thecontrary, direct methods (that is, paternity and parentage analyses)provide accurate estimates of contemporary gene flow (Jones andArdren, 2003). Such estimates allow detecting instantaneous signalsproduced by current conditions characterizing a population. Differentanalytical approaches are currently available to study contemporary
gene flow. They differ in rationale, assumptions on the geneticvariability of the background population and ways to handle possibleerrors due to low discriminatory power of the marker set or thepresence of genotyping errors (Burczyk and Chybicki, 2004; Slavovet al., 2005; Jones et al., 2010). Recent methodological improvementsallow to estimate the statistical precision of a parentage/paternityassignment for a given sample of a reproductive population(Gerber et al., 2003; Burczyk and Chybicki, 2004). In any case, bothOddou-Muratorio et al. (2003) and Bacles and Ennos (2008) claimedthat it is better to use several approaches together to estimate geneticexchange among populations.
Contemporary gene flow estimates can vary greatly among popula-tions for the same species. Hoebee et al. (2007) comparing pollen flowpatterns between a small, isolated population and a large, continuouspopulation of Sorbus torminalis found differences in the pollinationdistance curve, the self-pollination rate and the number of contribut-ing fathers per progeny. In particular, they showed a substantial pollenimmigration reduction in the smaller, and more isolated, population(B4 versus B38%). Similarly, Slavov et al. (2009) recorded discre-pancies in immigration rates, pollen pool differentiation among
Received 12 March 2011; revised 5 July 2011; accepted 2 August 2011; published online 7 September 2011
1Department of Environmental Sciences, University of Parma, Parma, Italy; 2Alterra, Wageningen UR, Wageningen, The Netherlands; 3Federal Research Centre for Forests,Vienna, Austria; 4INRA, UMR 1202 Biogeco, Cestas, France; 5Universite de Bordeaux, UMR 1202 Biogeco, Cestas, France and 6Plant Genetics Institute, CNR, Sesto Fiorentino(FI), ItalyCorrespondence: Dr GG Vendramin, Plant Genetics Institute, CNR, Via Madonna del Piano 10, Sesto Fiorentino (FI) 50019, Italy.E-mail: [email protected]
Heredity (2012) 108, 322–331& 2012 Macmillan Publishers Limited All rights reserved 0018-067X/12
www.nature.com/hdy

mothers and male neighbourhood sizes between two ecologicallycontrasting populations of Populus trichocarpa. Thus it is far-fetchedto conclude that what is recorded in a single study conducted in asingle stand is the gene flow rate characteristic of a species.
The number of publications comparing gene flow patterns betweendifferent conditions is increasing. However, to date the comparison ofcontemporary gene flow rates between managed and unmanagedforest tree stands is almost unexplored (Robledo-Arnuncio et al.,2004). Silvicultural treatments may modify the amount of geneticvariability and the spatial genetic structure within a stand (Rajora,1999; Rajora et al., 2000; Takahashi et al., 2000), suggesting possiblechanges in gene flow patterns within and among stands. These resultswere usually obtained by monitoring the levels and spatial distributionof genetic variability. However, in forest trees these populationparameters are usually not modified by human activities in theshort term, but their effects are delayed for a few generations becauseof long generation time (Kramer et al., 2008). By contrast, silviculturaltreatments may rapidly modify the density and the effective popula-tion size of the stands and, therefore, contemporary gene flowpatterns. Nevertheless, generalizations should be treated with cautionconsidering that the life history and reproductive biology of eachspecies also have an important role (El-Kassaby and Benowicz, 2000).
In this study, we used both mating model and maximum likelihoodpaternity analysis to analyse pollen flow patterns in four Europeanbeech (Fagus sylvatica L.) populations characterized by differentmanagement and evolutionary histories. In both approaches theestimated frequencies of null alleles were taken into account inorder to minimize possible confounding factors in gene flow estima-tion. Our results contribute to clarify the role of factors such asisolation and management on gene movement within and amongpopulations, and, therefore, on shaping future genetic diversity. Inaddition, to provide a complete picture of gene flow dynamics for thisspecies, we studied (i) the relationship between potentially significantphenotypic characteristics of sampled trees (location, diameter, height,crown area, bud burst phenology) and their reproductive success; and(ii) the distribution of within-population pollen dispersal distancesand the occurrence of long-distance dispersal events.
MATERIALS AND METHODSStudy sites, sample collection and microsatellite analysisTo study pollen flow in beech, four plots were chosen among the 10 described
by Buiteveld et al. (2007) from the Dynabeech project (Kramer, 2004) (Table 1).
Two plots (Dobra-1 and Dobra-2; Figures 1a and b) are located in Austria, in
the Waldviertel region, in close proximity to each other (500 m). Dobra-1
(coded as D1; see Table 1) is inside an untouched area, whereas Dobra-2 (D2)
has been managed following the shelterwood system, with a rotation length of
100–120 years and a seeding cut 10–15 years before harvesting, combined with
natural regeneration. The third and fourth plots (Figures 1c and d) are located
in Southern France on the St Baume Mountain (SB) and on the northern slope
of Ventoux Mountain (VE), approximately 100 km apart. VE is located in a
recently colonized area. SB is located inside a large natural population that
nowadays is a beech gene conservation unit. The entire population is isolated
from the next one at least by 60 km (see Figure 2 in Delhon and Thiebault,
2005), and it is considered a relic population that originated in the Pre-boreal
from a refugium south of the actual Rhone delta. A detailed description of the
four plots is given in Buiteveld et al. (2007), and a summary of their main
characteristics is reported in Table 1.
In total, 803 adult trees and 1009 seeds (from 27 trees, hereafter referred to as
maternal trees) were sampled; 376 trees and 447 seeds from the French stands in
year 1999, and 427 trees and 562 seeds from the Austrian stands in the year 2000
(Table 1). All adult trees present in the four stands were sampled for genetic
analysis and mapped. A detailed phenotypic characterization was conduced for
all individuals in the Austrian stands: diameter at breast height (DBH), height,
crown radius and crown height were measured. Moreover, bud burst phenology
was recorded from 2001 to 2003 and was used as a proxy for flowering
phenology, given the simultaneous development of leaves and flowers (Becker,
1981, p. 43). Observations were conducted every 2 days and phenological stages
were assessed following an adaptation of Malaisse’s scale, considering stage 5 as
the critical stage (Malaisse, 1967; Teissier du Cros et al., 1981).
Four highly polymorphic microsatellites (FS1-15, FS4-46, FS3-04 and mfc5
for samples from Austrian stands, and FS1-15, FS4-46, FS1-25 and mfc5 for
Table 1 Characteristics of investigated beech stands and sampling strategy
Plot Code Latitude/longitude Altitude
(m asl.)
Management
history
Isolation Plot size
(ha)
Adult
trees
Density
(trees/ha)
Maternal
trees
Seeds
sampled
Dobra-1 D1 48135¢/15123¢ 390–550 Unmanaged 0 3.36 192 57 9 287
Dobra-2 D2 48135¢/15123¢ 550–580 Shelterwood 0 1.44 235 163 9 275
St Baume SB 43119¢/5146¢ 750 Unmanaged B60 kma 1.91 286 150 4 192
Mt Ventoux VE 44110¢/5116¢ 1450 Colonization 0 1.32 90 68 5 255
Abbreviation: asl, above sea level.aThe plot is located inside a large population that is isolated (B60km) from the next one.
Figure 1 Maps of the four study plots (a: Dobra-1; b: Dobra-2; c: St Baume;
d: Mt Ventoux). The open circles indicate maternal trees and the filled
circles indicate the other adult trees in the stand.
Pollen flow in beechA Piotti et al
323
Heredity
samples from French stands) developed in beech by Pastorelli et al. (2003) and
Tanaka et al. (1999) were used to genotype all individuals. These microsatellites
were selected because they showed Mendelian inheritance, a high level of
polymorphism (Pastorelli et al., 2003) and because they were unlinked (Scalfi
et al., 2004). PCR amplifications were performed following the conditions
reported in Pastorelli et al. (2003) and fragment size detection was conducted as
described by Buiteveld et al. (2007). To rule out amplification failure due to
laboratory errors or poor DNA quality, PCR was performed at least twice on
samples without any amplification product, and DNA was re-isolated when
amplification failure was systematic across loci (Oddou-Muratorio et al., 2009).
Data analysisThe frequencies of genotyping errors in the four data sets were assessed by
calculating a genotyping error rate quantified by direct comparison of off-
spring–mother genotype at each locus and averaged over loci. In addition, the
frequencies of null alleles were directly estimated by using the program INEst,
running the individual inbreeding model (IIM) with a Gibbs sampler of 105
iterations (Chybicki and Burczyk, 2009a). An estimate of null allele frequencies
in the data sets from French stands based on different approaches was also
conducted by Oddou-Muratorio et al. (2009).
To take into account possible genotyping errors during microsatellite
scoring, we accommodated loci for which the presence of null alleles was
suspected, and performed parentage analysis following different approaches, as
suggested in recent literature (Bacles and Ennos, 2008; Oddou-Muratorio et al.,
2009).
As by Bacles and Ennos (2008), instead of introducing in the analysis a
global stochastic error rate, we performed two subsequent transformations of
the original data sets (referred to hereafter as RAW data sets): a binning
procedure for allele miscalls (obtaining the BIN data sets) and a subsequent
genotype substitution procedure for allele dropouts (BINNULL data sets). In
the binning procedure all alleles with frequency below 0.01 were binned with
alleles 40.01 of the nearest size. In the genotype substitution procedure,
homozygous genotypes were systematically changed into heterozygotes with a
null allele, and non-amplifying genotypes were transformed into null allele
homozygotes. For every locus in each population, the transformation that
guaranteed the higher paternity exclusion probability (EPP) and lower geno-
typing error (calculated for each locus as the number of mother–offspring
mismatches divided by the number of possible comparisons) was retained to
build the final data set for paternity analysis (MINERROR data sets). For loci
where no significant improvements were achieved after transformation, the raw
data were used.
Paternity analysis was conducted by using both a maximum likelihood
approach (Gerber et al., 2000) and a mating model approach (Burczyk et al.,
2002). The maximum likelihood approach is aimed at assigning paternity to
each analysed seed and allows one to estimate individual reproductive success
of local adults, whereas by the mating model approach dispersal parameters
and selection gradients at the population level (and their confidence intervals)
are jointly estimated.
The maximum likelihood paternity analysis was conduced on the four
MINERROR data sets (one for each plot) by using the software FaMoz (Gerber
et al., 2003), following a categorical allocation approach (Jones et al., 2010)
based on the assignment of paternity to the individual with the highest LOD
score above an estimated thresholds. Seeds were considered as locally pollinated
if at least one compatible father with a logarithm of odds (LOD) score above
the threshold was found, otherwise they were classified as pollinated by external
trees. The thresholds for statistical significance of LOD scores were estimated by
following the simulation method described by Gerber et al. (2000). The
distribution of the LOD scores of the most likely fathers of 50 000 seeds
randomly generated from the genotypes of local adult trees and the distribution
of LOD scores of the most likely fathers of 50 000 seeds whose paternal
genotype was randomly generated according to allele frequencies were graphi-
cally compared. The threshold for paternity assignment was chosen at the
intersection of the two distributions of LOD scores to minimize both type-I
(that is, when a seed pollinated by local pollen is not assigned to local fathers)
and type-II error (that is, when a paternity is attributed to a local father,
whereas the true father is outside the sampling area) (Gerber et al., 2000). LOD
scores were calculated by accounting for a mistyping error (e) set to 0 and for
mean departures from Hardy–Weinberg equilibrium estimated from the data.
The mating model paternity analysis was performed by using the neighbour-
hood model, originally introduced by Adams and Birkes (1991) and extended
by Burczyk et al. (2002), implemented in the program NM+ (Chybicki and
Burczyk, 2010a). The program allows estimating parameters of the neighbour-
hood model taking into account the estimated null allele frequencies for each
scored locus. The analysis was run on each RAW data set by using the default
value for the neighbourhood size and the ‘stop’ criterion (inf and 0.001,
respectively), and introducing null allele frequencies resulting from INEst
analysis. The estimated parameters were the pollen immigration (mp), selfing
rate (s), shape (bp) and scale (dp) parameters of four families of testable
dispersal kernels (exponential power, Weibull, geometric and 2Dt), and selec-
tion gradients for covariates of the reproductive success (gcrown_area for crown
area, gheight for height and gdbh for diameter). The models based on different
dispersal kernels were compared and the one with the highest final log-
likelihood was chosen as the most representative (Chybicki and Burczyk,
2009b).
Once paternity was assessed by following maximum likelihood paternity
analysis, we determined and explored the distributions of pollen dispersal
events for the four plots. Pollination distances were calculated as the Euclidean
distance between pollen donors and maternal trees. When two (or more) pollen
donors with the same LOD scores were the most likely ones, the mean of their
distances from the maternal tree was considered as the pollination distance. To
determine whether pollen dispersal distribution resembles the distribution of
distances between all potential pollen donors and maternal trees, we compared
them in each stand by using a Kolmogorov–Smirnov test (Sokal and Rohlf,
1995).
To study factors affecting male reproductive success estimated by the
maximum likelihood paternity analysis, we ran two Generalized Linear Model
analyses (McCullagh and Nelder, 1989) on the data sets from the Austrian
stands, where a detailed phenotypic characterization of all adult trees was
available. Data from D1 and D2 were pooled because we found no evidence of
plot influence on reproductive success. In the first analysis we used the female-
specific male reproductive success as dependent variable, which is estimated as
the number of assigned paternities for each male with each sampled female over
the total number of seeds analysed for each sampled female. A binomial
(successful pollinations versus unsuccessful pollinations of each male–female
pair) distribution of errors was assumed. The independent variables were the
distance, the angle (calculated as described by Burczyk et al., 1996) and the
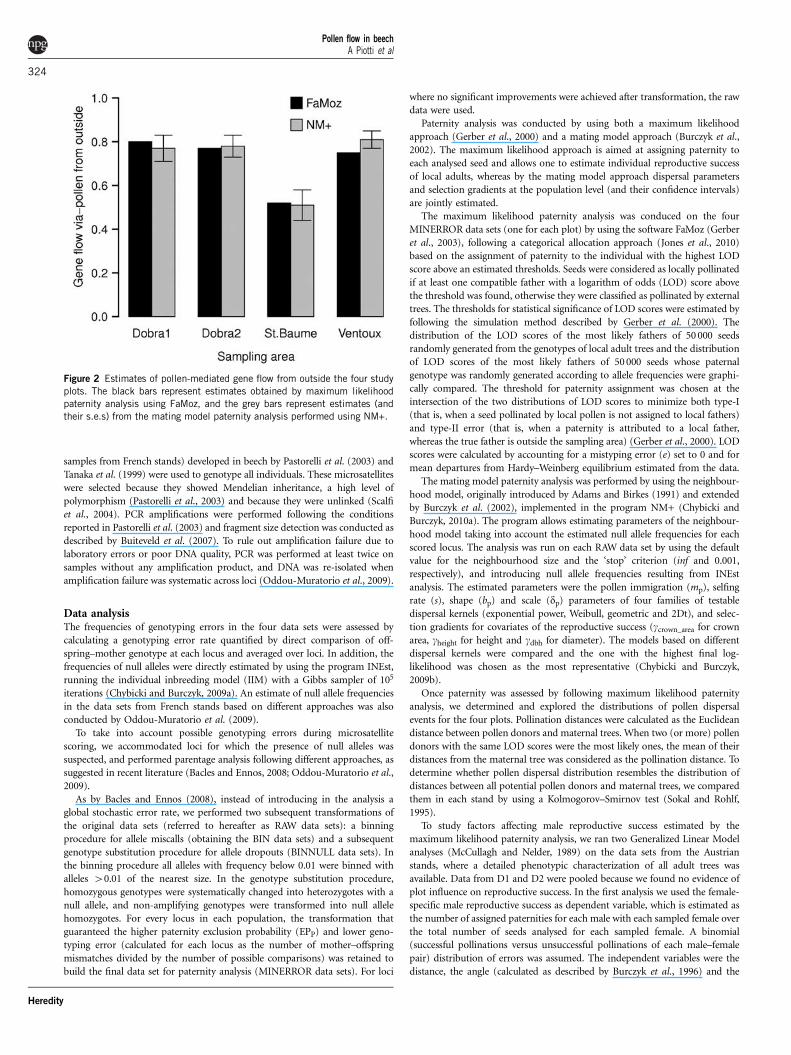
Figure 2 Estimates of pollen-mediated gene flow from outside the four study
plots. The black bars represent estimates obtained by maximum likelihood
paternity analysis using FaMoz, and the grey bars represent estimates (and
their s.e.s) from the mating model paternity analysis performed using NM+.
Pollen flow in beechA Piotti et al
324
Heredity

degree of phenological overlap between the potential pollen donor and the
maternal tree, the DBH, the height and the crown area (assuming a surface of
cylindrical shape with crown height as height and crown radius as radius) of
each potential pollen donor. Flowering phenology overlap was computed by
assuming that female flower receptivity and male flower pollen shedding start
at the day of bud burst and last for 10 days. According to this, individual
flowering behaviour was modelled for every tree fitting a normal curve by using
the fifth day after bud burst as the mean, and the first and tenth days as the 0.05
and 0.95 quantiles, respectively. Flowering overlap between two individuals was
consequently calculated as the area of overlap between two normal curves
describing the flowering behaviour of two trees. The average of phenological
overlap over the 3 years was then used.
In the second analysis we used as dependent variable the total male
reproductive success (assigned paternities) over all sampled maternal trees,
and a Poisson distribution of errors, which is usually considered more suitable
for count data, was assumed. The independent variables were DBH, height,
crown area of each potential pollen donor and the number of ‘nearby maternal
trees’ sampled. Given that the definition of ‘nearby maternal trees’ is arbitrary,
we counted the number of sampled maternal trees located within a circle
centred on each male, with radius of 10 m, 20, 30 and so on, up to 140 m.
All analyses were run by using the glm function of the R statistical package
(R Development Core Team, 2010), starting from the model with all indepen-
dent variables included and gradually simplifying the model by dropping the
non-significant ones (Crawley, 2002).
RESULTS
Genetic variability was high in all study areas (Table 2), as previouslyreported by Buiteveld et al. (2007), providing high exclusion prob-abilities, ranging from 0.973 (VE) to 0.985 (SB) for the RAW data sets,and from 0.983 (VE) to 0.988 (SB) for the MINERROR data sets(Table 3). The high Fis estimates reported by Buiteveld et al. (2007)seem to be dependent on the presence of null alleles at highfrequencies (X10%) for loci mfc5 and fs 4-46 in Austrian populations
and at frequencies around 10% for loci fs 4-46 and fs 1-25 in SBpopulation. Only the inbreeding coefficient of SB (0.083) was sig-nificantly different from 0 considering null allele frequencies (Z-test,Z¼2.184, Po0.05), whereas the Fis values of the other populationswere all below 0.033 and not statistically different from 0 (Table 2).
In the RAW data sets genotyping error rates were between 0.11 (D2)and 0.15 (SB), in line with what found by Oddou-Muratorio et al.(2009) investigating null allele presence on subsets of the SB and VEdata presented here. The genotype substitution procedure, but not thebinning procedure, markedly decreased the genotyping error rates forsome locus–population combinations, simultaneously increasing theEPP. Therefore, MINERROR data sets were obtained by modifyingsome loci where genotypes were accommodated to take into accountnull alleles: mfc5 for D1, fs 4-46 for D2, fs 4-46 and fs 1-25 for VE, andfs 1-25 for SB. In D1 the genotyping error decreased from 0.15 to 0.11from the RAW to the MINERROR data set; in D2 the decrease wasfrom 0.11 to 0.04, from 0.11 to 0.03 in VE and from 0.15 to 0.02 in theSB data sets (Table 3).
In the maximum likelihood paternity analyses performed on thefour MINERROR data sets, we reached high confidence in paternityassignment. Considering as resolved paternities both seeds unequi-vocally assigned to one local father and seeds pollinated by externaltrees, the proportion of resolved paternities over the total number ofseeds was high in all plots, ranging from 89% in VE to 98% in D2. For6% of the analysed seeds it was not possible to resolve paternitybecause two (or more) most likely pollen donors with the same LODscore were found (Table 4). Pollen-mediate gene flow from outside theplot, calculated as the proportion of seeds pollinated by external trees,was high in D1 (0.80), D2 (0.77) and VE (0.75), whereas it wasnotably lower in SB (0.53) (Figure 2 and Table 4). Self-pollinationevents are highly infrequent, with only three cases among the 274 localpollination events detected in all plots (1.1%), among which two werein SB. Type-I error estimated by following the simulation methodimplemented in FaMoz appeared to be higher in the Austrian plots(0.32 in D1 and 0.33 in D2) than in the French ones (0.13 in SB and0.19 in VE). Type-II error ranged between 0.23 in D1 and 0.35 in VE.It should be kept in mind that type-I and type-II errors are very likelyto be often under- and over-estimated, respectively, in real populationswhen assessed by simulations, and that the effects of the two types oferrors compensate each other when gene flow rates are determined(Oddou-Muratorio et al., 2003).
The mating model paternity analysis confirmed what was found bythe maximum likelihood method (Figure 2). Only in SB was a lowerpollen immigration (0.51±0.07 s.e.) detected, whereas the other threestands were characterized by high gene flow (0.77±0.06 in D1;0.78±0.05 in D2; 0.81±0.04 in VE). In general, this analysis showedextremely low self-pollination rates in the investigated stands, exceptD2, where a higher proportion of self-pollinated progenies wasdetected (0.09±0.02 s.e.). Selection gradients were not included inthe final model because (i) the s.e.s of the g parameters were extremelylarge and (ii) the final log-likelihood of the two nested models (withand without selection gradients) did not differ significantly (likelihoodratio test: w2
D1¼3.88, df¼3, P¼0.27; w2D2¼0.22, df¼3, P¼0.97).
Mean pollen dispersal distances greater than 80 m were detected bythe maximum likelihood paternity analysis performed on naturalstands (80 m±43.34 s.d. in D1 and 81.01±48.70 s.d. in SB), whereasthey were 42.32 m (±26.15 s.d.) and 58.71 m (±51.44 s.d.) in D2 andVE, respectively. Maximum dispersal distances detected rangedbetween 102.98 m in D2 to 210.51 m in SB. The distributions ofpollen dispersal distances in D2 and VE were significantly lower thanthe expected distributions considering the distances among all possible
Table 2 Genetic diversity within plots. Estimates of number of alleles
(n), observed (Ho) and expected (He) heterozygosity, fixation indexes
(Fis) and null allele frequencies (nullIIM) for the four SSR loci and
averaged over loci
Plot Locus n Ho He Fis nullIIM
D1 mfc 5 24 0.635 0.924 0.313 0.143**
fs 4-46 16 0.456 0.792 0.425 0.187**
fs 1-15 18 0.767 0.835 0.081 0.03
fs 3-04 4 0.414 0.411 �0.007 0.019
Overall 15.5 0.568 0.741 0.233a (0.025±0.023)b
D2 mfc 5 27 0.711 0.905 0.215 0.097**
fs 4-46 12 0.482 0.783 0.385 0.171**
fs 1-15 18 0.817 0.847 0.035 0.022
fs 3-04 4 0.379 0.375 �0.010 0.015
Overall 15.25 0.597 0.728 0.180a (0.013±0.013)b
SB mfc 5 19 0.808 0.868 0.070 0.013
fs 4-46 16 0.584 0.813 0.282 0.089*
fs 1-15 16 0.696 0.840 0.172 0.043
fs 1-25 13 0.455 0.718 0.367 0.122**
Overall 16 0.635 0.810 0.215a (0.083±0.038)b
VE mfc 5 11 0.789 0.876 0.099 0.041
fs 4-46 12 0.611 0.722 0.154 0.063
fs 1-15 20 0.562 0.658 0.146 0.059
fs 1-25 13 0.633 0.757 0.163 0.061
Overall 14 0.649 0.753 0.139a (0.033±0.028)b
aEstimated as Wright’s inbreeding coefficient (Fis¼1�(Ho/He)).bEstimated by following the IIM method described by Chybicki and Burczyk (2009a).Null allele frequency estimates significantly different from 0 are indicated by asterisks:*Po0.01; **Po0.001.
Pollen flow in beechA Piotti et al
325
Heredity

pollen donors and maternal trees (Kolmogorov–Smirnov test:D¼0.23, Po0.01 in D2; D¼0.27, Po0.001 in VE). On the contrary,in both natural stands (D1 and SB) the two distributions were notstatistically different (Figure 3). Dispersal model fitting from NM+analyses showed that the Weibull kernel was the most likely in D1 andSB, whereas the exponential power kernel fitted better in D2 and VE.Although the shape parameters (b) of the two kernels are not directlycomparable, in both kernels b¼1 is generally considered as thethreshold to distinguish between thin-tailed (b41) and fat-tailed(bo1) distributions (Austerlitz et al., 2004). Only for SB we founda scale parameter lower than 1 (bp¼0.83), although its confidenceinterval overlaps 1. The estimates of location parameters confirmedwhat was found in maximum likelihood paternity analyses: theaverage distance of pollen dispersal (dp) was high for natural standsD1 (184.14 m±105.95 s.e.) and SB (165.99 m±59.64 s.e.), and wasshorter for D2 and VE (23.63 m±3.38 s.e. and 60.01 m±21.47 s.e.,respectively; Table 5).
Individual male reproductive success, measured as the number ofgametes assigned to each pollen donor, was more evenly distributed inthe two natural stands, D1 (mean¼0.3±0.54 s.d., max¼2.5) and SB(mean¼0.32±0.6 s.d., max¼3), whereas it was more skewed in D2(mean¼0.26±0.76 s.d., max¼9) and VE (mean¼0.7±1.25 s.d.,max¼6) (Figure 4). The proportion of pollen contributors, calculatedas the number of trees that fathered at least one sampled seed dividedby the number of potential pollen donors, ranged between 0.21 in D2and 0.38 in VE (with 0.30 in D1 and 0.28 in SB). Several variables weretested for their ability to predict the female-specific male reproductivesuccess in the two Austrian plots: distance; phenological overlap;relative position (measured as angles with respect to North, East,South and West) and three different measures of tree sizes, DBH,height and crown area. Quadratic terms and interactions were alsotested. None of them, except distance, was significantly related to male
female-specific success (slope of success versus distance¼�0.005,s.e.¼0.0025, with Po0.05 of being equal to 0, analysis of deviance,Po0.05). Total male success was also tested against several predictors:DBH, phenology, height, crown area and the number of ‘nearbymaternal trees’. Again morphological and phenological variableswere not significantly related with total male success. Only the numberof available maternal trees was related significantly with the total malereproductive success by using both deviance analysis (Po0.01) and t-test on the slope (Po0.01). The slope of this relationship was highestfor the circle with the shortest radius (10 m) and decreased withincreasing radius (Figure 5).
DISCUSSION
We analysed pollen flow patterns in four beech stands that differconsiderably in their management histories. To overcome methodo-logical uncertainties related to different gene flow pattern analyses,we used two different approaches among the most common indispersal studies on plants (Gerber et al., 2000; Burczyk et al., 2002;Bacles et al., 2006). In both approaches we employed recently devel-oped techniques to take into account and correct possible genotypingerrors that can inflate gene flow rates (Bacles and Ennos, 2008;Chybicki and Burczyk, 2010a). The two methods provided almostidentical estimates of gene flow rates. Although our estimates arebased on four simple sequence repeat (SSR) markers, and a highernumber of markers is usually recommended to improve the precisionof paternity inference, we obtained sufficiently high exclusion prob-abilities (B0.98) that were further improved by the genotype sub-stitution procedure applied to raw data sets before performingmaximum likelihood paternity analysis. Gene flow parameters fromthe mating model approach were estimated with high precision, withs.e.s comparable to what was found in similar studies based on largermarker sets (for example, Oddou-Muratorio et al., 2010).
Table 3 Estimates of genotyping error, calculated as the ratio between the number of seed/mother genotypic mismatches (Nm) and the number
of allowed comparisons (Nc), and paternity analysis exclusion probabilities (EPp) for each plot and each locus in the RAW, BIN, BINNULL and
MINERROR data sets (see Materials and Methods for further details on the characteristics of each data set); n is the number of alleles
considering seed and adult genotypes
Plot Data set RAW BIN BINNULL MINERROR
Locus n Nm/Nc Error EPP n Nm/Nc Error EPP n Nm/Nc Error EPP n Nm/Nc Error EPP
D1 mfc5 28 27/241 0.1120 0.834 19 27/241 0.1120 0.827 20 17/287 0.0592 0.827 29 17/287 0.0592 0.834
fs 4-46 24 7/275 0.0254 0.610 8 7/275 0.0254 0.586 9 11/287 0.0383 0.615 24 7/275 0.0254 0.610
fs1-15 24 10/265 0.0377 0.690 9 10/265 0.0377 0.676 10 24/287 0.0836 0.722 24 10/265 0.0377 0.690
fs 3-04 4 0/275 0 0.209 4 0/275 0 0.209 5 2/287 0.0070 0.406 4 0/275 0 0.209
Overall 43/287 0.1498 0.984 43/287 0.1498 0.982 46/287 0.1603 0.989 32/287 0.1114 0.984
D2 mfc5 28 9/238 0.0378 0.834 19 9/238 0.0378 0.827 20 34/275 0.1236 0.827 28 9/238 0.0378 0.834
fs 4-46 24 20/254 0.0787 0.610 8 19/254 0.0748 0.586 9 2/275 0.0073 0.615 25 2/275 0.0073 0.629
fs1-15 24 1/241 0.0041 0.690 9 1/241 0.0041 0.676 10 32/275 0.1164 0.722 24 1/241 0.0041 0.690
fs 3-04 4 0/270 0 0.209 4 0/270 0 0.209 5 0/275 0 0.406 4 0/270 0 0.209
Overall 30/275 0.1091 0.984 29/275 0.1055 0.982 57/275 0.2073 0.989 12/275 0.0436 0.985
SB mfc5 21 3/192 0.0156 0.741 11 2/192 0.0104 0.718 12 2/192 0.0104 0.757 21 3/192 0.0156 0.741
fs 4-46 18 2/192 0.0104 0.636 10 2/192 0.0104 0.629 11 2/192 0.0104 0.681 18 2/192 0.0104 0.636
fs1-15 17 3/192 0.0156 0.685 11 2/192 0.0104 0.677 12 2/192 0.0104 0.724 17 3/192 0.0156 0.685
fs 1-25 13 23/178 0.1292 0.509 8 23/178 0.1292 0.494 9 0/192 0 0.585 14 1/192 0.0052 0.596
Overall 27/192 0.1517 0.985 26/192 0.1461 0.983 3/192 0.0156 0.991 5/192 0.0260 0.988
VE mfc5 22 1/255 0.0039 0.751 9 1/255 0.0039 0.71 10 1/255 0.0039 0.746 22 1/255 0.0039 0.751
fs 4-46 16 14/252 0.0556 0.539 9 14/252 0.0556 0.525 10 2/255 0.0078 0.633 17 2/255 0.0078 0.642
fs1-15 14 0/255 0 0.455 9 0/255 0 0.444 10 0/255 0 0.569 14 0/255 0 0.455
fs 1-25 20 15/251 0.0598 0.564 10 15/251 0.0598 0.545 11 3/255 0.0118 0.640 21 5/255 0.0196 0.657
Overall 30/255 0.1176 0.973 30/255 0.1176 0.965 6/255 0.0235 0.986 8/255 0.0313 0.983
Pollen flow in beechA Piotti et al
326
Heredity

Although European beech has a widespread distribution and greateconomic importance, within-population patterns of gene flow andlong-distance dispersal capabilities through pollen have been poorlystudied in this species. Aerobiological studies showed its large poten-tial for gene flow through pollen. In fact, there is evidence that meso-scale dispersal capabilities of European beech can be large enough tocover distances up to 1000 km, from Northern Italy to Catalonia(Spain) or across the Mediterranean Sea, from Spain to Tunisia(Teissier du Cros et al., 1981; Belmonte et al., 2008). In bio-geogra-phical studies of European beech, the low genetic differentiationamong populations is also usually attributed to its high pollendispersal capability (Comps et al., 2001; Buiteveld et al., 2007). Wefound that all populations, with the exception of SB, experienced highpollen flow rates (from 0.75 to 0.81). Our estimates are in agreementwith what found recently by Oddou-Muratorio et al. (2010) in aparentage analysis of three beech stands from Mt Ventoux. Never-theless, parentage and paternity analyses provide estimates of pollendispersal that are inherently different. Studying pollen movements byparentage analysis (that is, analysing the genetic relationship betweenseedlings and both potential parent trees) has the limitation of linking
pollen fate to the seed dispersal process. This is expected to biasinference on pollen dispersal component. In fact, many successfulpollination events will be missed because the vast majority of seeds donot germinate or fail to establish, or simply because seed can moveoutside the studied area. Oddou-Muratorio et al. (2010), by usingNM+ to perform mating model parentage analysis of beech seedlings,found that pollen immigration ranges between 63 and 72% (63 and68% in two stands inside a recolonization area, and 72% in an ancientforest stand). In general, there is a reduction of B10% in pollenimmigration compared with our findings (see Table 5). Althoughcomparing results from different studies can be hazardous, our standat Mt Ventoux is geographically close and ecologically similar to therecolonization plots (FS1 and FS2) studied by Oddou-Muratorio et al.(2010). Our mp estimate in VE is significantly higher than theestimates in these plots as compared by Z-test (VE versus FS1:Z¼3.16, Po0.001; VE versus FS2: Z¼2.28, Po0.05). Therefore, itcan be hypothesized that the reduction of pollen-mediated gene flowfrom paternity analysis (performed on non-dispersed seeds) to par-entage analysis (on seedlings) might result from a slight advantage inthe seedling establishment of offspring from local adults in the
Table 4 Number of genotyped seeds (Nseed); number of seeds assigned to local fathers (Nloc); number of seeds not assigned to local fathers
(Next); proportion of external pollination events per mother (Next/Nseed); number of seeds assigned to local fathers with only one father above the
LOD threshold (Nsingle); number of seeds assigned to local fathers with more than one father above the LOD threshold (Nmultiple); number of
seeds assigned to local fathers with two or more most likely fathers (same highest LOD scores) (unresolved assignments, Nunres); number of
seeds whose paternity was resolved (Nres) and ratio between resolved paternity assignments and genotyped seeds (Nres/Nseed) reported for each
maternal tree in the four plots
Plot Mother Nseed Nloc Next Next/Nseed Nsingle Nmultiple Nunres Nres Nres/Nseed
D1 1015 22 7 15 0.682 5 2 1 21 0.955
1016 46 12 34 0.739 8 4 - 46 1
1032 41 11 30 0.732 5 6 5 36 0.878
1052 21 2 19 0.905 1 1 1 20 0.952
1053 49 10 39 0.796 7 3 3 46 0.939
1121 20 5 15 0.750 3 2 2 18 0.9
1183 48 6 42 0.875 5 1 - 48 1
1124 19 0 19 1.000 0 0 - 19 1
1122 21 5 16 0.762 4 1 1 20 0.952
Overall 287 58 229 0.798 38 20 13 274 0.955
D2 2002 22 3 19 0.864 3 0 - 22 1
2020 22 2 20 0.909 1 1 - 22 1
2125 21 5 16 0.762 4 1 1 20 0.952
2057 20 5 15 0.750 3 2 1 19 0.95
2013 48 15 33 0.688 12 3 1 47 0.979
2018 38 6 32 0.842 5 1 - 38 1
2019 43 8 35 0.814 8 0 - 43 1
2028 39 9 30 0.769 7 2 2 37 0.949
2088 22 9 13 0.591 6 3 1 21 0.955
Overall 275 62 213 0.775 49 13 6 269 0.978
SB 3505 45 24 21 0.467 15 9 6 39 0.867
3502 51 24 27 0.529 14 10 5 46 0.902
3503 44 20 24 0.545 14 6 3 41 0.932
3504 52 23 29 0.558 18 5 - 52 1
Overall 192 91 101 0.526 61 30 14 178 0.927
VE 4802 52 22 30 0.577 6 16 16 36 0.692
4803 52 8 44 0.846 5 3 1 51 0.981
4804 51 11 40 0.784 8 3 2 49 0.961
4805 50 13 37 0.740 6 7 3 47 0.94
4801 50 9 41 0.820 3 6 5 45 0.9
Overall 255 63 192 0.753 28 35 27 228 0.894
Pollen flow in beechA Piotti et al
327
Heredity

colonization process. In the same way Bacles and Ennos (2008) detecteda limitation in the recruitment of genes carried by immigrant pollen bycomparing gene flow rates from non-dispersed seeds and newlyestablished seedlings in fragmented Fraxinus excelsior populations.
High gene flow through pollen seems a general characteristic ofFagaceae. Almost all estimates of pollen immigration in the literaturelie between 0.5 and 0.7 (for example, Dow and Ashley, 1998; Streiffet al., 1999; Buiteveld et al., 2001; Valbuena-Carabana et al., 2005;Chybicki and Burczyk, 2010b). When values lower than 0.5 werefound, they were associated with particular ecological conditions. InQuercus semiserrata low pollen immigration was ascribed to highisolation from conspecific populations owing to habitat fragmentation(Pakkad et al., 2008). Similar findings were reported by Pluess et al.(2009) and Hanaoka et al. (2007) in highly disturbed populations ofQuercus lobata and Fagus crenata, respectively. Among our studiedpopulations, only SB showed reduced pollen immigration. The studyplot is inside a 2000-ha low-altitude (500–1100 m above sea level)beech forest in the St Baume massif, B60 km from the nearest beechforest. The persistence of beech at such low altitude is determined bythe wet and cool microclimate that characterizes the northern slope of
St Baume massif. This forest retained the status of a sacred forestprobably since the pre-Roman times and maintained a long history oflimited human influence. It presents a markedly archaic character andis considered as a Pre-boreal–Boreal outpost of an early spread fromthe pleniglacial refugium near the Rhone delta (Delhon and Thiebault,2005). There is indeed evidence that this population has peculiarphenotypic and genetic characteristics (Delhon and Thiebault, 2005;Buiteveld et al., 2007). Its lower than average pollen immigration andhigh Fis, coupled with a low self-pollination rate, can thereforerepresent the consequences of bi-parental inbreeding due to elevatedisolation from surrounding genetically distinct populations and thehigh adult tree density characterizing this stand (150 trees perhectare). Tree density can have significant influences on pollen move-ments (Hardy, 2009), as discussed in following paragraphs. Significantlevels of bi-parental inbreeding were already documented in twomanaged (at different degree of intensity) beech stands: one in acontinuous and one in a fragmented landscape (Chybicki et al., 2009).In particular, these authors demonstrated that bi-parental inbreedingaccounted for the majority of homozygous excess in the ‘fragmented’population.
Figure 3 Distribution of inferred pollen dispersal distances (black bars), and distribution of all distances between potential pollen donors and maternal trees
(grey bars) in the four plots.
Table 5 Pollen migration rate (mp), selfing rate (s), most likely dispersal kernel family, average distance of pollen dispersal (dp) and shape
parameter (bp) estimated by the mating model paternity analysis in the different sites
Site D1a D2 SB VE
Parameter Estimate s.e. Estimate s.e. Estimate s.e. Estimate s.e.
mp 0.77 0.06 0.78 0.05 0.51 0.07 0.81 0.04
s 0.04 0.02 0.09 0.02 0.01 0.01 0.01 0.01
Dispersal kernel Weibull Exponential power Weibull Exponential power
dp 184.14 105.95 23.63 3.38 165.99 59.64 60.01 21.47
bp 1.10 0.33 15.83 NE 0.83 0.17 1.48 1.12
Abbreviation: NE, corresponding s.e. not estimated.aResults obtained by setting the ‘stop’ criterion parameter to 1; the maximum likelihood fitting with default value of 0.001 yields an unrealistic estimate of dp¼44398 (±446462 s.e.), withmp¼0.77 (±0.05 s.e.), s¼0.04 (±0.02 s.e.) and bp¼0.98 (±0.32 s.e.).
Pollen flow in beechA Piotti et al
328
Heredity

We found that the average within-population pollination distancesof the natural stands D1 and SB were extremely similar, eitherestimated with FaMoz (80 and 81 m, respectively) or with NM+(184 and 166 m, respectively). These values are higher than previousestimates for beech based on parentage methods: 30–43 m in threestands studied by Wang (2004) and 28–55 m in three stands studied byOddou-Muratorio et al. (2010). The majority of the studied stands arenot undisturbed, as D1 and SB, but fragmented or located in
recolonization areas. Previous estimates of average pollination dis-tances for beech are more similar to what found in our more disturbedplots (D2 and VE), ranging from 24 to 60 m depending on theestimation method. In addition, in D2 and VE pollen dispersaldistances are shorter on average than the random sampling ofdistances calculated from the location of all adult trees. In Fagaceaeaverage pollination distances usually span from a few meters to amaximum of 270 m in Quercus pyrenaica (Valbuena-Carabana et al.,2005), and our results confirm that F. sylvatica does not represent anexception when within-population spatial processes are considered.However, from an evolutionary point of view, local patterns are oflittle interest in species that show such an extended long-distancedispersal component of gene flow through pollen, with more than75% pollination events involving trees outside the study area. Fewattempts to include immigration events in the description of propa-gule dispersal distributions have been made. In all cases it has beenshown how the peak, as well as the fatness of the tail of the curve, areusually heavily underestimated (Jones et al., 2005; Piotti et al., 2009).Chybicki and Burczyk (2010b) recently found that, taking intoaccount immigrant pollen, and thus considering the whole pollinationprocess (pollen movements within population and from outside),resulted in an increase of average pollination distances by more thanone order of magnitude (29–463 m and 17–297 m in two oakpopulations characterized by B60% pollen immigration).
As far as we know, our study is the first attempt to compare geneflow through pollen between managed and unmanaged forest treestands by means of paternity analysis, an approach that allowscomparing pollen immigration levels, as well as the distributions ofpollen dispersal distances and male reproductive success. Finkeldeyand Ziehe (2004), in a review of the genetic implications of silvicul-tural regimes, noticed that genetic structure differences in managedversus unmanaged forests are difficult to monitor because of life-cyclecharacteristics of most forest tree species. This usually determines atime lag before the consequences of disturbances, such as habitatfragmentation or exploitation, can be detected (Kramer et al., 2008).In fact, several studies did not find any reduction in genetic diversityor changes in the mating systems of wind-pollinated temperate speciesfollowing silvicultural practices (for example, Rajora and Pluhar, 2003;Robledo-Arnuncio et al., 2004). However, evidence that silviculturaltreatments may modify within-stand genetic structure exists (Rajora,1999; Rajora et al., 2000). Takahashi et al. (2000), comparing primaryand recently harvested F. crenata stands, found signs of forest cuttingon genetic structure, as less genetic diversity and a considerably higherspatial genetic structure was found in the harvested stand. In aprevious work on the effects of management history on geneticdiversity in beech stands, Buiteveld et al. (2007) found that pairwisecomparisons between managed and unmanaged stands revealed nodifferences in genetic diversity estimates. On the other hand, theypointed out that long life-span and generation time of beech should betaken into account because the time span during which forestmanagement was practiced in these stands was relatively short (atmost two to three generations) and the impact of management maystill be manifested after more generations. Therefore, contemporarypattern of gene flow can be a more reliable indicator for studying theconsequences of processes that often concern a few recent generations,such as forest management or fragmentation (Aguilar et al., 2008;Piotti, 2009).
To study the possible effect of forest management on pollen flowpatterns, we concentrated our attention on D1–D2 comparison. D1was never managed whereas D2, only 500 m away, was managedaccording to the shelterwood system (high forest) in combination with
Figure 4 Distribution of male individual reproductive success, measured as
the number of pollination events in which every adult tree was involved, for
the four study plots. Each black bar represents an adult tree involved in at
least one pollination event. The number of adult trees with no paternity
assigned is reported near each bar-plot in italic.
Figure 5 Slopes of the relationship between individual male reproductive
success and number of maternal trees located within a circle of radius 10,
20, 30 m and so on, up to 140m, centred on each potential pollen donor.
Pollen flow in beechA Piotti et al
329
Heredity

natural regeneration. These two stands are characterized by similarpollen flow from outside; mean pollination distance in D1 is approxi-mately twice that in D2 (although D1 is twice the size of D2) and thedistributions of male reproductive success are not statistically differ-ent. The only detected difference is that pollen dispersal distances inD2 are ‘shorter’ compared with the expected distribution of distancesamong all potential pollen donors and maternal trees, whereas in D1the observed and expected distributions are similar. The shelterwoodsystem applied in D2, oriented to maintain a density close to 120 treesper hectare, has determined a marked difference in stand density fromD1 old growth forest: adult tree density is 57 trees per hectare in D1,about one-third of the D2 density (163 trees per hectare) (Kramer,2004). The impact of forest management is often measured in terms ofchange in stand density. Several silvicultural techniques tend to reducestand density, increasing inter-individual distances. In some studies,this has been advocated as the cause of enhanced pollen movement inmanaged populations (El-Kassaby and Jaquish, 1996; Robledo-Arnun-cio et al., 2004). Hardy (2009) described how density can mostly affectdispersal by modifying animal behaviour or altering wind movements.He pointed out that in wind-pollinated species plant density can affectwind patterns and the aerodynamic properties of pollen dispersal, andopen forest often promotes further-ranging dispersal. The meaneffective pollen dispersal distance is therefore expected to be lowerunder high density and/or when individuals are aggregated, andthis might explain the reduced pollen dispersal found in the managedD2 stand.
The results from Austrian stands were also used to study therelationship between reproductive success and phenotypic traits. Themother–father distance seems to be the only determinant factor inshaping the distribution of reproductive success, as we found a weakbut significant negative relationship between them. This means that,the higher the availability of ‘pollen traps’ (sampled maternal trees)around a pollen donor, the higher the probability of detectingsuccessful pollinations. Such a finding can have consequences in theexperimental planning of future pollen flow studies, but is not directlyrelated to the ability of particular phenotypes to be favoured in the‘struggle for pollination’. However, neither tree size nor phenologicalbehaviour is related to the number of pollination events recorded foreach adult tree in these stands. It is difficult to find a general trend onthis relationship in the literature. Hanaoka et al. (2007) found in asmall and isolated population of F. crenata that mating frequency wasweakly and negatively correlated with mother–father distance, con-firming our findings about the importance of seed trap position in thesampling area, and its positive correlation with father stem diameter.In the same species, Asuka et al. (2005), only in one out of the twostudy plots, found that larger adults had larger number of offspring. InF. sylvatica, the effect of diameter on male and female fertility wasstudied by Oddou-Muratorio et al. (2010), pointing out how tree sizeaffected both, but with a more pronounced effect on female fertility.
In conclusion, our paternity analyses confirm that, in general,pollen-mediated gene flow in European beech is very high. Forestmanagement by following the shelterwood system has minor influenceon within-stand dispersal, and did not change the foreign pollenarrival rate. This can represent a major explanation for previousfindings on the low impact of different management strategies onthe genetic diversity of this species (Leonardi and Menozzi, 1996;Buiteveld et al., 2007). Population isolation seems to be a moreeffective factor in reducing genetic connectivity, even if in the plotwithin the large isolated remnant of St Baume Mountain a pollen flowrate as high as 0.5 was detected. At present, beech range is shrinking inthe Mediterranean regions because of climate change and human land
use, and several highly fragmented populations can be found in thisarea (Jump and Penuelas, 2006). A further northward shift of the rearedge of the distribution caused by loss of suitable habitats is predictedin the near future in a recent modelling study (Kramer et al., 2010). Inthis scenario, information on the relationship between pollen-mediated gene flow and isolation is essential to study the effects offragmentation on the genetic diversity of tree populations and forplanning conservation strategies in temperate anemophilous trees.
DATA ARCHIVING
Genetic and phenotipic data have been deposited at Dryad(doi:10.5061/dryad.6kt34).
CONFLICT OF INTEREST
The authors declare no conflict of interest.
ACKNOWLEDGEMENTS
This study was financially supported by the European Commission through the
Dynabeech project (5th Framework Programme, QLRT-1999-01210). The
support to KK from the project Genetic adaptation of plant species to climate
change at the limits of their areas (KB-14-004-004), funded by the Dutch
Ministry of Economics, Agriculture and Innovation, is gratefully acknowledged.
Adams WT, Birkes DS (1991). Estimating mating patterns in forest tree populations. InFineschi S et al. (eds). Biochemical Markers in the Population Genetics of Forest Trees.SPB Academic Publishing: The Hague. pp 157–172.
Aguilar R, Quesada M, Ashworth L, Herrerias-Diego Y, Lobo J (2008). Genetic conse-quences of habitat fragmentation in plant populations: susceptible signals in plant traitsand methodological approaches. Mol Ecol 17: 5177–5188.
Asuka Y, Tomaru N, Munehara Y, Tani N, Tsumura Y, Yamamoto S (2005). Half-sib familystructure of Fagus crenata saplings in an old-growth beech-dwarf bamboo forest. MolEcol 14: 2565–2575.
Austerlitz F, Dick CW, Dutech C, Klein EK, Oddou-Muratorio S, Smouse PE et al. (2004).Using genetic markers to estimate the pollen dispersal curve. Mol Ecol 13: 937–954.
Bacles CFE, Lowe AJ, Ennos RA (2006). Effective seed dispersal across a fragmentedlandscape. Science 311: 628.
Bacles CFE, Ennos RA (2008). Paternity analysis of pollen-mediated gene flow for Fraxinusexcelsior L. in a chronically fragmented landscape. Heredity 101: 368–380.
Becker M (1981). Taxonomie et caracteres botanique. In: Teissier du Cros E et al. (eds). LeHetre. INRA: Paris. pp 35–46.
Belmonte J, Alarcon M, Avila A, Scialabba E, Pino D (2008). Long-range transport of beech(Fagus sylvatica L.) pollen to Catalonia (north-eastern Spain). Int J Biometeorol 52:675–687.
Buiteveld J, Bakker EG, Bovenschen J, de Vries SMG (2001). Paternity analysis in a seedorchard of Quercus robur L. and estimation of the amount of background pollinationusing microsatellite markers. Forest Genet 8: 331–337.
Buiteveld J, Vendramin GG, Leonardi S, Kramer K, Geburek T (2007). Genetic diversity anddifferentiation in European beech (Fagus sylvatica L.) stands varying in managementhistory. Forest Ecol Manag 247: 98–106.
Burczyk J, Adams WT, Shimizu JY (1996). Mating patterns and pollen dispersal in a naturalknobcone pine (Pinus attenuata Lemmon.) stand. Heredity 77: 251–260.
Burczyk J, Adams WT, Moran GF, Griffin AR (2002). Complex patterns of mating revealed ina Eucalyptus regnans seed orchard using allozyme markers and the neighbourhoodmodel. Mol Ecol 11: 2379–2391.
Burczyk J, Chybicki IJ (2004). Cautions on direct gene flow estimation in plant popula-tions. Evolution 58: 956–963.
Chybicki IJ, Burczyk J (2009a). Simultaneous estimation of null alleles and inbreedingcoefficients. J Hered 100: 106–133.
Chybicki IJ, Burczyk J (2009b). NM+: the Software Implementing Parentage-BasedMethods for Estimation of Gene Dispersal and Mating Patterns Based on Half-sibSeeds or Seedlings Data. The User Manual. Kazimierz Wielki University: Bydgoszcz,Poland.
Chybicki IJ, Trojankiewicz M, Oleksa A, Dzialuk A, Burczyk J (2009). Isolation-by-distancewithin naturally established populations of European beech (Fagus sylvatica). Botany87: 791–798.
Chybicki IJ, Burczyk J (2010a). NM+: software implementing parentage-based models forestimating gene dispersal and mating patterns in plants. Mol Ecol Res 10: 1071–1075.
Chybicki IJ, Burczyk J (2010b). Realized gene flow within mixed stands of Quercus robur L.and Q. petraea (Matt.) L. revealed at the stage of naturally established seedling. MolEcol 19: 2137–2151.
Pollen flow in beechA Piotti et al
330
Heredity

Comps B, Gomory D, Letouzey J, Thiebaut B, Petit RJ (2001). Diverging trends betweenheterozygosity and allelic richness during postglacial colonization in the Europeanbeech. Genetics 157: 389–397.
Crawley MJ (2002). Statistical Computing: an Introduction to Data Analysis Using S-Plus.John Wiley and Sons: New York.
Delhon C, Thiebault S (2005). The migration of beech (Fagus sylvatica L.) up theRhone: the Mediterranean history of a ‘‘mountain’’ species. Veget Hist Archaeobot 14:119–132.
Dow BD, Ashley MV (1998). High levels of gene flow in Bur oak revealed by paternityanalysis using microsatellites. J Hered 89: 62–70.
Eckert CG, Samis KE, Lougheed SC (2008). Genetic variation across species’ geographicalranges: the central–marginal hypothesis and beyond. Mol Ecol 17: 1170–1188.
El-Kassaby YA, Jaquish B (1996). Population density and mating pattern in western larch.J Hered 87: 438–443.
El-Kassaby YA, Benowicz A (2000). Effects of commercial thinning on genetic, plantspecies and structural diversity in second growth Douglas-fir (Pseudotsuga menziesii(Mirb.) Franco) stands. Forest Genet 7: 193–203.
Finkeldey R, Ziehe M (2004). Genetic implications of silvicultural regimes. Forest EcolManag 197: 231–244.
Gerber S, Mariette S, Streiff R, Bodenes C, Kremer A (2000). Comparison of microsa-tellites and amplified fragment length polymorphism markers for parentage analysis.Mol Ecol 9: 1037–1048.
Gerber S, Chabrier P, Kremer A (2003). FAMOZ: a software for parentage analysisusing dominant, codominant and uniparentally inherited markers. Mol Ecol Notes 3:479–481.
Hanaoka S, Yuzurihara J, Asuka Y, Tomaru N, Tsumura Y, Kakubari Y et al. (2007). Pollen-mediated gene flow in a small, fragmented natural population of Fagus crenata. Can JBot 85: 404–413.
Hardy OJ (2009). How fat is the tail? Heredity 103: 437–438.Hoebee SE, Arnold M, Duggelin C, Gugerli F, Brodbeck S, Rotach P et al. (2007). Mating
patterns and contemporary gene flow by pollen in a large continuous and a smallisolated population of the scattered forest tree Sorbus torminalis. Heredity 99: 47–55.
Jones AG, Ardren WR (2003). Methods of parentage analysis in natural populations. MolEcol 12: 2511–2523.
Jones AG, Small CM, Paczolt KA, Ratterman NL (2010). A practical guide to methods ofparentage analysis. Mol Ecol Res 10: 6–30.
Jones FA, Chen J, Weng GJ, Hubbell SP (2005). A genetic evaluation of seed dispersal inthe neotropical tree Jacaranda copaia (Bignoniaceae). Am Nat 166: 543–555.
Jump AS, Penuelas J (2005). Running to stand still: adaptation and the response of plantsto rapid climate change. Ecol Lett 8: 1010–1020.
Jump AS, Penuelas J (2006). Genetic effects of chronic habitat fragmentation in a wind-pollinated tree. Proc Natl Acad Sci USA 103: 4–8.
Kramer AT, Ison JL, Ashley MV, Howe HF (2008). The paradox of forest fragmentationgenetics. Cons Biol 22: 878–885.
Kramer K (2004). Effects of silvicultural regimes on dynamics of genetic and ecologicaldiversity of European beech forests. Impact assessment and recommendations forsustainable forestry Wageningen. Final Report of 5th framework project DynaBeech,QLK5-CT-1999-1210.
Kramer K, Degen B, Buschbom J, Hickler T, Thuiller W, Sykes MT et al. (2010). Modellingexploration of the future of European beech (Fagus sylvatica L.) under climate change—range, abundance, genetic diversity and adaptive response. Forest Ecol Manag 259:2213–2222.
Leonardi S, Menozzi P (1996). Spatial structure of genetic variability in natural strands ofFagus sylvatica L. (beech) in Italy. Heredity 77: 359–368.
Malaisse F (1967). Contribution a l’etude des hetraies d’Europe occidentaleNote 6. Apercu climatologique et phenologique relatif aux hetraies situees l’axeArdennes belges—Provence. Congres IUFRO Munich, Expose II. Section 21 21, pp325–334.
McCullagh P, Nelder JA (1989). Generalized Linear Models 2nd edn. Chapman Hall:London.
Oddou-Muratorio S, Houot M-L, Demesure-Musch B, Austerlitz F (2003). Pollen flow in thewildservice tree, Sorbus torminalis (L.) Crantz. I. Evaluating the paternity analysisprocedure in continuous populations. Mol Ecol 12: 3427–3439.
Oddou-Muratorio S, Vendramin GG, Buiteveld J, Fady B (2009). Population estimators orprogeny tests: what is the best method to assess null allele frequencies at SSR loci?Cons Genet 10: 1343–1347.
Oddou-Muratorio S, Bontemps A, Klein EK, Chybicki I, Vendramin GG, Suyama Y (2010).Comparison of direct and indirect genetic methods for estimating seed and pollendispersal in Fagus sylvatica and Fagus crenata. Forest Ecol Manag 259: 2151–2159.
Pakkad G, Ueno S, Yoshimaru H (2008). Gene flow pattern and mating system in asmall population of Quercus semiserrata Roxb. (Fagaceae). Forest Ecol Manag 255:3819–3826.
Pastorelli R, Smulders MJM, Van’t Westende WPC, Vosman B, Giannini R, Vettori C et al.(2003). Characterization of microsatellite markers in Fagus sylvatica L. and Fagusorientalis Lipsky. Mol Ecol Notes 3: 76–78.
Piotti A (2009). The genetic consequences of habitat fragmentation: the case of forests.iForest 2: 75–76.
Piotti A, Leonardi S, Piovani P, Scalfi M, Menozzi P (2009). Spruce colonization at treeline:where do those seeds come from? Heredity 103: 136–145.
Pluess AR, Sork VL, Dolan B, Davis FW, Grivet D, Merg K et al. (2009). Short distancepollen movement in a wind-pollinated tree, Quercus lobata (Fagaceae). Forest EcolManag 258: 735–744.
R Development Core Team (2010). R: a Language and Environment for StatisticalComputing. R Foundation for Statistical Computing: Vienna, Austria. ISBN 3-900051-07-0, URLhttp://www.R-project.org/.
Rajora OP (1999). Genetic biodiversity impacts of silvicultural practices and phenotypicselection in white spruce. Theor Appl Genet 99: 954–961.
Rajora OP, Rahman MH, Buchert GP, Dancik BP (2000). Microsatellite DNA analysis ofgenetic effects of harvesting in old-growth eastern white pine (Pinus strobus) in Ontario,Canada. Mol Ecol 9: 339–348.
Rajora OP, Pluhar SA (2003). Genetic diversity impacts of forest fires, forest harvesting,and alternative reforestation practices in black spruce (Picea mariana). Theor ApplGenet 106: 1203–1212.
Robledo-Arnuncio JJ, Smouse PE, Gil L, Alia R (2004). Pollen movement under alternativesilvicultural practices in native populations of Scots pine (Pinus sylvestris L.) in centralSpain. Forest Ecol Manag 197: 245–255.
Robledo-Arnuncio JJ, Gil L (2005). Patterns of pollen dispersal in a small population ofPinus sylvestris L. revealed by total-exclusion paternity analysis. Heredity 94: 13–22.
Scalfi M, Troggio M, Piovani P, Leonardi S, Magnaschi G, Vendramin GG et al. (2004). ARAPD, AFLP and SSR linkage map, and QTL analysis in European beech (Fagussylvatica L.). Theor Appl Genet 108: 433–441.
Slavov GT, Howe GT, Gyaourova AV, Birkes DS, Adams WT (2005). Estimating pollen flowusing SSR markers and paternity exclusion: accounting for mistyping. Mol Ecol 14:3109–3121.
Slavov GT, Leonardi S, Burczyk J, Adams WT, Strauss SH, DiFazio SP (2009). Extensivepollen flow in two ecologically contrasting populations of Populus trichocarpa. Mol Ecol18: 357–373.
Sokal RR, Rohlf FJ (1995). Biometry: Principles and Practices of Statistics in BiologicalResearch 3rd edn. W.H. Freeman and Company: New York.
Streiff R, Ducousso A, Lexer C, Steinkellner H, Gloessl J, Kremer A (1999). Pollendispersal inferred from paternity analysis in a mixed oak stand of Quercus robur L.and Q. petraea (Matt.) Liebl. Mol Ecol 8: 831–841.
Takahashi M, Mukouda M, Koono K (2000). Differences in genetic structure between twoJapanese beech (Fagus crenata Blume) stands. Heredity 84: 103–115.
Tanaka K, Tsumura Y, Nakamura T (1999). Development and polymorphism of micro-satellite markers for Fagus crenata and the closely related species, F. japonica. TheorAppl Genet 99: 11–15.
Teissier du Cros E, Le Tacon F, Nepveu G, Parde J, Timbal JE (1981). Le Hetre.Departement des Recherches Forestieres, INRA: Paris.
Valbuena-Carabana M, Gonzalez-Martinez SC, Sork VL, Collada C, Soto A, Goicoechea PGet al. (2005). Gene flow and hybridisation in a mixed oak forest (Quercus pyrenaicaWilld. and Quercus petraea (Matts.) Liebl.) in central Spain. Heredity 95: 457–465.
Wang KS (2004). Gene flow in European beech (Fagus sylvatica L.). Genetica 122:105–113.
Williams CG (2010). Long-distance pine pollen still germinates after meso-scale dispersal.Am J Bot 97: 846–855.
Pollen flow in beechA Piotti et al
331
Heredity