Lizards on Ice: Evidence for Multiple Refugia in Liolaemus pictus (Liolaemidae) during the Last...
17
Lizards on Ice: Evidence for Multiple Refugia in Liolaemus pictus (Liolaemidae) during the Last Glacial Maximum in the Southern Andean Beech Forests Iva ´ n Vera-Escalona 1 , Guillermo D’Elı ´a 2 , Nicola ´ s Gouin 3 , Frank M. Fontanella 4 , Carla Mun ˜ oz-Mendoza 1 , Jack W. Sites, Jr. 4 , Pedro F. Victoriano 1,5 * 1 Departamento de Zoologı ´a, Facultad de Ciencias Naturales y Oceanogra ´ficas, Universidad de Concepcio ´ n, Concepcio ´ n, Chile, 2 Instituto de Ciencias Ambientales y Evolutivas, Universidad Austral de Chile, Valdivia, Chile, 3 Centro de Estudios Avanzados en Zonas A ´ ridas, Facultad de Ciencias del Mar, Universidad Cato ´ lica del Norte, Coquimbo, Chile, 4 Department of Biology and Bean Life Science Museum, Brigham Young University, Provo, Utah, United States of America, 5 Centro de Investigaciones de Ecosistemas de la Patagonia CIEP, Coihaique, Chile Abstract Historical climate changes and orogenesis are two important factors that have shaped intraspecific biodiversity patterns worldwide. Although southern South America has experienced such complex events, there is a paucity of studies examining the effects on intraspecific diversification in this part of the world. Liolaemus pictus is the southernmost distributed lizard in the Chilean temperate forest, whose genetic structure has likely been influenced by Pleistocene glaciations. We conducted a phylogeographic study of L. pictus in Chile and Argentina based on one mitochondrial and two nuclear genes recovering two strongly divergent groups, Northern and Southern clades. The first group is distributed from the northernmost limit of the species to the Araucanı ´a region while the second group is distributed throughout the Andes and the Chiloe ´ archipelago in Southern Chile. Our results suggest that L. pictus originated 751 Kya, with divergence between the two clades occurring in the late Pleistocene. Demographic reconstructions for the Northern and Southern clades indicate a decrease in effective population sizes likely associated with Pleistocene glaciations. Surprisingly, patterns of genetic variation, clades age and historical gene flow in populations distributed within the limits of the Last Glacial Maximum (LGM) are not explained by recent colonization. We propose an ‘‘intra-Andean multiple refuge’’ hypothesis, along with the classical refuge hypothesis previously proposed for the biota of the Chilean Coastal range and Eastern Andean Cordillera. Our hypothesis is supported by niche modelling analysis suggesting the persistence of fragments of suitable habitat for the species within the limits of the LGM ice shield. This type of refuge hypothesis is proposed for the first time for an ectothermic species. Citation: Vera-Escalona I, D’Elı ´a G, Gouin N, Fontanella FM, Mun ˜ oz-Mendoza C, et al. (2012) Lizards on Ice: Evidence for Multiple Refugia in Liolaemus pictus (Liolaemidae) during the Last Glacial Maximum in the Southern Andean Beech Forests. PLoS ONE 7(11): e48358. doi:10.1371/journal.pone.0048358 Editor: Sergios-Orestis Kolokotronis, Fordham University, United States of America Received May 11, 2012; Accepted September 24, 2012; Published November 27, 2012 Copyright: ß 2012 Vera-Escalona et al. This is an open-access article distributed under the terms of the Creative Commons Attribution License, which permits unrestricted use, distribution, and reproduction in any medium, provided the original author and source are credited. Funding: This work was financed by FONDECYT 1120872, DIUC Semilla 2009 016-SP UdeC, DIUC Semilla 205.113.067-1SP UdeC, and NSF-OISE 0530267. The funders had no role in study design, data collection and analysis, decision to publish, or preparation of the manuscript. Competing Interests: The authors have declared that no competing interests exist. * E-mail: [email protected] Introduction The landscape of southern South America has been shaped by several climatic and geological processes, of which two are especially important because of the magnitude of their evolution- ary consequences: orogenic changes associated to the uplift of Andes [1] and glacial cycles with alternate levels of contrasting temperatures and concordant expansion and retreat of ice shields during the Pleistocene-Holocene period [2]. Andean uplift and subsequent interaction with the Pacific wet wind drift sustains the unique Valdivian Forest, characterized by a high level of endemism throughout a narrow band (,150–250 km wide) on the western Andes in Chile, from 36uS to 56uS, and adjacent Argentinean areas [3,4]. These forests, dominated by Nothofagus tree species and their associated communities, are formally recognized as a Chilean Biodiversity Hot Spot [5]. The Pleistocene epoch was characterized by several global glacial cycles that deeply impacted polar and temperate regions. The well-studied Last Glacial Maximum (LGM), which occurred approximately 23,000–18,000 years ago (ya) [6], modified landscapes throughout the distribution of the Southern Andean temperate forest due to the presence of an ice shield that extended from ,36uS to ,42uS. At maximum extent, this ice shield lowered sea level by ,120 m, exposing coastal areas and connecting near shore islands with the mainland. Glaciers likely covered all land south of the Cordillera del Piuche ´n on Chiloe ´ Island (Fig. 1; [7,8,9]), but this ice shield could have presented small ice-free ‘‘islands’’, mainly in the coastal range, small Andean valleys, and active volcanic zones. For example, both the N ˜ uble region (,37uS) and the Lonquimay Valley (,38uS) in the Chilean Andes were likely covered by discontinuous ice shields [10,11,12], which may explain present day patterns of genetic variation in several organisms such as freshwater crabs and frogs [13,14]. Recent studies have presented evidence for fragmented intra-ice shield refugia and small populations of plants and poikilothermic vertebrates that persisted through cyclic glaciations [13,14,15]. The phylogeographic consequences of these glacial phases would include: (1) fragmentation and decrease in population effective PLOS ONE | www.plosone.org 1 November 2012 | Volume 7 | Issue 11 | e48358
Transcript of Lizards on Ice: Evidence for Multiple Refugia in Liolaemus pictus (Liolaemidae) during the Last...

Lizards on Ice: Evidence for Multiple Refugia inLiolaemus pictus (Liolaemidae) during the Last GlacialMaximum in the Southern Andean Beech ForestsIvan Vera-Escalona1, Guillermo D’Elıa2, Nicolas Gouin3, Frank M. Fontanella4, Carla Munoz-Mendoza1,
Jack W. Sites, Jr.4, Pedro F. Victoriano1,5*
1 Departamento de Zoologıa, Facultad de Ciencias Naturales y Oceanograficas, Universidad de Concepcion, Concepcion, Chile, 2 Instituto de Ciencias Ambientales y
Evolutivas, Universidad Austral de Chile, Valdivia, Chile, 3 Centro de Estudios Avanzados en Zonas Aridas, Facultad de Ciencias del Mar, Universidad Catolica del Norte,
Coquimbo, Chile, 4 Department of Biology and Bean Life Science Museum, Brigham Young University, Provo, Utah, United States of America, 5 Centro de Investigaciones
de Ecosistemas de la Patagonia CIEP, Coihaique, Chile
Abstract
Historical climate changes and orogenesis are two important factors that have shaped intraspecific biodiversity patternsworldwide. Although southern South America has experienced such complex events, there is a paucity of studies examiningthe effects on intraspecific diversification in this part of the world. Liolaemus pictus is the southernmost distributed lizard inthe Chilean temperate forest, whose genetic structure has likely been influenced by Pleistocene glaciations. We conducted aphylogeographic study of L. pictus in Chile and Argentina based on one mitochondrial and two nuclear genes recoveringtwo strongly divergent groups, Northern and Southern clades. The first group is distributed from the northernmost limit ofthe species to the Araucanıa region while the second group is distributed throughout the Andes and the Chiloe archipelagoin Southern Chile. Our results suggest that L. pictus originated 751 Kya, with divergence between the two clades occurringin the late Pleistocene. Demographic reconstructions for the Northern and Southern clades indicate a decrease in effectivepopulation sizes likely associated with Pleistocene glaciations. Surprisingly, patterns of genetic variation, clades age andhistorical gene flow in populations distributed within the limits of the Last Glacial Maximum (LGM) are not explained byrecent colonization. We propose an ‘‘intra-Andean multiple refuge’’ hypothesis, along with the classical refuge hypothesispreviously proposed for the biota of the Chilean Coastal range and Eastern Andean Cordillera. Our hypothesis is supportedby niche modelling analysis suggesting the persistence of fragments of suitable habitat for the species within the limits ofthe LGM ice shield. This type of refuge hypothesis is proposed for the first time for an ectothermic species.
Citation: Vera-Escalona I, D’Elıa G, Gouin N, Fontanella FM, Munoz-Mendoza C, et al. (2012) Lizards on Ice: Evidence for Multiple Refugia in Liolaemus pictus(Liolaemidae) during the Last Glacial Maximum in the Southern Andean Beech Forests. PLoS ONE 7(11): e48358. doi:10.1371/journal.pone.0048358
Editor: Sergios-Orestis Kolokotronis, Fordham University, United States of America
Received May 11, 2012; Accepted September 24, 2012; Published November 27, 2012
Copyright: � 2012 Vera-Escalona et al. This is an open-access article distributed under the terms of the Creative Commons Attribution License, which permitsunrestricted use, distribution, and reproduction in any medium, provided the original author and source are credited.
Funding: This work was financed by FONDECYT 1120872, DIUC Semilla 2009 016-SP UdeC, DIUC Semilla 205.113.067-1SP UdeC, and NSF-OISE 0530267. Thefunders had no role in study design, data collection and analysis, decision to publish, or preparation of the manuscript.
Competing Interests: The authors have declared that no competing interests exist.
* E-mail: [email protected]
Introduction
The landscape of southern South America has been shaped by
several climatic and geological processes, of which two are
especially important because of the magnitude of their evolution-
ary consequences: orogenic changes associated to the uplift of
Andes [1] and glacial cycles with alternate levels of contrasting
temperatures and concordant expansion and retreat of ice shields
during the Pleistocene-Holocene period [2]. Andean uplift and
subsequent interaction with the Pacific wet wind drift sustains the
unique Valdivian Forest, characterized by a high level of
endemism throughout a narrow band (,150–250 km wide) on
the western Andes in Chile, from 36uS to 56uS, and adjacent
Argentinean areas [3,4]. These forests, dominated by Nothofagus
tree species and their associated communities, are formally
recognized as a Chilean Biodiversity Hot Spot [5].
The Pleistocene epoch was characterized by several global
glacial cycles that deeply impacted polar and temperate regions.
The well-studied Last Glacial Maximum (LGM), which occurred
approximately 23,000–18,000 years ago (ya) [6], modified
landscapes throughout the distribution of the Southern Andean
temperate forest due to the presence of an ice shield that extended
from ,36uS to ,42uS. At maximum extent, this ice shield lowered
sea level by ,120 m, exposing coastal areas and connecting near
shore islands with the mainland. Glaciers likely covered all land
south of the Cordillera del Piuchen on Chiloe Island (Fig. 1;
[7,8,9]), but this ice shield could have presented small ice-free
‘‘islands’’, mainly in the coastal range, small Andean valleys, and
active volcanic zones. For example, both the Nuble region (,37uS)
and the Lonquimay Valley (,38uS) in the Chilean Andes were
likely covered by discontinuous ice shields [10,11,12], which may
explain present day patterns of genetic variation in several
organisms such as freshwater crabs and frogs [13,14]. Recent
studies have presented evidence for fragmented intra-ice shield
refugia and small populations of plants and poikilothermic
vertebrates that persisted through cyclic glaciations [13,14,15].
The phylogeographic consequences of these glacial phases would
include: (1) fragmentation and decrease in population effective
PLOS ONE | www.plosone.org 1 November 2012 | Volume 7 | Issue 11 | e48358

sizes of widely distributed species during phases of ice shield
spread, with this effect amplified towards higher latitudes, and (2)
evidence for subsequent postglacial range expansions, again with
stronger signatures at southern-most latitudes. A contrasting
pattern should also be evident in the presumably less affected
populations from Central Chile, mainly along the Pacific coast in
the Coastal Cordillera. Indeed, these areas are thought to have
been relatively stable [7,8,9,16] and therefore we should expect
stronger signals of demographic equilibrium with increasing
northern latitudes.
To date there is no strong evidence for intraglacial refugia
throughout the Andes for heterothermic species. During the LGM,
direct and periglacial effects may have been stronger for
poikilothermic than for homeothermic species because lower
temperatures would exclude the former from broad areas [17,18].
One group of terrestrial endemic heterothermic vertebrates that
fits this situation is the pool of lizard species of the genus Liolaemus.
This clade is endemic to temperate South America and includes
approximately 240 described species, of which 70 occur in Chile
[19]. One of the most conspicuous species of this genus is Liolaemus
pictus [20], a medium-sized viviparous lizard inhabiting Nothofagus
forests [21]. It is the southernmost West-Andean Liolaemus species
[22] and one of the few lizards adapted to live in cold, rainy
woodland habitats. Ecologically L. pictus ranges from sea level to
1600 m, along over 800 km. Its western distribution covers Chile
from the Region del Maule (,36uS) to the Region de Los Lagos
including some islands in the Chiloe archipelago (43uS) while its
eastern distribution covers part of the Northern Argentinean
Patagonia [23] (Fig. 1). This species shows extensive geographic
variation in color and six subspecies have been described,
including three mainland forms (Fig. 1), while three others are
on near shore islands [24]. Color based subspecies occur in
sympatry at some localities, suggesting the possibility of divergence
in isolation followed by dispersal and secondary contact
[25,26,27,28]. However, the fact that different color patterns are
representative of a polymorphic feature has not been ruled out.
Previous studies on some Liolaemus species have shown no
significant reduction of genetic variation, effective population size
(Ne) and distributional ranges in areas far from the LGM effects. In
contrast, southern populations and those near the Andes exposed
to direct and periglacial effects do show signatures of range
reductions and loss of genetic variation [28,29]. Vidal et al. [24]
suggested for L. pictus that during the LGM some mainland
localities could have acted as refugia. Remarkably, none of the
Liolaemus studies examined the timing of the inferred demographic
changes, either retractions or expansions, putatively associated to
the Quaternary glaciations. These scenarios may be further tested
by assessing the congruence between past stability areas inferred
by using ecological niche modeling [30,31,32] and the demo-
graphic inferences gathered from the assessment of genetic
variation and evolutionary relationships [31,33].
The objective of this study was therefore to assess the
phylogeographic structure of L. pictus, based on dense geographic
sampling, niche modeling, and genetic information from one
cytoplasmic and two nuclear loci, in order to test two hypotheses.
First, we predict a pattern of stronger influences of recent
glaciations (LGM), both in populations in the eastern (Andean)
and southern distribution of this species. If so, we should expect to
see signals of disequilibrium between mutation and genetic drift,
with a predominance of derived haplotypes in glaciated and
recolonized areas, evidence of reductions in effective population
size (Ne) during the LGM, and increases in Ne during glacial
retreat. In addition, we hypothesize that if the effects of the
glaciations in the Andes and within the large ice sheet limits were
strong, most of population migrations during a glacial retreats
would have been directional from the western refugia towards the
Andes. Because phylogeographic histories recovered from mtDNA
sequences alone might be discordant with nuclear gene histories
[34,35,36], we analyzed both in this study. The geographic
patterns of evolutionary relationships among populations, as well
as the distribution of genetic variation, were compared with the
past and present distributions of potential habitat for L. pictus. We
also tested the congruence between the inferred evolutionary
lineages and the patterns of genetic differentiation throughout
their distributions, and discussed these in the context of the
recognized subspecies of L. pictus.
Materials and Methods
Sample collectionWe analyzed 196 specimens of L. pictus collected at 46 localities
across the entire latitudinal range of the species, between 37u479
and 43u029 South (Table S1, Fig. 1). Specimens were collected
under authorizations SAG-1898 and SAG-4729 from Servicio
Agrıcola y Ganadero (SAG). All methods involving L. pictus were
carried out in accordance with a protocol reviewed and approved
by the Ethics Committee of the Fondo Nacional de Ciencia y
Tecnologıa (FONDECYT, Chile) and the Ethics Committee of
the Universidad de Concepcion (UDEC, Chile), as part of the
review process for the Fondecyt Research Grant 1090664.
Voucher specimens were catalogued in the Museo de Zoologıa
at Universidad de Concepcion (MZUC (UCCC), Chile). No
specimen was found in the Chilean ‘‘Longitudinal Valley’’, very
likely due to the almost complete replacement of Nothofagus forests
by non-native Pinus dominated agro-forestry systems, which has
probably eradicated L. pictus populations from this region [23]. As
such, our sampling consists mainly of localities in both the Andean
and the Coastal mountain ranges and includes the distributional
range of four of the six currently recognized subspecies [37]. We
lack samples of L. pictus codoceae and L. pictus talcanensis, whose status
has been questioned [24].
DNA sequence acquisitionOf the 196 mitochondrial sequences analyzed, 59 were retrieved
from Genbank (EU649356–EU649413, AY367791) and the other
137 were generated in this study. Total genomic DNA was
extracted from muscle tissue preserved in ethanol using the
Wizard SV Genomic DNA Purification kit (Promega). A fragment
of the mitochondrial cytochrome b (cyt-b) gene was amplified
using primers GluDGL (59-TGACTTGAARAACCAYCGTTG-
39), F1 (59-TGAGGACARATATCHTTYTGRGG-39) y cytb3
(59-GGCAAATAGGAARTATCATTC-39). PCR amplifications
of cyt-b were carried out as described in Victoriano et al. [28]. The
nuclear genes EXPH5 and LDB5B were amplified following
previously published procedures [38,39]. Negative controls were
used for all amplifications. Amplicons were purified using the
GenClean III kit (BIO 101, Inc) and later sequenced at Macrogen
Inc. (Korea). Sequences were edited with Codon Code Aligner 2.0
[40], and deposited in Genbank under accession numbers
JX494826-JX494964 (cyt-b) and JX999516-JX999585 (nuclear
genes). Nuclear LDB5B and EXPH5 alleles at heterozygous sites
were inferred with PHASE 2.1 [41,42,43]. We conducted ten
replicate PHASE runs using 1000 burn-in steps and 1000
iterations. The PHASE probability threshold was set to 0.60, a
level that has been suggested as optimal for reducing the number
of unresolved haplotypes with fewer false positives [44]. To test for
recombination, we used multiple tests implemented in RDP3 [45].
Phylogeography of Liolaemus pictus
PLOS ONE | www.plosone.org 2 November 2012 | Volume 7 | Issue 11 | e48358

Phylogeography of Liolaemus pictus
PLOS ONE | www.plosone.org 3 November 2012 | Volume 7 | Issue 11 | e48358

Genealogical analysesSequence alignments were performed with Clustal X [46] using
the default values for all alignment parameters. Mitochondrial
DNA sequences were translated to check for sequence function-
ality. For both nuclear and mitochondrial genes, the degree of
saturation of the matrix was assessed following the procedure
described in DAMBE 5.0.11 [47]. The test was done with 100
replicates using the proportion of invariant sites found by
jModeltest 0.1.1 [48].
The cyt-b gene tree was constructed with Bayes Phylogenies 1.1
[49], based on the best-fit model of sequence evolution estimated
with jModeltest 0.1.1 and the BIC criteria. The phylogenetic tree
was rooted, using as outgroup the combined haplotypes of
Liolaemus chilensis and Liolaemus cyanogaster, both closely related to
L. pictus [22]. Bayesian searches were run for 106106 generations
and sampled every 500 generations; the first 2000 trees were
discarded as burn-in, and a majority rule consensus tree of the
remaining sampled trees was constructed with Bayes Trees 1.0
[50]. Relationships among haplotypes were also explored with
statistical parsimony (SP), using TCS [51], with the inferred
network parsimony confidence limit of 95%. In order to polarize
haplotype states for the nuclear gene networks, we included alleles
of the closely related species of the same genus [22] L. lemniscatus
and L. chiliensis for LDB5B, and of L. lemniscatus and L. tenuis for
EXPH5. From the haplotype network we inferred the ancestral
haplotype according to the criteria of Templeton et al. [52].
Coalescent theory predicts that the haplotypes from the periphery
of a network are more recent in origin than the central haplotypes,
and we followed this prediction in our interpretations of the
nuclear haplotype networks in relation to the outgroup alleles. We
then used the ancestral-derived network position of the alleles
within their geographical context to test the prediction that
refugial areas should include a relatively high frequency of
ancestral haplotypes, following the methods of Miraldo et al. [36].
Genetic structure and demographic analysesFor the mtDNA dataset, population diversity estimates,
including nucleotide diversity (p), number of haplotypes (h),
haplotype diversity (Hd) and number of segregating sites (s), were
calculated using DnaSP 4.5 [53]. These indexes were not
estimated for the nuclear genes. Observed pairwise genetic
distances (uncorrected p-distance) for cyt-b sequences were
estimated for all samples and within and between clades using
MEGA 5 [54]. An analysis of molecular variance (AMOVA) was
performed using Arlequin 3.11 [55] by grouping the haplotypes by
localities and main clades. In addition, the neutrality test of Fu
[56] was applied to these clades as a way to assess their recent
demographic history. These tests were performed with DnaSP 4.5.
Analyses of mismatch distributions of pairwise haplotype compar-
isons and estimations of the raggedness index (Rgg) were achieved
with Arlequin 3.11. The raggedness index takes high values
(Rgg.0.05) when pairwise distributions are multimodal, which is
expected for samples gathered from stable populations, and low
values (Rgg,0.005) for unimodal distributions, a signal of recent
population expansion [57]. In addition, we estimated the
probability (p Ragg) of observing a higher estimated raggedness
value than the observed value under the hypothesis of population
expansion, as implemented in Arlequin 3.11.
For cyt-b, the spatial structure of the genetic variation was
assessed with a Bayesian approach using Geneland [58]; the goal
was to identify subgroups within the main clades, which later were
considered as separate demographic units for the analysis of
migration between populations. Geneland provides a Bayesian
probabilistic frequency distribution graph that indicates the most
likely number of populations and their geographic limits. We ran a
non-correlated spatial model for haploid information with three
independent chains run for 156106 generations, sampling every
250 generations. For complementarity purposes, spatial patterns of
genetic divergence between sampling areas across the range of L.
pictus were analyzed using two additional procedures. For the
mtDNA gene, we performed a genetic landscape shape interpo-
lation procedure using the program Alleles In Space [AIS; 59].
This method, based on Delaunay triangulations, produces a three-
dimensional graphical representation of genetic distance patterns
across the full landscape analyzed in a study. This approach allows
a better visualization of the heterogeneity of the genetic divergence
patterns across a landscape, and has proven useful in phylogeo-
graphic studies [60]. Genetic landscape shape interpolation
analyses were carried out using both ‘‘raw’’ genetic distances
and residual genetic distances as described in the AIS software
information. The residual genetic distances are derived from the
linear regression of all pairwise genetic distances on geographical
distances, allowing removal of the effect of geographical distance.
Isolation-by-distance (IBD) was also tested following the procedure
implemented in AIS.
Historical changes in Ne for each of the main clades were
evaluated using graphic reconstructions of population sizes
through time estimated with a lineage-through-time (LTT,
Bayesian skyline plot analysis) plot using BEAST 1.4.7 [61],
under a relaxed molecular clock. Runs consisted of 156106
generations with sampling every 1000, and the first 10% discarded
as a burn-in. Because the cyt-b rate of evolution for L. pictus was
unknown, it was estimated with BEAST 1.4.7 using a relaxed
molecular clock in a phylogenetic framework. In order to estimate
the age of the main nodes on the cyt-b tree and analyze the
association between the geographic distributions of the hap-
logroups and their ages, we conducted an analysis with a Yule
process of speciation using the software BEAST 1.4.7 [61]. To
place the mean priors in the tree we used two fossils from the
subgenus Eulaemus, both from Argentina. One fossil correspond to
18.5–20 Mya [62] while the second is a recent fossil associated
with the origin of Liolaemus multimaculatus 70,000 ya [63,64]. The
model used for this analysis was the TN93 with a relaxed
uncorrelated log normal clock selected with a likelihood value of
23981.282 using Bayes factor in Tracer 1.5 [65]. The length of
the chain was of 406106 steps, sampling parameters every 1000
steps and discarding the first 10% of them. We obtained a
substitution rate of 6.57%/million years, which was the same used
for the Bayesian skyline plot analysis.
The magnitude and spatial arrangement of gene flow was
assessed with the coalescence approach implemented in Migrate
3.27 [66], based on a Maximum Likelihood algorithm. These
analyses were based on the population clusters defined by
Geneland. Within each of the two main clades (see below) we
estimated directional gene flow between clusters and, when a
cluster included widely distributed localities, we further delimited
geographic areas in order to estimate directional gene flow
Figure 1. Sample sites (as detailed in Table S1), and subspecies distributions of L. pictus. Triangles and circles show the Northern andSouthern clades, respectively. Symbols sizes are proportional to sample sizes, and dashed line is the estimated limit of the ice shield during LGMaccording to Heusser [11].doi:10.1371/journal.pone.0048358.g001
Phylogeography of Liolaemus pictus
PLOS ONE | www.plosone.org 4 November 2012 | Volume 7 | Issue 11 | e48358

between physiographic regions (e.g. Coastal mainland vs. high-
Andes). We used the following base frequencies A = 0.3010,
C = 0.2742, G = 0.1361, T = 0.2887, and Ti/Tv = 15.1109, and
performed analyses with 10 short chains with sampling increasing
to 200 and 500 recorded genealogies, and one long chain with
sampling increment of 100 and 40,000 recorded genealogies. For
all runs the first 20,000 genealogies were discarded as burn-in. The
criterion of Gelman was used to verify that sampling was made
from the stationary distribution.
Ecological-niche modellingWe conducted an ecological niche modelling analysis in order to
identify potential refugia for L. pictus during the LGM and
determine if these predicted areas of past occurrence were
concordant with those inferred in the phylogeographic inferences.
Ecological niches and potential geographic distributions were
modeled using the maximum entropy method [67]. Climatic
envelopes were estimated from 19 environmental variables that
likely summarize niche dimensions that are particularly relevant to
determining species distributions [68]. For the LGM and present
climate conditions, we used two sets of monthly climate data
(precipitation and temperature). For current conditions (means
1950–2000), we used WorldClim, a global climate database with a
spatial resolution of 2.5 min [69], available at http://www.
worldclim.org. Maxent generates Ecological Niche Models
(ENM) using presence-only records, contrasting them with
pseudo-absence data sampled from the remainder of the study
area. The present-day ENM were developed based on the 123
confirmed occurrence points for L. pictus [23]. The bioclimatic
niche of the species was then projected on to past climate layers to
predict the potential range of the species during the LGM
(,21,000 ya). We used the default convergence threshold (1025)
and maximum number of iterations (500), using 25% of the
localities for model testing. As suggested by Waltari et al. [68], we
chose a presence threshold to render each projection into a binary
form, and considered grid cells with a cumulative probability of
more than 10 (from a range of 0–100) as suitable. This threshold
identified smaller areas than a lowest-presence threshold that
yielded zero omission error, thus resulting in a more restricted
picture of potential distribution.
The inputs of all the analyses were deposited at Dryad (http://
dx.doi.org/10.5061/dryad.853t3)
Results
Genealogical analysesWe obtained an alignment of 644 base pairs of the cyt-b gene
from 196 sequences gathered from specimens of L. pictus collected
at 46 localities. Results of the test of Xia & Xie [45], including the
outgroups, indicated a low degree of saturation. We found a total
of 130 haplotypes and 194 segregating sites. The genetic and
nucleotide diversity were Hd = 0.990760.0023 and
p = 0.057560.0018, respectively (Table 1). Pairwise genetic
distance between localities ranged from 0.00060.000 to
0.114060.013 (average 0.057560.0049). The zero values corre-
spond to comparisons between localities from the southernmost
mainland range close to the Andes (i.e. 28–29, 28–30, 29–30),
while the highest value corresponds to the comparison between
localities 8 (Salto El Indio, Malalcahuello, in the northern
distribution close to the Andes at 38u259S) and 16 (MN Alerce
Costero, Coastal range at 40u109S). A list of the haplotypes per
sampling site is given in Table S2. Of the 130 unique haplotypes
found, only 13 were shared among localities. Twenty of 46
localities included at least one shared haplotype. Twelve localities
presented a single shared haplotype and 2 sites shared 3
haplotypes. Most of the shared haplotypes were detected in the
central and southern range of the distribution of the species.
Phylogenetic reconstruction of the unique cyt-b sequences
recovered two well-supported reciprocally monophyletic clades of
L. pictus haplotypes corresponding to northern and southern
populations (Fig. 2). The northern phylogroup (clade N) was
composed of haplotypes from samples collected between 36u469S
and 38u269S in the Coastal Cordillera and the Andean Cordillera.
This clade was subdivided into two well-supported subclades: one
(N1) includes haplotypes from both the Andes and the Coastal
Cordillera and the second (N2) including haplotypes from two
localities near Puren in the Coastal Cordillera. Within the former,
haplotypes from subclade N1A were all from the region of Las
Trancas in the northern Andean Cordillera, which corresponds to
the distributional range of the subspecies L. pictus septentrionalis.
Subclade N1B was widely distributed, weakly resolved, and
included haplotypes from the Coastal Cordillera and the Andean
Cordillera (Fig. 2).
The southern phylogroup (Clade S) was composed of two
strongly differentiated groups (S1 and S2), the smallest of which
(S1) was strongly supported statistically and included only
haplotypes from a restricted area from the Chilean Coastal range
located at 41u309S. The larger clade (S2) was composed of two
subclades (S2A and S2B) having a moderate probabilistic support.
Subclade S2A was well supported and included haplotypes from
the Western Andes (e.g. Antillanca and Puyehue) from 39uS to
41uS. These localities are within the Chilean distributional range
of the subspecies L. pictus argentinus. The larger subclade (S2B) was
a weakly supported polytomy of five subclades. The smallest of
these, S2B1, was composed of one haplotype shared by individuals
from the Andean locality of Malalcahuello (Western Andes), an
area geographically very close to some localities harboring
haplotypes from the Northern clade. Subclade S2B2 included five
haplotypes with the longest branch lengths of the whole sample,
most of them from a small region of the Coastal range
corresponding to localities 16 (MN Alerce Costero) and 20 (Close
to Heicolla). The two subclades S2B3 and S2B4 were composed of
haplotypes broadly distributed between western Argentina, the
southern Chilean Andes and the Coastal range. Finally, subclade
S2B5 was well supported and composed exclusively of haplotypes
from Chiloe Island. Only two haplotypes collected at localities 40
and 41 in the north of the island were not in this clade; both were
part of clade S2B4. Thus, subclades S2B4 and S2B5 overlap on
northern Chiloe Island.
Table 1. Estimates of haplotype diversity (Hd), nucleotidediversity (p), Fu’s Fu test with associated levels of significance(*: ,0.05, **: .0.05), and raggedness index (Rgg) for the twomain phylogroups described by the Bayesian phylogeny.
Mainclades N s h Hd p Fs Rgg
NorthernClade
44 103/644 30 0.986 0.03243 23.442* 0.0013 **
SouthernClade
152 161/644 100 0.987 0.04042 23,987* 0.0019 **
Total 196 194/644 130 0.991 0.05750 ne ne
N: sample size, s: number of segregating sites, h: haplotype number, ne: nonestimated.doi:10.1371/journal.pone.0048358.t001
Phylogeography of Liolaemus pictus
PLOS ONE | www.plosone.org 5 November 2012 | Volume 7 | Issue 11 | e48358

The AMOVA showed that 55.5% of the total cyt-b variation
was explained by differences between the two main clades (Table
S3). The number of segregating sites and the haplotype richness
were lower in the Northern clade than in the Southern clade (103
vs 161 and 30 vs 100, respectively; Table 1), and the respective
values of haplotype richness standardized for sample sizes were
Figure 2. Cyt-b genealogy obtained in a Bayesian analysis. Branch colors as codes in the map of Fig. 1. Numbers on tips of branchescorrespond to haplotypes detailed in Table S2. Numbers in parentheses are localities, grey and black bars identify the two main clades, and coloredbars represent the subspecies of L. pictus.doi:10.1371/journal.pone.0048358.g002
Phylogeography of Liolaemus pictus
PLOS ONE | www.plosone.org 6 November 2012 | Volume 7 | Issue 11 | e48358
0.68 and 0.66. Haplotype diversity values (Hd) were very similar
between both clades, while nucleotide diversity was higher in the
Southern clade (Clade S p= 0.04042, Clade N p= 0.03243). The
average genetic distance between the Northern and Southern
clades was 0.09060.009.
In general, all pairwise p-distance values involving comparisons
between Northern and Southern clades are higher than values
from comparisons among the Southern subclades. In addition, the
among-Northern subclade values are higher than among-Southern
subclade values (Table S4).
Mean ages and 95% highest posterior density of mtDNA
phylogroups are shown in Table 2. Basal divergence within L.
pictus (N+S) is estimated to have started approximately 751,000 ya
(547,000–988,000) in the mid Pleistocene. Clade N is estimated to
have diverged approximately 523,000 ya (338,000–720,000), and
clade S about 580,000 ya (424,000–753,000), during the second
half of Pleistocene (Table 2).
The cyt-b haplotype networks are highly congruent with the
Bayesian genealogy. The Northern and Southern haploclades are
recovered as separate networks (Fig. 3), and the Northern
haplogroup includes haplotypes from Coastal and Andean regions
that are closely linked except for two subgroups of haplotypes that
appeared well differentiated. One of these includes samples from
the Andean region of Las Trancas and the second represents the
coastal region of Puren. The Southern haplogroup includes
samples from the Coastal Cordillera, the Andean Cordillera,
and Chiloe Island. Haplotypes from the Coastal and Andean
Cordilleras are mixed in this network, and while most haplotypes
from Chiloe Island form an exclusive group, two insular
haplotypes are associated with haplotypes from the mainland.
The root of the cyt-b network should be between the highly
divergent N and S clades, and this allowed us to infer the ancestral
haplotypes within each haplogroup (Fig. 3). The inferred ancestral
haplotypes from the mtDNA network showed the shortest branch
lengths and the smallest number of changes from the root in the
Bayes tree (Fig. 2).
Overall, from the 10 clades revealed in the cyt-b network, four
suggested ancestral haplotypes were from the Coastal range, five
from localities in the western Chilean Andes, and one from the
Eastern Argentinean Andes. Among the six Andean ancestral
haplotypes, two were distributed in areas outside of the LGM ice
shield boundaries, whereas the other four fell within this border.
For detailed distribution of ancestral haplotypes see Table S2.
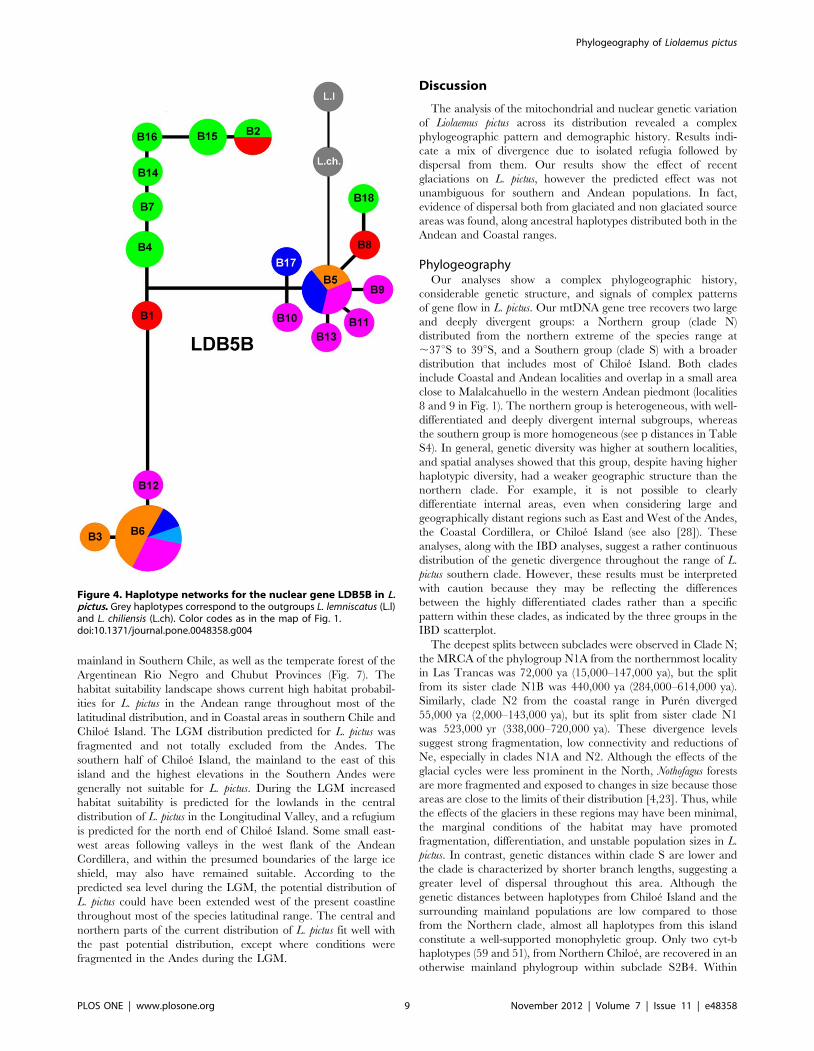
The nuclear gene networks (Fig. 4 and Fig. S1) were partially
congruent with the cyt-b network; 18 haplotypes were detected for
each gene. The LDB5B network (Fig. 4), was most congruent with
the mtDNA network and resolved three groups: one corresponded
exactly to the Northern clade of mtDNA haplotypes, and two
divergent clades were composed of haplotypes from localities that
were part of the Southern mtDNA clade. Although the LDB5B
alleles did not form reciprocally monophyletic geographic groups,
contrary to what observed on the cyt-b gene tree, there was a clear
tendency for the Northern haplotypes to form a single group. The
position of the outgroups in this network suggests that haplotype
B5, broadly distributed, is ancestral. The EXPH5 network did not
recover discrete clades, rather all haplotypes are organized in a
linear array of similar distances with Northern haplotypes at one
end (Fig. S1). The position of the outgroups in this network
suggests that haplotypes E5 and E6 from the Western Andes are
ancestral. In general terms, the samples of the Northern mtDNA
clade (clade N) tend to also form a unique cluster in both nuclear
gene networks, although they were not exclusive. The haplotypes
in both nuclear genes showed much less structure relative to the
mitochondrial network.
Demographic analysisAnalysis of the population genetic structure using the program
Geneland revealed the presence of four populations within the
mtDNA Clade N (named Northern clusters A–D in the Migrate
analyses) and three within Clade S (named Southern clusters A–C
in the Migrate analyses). The general distributions of these clusters
are detailed in the Table 3.
The analysis of isolation-by-distance revealed a high and highly
significant positive correlation between geographic and genetic
distances (r = 0.716, p,0.001). Despite the strong correlation for
the total pairwise comparisons, three clouds of spots could be
detected (Fig. 5). One of these clouds shows high genetic distances
both for geographically close and distant comparisons, and
included the between N-S comparisons. This pattern was
confirmed by the genetic landscape shape interpolation analyses
for which no strong discontinuity could be observed from South to
North (Fig. 5), although high atypical peaks were associated with
the Northern clade (N). This graphical representation shows more
genetic homogeneity among southern localities than among those
of the northern part of the range. Demographic analyses showed
signals of recent population expansions as expected for the
Southern group but also for the Northern group, and Fu’s
neutrality tests gave significant negative Fs values for both
(Table 1). Mismatch distribution analyses provided values of the
raggedness index for each group below 0.05 and with p values
higher than 0.05 (Table 1), indicating non-significant differences
between the expected unimodal distribution and the observed
distribution of pair-wise differences between haplotypes. Bayesian
skyline plot analyses showed a reduction of Ne in both the
Northern and the Southern group; although as expected,
oscillations are more pronounced for the latter (Fig. 6). The Ne
reduction in both clades started about 50,000–60,000 ya, and the
lowest Ne values were estimated around 16,000–17,000 ya. The
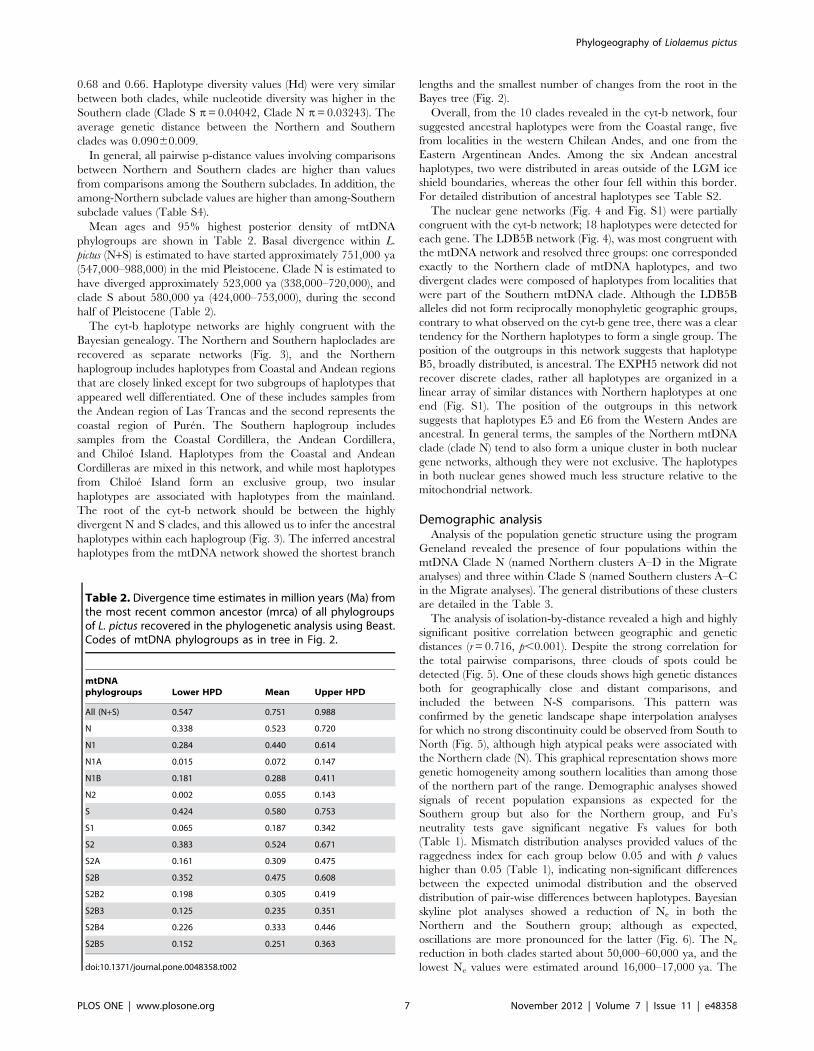
Table 2. Divergence time estimates in million years (Ma) fromthe most recent common ancestor (mrca) of all phylogroupsof L. pictus recovered in the phylogenetic analysis using Beast.Codes of mtDNA phylogroups as in tree in Fig. 2.
mtDNAphylogroups Lower HPD Mean Upper HPD
All (N+S) 0.547 0.751 0.988
N 0.338 0.523 0.720
N1 0.284 0.440 0.614
N1A 0.015 0.072 0.147
N1B 0.181 0.288 0.411
N2 0.002 0.055 0.143
S 0.424 0.580 0.753
S1 0.065 0.187 0.342
S2 0.383 0.524 0.671
S2A 0.161 0.309 0.475
S2B 0.352 0.475 0.608
S2B2 0.198 0.305 0.419
S2B3 0.125 0.235 0.351
S2B4 0.226 0.333 0.446
S2B5 0.152 0.251 0.363
doi:10.1371/journal.pone.0048358.t002
Phylogeography of Liolaemus pictus
PLOS ONE | www.plosone.org 7 November 2012 | Volume 7 | Issue 11 | e48358

Southern group showed a greater magnitude in both reduction
and recovery of population size, although both groups show rapid
and pronounced recoveries of Ne with no signal of a slow down in
this trend in the Southern group.
The assessment of gene flow among the groups within each
clade revealed a mixed pattern (Table 3). In the clade N, there is
greater evidence of historical gene flow from Andean to Coastal
populations. For the Southern clade, the highest level of gene flow
is estimated from cluster C towards cluster B (Nm = 6.313), with
both clusters composed of populations from Coastal mainland and
Andean localities. Globally, for all 15 comparisons the estimates of
gene flow could be considered as non-zero values. Among these
comparisons, five revealed predominant gene flow from Andean
localities lying within the LGM ice shield boundaries towards
Coastal localities, but as predicted we find a clearly higher value of
gene flow from Coastal to Andean populations only for the
Southern cluster A.
Ecological niche modellingEcological niche modeling predicts several fragmented refugia
for L. pictus, including at both lowlands and Andean valleys. The
Maxent model predicts a current distribution close to the one
known for L. pictus, from the Andes of the Maule Region in
Central Chile (ca. 36uS) to the Chiloe Archipelago and nearby
Figure 3. Cyt-b haplotype network for L. pictus. Colors are the same as in Fig. 1, probable ancestral haplotypes for each haplogroup are labeledwith asterisks, and numbers on the lines correspond to mutation steps.doi:10.1371/journal.pone.0048358.g003
Phylogeography of Liolaemus pictus
PLOS ONE | www.plosone.org 8 November 2012 | Volume 7 | Issue 11 | e48358
mainland in Southern Chile, as well as the temperate forest of the
Argentinean Rio Negro and Chubut Provinces (Fig. 7). The
habitat suitability landscape shows current high habitat probabil-
ities for L. pictus in the Andean range throughout most of the
latitudinal distribution, and in Coastal areas in southern Chile and
Chiloe Island. The LGM distribution predicted for L. pictus was
fragmented and not totally excluded from the Andes. The
southern half of Chiloe Island, the mainland to the east of this
island and the highest elevations in the Southern Andes were
generally not suitable for L. pictus. During the LGM increased
habitat suitability is predicted for the lowlands in the central
distribution of L. pictus in the Longitudinal Valley, and a refugium
is predicted for the north end of Chiloe Island. Some small east-
west areas following valleys in the west flank of the Andean
Cordillera, and within the presumed boundaries of the large ice
shield, may also have remained suitable. According to the
predicted sea level during the LGM, the potential distribution of
L. pictus could have been extended west of the present coastline
throughout most of the species latitudinal range. The central and
northern parts of the current distribution of L. pictus fit well with
the past potential distribution, except where conditions were
fragmented in the Andes during the LGM.
Discussion
The analysis of the mitochondrial and nuclear genetic variation
of Liolaemus pictus across its distribution revealed a complex
phylogeographic pattern and demographic history. Results indi-
cate a mix of divergence due to isolated refugia followed by
dispersal from them. Our results show the effect of recent
glaciations on L. pictus, however the predicted effect was not
unambiguous for southern and Andean populations. In fact,
evidence of dispersal both from glaciated and non glaciated source
areas was found, along ancestral haplotypes distributed both in the
Andean and Coastal ranges.
PhylogeographyOur analyses show a complex phylogeographic history,
considerable genetic structure, and signals of complex patterns
of gene flow in L. pictus. Our mtDNA gene tree recovers two large
and deeply divergent groups: a Northern group (clade N)
distributed from the northern extreme of the species range at
,37uS to 39uS, and a Southern group (clade S) with a broader
distribution that includes most of Chiloe Island. Both clades
include Coastal and Andean localities and overlap in a small area
close to Malalcahuello in the western Andean piedmont (localities
8 and 9 in Fig. 1). The northern group is heterogeneous, with well-
differentiated and deeply divergent internal subgroups, whereas
the southern group is more homogeneous (see p distances in Table
S4). In general, genetic diversity was higher at southern localities,
and spatial analyses showed that this group, despite having higher
haplotypic diversity, had a weaker geographic structure than the
northern clade. For example, it is not possible to clearly
differentiate internal areas, even when considering large and
geographically distant regions such as East and West of the Andes,
the Coastal Cordillera, or Chiloe Island (see also [28]). These
analyses, along with the IBD analyses, suggest a rather continuous
distribution of the genetic divergence throughout the range of L.
pictus southern clade. However, these results must be interpreted
with caution because they may be reflecting the differences
between the highly differentiated clades rather than a specific
pattern within these clades, as indicated by the three groups in the
IBD scatterplot.
The deepest splits between subclades were observed in Clade N;
the MRCA of the phylogroup N1A from the northernmost locality
in Las Trancas was 72,000 ya (15,000–147,000 ya), but the split
from its sister clade N1B was 440,000 ya (284,000–614,000 ya).
Similarly, clade N2 from the coastal range in Puren diverged
55,000 ya (2,000–143,000 ya), but its split from sister clade N1
was 523,000 yr (338,000–720,000 ya). These divergence levels
suggest strong fragmentation, low connectivity and reductions of
Ne, especially in clades N1A and N2. Although the effects of the
glacial cycles were less prominent in the North, Nothofagus forests
are more fragmented and exposed to changes in size because those
areas are close to the limits of their distribution [4,23]. Thus, while
the effects of the glaciers in these regions may have been minimal,
the marginal conditions of the habitat may have promoted
fragmentation, differentiation, and unstable population sizes in L.
pictus. In contrast, genetic distances within clade S are lower and
the clade is characterized by shorter branch lengths, suggesting a
greater level of dispersal throughout this area. Although the
genetic distances between haplotypes from Chiloe Island and the
surrounding mainland populations are low compared to those
from the Northern clade, almost all haplotypes from this island
constitute a well-supported monophyletic group. Only two cyt-b
haplotypes (59 and 51), from Northern Chiloe, are recovered in an
otherwise mainland phylogroup within subclade S2B4. Within
Figure 4. Haplotype networks for the nuclear gene LDB5B in L.pictus. Grey haplotypes correspond to the outgroups L. lemniscatus (L.l)and L. chiliensis (L.ch). Color codes as in the map of Fig. 1.doi:10.1371/journal.pone.0048358.g004
Phylogeography of Liolaemus pictus
PLOS ONE | www.plosone.org 9 November 2012 | Volume 7 | Issue 11 | e48358

S2B4, other closely related haplotypes are from Argentina
(Alumine and Bariloche), and from both Coastal and Andean
Chilean regions in southern Chile. Some of these haplotypes are
shared by more than one locality and with a broad distribution
(e.g. 46, 47, 69 and 74), which suggests an historical connection
between populations from the east and west of the Andes and
Chiloe Island. Our results disagree with Vidal et al. [24], because
they do not infer immigration from the mainland to Chiloe Island,
rather several of our Nm values suggest bidirectional gene flow
(Table 3). The age of the mainland clades, which include
haplotypes from Chiloe Island, implies that gene flow to and
from the island must have occurred prior to the LGM. Clade
S2B4, which includes the two Chiloe Island haplotypes, is
333,000 yr old, and the divergence times for these two haplotypes
are approximately 80,000 to 100,000 ya (estimation not shown).
This suggests that immigration from the continent occurred prior
to the LGM, in response to the formation of land bridges linking
the island with the mainland during previous glacial periods.
However, the extent of migration is not consistent with the
scenario of falling sea level during the repeated glacial cycles that
have connected the northern part of the island of Chiloe during
the Quaternary [70], and which have resulted in a land bridge
between the northern end of the island and the continent (Chacao
Channel). In fact, several authors have proposed the existence of
recurrent bridges between Chiloe Island and the continent
associated with a drop in global sea level during glacial periods
[71,72,73,74,75]. Although such recurrent events should facilitate
the migration of organisms, L. pictus dispersal could have been
limited by the extensive ice cover during the LGM, especially on
the east side of the island. Retreat of this ice shield may have also
produced abundant meltwater, and such geologically recent
fluvioglacial barriers may have prevented island-mainland gene
flow. Therefore, this process would have contributed to reduce the
connectivity between Chiloe Island and the continent for L. pictus
rather than to increase it. This highlights the importance of
considering the temporal dynamics throughout each glacial cycle if
one wants to understand the effects of the glaciations on gene flow.
In addition, connectivity between Chiloe Island and the
continent could have been limited because the exposed continental
shelf may not have been colonized by a continuous Nothofagus
forest, due to different physical and chemical properties of the soils
which were impacted by marine sediments for a long time.
Although L. pictus inhabits the borders of Nothofagus forests, it needs
high density, high connectivity, and large size patches of arboreal
Table 3. Results of H and migration rate between clusters of population of L. pictus. Clusters correspond to the same alreadydefined by Geneland.
Gene flow (Nm)
Northern Clade clusters r N h A B C D
Coastal-Andean r (A) 22 0.0235 - 2.103 1.81E-09 1.58E-11
Andean r (B) 5 0.0069 6.46E-13 - 6.46E-13 6.46E-13
Coastal-Andean r (C) 13 0.0124 1.092 7.51E-10 - 1.67E-10
Andean r (D) 4 0.0044 0.119 1.78E-12 1.78E-12 -
Cluster North A N h a b
Coastal mainland r (a) 2 0.0026 - 0.4915
Andean r (b) 20 0.0136 3.02E-03 -
Cluster North C N h a b
Coastal mainland r (a) 2 0.0030 - 0.0996
Andean r (b) 10 0.0093 3.26E-07 -
Southern Clade clusters r N h A B C
Chiloe- Coastal mainland-Andean r (A) 120 0.1374 - 1.403 1.167
Coastal mainland-Andean r (B) 22 0.0560 4.73E-09 - 6.313
Coastal mainland r (C) 11 0.0350 1.807 1.10E-07 -
Cluster South A (comparison 1) N h a b
Coastal mainland r (a) 23 0.0665 - 2.99E-03
Andean r (b) 46 0.0215 16.754 -
Cluster South A (comparison 2) N h a b
Chiloe Island r (a) 50 0.0408 - 11.636
Coastal mainland-Andean r (b) 69 0.0706 3.45E-09 -
Cluster South A (comparison 3) N h a b
Chiloe Island r (a) 50 0.0480 - 2.29E-03
Andean r (b) 46 0.0223 15.881 -
Cluster South B N h a b c
West Andes r (a) 44 0.0116 - 0.9011 0.9593
East Andes r (b) 10 0.0140 7.17E-13 - 2.72E-12
Coastal mainland r (c) 25 0.0260 1.00E-12 1.1936 -
H= 2Nem. N = number of individuals in each sample. Migration rate values are in Nm. r = receiving population.doi:10.1371/journal.pone.0048358.t003
Phylogeography of Liolaemus pictus
PLOS ONE | www.plosone.org 10 November 2012 | Volume 7 | Issue 11 | e48358

vegetation [20,76]. Nunez et al. [14] studied the frog Eupsophus
calcaratus, a species also associated to the temperate Nothofagus
forest, and recovered a monophyletic group for the haplotypes
from Chiloe Island which was the sister clade of samples from
Alerce Andino in the continent (our localities 25 and 26),
suggesting historical dispersal between both areas. For larger
vertebrates such as the southern deer Pudu pudu, there is evidence
for high divergence, low gene flow and reciprocal monophyly
between Chiloe Island and the mainland [77]. The split for both
deer clades was estimated to approximately 437,000 ya, which is
similar to our estimate for L. pictus (divergence time from MRCA
of clade S2B, 475,000 ya). Independent of the presence of small or
medium sized fluvial barriers during glacial periods, this species
should have been able to move between the island and the
continent if the forest had colonized continuous formations over
the exposed shelf, thereby erasing the pattern of reciprocal
monophyly detected in our study. For Chiloe Island, we found no
evidence for recent or post-LGM migration from the northwestern
non-glaciated area to the south of the ‘‘Chiloe ice diagonal’’
(Fig. 1), suggesting that vagility for L. pictus may have been low.
Similarly, there is no evidence of shared haplotypes between these
two areas in the frog Eupsophus calcaratus [14].
For samples from clade S, recent gene flow is inferred from the
occurrence of shared haplotypes among several localities, all of
which include Southern clade and Andean sites within the
maximum limits of the LGM ice sheet. Some haplotypes are
shared among nearby localities, including sites 36–40 from
northwestern Chiloe Island. Antillanca (site 34) and Puyehue (site
22) share three haplotypes in the Western Andes. However, we
found evidence for recent gene flow between localities more than
100 km apart, such as between Rıo Puelo and Bariloche (sites 27
and 35 respectively), Huerquehue and Los Llolles (11 and 17), and
Chaiten and Canal Garrado (28–30). The last example suggests a
more recent connection between mainland localities surrounding
Chiloe Island than between this island and the continent. Prior
evidence for post-LGM dispersal in the glaciated Andes has been
found in other species like the freshwater crab Aegla alacalufi [13],
the freshwater fish Galaxias maculatus [78], and the tree Araucaria
araucana [79]. For G. maculatus and A. araucana, re-colonization
occurred from Eastern Andean refugia [78,79].
Despite the exhaustive sampling effort over the entire range of
L. pictus [23], no specimen was found in the Longitudinal Valley.
The complete loss of native forest, especially of trees of the genus
Nothofagus [80], has eliminated suitable habitat for L. pictus in the
BioBıo and Araucanıa regions and almost certainly led to the
extinction of L. pictus populations in these regions [81,82]. Given
the substitution rate of the mitochondrial gene employed in our
study, the time passed since these extinctions was probably
insufficient to detect a significant effect on population structure
[83].
Co-distribution of haplotypes from highly divergent clades
suggests older migration between different areas. For example,
sites 23 and 24 from the Estaquillas area (close to the mainland
coast in southern Chile) included S1 haplotypes which are
endemic to that area, and haplotypes from the broadly distributed
clade S2B4. Similarly, sites 40 and 41 along the northern margin
Figure 5. Genetic landscape shape (GLS) interpolation analysis and Isolation by Distance analysis, for L. pictus. GLS was made by usinga 50650 grid and a raw genetic distance. X and Y axes correspond to geographic locations within the overall physical landscape examined in thisstudy (Fig. 1). Surface plot heights reflect genetic distances.doi:10.1371/journal.pone.0048358.g005
Phylogeography of Liolaemus pictus
PLOS ONE | www.plosone.org 11 November 2012 | Volume 7 | Issue 11 | e48358

of Chiloe Island included haplotypes from the same clade S2B4
and from clade S2B5, which includes only haplotypes endemic to
the island. If the secondary contact hypothesis is valid, and
excluding the explanation of ancestral polymorphism due to
incomplete lineage sorting, populations would have dispersed over
long distances after an old lineage diversification. Evidence for
multiclade presence was obtained previously by Vidal et al. for the
localities of Las Cascadas and Los Muermos, close to Estaquillas
[24].
Several clades in the South of the mainland predate the LGM
and show a restricted distribution, suggesting a ‘‘relict population’’
with low rates of expansion. For example, clades S1 and S2B2,
which are 187,000 and 305,000 ya respectively, are restricted to a
small region of the southern coast. Clade S2A, which diverged
approximately 300,000 ya, has a broader distribution but is
restricted to the Western Andes, suggesting that some L. pictus
phylogroups persisted within the limits of the LGM ice shield.
Other clades include haplotypes from both Andean and coastal
regions (S2B3 and S2B4). However, each of these clades harbors
two subclades that are reciprocally monophyletic, with one each in
the Andes and the Coastal range. Gene flow estimates between
these areas suggest an exchange of individuals between the coast
and the Andes predating the LGM. Pleistocene glaciations that
occurred in southern South America are well documented [84,85],
and according to the dates of these events, both the origin and
diversification of the main clades of L. pictus should be associated
Figure 6. Prediction of the historical effective population size in L. pictus. Bayesian skyline plots and mismatch analysis for the two majormtDNA clades of L. pictus. The black line is the temporal trend of the mean of effective population size. Vertical light blue band corresponds to theLGM.doi:10.1371/journal.pone.0048358.g006
Phylogeography of Liolaemus pictus
PLOS ONE | www.plosone.org 12 November 2012 | Volume 7 | Issue 11 | e48358

with the coldest Pleistocene glaciations approximately 700,000 ya
and the last southern Patagonia glaciations 180,000 ya. Liolaemus
pictus is one of the youngest species within the genus, and our
molecular divergence estimates (Vera and colleagues, unpublished
data) suggest that most of the species, both in the ‘‘Chilean group’’
and in species of the subgenus Eulaemus in Argentina [86], are
older than L. pictus.
Although the levels of spatial structure were deeper for the
mitochondrial than for both nuclear genes, the spatial trends of the
genealogical relationships were similar among them and not in
total conflict. The general mitochondrial pattern was strongly
suggested by both nuclear genes, but the southern range showed a
mixed distribution of related nuclear haplotypes and incomplete
lineage sorting. Nevertheless, both nuclear genes suggest differen-
tiation between the Northern and the Southern groups, thus
corroborating the mtDNA gene tree showing the oldest split
between lineages at approximately 39uS, and a more recent
weaker structure among the southern populations. These kinds of
differences between the patterns of nuclear and mitochondrial
differentiation are expected given the larger Ne and longer sorting
time to reach monophyly for the nuclear loci [87,88].
Historical demographyOur demographic analyses of L. pictus corroborate the
hypothesis of population size decreases during Pleistocene
glaciations [89], but these reductions started prior to the LGM,
about 50,000–60,000 ya, shortly after the onset of the Llanquihue
Glaciation approximately 70,000 ya. This decrease began at about
the same time in both the Northern and Southern clades, but the
magnitude of this fluctuation was larger in the southern
populations. These results are concordant with the changes of
distributional range inferred from niche modelling, and the
discordance between past and present distributions is larger for
southern than for northern areas. In turn this fact predicts the
occurrence of larger areas for historical population expansion in
the South, which fits with the observed spatial pattern of shared
haplotypes among distant localities, the presence of secondary
contact zones, and greater incomplete lineage sorting in nuclear
genes in the southern portion of the L. pictus distribution. The
more extensive ice sheets in the South produced extensive
exclusion zones for animal and plant populations [90], and
subsequent retreat of the glaciers with warming temperatures
(,17,000 ya) provided more favorable conditions for re-coloniza-
tion by many species [91]. These improved conditions are
reflected in the genetic signatures of both clades of L. pictus by
rapid population growth after the ice sheet melted, but with much
greater expansion in the southern group. This population
expansion was likely associated with the rapid colonization of
Nothofagus forests from southern refugia during the same period [9].
Conversely, the higher genetic structure observed for L. pictus in
Figure 7. Present and LGM potential distribution for L. pictus estimated from Ecological Niche Modeling (ENM). The color scalecorresponds to the probability for suitable habitat; red and light blue indicate highest and lowest suitability values respectively. The heavy blue linedelimits the maximum extension of ice shield during LGM according to Heusser [11].doi:10.1371/journal.pone.0048358.g007
Phylogeography of Liolaemus pictus
PLOS ONE | www.plosone.org 13 November 2012 | Volume 7 | Issue 11 | e48358

the northern part of its distribution is most parsimoniously
explained by local population reductions followed by modest
post-LGM population expansion with limited dispersal, as found
previously in another lizard species [92].
Pleistocene refugiaAlthough research is beginning to characterize LGM refugia in
southern South America [93,94], little is known compared to the
Northern Hemisphere [15,95,96,97,98,99]. Our results suggest
that more than the two classical putative refugia (i.e. one Coastal
and one Esat Andean), sustained populations of L. pictus. This is
supported by several lines of evidence, including the presence of
private haplotypes within glacial limits, several clades older than
the LGM and distributed throughout the Andes, and high genetic
diversity for many populations across the species distribution. On
the other hand, the presence of probable ancestral haplotypes
within LGM limits and signals of gene flow from the Andes to
neighboring areas suggest the past occurrence of multiple source
populations within the boundaries of the LGM ice shield.
Considering the glacial history of the study area, our data suggests
that during recurring glacial phases, and in addition to the Pacific
Coastal refugia, L. pictus likely persisted in multiple Andean
refugia, where genetic variation has accumulated and from where
populations expanded during interglacial periods [100,101]. This
scenario is corroborated by ENM projections of potential past
distributions of L. pictus, which indicate that during the LGM
appropriate habitat persisted in the Andes. In general terms, ENM
predicts the occurrence of refugia on Chiloe Island, in the central
valley, adjacent Pacific coast, and several isolated valleys within
the Andes. As such, many populations of L. pictus could have
persisted in these areas, as isolated pockets within the presumed
boundaries of the LGM ice shield. Similarly, this same scenario
has also likely occurred during older glaciations.
Independent evidence corroborates the occurrence of ice free
areas during the LGM within the Andes, specifically the Nuble
glacial gap (36u309S) and the Malalcahuello Valley which might
have acted as refugial areas [11,102]. Evidence for within LGM
ice shield refugia has been published for other groups. For
example Xu et al. [13] proposed a refugium in the Andean locality
of Termas del Amarillo (,43uS) for the freshwater crab Aegla
alacalufi. Similarly, Nunez et al. [14] found evidence for two intra-
LGM refugia in the frog Eupsophus calcaratus. Liolaemus pictus
haplotypes collected from the Malalcahuello area (sites 8, 9) were
highly divergent and fell in both Southern and Northern clades,
Malalcahuello being the area where both groups overlapped. The
same pattern was found in the mouse Abrothrix longipilis; in this case
highly divergent haplotypes co-occur in the area of Malalcahuello
(D’Elıa and colleagues, unpublished data). In addition, Ruiz et al.
[103] suggested that Malalcahuello was a refugial area for the
large ‘‘monkey tail’’ tree Araucaria araucana. Future research will
clarify the roles of Malalcahuello and Nuble either as refugia for L.
pictus or as areas of secondary contact of variants that differentiated
elsewhere. We note that the repetition of the pattern for unrelated
taxa seems to suggest that the region was probably a refugium.
The estimated ages for most clades suggest that their origins
predate the LGM, therefore the most probable explanation for the
observed distribution of the Andean clades S2A, S2B3 and S2B4
would be the long-term persistence of several refugia within the
limits of the LGM, as suggested by the ENM. An alternative
explanation would be that during the LGM, populations were
driven into the Longitudinal Valley and later recolonized the
Andean Cordillera and coastal areas. However, the latter scenario
predicts less geographic structure within each clade. Some clades,
such as S2B3 and S2B4, include haplotypes from both cordilleras
(Coastal and Andes), but haplotypes from each cordillera tend to
form reciprocally monophyletic groups within each of these clades.
Additional evidence for our interpretation of persistent refugia
within the LGM ice sheet comes from the geographic provenance
of the inferred ancestral haplotypes of some haplogroups. Six of
the 10 haplogroups in the cyt-b network were Andean in
distribution and occurred in areas within the LGM ice sheet,
which suggests that these phylogroups likely originated in these
areas prior to the LGM. Additionally, the frequency with which
Andean populations acted as sources and Coastal populations as
sinks for gene flow is striking, and such patterns can only be
explained by the occurrence of multiple Andean refugia during the
LGM. Our estimates suggest several cases of gene flow from the
Andes to non Andean areas. For clades S2B3 and S2B4, the
predominant migration pattern was from the eastern (Argentinean
localities in the Andes, within the ice shield boundaries) to the
Chilean coastal mainland. According to these results, it is very
likely that eastern Andean populations were a source of variants
for Pacific coastal sink populations at similar latitudes. The recent
review of Sersic et al. [98] based on lizard, small mammal, and
plant species that share part of their ranges with L. pictus, suggests
three kinds of refugia in southern South America, all outside the
LGM ice shield boundary: 1) a northern area in the central valley,
2) a Pacific Coastal area including Chiloe Island, and 3) the
eastern Andes outside the LGM. Palynological and genetic studies
suggest that the eastern Andean refugia, at the latitude proposed in
our study (37uS–44uS), would have been delimited by Andean
glaciers to the West and the Argentinean steppe towards the East
[104,105,106]. Overall, our results agree with these proposals.
However, in addition to these previous proposals of refugia, we
hypothesize the occurrence of refugia both in the western and
eastern Andes and within the limits of the large LGM ice-shield
boundary. These fragmented refugia would have been distributed
from the northern extreme of the distribution of L. pictus south to
approximately 41uS, and are characterized by unexpectedly high
genetic endemism and diversity.
In agreement with similar findings from other taxa, these results
constitute the first evidence for the intraglacial persistence of
multiple lizard populations during the LGM. The proposal of a
more complex scenario of several isolated refugia is further
supported, and should replace the over-simplified scenario of a
continuous LGM ice shield in the southern South America Andes.
Future studies based on other co-distributed species are needed to
test the proposed scenario.
Taxonomic implicationsOur phylogeographic patterns do not corroborate the current
taxonomic arrangement within L. pictus, in particular in relation to
most of the recognized subspecies [76]. The haplotypes gathered
from specimens previously identified on the basis of their
geographic origin as L. pictus argentinus were recovered in three
well-supported clades. Our extensive sampling shows that haplo-
types from specimens collected within the distributional range of L.
pictus chiloensis fail to form a monophyletic group; two haplotypes
belong to an otherwise mainland clade, but most of the individuals
from most of Chiloe Island were recovered in a well supported
clade, which should be considered as a different evolutionary unit.
Remarkably, Chiloean specimens are morphologically distinct
from those collected on the mainland. The nature of the
incongruence between the mitochondrial and morphological
patterns of geographic variation is for the moment unknown
[37], and we have no clear evidence to support the existence of
any of the previously proposed southern subspecies of L. pictus.
However, the deep divergence (ca. 11%) between the Northern
Phylogeography of Liolaemus pictus
PLOS ONE | www.plosone.org 14 November 2012 | Volume 7 | Issue 11 | e48358

and the Southern clades suggest differences that should be
recognized at the species level. The analysis of unlinked loci and
morphological characters is necessary to test the mitochondrial
based hypothesis [107], given that gene trees do not always
correctly track species trees [108]. Although nuclear loci do not
recover reciprocally monophyletic Northern and Southern groups,
they tend to do so. Given that expected coalescent times are larger
for nuclear loci [109], this is not an unexpected pattern. Our
preliminary observations suggest considerable morphological
differences, especially related to color patterns, and these seem
to be concordant with the distributions of the two main clades. If
correct, the Northern clade should be elevated to the species level
with the name Liolaemus septentrionalis, and the name L. pictus should
be restricted to the Southern group.
Supporting Information
Table S1 Collection localities for Liolaemus pictus,sample sizes (N) and subspecies to which are allocated.Localities were grouped into four geographic zones (West Andes
Cordillera: WAC; East Andes Cordillera: EAC; Coastal Cordil-
lera: CC; and Insular Chiloe: IC, as well as into two genealogical
based groups (South and North).
(DOC)
Table S2 Haplotypes composition for each sample sitefor the mitochondrial region cyt-b and the nuclear genesLDB5B and EXPH5 in Liolaemus pictus. Bold numbers are
haplotypes distributed in more than one locality. Geographic
coordinates and relative distribution of each locality are detailed in
Table S1 and Fig. 1.
(DOC)
Table S3 Analysis of molecular variance (AMOVA), forthe two main haplogroups in Liolaemus pictus. Each
group in the AMOVA corresponds to the deepest splited clades,
called northern and southern. Northern phylogroup is distributed
from the northern extreme to approximately 37uS, and the
Southern phylogroup is from this latitude up the southern extreme
of the distribution of L. pictus.
(DOC)
Table S4 Estimates of evolutionary divergence (p-distance bellow the diagonal), over sequence pairsbetween phylogroups (clades) in Liolaemus pictus.Greyscale according to evolutionary divergence values. Values
on the diagonal are intra clades p-distances. Standard error
estimates are shown above the diagonal. Phylogroups codes as in
Fig. 2.
(DOC)
Figure S1 Haplotype networks for the nuclear geneEXPH5 in L. pictus. Grey haplotypes correspond to the
outgroups L. lemniscatus (L.l), and L. tenuis (L. t). Color codes as in
the map of Fig. 1.
(TIF)
Acknowledgments
Tania Coronado, Paulo Donoso, Andrea Iturrıa, Alfonso Jara, Amado
Perez-Leiva, Marıa Jose Sandoval, Gisela Stotz, Juan Carlos Ortiz and
Marcela Vidal provided essential assistance during field work. Specimens
were collected under authorizations SAG 1898 and SAG 4729 (Servicio
Agrıcola y Ganadero).
Author Contributions
Conceived and designed the experiments: IVE PFV. Performed the
experiments: IVE CMM. Analyzed the data: IVE CMM FMF NG.
Contributed reagents/materials/analysis tools: PFV JWS. Wrote the
paper: IVE PFV GD.
References
1. Gregory-Wodzicki KM (2000) Andean paleoelevation estimates: A review and
critique. Geol Soc Am Bull 112: 1091–1105.
2. Kaiser J, Lamy F, Hebbeln D (2005) A 70-kyr sea surface temperature record
off southern Chile (Ocean Drilling Program Site 1233). Paleoceanography 20:
1–15.
3. Cabrera AL, Willink A (1980) Biogeografıa de America Latina. Washington,
District of Columbia: Organizacion de Estados Americanos. VI 120 p.
4. Villagran C, Hinojosa LF (2005) Esquema biogeografico de Chile. In: Llorente-
Bousquets J, Morrone JJ, editors. Regionalizacion Biogeografica en Iberoa-
merıca y topicos afines. Mexico: Ediciones de la Universidad Nacional
Autonoma de Mexico, Jimenez Editores. pp. 577.
5. Russell G, Bowers W, Keesing V, Niemeyer H, Sevenet T, et al. (2000) Patterns
of bioactivity and herbivory on Nothofagus species from Chile and New Zeland.
J Chem Ecol 2 6: 4 1–5 6.
6. Hulton NRJ, Purves RS, McCulloch RD, Sugden DE, Bentley MJ (2002) The
Last Glacial Maximum and deglaciation in southern South America.
Quaternary Sci Rev 21: 233–241.
7. Villagran C (1991) Historia de los bosques templados del sur de Chile durante
el Tardiglacial y Postglacial. Rev Chil Hist Nat 64: 447–460.
8. Villagran C, Moreno P, Villa R (1995) Antecedentes palinologicos acerca de la
historia cuaternaria de los bosques chilenos. In: Armesto JJ, editor. Ecologıa de
los bosques nativos de Chile. Santiago, Chile: Editorial Universitaria. pp. 51–
70.
9. Markgraf V, McGlone M, Hope G (1995) Neogene paleoenvironmental and
paleoclimatic change in southern temperate ecosystems – a southern
perspective. Trends Ecol Evol 10:143–147.
10. Amigo J, Ramırez C (1998) A bioclimatic classification of Chile: woodland
communities in the temperate zone. Plant Ecol 136: 9–26.
11. Heusser CJ (2003) Ice age southern Andes: A cronichle of paleoecological
events. Developments Quater Sci, 3. Elsevier Press. 238 p.
12. Smith-Ramırez C (2004) The Chilean coastal range: a vanishing center of
biodiversity and endemism in South American temperate rainforests. Biodiver
Conserv 13: 373–393.
13. Xu J, Perez-Losada M, Jara C, Crandall K (2009) Pleistocene refugia leaves
deep signature on the freshwater crab Aegla alacalufi in Chilean Patagonia.
Mol Ecol 18, 904–918.
14. Nunez J, Wood NK, Rabanal FE, Fontanella FM, Sites JW Jr (2011)
Amphibian phylogeography in the Antipodes: Refugia and postglacial
colonization explain mitochondrial haplotype distribution in the Patagonian
frog Eupsophus calcaratus (Cycloramphidae). Mol Phylogenet Evol 58(2): 343–
352.
15. Ruzzante DE, Walde SJ, Gosse JC, Cussac VE, Habit E, et al. (2008) Climate
control on ancestral population dynamics: insight from patagonian fish
phylogeography. Mol Ecol 17(9): 2234–2244.
16. Thorson R (1999) El Lımite Glacial en Sudamerica y su papel en la
Biogeografıa: Observaciones de Darwin. Ciencia al dıa internacional 4(2): 1–
15.
17. Portner HO, Bennett AF, Bozinovic F, Clarke A, Lardies MA, et al. (2006)
Trade-offs in thermal adaptation: in need of a molecular to ecological
integration. Physiol Biochem Zool 79(2):295–313.
18. Deutsch CA, Tewksbury JJ, Huey RB, Sheldon KS, Ghalambor CK, et al.
(2008) Impacts of climate warming on terrestrial ectotherms across latitude.
PNAS 105(18): 6668–6672.
19. Lobo F, Esoza R, Quinteros S (2010) A critical review and systematic discussion
of recent clasifi cation proposal for liolaemid lizards. Zootaxa 25 49: 1–30
20. Dumeril AMC, Bibron G (1837) Erpetologie Generale ou Histoire Naturelle
Complete des Reptiles. Vol. 4. Paris: Libr. Encyclopedique Roret 4: 1–571.
21. Donoso-Barros R (1966) Reptiles de Chile. Santiago, Chile: Ediciones de la
Universidad de Chile press. 604 p.
22. Schulte II JA, Macey JR, Espinoza RE, Larson A (2000) Phylogenetic
relationships in the iguanid lizard genus Liolaemus: multiple origins of viviparous
reproduction and evidence for recurring Andean vicariance and dispersal.
Biol J Linn Soc 69: 75–102.
23. Vera-Escalona IM, Coronado T, Munoz-Mendoza C, Victoriano P (2010)
Distribucion historica y actual de la lagartija Liolaemus pictus (Dumeril & Bibron
1837) (Liolaemidae) y nuevo lımite continental sur de distribucion. Gayana
74(2): 139–146.
24. Vidal M, Moreno P, Poulin E (2011) Genetic diversity and insular colonization
of Liolaemus pictus (Squamata, Liolaemidae) in north-western Patagonia. Austral
Ecol 37: 67–77.
Phylogeography of Liolaemus pictus
PLOS ONE | www.plosone.org 15 November 2012 | Volume 7 | Issue 11 | e48358

25. Avila LJ, Morando M, Sites JW Jr (2006) Congeneric phylogeography:
hypothesizing species limits and evolutionary processes in Patagonian lizards of
the Liolaemus boulengeri group (Squamata: Liolaemini). Biol Jl Linn Soc 241–275.
26. Morando M, Avila LJ, Sites JW Jr (2003). Sampling strategies for delimiting
species: genes, individuals and populations in the Liolaemus elongatus-kriegi
Complex (Squamata: Liolaemidae) in Andean-Patagonian South America.
Systematic Biol 52(2): 159–185.
27. Vidal MA, Veloso A, Mendez MA (2006) Insular morphological divergence in
the lizard Liolaemus pictus (Liolaemidae). Amphibia-Reptilia 27: 103–111.
28. Victoriano PF, Ortiz JC, Benavides E, Adams BJ, Sites JW Jr (2008)
Comparative phylogeography of codistributed species of Chilean Liolaemus
(Squamata: Tropiduridae) from the central-southern Andean range. Mol Ecol
2397–2416.
29. Morando M, Avila LJ, Turner CR, Sites JW Jr (2007) Molecular evidence for a
species complex in the Patagonian lizard Liolaemus bibronii and phylogeography
of the closely related Liolaemus gracilis (Squamata: Liolaemini). Mol Phylogenet
Evol 43(9): 952–973.
30. Knowles L, Carstens B, Keat M (2007) Coupling Genetic and Ecological-Niche
Models to Examine How Past Population Distributions Contribute to
Divergence. Current Bio 17: 940–946.
31. Carnaval AC, Moritz C (2008) Historical climate modelling informs patterns of
current biodiversity in the Brazilian Atlantic Rainforest. J Biogeogr. 35: 1187–
1201.
32. Elith J, Leathwick JR (2009) Species Distribution Models:Ecological Explana-
tion and Prediction Across Space and Time. Annu Rev Ecol Evol Syst. 40:
677–97.
33. Carnaval AC, Hickerson MJ, Haddad CFB, Rodrigues MT, Moritz C (2009)
Stability predicts genetic diversity in the Brazilian Atlantic forest hotspot.
Science 323:785–89.
34. Harrison RG (1991) Molecular changes at speciation. Annu Rev Ecol Syst. 22:
281–308.
35. Avise JC (2000) Phylogeography: The History and Formation of Species.
Harvard University Press, Cambridge, Massachusetts, USA. 464 p.
36. Miraldo A, Hewitt GM, Paulo OS, Emerson BC (2011) Phylogeography and
demographic history of Lacerta lepida in the Iberian Peninsula: multiple refugia,
range expansion and secondary contact zones. BMC Evol Biol 11: 170.
37. Vidal MA (2007) Variacion geografica en Liolaemus pictus (Liolaeminae) del
archipielago de Chiloe: el rol de las glaciaciones y la insularidad en la
divergencia molecular, fisiologica y morfologica. Tesis de grado para el
Doctorado en Ecologıa y Biologıa Evolutiva. Santiago, Chile: Facultad de
Ciencias, Universidad de Chile 116 p.
38. Portik DM, Wood PL Jr, Grismer JL, Stanley EL, Jackman TR (2011)
Identification of 104 rapidly-evolving nuclear protein-coding markers for
amplification across scaled reptiles using genomic resources. Conserv Genet
Resour. DOI: 10.1007/s12686-011-9460-1.
39. Camargo A, Avila LJ, Morando M, Sites JW Jr (2012) Accuracy and precision
of species trees: effects of locus, individual, and base-pairsampling on inference
of species trees in lizards of the Liolaemus darwinii group (Squamata,
Liolaemidae). Systematic Biology 61(2): 272–288
40. Codoncode Corporation (2009) Codon Code aligner v. 3.5. CodonCode
website. Available: http://www.codoncode.com/aligner/download.htm (Ac-
cessed October 8, 2012)
41. Stephens M, Smith NJ, Donnelly P (2001) A new statistical method for
haplotype reconstruction from population data. AJHG 68: 978–989.
42. Stephens M, Donnelly P (2003) A Comparison of Bayesian Methods for
Haplotype Reconstruction from Population Genotype Data. AJHG 73:1162–
1169.
43. Stephens M, Scheet P (2005) Accounting for decay of linkage desequilibrium in
haplotype inference and missing-data imputation. AJHG 76: 449–462.
44. Garrick RC, Sunnucks P, Dyer R (2010) Nuclear gene phylogeography using
PHASE: dealing with unresolved genotypes, lost alleles, and systematic bias in
parameter estimation. BMC Evol Biol 10: 118.
45. Martin DP, Williamson C, Posada D (2005) RDP2: recombination detection
and analysis from sequence alignments. Bioinformatics 21(2): 260–262.
46. Thompson JD, Gibson TJ, Plewniak F, Jeanmougin F, Higgins DG (1997) The
ClustalX windows interface: flexible strategies for multiple sequence alignment
aided by quality analysis tools. Nucleic Acids Research 24: 4876–4882.
47. Xia X, Xie Z (2001) DAMBE: Data analysis in molecular biology and
evoluiton. J Hered 92: 371–373.
48. Posada D (2008) jModelTest: Phylogenetic Model Averaging. Mol Biolo Evol
25: 1253–1256.
49. Pagel M, Meade A (2004) A Phylogenetic Mixture Model for Detecting
Pattern-Heterogeneity in Gene Sequence or Character-State Data. Syst Biol
53: 571–581.
50. Meade A, Pagel M (2009) Bayes trees v1.0. Reading Evolutionary Biology
Group website. Available: http://www.evolution.reading.ac.uk/BayesTrees.
html (Accessed October 8, 2012)
51. Clement M, Posada D, Crandall K (2000) TCS: a computer program to
estimate gene genealogies. Mol Ecol 9(10): 1657–1660.
52. Templeton AR, Routman E, Phillips CA (1995) Separating Population
Structure from Population History: A Cladistic Analysis of the Geographical
Distribution of Mitochondrial DNA Haplotypes in the Tiger Salamander,
Ambystoma tigrinum. Genetics 140: 767–782.
53. Rozas J, Sanchez-DelBarrio JC, Messeguer X, Rozas R (2003) DnaSP, DNA
polymorphism analyses by the coalescent and other methods. Bioinformatics
19: 2496–2497.
54. Tamura K, Peterson D, Peterson N, Stecher G, Nei M, et al. (2011) MEGA5:
Molecular Evolutionary Genetics Analysis using Maximum Likelihood,
Evolutionary Distance, and Maximum Parsimony Methods. Mol Biol Evol
28: 2731–2739.
55. Excoffier L, Laval G, Schneider S (2005) Arlequin v. 3.0: An integrated
software package for population genetics data analyses. Evolutionary bioinfor-
matics online 1: 47–50.
56. Fu YX (1997) Statistical tests of neutrality of mutations against population
growth, hitchhiking and background selection. Genetics 147: 915–925.
57. Harpending HC (1994) Signature of ancient population growth in a lower-
resolution mitochondrhial DNA mismatch distribution. Human Biol 66: 591–
600.
58. Guillot G, Mortier F, Estoup A (2005) Geneland: A program for landscape
genetics. Mol Ecol Notes 5: 712–715.
59. Miller MP (2005) Alleles in space: computer software for the joint analysis of
interindividual spatial and genetic information. J Hered 96: 722–724.
60. Miller MP, Bellinger MR, Forsman ED, Haig SM (2006) Effects of historical
climate change, habitat connectivity, and vicariance on genetic structure and
diversity across the range of the red tree vole (Phenacomys longicaudus) in the
Pacific Northwestern United States. Mol Ecol 15: 145–159.
61. Drummond AJ, Rambaut A (2007) BEAST: Bayesian evolutionary analysis by
sampling trees. BMC Evol Biol 7: 214.
62. Albino AM (2008) Lagartos iguanios del Colhuehuapense (Miocenoi temprano)
de Gaiman (provincia del Chubut, Argentina). Amehiniana 45(4): 775–782.
63. Albino AM (2005) A late quaternary lizard assemblage from the southern
pampean region of Argentina. J Verteb Paleont 25(1): 185–191.
64. Etheridge R (2000) A review of lizards of the Liolaemuswiegmannii group
(Squamata, Iguania, Tropiduridae), and a history of morphological change in
the sand-dwelling species. Herpetol Monogr 14: 293–352.
65. Rambaut A, Drummond AJ (2007) Tracer v1.4, Tracer page. Available:
http://tree.bio.ed.ac.uk/software/tracer/ (Accessed October 8, 2012)
66. Beerli P, Felsenstein J (2001). Maximum likelihood estimation of a migration
matrix and effective population sizes in n subpopulations by using a coalescent
approach. Proceedings of the National Academy of Science USA 98, 4563–
4568.
67. Phillips SJ, Anderson RP, Schapire RE (2006) Maximum entropy modeling of
species geographic distributions. Ecol Model 190: 231–259.
68. Waltari E, Hijmans RJ, Peterson AT, Nyari AS, Perkins SL, et al. (2007)
Locating Pleistocene refugia: comparing phylogeographic and ecological niche
model predictions PLoS ONE 2(7): e563. doi:10.1371/journal.pone.0000563.
69. Hijmans RJ, Cameron SE, Parra JL, Jones PG, Jarvis A (2005) Very high
resolution interpolated climate surfaces for global land areas. Int J Climatol 25:
1965–1978.
70. Moreno PY, Villagran C, Marquet PA, Marshall LG (1994) Quaternary
paleobiogeography of northern and central Chile. Rev Chil Hist Nat 67: 487–
502.
71. Formas JR, Brieva LM (2000) Population genetics of the chilean frog
Batrachyla leptopus (Leptodactylidae). Genet Mol Biol 23(1): 43–48.
72. Villagran C (2001) Un modelo de la historia de la vegetacion de la cordillera de
la costa de Chile central-sur: la hipotesis glacial de Darwin. Rev Chil Hist Nat
74: 793–803.
73. Huybrechts P (2002) Sea-level changes at the LGM from iced-dynamic
reconstructions of the Greenland and Antarctic ice sheets during the glacial
cycles. Quaternary Sci Rev 21: 203–231.
74. Alley RB (2005) Ice-sheet and sea-level changes. Science 310: 456.
75. McCulloch RD, Bentley MJ, Tipping RM, Clapperton CM (2005) Evidence
for late-glacial iced dammed lakes in the central Strait of Magellan and Bahia
Inutil, southernmost South America. Geografiska Annaler 87 A: 335–362.
76. Pincheira-Donoso D, Nunez H (2005) Las especies chilena del genero Liolaemus
Wiegmann, 1834 (Iguania Tropiduridae: Liolaeminae). Taxonomıa, sistema-
tica y evolucion. Mus Nac Hist Nat Chile 59:7486.
77. Fuentes-Hurtado M, Marın JC, Gonzalez-Acuna D, Verdugo C, Verdugo F, et
al. (2011) Molecular divergence between insular and nental Pudu d)
populations in the Chilean Patagonia. Studies on Neotropical Fauna and
Environment 46(1): 23–33.
78. Zattara E, Premoli A (2005) Genetic structuring in Andean landlocked
populations of Galaxias maculatus: effects of biogeographic history. J Biogeogr 32:
5–14.
79. Marchelli P, Baier C, Mengel C, Ziegenhagen B, Gallo LA (2010)
Biogeographic history of the threatened species Araucaria araucana (Molina) K.
Koch and implications for conservation: a case study with organelle DNA
markers. Conserv Genet 11: 951–963.
80. Gajardo R (1994) La vegetacion natural de Chile: Clasificacion y distribucion
geografica. Chile: Editorial universitaria, 165 p.
81. Berninger O (1929) Wald und offenes Land in Sud Chile seit der spanischen
Eroberung. Geographische Abhandlungen 3: 1–130.
82. Haig IT, Teesdale LV, Briegler PA, Payne BH, Haertel MH (1946) Forest
resources of Chile, Washington, DC, USA. US Forest Service, Department of
Agriculture, in cooperation with Corporacion de Fomento de la producitvidad.
256p.
Phylogeography of Liolaemus pictus
PLOS ONE | www.plosone.org 16 November 2012 | Volume 7 | Issue 11 | e48358

83. Avise JC, Arnold J, Ball RM, Bermingham E, Lamb T, et al. (1987)
Intraspecific phylogeography: the mitochondrial DNA bridge betweenpopulation genetics and systematics. Ann Rev Ecol Syst 18: 489–522.
84. Rabassa J, Clapperton C (1990) Quaternary glaciations of the southern Andes.
Quaternary Sci Rev 9:153–174.85. McCulloch RD, Bentley MJ, Purves RS, Hulton NRJ, Sugden DE, et al. (2000)
Climatic inferences from glacial and paleoecological evidence at the last glacialtermination, southern South America. J Quaternary Sci 15: 409–417.
86. Fontanella F, Olave M, Avila LJ, Sites JW, Morando M (2012) Molecular
dating and diversification of the South American lizard genus Liolaemus(subgenus Eulaemus) based on nuclear and mitochondrial DNA sequences.
Zool J Linn Soc 164: 825–835.87. Moore WS (1995) Inferring phylogenies from mtDNA variation: mitochondri-
al-gene trees versus nuclear-gene trees. Evolution 49:718–726.88. Pinho C, Harris DJ, Ferrand N (2008) Non-equilibrium estimates of gene flow
inferred from nuclear genealogies suggest that Iberian and North African wall
lizards (Podarcis spp) are an assemblage of incipient species. BMC EvolutionaryBiology 8: 63.
89. Cronin TM (2010) Paleoclimates: understanding climate change past andpresent. New York, USA: Columbia University Press. 448 p.
90. Vuilleumier BS (1971) Pleistocene changes in the fauna and flora of South
America. Science 173: 771–780.91. Hewitt G (2000) The genetic legacy of the quaternary ice ages. Nature 405:
907–913.92. Bell RC, Parra JL, Tonione M, Hoskin CJ, Mackenszie JB, et al. (2010)
Patterns of persistence and isolation indicate resilience to climate change inmontane rainforest lizards. Mol Ecol 19: 2531–2544.
93. Lessa EP, D’Elıa G, Pardinas UFJ (2010) Genetic footprints of late Quaternary
climate change in the diversity of Patagonian-Fueguian rodents. Mol Ecol 19:3031–3037.
94. Canon C, D’Elıa G, Pardinas UFJ, Lessa EP (2010) Phylogeography ofLoxodontomys micropus with comments on the alpha taxonomy of Loxodontomys
(Cricetidae: Sigmodontinae). J Mamm 91: 1449–1458.
95. Beheregaray LB (2008) Twenty years of Phylogeography: the state of the fieldand the challenges for the Southern Hemisphere. Mol Ecol 17: 3754–3774.
96. Muellner AN, Tremetsberger K, Stuessey T, Baeza M (2005) Pleistocenerefugia and recolonization routes in the southern Andes: insights from
Hypochaeris palustris (Asteraceae, Lactuceae). Mol Ecol 14: 203–212.
97. Marchelli P, Gallo L (2006) Multiple ice-age refugia in a southern beech of
South America as evidenced by chloroplast DNA markers. Conservation
Genetics 7: 591–603.
98. Sersic A, Cosacov A, Cocucci AA, Johnson L, Pozner R, et al. (2011) Emerging
phylogeographical patterns of plants and terrestrial vertebrates from Patagonia.
Biol J Linn Soc 103: 475–494.
99. Tremetsberger K, Urtubey E, Terrab A, Baeza CM, Ortiz MA, et al. (2009)
Pleistocene refugia and polytopic replacement of diploids by tetraploids in the
Patagonian and Subantarctic plant Hypochaeris incana (Asteraceae, Cichorieae).
Mol Ecol 18(17): 3668–82.
100. Rand AL (1948) Glaciation, an isolation factor in speciation. Evolution 2(4):
314–321.
101. Hewitt GM (1996) Some genetic consequences of ice ages, and their role, in
divergence and speciation. Biol J Linn Soc 58: 247–276.
102. Holling JT, Schilling DH (1981) Late Wisconsin-Weichselian mountain glaciers
and small ice caps. In: Denton GH, Hughes TJ, editors. The last great ice sheet.
New York, USA: John Wiley & Sons, Inc. pp. 179–206.
103. Ruiz E, Gonzalez F, Torres-Diaz C, Fuentes G, Mardones M, et al. (2007)
Genetic diversity and diversification within and among Chilean populations of
Araucaria araucana (Araucariaceae) based on allozyme variability. Taxon 56(4):
1221–1228.
104. Markgraf V (1984) Late Pleistocene and Holocene vegetation history of
temperate Argentina: Lago Morenito, Bariloche. Diss Bot 72: 235–254.
105. Premoli AC, Kitzberger T, Veblen TT (2000) Isozime variation and recent
biogeographical history of the long-lived conifer Fitzroya cupressoides.
J Biogeography 27: 251–260.
106. Pastorino MJ, Gallo LA (2002) Quaternary evolution history of Austrocedrus
chilensis, a cypress native to the Andean-Patagonian forest. J Biogeography 29:
1167–1178.
107. Sites JW Jr, Marshall JC (2004) Operational criteria for delimiting species.
Annu Rev Ecol Evol Syst 35: 199–227.
108. Pamilo K, Nei M (1988) Relationships between gene trees and species trees.
Mol Biol Evol 5(5): 568–583.
109. Hudson RR (1990) Gene genealogies and the coalescent process. Oxf Surv
Evol Biol. 7:1–44.
Phylogeography of Liolaemus pictus
PLOS ONE | www.plosone.org 17 November 2012 | Volume 7 | Issue 11 | e48358