Northern richness and cryptic refugia: phylogeography of the Italian smooth newt Lissotriton...
14
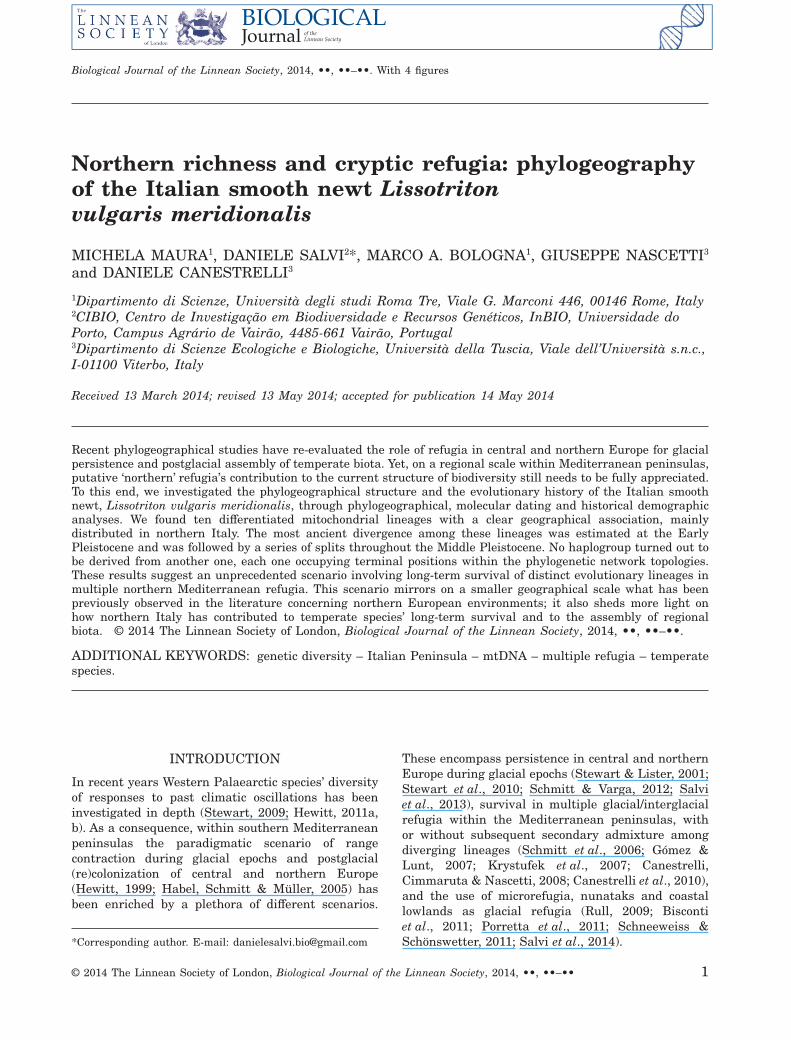
Northern richness and cryptic refugia: phylogeography of the Italian smooth newt Lissotriton vulgaris meridionalis MICHELA MAURA 1 , DANIELE SALVI 2 *, MARCO A. BOLOGNA 1 , GIUSEPPE NASCETTI 3 and DANIELE CANESTRELLI 3 1 Dipartimento di Scienze, Università degli studi Roma Tre, Viale G. Marconi 446, 00146 Rome, Italy 2 CIBIO, Centro de Investigação em Biodiversidade e Recursos Genéticos, InBIO, Universidade do Porto, Campus Agrário de Vairão, 4485-661 Vairão, Portugal 3 Dipartimento di Scienze Ecologiche e Biologiche, Università della Tuscia, Viale dell’Università s.n.c., I-01100 Viterbo, Italy Received 13 March 2014; revised 13 May 2014; accepted for publication 14 May 2014 Recent phylogeographical studies have re-evaluated the role of refugia in central and northern Europe for glacial persistence and postglacial assembly of temperate biota. Yet, on a regional scale within Mediterranean peninsulas, putative ‘northern’ refugia’s contribution to the current structure of biodiversity still needs to be fully appreciated. To this end, we investigated the phylogeographical structure and the evolutionary history of the Italian smooth newt, Lissotriton vulgaris meridionalis, through phylogeographical, molecular dating and historical demographic analyses. We found ten differentiated mitochondrial lineages with a clear geographical association, mainly distributed in northern Italy. The most ancient divergence among these lineages was estimated at the Early Pleistocene and was followed by a series of splits throughout the Middle Pleistocene. No haplogroup turned out to be derived from another one, each one occupying terminal positions within the phylogenetic network topologies. These results suggest an unprecedented scenario involving long-term survival of distinct evolutionary lineages in multiple northern Mediterranean refugia. This scenario mirrors on a smaller geographical scale what has been previously observed in the literature concerning northern European environments; it also sheds more light on how northern Italy has contributed to temperate species’ long-term survival and to the assembly of regional biota. © 2014 The Linnean Society of London, Biological Journal of the Linnean Society, 2014, ••, ••–••. ADDITIONAL KEYWORDS: genetic diversity – Italian Peninsula – mtDNA – multiple refugia – temperate species. INTRODUCTION In recent years Western Palaearctic species’ diversity of responses to past climatic oscillations has been investigated in depth (Stewart, 2009; Hewitt, 2011a, b). As a consequence, within southern Mediterranean peninsulas the paradigmatic scenario of range contraction during glacial epochs and postglacial (re)colonization of central and northern Europe (Hewitt, 1999; Habel, Schmitt & Müller, 2005) has been enriched by a plethora of different scenarios. These encompass persistence in central and northern Europe during glacial epochs (Stewart & Lister, 2001; Stewart et al., 2010; Schmitt & Varga, 2012; Salvi et al., 2013), survival in multiple glacial/interglacial refugia within the Mediterranean peninsulas, with or without subsequent secondary admixture among diverging lineages (Schmitt et al., 2006; Gómez & Lunt, 2007; Krystufek et al., 2007; Canestrelli, Cimmaruta & Nascetti, 2008; Canestrelli et al., 2010), and the use of microrefugia, nunataks and coastal lowlands as glacial refugia (Rull, 2009; Bisconti et al., 2011; Porretta et al., 2011; Schneeweiss & Schönswetter, 2011; Salvi et al., 2014). *Corresponding author. E-mail: [email protected] Biological Journal of the Linnean Society, 2014, ••, ••–••. With 4 figures © 2014 The Linnean Society of London, Biological Journal of the Linnean Society, 2014, ••, ••–•• 1
Transcript of Northern richness and cryptic refugia: phylogeography of the Italian smooth newt Lissotriton...
Northern richness and cryptic refugia: phylogeographyof the Italian smooth newt Lissotritonvulgaris meridionalis
MICHELA MAURA1, DANIELE SALVI2*, MARCO A. BOLOGNA1, GIUSEPPE NASCETTI3
and DANIELE CANESTRELLI3
1Dipartimento di Scienze, Università degli studi Roma Tre, Viale G. Marconi 446, 00146 Rome, Italy2CIBIO, Centro de Investigação em Biodiversidade e Recursos Genéticos, InBIO, Universidade doPorto, Campus Agrário de Vairão, 4485-661 Vairão, Portugal3Dipartimento di Scienze Ecologiche e Biologiche, Università della Tuscia, Viale dell’Università s.n.c.,I-01100 Viterbo, Italy
Received 13 March 2014; revised 13 May 2014; accepted for publication 14 May 2014
Recent phylogeographical studies have re-evaluated the role of refugia in central and northern Europe for glacialpersistence and postglacial assembly of temperate biota. Yet, on a regional scale within Mediterranean peninsulas,putative ‘northern’ refugia’s contribution to the current structure of biodiversity still needs to be fully appreciated.To this end, we investigated the phylogeographical structure and the evolutionary history of the Italian smoothnewt, Lissotriton vulgaris meridionalis, through phylogeographical, molecular dating and historical demographicanalyses. We found ten differentiated mitochondrial lineages with a clear geographical association, mainlydistributed in northern Italy. The most ancient divergence among these lineages was estimated at the EarlyPleistocene and was followed by a series of splits throughout the Middle Pleistocene. No haplogroup turned out tobe derived from another one, each one occupying terminal positions within the phylogenetic network topologies.These results suggest an unprecedented scenario involving long-term survival of distinct evolutionary lineages inmultiple northern Mediterranean refugia. This scenario mirrors on a smaller geographical scale what has beenpreviously observed in the literature concerning northern European environments; it also sheds more light onhow northern Italy has contributed to temperate species’ long-term survival and to the assembly of regionalbiota. © 2014 The Linnean Society of London, Biological Journal of the Linnean Society, 2014, ••, ••–••.
ADDITIONAL KEYWORDS: genetic diversity – Italian Peninsula – mtDNA – multiple refugia – temperatespecies.
INTRODUCTION
In recent years Western Palaearctic species’ diversityof responses to past climatic oscillations has beeninvestigated in depth (Stewart, 2009; Hewitt, 2011a,b). As a consequence, within southern Mediterraneanpeninsulas the paradigmatic scenario of rangecontraction during glacial epochs and postglacial(re)colonization of central and northern Europe(Hewitt, 1999; Habel, Schmitt & Müller, 2005) hasbeen enriched by a plethora of different scenarios.
These encompass persistence in central and northernEurope during glacial epochs (Stewart & Lister, 2001;Stewart et al., 2010; Schmitt & Varga, 2012; Salviet al., 2013), survival in multiple glacial/interglacialrefugia within the Mediterranean peninsulas, withor without subsequent secondary admixture amongdiverging lineages (Schmitt et al., 2006; Gómez &Lunt, 2007; Krystufek et al., 2007; Canestrelli,Cimmaruta & Nascetti, 2008; Canestrelli et al., 2010),and the use of microrefugia, nunataks and coastallowlands as glacial refugia (Rull, 2009; Biscontiet al., 2011; Porretta et al., 2011; Schneeweiss &Schönswetter, 2011; Salvi et al., 2014).*Corresponding author. E-mail: [email protected]
bs_bs_banner
Biological Journal of the Linnean Society, 2014, ••, ••–••. With 4 figures
© 2014 The Linnean Society of London, Biological Journal of the Linnean Society, 2014, ••, ••–•• 1

Even at the smaller geographical scale of the ItalianPeninsula, a similarly wide diversity of responses toPlio-Pleistocene climatic oscillations is emergingamong temperate species (e.g. Canestrelli et al., 2010;Vega et al., 2010; Hewitt, 2011b; Canestrelli, Sacco &Nascetti, 2012a; Canestrelli et al., 2012b; and refer-ences therein). The southern part of the ItalianPeninsula has been identified as a major hotspot ofgenetic diversity, as a glacial/interglacial refugiumand as a source for later (re)colonizations of northernareas, for most species studied to date (e.g. Canestrelliet al., 2006, 2008, 2010; Magri, 2008). Moreover,phylogeographical patterns indicating multiplerefugia in distinct mountain districts, coastal refugiaand/or microrefugia have been found in most of thesespecies (Canestrelli, Cimmaruta & Nascetti, 2007;Magri, 2008; Canestrelli et al., 2010, 2012a, b; Vegaet al., 2010).
On the other hand, an even more complicatedpicture is emerging as regards the northern part ofItaly. Indeed, while this area has long been acknowl-edged as a site of postglacial (re)colonization, recentworks have also identified it as a putative refugium(Canestrelli et al., 2007, 2012b; Crottini et al., 2007;Canestrelli & Nascetti, 2008; Salvi et al., 2013),revealing that many of the evolutionary and historicaldemographic processes leading to the assembly of thepresent-day regional biota have still to be fully appre-ciated. These findings mirror what has previouslybeen observed in the literature concerning the north-ern European environments (Stewart & Lister, 2001;Stewart et al., 2010; Schmitt & Varga, 2012); simi-larly, they suggest the need for more studies toachieve a deeper understanding of how northern Italyhas contributed to temperate species’ long-term sur-vival and to the current structure of the Italian andEuropean biota.
In this study we analysed the phylogeographicalstructure of the Italian smooth newt, Lissotritonvulgaris meridionalis (Boulenger, 1882), within itsputative Pleistocene refugium in Italy (Babik,Branicki & Crnobrnja–Isaloviç, 2005). Lissotritonvulgaris is a temperate species widespread in Europeand south-western Asia. A previous phylogeographicalstudy of L. vulgaris carried out at the level of thewhole species range showed a high genetic fragmen-tation of populations into several divergent lineagesthat survived Pleistocene climatic oscillations in mul-tiple refugia located in southern Europe, centralEurope and south-western Asia (Babik, Branicki &Crnobrnja–Isaloviç, 2005). Among these lineages theItalian populations were identified as belonging to anindependent and anciently differentiated lineage(∼1.9 Mya; Babik et al., 2005).
Here we used phylogeographical, molecular datingand historical demographic analyses, together with
a denser sampling scheme in northern Italy, withthe aim of investigating the evolutionary historyof L. v. meridionalis, and to shed more light on howthis area has contributed to temperate species’long-term survival and to the assembly of regionalbiota.
MATERIAL AND METHODSSAMPLING AND LABORATORY PROCEDURES
We sampled 82 L. v. meridionalis individuals from24 localities throughout its range (see Table 1 andFig. 1B). Newts were anaesthetized by submersionin a 0.1% solution of MS222 (3-aminobenzoic acidethyl ester) and tissue samples were collected fromtail tips and stored in 96% ethanol until subsequentanalyses. Afterwards, all individuals were released atthe respective collection site.
DNA extraction was performed by following thestandard cetyltrimethyl ammonium bromide (CTAB)protocol (Doyle & Doyle, 1987).
Two mtDNA fragments were amplified andsequenced for all individuals, one comprising thepartial NADH dehydrogenase subunit 4 gene andthe flanking tRNAHis gene (hereafter ND4), and theother comprising the NADH dehydrogenase subunit2 gene (hereafter ND2). Preliminary amplificationsand sequencing of the ND4 fragment were performedusing the primers ND4 and LEU (Arévalo, Davis& Sites, 1994), and then the internal primersND4vulgF1 (ATCCGAATTTCTATAATCMTTACCC)and ND4vulgR1 (CTTCTTGGTAGGTAGAGAGGGTTTA) were designed and used for PCR amplificationand sequencing of all individuals. Preliminary ampli-fications and sequencing of the ND2 fragment wereperformed using the primers L3780 and H5018 (Babiket al., 2005); the internal forward primer LVND2F1(AATCAGCAACAAAATACTTTTTAACG) was thendesigned and used with the H5018 for amplificationand sequencing of all individuals.
Amplifications were performed in a 25-μL volumecontaining MgCl2 (2.5 mM), reaction buffer (5×,Promega), the four dNTPs (0.2 mM each), the twoprimers (0.2 μM each), the enzyme Taq polymerase(1 U, Promega) and 2 μL of genomic DNA. PCRreactions were carried out with an initial step at95 °C for 5 min followed by 30 (ND4) or 38 (ND2)cycles of: 94 °C for 1 min, 55 °C (ND4) or 56 °C(ND2) for 1 min, 72 °C for 1 min, and a single finalstep at 72 °C for 10 min. Purification and sequenc-ing of the PCR products were carried out byMacrogen Inc. (http://www.macrogen.com) using anABI PRISM 3700 sequencing system. All sequenceswere deposited in GenBank (accession numbers:KM262086–KM262179).
2 M. MAURA ET AL.
© 2014 The Linnean Society of London, Biological Journal of the Linnean Society, 2014, ••, ••–••
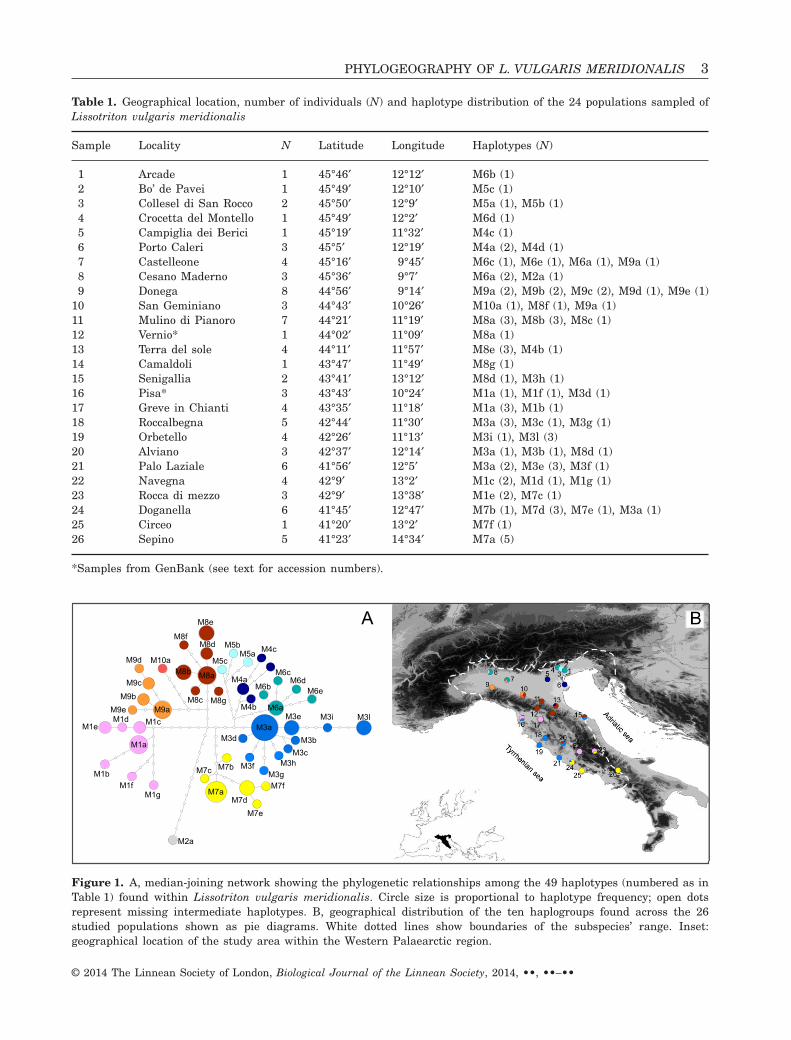
Table 1. Geographical location, number of individuals (N) and haplotype distribution of the 24 populations sampled ofLissotriton vulgaris meridionalis
Sample Locality N Latitude Longitude Haplotypes (N)
1 Arcade 1 45°46′ 12°12′ M6b (1)2 Bo’ de Pavei 1 45°49′ 12°10′ M5c (1)3 Collesel di San Rocco 2 45°50′ 12°9′ M5a (1), M5b (1)4 Crocetta del Montello 1 45°49′ 12°2′ M6d (1)5 Campiglia dei Berici 1 45°19′ 11°32′ M4c (1)6 Porto Caleri 3 45°5′ 12°19′ M4a (2), M4d (1)7 Castelleone 4 45°16′ 9°45′ M6c (1), M6e (1), M6a (1), M9a (1)8 Cesano Maderno 3 45°36′ 9°7′ M6a (2), M2a (1)9 Donega 8 44°56′ 9°14′ M9a (2), M9b (2), M9c (2), M9d (1), M9e (1)
10 San Geminiano 3 44°43′ 10°26′ M10a (1), M8f (1), M9a (1)11 Mulino di Pianoro 7 44°21′ 11°19′ M8a (3), M8b (3), M8c (1)12 Vernio* 1 44°02′ 11°09′ M8a (1)13 Terra del sole 4 44°11′ 11°57′ M8e (3), M4b (1)14 Camaldoli 1 43°47′ 11°49′ M8g (1)15 Senigallia 2 43°41′ 13°12′ M8d (1), M3h (1)16 Pisa* 3 43°43′ 10°24′ M1a (1), M1f (1), M3d (1)17 Greve in Chianti 4 43°35′ 11°18′ M1a (3), M1b (1)18 Roccalbegna 5 42°44′ 11°30′ M3a (3), M3c (1), M3g (1)19 Orbetello 4 42°26′ 11°13′ M3i (1), M3l (3)20 Alviano 3 42°37′ 12°14′ M3a (1), M3b (1), M8d (1)21 Palo Laziale 6 41°56′ 12°5′ M3a (2), M3e (3), M3f (1)22 Navegna 4 42°9′ 13°2′ M1c (2), M1d (1), M1g (1)23 Rocca di mezzo 3 42°9′ 13°38′ M1e (2), M7c (1)24 Doganella 6 41°45′ 12°47′ M7b (1), M7d (3), M7e (1), M3a (1)25 Circeo 1 41°20′ 13°2′ M7f (1)26 Sepino 5 41°23′ 14°34′ M7a (5)
*Samples from GenBank (see text for accession numbers).
malv10
M7eM7d
M7f
M9e
M2a
A
M3a
M3f
M3eM6a
M3d
M3hM3g
M3i M3l
M5c
M4aM6c
M1g
M6d
M10a
M6eM6b
M1a
M4bM1d
M1fM1b
M1e M1c
M8e
M9a
M7c
M7a
M7b
M8b
M8f
M8g
M9cM8a
M8d
M8c
M9d
M9b
M5aM5b M4c
M3bM3c
B
Figure 1. A, median-joining network showing the phylogenetic relationships among the 49 haplotypes (numbered as inTable 1) found within Lissotriton vulgaris meridionalis. Circle size is proportional to haplotype frequency; open dotsrepresent missing intermediate haplotypes. B, geographical distribution of the ten haplogroups found across the 26studied populations shown as pie diagrams. White dotted lines show boundaries of the subspecies’ range. Inset:geographical location of the study area within the Western Palaearctic region.
PHYLOGEOGRAPHY OF L. VULGARIS MERIDIONALIS 3
© 2014 The Linnean Society of London, Biological Journal of the Linnean Society, 2014, ••, ••–••
NUCLEOTIDE VARIATION, PHYLOGENETIC ANALYSES
AND MOLECULAR DATING
Electropherograms were visually checked usingFinchTv 1.4.0 (Geospiza Inc.) and aligned usingClustal X 2.0 (Larkin et al., 2007). Previously pub-lished sequences of ND4 and ND2 fragments of fouradditional individuals sampled in central Italy (local-ity numbers 12 and 16 in Table 1) were added to ouranalyses (Babik et al., 2005, GenBank accessionnumbers: AY951639, AY951495, AY951454–56 andAY951609–11). We discarded the hypothesis ofpseudogenes occurring in our mitochondrial sequencedataset by confirming the absence of stop codons inprotein-coding fragments, and the overall similaritywith the reference mitochondrial genome of L. vulgaris(GenBank accession number: EU880339).
Nucleotide variation and corrected sequence diver-gence (Tamura & Nei, 1993) between and within themain haplogroups were estimated using the softwareMEGA 5 (Tamura et al., 2011).
The appropriate model of nucleotide substitutionfor our dataset was chosen among 88 distinct modelsusing the Akaike Information Criterion (AIC; Akaike,1973) implemented in jModelTest 0.1.1 (Posada,2008). TIM2+Γ (Posada, 2003) was the best fit modelfor ND4 and ND2 fragments analysed both separatelyand combined (with the gamma distribution shapeparameter = 0.141).
The genealogical relationships among haplotypeswere inferred by phylogenetic networks as wellas by maximum-likelihood (ML) and Bayesian (BA)phylogenetic trees. Phylogenetic networks wereinferred using two distinct algorithms: the statisticalparsimony procedure implemented in TCS 1.21(Clement, Posada & Crandall, 2000) and themedian-joining procedure (Bandelt, Forster & Röhl,1999) implemented in NETWORK 4.6.1 (Fluxus-engineering). However, both methods recovered topolo-gies with several missing intermediate haplotypesconnecting terminal haplotypes. In such cases, themedian-joining method shows relatively higher perfor-mance among network-building procedures (Cassens,Mardulyn & Milinkovitch, 2005). Therefore, only themedian-joining network is shown. ML analysis wasperformed with PhyML 3.0 (Guindon et al., 2010)using the SPR&NNI algorithm and the model ofsequence evolution suggested by jModelTest. Therobustness of the inferred ML tree was assessed by thenon-parametric bootstrap method with 1000 replicates(BP). BA analyses were performed in MrBayes 3.2.0(Ronquist et al., 2012). Two independent runs wereconducted using the model of evolution selected byJModeltest, with random starting trees, run lengthof 107 generations, sampling every 100 generations.Branching reliability was estimated as values of
Bayesian posterior probabilities (BPP) of sampledtrees (burn-in = 25%).
Time estimates for the most recent common ances-tors (TMRCAs) of the mtDNA haplogroups wereobtained by using the distance-based least squares(LS) method (Xia & Yang, 2011) implemented in thesoftware DAMBE 5.3.8 (Xia & Xie, 2001). A likelihoodratio test performed with this software did not rejectthe molecular clock hypothesis for our dataset. TheLS analysis was performed specifying the ML treetopology calculated in PhyML and using the relatedsubspecies L. v. vulgaris as an outgroup (GenBankaccession numbers: AY951562 and AY951396). Weset the root of the tree as far back as 1.9 Mya,corresponding to the divergence time between L. v.vulgaris and L. v. meridionalis as estimated by Babiket al. (2005). We used the ‘softbound’ option and‘MLCompositeTN93’ genetic distance, as suggested byXia & Yang (2011). Standard deviations of the timeestimates were obtained by means of 1000 bootstrapre-samplings.
POPULATION GENETIC STRUCTURE AND
HISTORICAL DEMOGRAPHY
We investigated the geographical structure of geneticvariation following two distinct approaches. In bothcases populations with one individual were excludedfrom the dataset. First, we searched for groups ofpopulations that are geographically homogeneous butmaximally differentiated from each other by using thespatial analysis of molecular variance implementedin SAMOVA 1.0 (Dupanloup, Schneider & Excoffier,2002). We performed this analysis setting the numberof groups (K) from two to 12, and selecting the bestclustering option as the one returning the highest andsignificant value of FCT (i.e. the among-group variancecomponent). To verify the consistency of the resultsamong runs, we replicated the analysis five timesfor each K value with 1000 independent annealingprocesses.
Second, we investigated to what extent the geo-graphical structure of genetic variation wasaccounted for patterns of isolation-by-distance, rela-tive to genetic differentiation among groups; this wasdone by carrying out partial Mantel tests as imple-mented in the IBD web service 3.23 (Jensen, Bohonak& Kelley, 2005). To perform these analyses we com-puted three distance matrices among populationpairs: (1) the corrected mean genetic distance (TrN+Γmodel, Γ = 0.141) calculated with MEGA; (2) the geo-graphical distance, calculated by GEOGRAPHIC DIS-TANCE MATRIX GENERATOR 1.2.3 (Ersts, 2012)and subsequently log-transformed following sugges-tions by Rousset (1997); and (3) a binary matrix (theindicator matrix) in which the value ‘0’ indicates that
4 M. MAURA ET AL.
© 2014 The Linnean Society of London, Biological Journal of the Linnean Society, 2014, ••, ••–••
two populations are within the same group, and ‘1’in the opposite case. We assessed the significance ofcorrelations and partial correlations between thesematrices, by using Mantel and partial Mantel tests of1000 bootstrap replicates.
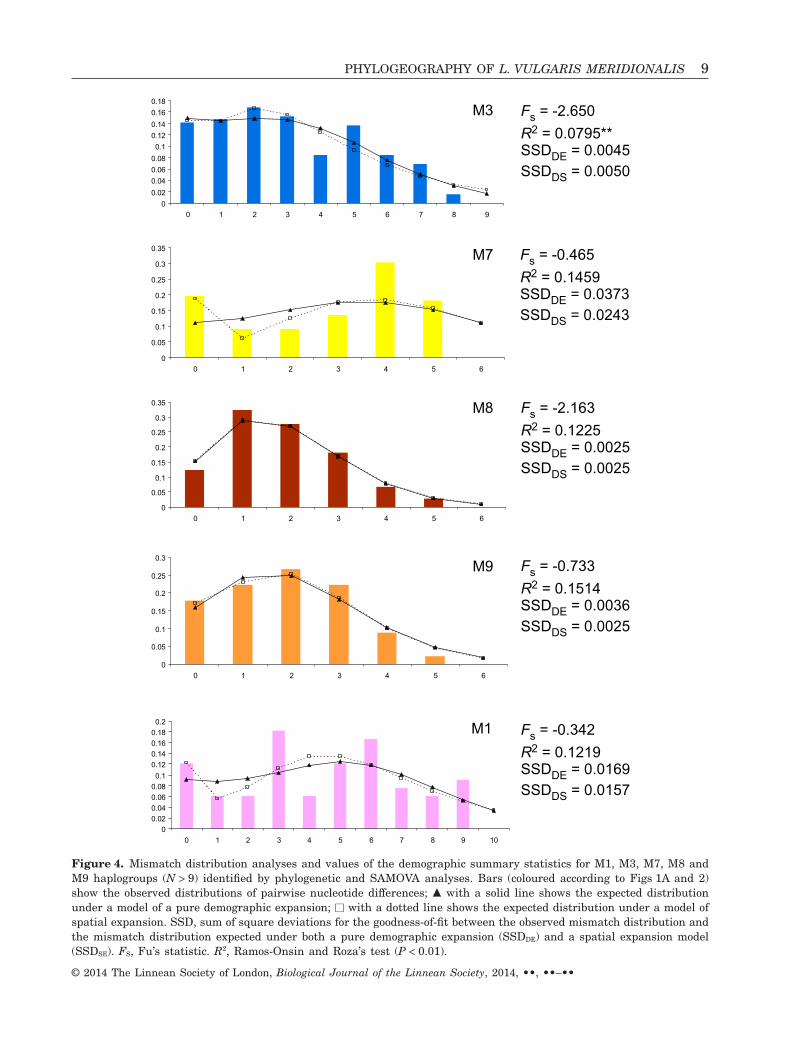
Past demographic changes of each haplogroup found(with N > 9) were investigated by using two differentmethods. First, a mismatch distribution analysis(Rogers & Harpending, 1992) was performed with thesoftware ARLEQUIN 3.5.1.2 (Excoffier, Laval &Schneider, 2005). In this analysis the observed distri-bution of nucleotide differences between haplotypepairs (mismatch distribution) is compared with thatexpected under both a demographic expansion model(Rogers & Harpending, 1992) and a sudden spatialexpansion model (Excoffier, 2004). We used the sum ofsquared deviations between estimated and observedmismatch distributions as goodness-of-fit statistics; itssignificance was assessed using 1000 bootstrap repli-cates. Second, the FS (Fu, 1997) and R2 (Ramos-Onsins& Rozas, 2002) statistics were also used to infer pastdemographic changes. Both these neutrality tests havebeen shown to outperform most of the other statisticscommonly used with the same aim (see Ramos-Onsins& Rozas, 2002), and, in particular, FS was shown toperform better at large sample sizes while R2 doesat small sample sizes (Ramos-Onsins & Rozas,2002). High, negative and significant values of FS
and small, positive and significant values of R2 areindicative of past demographic expansions (Fu, 1997;Ramos-Onsins & Rozas, 2002). The significance of theFS and R2 values was assessed through 1000 coalescentsimulations, carried out under the hypothesis of popu-lation equilibrium and selective neutrality. Moreover,for the estimated FS values the 2% cut-off criterion wasused to assess the 5% nominal level of significance (Fu,1997). FS and R2 statistics and coalescent simulationswere performed with the software DnaSP 5 (Librado &Rozas, 2009).
RESULTSNUCLEOTIDE VARIATION, PHYLOGENETIC ANALYSES
AND MOLECULAR DATING
For all individuals analysed the ND4 fragment was644 bp in length, comprising 587 bp of the (3′) NADHdehydrogenase subunit 4 gene and 57 bp of thetRNAHis gene; the ND2 fragment was 651 bp. Thecombined dataset (overall 1295 bp) included 109variable positions, of which 61 were parsimony-informative. We did not find indels or stop codonswithin the coding region of either the ND2 or the ND4fragments. A total of 49 haplotypes were found inthe combined fragment. Geographical distribution ofhaplotypes is presented in Figure 1B and Table 1.
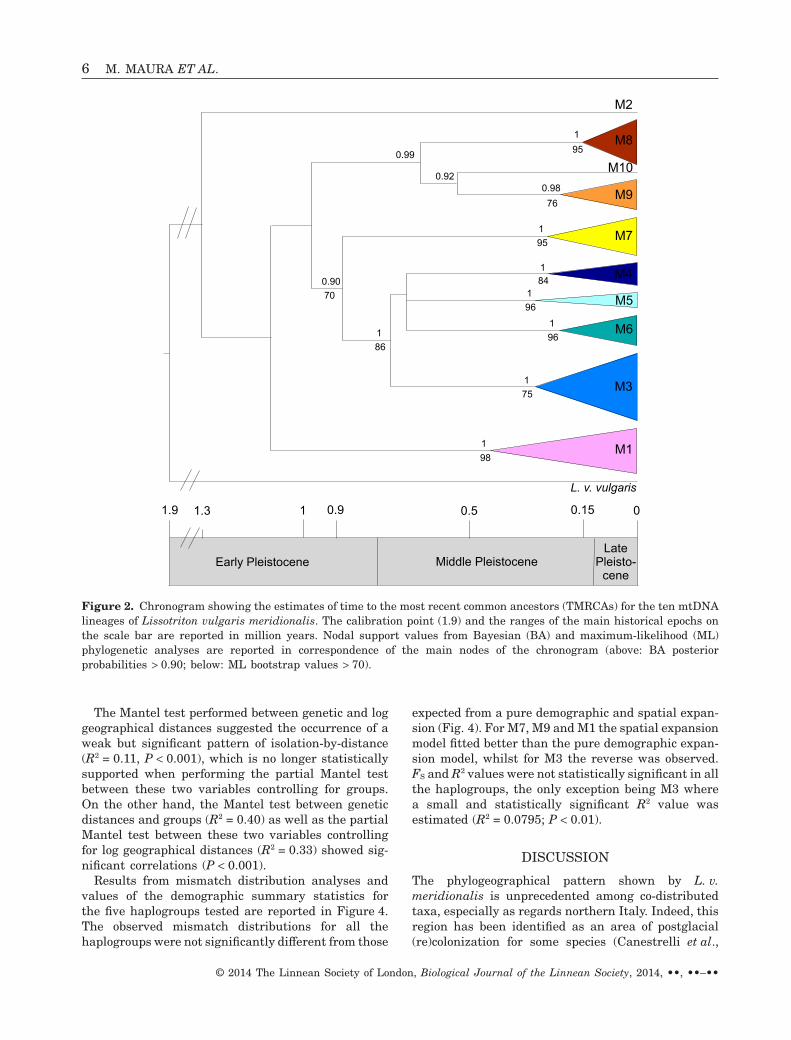
Phylogenetic analyses based on ML and BA treesand network reconstructions were congruent andrevealed ten reciprocally monophyletic and statisti-cally supported haplogroups (BP > 75, BPP > 0.98;Figs 1A, 2 and Supplementary Fig. S1) whose geo-graphical distribution is shown in Figure 1B. Sevenhaplogroups were distributed in northern Italy:M9 (samples 7, 9 and 10), M10 (sample 10) and M2(sample 8) mainly in the central–western part of thePo plain; M4 (samples 5, 6 and 13) and M5 (samples2 and 3) in the Venetian plain; M6 (samples 1, 4, 7and 8) along the pre-Alpine area; and M8 on bothsides of the northern Apennines (samples 10–15, 20).Haplogroups M1, M3 and M7 occurred in the remain-ing of the species’ range along the central Italianpeninsula: M3 was mostly distributed along theTyrrhenian coast (samples 15, 16, 18–21 and 24)reaching the Adriatic side in sample 15; M7 in thesouthern part of the subspecies range (samples23–26); and M1 close to both the northern (samples16 and 17) and central Apennines (samples 22, 23),showing indeed an apparently fragmented distribu-tion. Co-presence was observed in nine localities (7, 8,10, 13, 15, 16, 20, 23 and 24) and occurred amongmost of the haplogroups.
Average sequence divergence among haplogroupsranged from 0.007 (between M9 and M10; SD 0.002)to 0.022 (between M2 and M5; SD 0.005) whereaswithin groups average genetic distance ranged from0.001 (M8 and M9; SD 0.001) to 0.004 (M5; SD 0.001)(see Table 2).
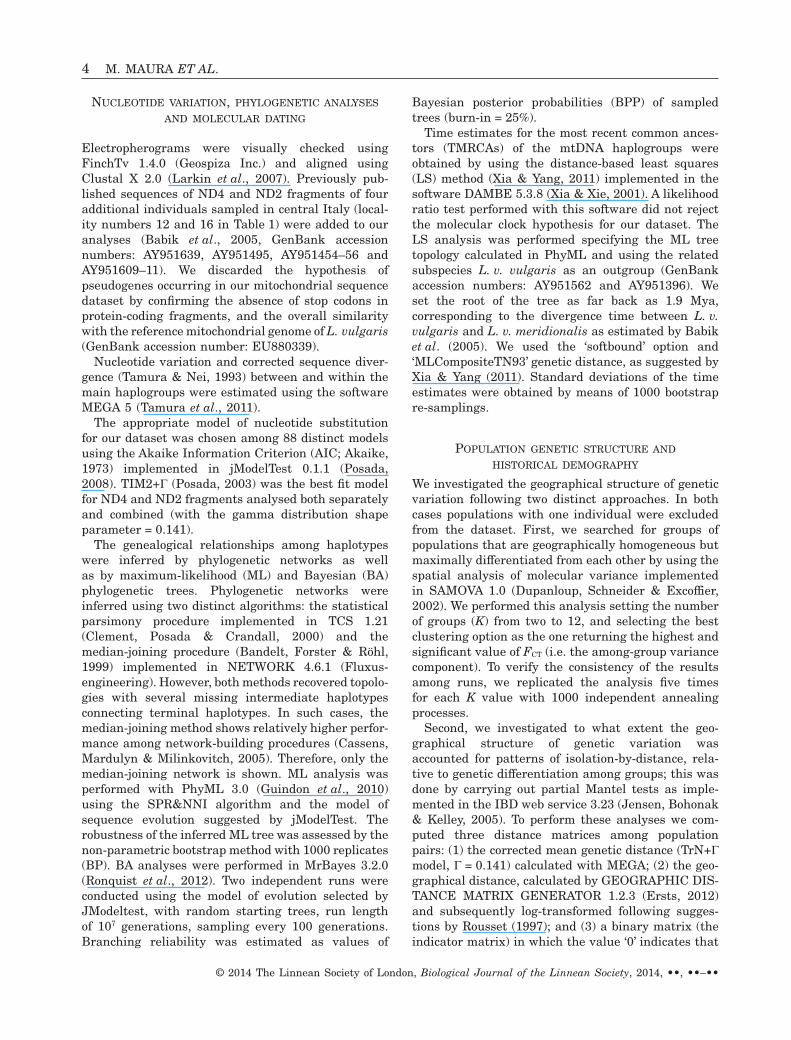
TMRCA estimates for the mtDNA haplogroups areshown as a chronogram in Figure 2 and in Supplemen-tary Table S1. The TMRCA for the entire ingroup wasestimated to have occurred in the late Early Pleisto-cene (1.312 ± 0.290 Mya); the subsequent splits amongthe haplogroups fell within the late Early Pleistoceneand the Middle Pleistocene. Finally, the TMRCAs ofeach haplogroup ranged from the early Middle Pleis-tocene (i.e. 0.444 ± 0.131 Mya of M1) to the early LatePleistocene (i.e. 0.166 ± 0.070 Mya of M8).
POPULATION GENETIC STRUCTURE AND
HISTORICAL DEMOGRAPHY
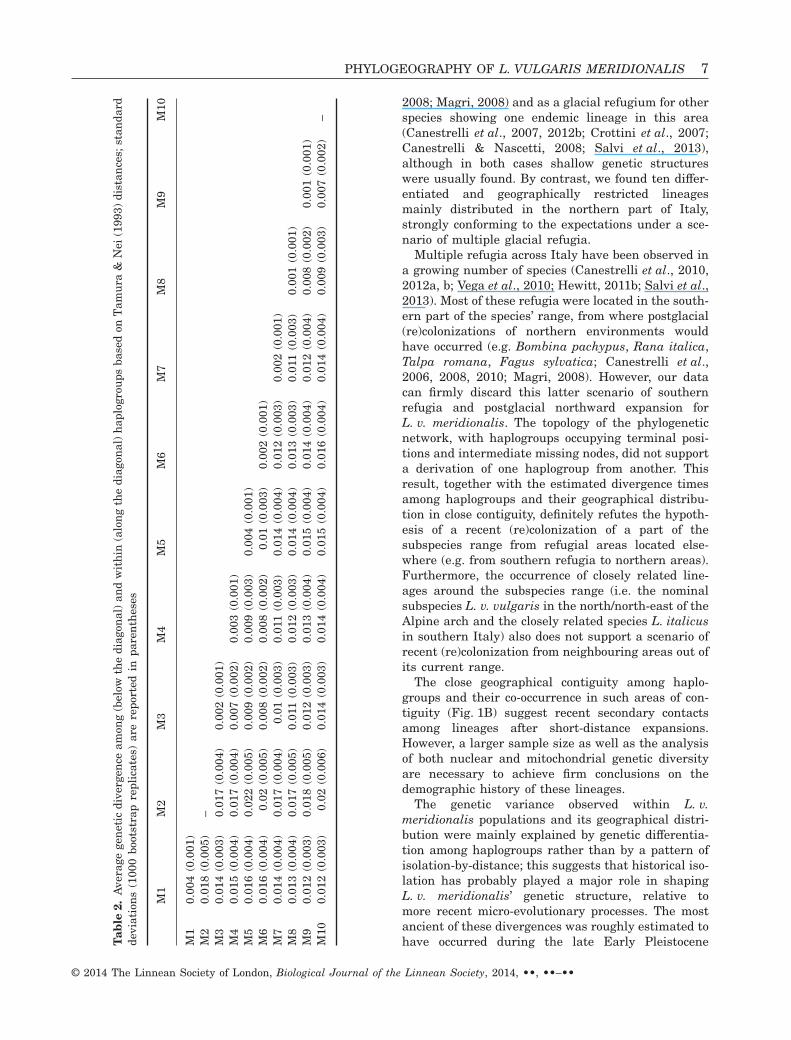
The spatial analysis of molecular variance showed thatFCT values progressively increased (from 0.301 to0.596) and FSC values progressively decreased (from0.619 to 0.153) when K increases from K = 2 to 12 (seeFig. 3A). After K = 9 population structures were nolonger informative as one population at a time isremoved from groups (see Fig. 3B). At K = 9 the groupsrecovered almost mirror the geographical distributionof the haplogroups identified in the phylogenetic analy-ses (M1, M3–M9) plus an additional group composed ofsamples 16 and 17.
PHYLOGEOGRAPHY OF L. VULGARIS MERIDIONALIS 5
© 2014 The Linnean Society of London, Biological Journal of the Linnean Society, 2014, ••, ••–••
The Mantel test performed between genetic and loggeographical distances suggested the occurrence of aweak but significant pattern of isolation-by-distance(R2 = 0.11, P < 0.001), which is no longer statisticallysupported when performing the partial Mantel testbetween these two variables controlling for groups.On the other hand, the Mantel test between geneticdistances and groups (R2 = 0.40) as well as the partialMantel test between these two variables controllingfor log geographical distances (R2 = 0.33) showed sig-nificant correlations (P < 0.001).
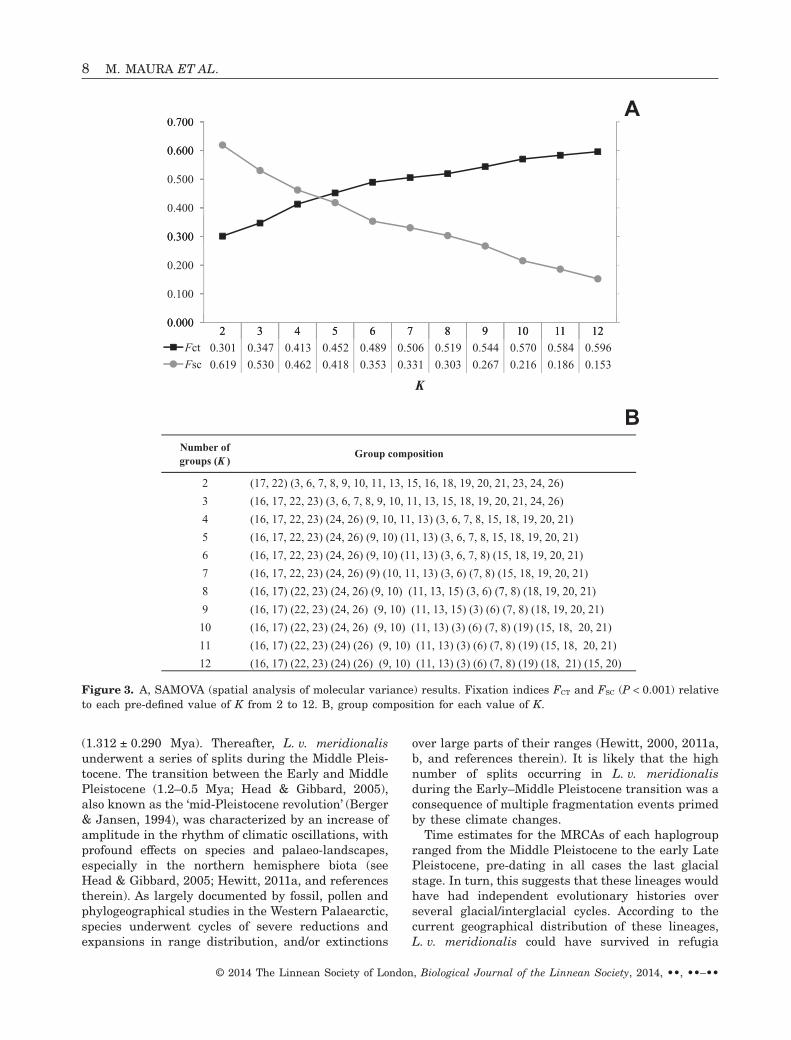
Results from mismatch distribution analyses andvalues of the demographic summary statistics forthe five haplogroups tested are reported in Figure 4.The observed mismatch distributions for all thehaplogroups were not significantly different from those
expected from a pure demographic and spatial expan-sion (Fig. 4). For M7, M9 and M1 the spatial expansionmodel fitted better than the pure demographic expan-sion model, whilst for M3 the reverse was observed.FS and R2 values were not statistically significant in allthe haplogroups, the only exception being M3 wherea small and statistically significant R2 value wasestimated (R2 = 0.0795; P < 0.01).
DISCUSSION
The phylogeographical pattern shown by L. v.meridionalis is unprecedented among co-distributedtaxa, especially as regards northern Italy. Indeed, thisregion has been identified as an area of postglacial(re)colonization for some species (Canestrelli et al.,
M5
M6
Early Pleistocene Middle PleistoceneLatePleisto-cene
1 01.9 0.51.3 0.9 0.15
M2
M10
M9
M8
M7
M4
M3
M1
L. v. vulgaris
951
760.98
0.92
951
961
961841
751
861
700.90
981
0.99
Figure 2. Chronogram showing the estimates of time to the most recent common ancestors (TMRCAs) for the ten mtDNAlineages of Lissotriton vulgaris meridionalis. The calibration point (1.9) and the ranges of the main historical epochs onthe scale bar are reported in million years. Nodal support values from Bayesian (BA) and maximum-likelihood (ML)phylogenetic analyses are reported in correspondence of the main nodes of the chronogram (above: BA posteriorprobabilities > 0.90; below: ML bootstrap values > 70).
6 M. MAURA ET AL.
© 2014 The Linnean Society of London, Biological Journal of the Linnean Society, 2014, ••, ••–••
2008; Magri, 2008) and as a glacial refugium for otherspecies showing one endemic lineage in this area(Canestrelli et al., 2007, 2012b; Crottini et al., 2007;Canestrelli & Nascetti, 2008; Salvi et al., 2013),although in both cases shallow genetic structureswere usually found. By contrast, we found ten differ-entiated and geographically restricted lineagesmainly distributed in the northern part of Italy,strongly conforming to the expectations under a sce-nario of multiple glacial refugia.
Multiple refugia across Italy have been observed ina growing number of species (Canestrelli et al., 2010,2012a, b; Vega et al., 2010; Hewitt, 2011b; Salvi et al.,2013). Most of these refugia were located in the south-ern part of the species’ range, from where postglacial(re)colonizations of northern environments wouldhave occurred (e.g. Bombina pachypus, Rana italica,Talpa romana, Fagus sylvatica; Canestrelli et al.,2006, 2008, 2010; Magri, 2008). However, our datacan firmly discard this latter scenario of southernrefugia and postglacial northward expansion forL. v. meridionalis. The topology of the phylogeneticnetwork, with haplogroups occupying terminal posi-tions and intermediate missing nodes, did not supporta derivation of one haplogroup from another. Thisresult, together with the estimated divergence timesamong haplogroups and their geographical distribu-tion in close contiguity, definitely refutes the hypoth-esis of a recent (re)colonization of a part of thesubspecies range from refugial areas located else-where (e.g. from southern refugia to northern areas).Furthermore, the occurrence of closely related line-ages around the subspecies range (i.e. the nominalsubspecies L. v. vulgaris in the north/north-east of theAlpine arch and the closely related species L. italicusin southern Italy) also does not support a scenario ofrecent (re)colonization from neighbouring areas out ofits current range.
The close geographical contiguity among haplo-groups and their co-occurrence in such areas of con-tiguity (Fig. 1B) suggest recent secondary contactsamong lineages after short-distance expansions.However, a larger sample size as well as the analysisof both nuclear and mitochondrial genetic diversityare necessary to achieve firm conclusions on thedemographic history of these lineages.
The genetic variance observed within L. v.meridionalis populations and its geographical distri-bution were mainly explained by genetic differentia-tion among haplogroups rather than by a pattern ofisolation-by-distance; this suggests that historical iso-lation has probably played a major role in shapingL. v. meridionalis’ genetic structure, relative tomore recent micro-evolutionary processes. The mostancient of these divergences was roughly estimated tohave occurred during the late Early PleistoceneT
able
2.A
vera
gege
net
icdi
verg
ence
amon
g(b
elow
the
diag
onal
)an
dw
ith
in(a
lon
gth
edi
agon
al)
hap
logr
oups
base
don
Tam
ura
&N
ei(1
993)
dist
ance
s;st
anda
rdde
viat
ion
s(1
000
boot
stra
pre
plic
ates
)ar
ere
port
edin
pare
nth
eses
M1
M2
M3
M4
M5
M6
M7
M8
M9
M10
M1
0.00
4(0
.001
)M
20.
018
(0.0
05)
–M
30.
014
(0.0
03)
0.01
7(0
.004
)0.
002
(0.0
01)
M4
0.01
5(0
.004
)0.
017
(0.0
04)
0.00
7(0
.002
)0.
003
(0.0
01)
M5
0.01
6(0
.004
)0.
022
(0.0
05)
0.00
9(0
.002
)0.
009
(0.0
03)
0.00
4(0
.001
)M
60.
016
(0.0
04)
0.02
(0.0
05)
0.00
8(0
.002
)0.
008
(0.0
02)
0.01
(0.0
03)
0.00
2(0
.001
)M
70.
014
(0.0
04)
0.01
7(0
.004
)0.
01(0
.003
)0.
011
(0.0
03)
0.01
4(0
.004
)0.
012
(0.0
03)
0.00
2(0
.001
)M
80.
013
(0.0
04)
0.01
7(0
.005
)0.
011
(0.0
03)
0.01
2(0
.003
)0.
014
(0.0
04)
0.01
3(0
.003
)0.
011
(0.0
03)
0.00
1(0
.001
)M
90.
012
(0.0
03)
0.01
8(0
.005
)0.
012
(0.0
03)
0.01
3(0
.004
)0.
015
(0.0
04)
0.01
4(0
.004
)0.
012
(0.0
04)
0.00
8(0
.002
)0.
001
(0.0
01)
M10
0.01
2(0
.003
)0.
02(0
.006
)0.
014
(0.0
03)
0.01
4(0
.004
)0.
015
(0.0
04)
0.01
6(0
.004
)0.
014
(0.0
04)
0.00
9(0
.003
)0.
007
(0.0
02)
–
PHYLOGEOGRAPHY OF L. VULGARIS MERIDIONALIS 7
© 2014 The Linnean Society of London, Biological Journal of the Linnean Society, 2014, ••, ••–••
(1.312 ± 0.290 Mya). Thereafter, L. v. meridionalisunderwent a series of splits during the Middle Pleis-tocene. The transition between the Early and MiddlePleistocene (1.2–0.5 Mya; Head & Gibbard, 2005),also known as the ‘mid-Pleistocene revolution’ (Berger& Jansen, 1994), was characterized by an increase ofamplitude in the rhythm of climatic oscillations, withprofound effects on species and palaeo-landscapes,especially in the northern hemisphere biota (seeHead & Gibbard, 2005; Hewitt, 2011a, and referencestherein). As largely documented by fossil, pollen andphylogeographical studies in the Western Palaearctic,species underwent cycles of severe reductions andexpansions in range distribution, and/or extinctions
over large parts of their ranges (Hewitt, 2000, 2011a,b, and references therein). It is likely that the highnumber of splits occurring in L. v. meridionalisduring the Early–Middle Pleistocene transition was aconsequence of multiple fragmentation events primedby these climate changes.
Time estimates for the MRCAs of each haplogroupranged from the Middle Pleistocene to the early LatePleistocene, pre-dating in all cases the last glacialstage. In turn, this suggests that these lineages wouldhave had independent evolutionary histories overseveral glacial/interglacial cycles. According to thecurrent geographical distribution of these lineages,L. v. meridionalis could have survived in refugia
A0.600
0.700
0.600
0.700
0.300
0.400
0.500
0.600
0.700
0.300
0.400
0.500
0.600
0.700
0.000
0.100
0.200
0.300
0.000
0.100
0.200
0.300
2 3 4 5 6 7 8 9 10 11 12
BK
0.0000.0002 3 4 5 6 7 8 9 10 11 12
Fct 0.301 0.347 0.413 0.452 0.489 0.506 0.519 0.544 0.570 0.584 0.596
Fsc 0.619 0.530 0.462 0.418 0.353 0.331 0.303 0.267 0.216 0.186 0.153
Number of groups (K )
2
Group composition
(17, 22) (3, 6, 7, 8, 9, 10, 11, 13, 15, 16, 18, 19, 20, 21, 23, 24, 26)
3
4
5
6
7
8 (16 17) (22 23) (24 26) (9 10) (11 13 15) (3 6) (7 8) (18 19 20 21)
(16, 17, 22, 23) (3, 6, 7, 8, 9, 10, 11, 13, 15, 18, 19, 20, 21, 24, 26)
(16, 17, 22, 23) (24, 26) (9, 10, 11, 13) (3, 6, 7, 8, 15, 18, 19, 20, 21)
(16, 17, 22, 23) (24, 26) (9, 10) (11, 13) (3, 6, 7, 8, 15, 18, 19, 20, 21)
(16, 17, 22, 23) (24, 26) (9, 10) (11, 13) (3, 6, 7, 8) (15, 18, 19, 20, 21)
(16, 17, 22, 23) (24, 26) (9) (10, 11, 13) (3, 6) (7, 8) (15, 18, 19, 20, 21)
8
9
10
11
12
(16, 17) (22, 23) (24, 26) (9, 10) (11, 13, 15) (3, 6) (7, 8) (18, 19, 20, 21)
(16, 17) (22, 23) (24, 26) (9, 10) (11, 13, 15) (3) (6) (7, 8) (18, 19, 20, 21)
(16, 17) (22, 23) (24, 26) (9, 10) (11, 13) (3) (6) (7, 8) (19) (15, 18, 20, 21)
(16, 17) (22, 23) (24) (26) (9, 10) (11, 13) (3) (6) (7, 8) (19) (15, 18, 20, 21)
(16, 17) (22, 23) (24) (26) (9, 10) (11, 13) (3) (6) (7, 8) (19) (18, 21) (15, 20)
Figure 3. A, SAMOVA (spatial analysis of molecular variance) results. Fixation indices FCT and FSC (P < 0.001) relativeto each pre-defined value of K from 2 to 12. B, group composition for each value of K.
8 M. MAURA ET AL.
© 2014 The Linnean Society of London, Biological Journal of the Linnean Society, 2014, ••, ••–••
00.020.040.060.080.10.120.140.160.18
0 1 2 3 4 5 6 7 8 9
M3 Fs = -2.650R2 = 0.0795**SSDDE = 0.0045SSDDS = 0.0050
M7 Fs = -0.465R2 = 0.1459SSDDE = 0.0373SSDDS = 0.0243
0
0.05
0.1
0.15
0.2
0.25
0.3
0.35
0 1 2 3 4 5 6
0
0.05
0.1
0.15
0.2
0.25
0.3
0.35
0 1 2 3 4 5 6
M8 Fs = -2.163R2 = 0.1225SSDDE = 0.0025SSDDS = 0.0025
0
0.05
0.1
0.15
0.2
0.25
0.3
0 1 2 3 4 5 6
M9 Fs = -0.733R2 = 0.1514SSDDE = 0.0036SSDDS = 0.0025
00.020.040.060.080.10.120.140.160.180.2
0 1 2 3 4 5 6 7 8 9 10
M1 Fs = -0.342R2 = 0.1219SSDDE = 0.0169SSDDS = 0.0157
Figure 4. Mismatch distribution analyses and values of the demographic summary statistics for M1, M3, M7, M8 andM9 haplogroups (N > 9) identified by phylogenetic and SAMOVA analyses. Bars (coloured according to Figs 1A and 2)show the observed distributions of pairwise nucleotide differences; ▲ with a solid line shows the expected distributionunder a model of a pure demographic expansion; □ with a dotted line shows the expected distribution under a model ofspatial expansion. SSD, sum of square deviations for the goodness-of-fit between the observed mismatch distribution andthe mismatch distribution expected under both a pure demographic expansion (SSDDE) and a spatial expansion model(SSDSE). FS, Fu’s statistic. R2, Ramos-Onsin and Roza’s test (P < 0.01).
PHYLOGEOGRAPHY OF L. VULGARIS MERIDIONALIS 9
© 2014 The Linnean Society of London, Biological Journal of the Linnean Society, 2014, ••, ••–••
located in central Italy (M1, M3 and M7) and espe-cially in northern Italy (M2, M4–M6, M8–M10).
During the last glacial periods, particularly theLast Glacial Maximum (LGM), the Alpine glaciersreached the lowland edges of the Po and Venetianplains (Orombelli, Tanzi & Ravazzi, 2004; Hughes &Woodward, 2008). The northern lowlands were domi-nated by a steppe vegetation (i.e. Poaceae, Artemisiaand Chenopodiaceae), with colder and more aridclimate conditions than at present (Cremaschi,1992; Elenga et al., 2000; Prentice et al., 2000; Miolaet al., 2003; Mozzi et al., 2003). Furthermore,palaeogeographical, palaeobotanic and palaeoclimaticstudies provided evidence for less uniform climaticand vegetation patterns throughout this area, pin-pointing a gradient of increasing moisture availabilityfrom west to east in the Alpine forelands, and fromnorth to south in the Venetian plain (Florineth &Schlüchter, 2000; Ravazzi et al., 2004). Wet environ-ments have been identified in the southern and distalportion of the Venetian plain (Miola et al., 2006;Fontana, Mozzi & Bondesan, 2008) as well as in thewestern Po plain (Tropeano & Cerchio, 1984). Moreo-ver, reduced stands of coniferous trees (i.e. Pinussylvestris, P. mugo, Picea abies and Larix decidua)and even temperate trees (i.e. Corylus avellana,Quercus deciduous, Tilia spp., Ulmus spp., Fraxinusexcelsior, Carpinus spp., Abies alba and Fagussylvatica) would have survived during the LGM innorth-eastern Italy and in the central Po plain insmall, environmentally favourable sites (Monegatoet al., 2007; Amorosi et al., 2008; Kaltenriederet al., 2009; Pini, Ravazzi & Donegana, 2009;Monegato et al., 2011; Ravazzi et al., 2012). Thispalaeoenvironmental scenario for northern Italy, withscattered pockets of (micro)environmentally suitablehabitats dispersed in a matrix of unsuitable environ-ments for temperate species, echoes the well-knownpattern of northern ‘cryptic’ refugia previously discov-ered in central-eastern and northern Europe (Stewart& Lister, 2001; Willis & van Andel, 2004; Stewartet al., 2010; Schmitt & Varga, 2012). Such a scenarioof glacial survival in several refugia located in dis-tinct humid areas throughout the Po and Venetianplains (e.g. the foothills of the glaciated Alps) appearsparticularly suitable for an amphibian such as L. v.meridionalis, strictly linked to freshwater habitats forits reproduction, with phylopatric habits and with lowdispersal abilities (Smith & Green, 2005; Razzetti,Lapini & Bernini, 2007).
The long-term persistence of temperate species in arefugium in northern Italy has been suggested formany amphibians and reptiles, based on the occur-rence of one divergent phylogeographical lineageendemic to this region (e.g. Hyla intermedia, Pelobatesfuscus, Pelophylax lessonae, Triturus carnifex,
Podarcis muralis; Canestrelli et al., 2007, 2012b;Crottini et al., 2007; Canestrelli & Nascetti, 2008;Salvi et al., 2013). A precise identification of the geo-graphical location of these putative refugia is notachievable with the genetic and fossil data to dateavailable for these organisms. However, the occurrenceof several lineages of L. v. meridionalis endemic torestricted areas in the west (M9), north-west (M2) andnorth-east (M4 and M5) of Italy may provide a clue forfurther phylogeographical and palaeoenvironmentalstudies aimed to identify and characterize putativeglacial refugia in these areas.
Finally, the deep phylogeographical structurefound in L. v. meridionalis mirrors the patternsfound within other lineages of L. vulgaris (e.g. L. v.vulgaris and L. v. graecus; Babik et al., 2005) as wellas in other small body newts, such as L. italicus(Canestrelli et al., 2012a), endemic to southern Italy,and L. boscai (Martínez-Solano et al., 2006), endemicto the Iberian Peninsula. Thus, it seems that thesenewts have been particularly prone to retain thegenetic imprints of Pleistocene climatic oscillations,providing very useful models for microevolutionaryand phylogeographical studies. However, note thatthe phylogeographical inferences made in thesestudies, including ours, are based on mtDNA dataalone, which may have some limitations (Ballard &Whitlock, 2004; Toews & Brelsford, 2012; but see alsoZink & Barrowclough, 2008). In our study we cansafely rule out the most common of these drawbacks,such as the occurrence of sex-biased dispersal ofL. v. meridionalis (see, for example, Kovar et al.,2009) or the presence of pseudogenes (see Methods).On the other hand, we cannot rule out the hypothesisthat some forms of selection may have biased themitochondrial phylogeographical pattern of L. v.meridionalis, although these processes have beenreported in a minor number of phylogeographicalstudies (Toews & Brelsford, 2012). Further studiesusing a wide range of nuclear loci and additionalsamples in areas of contact between lineages arecurrently in progress to investigate this issue indetail.
In conclusion, our study indicates that sincethe Early Pleistocene the Italian smooth newt L. v.meridionalis has persisted throughout severalglacial–interglacial cycles in the northern part of itsrange, undergoing events of multiple fragmentationinto separate refugia. On the whole, this unprec-edented scenario further extends the array ofresponses of Italian temperate species to the Pleisto-cene climatic oscillations, and suggests that we arestill far from a full appreciation of how the currentItalian biota has been assembled. Finally, furtherstudies on multiple species in peri-montane areas ofthe Alpine arch and northern Apennines are particu-
10 M. MAURA ET AL.
© 2014 The Linnean Society of London, Biological Journal of the Linnean Society, 2014, ••, ••–••
larly needed for an appraisal of the temporal andspatial scales at which northern Mediterraneanrefugia have taken place.
ACKNOWLEDGEMENTS
We are grateful to Alessandra Perilli for help in thelaboratory, to Catarina Pinho, Iñigo Martínez-Solanoand Giovanni Monegato for discussions on an earlydraft of the manuscript, and four anonymousreviewers for their helpful comments. We thankAlessio Capoccia, Anna Loy, David Fiacchini, EdoardoRazzetti, Lucio Bonato, Francesco Ficetola, NikiMorganti, Francesco P. Caputo, Paolo Cipriani,Daniela Lucente and Valeria Pasqualini for help withsample collection. We also thank Martin Bennett forhis review of the English text. Newts were capturedunder permits from the Italian Ministry of Environ-ment (DPN-2009-0005106). This study was fundedby the Agenzia Regionale dei Parchi (ARP-Lazio),by the PRIN projects 20085YJMTC (to M.A.B.)and 2012FRHYRA (to D.C.) from the ‘Ministerodell’Istruzione, dell’Università e della Ricerca’ (MIUR,Italy). D.S. was supported by a post-doctoral grant(SFRH/BPD/66592/2009) of the Fundação para aCiência e Tecnologia (FCT, Portugal) under thePrograma Operacional Potencial Humano (funds fromthe European Social Fund and Portuguese Ministérioda Educação e Ciência) and by the project ‘Genomicsand Evolutionary Biology’ cofinanced by North Portu-gal Regional Operational Programme 2007/2013ON.2-O Novo Norte (European Regional DevelopmentFund).
REFERENCES
Akaike H. 1973. Information theory and an extension of themaximum likelihood principle. In: Petrov BN, Csaki F, eds.Second international symposium on information theory.Budapest: Akademiai Kiado, 267–281.
Amorosi A, Dinelli E, Rossi V, Vaiani SC, Sacchetto M.2008. Late Quaternary palaeoenvironmental evolution ofthe Adriatic coastal plain and the onset of Po River Delta.Palaeogeography, Palaeoclimatology, Palaeoecology 268:80–90.
Arévalo E, Davis SK, Sites JW. 1994. Mitochondrial DNAsequence divergence and phylogenetic relationships amongeight chromosome races of the Sceloporus grammicuscomplex (Phrynosomatidae) in central Mexico. SystematicBiology 43: 387–418.
Babik W, Branicki W, Crnobrnja–Isaloviç J. 2005.Phylogeography of two European newt species – discordancebetween mtDNA and morphology. Molecular Ecology 14:2475–2491.
Ballard JWO, Whitlock MC. 2004. The incomplete naturalhistory of mitochondria. Molecular Ecology 13: 729–744.
Bandelt HL, Forster P, Röhl A. 1999. Median–joining net-works for inferring intraspecific phylogenies. MolecularBiology and Evolution 16: 37–48.
Berger WH, Jansen E. 1994. Mid-Pleistocene climate shift:the Nansen connection. In: Johannessen OM, Muerch RD,Overland JE, eds. The polar oceans and their role in shapingthe global environment. AGU Geophysical Monograph 85:295–311.
Bisconti R, Canestrelli D, Colangelo P, Nascetti G. 2011.Multiple lines of evidence for demographic and range expan-sion of a temperate species (Hyla sarda) during the lastglaciation. Molecular Ecology 20: 5313–5327.
Canestrelli D, Aloise G, Cecchetti S, Nascetti G.2010. Birth of a hotspot of intraspecific genetic diversity:notes from the underground. Molecular Ecology 9: 5432–5451.
Canestrelli D, Cimmaruta R, Costantini V, Nascetti G.2006. Genetic diversity and phylogeography of the Apennineyellow-bellied toad Bombina pachypus, with implications forconservation. Molecular Ecology 15: 3741–3754.
Canestrelli D, Cimmaruta R, Nascetti G. 2007.Phylogeography and historical demography of the Italiantreefrog Hyla intermedia reveals multiple refugia, popula-tion expansions and secondary contacts within peninsularItaly. Molecular Ecology 16: 4808–4821.
Canestrelli D, Cimmaruta R, Nascetti G. 2008. Popula-tion genetic structure and diversity of the Apennineendemicstream frog, Rana italica – insights on the Pleisto-cene evolutionary history of the Italian peninsular biota.Molecular Ecology 17: 3856–3872.
Canestrelli D, Nascetti G. 2008. Phylogeography of the poolfrog Rana (Pelophylax) lessonae in the Italian peninsula andSicily: multiple refugia, glacial expansions and nuclear–mitochondrial discordance. Journal of Biogeography 35:1923–1936.
Canestrelli D, Sacco F, Nascetti G. 2012a. On glacialrefugia, genetic diversity and microevolutionary processes:deep phylogeographic structure in the endemic newtLissotriton italicus. Biological Journal of the LinneanSociety 105: 42–55.
Canestrelli D, Salvi D, Maura M, Bologna MA, NascettiG. 2012b. One species, three Pleistocene evolutionary his-tories: phylogeography of the Italian crested newt, Trituruscarnifex. PLoS ONE 7: e41754.
Cassens I, Mardulyn P, Milinkovitch M. 2005. Evaluatingintraspecific ‘network’ construction methods using simu-lated sequence data: do existing algorithms outperform theglobal maximum parsimony approach? Systematic Biology54: 363–372.
Clement M, Posada D, Crandall KA. 2000. Tcs: a computerprogram to estimate gene genealogies. Molecular Ecology 9:1657–1660.
Cremaschi M. 1992. I mutamenti del clima nel Quaternario:le linee generali. La penisola italiana nel Quaternario:aspetti geologici e geoarcheologici. In: Guidi A, Piperno M,eds. Italia Preistorica. Bari: Editori Laterza, 4–58.
Crottini A, Andreone F, Kosuch J, Borkin LJ, LitvinchukSN, Eggert C, Veith M. 2007. Fossorial but widespread: the
PHYLOGEOGRAPHY OF L. VULGARIS MERIDIONALIS 11
© 2014 The Linnean Society of London, Biological Journal of the Linnean Society, 2014, ••, ••–••

phylogeography of the common spadefoot toad (Pelobatesfuscus), and the role of the Po Valley as a major source ofgenetic variability. Molecular Ecology 16: 2734–2754.
Doyle JJ, Doyle JL. 1987. A rapid DNA isolation procedurefor small quantities of fresh leaf tissue. Phytochemical Bul-letin 19: 11–15.
Dupanloup I, Schneider S, Excoffier L. 2002. A simulatedannealing approach to define the genetic structure of popu-lations. Molecular Ecology 11: 2571–2581.
Elenga H, Peyron O, Bonnefille R, Jolly D, Cheddadi R,Guiot J, Andrieu V, Bottema S, Buchet G, de BeaulieuJL, Hamilton AC, Maley J, Marchant R, Perez-ObiolR, Reille M, Riollet G, Scott L, Straka H, Taylor D,VanCampo E, Vincens A, Laarif F, Jonson H. 2000.Pollen-based biome reconstruction for southern Europe andAfrica 18,000 yr BP. Journal of Biogeography 27: 621–634.
Ersts PJ. 2012. Geographic distance matrix generator, version1.2.3. Available at: http://biodiversityinformatics.amnh.org/open_source/gdmg
Excoffier L. 2004. Patterns of DNA sequence diversity andgenetic structure after a range expansion: lessons from theinfinite-island model. Molecular Ecology 13: 853–864.
Excoffier LG, Laval G, Schneider S. 2005. Arlequin(version 3.0): an integrated software package for populationgenetics data analysis. Evolutionary Bioinformatics Online1: 47–50.
Florineth D, Schlüchter C. 2000. Alpine evidence foratmospheric circulation patterns in Europe during the LastGlacial Maximum. Quaternary Research 54: 294–308.
Fontana A, Mozzi P, Bondesan A. 2008. Alluvial megafansin the Veneto-Friuli Plain: evidence of aggrading anderosive phases during Late Pleistocene and Holocene. Qua-ternary International 189: 71–89.
Fu YX. 1997. Statistical tests of neutrality of mutationsagainst population growth, hitchhiking and backgroundselection. Genetics 147: 915–925.
Gómez A, Lunt DH. 2007. Refugia within refugia: patternsof phylogeographic concordance in the Iberian Peninsula.In: Weiss S, Ferrand N, eds. Phylogeography in southernEuropean refugia: evolutionary perspectives on the originsand conservation of European biodiversity. Dordrecht:Springer, 155–188.
Guindon S, Dufayard JF, Lefort V, Anisimova M,Hordijk W, Gascuel O. 2010. New algorithms andmethods to estimate maximum-likelihood phylogenies:assessing the performance of PhyML 30. Systematic Biology59: 307–321.
Habel JC, Schmitt T, Müller P. 2005. The fourth paradigmpattern of postglacial range expansion of European terres-trial species: the phylogeography of the Marbled Whitebutterfly (Satyrinae, Lepidoptera). Journal of Biogeography32: 1489–1497.
Head MJ, Gibbard PL. 2005. Early–middle Pleistocene tran-sitions: the land–ocean evidence. London: Geological Society,Special Publications.
Hewitt GM. 1999. Postglacial re-colonization of Europeanbiota. Biological Journal of the Linnean Society 68:78–112.
Hewitt GM. 2000. The genetic legacy of the Quaternary iceages. Nature 405: 907–913.
Hewitt GM. 2011a. Quaternary phylogeography: the roots tohybrid zones. Genetica 139: 617–638.
Hewitt GM. 2011b. Mediterranean peninsulas – the evolu-tion of hotspots. In: Zachos FE, Habel JC, eds. Biodiversityhotspots. Heidelberg: Springer, 123–147.
Hughes PD, Woodward JC. 2008. Timing of glaciation inthe Mediterranean mountains during the last cold stage.Journal of Quaternary Science 23: 575–588.
Jensen JL, Bohonak AJ, Kelley ST. 2005. Isolation bydistance, web service. BMC Genetics 6: 13.
Kaltenrieder P, Belis CA, Hofstetter S, Ammann B,Ravazzi C, Tinner W. 2009. Environmental and climaticconditions at a potential glacial refugial site of tree speciesnear the Southern Alpine glaciers. New insights frommultiproxy sedimentary studies at Lago della Costa(Euganean Hills, Northeastern Italy). Quaternary ScienceReviews 28: 2647–2662.
Kovar R, Brabec M, Vita R, Bocek R. 2009. Spring migra-tion distances of some Central European amphibian species.Amphibia-Reptilia 30: 367–378.
Krystufek B, Buzan EV, Hutchinson WF, Hänfling B.2007. Phylogeography of the rare Balkan endemic Martino’svole, Dinaromys bogdanovi, reveals strong differentiationwithin the western Balkan Peninsula. Molecular Ecology16: 1221–1232.
Larkin MA, Blackshields G, Brown NP, Chenna R,McGettiga PA, McWilliam H, Valentin F, Wallace IM,Wilm A, Lopez R, Thompson JD, Gibson TJ, HigginsDG. 2007. Clustal W and Clustal X version 20.Bioinformatics 23: 2947–2948.
Librado P, Rozas J. 2009. DnaSP v5: a software forcomprehensive analysis of DNA polymorphism data.Bioinformatics 25: 1451–1452.
Magri D. 2008. Patterns of post-glacial spread and the extentof glacial refugia of European beech (Fagus sylvatica).Journal of Biogeography 35: 450–463.
Martínez-Solano I, Teixeira J, Buckley D, García-ParísM. 2006. Mitochondrial DNA phylogeography of Lissotritonboscai (Caudata, Salamandridae): evidence for old, multiplerefugia in an Iberian endemic. Molecular Ecology 15: 3375–3388.
Miola A, Albanese D, Valentini G, Corain L. 2003. Pollendata for a biostratigraphy of LGM in the Venetian Po Plain.Il Quaternario 16: 21–26.
Miola A, Bondesan A, Corain L, Favaretto S, Mozzi P,Piovan S, Sostizzo I. 2006. Wetlands in the Venetian PoPlain (northeastern Italy) during the Last GlacialMaximum: interplay between vegetation, hydrology andsedimentary environment. Review of Palaeobotany andPalynology 141: 53–81.
Monegato G, Monegato I, Pini R, Ravazzi C, Reimer PJ,Wick L. 2011. Correlating Alpine glaciation with Adriaticsea-level changes through lake and alluvial stratigraphy.Journal of Quaternary Science 26: 791–804.
Monegato G, Ravazzi C, Donegana M, Pini R, CalderoniG, Wick L. 2007. Evidence of a twofold glacial advance
12 M. MAURA ET AL.
© 2014 The Linnean Society of London, Biological Journal of the Linnean Society, 2014, ••, ••–••
during the Last Glacial Maximum in the Tagliamento endmoraine system (eastern Alps). Quaternary Research 68:284–302.
Mozzi P, Bini C, Zilocchi L, Becattini R, Mariotti LippiM. 2003. Stratigraphy, palaeopedology and palynology ofLate Pleistocene and Holocene deposits in the landwardsector of the lagoon of Venice (Italy), in relation to theCaranto level. Il Quaternario – Italian Journal of Quater-nary Sciences 16: 193–210.
Orombelli G, Tanzi G, Ravazzi C. 2004. Glacier extent overthe Italian Alps during the LGM. In: Antonioli F, Vai GB,eds. CLIMEX litho-palaeoenvironmental maps of Italyduring the last two climatic extremes: explanatory notes.Bologna: Museo Geologico G. Cappellini, 23–24.
Pini R, Ravazzi C, Donegana M. 2009. Pollen stratigraphy,vegetation and climate history of the last 215 ka in theAzzano Decimo core (plain of Friuli, north-eastern Italy).Quaternary Science Reviews 28: 1268–1290.
Porretta D, Canestrelli D, Urbanelli S, Bellini R,Schaffner F, Petric D, Nascetti G. 2011. Southern cross-roads of the Western Palaearctic during the Late Pleisto-cene and their imprints on current patterns of geneticdiversity: insights from the mosquito Aedes caspius. Journalof Biogeography 38: 20–30.
Posada D. 2003. Using Modeltest and PAUP to select a modelof nucleotide substitution. In: Baxevanis AD, Davison DB,Page RDM, Petsko GA, Stein LD, Stormo GD, eds.Current protocols in bioinformatics. New York: Wiley, 6.5.1–6.5.14.
Posada D. 2008. jModelTest: phylogenetic model averaging.Molecular Biology and Evolution 25: 1253–1256.
Prentice IC, Jolly D, BIOME 6000 participants. 2000.Mid-Holocene and glacial-maximum vegetation geographyof the northern continents and Africa. Journal of Biogeog-raphy 27: 507–519.
Ramos-Onsins SE, Rozas J. 2002. Statistical properties ofnew neutrality tests against population growth. MolecularBiology and Evolution 19: 2092–2100.
Ravazzi C, Deaddis M, De Amicis M, Marchetti M,Vezzoli G, Zanchi A. 2012. The last 40 ka evolution of theCentral Po Plain between the Adda and Serio rivers.Géomorphologie: Relief, Processus, Environnement 2: 131–154.
Ravazzi C, Orombelli G, Tanzi G, CLIMEX Group. 2004.An outline of the flora and vegetation of the Adriatic basin(northern Italy and eastern side of the Apennine) during theLast Glacial Maximum. In: Antonioli F, Vai GB, eds.CLIMEX litho-palaeoenvironmental maps of Italy duringthe last two climatic extremes: explanatory notes. Bologna:Museo Geologico G. Cappellini, 15–19.
Razzetti E, Lapini L, Bernini F. 2007. Lissotriton vulgaris.In: Lanza B, Andreone F, Bologna MA, Corti C, Razzetti E,eds. Fauna d’Italia AMPHIBIA. Bologna: EdizioniCalderini de Il Sole 24 ORE Editoria Specializzata S.r.l.,246–254.
Rogers AR, Harpending HC. 1992. Population growthmakes waves in the distribution of pairwise genetic differ-ences. Molecular Biology and Evolution 9: 552–569.
Ronquist F, Teslenko M, van der Mark P, Ayres D,Darling A, Höhna S, Larget B, Liu L, Suchard MA,Huelsenbeck JP. 2012. MrBayes 3.2: efficient Bayesianphylogenetic inference and model choice across a largemodel space. Systematic Biology 61: 539–542.
Rousset F. 1997. Genetic differentiation and estimation ofgene flow from F-statistics under isolation by distance.Genetics 145: 1219–1228.
Rull V. 2009. Microrefugia. Journal of Biogeography 36:481–484.
Salvi D, Harris DJ, Kaliontzopoulou A, Carretero MA,Pinho C. 2013. Persistence across Pleistocene Ice Agesin Mediterranean and extra-Mediterranean refugia:phylogeographic insights from the common wall lizard.BMC Evolutionary Biology 13: 147.
Salvi D, Schembri PJ, Sciberras A, Harris DJ. 2014.Evolutionary history of the Maltese wall lizard Podarcisfilfolensis: insights on the ‘expansion–contraction’ model ofthe Pleistocene biogeography. Molecular Ecology 23: 1167–1187.
Schmitt T, Habel JC, Zimmermann M, Müller P. 2006.Genetic differentiation of the marbled white butterfly,Melanargia galathea, accounts for glacial distribution pat-terns and postglacial range expansion in southeasternEurope. Molecular Ecology 15: 1889–1901.
Schmitt T, Varga Z. 2012. Extra-Mediterranean refugia: therule and not the exception? Frontiers in Zoology 9: 22.
Schneeweiss GM, Schönswetter P. 2011. A re-appraisal ofnunatak survival in arctic–alpine phylogeography. Molecu-lar Ecology 20: 190–192.
Smith MA, Green DM. 2005. Are all amphibian populationsmetapopulations? Dispersal and the metapopulation para-digm in amphibian ecology. Ecography 28: 110–128.
Stewart JR. 2009. The evolutionary consequence of the indi-vidualistic response to climate change. Journal of Evolu-tionary Biology 22: 2363–2375.
Stewart JR, Lister AM. 2001. Cryptic northern refugia andthe origins of modern biota. Trends in Ecology & Evolution16: 608–613.
Stewart JR, Lister AM, Barnes I, Dalén L. 2010. Refugiarevisited: individualistic responses of species in space andtime. Proceedings of the Royal Society B 77: 661–671.
Tamura K, Nei M. 1993. Estimation of the numberof nucleotide substitutions in the control region ofmitochondrial DNA in humans and chimpanzees. MolecularBiology and Evolution 10: 512–526.
Tamura K, Peterson D, Peterson N, Stecher G, Nei M,Kumar S. 2011. MEGA5: molecular evolutionary geneticsanalysis using maximum likelihood, evolutionary distance,and maximum parsimony methods. Molecular Biology andEvolution 28: 2731–2739.
Toews DPL, Brelsford A. 2012. The biogeography ofmitochondrial and nuclear discordance in animals. Molecu-lar Ecology 21: 3907–3930.
Tropeano D, Cerchio E. 1984. L’orizzonte torboso würmianonel sottosuolo della pianura piemontese meridionale.Osservazioni preliminari. Bollettino dell’AssociazioneMineraria Subalpina 21: 199–221.
PHYLOGEOGRAPHY OF L. VULGARIS MERIDIONALIS 13
© 2014 The Linnean Society of London, Biological Journal of the Linnean Society, 2014, ••, ••–••
Vega R, Amori G, Aloise G, Cellini S, Loy A, Searle JB.2010. Genetic and morphological variation in a Mediterra-nean glacial refugium: evidence from Italian pygmy shrews,Sorex minutus (Mammalia: Soricomorpha). BiologicalJournal of the Linnean Society 100: 774–787.
Willis KJ, van Andel TH. 2004. Trees or no trees? Theenvironments of central and eastern Europe during the LastGlaciation. Quaternary Science Reviews 23: 2369–2387.
Xia X, Xie Z. 2001. DAMBE: data analysis in molecularbiology and evolution. Journal of Heredity 92: 371–373.
Xia X, Yang Q. 2011. A distance-based least-square methodfor dating speciation events. Molecular Phylogenetics andEvolution 59: 342–353.
Zink RM, Barrowclough GF. 2008. Mitochondrial DNAunder siege in avian phylogeography. Molecular Ecology 17:2107–2121.
SUPPORTING INFORMATION
Additional Supporting Information may be found in the online version of this article at the publisher’s web-site:
Figure S1. Phylogenetic relationships among the 49 haplotypes found in Lissotriton vulgaris meridionalisbased on Bayesian inference (BA) and maximum likelihood (ML) analyses. Bayesian posterior probabilities(> 0.90) are given above the nodes of the BA tree; bootstrap values (> 70) for ML are given below the nodes.Table S1. Times to the most recent common ancestor (TMRCA) of clades within Lissotriton vulgarismeridionalis (in Myr) estimated in DAMBE. Standard deviations are shown in parenthesis.
14 M. MAURA ET AL.
© 2014 The Linnean Society of London, Biological Journal of the Linnean Society, 2014, ••, ••–••