ANCIENT TEPUI SUMMITS HARBOR YOUNG RATHER THAN OLD LINEAGES OF ENDEMIC FROGS
Auditory Deficit as a Consequence Rather thanEndophenotype of Specific Language Impairment:Electrophysiological EvidenceD. V. M. Bishop*, Mervyn J. Hardiman, Johanna G. Barry¤
Department of Experimental Psychology, University of Oxford, Oxford, Unit
Abstract
Background: Are developmental language disorders caused by poor auditory discrimination? This is a popular theory, butbehavioural evidence has been inconclusive. Here we studied children with specific language impairment, measuring thebrain’s electrophysiological response to sounds in a passive paradigm. We focused on the T-complex, an event-related peakthat has different origins and developmental course from the well-known vertex response.
Methods: We analysed auditory event-related potentials to tones and syllables from 16 children and 16 adolescents withspecific language impairment who were compared with 32 typically-developing controls, matched for gender, IQ and age.
Results: We replicated prior findings of significant reduction in Ta amplitude for both children and adolescents with specificlanguage impairment, which was particularly marked for syllables. The topography of the T-complex to syllables indicated aless focal response in those with language impairments. To distinguish causal models, we considered correlations betweensize of the Ta response and measures of language and literacy in parents as well as children. The best-fitting model was onein which auditory deficit was a consequence rather than a cause of difficulties in phonological processing.
Conclusions: The T-complex to syllables has abnormal size and topography in children with specific language impairment,but this is more likely to be a consequence rather than a cause of difficulties in phonological processing.
Citation: Bishop DVM, Hardiman MJ, Barry JG (2012) Auditory Deficit as a Consequence Rather than Endophenotype of Specific Language Impairment:Electrophysiological Evidence. PLoS ONE 7(5): e35851. doi:10.1371/journal.pone.0035851
Editor: Sam Gilbert, University College London, United Kingdom
Received January 20, 2012; Accepted March 23, 2012; Published May 9, 2012
Copyright: � 2012 Bishop et al. This is an open-access article distributed under the terms of the Creative Commons Attribution License, which permitsunrestricted use, distribution, and reproduction in any medium, provided the original author and source are credited.
Funding: This project was funded by Wellcome Trust Programme Grant 053335 (www.wellcome.ac.uk). The funders had no role in study design, data collectionand analysis, decision to publish, or preparation of the manuscript.
Competing Interests: The authors have declared that no competing interests exist.
* E-mail: [email protected]
¤ Current address: MRC Institute of Hearing Research Nottingham Clinical Section, Eye, Ear Nose & Throat Centre, Queens Medical Centre, Nottingham, UnitedKingdom
Introduction
Specific language impairment (SLI), also known as ‘‘develop-
mental dysphasia’’, is a heritable neurodevelopmental disorder
that is diagnosed when a child has difficulties learning to produce
and/or understand speech for no apparent reason [1]. One
theoretical account of SLI regards oral language difficulties as a
downstream consequence of low-level auditory perceptual
limitations. Although such theories have a long history, debate
continues as to whether SLI is essentially an auditory processing
disorder, and if so, whether the auditory limitations are specific
to speech [2]. Despite some 40 years of research it has been
surprisingly difficult to resolve this issue. In part, this is because
correlational data are poor at distinguishing causal models. All
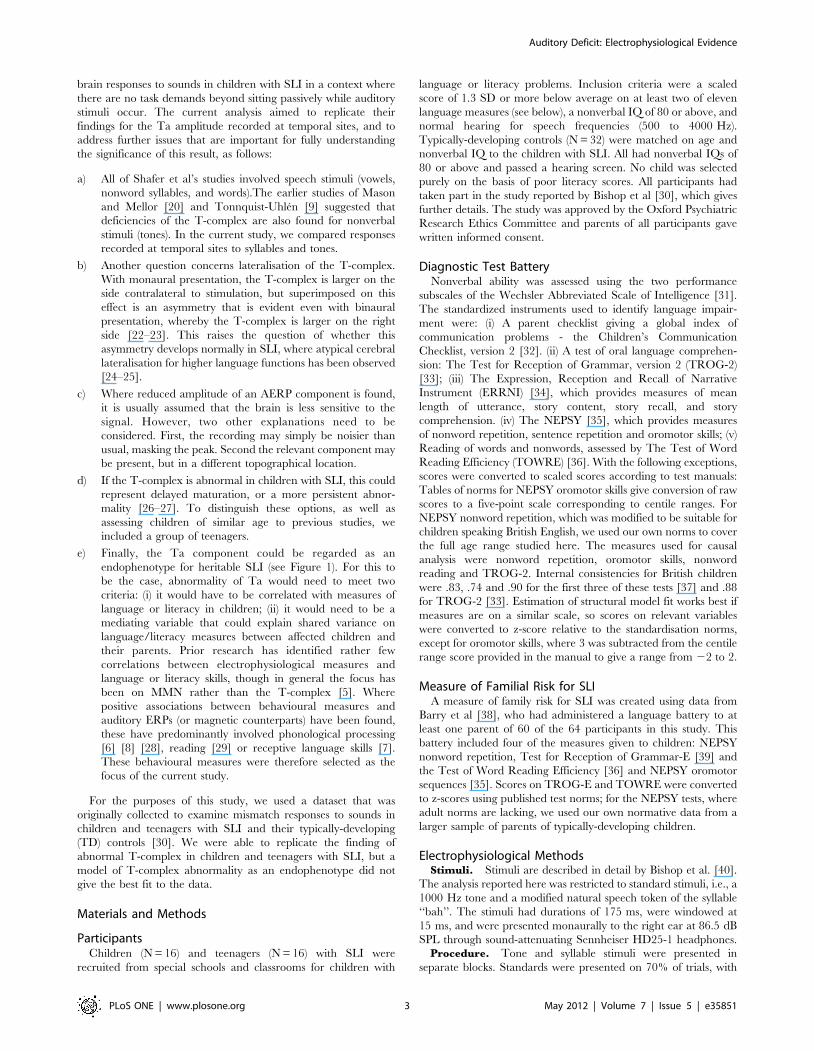
four models shown in Figure 1 predict an association between
auditory deficit and language impairment. The Endophenotype
model is often assumed to be the explanation if a correlation is
found: this regards auditory deficit as a mediating factor between
a genetic risk for SLI and overt language deficits. The Additive
Risks model, on the other hand, regards auditory deficit as an
additional risk factor that moderates a genetic risk for language
impairment [3]. Another possibility is that the two deficits are
independent consequences of a genetic risk variant, as shown in
the Pleiotropy model. Finally, in the Neuroplasticity model,
auditory deficit is the consequence of language impairment, with
brain processing of sounds being affected by poor language skills.
As will be argued below, progress can be made in distinguishing
these causal models if we have measures of parental language as
well as child auditory and language skills.
As well as logical problems, there are methodological difficulties
inherent in this field. It is difficult to get reliable data from children
using psychoacoustic procedures that involve long sequences of
uninteresting stimuli. Electrophysiological methods have been
proposed as an approach that could overcome this problem [4],
but in practice it has been difficult to find solid, replicable effects
that could be the basis for a clinical test [5]. One of the most
popular neurophysiological indicators of auditory discrimination,
the mismatch negativity (MMN) is useful in group comparisons,
but insufficiently reliable or valid for clinical diagnosis of
individuals [6].
PLoS ONE | www.plosone.org 1 May 2012 | Volume 7 | Issue 5 | e35851
ed Kingdom
Recently, attention has shifted from the MMN to measures
based on the auditory event-related potential, obtained by
averaging the waveform from electrodes placed on the scalp
during an interval associated with stimulus presentation [7–10].
Most research has focused on the vertex response, an auditory
event-related potential (AERP) with a distinctive pattern of peaks
and troughs, which is sensitive to age and aspects of stimulus
presentation [11]. AERPs recorded from temporal sites differ from
the vertex response, being generated in secondary auditory cortex,
and lateralised with a right-sided predominance [12–13]. Also, the
T-complex has a different developmental trajectory to the vertex
response as it matures earlier and remains relatively constant in
form from puberty onwards [12–17].
The AERP recorded from temporal sites was first studied in
detail by Wolpaw and Penry [18], who described a series of
negative (,90 ms), positive (,110 ms) and negative (,125 ms)
peaks at temporal sites. They suggested that this was composed of
the vertex N1–P2 complex originating from a wide area of cortex
plus an additional wave in the 80–200 ms range produced within
secondary auditory cortex. In order to reveal the additional wave,
the N1–P2 response at the vertex (electrode Cz) was scaled to, and
subtracted from, that recorded at temporal sites. The resultant
waveform was labelled the T-complex, a positive wave at 105–
110 ms (Ta) followed by a negative deflection at 150–160 ms (Tb).
Subsequent researchers have retained the term T-complex but
have not adopted the approach of subtracting the standardized
vertex response. This seems appropriate given that there is little
correlation between the response recorded at the midline
electrodes and that recorded at temporal sites [13].
The amplitude and shape of the observed waveform at temporal
sites will be influenced by the reference used. Wolpaw and Penry
[18] used a non-cephalic reference, but others have used the nose,
electrode FPz, or average of all electrodes. However, the latter
approach is potentially problematic because of the large impact of
the vertex response on the average, which, if subtracted, can lead
to a waveform that is dominated by an inverted vertex response.
Recently, Shafer et al [19] reanalysed data from a series of ERP
studies, and found differences in the T-complex (recorded with a
nose reference) between children with SLI and matched typically-
developing children. Group differences were most marked for the
Ta positive peak, which occurs around 80–160 ms after the onset
of an auditory signal. Among children with language impairments,
73% had poor T-complex measures, compared with only 13% of
the typically-developing children. Shafer et al noted that this
striking difference is consistent with some much older, neglected
studies. Mason and Mellor [20] first described abnormal responses
to a 1000 Hz tone at temporal sites in children with speech and
language disorders. Their sample of children was not well-
described, with no psychometric data on IQ or language, and this
aspect of their results has not received much attention. Tonnquist-
Uhlen [9] included the T-complex in an extensive study of
auditory event-related potentials in 20 children with severe
language impairments. She found that a substantial minority of
children did not show a Ta component to a 500 Hz tone,
compared with only one of twenty control children. However,
psychometric data were not provided, and the EEG was
pathological in nine of the language-impaired children and
borderline in two. Only two children had a family history of
language impairment. In this regard, the sample was rather
different from that of most English-speaking samples with SLI,
where there is typically high familiality and no obvious neurolog-
ical abnormalities [21].
The results of Shafer et al [19] suggest that the auditory ERP at
temporal sites may be a useful index for documenting abnormal
Figure 1. Causal models of the relationship between auditory deficit, language impairment and family risk for SLI.doi:10.1371/journal.pone.0035851.g001
Auditory Deficit: Electrophysiological Evidence
PLoS ONE | www.plosone.org 2 May 2012 | Volume 7 | Issue 5 | e35851
brain responses to sounds in children with SLI in a context where
there are no task demands beyond sitting passively while auditory
stimuli occur. The current analysis aimed to replicate their
findings for the Ta amplitude recorded at temporal sites, and to
address further issues that are important for fully understanding
the significance of this result, as follows:
a) All of Shafer et al’s studies involved speech stimuli (vowels,
nonword syllables, and words).The earlier studies of Mason
and Mellor [20] and Tonnquist-Uhlen [9] suggested that
deficiencies of the T-complex are also found for nonverbal
stimuli (tones). In the current study, we compared responses
recorded at temporal sites to syllables and tones.
b) Another question concerns lateralisation of the T-complex.
With monaural presentation, the T-complex is larger on the
side contralateral to stimulation, but superimposed on this
effect is an asymmetry that is evident even with binaural
presentation, whereby the T-complex is larger on the right
side [22–23]. This raises the question of whether this
asymmetry develops normally in SLI, where atypical cerebral
lateralisation for higher language functions has been observed
[24–25].
c) Where reduced amplitude of an AERP component is found,
it is usually assumed that the brain is less sensitive to the
signal. However, two other explanations need to be
considered. First, the recording may simply be noisier than
usual, masking the peak. Second the relevant component may
be present, but in a different topographical location.
d) If the T-complex is abnormal in children with SLI, this could
represent delayed maturation, or a more persistent abnor-
mality [26–27]. To distinguish these options, as well as
assessing children of similar age to previous studies, we
included a group of teenagers.
e) Finally, the Ta component could be regarded as an
endophenotype for heritable SLI (see Figure 1). For this to
be the case, abnormality of Ta would need to meet two
criteria: (i) it would have to be correlated with measures of
language or literacy in children; (ii) it would need to be a
mediating variable that could explain shared variance on
language/literacy measures between affected children and
their parents. Prior research has identified rather few
correlations between electrophysiological measures and
language or literacy skills, though in general the focus has
been on MMN rather than the T-complex [5]. Where
positive associations between behavioural measures and
auditory ERPs (or magnetic counterparts) have been found,
these have predominantly involved phonological processing
[6] [8] [28], reading [29] or receptive language skills [7].
These behavioural measures were therefore selected as the
focus of the current study.
For the purposes of this study, we used a dataset that was
originally collected to examine mismatch responses to sounds in
children and teenagers with SLI and their typically-developing
(TD) controls [30]. We were able to replicate the finding of
abnormal T-complex in children and teenagers with SLI, but a
model of T-complex abnormality as an endophenotype did not
give the best fit to the data.
Materials and Methods
ParticipantsChildren (N = 16) and teenagers (N = 16) with SLI were
recruited from special schools and classrooms for children with
language or literacy problems. Inclusion criteria were a scaled
score of 1.3 SD or more below average on at least two of eleven
language measures (see below), a nonverbal IQ of 80 or above, and
normal hearing for speech frequencies (500 to 4000 Hz).
Typically-developing controls (N = 32) were matched on age and
nonverbal IQ to the children with SLI. All had nonverbal IQs of
80 or above and passed a hearing screen. No child was selected
purely on the basis of poor literacy scores. All participants had
taken part in the study reported by Bishop et al [30], which gives
further details. The study was approved by the Oxford Psychiatric
Research Ethics Committee and parents of all participants gave
written informed consent.
Diagnostic Test BatteryNonverbal ability was assessed using the two performance
subscales of the Wechsler Abbreviated Scale of Intelligence [31].
The standardized instruments used to identify language impair-
ment were: (i) A parent checklist giving a global index of
communication problems - the Children’s Communication
Checklist, version 2 [32]. (ii) A test of oral language comprehen-
sion: The Test for Reception of Grammar, version 2 (TROG-2)
[33]; (iii) The Expression, Reception and Recall of Narrative
Instrument (ERRNI) [34], which provides measures of mean
length of utterance, story content, story recall, and story
comprehension. (iv) The NEPSY [35], which provides measures
of nonword repetition, sentence repetition and oromotor skills; (v)
Reading of words and nonwords, assessed by The Test of Word
Reading Efficiency (TOWRE) [36]. With the following exceptions,
scores were converted to scaled scores according to test manuals:
Tables of norms for NEPSY oromotor skills give conversion of raw
scores to a five-point scale corresponding to centile ranges. For
NEPSY nonword repetition, which was modified to be suitable for
children speaking British English, we used our own norms to cover
the full age range studied here. The measures used for causal
analysis were nonword repetition, oromotor skills, nonword
reading and TROG-2. Internal consistencies for British children
were .83, .74 and .90 for the first three of these tests [37] and .88
for TROG-2 [33]. Estimation of structural model fit works best if
measures are on a similar scale, so scores on relevant variables
were converted to z-score relative to the standardisation norms,
except for oromotor skills, where 3 was subtracted from the centile
range score provided in the manual to give a range from 22 to 2.
Measure of Familial Risk for SLIA measure of family risk for SLI was created using data from
Barry et al [38], who had administered a language battery to at
least one parent of 60 of the 64 participants in this study. This
battery included four of the measures given to children: NEPSY
nonword repetition, Test for Reception of Grammar-E [39] and
the Test of Word Reading Efficiency [36] and NEPSY oromotor
sequences [35]. Scores on TROG-E and TOWRE were converted
to z-scores using published test norms; for the NEPSY tests, where
adult norms are lacking, we used our own normative data from a
larger sample of parents of typically-developing children.
Electrophysiological MethodsStimuli. Stimuli are described in detail by Bishop et al. [40].
The analysis reported here was restricted to standard stimuli, i.e., a
1000 Hz tone and a modified natural speech token of the syllable
‘‘bah’’. The stimuli had durations of 175 ms, were windowed at
15 ms, and were presented monaurally to the right ear at 86.5 dB
SPL through sound-attenuating Sennheiser HD25-1 headphones.
Procedure. Tone and syllable stimuli were presented in
separate blocks. Standards were presented on 70% of trials, with
Auditory Deficit: Electrophysiological Evidence
PLoS ONE | www.plosone.org 3 May 2012 | Volume 7 | Issue 5 | e35851

one of two other (deviant) stimuli occurring on 15% of trials in a
quasi-random sequence. Deviant stimuli, which are not analysed
here, were a 1030 Hz and 1200 Hz tone for the tone condition,
and the syllables ‘‘bee’’ or ‘‘dah’’ for the speech condition.
Stimulus onset asynchrony was 1 s. For each stimulus type there
were two blocks each of 333 trials, making a total of 466 standards.
Participants were seated in a sound-attenuated electrically-shielded
booth, and they played Gameboy or watched a silent film during
stimulus presentation.
EEG recording and data analysis. The EEG was recorded
on a SynAmps or NuAmps NeuroScan system using Ag/AgCl
sintered electrodes and a water-soluble conductive gel. Early pilot
studies indicated no difference in the results obtained from the two
recording systems, and the proportions of children from each
group tested on each system did not differ significantly. An
electrode cap was fitted according to the International 10–10
system to record from 28 sites: FC1, F7, FP1, FZ, FP2, F8, FC2,
FT9, FC5, F3, FCZ, F4, FC6, FT10, T7, C3, CZ, C4, T8, CP5,
P7, P3, PZ, P4, P8, CP6, M1, and M2. M1 or M2 was selected as
reference electrode and ground was placed at AFZ. Electro-
oculograms (EOG) were recorded from supra- and infra-orbital
electrodes on the left eye and also from electrodes placed lateral to
the left and right eyes. Impedances for all electrodes were kept
below 8 kV. The EEG was recorded continuously on-line and
stored for off-line processing. EEG data were digitised at 500 Hz
and band-pass filtered (0.01–70 Hz for SynAmps; 0.1–70 Hz for
NuAmps) and a 50 Hz notch filter was employed.
Offline analysis. The continuous EEG was epoched to give
trials for all standard stimuli of 1000 ms duration, including
200 ms baseline. Subsequent data processing is described in detail
by Bishop et al. (2011b). This was done for each participant
separately for standard tone and syllable stimuli. An initial stage of
artefact rejection was conducted to remove trials with extreme
amplitudes (+/2350 mv), while retaining blinks. Blinks and other
regular artefacts were then mathematically subtracted from the
data using independent component analysis (ICA) (see [12].
Further artefact rejection was then applied with cutoff +/275 mv.
Conventional analysis of the Ta component was conducted on
the averaged AERP for each participant. Mean amplitude of Ta
was measured at the temporal electrodes T7 and T8 over the time
window 88–160 ms post signal onset, which was the interval used
by Shafer et al [19] for this component. Mean amplitude rather
than peak amplitude was used because of concerns that peaks are
more affected by noise in the signal. Following Shafer et al [19],
the Ta was measured relative to a baseline of 0–76 ms post
stimulus onset. Internal consistency was computed by measuring
Ta amplitude separately for odd and even epochs for each
stimulus type and electrode. Correlations between Ta amplitudes
for odd and even epochs were .78, .76, .85 and .88 for tones (T7
and T8) and syllables (T7 and T8) respectively. To ensure normal
data for structural equation modeling, values that were more or
less than 2 SD from the mean for that electrode and condition
were censored, i.e. a value corresponding to 62 SD was
substituted, ensuring that skewness and kurtosis were nonsignifi-
cant for all Ta measures. This affected 5% of values. In addition,
the noisiness of the signal at electrodes T7 and T8 was estimated
using the standard deviation of the amplitude across time in the
pre-stimulus period (2200 to 0 ms) of the waveform.
To visualise the topography of the auditory ERP the grand
average waveforms for each group and stimulus combination were
analysed to extract two independent components following the
procedures adopted by Bishop et al [12]. This approach allows one
to investigate topography of activity after extracting the P1–N2–P2
vertex response, which dominates the auditory ERP and usually
emerges as the first component. In our data, the later N2 (peaking
around 400 ms) was also substantial and a 2 Hz high-pass filter
was first applied to minimize its impact on the auditory ERP. This
filtering has minimal impact on the T-complex and N1–P2
complex, which occur earlier, and it ensures we do not have a
component corresponding to N2 emerging as one of the first two
components. The EEGlab routine ‘runica’ was then applied to
each grand averaged waveform to extract two independent
components after reducing the dimensionality of the data with
principal components analysis. Polarity of components is arbitrary:
for group comparisons, polarity of component 1 was made
consistent with Fz, and polarity of component 2 was made
consistent with T7.
Analytic ApproachOur analysis focused on amplitude of the Ta component at T7
and T8, as this gave the clearest evidence of group differences in
previous studies and we wished to use a priori statistical tests. The
null hypothesis was that Ta amplitude would be similar in SLI and
TD groups. Comparisons of quantitative AERP indices in SLI and
TD were conducted using four-way analysis of variance (ANOVA)
with stimulus (tone vs syllable) and side (T7 vs T8) as repeated
measures, and clinical status (SLI vs TD) and age band (child vs
teen) as between subjects variables. Topography of the AERP was
evaluated visually from head maps showing electrodes contribut-
ing to the two independent components.
Associations with ERP measures were conducted for the specific
language and literacy measures listed in Table 1. Missing data on
child or parent behavioural tests were imputed by assigning a score
equivalent to the individual from the same group with the closest
average language test score. Predictions of four models of the
relationship between Ta amplitude, language measures and
parental language (Figure 1) were tested formally using structural
equation modelling implemented with OpenMx software [41].
Table 1. Mean (SD) age, nonverbal IQ and scores onlanguage/literacy tests in relation to age and SLI status.
Group TD-child TD-teen SLI-child SLI-teen
N male and female1 6 f 10 m 6 f 10 m 5 f 11 m 5 f 11 m
Age (yr) 9.75 13.80 9.82 14.06
(1.29) (1.06) (1.27) (1.20)
WASI PIQ 102.31 101.38 98.38 100.75
(9.86) (12.15) (9.22) (9.35)
Test for Reception ofGrammar2
99.07 104.43 79.81 94.38
(11.44) (6.30) (11.59) (11.10)
NEPSY nonword repetition3,4 10.94 10.94 7.81 6.06
(2.46) (2.26) (3.12) (3.11)
NEPSY oromotor sequences5 0.25 0.31 21.13 20.94
(1.00) (1.08) (0.81) (1.19)
TOWRE phonetic decoding2 106.27 108.13 83.56 77.06
(10.50) (9.65) (14.07) (12.91)
1Missing data: three on TROG-2, three on nonword repetition, three onoromotor sequences, and one on TOWRE;2Scaled with mean 100, SD 15;3Scaled with mean 10, SD 3;4Relative to own norms;5Five-point scale.doi:10.1371/journal.pone.0035851.t001
Auditory Deficit: Electrophysiological Evidence
PLoS ONE | www.plosone.org 4 May 2012 | Volume 7 | Issue 5 | e35851
Results
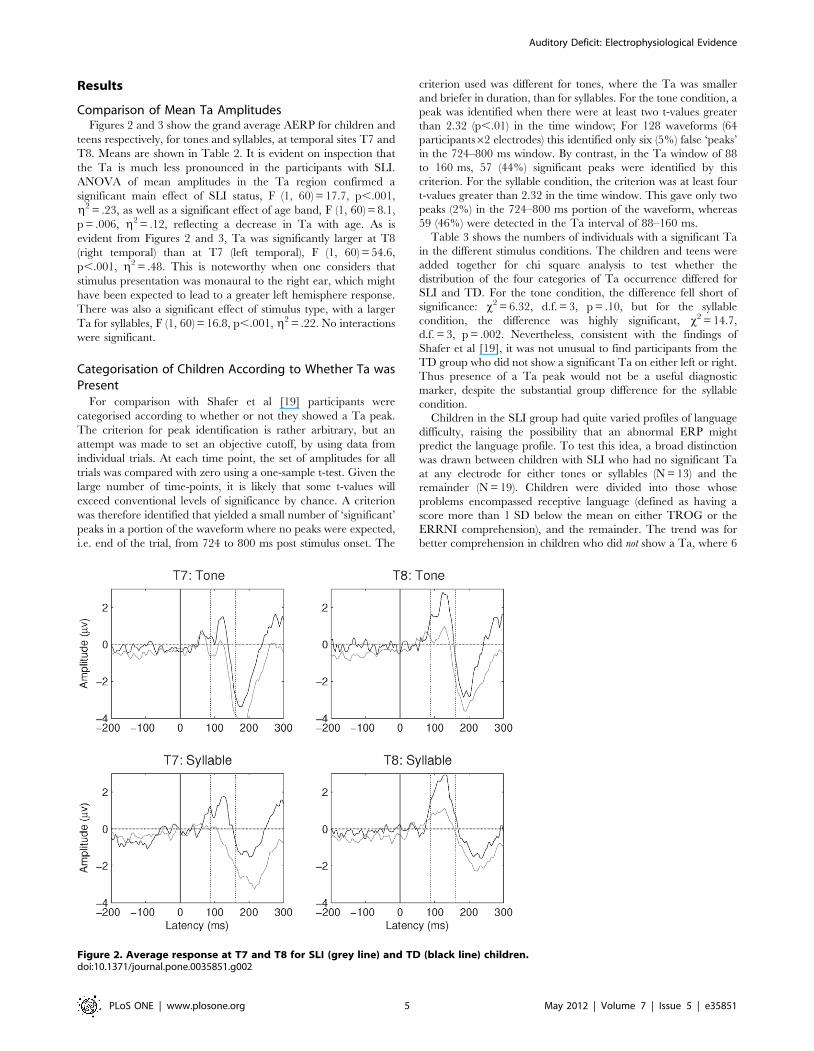
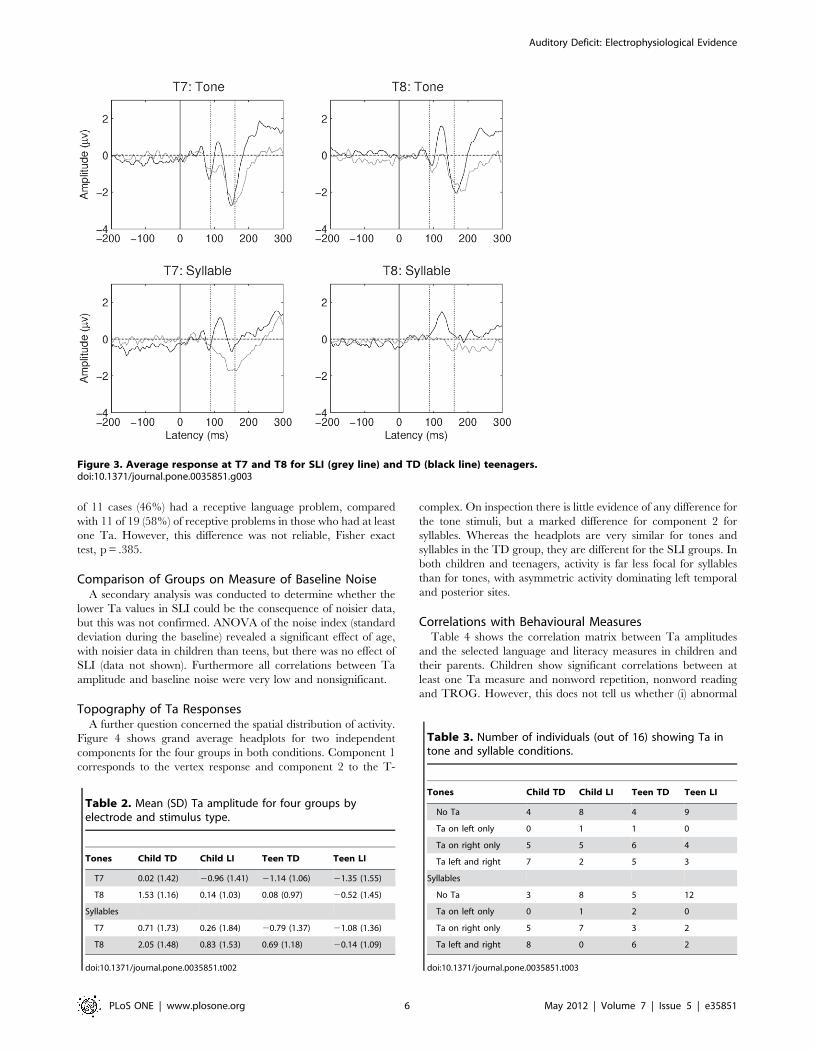
Comparison of Mean Ta AmplitudesFigures 2 and 3 show the grand average AERP for children and
teens respectively, for tones and syllables, at temporal sites T7 and
T8. Means are shown in Table 2. It is evident on inspection that
the Ta is much less pronounced in the participants with SLI.
ANOVA of mean amplitudes in the Ta region confirmed a
significant main effect of SLI status, F (1, 60) = 17.7, p,.001,
g2 = .23, as well as a significant effect of age band, F (1, 60) = 8.1,
p = .006, g2 = .12, reflecting a decrease in Ta with age. As is
evident from Figures 2 and 3, Ta was significantly larger at T8
(right temporal) than at T7 (left temporal), F (1, 60) = 54.6,
p,.001, g2 = .48. This is noteworthy when one considers that
stimulus presentation was monaural to the right ear, which might
have been expected to lead to a greater left hemisphere response.
There was also a significant effect of stimulus type, with a larger
Ta for syllables, F (1, 60) = 16.8, p,.001, g2 = .22. No interactions
were significant.
Categorisation of Children According to Whether Ta wasPresent
For comparison with Shafer et al [19] participants were
categorised according to whether or not they showed a Ta peak.
The criterion for peak identification is rather arbitrary, but an
attempt was made to set an objective cutoff, by using data from
individual trials. At each time point, the set of amplitudes for all
trials was compared with zero using a one-sample t-test. Given the
large number of time-points, it is likely that some t-values will
exceed conventional levels of significance by chance. A criterion
was therefore identified that yielded a small number of ‘significant’
peaks in a portion of the waveform where no peaks were expected,
i.e. end of the trial, from 724 to 800 ms post stimulus onset. The
criterion used was different for tones, where the Ta was smaller
and briefer in duration, than for syllables. For the tone condition, a
peak was identified when there were at least two t-values greater
than 2.32 (p,.01) in the time window; For 128 waveforms (64
participants62 electrodes) this identified only six (5%) false ‘peaks’
in the 724–800 ms window. By contrast, in the Ta window of 88
to 160 ms, 57 (44%) significant peaks were identified by this
criterion. For the syllable condition, the criterion was at least four
t-values greater than 2.32 in the time window. This gave only two
peaks (2%) in the 724–800 ms portion of the waveform, whereas
59 (46%) were detected in the Ta interval of 88–160 ms.
Table 3 shows the numbers of individuals with a significant Ta
in the different stimulus conditions. The children and teens were
added together for chi square analysis to test whether the
distribution of the four categories of Ta occurrence differed for
SLI and TD. For the tone condition, the difference fell short of
significance: x2 = 6.32, d.f. = 3, p = .10, but for the syllable
condition, the difference was highly significant, x2 = 14.7,
d.f. = 3, p = .002. Nevertheless, consistent with the findings of
Shafer et al [19], it was not unusual to find participants from the
TD group who did not show a significant Ta on either left or right.
Thus presence of a Ta peak would not be a useful diagnostic
marker, despite the substantial group difference for the syllable
condition.
Children in the SLI group had quite varied profiles of language
difficulty, raising the possibility that an abnormal ERP might
predict the language profile. To test this idea, a broad distinction
was drawn between children with SLI who had no significant Ta
at any electrode for either tones or syllables (N = 13) and the
remainder (N = 19). Children were divided into those whose
problems encompassed receptive language (defined as having a
score more than 1 SD below the mean on either TROG or the
ERRNI comprehension), and the remainder. The trend was for
better comprehension in children who did not show a Ta, where 6
Figure 2. Average response at T7 and T8 for SLI (grey line) and TD (black line) children.doi:10.1371/journal.pone.0035851.g002
Auditory Deficit: Electrophysiological Evidence
PLoS ONE | www.plosone.org 5 May 2012 | Volume 7 | Issue 5 | e35851
of 11 cases (46%) had a receptive language problem, compared
with 11 of 19 (58%) of receptive problems in those who had at least
one Ta. However, this difference was not reliable, Fisher exact
test, p = .385.
Comparison of Groups on Measure of Baseline NoiseA secondary analysis was conducted to determine whether the
lower Ta values in SLI could be the consequence of noisier data,
but this was not confirmed. ANOVA of the noise index (standard
deviation during the baseline) revealed a significant effect of age,
with noisier data in children than teens, but there was no effect of
SLI (data not shown). Furthermore all correlations between Ta
amplitude and baseline noise were very low and nonsignificant.
Topography of Ta ResponsesA further question concerned the spatial distribution of activity.
Figure 4 shows grand average headplots for two independent
components for the four groups in both conditions. Component 1
corresponds to the vertex response and component 2 to the T-
complex. On inspection there is little evidence of any difference for
the tone stimuli, but a marked difference for component 2 for
syllables. Whereas the headplots are very similar for tones and
syllables in the TD group, they are different for the SLI groups. In
both children and teenagers, activity is far less focal for syllables
than for tones, with asymmetric activity dominating left temporal
and posterior sites.
Correlations with Behavioural MeasuresTable 4 shows the correlation matrix between Ta amplitudes
and the selected language and literacy measures in children and
their parents. Children show significant correlations between at
least one Ta measure and nonword repetition, nonword reading
and TROG. However, this does not tell us whether (i) abnormal
Figure 3. Average response at T7 and T8 for SLI (grey line) and TD (black line) teenagers.doi:10.1371/journal.pone.0035851.g003
Table 2. Mean (SD) Ta amplitude for four groups byelectrode and stimulus type.
Tones Child TD Child LI Teen TD Teen LI
T7 0.02 (1.42) 20.96 (1.41) 21.14 (1.06) 21.35 (1.55)
T8 1.53 (1.16) 0.14 (1.03) 0.08 (0.97) 20.52 (1.45)
Syllables
T7 0.71 (1.73) 0.26 (1.84) 20.79 (1.37) 21.08 (1.36)
T8 2.05 (1.48) 0.83 (1.53) 0.69 (1.18) 20.14 (1.09)
doi:10.1371/journal.pone.0035851.t002
Table 3. Number of individuals (out of 16) showing Ta intone and syllable conditions.
Tones Child TD Child LI Teen TD Teen LI
No Ta 4 8 4 9
Ta on left only 0 1 1 0
Ta on right only 5 5 6 4
Ta left and right 7 2 5 3
Syllables
No Ta 3 8 5 12
Ta on left only 0 1 2 0
Ta on right only 5 7 3 2
Ta left and right 8 0 6 2
doi:10.1371/journal.pone.0035851.t003
Auditory Deficit: Electrophysiological Evidence
PLoS ONE | www.plosone.org 6 May 2012 | Volume 7 | Issue 5 | e35851

brain responses lead to language problems (Endophenotype and
Additive Risks models in Figure 1), (ii) language problems lead to
abnormal brain responses (Neuroplasticity model), or (iii) a third
factor increases the risk for both language problems and abnormal
brain responses (Pleiotropy model). The familial risk measures,
based on language and literacy test scores of parents, are useful for
Figure 4. Weightings from electrodes for two independent components corresponding to the vertex and T-complex.doi:10.1371/journal.pone.0035851.g004
Auditory Deficit: Electrophysiological Evidence
PLoS ONE | www.plosone.org 7 May 2012 | Volume 7 | Issue 5 | e35851
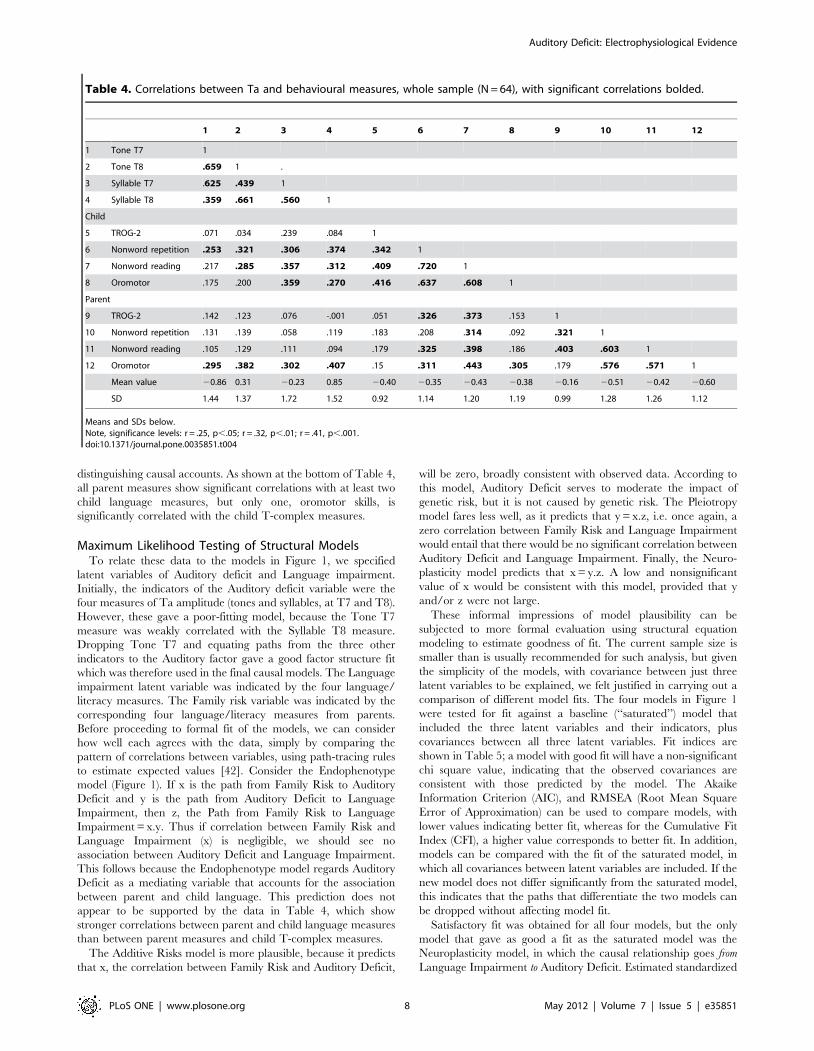
distinguishing causal accounts. As shown at the bottom of Table 4,
all parent measures show significant correlations with at least two
child language measures, but only one, oromotor skills, is
significantly correlated with the child T-complex measures.
Maximum Likelihood Testing of Structural ModelsTo relate these data to the models in Figure 1, we specified
latent variables of Auditory deficit and Language impairment.
Initially, the indicators of the Auditory deficit variable were the
four measures of Ta amplitude (tones and syllables, at T7 and T8).
However, these gave a poor-fitting model, because the Tone T7
measure was weakly correlated with the Syllable T8 measure.
Dropping Tone T7 and equating paths from the three other
indicators to the Auditory factor gave a good factor structure fit
which was therefore used in the final causal models. The Language
impairment latent variable was indicated by the four language/
literacy measures. The Family risk variable was indicated by the
corresponding four language/literacy measures from parents.
Before proceeding to formal fit of the models, we can consider
how well each agrees with the data, simply by comparing the
pattern of correlations between variables, using path-tracing rules
to estimate expected values [42]. Consider the Endophenotype
model (Figure 1). If x is the path from Family Risk to Auditory
Deficit and y is the path from Auditory Deficit to Language
Impairment, then z, the Path from Family Risk to Language
Impairment = x.y. Thus if correlation between Family Risk and
Language Impairment (x) is negligible, we should see no
association between Auditory Deficit and Language Impairment.
This follows because the Endophenotype model regards Auditory
Deficit as a mediating variable that accounts for the association
between parent and child language. This prediction does not
appear to be supported by the data in Table 4, which show
stronger correlations between parent and child language measures
than between parent measures and child T-complex measures.
The Additive Risks model is more plausible, because it predicts
that x, the correlation between Family Risk and Auditory Deficit,
will be zero, broadly consistent with observed data. According to
this model, Auditory Deficit serves to moderate the impact of
genetic risk, but it is not caused by genetic risk. The Pleiotropy
model fares less well, as it predicts that y = x.z, i.e. once again, a
zero correlation between Family Risk and Language Impairment
would entail that there would be no significant correlation between
Auditory Deficit and Language Impairment. Finally, the Neuro-
plasticity model predicts that x = y.z. A low and nonsignificant
value of x would be consistent with this model, provided that y
and/or z were not large.
These informal impressions of model plausibility can be
subjected to more formal evaluation using structural equation
modeling to estimate goodness of fit. The current sample size is
smaller than is usually recommended for such analysis, but given
the simplicity of the models, with covariance between just three
latent variables to be explained, we felt justified in carrying out a
comparison of different model fits. The four models in Figure 1
were tested for fit against a baseline (‘‘saturated’’) model that
included the three latent variables and their indicators, plus
covariances between all three latent variables. Fit indices are
shown in Table 5; a model with good fit will have a non-significant
chi square value, indicating that the observed covariances are
consistent with those predicted by the model. The Akaike
Information Criterion (AIC), and RMSEA (Root Mean Square
Error of Approximation) can be used to compare models, with
lower values indicating better fit, whereas for the Cumulative Fit
Index (CFI), a higher value corresponds to better fit. In addition,
models can be compared with the fit of the saturated model, in
which all covariances between latent variables are included. If the
new model does not differ significantly from the saturated model,
this indicates that the paths that differentiate the two models can
be dropped without affecting model fit.
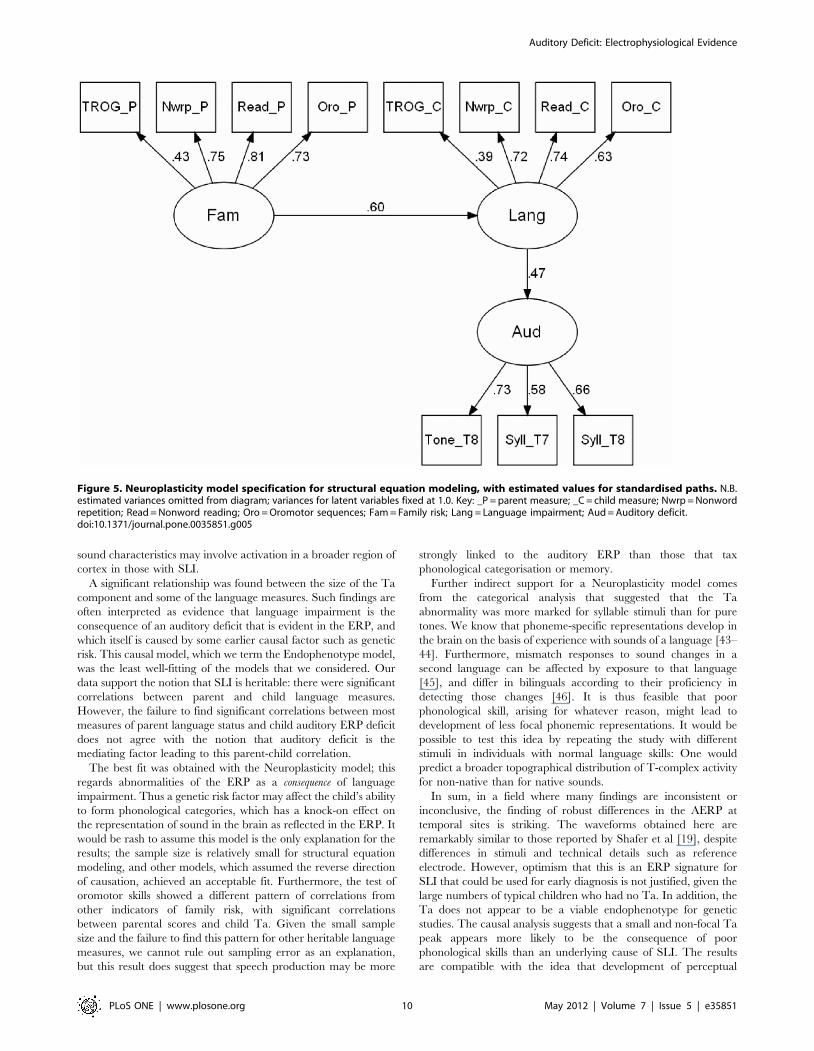
Satisfactory fit was obtained for all four models, but the only
model that gave as good a fit as the saturated model was the
Neuroplasticity model, in which the causal relationship goes from
Language Impairment to Auditory Deficit. Estimated standardized
Table 4. Correlations between Ta and behavioural measures, whole sample (N = 64), with significant correlations bolded.
1 2 3 4 5 6 7 8 9 10 11 12
1 Tone T7 1
2 Tone T8 .659 1 .
3 Syllable T7 .625 .439 1
4 Syllable T8 .359 .661 .560 1
Child
5 TROG-2 .071 .034 .239 .084 1
6 Nonword repetition .253 .321 .306 .374 .342 1
7 Nonword reading .217 .285 .357 .312 .409 .720 1
8 Oromotor .175 .200 .359 .270 .416 .637 .608 1
Parent
9 TROG-2 .142 .123 .076 -.001 .051 .326 .373 .153 1
10 Nonword repetition .131 .139 .058 .119 .183 .208 .314 .092 .321 1
11 Nonword reading .105 .129 .111 .094 .179 .325 .398 .186 .403 .603 1
12 Oromotor .295 .382 .302 .407 .15 .311 .443 .305 .179 .576 .571 1
Mean value 20.86 0.31 20.23 0.85 20.40 20.35 20.43 20.38 20.16 20.51 20.42 20.60
SD 1.44 1.37 1.72 1.52 0.92 1.14 1.20 1.19 0.99 1.28 1.26 1.12
Means and SDs below.Note, significance levels: r = .25, p,.05; r = .32, p,.01; r = .41, p,.001.doi:10.1371/journal.pone.0035851.t004
Auditory Deficit: Electrophysiological Evidence
PLoS ONE | www.plosone.org 8 May 2012 | Volume 7 | Issue 5 | e35851

paths for this model are shown in Figure 5. These allow direct
comparison of effect sizes for different paths, whereas the
unstandardized paths shown in Table 5 are scaled in the original
units of measurement.
Discussion
We replicated the study of Shafer et al [19], finding robust
differences between SLI and TD groups in the amplitude of the
Ta, particularly when syllables were used. Our findings demon-
strate abnormal responsiveness to meaningless sounds at an early
stage of cortical processing in a passive task requiring no explicit
discrimination. Significant group differences were also seen for
pure tones, indicating that the impairment is not specific to speech.
As in Shafer et al. [19], discrimination between the TD and SLI
groups was far from perfect when a categorical classification of T-
complex was used. Even though the effect size of the difference
between TD and SLI children was relatively large by the standards
of this field, many of the TD children did not show a T-complex,
whereas some children with SLI did. It would not, therefore, be
possible to use the T-complex as a diagnostic measure for SLI.
Our stimuli were presented monaurally to the right ear.
Nevertheless, as in previous studies, we found that the T-complex
was greater on the right, ipsilateral side. This effect was seen in all
groups, however, and did not interact with SLI/TD status. The
fact that the abnormality of the T-complex was just as pronounced
in teenagers with SLI as in children speaks against any simple
explanation in terms of delayed maturation, although it would be
compatible with a model such as that proposed by Wright and
Zecker [27], who proposed that maturation of auditory function is
terminated at puberty.
The analysis of variability in the baseline period allowed us to
rule out an explanation in terms of noisier ERPs in the participants
with SLI. Scrutiny of the headplots of two independent
components in the Ta time period revealed, however, more
topographically diffuse activity in children and teenagers with SLI
when syllables were used. This finding is compatible with an
earlier study of the same dataset in which we analysed late-
discriminative negativity responses to stimulus change in series of
tones or syllables [30]. In that study, the evidence was more
indirect, but on the basis of an analysis of synchronisation of brain
responses across different epochs, we proposed that analysis of
Table 5. Model fit and unstandardised path estimates (SE) for models from Figure 1.
Model Endophenotype Additive Risks Pleiotropy Neuroplasticity
x2 55.1 51.7 53.5 48.0
d.f. 44 44 44 44
P .121 .197 .150 .312
AIC 232.9 236.3 234.5 240.0
CFI: .994 .995 .995 .996
RMSEA: .102 .094 .098 .084
Change in fit relative to saturated model
x2 7.38 3.99 5.75 0.29
d.f. 1 1 1 1
P .006 .046 .017 .590
Paths between latent variables
Fam-.Aud 0.40 (0.19) – 0.42 (0.19) –
Fam-.Lang – 0.53 (0.19) 0.65 (0.20) 0.60 (0.19)
Aud-.Lang 0.55 (0.17) 0.48 (0.19) – –
Lang-.Aud – – – 0.47 (0.16)
Paths from Child Language
TROG 0.36 (0.10) 0.33 (0.09) 0.35 (0.10) 0.36 (0.10)
Nonword repetition 0.83 (0.12) 0.75 (0.11) 0.79 (0.12) 0.82 (0.12)
Nonword reading 0.87 (0.12) 0.82 (0.11) 0.88 (0.12) 0.89 (0.12)
Oromotor 0.76 (0.13) 0.69 (0.11) 0.72 (0.13) 0.74 (0.13)
Paths from Parent Language
TROG 0.40 (0.13) 0.43 (0.13) 0.41 (0.13) 0.43 (0.13)
Nonword repetition 0.98 (0.15) 0.96 (0.16) 0.94 (0.15) 0.96 (0.15)
Nonword reading 0.98 (0.15) 1.04 (0.15) 0.97 (0.15) 1.02 (0.15)
Oromotor 0.85 (0.14) 0.79 (0.13) 0.86 (0.14) 0.82 (0.14)
Paths from Auditory (constrained to be equal)
Tone T8 1.06 (0.13) 1.15 (0.13) 1.06 (0.13) 1.00 (0.13)
Syllable T7 1.06 (0.13) 1.15 (0.13) 1.06 (0.13) 1.00 (0.13)
Syllable T8 1.06 (0.13) 1.15 (0.13) 1.06 (0.13) 1.00 (0.13)
doi:10.1371/journal.pone.0035851.t005
Auditory Deficit: Electrophysiological Evidence
PLoS ONE | www.plosone.org 9 May 2012 | Volume 7 | Issue 5 | e35851
sound characteristics may involve activation in a broader region of
cortex in those with SLI.
A significant relationship was found between the size of the Ta
component and some of the language measures. Such findings are
often interpreted as evidence that language impairment is the
consequence of an auditory deficit that is evident in the ERP, and
which itself is caused by some earlier causal factor such as genetic
risk. This causal model, which we term the Endophenotype model,
was the least well-fitting of the models that we considered. Our
data support the notion that SLI is heritable: there were significant
correlations between parent and child language measures.
However, the failure to find significant correlations between most
measures of parent language status and child auditory ERP deficit
does not agree with the notion that auditory deficit is the
mediating factor leading to this parent-child correlation.
The best fit was obtained with the Neuroplasticity model; this
regards abnormalities of the ERP as a consequence of language
impairment. Thus a genetic risk factor may affect the child’s ability
to form phonological categories, which has a knock-on effect on
the representation of sound in the brain as reflected in the ERP. It
would be rash to assume this model is the only explanation for the
results; the sample size is relatively small for structural equation
modeling, and other models, which assumed the reverse direction
of causation, achieved an acceptable fit. Furthermore, the test of
oromotor skills showed a different pattern of correlations from
other indicators of family risk, with significant correlations
between parental scores and child Ta. Given the small sample
size and the failure to find this pattern for other heritable language
measures, we cannot rule out sampling error as an explanation,
but this result does suggest that speech production may be more
strongly linked to the auditory ERP than those that tax
phonological categorisation or memory.
Further indirect support for a Neuroplasticity model comes
from the categorical analysis that suggested that the Ta
abnormality was more marked for syllable stimuli than for pure
tones. We know that phoneme-specific representations develop in
the brain on the basis of experience with sounds of a language [43–
44]. Furthermore, mismatch responses to sound changes in a
second language can be affected by exposure to that language
[45], and differ in bilinguals according to their proficiency in
detecting those changes [46]. It is thus feasible that poor
phonological skill, arising for whatever reason, might lead to
development of less focal phonemic representations. It would be
possible to test this idea by repeating the study with different
stimuli in individuals with normal language skills: One would
predict a broader topographical distribution of T-complex activity
for non-native than for native sounds.
In sum, in a field where many findings are inconsistent or
inconclusive, the finding of robust differences in the AERP at
temporal sites is striking. The waveforms obtained here are
remarkably similar to those reported by Shafer et al [19], despite
differences in stimuli and technical details such as reference
electrode. However, optimism that this is an ERP signature for
SLI that could be used for early diagnosis is not justified, given the
large numbers of typical children who had no Ta. In addition, the
Ta does not appear to be a viable endophenotype for genetic
studies. The causal analysis suggests that a small and non-focal Ta
peak appears more likely to be the consequence of poor
phonological skills than an underlying cause of SLI. The results
are compatible with the idea that development of perceptual
Figure 5. Neuroplasticity model specification for structural equation modeling, with estimated values for standardised paths. N.B.estimated variances omitted from diagram; variances for latent variables fixed at 1.0. Key: _P = parent measure; _C = child measure; Nwrp = Nonwordrepetition; Read = Nonword reading; Oro = Oromotor sequences; Fam = Family risk; Lang = Language impairment; Aud = Auditory deficit.doi:10.1371/journal.pone.0035851.g005
Auditory Deficit: Electrophysiological Evidence
PLoS ONE | www.plosone.org 10 May 2012 | Volume 7 | Issue 5 | e35851

representations in the child’s brain is affected by expertise and
experience.
Acknowledgments
We gratefully acknowledge the help of the many schools and families who
participated in the research. Without their support and enthusiasm this
work would not have been possible.
Author Contributions
Conceived and designed the experiments: DVMB JGB MJH. Performed
the experiments: JGB MJH. Analyzed the data: DVMB. Wrote the paper:
DVMB JGB MJH.
References
1. Bishop D, Norbury CF (2008) Speech and language disorders. In: Rutter M,Bishop D, Pine D, Scott S, Stevenson J, et al., editor. Rutter’s Child and
Adolescent Psychiatry. Oxford: Blackwell. pp 782–801.
2. Miller CA (2011) Auditory processing theories of language disorders: Past,present, and future. Lang Speech Hear Serv Sch 42: 309–319.
3. Bishop DVM (2006) Developmental cognitive genetics: How psychology can
inform genetics and vice versa. Q J Exp Psychol - A 59: 1153–1168.
4. Kraus N, McGee TJ, Carrell TD, Zecker SG, Nicol TG, et al. (1996) Auditoryneurophysiologic responses and discrimination deficits in children with learning
problems. Science 273: 971–973.
5. Bishop DVM (2007) Using mismatch negativity to study central auditoryprocessing in developmental language and literacy impairments: where are we,
and where should we be going? Psychol Bull 133: 651–672.
6. Bishop DVM, Hardiman MJ (2010) Measurement of mismatch negativity inindividuals: a study using single-trial analysis. Psychophysiol 47: 697–705.
7. Bishop DVM, Hardiman M, Uwer R, von Suchodoletz W (2007) Atypical long-
latency auditory event-related potentials in a subset of children with specificlanguage impairment. Dev Sci 10: 565–575.
8. McArthur G, Atkinson C, Ellis D (2009) Atypical brain responses to sounds in
children with specific language and reading impairments. Dev Sci 12: 768–783.
9. Tonnquist-Uhlen I (1996) Topography of auditory evoked long-latency
potentials in children with severe language impairment: the T complex. ActaOtolaryngol 116: 680–689.
10. Weber-Fox C, Leonard LB, Wray AH, Tomblin JB (2010) Electrophysiological
correlates of rapid auditory and linguistic processing in adolescents with specificlanguage impairment. Brain Lang 115: 162–181.
11. Wunderlich JL, Cone-Wesson BK (2006) Maturation of CAEP in infants and
children: A review. Hear Res 212: 212–223.
12. Bishop DVM, Anderson M, Reid C, Fox AM (2011) Auditory developmentbetween 7 and 11 years: An event-related potential (ERP) study. PLoS One 6:
e18993.
13. Tonnquist-Uhlen I, Ponton CW, Eggermont JJ, Kwong B, Don M (2003)Maturation of human central auditory system activity: the T-complex. Clin
Neurophysiol 114: 685–701.
14. Albrecht R, von Suchodoletz W, Uwer R (2000) The development of auditoryevoked dipole source activity from childhood to adulthood. Clin Neurophysiol
111: 2268–2276.
15. Gomes H, Dunn M, Ritter W, Kurtzberg D, Brattson A, et al. (2001)Spatiotemporal maturation of the central and lateral N1 components to tones.
Dev Brain Res 129: 147–155.
16. Pang EW, Taylor MJ (2000) Tracking the development of the N1 from age 3 toadulthood: an examination of speech and nonspeech stimuli. Clin Neurophysiol
111: 388–397.
17. Ponton C, Eggermont J-J, Khosla D, Kwong B, Don M (2002) Maturation ofhuman central auditory system activity: Separating auditory evoked potentials
by dipole source modeling. Clin Neurophysiol 113: 407–420.
18. Wolpaw JR, Penry JK (1975) A temporal component of the auditory evokedresponse. Electroen Clin Neuro 39: 609–620.
19. Shafer VL, Schwartz RG, Martin B (2011) Evidence of deficient central speech
processing in children with specific language impairment: The T-complex. ClinNeurophysiol 122: 1137–1155.
20. Mason SM, Mellor DH (1984) Brain-stem, middle latency and late cortical
evoked potentials in children with speech and language disorders. EEG ClinNeurophysiol 59: 297–309.
21. Robinson RJ (1991) Causes and associations of severe and persistent specific
speech and language disorders in children. Dev Med Child Neurol 33: 943–962.
22. Cacace AT, Dowman R, Wolpaw JR (1988) T complex hemisphericasymmetries: Effects of stimulus intensity. Hear Res 34: 225–232.
23. Wolpaw JR, Penry JK (1977) Hemispheric differences in the auditory evoked
response. EEG Clin Neurophysiol 43: 99–102.
24. de Guibert C, Maumet C, Jannin P, Ferre J-C, Treguier C, et al. (2011)Abnormal functional lateralization and activity of language brain areas in typical
specific language impairment (developmental dysphasia). Brain 134: 3044–3058.25. Whitehouse AJO, Bishop DVM (2008) Cerebral dominance for language
function in adults with specific language impairment or autism. Brain 131:
3193–3200.26. Bishop DVM, McArthur GM (2004) Immature cortical responses to auditory
stimuli in specific language impairment: evidence from ERPs to rapid tonesequences. Dev Sci 7: F11–F18.
27. Wright BA, Zecker SG (2004) Learning problems, delayed development, andpuberty. P Natl Acad Sci 101: 9942–9946.
28. Fox AM, Reid CL, Anderson M, Richardson C, Bishop DVM (2011)
Maturation of rapid auditory temporal processing and subsequent nonwordrepetition performance in children. Dev Sci.
29. Parviainen T, Helenius P, Poskiparta E, Niemi P, Salmelin R (2011) Speechperception in the child brain: Cortical timing and its relevance to literacy
acquisition. Hum Brain Ma 32: 2193–2206.
30. Bishop DVM, Hardiman MJ, Barry JG (2010) Lower-frequency event-relateddesynchronization: a signature of late mismatch responses to sounds, which is
reduced or absent in children with specific language impairment. J Neurosci 30:15578–15584.
31. Wechsler D (1999) Wechsler Abbreviated Scale of Intelligence. San Antonio:Psychological Corporation.
32. Bishop DVM (2003) The Children’s Communication Checklist, version 2 (CCC-
2). London: Pearson.33. Bishop DVM (2003) The Test for Reception of Grammar, version 2 (TROG-2).
London: Pearson.34. Bishop DVM (2004) Expression, Reception and Recall of Narrative Instrument
(ERRNI). London: Pearson.
35. Korkman M, Kirk U, Kemp SI (1998) NEPSY: A developmental neuropsy-chological assessment. San Antonio: Psychological Corporation.
36. Torgesen JK, Wagner R, Rashotte C (1999) Test of Word Reading Efficiency(TOWRE). New York: Psychological Corporation.
37. Bishop DVM, McDonald D, Bird S, Hayiou-Thomas ME (2009) Children whoread accurately despite language impairment: Who are they and how do they do
it? Ch Dev 80: 593–605.
38. Barry JG, Yasin I, Bishop DVM (2007) Heritable risk factors associated withlanguage impairments. Genes Brain Behav 6: 66–76.
39. Bishop DVM (2005) The Test for Reception of Grammar, electronic version(TROG-E). London: Pearson Assessment.
40. Bishop DVM, Hardiman MJ, Barry JG (2011) Is auditory discrimination mature
by middle childhood? A study using time-frequency analysis of mismatchresponses from 7 years to adulthood. Dev Sci 14: 402–416.
41. Boker S, Neale M, Maes H, Wilde M, Spiegel M, et al. (2011) OpenMx: Anopen source extended Structural Equation Modeling framework. Psychometrika
76: 306–317.42. Wright S (1978) The application of path analysis to etiology. In: Morton NE,
Chung CS, eds. New York: Acadmic Press.
43. Cheour M, Ceponiene R, Lehtokoski A, Luuk A, Allik J, et al. (1998)Development of language-specific phoneme representations in the infant brain.
Nat Neurosci 1: 351–353.44. Kuhl P, Conboy B, Coffey-Corina S, Padden D, Rivera-Gaxiola M, et al. (2008)
Phonetic learning as a pathway to language: new data and native language
magnet theory expanded (NLM-e). Philos Trans R Soc Lond B Biol Sci 363:979–1000.
45. Cheour M, Shestakova A, Alku P, Ceponiene R, Naatanen R (2002) Mismatchnegativity shows that 3-6-year-old children can learn to discriminate non-native
speech sounds within two months. Neurosci Lett 325: 187–190.
46. Dıaz B, Baus C, Escera C, Costa A, Sebastian-Galles N (2008) Brain potentialsto native phoneme discrimination reveal the origin of individual differences in
learning the sounds of a second language. P Natl Acad Sci 105: 16083–16088.
Auditory Deficit: Electrophysiological Evidence
PLoS ONE | www.plosone.org 11 May 2012 | Volume 7 | Issue 5 | e35851
Copyright © 2022 FDOKUMEN