Zinc in the Retinal Pigment Epithelium and Choriocapillaris ...

The FASEB Journal • Research Communication
Functional characterization, tuning, and regulationof visual pigment gene expression in ananadromous lamprey
Wayne L. Davies,*,† Jill A. Cowing,† Livia S. Carvalho,† Ian C. Potter,‡
Ann E. O. Trezise,* David M. Hunt,† and Shaun P. Collin*,1
*School of Biomedical Science, University of Queensland, Brisbane, Australia, †UCL Institute ofOphthalmology, London, UK, and ‡School of Biological Sciences and Biotechnology, MurdochUniversity, Murdoch, Australia
ABSTRACT Lampreys are one of the two survivinggroups of jawless vertebrates, whose ancestors arose morethan 540 million years ago. Some species, such as Geotriaaustralis, are anadromous, commencing life as ammo-coetes in rivers, migrating downstream to the sea, andmigrating back into rivers to spawn. Five photoreceptortypes and five retinal cone opsin genes (LWS, SWS1, SWS2,RhA, and RhB) have previously been identified in G.australis. This implies that the ancestral vertebrates pos-sessed photopic or cone-based vision with the potentialfor pentachromacy. Changes in the morphology of pho-toreceptors and their spectral sensitivity are encounteredduring differing aquatic phases of the lamprey lifecycle.To understand the molecular basis for these changes, wecharacterized the visual pigments and measured the rela-tive levels of opsin expression over two lifecycle phasesthat are accompanied by contrasting ambient light envi-ronments. By expressing recombinant opsins in vitro, weshow that SWS1, SWS2, RhA, and RhB visual pigmentspossess �max values of 359, 439, 497, and 492 nm respec-tively. For the LWS visual pigment, we predict a �max valueof 560 nm based on key spectral tuning sites in othervertebrate LWS opsins. Quantitative reverse transcriptase-polymerase chain reaction reveals that the retinal opsingenes of G. australis are differentially regulated such thatthe visual system switches from a broad sensitivity acrossa wide spectral range to a much narrower sensitivitycentered around 490–500 nm on transition from marineto riverine conditions. These quantitative changes in vi-sual pigment expression throughout the lifecycle maydirectly result from changes in the lighting conditions ofthe surrounding milieu.—Davies, W. L., Cowing, J. A.,Carvalho, L. S., Potter, I. C., Trezise, A. E. O., Hunt,D. M., Collin, S. P. Functional characterization, tuningand regulation of visual pigment gene expression in ananadromous lamprey. FASEB J. 21, 2713–2724 (2007)
Key Words: color vision � lifecycle � recombinant protein
The lampreys (petromyzontiformes) and the hag-fishes (Myxiniformes) are the sole extant members ofthe jawless (agnathan) vertebrates, a group whose
ancestry dates to at least the middle Cambrian period,540 million years ago (1, 2). Phylogenetically, theposition of the agnathans at the base of the vertebrateradiation places them in a unique position for investi-gating the regulatory mechanisms that underlie verte-brate evolution and their response to a changingenvironment.
The thirty-eight surviving species of lampreys com-prise three families, the Petromyzontidae with thirty-four northern hemisphere species (3), the Geotri-idae with a single southern hemisphere species(Geotria australis), and the Mordaciidae with threesouthern hemisphere species (4). Nine species oflampreys, including the pouched lamprey G. australisare anadromous, spending the early part of their livesin freshwater and then migrating to the sea wherethey feed for a period prior to remigrating into riversto breed (5). All species of lamprey have a micropha-gous larval phase that is spent burrowed in the softsubstrata of rivers (6). After a number of years, 4 inthe case of G. australis (7), the larva (ammocoete)undergoes a radical metamorphosis, which is charac-terized by the formation of eyes, enlargement of finsand development of a tongue-like piston and atooth-bearing suctorial disc (8, 9). When fully meta-morphosed, the young adults of the anadromousspecies migrate downstream to the sea where theyattach to their teleost hosts by the suctorial disc,enabling them to extract blood and flesh through theaction of their multicuspid tongue-like piston andthe secretion of cytolytic enzymes (7). During theirmarine phase, G. australis feeds in the upper part ofthe water column of the Southern Ocean, wherethere is 24 h of daylight for 6 months of the year (10).When fully grown, G. australis ceases feeding andre-enters rivers and, over a period of 15 months,migrates at night to upstream areas, where the adultsspawn and die (11).
1 Correspondence: School of Biomedical Science, Univer-sity of Queensland, Brisbane, Qld 4072, Australia. E-mail:[email protected]
doi: 10.1096/fj.06-8057com
27130892-6638/07/0021-2713 © FASEB

Over the lifecycle of G. australis, the downstreammigrants are diurnal, traveling toward the sea duringthe day and burrowing at night. At sea, these lampreysfrequent the brightly lit surface waters where they arepredated on by albatross. On returning to the streamsystem, where the water is more turbid, G. australisbecomes photophobic, burrowing during the day andmoving upstream at night (11). Morphological (12)and spectral analyses reveal changes in the appearanceand sensitivity of the photoreceptors during the pro-tracted lifecycle.
The postmetamorphic visual system of G. australis iswell-developed, and five morphologically distinct pho-toreceptor types have been characterized (13). Thepeak spectral sensitivity of the visual pigments of threereceptor types in downstream and upstream migrants,respectively, have been previously determined by mi-crospectrophotometry (MSP) as 610 and 616 nm (longwavelength sensitive cone; C1), 515 and 515 nm (me-dium wavelength sensitive cone; C2), and 506 and 500nm (medium wavelength sensitive rod-like cone; C3),all characterized with a chromophore based on vita-min-A2 (porphyropsin; ref. 14). The final two photore-ceptor types (C4 and C5) could only be distinguished atthe ultrastructural level in the retina of downstreammigrants (13) and, due to their small size and relativelylow density, their spectral characterization has yet to bedetermined.
The morphology of the photoreceptors of the down-stream and upstream phases in the lifecycle of G.australis differ. In the downstream phase, all photore-ceptors are slender (2–3 �m in diameter) and denselypacked, with three receptor types possessing denseaggregations of yellow short wavelength-absorbing pig-ment within their myoid (14). In the upstream phase,all photoreceptors are large (7–12 �m in diameter) andalthough the same complement of photoreceptors ex-ist, the yellow myoidal pigment is absent in the C2photoreceptor and is replaced by a (pigment-free)ellipsosome. Large photoreceptors and the presence ofan ellipsosome are features typically associated withincreasing sensitivity. Therefore, there appears to be ahigh degree of retinal plasticity underlying the transi-tion of this species from its downstream phase (relianton high densities of small photoreceptors sampling aphotopic environment) to its upstream phase (relianton low densities of large photoreceptors sampling ascotopic environment; refs. 13, 14).
Molecular genetic studies reveal that G. australisexpresses five cone visual pigment (opsin) genes: a longwavelength sensitive opsin (LWS), two short wavelengthsensitive opsins (SWS1 and SWS2), and two middlewavelength sensitive opsins (RhA and RhB; ref. 15).Phylogenetic analysis has demonstrated that the LWS,SWS1, SWS2, and Rh visual pigment genes are ortholo-gous to the major classes of opsin genes present in thegnathostome lineage of vertebrates and arose by severallinear gene duplications before the separation of thejawless and jawed vertebrate lineages (15).
The previous reports of changes in the level of a
short wavelength-absorbing pigment and the spectralsensitivities of three of the five photoreceptor typesduring the lifecycle of this anadromous lamprey appearto correlate with concurrent changes in the light envi-ronment as it moves from the clear surface layers of theocean to the turbid water of rivers. The aim of this studywas therefore to 1) characterize the peak spectralsensitivities of the full complement of visual pigmentsduring the downstream and upstream phases of thelifecycle of Geotria australis by employing in vitro expres-sion of recombinant opsins and regeneration with11-cis-retinal, 2) relate the spectral sensitivities of thevisual pigments encoded by the five opsin genes to thekey residues shown to be important for spectral tuning,and 3) quantify the relative levels of opsin gene expres-sion in both the downstream and upstream phases ofthe anadromous lifecycle using quantitative polymerasechain reaction (qPCR) methods.
MATERIALS AND METHODS
RNA source and preparation
A duplicate cohort of three independent downstream (75–110 mm in total length) and upstream (560–640 mm in totallength) migrants of the southern hemisphere lamprey Geotriaaustralis were obtained from streams and rivers in south-western Australia using an electric fish shocker. In ourexperiments, the retina of the downstream phase is consid-ered to be a preadaptation for the marine phase (14) basedon ultrastructural studies that reveal a salt-acclimated retina isidentical to the retina of a downstream migrant and the factthat the duration of the downstream phase can be small (�6wk). All animals were housed in freshwater aquaria thatmimicked their natural environment as far as possible (con-stant temperature of 17°C under a 12 h light/dark cycle).After euthanasia by an overdose of methane tricaine sulfonatesalt (MS 222; 1 in 2000 dilution), the right and left eyes wereremoved and a small horizontal incision made through thecornea before placement in RNA Later solution (Ambion,GeneWorks, Hindmarsh, Australia) to minimize RNA degra-dation. All tissue samples were initially stored at 4°C over-night to maximize the diffusion of the RNA preservationsolution throughout the whole tissue and then stored at–80°C until required for further analysis. All procedures wereperformed in accordance with the ethical guidelines of theNational Health and Medical Research Council of Australiaand the Animal Ethics Committee of The University ofQueensland (AEC No: PHY/PH/074/03/NHMRC/ARC).Fresh tissue was homogenized in a solution containing gua-nidinium thiocyanate, and total RNA was isolated using theNucleospin RNA II purification kit according to the manu-facturer’s instructions (Macherey-Nagal, Integrated Sciences,Chatswood, Australia).
Generation of recombinant lamprey opsin constructs
The full-length coding region of the lamprey (downstreammigrant) LWS, SWS1, SWS2, RhA, and RhB opsin cDNAsequences were isolated by PCR and reconstructed as de-scribed previously (15). Forward and reverse primers (Table1) were used to amplify the cDNA sequences as a singlefragment with the addition of EcoRI and SalI restriction sitesat the 5�- and 3�-ends of the coding region, respectively, for
2714 Vol. 21 September 2007 DAVIES ET AL.The FASEB Journal

insertion into a mammalian expression vector. The forwardprimer for each opsin contained a translation start codon(AUG) present within a Kozak consensus sequence to ensureefficient translation of the recombinant visual pigment. Thereverse primers were designed to replace the stop codon ofthe opsin protein with a SalI restriction site contained withina sequence that would encode a C-terminal bovine rod opsin1D4 epitope (ETSQVAPA) that would be recognized by theanti-Rho1D4 monoclonal antibody. Subsequent to PCR andrestriction enzyme digestion, the EcoRI-SalI fragment wassubcloned into the vector pMT4, as described previously (16).
Expression and purification of opsin proteins
Human embryonic kidney (HEK-293T) cells were transientlytransfected with 7 �g per plate of opsin-pMT4 recombinantexpression vector by GeneJuice (Merck, Chemicals Ltd.,Nottingham, UK), using thirty 90 mm plates per experiment.After 48 h, transfected cells were harvested and washed fourtimes with phosphate-buffered saline (PBS; pH 7.0) andstored at –80°C until required. The recombinant visualpigments were generated by suspending the cells in PBS,followed by incubation with 40 �M 11-cis-retinal in the dark.The membrane-bound pigments were solubilized and puri-fied by immunoaffinity chromatography using the anti-Rho1D4 antibody coupled to a CNBr-activated Sepharosecolumn as described previously (17), eluted, and stored onice.
Spectrophotometric analysis of recombinant visual pigments
Chilled reconstituted visual pigment samples were subjectedto spectrophotometric analysis, and absorbance spectra wererecorded in the dark using a Spectronic Unicam UV500dual-beam spectrophotometer. Subsequently, the sampleswere either bleached by exposure to fluorescent light for 10min (SWS2, RhA, and RhB visual pigments) or acid-dena-tured with 26 mM hydrochloric acid (SWS1 visual pigment).Spectrophotometric recordings were repeated three timesper sample, and the bleached or acid-denatured spectra weresubtracted from the dark absorbance spectra to producedifference spectra for the calculation of the peak absorbance(�max) value for each expressed lamprey visual pigment. Theresultant visual spectra were overlaid with visual pigmenttemplates (18), and best-fit spectral curves were obtainedusing the Solver add-in function in Microsoft Excel to vary the�max. As absorbance spectra are distorted by the underlyingabsorbance and scatter of the protein, difference spectra wereused as the more accurate estimation of the �max values.
Phylogenetic analysis of vertebrate Rh opsin genes
Sequence alignments of Rh1 and Rh2 protein sequencesacross a variety of vertebrate classes (from teleosts to mam-mals) were produced and subjected to phylogenetic analysisusing the MEGA Version 3.1 computer package (19). Withthe use of codon-matched alignment, a neighbor-joining tree(20), bootstrapped with 1000 replicates, was generated usinga Jones-Taylor-Thornton (JTT) substitution matrix (21).
qPCR analysis of opsin expression
First-strand cDNA was prepared from total RNA (1 �g)extracted from the retinae of downstream and upstreammigrants of the southern hemisphere lamprey G. australis.Reverse transcription was performed using random 9-meroligonucleotides (750 ng) and Superscript II reverse tran-scriptase (Invitrogen, Mount Waverly, Australia) at 42°C for2 h. Removal of the initial RNA strand from the cDNA samplewas achieved by digestion with RNase H (New EnglandBiolabs, Australia) at 37°C for 15 min and purificationthrough a silica-membrane column, using the UltraCleanPCR Clean-up Kit, according to the manufacture’s instruc-tions (Mo Bio Laboratories, Geneworks, Australia). Individualvisual pigment transcripts were quantified using gene-specificforward and reverse primers designed specifically to amplifyLWS, SWS1, SWS2, RhA, and RhB opsin transcripts (Table 2).In addition, forward and reverse primers were designed toamplify transcripts transcribed from the house-keeping geneglyceraldehyde-3-phosphate dehydrogenase (GAPDH) to use as aninternal control to correct for sample to sample variation.
Initially, a codon-matched nucleotide alignment of eachopsin expressed in the retina of G. australis was prepared.Regions of divergence were determined, and 30-mer oligonu-cleotides were designed manually with nonconserved nucle-otides present at the 3�-end of all forward and reverse primersto facilitate amplification of specific transcripts. Each primerwas subjected to in silico analysis using the blastn algorithm(http://www.ncbi.nlm.nih.gov/blast) and a PCR-simulationprogram (Amplify Version 3.0; http://engels.genetics.wisc.edu/amplify/) to ensure specific hybridization to individuallamprey opsin transcripts with minimal primer-dimer forma-tion. All primer combinations traversed at least one exon-exon boundary, resulting in amplicons �150 bp with anaverage GC content of 68%. Triplicate qPCRs were per-formed on three independent cDNA templates (40 ng), using1� Dynamo PCR SYBR-Master Mix (Finnzymes, GeneWorks,Hindmarsh, Australia) and forward and reverse primers (500nM), for both experimental opsin and endogenous GAPDH
TABLE 1. Oligonucleotide sequences used to generate the recombinant G. australis opsinconstructs for expression analysis
Primer Sequence
PE-LWS-F 5�-GCGCGAATTCCACCATGGCGCAGTCGTGGGAGCGG-3�PE-LWS-R 5�-CGGCGTCGACGCCGCGGGGCTGACGGACGAGTT-3�PE-SWS1-F 5�-GCGCGAATTCCACCATGTCCGGAGATGAAGAGTTC-3�PE-SWS1-R 5�-CGGCGTCGACGCCCCGGGGATCATTTGGGTGGT-3�PE-SWS2-F 5�-GCGCGAATTCCACCATGTATCAGGGAAAGTCGACA-3�PE-SWS2-R 5�-CGGCGTCGACGCGGCAGGAGCGACTTGACTTGT-3�PE-RHA-F 5�-GCGCGAATTCCACCATGAACGGCACAGAGGGGCAG-3�PE-RHA-R 5�-CGGCGTCGACGCGGCCGGGGCCACCTGGCTGGT-3�PE-RHB-F 5�-GCGCGAATTCCACCATGAACGGAACCGAGGGAGCG-3�PE-RHB-R 5�-CGGCGTCGACGCTGACGGGGACACTTGACTAGA-3�
Eco RI site (GAATTC) in the forward (F) primers and Sal I site (GTCGAC) in the reverse (R)primers are underlined.
2715OPSIN EXPRESSION IN THE LAMPREY

reactions. A MJ Research Opticon II qPCR Detector was usedto detect SYBR-green reporter dye fluorescence and datawere analyzed offline. A typical protocol took 2 h to completeand included an initial denaturation step at 94°C for 10 min,followed by 40 cycles of a 94°C for 10 s (denaturation), 58°Cfor 30 s (annealing), 72°C for 30 s (extension), and a finalextension step at 81°C for 10 s to negate any spuriousprimer-dimer amplification before a plate read. To confirmprimer specificity, melting and standard curves were gener-ated for each amplicon using a 10-fold serial dilution (1 pg to10 ng) of input template. The level of fluorescence, as anindication of amplicon accumulation with an increasing PCRcycle number, was measured in real time and the thresholdcycle (CT) calculated. The CT value is defined as the cyclenumber where the level of fluorescence is above a back-ground threshold. The baseline range and threshold levelwere manually adjusted to where the fluorescence increasesexponentially and the CT is linearly proportional to thelogarithm of the input template concentration. Quantifica-tion of opsin gene expression, relative to GAPDH, was per-formed using the comparative threshold cycle method asdescribed previously (22, 23). Statistical comparisons weremade using Student’s t tests (unpaired, two-tailed) and a Pvalue of �0.05 was taken to indicate a change in transcriptlevel was of statistical significance.
RESULTS
Regeneration and spectral sensitivity of visual pigments
To characterize spectrally each of the five visual pig-ments in Geotria australis, an in vitro recombinant spec-trophotometric assay was used. Dark spectra for eachreconstituted visual pigment was determined across awide range of wavelengths (200 nm to 700 nm) and thepigment was then either bleached (SWS2, RhA, RhB,and LWS visual pigments) or acid denatured (SWS1visual pigment). �max values were obtained by fitting aGovardovskii template (18) to the difference absor-bance spectra for each regenerated visual pigment.
As shown in Fig. 1, expression of four out of the fivelamprey visual pigments (SWS1, SWS2, RhA, and RhB)was successful. Unfortunately, despite several attemptswith different clones, the LWS visual pigment consis-tently failed to produce a pigment. Expression of theSWS1 opsin yielded a �max value of 358 nm, confirmingthe ultraviolet sensitivity (UVS) of this pigment (Fig.1A). Furthermore, this value is almost identical to the
TABLE 2. Oligonucleotide sequences used to quantify the expression level of G. australis opsinmRNA by quantitative RT-PCR
Primer Sequence
RT-LWS-F 5�-GCCCATGATCATCTGCTACTTGCAAGTCTG-3�RT-LWS-R 5�-CCAGCAGAAGATGTAGGCGAAGATCATGAC-3�RT-SWS1-F 5�-ACCTACTTCCTCTTCGTGTTCTGCTTCGTC-3�RT-SWS1-R 5�-AATAATTCCCTCTCCGCCTTCTGGGTACTC-3�RT-SWS2-F 5�-GGCGTTTCTCTTCATCTTTTGCTTCGGGAC-3�RT-SWS2-R 5�-TAAATACCTCCTTCTCGGTCTTCTGCGTGC-3�RT-RHA-F 5�-GTCCCCTACATGTTCATCGTTCACTTCACG-3�RT-RHA-R 5�-TTAATCTCCTTCTCGGCCTTCTGCGTCGAT-3�RT-RHB-F 5�-GTCATCTACTTGTTCCTGGTCCACTTCCTG-3�RT-RHB-R 5�-TTAATTTCACGCTCGGCTTTCTGCGTGCTG-3�RT-GAPDH-F 5�-AAATTAGTCAGCAATGCGTCGTGCACGACC-3�RT-GAPDH-R 5�-AAAATCCACGGTCTTCTGGGTTGCCGTGTA-3�
Figure 1. Absorption spectra of regenerated G. australis SWS1 (A), SWS2 (B), RhA (C), and RhB (D) visual pigments. For eachpigment, dark (closed circles) and bleached (SWS2, RhA, and RhB) or acid-denatured (SWS1) spectra (open circles) are shown,with fitted Govardovskii (18) templates (line) in insets to determine �max values.
2716 Vol. 21 September 2007 DAVIES ET AL.The FASEB Journal

predicted �max of 360 nm for ancestral SWS1 pigments(24). The �max of the regenerated SWS2 pigment was439 nm (Fig. 1B), which resides within the blue-range(440–460 nm). Reconstitution of RhA and RhB opsinswith 11-cis-retinal generated �max values of 497 (Fig. 1C)and 492 nm (Fig. 1D), respectively, which is consistentwith the middle wavelength sensitivity of Rh1 and Rh2visual pigments.
Structural characterization of each visual pigmentopsin
Amino acid sequences of the five opsin genes (LWS,AAR14680; SWS1, AAR14684; SWS2, AAR14681; RhA,
AAR14682; and RhB, AAR14683) expressed in theretina of G. australis were analyzed for structurallyimportant residues, especially given that the LWS opsinfailed to regenerate in vitro. Each opsin sequence wassubjected to protein secondary structure predictionanalysis using the TMHMM Server Version 2.0 (http://www.cbs.dtu.dk/services/TMHMM/) and seven trans-membrane domains (TMDs), two extracellular do-mains (ECDs), three intracellular domains (ICDs), anextracellular N terminus, and an intracellular C-termi-nus were predicted at locations consistent with thosedetermined by crystallography (25) for the bovinerhodopsin polypeptide (NP_001014890; Fig. 2).
Comparison of the opsin amino acid sequences of G.
Figure 2. Alignment of the amino acid sequences of visual pigments expressed in the southern hemisphere lamprey (Geotriaaustralis; GA) and the common cow (Bos taurus, BT). RH1, rod opsin; LWS, long wavelength sensitive; SWS 1 and 2, shortwavelength sensitive 1 and 2; RhA and B, rod-like cone A and B (medium wavelength sensitive). Identical amino acids presentbetween the opsin sequences derived from G. australis retina and bovine RH1 are shown by dots (.) and gaps inserted tomaintain a high degree of identity are indicated by dashes (–). *Denote a consensus residue between all 5 lamprey opsinsequences and bovine RH1. Seven putative transmembrane domains (TMDs) are indicated by gray shading. TMDs shown forbovine rhodopsin were determined by crystallography (25). The putative positions of the TMDs for each lamprey visual pigmentwere predicted online using TMHMM Server Version 2.0 (http://www.cbs.dtu.dk/services/TMHMM/). Residues identified asbeing critical for correct opsin protein conformation (boxed) are discussed in the text.
2717OPSIN EXPRESSION IN THE LAMPREY

australis and bovine rod opsin demonstrated that thecritical residues involved in the maintenance of thetertiary structure of the opsin molecule are present(Fig. 2). With the use of the conventional numberingsystem of the bovine rod opsin polypetide sequence(Fig. 3A; gray circles), these key sites include 1) threeconserved cysteine (C) residues at positions 110(TMD3), 185 (ECD2) and 187 (ECD2) that are in-volved in disulphide bond formation (26), except for athreonine (T) residue at position 185 in the G. australisLWS opsin, which is also conserved throughout the restof the vertebrate LWS opsin class; 2) a conservedglutamate (E) at position 113 (TMD3) that provides thenegative counterion to the proton of the Schiff’s base(27); 3) a conserved glutamate (E) at position 134(TM3) that provides a negative charge to stabilize theinactive opsin molecule (28); 4) a conserved lysine (K)at position 296 (TM7) that is covalently linked to thechromophore via a Schiff’s base (29); 5) conservationof one or both of the cysteine (C) residues at putativepalmitoylation positions 322 and 323 (both at thecarboxy-terminus; ref. 30) in all lamprey opsins (SWS1,SWS2, RhA, and RhB), except for the LWS opsin; 6) thepresence of a number of serine (S) and threonine (T)residues in the carboxy-terminus, which are potentialtargets for phosphorylation by rhodopsin kinases in thedeactivation of metarhodopsin II (31, 32, 33); and 7)the conserved glycosylation sites at positions 2 and 15 ofthe amino terminus in the MWS opsins (RhA and RhB)identified in the retina of G. australis (32). Overall, eachopsin identified in the retina of G. australis, includingthe LWS opsin, possesses all of the critical amino acidsrequired to produce a functional visual pigment; the
failure of the LWS opsin to produce a pigment in vitrocannot therefore be due to the absence of thesestructurally important residues.
Putative amino acids involved in spectral tuning ofvisual pigments
Functionally, a total of 22 tuning sites have been shownto influence the spectral sensitivity of vertebrate visualpigments (24, 34–37), most of which are in closeproximity to the photosensitive chromophore (Fig. 3A;black circles). For LWS visual pigments, five tuning sites(164, 181, 261, 269, 292) have been identified, with theamino acids present at these sites in the ancestral LWSopsin proposed to be SHYTA respectively and giving a�max value of 560 nm based on a vitamin-A1 chro-mophore (38). The LWS opsin expressed in the retinaof G. australis possesses an identical complement ofresidues (SHYTA) at these critical positions and wouldbe expected to yield a pigment with a �max value of 560nm if based on a vitamin-A1 chromophore (Fig. 3B).
The predicted ancestral tuning sites and spectralsensitivities (based on a vitamin-A1 chromophore) forSWS1 and SWS2 visual pigments are F46/F49/T52/F86/S90/T93/A114/S118 (FFTFSTAS) with a �max of360 nm (39) and F46/I49/V52/T93/A164/L207/A269(FIVTALA) with a �max of 439 nm (36), respectively.The sequence of the putative tuning sites present in theG. australis SWS1 visual pigment is FITFSTAS, whichonly differs from the proposed ancestral vertebratesequence at position 49 (I instead of F). Therefore, thepredicted �max is consistent with the value of 358 nm
Figure 3. Spectral tuning of opsin molecules expressed in the retina of G. australis, modeled on bovine rod opsin. A) A schematicrepresentation of the three-dimensional structure of a visual pigment, showing the opsin seven transmembrane domains (TMDI–VII), 3 extracellular domains (ECD I – III), 3 intracellular domains (ICD I–III), amino- and carboxy-termini (N or C), and theretinal chromophore. Modified from Baldwin (51). Amino acids are represented by white circles, except when highlighted grayor black to show residues critical for maintaining protein structural integrity or spectral sensitivity, respectively. Sites forglycosylation (residues 2 and 15), disulphide bonding (residues 110 and 187), attachment of the chromophore (residue 296),and palmitoylation (residues 322 and 323) are also indicated. B) Tables showing the positions and sequence of tuning sitesimplicated in the spectral tuning of ancestral LWS, SWS1, SWS2, Rh1 and Rh2 visual pigments and the equivalent residuespresent in G. australis visual pigments. *Denotes tuning sites that underlie a red-shift of 44 nm in the spectral sensitivity of theSWS2 visual pigment of the Japanese common newt (Cynops pyrrhogaster) compared to the bullfrog (Rana catesbeiana) (35).
2718 Vol. 21 September 2007 DAVIES ET AL.The FASEB Journal

obtained for the regenerated lamprey SWS1 visualpigment and can be accounted for therefore by theresidues present at these tuning sites (Fig. 3B). Themost important site for UV-sensitivity (UVS) is however86 (40) with F resulting in a UVS pigment in allnonavian UVS pigments (37). The sole amino aciddifference at position 49 is unlikely therefore to mod-ulate the spectral sensitivity to any significant extent.Unlike SWS1, the tuning sites determined for the G.australis SWS2 visual pigment (FLFLALA) vary to agreater extent from the proposed ancestral sequence,at positions 49 (L instead of I), 52 (F instead of V) and93 (L instead of T; Fig. 3B). Despite this, the predicted�max value for the ancestral pigment and actual �maxvalue for the lamprey lie within the blue-range and areidentical at 439 nm, thus contrasting with a previousstudy that showed that amino acid changes at thesethree positions generated a small spectral shift (36). Inaddition to the residues at these sites, changes at sevenfurther sites have together been shown to cause ared-shift of 44 nm in the newt SWS2 visual pigment(�max of 474 nm) compared to that of the bullfrog(�max of 430 nm; ref. 35). The residues present at thesesites in the G. australis SWS2 sequence (S91, A94, M122,S127, C211, F261, S292) are identical to those in thebullfrog SWS2 opsin, implying that they represent theancestral state.
To date, no ancestral sequence has been proposedfor the vertebrate Rh1/Rh2 class of visual pigments.Seven tuning sites have, however, been shown to mod-ulate the spectral sensitivities of Rh1 and Rh2 visualpigments (D83/E122/M207/H211/W265/A292/A295;DEMHWAA; ref. 39). Sequence alignments of Rh1 andRh2 protein sequences across a variety of vertebrateclasses (from teleosts to mammals) were produced andsubjected to phylogenetic analysis. The resulting neigh-bor-joining tree (20) suggested that the residuespresent at key tuning sites in the ancestral Rh1 and Rh2opsins are DEMHWAA and DEMHWAS, respectively(Fig. 4). Comparison of the amino acids at thesepositions in G. australis RhA and RhB protein se-quences shows that RhA (NEMHWAA) possesses asimilar complement of residues to the proposed ances-tral sequence for Rh1 with the exception of a singleamino acid difference at position 83 (N instead of D;Fig. 3B). The sequence for RhB (DELHWAS) is similarto the ancestral sequence proposed for Rh2 but with asingle amino acid difference at position 207 (L insteadof M) (Fig. 3B). Spectral analysis of isolated rod-likephotoreceptors from the retina of an upstream migrantof the northern hemishphere lamprey Petromyzon mari-nus (the sea lamprey) identified a porphyropsin (vita-min-A2) with a �max value of 525 (41). When analyzedin the context of a vitamin-A1 chromophore using themethod of Whitmore and Bowmaker (42), this visualpigment would be predicted to give a spectral sensitivitypeak absorbance of 496 nm, which is almost identical tothe �max value of 497 nm for the regenerated G.australis RhA visual pigment. Similarly, a �max value of�500 nm (based on a vitamin-A1 chromophore) has
been found for a regenerated “rhodopsin” of anothernorthern hemisphere lamprey, Lampetra fluviatilis (theriver lamprey; ref. 43). Unlike most Rh1 pigments,which possess D83 and exhibit �max values close to 500nm (39), the RhA pigment identified in G. australis, aswell as Petromyzon marinus (the sea lamprey; U67123)and Lethenteron japonicum (the Artic lamprey; M63632)all contain N83. In bovine Rh1 visual pigments, a D83Nmutation causes a decrease in the �max value by 6 nm(44), which may explain the small short wavelengthshift in the peak spectral absorbance of regeneratedlamprey RhA visual pigments and the presence of D orN at site 83 in some deep-sea fish has been implicatedin the spectral tuning of rod visual pigments (45).
Comparison between the spectral tuning sitespresent in G. australis RhA (NEMHWAA) and RhB(DELHWAS) identifies three candidate amino aciddifferences (N83D, M207L, A295S) for this spectralshift. In bovine Rh1 visual pigments, D83N and A295Smutations cause a decrease in the �max value by 6 nm(44) and 5 nm (46), respectively. In constrast, a L207Mmutation in the Rh2 visual pigment of the coelacanthcauses a 6 nm increase in the �max value (47). Ifadditive therefore, these three amino acid differenceswould be expected to cause a net short wavelength shiftof 5 nm. When applied to the RhA and RhB visualpigments of G. australis, the �max value of the RhBpigment is indeed short wavelength shifted with respectto the RhA pigment by the expected 5 nm, thus thespectral difference between RhA and RhB visual pig-ments may be entirely explained by the A295S differ-ence.
Differential expression of opsins throughout thelamprey life-cycle
The adult stage of the lifecycle of G. australis consists oftwo migratory phases: 1) a downstream migration froma spectrally-poor freshwater river environment to aspectrally-rich marine phase (8) and 2) an upstreammigration involving a return to the original spectrally-poor freshwater setting from the marine environment(11). To investigate changes in opsin gene expressionduring these two migratory stages, retinal tissue wascollected from downstream and upstream migrants.Complimentary DNA was prepared from total RNAextracted from the retinae of three different animalsand subjected to qPCR to determine the relative mRNAexpression levels compared to an internal GAPDHcontrol.
To obtain meaningful and accurate data when usingqPCR, it is essential to show that primers designed toeach transcript of interest are specific and do notcross-hybridize with closely related transcripts in thecDNA pool under a chosen set of experimental condi-tions. Under qPCR conditions, forward and reverseprimers designed for a particular lamprey opsin weretested for specificity against plasmids containing full-length clones of LWS, SWS1, SWS2, RhA, and RhBopsins. In all cases, a 150 bp amplicon was observed for
2719OPSIN EXPRESSION IN THE LAMPREY

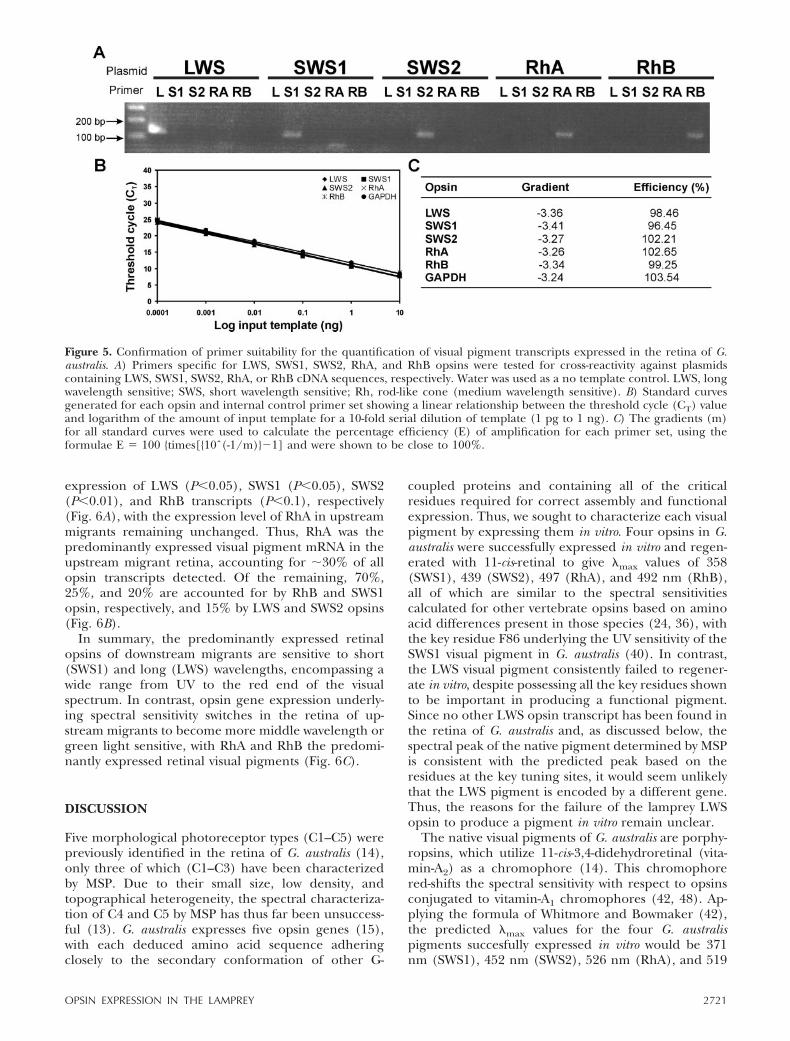
PCR reactions containing a discreet primer set and acorresponding cloned opsin cDNA (Fig. 5A). As theactual expression level for each opsin is unknown, it isvital to establish that the primer sets remain specificover a large range of input template concentrations. Byusing a 10-fold serial dilution of template, standardcurves were generated demonstrating that each primerset was specific over a range of 1 pg to 10 ng of inputtemplate (Fig. 5B) with amplification efficiencies closeto 100% (Fig. 5C), thus allowing direct comparisonbetween the relative expression levels.
Overall, all five opsins are expressed in the retinae of
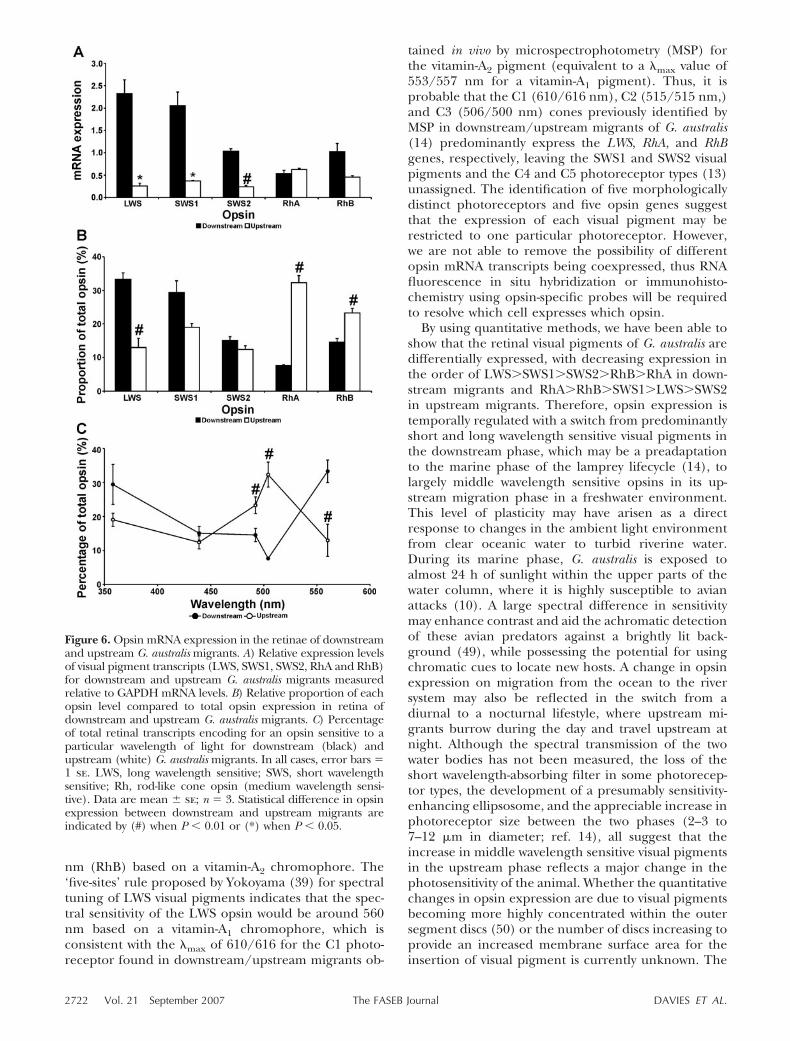
both downstream and upstream migrants of G. australis.The different opsin mRNA levels however showedsubstantial differences over the two lifecycle stagesstudied (Fig. 6). In the retina of downstream migrants,about a third of the total opsin mRNA present was fromthe LWS gene, SWS1 transcripts accounted for slightlyless than a third, SWS2 and RhB mRNA levels were�15% each, with RhA expression accounting for lessthan 10%. For upstream migrants, the total transcriptlevel for these five opsins was reduced by �4-fold whencompared to the levels in downstream migrants. Thisdecrease arises from a 9-, 6-, 4-, and 2-fold diminished
Figure 4. Phylogenetic analysis of vertebrate Rh1 and Rh2 amino acid sequences. A neighbor-joining tree was generated(Saitou and Nei, 1987) by using a Jones-Taylor-Thornton substitution matrix (Jones et al., 1992) within the MEGA Version3.1 computer package (Kumar et al., 2004). Degree of support for internal branching was assessed by bootstrapping with1000 replicates. The scale bar indicates the number of amino acid substitutions per site. The chicken SWS2 amino acidsequence was used as an outgroup. Inferred ancestral Rh1 (DEMHWAA) and Rh2 (DEMHWAS) tuning sites and relativeamino acid replacements of residues at key positions 83, 122, 207, 211, 265, 292, and 295, are indicated. Sequences usedfor generating the tree are as follows: (a) Rh1 opsin class: human (Homo sapiens), NM000539; mouse (Mus musculus),NM145383; bottle-nose dolphin (Tursiops truncatus), AF055456; fat-tailed dunnart (Sminthopsis crassicaudata), AY159786;chicken (Gallus gallus), NM205490; American alligator (Alligator mississippiensis), AMU23802; tiger salamander (Ambystomatigrinum), AF038947; Comoran coelacanth (Latimeria chalumnae), AF131253; goldfish (Carassius auratus), L11863; JohnDory (Zeus faber), Y14484; cavefish (Astyanax mexicanus), U12328; dogfish (Galeus melastomus), Y17586; smaller spottedcatshark (Scyliorhinus canicula), Y17585; little skate (Raja erinacea), U81514; (b) Rh2 opsin class: chicken (Gallus gallus),NM205490; American chameleon (Anolis carolinensis), AH004781; Tokay gecko (Gekko gecko), M92035; Comoran coelacanth(Latimeria chalumnae), AF131258; bluefin killifish (Lucania goodei), AY296739; rainbow trout (Oncorhynchus mykiss),AF425076; zebrafish (Danio rerio), NM131253 (Rh2.1), NM182891 (Rh2.2), NM182892 (Rh2.3), NM131254 (Rh2.4); (c)SWS2 opsin class: chicken (Gallus gallus), NM205517.
2720 Vol. 21 September 2007 DAVIES ET AL.The FASEB Journal
expression of LWS (P�0.05), SWS1 (P�0.05), SWS2(P�0.01), and RhB transcripts (P�0.1), respectively(Fig. 6A), with the expression level of RhA in upstreammigrants remaining unchanged. Thus, RhA was thepredominantly expressed visual pigment mRNA in theupstream migrant retina, accounting for �30% of allopsin transcripts detected. Of the remaining, 70%,25%, and 20% are accounted for by RhB and SWS1opsin, respectively, and 15% by LWS and SWS2 opsins(Fig. 6B).
In summary, the predominantly expressed retinalopsins of downstream migrants are sensitive to short(SWS1) and long (LWS) wavelengths, encompassing awide range from UV to the red end of the visualspectrum. In contrast, opsin gene expression underly-ing spectral sensitivity switches in the retina of up-stream migrants to become more middle wavelength orgreen light sensitive, with RhA and RhB the predomi-nantly expressed retinal visual pigments (Fig. 6C).
DISCUSSION
Five morphological photoreceptor types (C1–C5) werepreviously identified in the retina of G. australis (14),only three of which (C1–C3) have been characterizedby MSP. Due to their small size, low density, andtopographical heterogeneity, the spectral characteriza-tion of C4 and C5 by MSP has thus far been unsuccess-ful (13). G. australis expresses five opsin genes (15),with each deduced amino acid sequence adheringclosely to the secondary conformation of other G-
coupled proteins and containing all of the criticalresidues required for correct assembly and functionalexpression. Thus, we sought to characterize each visualpigment by expressing them in vitro. Four opsins in G.australis were successfully expressed in vitro and regen-erated with 11-cis-retinal to give �max values of 358(SWS1), 439 (SWS2), 497 (RhA), and 492 nm (RhB),all of which are similar to the spectral sensitivitiescalculated for other vertebrate opsins based on aminoacid differences present in those species (24, 36), withthe key residue F86 underlying the UV sensitivity of theSWS1 visual pigment in G. australis (40). In contrast,the LWS visual pigment consistently failed to regener-ate in vitro, despite possessing all the key residues shownto be important in producing a functional pigment.Since no other LWS opsin transcript has been found inthe retina of G. australis and, as discussed below, thespectral peak of the native pigment determined by MSPis consistent with the predicted peak based on theresidues at the key tuning sites, it would seem unlikelythat the LWS pigment is encoded by a different gene.Thus, the reasons for the failure of the lamprey LWSopsin to produce a pigment in vitro remain unclear.
The native visual pigments of G. australis are porphy-ropsins, which utilize 11-cis-3,4-didehydroretinal (vita-min-A2) as a chromophore (14). This chromophorered-shifts the spectral sensitivity with respect to opsinsconjugated to vitamin-A1 chromophores (42, 48). Ap-plying the formula of Whitmore and Bowmaker (42),the predicted �max values for the four G. australispigments succesfully expressed in vitro would be 371nm (SWS1), 452 nm (SWS2), 526 nm (RhA), and 519
Figure 5. Confirmation of primer suitability for the quantification of visual pigment transcripts expressed in the retina of G.australis. A) Primers specific for LWS, SWS1, SWS2, RhA, and RhB opsins were tested for cross-reactivity against plasmidscontaining LWS, SWS1, SWS2, RhA, or RhB cDNA sequences, respectively. Water was used as a no template control. LWS, longwavelength sensitive; SWS, short wavelength sensitive; Rh, rod-like cone (medium wavelength sensitive). B) Standard curvesgenerated for each opsin and internal control primer set showing a linear relationship between the threshold cycle (CT) valueand logarithm of the amount of input template for a 10-fold serial dilution of template (1 pg to 1 ng). C) The gradients (m)for all standard curves were used to calculate the percentage efficiency (E) of amplification for each primer set, using theformulae E � 100 {times[{10ˆ(-1/m)}�1] and were shown to be close to 100%.
2721OPSIN EXPRESSION IN THE LAMPREY
nm (RhB) based on a vitamin-A2 chromophore. The‘five-sites’ rule proposed by Yokoyama (39) for spectraltuning of LWS visual pigments indicates that the spec-tral sensitivity of the LWS opsin would be around 560nm based on a vitamin-A1 chromophore, which isconsistent with the �max of 610/616 for the C1 photo-receptor found in downstream/upstream migrants ob-
tained in vivo by microspectrophotometry (MSP) forthe vitamin-A2 pigment (equivalent to a �max value of553/557 nm for a vitamin-A1 pigment). Thus, it isprobable that the C1 (610/616 nm), C2 (515/515 nm,)and C3 (506/500 nm) cones previously identified byMSP in downstream/upstream migrants of G. australis(14) predominantly express the LWS, RhA, and RhBgenes, respectively, leaving the SWS1 and SWS2 visualpigments and the C4 and C5 photoreceptor types (13)unassigned. The identification of five morphologicallydistinct photoreceptors and five opsin genes suggestthat the expression of each visual pigment may berestricted to one particular photoreceptor. However,we are not able to remove the possibility of differentopsin mRNA transcripts being coexpressed, thus RNAfluorescence in situ hybridization or immunohisto-chemistry using opsin-specific probes will be requiredto resolve which cell expresses which opsin.
By using quantitative methods, we have been able toshow that the retinal visual pigments of G. australis aredifferentially expressed, with decreasing expression inthe order of LWSSWS1SWS2RhBRhA in down-stream migrants and RhARhBSWS1LWSSWS2in upstream migrants. Therefore, opsin expression istemporally regulated with a switch from predominantlyshort and long wavelength sensitive visual pigments inthe downstream phase, which may be a preadaptationto the marine phase of the lamprey lifecycle (14), tolargely middle wavelength sensitive opsins in its up-stream migration phase in a freshwater environment.This level of plasticity may have arisen as a directresponse to changes in the ambient light environmentfrom clear oceanic water to turbid riverine water.During its marine phase, G. australis is exposed toalmost 24 h of sunlight within the upper parts of thewater column, where it is highly susceptible to avianattacks (10). A large spectral difference in sensitivitymay enhance contrast and aid the achromatic detectionof these avian predators against a brightly lit back-ground (49), while possessing the potential for usingchromatic cues to locate new hosts. A change in opsinexpression on migration from the ocean to the riversystem may also be reflected in the switch from adiurnal to a nocturnal lifestyle, where upstream mi-grants burrow during the day and travel upstream atnight. Although the spectral transmission of the twowater bodies has not been measured, the loss of theshort wavelength-absorbing filter in some photorecep-tor types, the development of a presumably sensitivity-enhancing ellipsosome, and the appreciable increase inphotoreceptor size between the two phases (2–3 to7–12 �m in diameter; ref. 14), all suggest that theincrease in middle wavelength sensitive visual pigmentsin the upstream phase reflects a major change in thephotosensitivity of the animal. Whether the quantitativechanges in opsin expression are due to visual pigmentsbecoming more highly concentrated within the outersegment discs (50) or the number of discs increasing toprovide an increased membrane surface area for theinsertion of visual pigment is currently unknown. The
Figure 6. Opsin mRNA expression in the retinae of downstreamand upstream G. australis migrants. A) Relative expression levelsof visual pigment transcripts (LWS, SWS1, SWS2, RhA and RhB)for downstream and upstream G. australis migrants measuredrelative to GAPDH mRNA levels. B) Relative proportion of eachopsin level compared to total opsin expression in retina ofdownstream and upstream G. australis migrants. C) Percentageof total retinal transcripts encoding for an opsin sensitive to aparticular wavelength of light for downstream (black) andupstream (white) G. australis migrants. In all cases, error bars �1 se. LWS, long wavelength sensitive; SWS, short wavelengthsensitive; Rh, rod-like cone opsin (medium wavelength sensi-tive). Data are mean se; n � 3. Statistical difference in opsinexpression between downstream and upstream migrants areindicated by (#) when P � 0.01 or (*) when P � 0.05.
2722 Vol. 21 September 2007 DAVIES ET AL.The FASEB Journal

presence of an identical number of photoreceptortypes and visual pigment genes suggest that theseancient animals possess the potential for pentachro-macy. Our study shows that all five opsin genes areexpressed simultaneously, thus arguing for the pres-ence of a functional pentachromatic visual system. Therelative levels of expression, however, vary during twocontrasting phases of the lamprey lifecycle; visualplasticity would therefore appear to be a key compo-nent in the development of the earliest vertebratevisual system.
We thank Dr. R. Crouch for the generous provision of11-cis-retinal and Dr. S. Wilkie for many helpful comments.This work has been supported by grants from the AustralianResearch Council (ARC Discovery Grant DP0209452) and theUK Biotechnology and Biological Sciences Research Council(UK BBSRC Grant BB/D521630/1). Present address forW. L. Davies is UCL Institute of Ophthalmology, 11–43 BathSt., London EC1V 9EL, UK.
REFERENCES
1. Shu, D. G., Luo, H. L., Morris, S. C., Zhang, X. L., Hu, S. X.,Chen, L., Han, J., Zhu, M., Li, Y., and Chen, L. Z. (1999) LowerCambrian vertebrates from South China. Nature 402, 42–46
2. Shu, D. G., Morris, S. C., Han, J., Zhang, Z. F., Yasui, K., Janvier,P., Chen, L., Zhang, X. L., Liu, J. N., Li Y et al. (2003) Head andbackbone of the early Cambrian vertebrate Haikouichthys.Nature 421, 526–529
3. Renaud, C. B. (1997) Conservation status of northern hemi-sphere lampreys (Petromyzontidae). J. Appl. Ichthyol. 13, 143–148
4. Gill, H. S., Renaud, C. B., Chapleau, F., Mayden, R. L., andPotter, I. C. (2003) Phylogeny of living parasitic lampreys (Petro-myzontiformes) based on morphological data. Copeia 687–703
5. McDowall, R. M. (1988) Diadromy of Fishes. Migrations be-tween Fresh and Marine Environments, Croom Helm, London,United Kingdom
6. Potter, I. C. (1980) The Petromyzontiformes with particularreference to paired species. Can. J. Fish. Aquat. Sci. 37, 1595–1615
7. Potter, I. C., and Hilliard, R. W. (1987) A proposal for thefunctional and phylogenetic significance of differences in thedentition of lampreys (Agnatha: Petromyzontiformes). J. Zool.212, 713–737
8. Potter, I. C., Hilliard, R. W., and Bird, D. J. (1980) Metamor-phosis in the southern hemisphere lamprey, Geotria australis. J.Zool. 190, 405–430
9. Youson, J. H. (1980) Morphology and physiology of lampreymetamorphosis. Can. J. Fish. Aquat. Sci. 37, 1687–1710
10. Potter, I. C., Prince, P. A., and Croxall, J. P. (1979) Data on theadult marine and migratory phases in the life cycle of thesouthern hemisphere lamprey Geotria australis. Environ. Biol.Fishes 4, 65–69
11. Potter, I. C., Hilliard, R. W., Bird, D. J., and Macey, D. J. (1983)Quantitative data on morphology and organ weights during theprotracted spawning-run period of the Southern Hemispherelamprey Geotria australis. J. Zool. 200, 1–20
12. Collin, S. P., Potter, I. C., and Braekevelt, C. R. (1999) Theocular morphology of the southern hemisphere lamprey Geotriaaustralis gray, with special reference to optical specializationsand the characterization and phylogeny of photoreceptor types.Brain Behav. Evol. 54, 96–118
13. Collin, S. P., Trezise, A. E. (2004) The origins of color vision invertebrates. Clin. Exp. Optom. 87, 217–223
14. Collin, S. P., Hart, N. S., Shand, J., and Potter, I. C. (2003a)Morphology and spectral absorption characteristics retinal pho-
toreceptors in the southern hemisphere (Geotria australis).Visual. Neurosci. 20, 119–130
15. Collin, S. P., Knight, M. A., Davies, W. L., Potter, I. C., Hunt, D. M.,and Trezise, A. E. (2003b) Ancient color vision: multiple opsingenes in the ancestral vertebrates. Curr. Biol. 13, R864–R865
16. Franke, R. R., Sakmar, T. P., Oprian, D. D., and Khorana, H. G.(1988) A single amino acid substitution in rhodopsin(Lys248Leu) prevents activation of transducin. J. Biol. Chem. 263,2119–2122
17. Molday, R. S., and Mackenzie, D. (1983) Monoclonal-antibodiesto rhodopsin: Characterization, cross-reactivity, and applicationas structural probes. Biochemistry 22, 653–660
18. Govardovskii, V. I., Fyhrquist, N., Reuter, T., Kuzmin, D. G., andDonner, K. (2000) In search of the visual pigment template.Visual. Neurosci. 17, 509–528
19. Kumar, S., Tamura, K., and Nei, M. (2004) MEGA3: Integratedsoftware for Molecular Evolutionary Genetics Analysis and se-quence alignment. Briefings. in. Bioinformatics 5, 150–163
20. Saitou, N., and Nei, M. (1987) The neighbor-joining method: anew method for reconstructing phylogenetic trees. Mol. Biol.Evol. 4, 406–425
21. Jones, D. T., Taylor, W. R., and Thornton, J. M. (1992) Therapid generation of mutation data matrices from protein se-quences. Comput. Appl. Biosci. 8, 275–282
22. Davies, W. L., Vandenberg, J. I., Sayeed, R. A., and Trezise, A. E.(2004a) Cardiac expression of the cystic fibrosis transmembraneconductance regulator involves novel exon 1 usage to produce anunique amino-terminal protein. J. Biol. Chem. 279, 15877–15887
23. Davies, W. L., Vandenberg, J. I., Sayeed, R. A., and Trezise, A. E.(2004b) Post-transcriptional regulation of the cystic fibrosisgene in cardiac development and hypertrophy. Biochem., andBiophys. Res. Comm. 319, 410–418
24. Yokoyama, S. (2002) Molecular evolution of color vision invertebrates. Gene 300, 69–78
25. Palczewski, K., Kumasaka, T., Hori, T., Behnke, C. A., Moto-shima, H., Fox, B. A., Trong, I. L., Teller, D. C., Okada, T.,Stenkamp, R. E., et al. (2000) Crystal structure of rhodopsin: AG protein-coupled receptor. Science 289, 739–745
26. Karnik, S. S., and Khorana, G. H. (1990) Assembly of functionalrhodopsin requires a disulfide bond between cysteine residues110 and 187. J. Biol. Chem. 265, 17520–17524
27. Sakmar, T. P., Franke, R. R., and Khorana, G. H. (1989)Glutamic acid-113 serves as the retinylidene Schiff base counte-rion in bovine rhodopsin. Proc. Natl. Acad. Sci. U. S. A. 86,8309–8313
28. Cohen, G. B., Yang, T., Robinson, P. R., and Oprian, D. D.(1993) Constitutive activation of opsin: Influence of charge atposition 134 and size at position 296. Biochemistry 32, 6111–6115
29. Dratz, E. A., Hargrave, P. A. (1983) The structure of rhodopsinand the outer segment disc membrane. Trends Biochem. Sci. 8,128–131
30. Ovchinnikov, Y. A., Abdulaev, N. G., and Bogachuk, A. S. (1988)Two adjacent cysteine residues in the C-terminal fragment ofbovine rhodopsin are palmitylated. FEBS Lett. 230, 1–5
31. Palczewski, K., Buczylko, J., Lebioda, L., Crabb, J. W., andPolans, A. S. (1993) Identification of the N-terminal region inrhodopsin kinase involved in its interaction with rhodopsin.J. Biol. Chem. 268, 6004–6013
32. Sakmar, T. P., and Fahmy, K. (1996) Properties and photoactiv-ity of rhodopsin mutants. Israel J. Chem. 35, 325–337
33. Zhao, X., Haeseleer, F., Fariss, R. N., Huang, J., Baehr, W.,Milam, A. H., and Palczewski, K. (1997) Molecular cloning andlocalization of rhodopsin kinase in the mammalian pineal.Visual. Neurosci. 14, 225–232
34. Hunt, D. M., Dulai, K. S., Partridge, J. C., Cottrill, P., andBowmaker, J. K. (2001) The molecular basis for spectral tuningof rod visual pigments in deep-sea fish. J. Exp. Biol. 204,3333–3344
35. Takahashi, Y., and Ebrey, T. G. (2003) Molecular basis ofspectral tuning in the newt short wavelength sensitive visualpigment. Biochemistry 42, 6025–6034
36. Yokoyama, S., and Tada, T. (2003) The spectral tuning in theshort wavelength-sensitive type 2 pigments. Gene 306, 91–98
37. Hunt, D. M., Cowing, J. A., Wilkie se, Parry, J. W., and Poopa-lasundaram, S., Bowmaker, J. K. (2004) Divergent mechanismsfor the tuning of shortwave sensitive visual pigments in verte-brates. Photochem. Photobiol. Sci. 3, 713–720
2723OPSIN EXPRESSION IN THE LAMPREY

38. Yokoyama, S., and Radlwimmer, F. B. (2001) The moleculargenetics and evolution of red and green color vision in verte-brates. Genetics 158, 1697–1710
39. Yokoyama, S. (2000) Molecular evolution of vertebrate visualpigments. Prog. Retin. Eye. Res. 19, 385–419
40. Cowing, J. A., Poopalasundaram, S., Wilkie se, Robinson, P. R.,Bowmaker, J. K., and Hunt, D. M. (2002) The molecular mecha-nism for the spectral shifts between vertebrate ultraviolet- andviolet-sensitive cone visual pigments. Biochem. J. 367, 129–135
41. Harosi, F. I., and Kleinschmidt, J. (1993) Visual pigments in thesea lamprey, Petromyzon. marinus. Visual. Neurosci. 10, 711–715
42. Whitmore, A. V., and Bowmaker, J. K. (1989) Seasonal variationin cone sensitivity and short-wave absorbing visual pigments inthe rudd Scadinius erythrophythalmus. J. Comp. Physiol. A. 166,103–115
43. Hisatomi, O., Ishikawa, M., Tonosaki, A., and Tokunaga, F.(1997) Characterization of lamprey rhodopsin by isolation fromlamprey retina and expression in mammalian cells. Photochem.Photobiol. 66, 792–795
44. Nathans, J. (1990) Determinants of visual pigment absorbance:role of changed amino acids in the putative transmembranesegments. Biochemistry 29, 937–942
45. Hunt, D. M., Wilkie se, Bowmaker, J. K., and Poopalasundaram,S. (2001) Vision in the ultraviolet. Cell. Mol. Life. Sci. 58,1583–1598
46. Janz, J. M., Farrens, D. L. (2001) Engineering a functionalblue-wavelength-shifted rhodopsin mutant. Biochemistry 40,7219–7227
47. Yokoyama, S., Zhang, H., Radlwimmer, F. B., and Blow, N. S.(1999) Adaptive evolution of color vision of the Comorancoelacanth (Latimeria chalumnae). Proc. Natl. Acad. Sci. U. S. A.96, 6279–6284
48. Harosi, F. I. (1994) Analysis of two spectral properties ofvertebrate visual pigments. Vision. Res. 34, 1359–1367
49. Lythgoe, J. N. (1979) in The Ecology of Vision.Oxford SciencePublications, Clarendon Press, Oxford, United Kingdom
50. Wagner, H. J., and Kroger, R. H. (2005) Adaptive plasticityduring the development of color vision. Prog. Retin. Eye. Res. 24,521–536
51. Baldwin, J. M. (1993) The probable arrangement of the helicesin G protein-coupled receptors. EMBO J. 12, 1693–1703
Received for publication December 28, 2006.Accepted for publication March 8, 2007.
2724 Vol. 21 September 2007 DAVIES ET AL.The FASEB Journal
Copyright © 2022 FDOKUMEN