Process parameters determination of phosphorescent pigment added, frit-based wall tiles vetrosa...
10
Process parameters determination of phosphorescent pigment added, frit-based wall tiles vetrosa decorations Selvin Yes ¸ilay Kaya a, * , Bekir Karasu b a Anadolu University, Department of Glass, Yunusemre Campus, 26470, Eskisehir, Turkey b Anadolu University, Dept. of Materials Sci. & Eng., Iki Eylul Campus, 26555, Eskisehir, Turkey Received 11 September 2011; received in revised form 14 November 2011; accepted 16 November 2011 Available online 8 December 2011 Abstract In this study bluish-green (BG) and yellowish-green (YG) phosphorescent pigments were synthesized and produced under laboratory conditions and the best ones in terms of higher phosphorescence intensity and longer duration were, afterwards, added into wall tile transparent vetrosa frits to obtain new, functional and decorative products. Their uses under industrial working conditions were also examined. Throughout the study the optimum process parameters were determined. # 2011 Elsevier Ltd and Techna Group S.r.l. All rights reserved. Keywords: Phosphorescent pigments; Production; Process parameters; Transparent vetrosa frit; Glazed wall tile 1. Introduction The Eu 2+ -activated alkaline earth aluminates became an important class of phosphorescent materials for their quantum efficiency in the visible region. They were considered as a new generation of long afterglow phosphors for their high bright- ness, long life time, good chemical stability and non- radioactivity [1,2]. Phosphorescence, also called afterglow, refers to a luminescence with delayed radiative return that is caused by trapping of photo-generated electrons and/or holes at intrinsic or extrinsic defect sites of the material. When freed by thermal energy, these trapped charge carriers recombine at the ionized luminescent centers. The amount of thermal energy needed for freeing the charge carriers depends on the trap depth, E T . Thus, phosphorescence is a thermo-activated physical phenomenon, in which charge carriers are released at well-defined temperatures characteristic of the trap depths. In other words, phosphorescence is a thermo-luminescence with de-trapping at room temperature [3]. It is known that the persistent luminescence life time and intensities of phosphors can be enhanced by co-doping them with other rare earth ions. The phosphorescence from the aluminates is believed to be caused by the 4f–5d transition of Eu 2+ ions in the crystals and this behaviour is based upon the thermal activation of holes from traps followed by the emission of Eu 2+ . Such electron transitions have been reported to be affected by the electrical surroundings of Eu 2+ ions. Thus, the color of the phosphor is dependent on the crystal structure of the main phases [4–8]. Frits are glass particles prepared by heating suitable batches to a high temperature in a gas or oil-fired furnace or in an electric melting unit. Batch constituents are chosen amongst the readily available inorganic raw materials. Frits are employed as a glaze component, a special bonding material in abrasives, a flux in subsidiary ceramic processes like decorating, a coating for electronic components and a cement in ceramic, metal and glass/metal seals [9]. In the present study, long-lasting phosphorescent bluish- green and yellowish-green pigments were developed and produced. Additionally, a low melting transparent frit composition was synthesized and produced for glazed wall tile vetrosa applications. In order to achieve vetrosa decorated wall tiles with long lasting phosphorescence ability, developed pigments were added into the new frit at certain ratios. The determination of the optimum pigment addition % into the frit, the effect of decoration firing temperature and www.elsevier.com/locate/ceramint Available online at www.sciencedirect.com Ceramics International 38 (2012) 2757–2766 * Corresponding author. Tel.: +90 2223213550; fax: +90 2223351290. E-mail address: [email protected] (S.Y. Kaya). 0272-8842/$36.00 # 2011 Elsevier Ltd and Techna Group S.r.l. All rights reserved. doi:10.1016/j.ceramint.2011.11.045
Transcript of Process parameters determination of phosphorescent pigment added, frit-based wall tiles vetrosa...
Process parameters determination of phosphorescent pigment added,
frit-based wall tiles vetrosa decorations
Selvin Yesilay Kaya a,*, Bekir Karasu b
a Anadolu University, Department of Glass, Yunusemre Campus, 26470, Eskisehir, Turkeyb Anadolu University, Dept. of Materials Sci. & Eng., Iki Eylul Campus, 26555, Eskisehir, Turkey
Received 11 September 2011; received in revised form 14 November 2011; accepted 16 November 2011
Available online 8 December 2011
Abstract
In this study bluish-green (BG) and yellowish-green (YG) phosphorescent pigments were synthesized and produced under laboratory
conditions and the best ones in terms of higher phosphorescence intensity and longer duration were, afterwards, added into wall tile transparent
vetrosa frits to obtain new, functional and decorative products. Their uses under industrial working conditions were also examined. Throughout the
study the optimum process parameters were determined.
# 2011 Elsevier Ltd and Techna Group S.r.l. All rights reserved.
Keywords: Phosphorescent pigments; Production; Process parameters; Transparent vetrosa frit; Glazed wall tile
www.elsevier.com/locate/ceramint
Available online at www.sciencedirect.com
Ceramics International 38 (2012) 2757–2766
1. Introduction
The Eu2+-activated alkaline earth aluminates became an
important class of phosphorescent materials for their quantum
efficiency in the visible region. They were considered as a new
generation of long afterglow phosphors for their high bright-
ness, long life time, good chemical stability and non-
radioactivity [1,2].
Phosphorescence, also called afterglow, refers to a
luminescence with delayed radiative return that is caused by
trapping of photo-generated electrons and/or holes at intrinsic
or extrinsic defect sites of the material. When freed by thermal
energy, these trapped charge carriers recombine at the ionized
luminescent centers. The amount of thermal energy needed for
freeing the charge carriers depends on the trap depth, ET. Thus,
phosphorescence is a thermo-activated physical phenomenon,
in which charge carriers are released at well-defined
temperatures characteristic of the trap depths. In other words,
phosphorescence is a thermo-luminescence with de-trapping at
room temperature [3].
It is known that the persistent luminescence life time and
intensities of phosphors can be enhanced by co-doping them
* Corresponding author. Tel.: +90 2223213550; fax: +90 2223351290.
E-mail address: [email protected] (S.Y. Kaya).
0272-8842/$36.00 # 2011 Elsevier Ltd and Techna Group S.r.l. All rights reserve
doi:10.1016/j.ceramint.2011.11.045
with other rare earth ions. The phosphorescence from the
aluminates is believed to be caused by the 4f–5d transition of
Eu2+ ions in the crystals and this behaviour is based upon the
thermal activation of holes from traps followed by the emission
of Eu2+. Such electron transitions have been reported to be
affected by the electrical surroundings of Eu2+ ions. Thus, the
color of the phosphor is dependent on the crystal structure of the
main phases [4–8].
Frits are glass particles prepared by heating suitable batches
to a high temperature in a gas or oil-fired furnace or in an
electric melting unit. Batch constituents are chosen amongst the
readily available inorganic raw materials. Frits are employed as
a glaze component, a special bonding material in abrasives, a
flux in subsidiary ceramic processes like decorating, a coating
for electronic components and a cement in ceramic, metal and
glass/metal seals [9].
In the present study, long-lasting phosphorescent bluish-
green and yellowish-green pigments were developed
and produced. Additionally, a low melting transparent frit
composition was synthesized and produced for glazed
wall tile vetrosa applications. In order to achieve vetrosa
decorated wall tiles with long lasting phosphorescence
ability, developed pigments were added into the new frit at
certain ratios.
The determination of the optimum pigment addition %
into the frit, the effect of decoration firing temperature and
d.

Table 1
Batch recipes for the production of phosphors.
Raw materials For bluish-green
phosphors (BGP)
(Moles)
For yellowish-green
phosphors (YGP)
(Moles)
H3AlO3 9–14 0.23–0.48
H3BO3 0.5–1.2 0.01–0.03
Eu2O3 0.001–0.02 0.001–0.003
Dy2O3 0.01–0.08 0.002–0.006
SrCO3 2–4 0.25–0.46
Nd2O3 0.001–0.002 –
Y2O3 – 0.001–0.003
Table 2
Composition of the base low temperature transparent VF coded frit.
Components Content (mol%)
R2O(Na2O, K2O) 21.54
RO(CaO, MgO, BaO) 9.53
R2O3(B2O3, Al2O3, Fe2O3a) 15.84
RO2(SiO2) 53.09
a Come from some raw materials and their amounts are negligible.
S.Y. Kaya, B. Karasu / Ceramics International 38 (2012) 2757–27662758
time and the thickness of vetrosa layer were searched to
receive decorations with long lasting, high intensity phos-
phorescence.
2. Materials and methods
2.1. Production of bluish-green (BG) and yellowish-green
(YG) phosphorescent pigments
Polycrystalline phosphor powder samples of the Sr4A-
l14O25:Eu2+, Dy3+, Nd3+ and SrAl2O4:Eu2+, Dy3+, Y3+ systems
have been synthesized through the solid-state reaction
technique. The initial batches of phosphorescent pigments
were prepared using high purity materials; H3AlO3 (Merck,
Hydragillite), SrCO3 (Riedel-de Haen, >99.5%), BaCO3
(Sigma–Aldrich, >99%), Eu2O3 (Stanford Materials,
99.99%), Dy2O3 (Stanford Materials, 99.9%), Y2O3 (Stanford
Materials, 99.999%) and Nd2O3 (Stanford Materials, 99.95%).
The raw materials were weighed according to the following
recipes (Table 1).
The weighed batches were milled in zirconium oxide bowls
using zirconium oxide balls and isopropyl alcohol at 200 rpm
for 1–4 h (Planetary mill, Fritsch/Pulverisette 5). The mixed
slurries were dried in an oven at 75 8C for 24 h. The dried
powders were ground and thoroughly mixed. Afterwards,
sintering was conducted in alumina crucibles in a tunnel
furnace (Protherm PTF 16/50/450) under reducing atmosphere
supplied by 95–98.5% N2 + 5–1.5% H2 gas mixture at 1350–
1600 8C for 1–5 h. Reductive atmosphere condition is
necessary to ensure complete reduction of activator ion Eu3+
to Eu2+.
Phase identifications were made by XRD at 40 kV and
30 mA with Rigaku Rint 2000 using Cu-Ka radiation. The
morphology of sintered powders was designated by Zeiss EVO
55 SEM fitted with an EDX. The photoluminescence (PL)
emission spectra were taken on Perkin Elmer LS55 lumines-
cence spectrometer. Each sample was excited with 240–260 nm
radiation from a pulsed xenon lamp. The emission spectra were
scanned in the range of wavelengths from 360 to 650 nm. To
measure the excitation spectra, the analyzer monochromator
was set to the maximum wavelength of the emission spectra and
then an excitation monochromator was scanned in the range of
200–400 nm.
Since commercially available low melting transparent frits
were found to be unsuitable for the production of long lasting
phosphorescence ability bearing new products, such as vetrosa
decoration and wall tile glazes, a new transparent frit
composition (VF) was synthesized and produced after 15
trials (Table 2). The behaviour of frit with or without pigment
addition was studied by a hot stage microscope (Misura 3.32
ODHT HSM 1600-80) with a heating rate of 10 8C/min up to
1300 8C. The frit viscosities were calculated employing HSM
data in association with Tg values obtained from DTA (Netzsch
STA 409 PC). In order to determine thermal expansion
coefficient values samples were heated in a dilatometer
(Netzsch DIL 402 PC) at a rate of 10 8C/min up to 600 8C.
After the production of phosphorescent pigments and the
transparent frit (VF), they were mixed at certain ratios. To
provide homogenous mixture, dry blending process performed
for 10 min. Then, the phosphorescent pigment-added vetrosa
frit was applied onto glazed ceramic wall tiles for decoration
purposes by screen printing. Besides laboratory studies,
industrial firing was also conducted in a fast single-firing
decoration furnace with a top temperature of 920 8C for a total
firing cycle of 40 min. At this stage the optimum process
parameters for producing decorated, glazed wall tiles with
phosphorescence ability were investigated. Finally, the micro-
structure of glazed wall tiles decorated by phosphorescent
vetrosa frit was examined by SEM (Zeiss EVO 50 at 20 kV),
attached to EDX.
3. Results and discussion
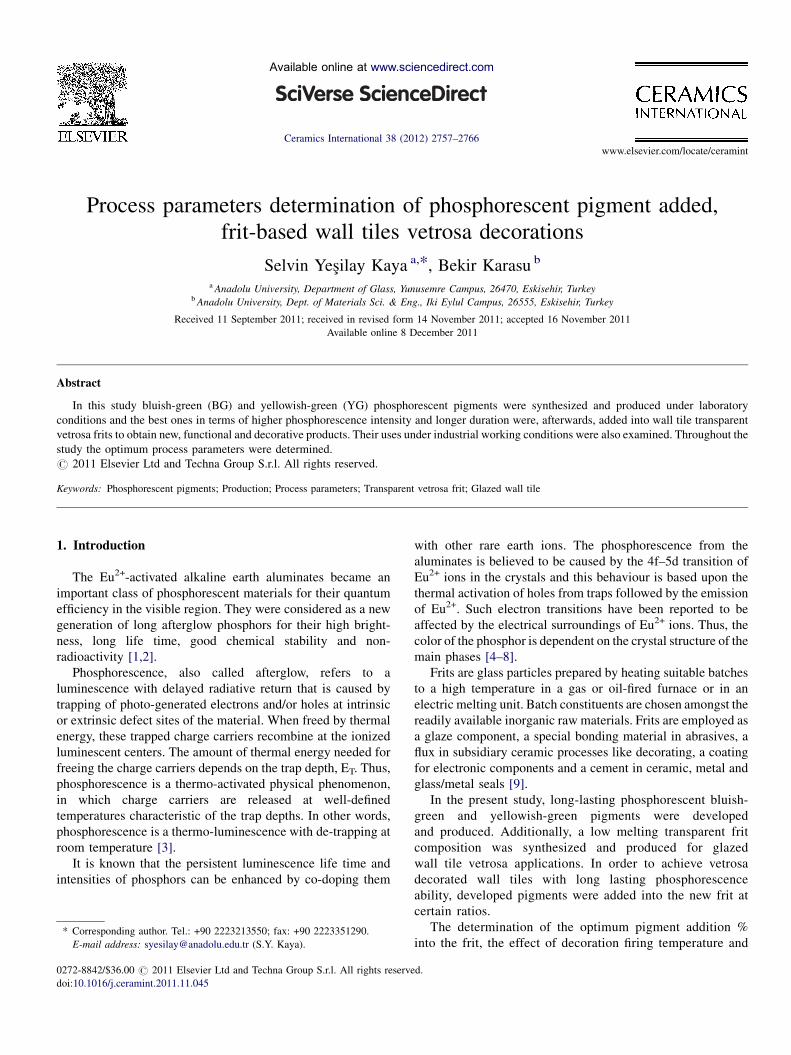
The XRD patterns of bluish-green (BG) and yellowish-green
(YG) phosphor samples synthesized under laboratory condi-
tions are shown in Fig. 1.
According to the XRD results, the major crystal phase is
seen to be Sr4Al14O25 for BG phosphor and SrAl2O4 for YG
one.
The morphologies of the phosphorescent powders sintered
and ground below 63 mm are given in Fig. 2, indicating that the
average size distribution of particles are �10 nm. EDX patterns
taken from phosphor powders were presented in Fig. 3.
The excitation and emission spectra of powders were
recorded by means of a fluorescence spectrophotometer (Perkin
Elmer LS55). Emission spectra of Sr4Al14O25:Eu2+, Dy3+, Nd3+
and SrAl2O4:Eu2+, Dy3+, Y3+ system phosphors fired at 1250–
1600 8C for 1–5 h are indicated in Fig. 4.
Emission analysis results presented that Sr4Al14O25:Eu2+,
Dy3+, Nd3+ system has emission intensity at �490 nm
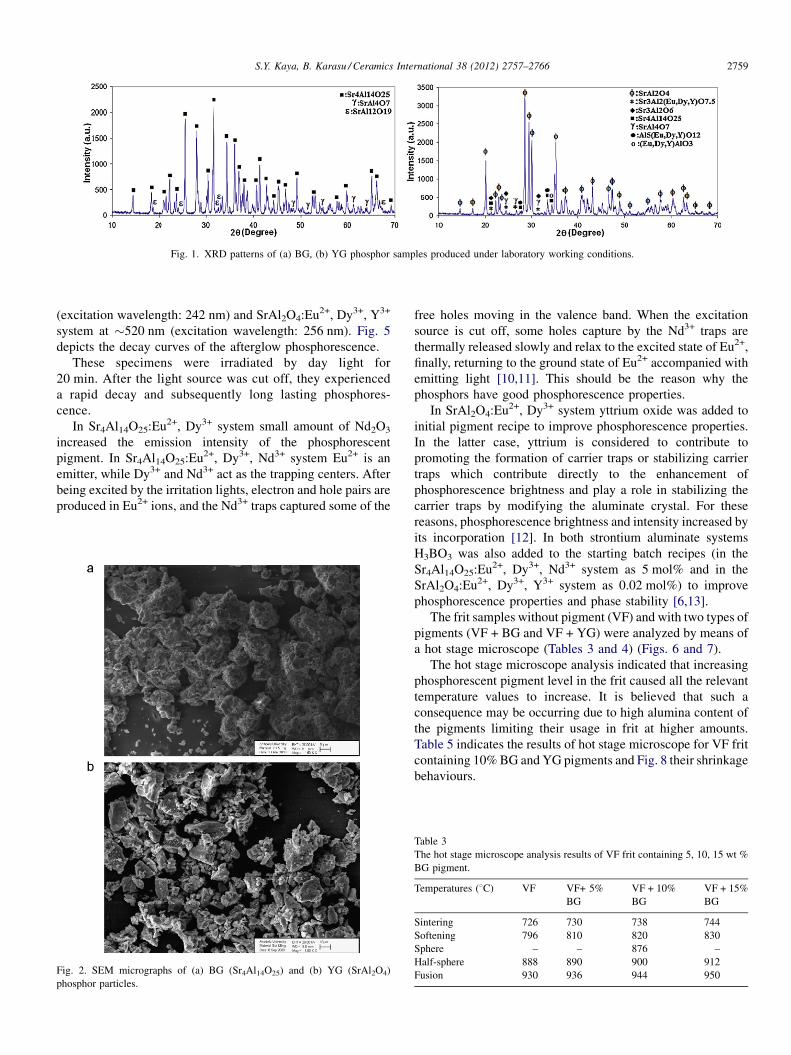
Fig. 1. XRD patterns of (a) BG, (b) YG phosphor samples produced under laboratory working conditions.
S.Y. Kaya, B. Karasu / Ceramics International 38 (2012) 2757–2766 2759
(excitation wavelength: 242 nm) and SrAl2O4:Eu2+, Dy3+, Y3+
system at �520 nm (excitation wavelength: 256 nm). Fig. 5
depicts the decay curves of the afterglow phosphorescence.
These specimens were irradiated by day light for
20 min. After the light source was cut off, they experienced
a rapid decay and subsequently long lasting phosphores-
cence.
In Sr4Al14O25:Eu2+, Dy3+ system small amount of Nd2O3
increased the emission intensity of the phosphorescent
pigment. In Sr4Al14O25:Eu2+, Dy3+, Nd3+ system Eu2+ is an
emitter, while Dy3+ and Nd3+ act as the trapping centers. After
being excited by the irritation lights, electron and hole pairs are
produced in Eu2+ ions, and the Nd3+ traps captured some of the
Fig. 2. SEM micrographs of (a) BG (Sr4Al14O25) and (b) YG (SrAl2O4)
phosphor particles.
free holes moving in the valence band. When the excitation
source is cut off, some holes capture by the Nd3+ traps are
thermally released slowly and relax to the excited state of Eu2+,
finally, returning to the ground state of Eu2+ accompanied with
emitting light [10,11]. This should be the reason why the
phosphors have good phosphorescence properties.
In SrAl2O4:Eu2+, Dy3+ system yttrium oxide was added to
initial pigment recipe to improve phosphorescence properties.
In the latter case, yttrium is considered to contribute to
promoting the formation of carrier traps or stabilizing carrier
traps which contribute directly to the enhancement of
phosphorescence brightness and play a role in stabilizing the
carrier traps by modifying the aluminate crystal. For these
reasons, phosphorescence brightness and intensity increased by
its incorporation [12]. In both strontium aluminate systems
H3BO3 was also added to the starting batch recipes (in the
Sr4Al14O25:Eu2+, Dy3+, Nd3+ system as 5 mol% and in the
SrAl2O4:Eu2+, Dy3+, Y3+ system as 0.02 mol%) to improve
phosphorescence properties and phase stability [6,13].
The frit samples without pigment (VF) and with two types of
pigments (VF + BG and VF + YG) were analyzed by means of
a hot stage microscope (Tables 3 and 4) (Figs. 6 and 7).
The hot stage microscope analysis indicated that increasing
phosphorescent pigment level in the frit caused all the relevant
temperature values to increase. It is believed that such a
consequence may be occurring due to high alumina content of
the pigments limiting their usage in frit at higher amounts.
Table 5 indicates the results of hot stage microscope for VF frit
containing 10% BG and YG pigments and Fig. 8 their shrinkage
behaviours.
Table 3
The hot stage microscope analysis results of VF frit containing 5, 10, 15 wt %
BG pigment.
Temperatures (8C) VF VF+ 5%
BG
VF + 10%
BG
VF + 15%
BG
Sintering 726 730 738 744
Softening 796 810 820 830
Sphere – – 876 –
Half-sphere 888 890 900 912
Fusion 930 936 944 950

Fig. 3. EDX pattern taken from (a) BG (Sr4Al14O25) and (b) YG (SrAl2O4) phosphor powders.
S.Y. Kaya, B. Karasu / Ceramics International 38 (2012) 2757–27662760
Hot stage microscope results strengthened the approach
about the effect of alumina content in pigments on raising the
relevant temperature values (Table 5). VF frit with BG pigment
contains higher level of alumina and naturally all of its relevant
values get higher when compared to those having YG one.
Table 4
The hot stage microscope analysis results of VF frit including 5, 10, 15 wt %
YG pigment.
Temperatures (8C) VF VF + 5%
YG
VF + 10%
YG
VF + 15%
YG
Sintering 726 728 732 740
Softening 796 806 812 824
Sphere – – – 886
Half-sphere 888 890 898 908
Fusion 930 932 940 946
Figs. 9 and 10 present the viscosity curves of VF frit with BG
and YG pigments.
It can be more clearly seen from the viscosity curves that VF
frit has a lower viscosity value than those with pigment
incorporation at higher temperatures. When the level of
Table 5
The hot stage microscope analysis results of VF frit containing 10% YG and BG
pigments.
Temperatures (8C) VF VF + 10% BG VF+ 10% YG
Sintering 726 738 732
Softening 796 820 812
Sphere – 876 –
Half-sphere 888 900 898
Fusion 930 944 940

Fig. 4. Emission spectra of (a) BG and (b) YG phosphors exited by the
l = 242 nm and l = 256 nm UV lights.
Fig. 5. Decay curves of (a) BG and (b) YG phosphors exited by the l = 242 nm
and l = 256 nm UV lights.
S.Y. Kaya, B. Karasu / Ceramics International 38 (2012) 2757–2766 2761
pigment was increased, then, frit viscosities also raised. It is
thought that this is caused by the major crystalline phases
[Sr4Al14O25 (Tmelting: �1900 8C) and SrAl2O4 (Tmelting:
�1200 8C)] present in these two different systems raising
the melting temperature of VF frit.
Relative viscosity curves of VF frit including 10% bluish-
green and yellowish-green pigments are given in Fig. 11. When
10% BG and YG pigment added frits are compared with VF frit
without pigment in terms of viscosity it is noticed that pigment
addition has an increasing effect on it.
As seen from Fig. 11, bluish-green phosphorescent pigment
addition increases the viscosity of VF frit more than yellowish-
green one. It is assumed that the reason of such a condition is
occurring with bluish-green pigment having the major crystal-
line phases of Sr4Al14O25, in which strongly bonded aluminum
level is higher.
Table 6
Thermal expansion coefficient values of VF frit with 5, 10, and 15% BG
pigment (400 8C).
Sample codes Thermal exp. coeff. (�10�7 1/8E)
VF 64.86
VF + 5% BG 64.19
VF + 10% BG 64.68
VF + 15% BG 64.81
Table 6 gives thermal expansion coefficient values of VF frit
and VF frit with 5–15% BG pigment and Table 7 the values of
VF frit with 5–15% YG pigment. In both cases a major change
in a values cannot be seen. This is an advantage for the frit not
to experience a mismatch between decoration and the glazed
Fig. 6. Shrinkage curves of VF frit with 5, 10, 15 wt% BG pigment.

Fig. 7. Shrinkage curves of VF frit with 5, 10, 15 wt% YG pigment.
Fig. 9. The viscosity curves of VF frit with 5, 10, 15% BG pigment.
Table 7
Thermal expansion coefficient values of VF frit with 5, 10, 15% YG pigment
(400 8C).
Sample Codes Thermal Exp. Coeff. (�10�7 1/8E)
VF 64.86
VF + 5% YG 65.37
VF + 10% YG 65.69
VF + 15% YG 66.05
Fig. 8. The shrinkage curves of VF frit with 10% BG and YG pigments.
Fig. 10. The viscosity curves of VF frit with 5, 10, 15% YG pigment.
Fig. 11. The viscosity curves of VF frit with 10% BG and YG pigments.
Fig. 12. Dilatometer curves of VF frit with 5, 10, 15% BG pigment.
Fig. 13. Dilatometer curves of VF frit with 5, 10, 15% YG pigment.
S.Y. Kaya, B. Karasu / Ceramics International 38 (2012) 2757–27662762

Fig. 14. Dilatometer curves of VF frit without pigment and with 10% BG and
YG pigments.
Fig. 15. The glazed wall tiles decorated with BG phosphorescent pigment
added frit as (a) 5%, (b) 10%, (c) 15%. Their industrial single fast-firing was
conducted in VitrA Karo Inc.
S.Y. Kaya, B. Karasu / Ceramics International 38 (2012) 2757–2766 2763
wall tile surface for subsequent application. Figs. 12 and 13
present dilatometer analysis results of the frit samples.
The results confirm that pigment addition into VF frit does
not have a considerable effect on a value (Fig. 14).
3.1. Determination of optimum pigment addition into
transparent vetrosa frit
To determine the final effects of pigment addition on the
phosphorescence ability of the wall tile decoration, the
pigments were added into VF frit as 5, 10 and 15 wt.% and
the mixtures were applied on the glazed wall tile surfaces.
Fig. 16. The glazed wall tiles decorated with YG phosphorescent pigment
added frit as (a) 5%, (b) 10%, (c) 15%. Their industrial single fast-firing was
conducted in VitrA Karo Inc.

Fig. 17. The final appearances of decorated, glazed wall tiles in the day light and the dark. Decors contain 10% BG and YG pigments and single fast-fired at 920 8C(a) and 980 8C (b) in VitrA Karo Inc.
Fig. 18. The final appearances of decorated, glazed wall tiles in the day light
and the dark. They were single fast-fired at 920 8C 40 min (a) and 35 min (b) at
VitrA Karo Inc.
S.Y. Kaya, B. Karasu / Ceramics International 38 (2012) 2757–27662764
Figs. 15 and 16 show the final decorated products both in the
day light and the dark respectively.
The minimum level of afterglow was observed with the
product having 5% BG pigment, although, after firing, desired
decoration was obtained with satisfactory maturation and
smooth surface. The product with 10% incorporation exhibited
comparingly higher afterglow and phosphorescence intensity
without any surface defect. In the case of 15% pigment addition
frit maturation problem occurred.
As to YG pigment applications, the optimum afterglow was
obtained with the usage of 10% pigment in the vetrosa frit.
When the addition rate was raised up to 15%, satisfactory
decoration could not be achieved.
With 5% pigment addition satisfactory phosphorescence
ability of decors cannot be achieved. 15% addition does not
attract the attention for cost reasons. Therefore, it was
decided that further studies should be carried out with 10%
addition.
3.2. The effects of firing temperature and time on the
phosphorescence properties of the decoration
The studied decors are matured at temperatures below
1000 8C not to lose phosphorescence ability. Therefore, to
determine optimum firing temperatures of decorated glazed
wall tile samples they were single fast-fired at 920 and 980 8Cin VitrA Karo Inc. in a decoration-firing furnace for a total time
of 35–40 min. The appearances of final products are given in
Fig. 17.

Fig. 19. The final appearance of the decorated glazed wall tiles after single fast-fired at 920 8C for 40 min in VitrA Karo Inc.
Fig. 20. SEM micrographs taken from the cross section of the decoration part of
the piece shown in (a) Fig. 19(a) and (b) of the piece shown in Fig. 19(c).
S.Y. Kaya, B. Karasu / Ceramics International 38 (2012) 2757–2766 2765
As seen from Fig. 17 phosphorescence intensity of YG
pigment containing decor comparingly little bit weakens when
temperature raises up to 980 8C unlike the one with BG
pigment. This indicates the sensitivity of YG pigment added
decors to temperature increase.
Under the production condition of VitrA Karo Inc. only YG
pigment added decors were studied in order to see the firing
time effect on the phosphorescence properties of final products.
Fig. 18 depicts the relevant decors fired at 920 8C for 35 and
40 min respectively.
As seen firing time of 40 min supplies better maturation and
smoother surface.
3.3. The effect of vetrosa frit thickness on the
phosphorescence properties of the decoration
To understand the effects of vetrosa frit level applied onto
the glazed wall-tile body on the phosphorescence glow, the
amount of industrial standard frit, 3.5 g, and also 1.5 g were
studied in the decors (Fig. 19). Naturally, with 3.5 g frit
application better afterglow property is achieved. However,
with 1.5 g frit satisfactory phosphorescence is also received and
the use of this much frit is suggested in order to produce final
products with less cost.
SEM and EDX analyses related to Sr4Al14O25 and SrAl2O4
crystals are presented in Figs. 20 and 21.

Fig. 21. The EDX analyses of final products given in Fig. 20(a) and (b) respectively.
S.Y. Kaya, B. Karasu / Ceramics International 38 (2012) 2757–27662766
4. Conclusions
Sr4Al14O25:Eu2+, Dy3+, Nd3+ and SrAl2O4:Eu2+, Dy3+,Y3+
phosphors were synthesized, prepared and produced by the
solid-state reaction using H3BO3 as a fluxing agent at 1350–
1600 8C for 3 h under reductive atmosphere of 95–98.5%
N2 + 5–1.5% H2. To obtain powders having good phosphor-
escence properties in both strontium aluminate systems
different kinds of rare earths were used. In both systems
Nd3+ and Y3+ have a positive effect on the luminescence.
Results indicated that produced phosphorescence pigments
can be added into a suitable low temperature transparent frit for
III. firing decoration purposes in order to get more functional
and attractive phosphorescence ability having glazed wall tiles.
Acknowledgments
The authors would like to thank TUBITAK (Science,
Technology and Research Association of Turkiye) for
supporting the project numbered 108M464. Special thanks
also go to the authorities and people of VitrA Karo Inc. of
Turkiye, facilitating the study to be conducted satisfactorily.
References
[1] X. Yu, C. Zhou, X. He, Z. Peng, S. Yang, The influence of some processing
conditions on luminescence of SrAl2O4:Eu2+ nanoparticles produced by
combustion method, Materials Letters 58 (6) (2004) 1087–1091.
[2] S. Kaya Yesilay, B. Karasu, G. Kaya, E. Karacaoglu, Effects of firing
temperature and time on the luminescency of phosphors in strontium
aluminate system co-doped by Eu2O3 and Dy2O3 and prepared by solid
state reaction processing, Advances in Science and Technology 62 (2010)
82–87.
[3] F. Clabau, X. Rocquefelte, S. Jobic, P. Deniard, M. Whangbo, On the
phosphorescence mechanism in SrAl2O4:Eu2+ and its cooped derivatives,
Solid State Sciences 9 (2007) 608–612.
[4] S. Choi, N. Kim, Y. Yun, S.C. Choi, Photoluminescence properties of
SrAl2O4 and CaAl2O4 long-phosphorescent phosphors synthesized by an
oxalate co precipitation method, Journal of Ceramic Processing Research.
7 (1) (2006) 62–65.
[5] S. Kaya Yesilay, B. Karasu, G. Kaya, E. Karacaoglu, Influences of Eu3+
and Dy3+ contents on the properties of long afterglow strontium
aluminate phosphors, Advances in Science and Technology 62
(2010) 88–94.
[6] S. Kaya Yesilay, B. Karasu, E. Karacaoglu, The effects of boron
oxide content on the phosphorescence mechanism of strontium alumi-
nate phosphors, in: The Proceeding Book of the 15th International
Metallurgy and Materials Congress, Istanbul, (2010), pp. 2140–
2146.
[7] S. Kaya Yesilay, B. Karasu, The production and use of bluish-green and
yellowish-green phosphorescent pigments in wall tile and vetrosa appli-
cations, Seramik Turkiye Magasine, Turkish Ceramic Federation (Octo-
ber–March) (2011) 128–134.
[8] Kaya, S. Yesilay, B. Karasu, E. Karacaoglu, Phosphorescent pigment
applications in glasses, in: The Proceeding of the Camgeran 2010 Glass
Symposium with International Participation, 2010, pp. 41–44 (in Turk-
ish).
[9] J.R. Taylor, A.C. Bull, Ceramics Glaze Technology, Pergamon Press,
London, 1980, pp. 50–51.
[10] W. Jia, H. Yuan, L. Lu, H. Liu, M.W. Yen, Crystal growth and characteri-
zation of Eu2+, Dy3+: SrAl2O4 and Eu2+ Nd3+: CaAl2O4 by the LHPG
method, Journal of Crystal Growth 200 (1999) 179–184.
[11] H. Ryu, K.S. Bartwal, Photoluminescent spectra of Nd3+ codoped CaA-
l2O4:Eu2+ blue phosphor, Research Letters in Materials Science 23643
(2007) 1–4, Article ID.
[12] J. Fu, Y. Ochi, Long-lasting phosphor, United States Patents, Patent
No:6010644, 2000.
[13] X. Luoa, W. Caoa, Z. Xiao, Investigation on the distribution of rare earth
ions in strontium aluminate phosphors, Journal of Alloys and Compounds
416 (1–2) (2006) 250–255.