
The effect of retinal pigment epithelial cell patch size on growth factor expression
6
The effect of retinal pigment epithelial cell patch size on growth factor expression Elizabeth Vargis a, b,1 , Cristen B. Peterson c , Jennifer L. Morrell-Falvey c , Scott T. Retterer a, c, * , Charles Patrick Collier a, ** a Center for Nanophase Materials Sciences, Oak Ridge National Laboratory, Oak Ridge, TN 37831, USA b Joint Institute of Biological Sciences, University of Tennessee, Knoxville, TN 37996, USA c Biosciences Division, Oak Ridge National Laboratory, Oak Ridge, TN 37831, USA * Corresponding author. Center for Nanophase Materials Sciences, Oak Ridge National Laboratory, Oak Ridge, TN 37831, USA. Tel.: þ1 865 405 4066; fax: þ1 865 574 5345. ** Corresponding author. Tel.: þ1 865 576 3638; fax: þ1 865 574 1753. Email addresses: [email protected] (S.T. Retterer), [email protected] (C.P. Collier). 1 Current institution: Department of Biological Engineering, Utah State University, Logan, UT 84322-4105, USA. 1. Introduction Controlling the spatial organization and growth of cells is an important step in understanding cell behavior and modeling disease processes in vitro. Monitoring the expression of important proteins within these controlled environments can lead to new insights that inform our understanding of how disease processes are initiated and develop over time. While many of these questions have been studied using conventional cell culturing methods, the continued development of physiologically relevant models that can replicate the metabolic, mechanical and barrier properties of functional tissues remains important [1,2]. Microscale surface chemical patterning offers one method of controlling the growth of cells in vitro. Previous studies have evaluated the effect of extracellular matrix (ECM) composition on cell size and shape as well as the secretion of additional ECM by growing cells on micropatterned structures [3,4]. The impact of micropatterning on function and morphology has been investigated on many types of cells including keratinocytes, neuronal cells, fibroblasts, macrophages, stem, epithelial, and cancer cells [3e6]. Such studies are critical to combining directed growth techniques with high throughput microfluidic assays, where individual patches of cells can be addressed, manipulated and studied in parallel [7e9]. Many diseases, such as liver failure, osteoporosis, and cancer, have been studied using micropatterning techniques. These studies have led to the development of techniques for controlling the self-assembly of vascular structures and liver tissues, manipulating the mechanical forces and stress placed on osteoblasts, and demonstrating differences in morphology and motility between normal and cancerous cells [10e13]. In this paper, micropatterning techniques are used to create cellular ‘patches’ that emulate defects in natural systems which can be used to examine the impact of local cellecell and celleenvironment interactions on the loss of barrier properties as well as changes in the biomarker expression of retinal pigment epithelial cells.
-
Upload
independent -
Category
Documents
-
view
4 -
download
0
Transcript of The effect of retinal pigment epithelial cell patch size on growth factor expression

The effect of retinal pigment epithelial cell patch size on growth factor expression
Elizabeth Vargis a, b,1 , Cristen B. Peterson c , Jennifer L. Morrell-Falvey c , Scott T. Retterer a, c, * , Charles Patrick Collier a, **
a Center for Nanophase Materials Sciences, Oak Ridge National Laboratory, Oak Ridge, TN 37831, USA b Joint Institute of Biological Sciences, University of Tennessee, Knoxville, TN 37996, USA c Biosciences Division, Oak Ridge National Laboratory, Oak Ridge, TN 37831, USA
* Corresponding author. Center for Nanophase Materials Sciences, Oak Ridge
National Laboratory, Oak Ridge, TN 37831, USA. Tel.: þ1 865 405 4066; fax: þ1 865 574 5345. ** Corresponding author. Tel.: þ1 865 576 3638; fax: þ1 865 574 1753.
Email addresses: [email protected] (S.T. Retterer), [email protected] (C.P . Collier). 1 Current institution: Department of Biological Engineering, Utah State University, Logan, UT 84322-4105, USA.
1. Introduction
Controlling the spatial organization and growth of cells is an important step in understanding cell behavior and modeling disease processes in vitro. Monitoring the expression of important proteins within these controlled environments can lead to new insights that inform our understanding of how disease processes are initiated and develop over time. While many of these questions have been studied using conventional cell culturing methods, the continued development of physiologically relevant models that can replicate the metabolic, mechanical and barrier properties of functional t issues remains important [1,2]. Microscale surface chemical patterning offers one method of controlling the growth of
cells in vitro. Previous studies have evaluated the effect of extracellular matrix (ECM) composition on cell size and shape as well as the secretion of additional ECM by growing cells on micropatterned structures [3,4]. The impact of micropatterning on function and morphology has been investigated on many types of cells including keratinocytes, neuronal cells, fibroblasts, macrophages, stem, epithelial, and cancer cells [3e6]. Such studies are critical to combining directed growth techniques with high throughput microfluidic assays, where individual patches of cells can be addressed, manipulated and studied in parallel [7e9]. Many diseases, such as liver failure, osteoporosis, and cancer, have been studied using micropatterning techniques. These studies have led to the development of techniques for controlling the self-assembly of vascular structures and liver tissues, manipulating the mechanical forces and stress placed on osteoblasts, and demonstrating differences in morphology and motility between normal and cancerous cells [10e13]. In this paper, micropatterning techniques are used to create cellular ‘patches’ that emulate defects in natural systems which can be used to examine the impact of local cellecell and celleenvironment interactions on the loss of barrier properties as well as changes in the biomarker expression of retinal pigment epithelial cells.

Retinal pigment epithelial cells (RPEs) are polarized and highly specialized neural cells that provide metabolic support to photoreceptor cells (rods and cones). They are an important component of the retina with a central role in normal vision as well as the initiation and progression of retinal diseases such as age-related macular
degeneration (AMD). When RPE cells do not behave appropriately or die as the result of repeated exposure to reactive oxidative species, the formation of drusen (acellular debris, dry AMD) or retinal neovascularization (wet AMD) can occur [14]. Dry AMD is currently managed by vitamin supplementation and dietary modifications. For patients with wet AMD, expensive antiangiogenic (i.e. anti-vascular endothelial growth factor (VEGF)) therapy is the most common treatment option [15]. Anti-VEGF therapy is used to treat wet AMD because of the central role that VEGF plays in neovascularization. As a signaling protein, VEGF is needed for angiogenesis and neovascularization in normal processes such
as embryonic development and the formation of new muscles after exercise. It has been implicated in cancer malignancy as well as diseases of the retina, including diabetic retinopathy and AMD. In the eye, RPE cells are the primary retinal source of VEGF [16] and also express VEGF receptors [17,18]. VEGF, in turn, impacts tight junction formation of RPE cells, altering the permeability of the epithelial barrier between the retina and its blood supply [17]. The goal of this study is to replicate the effects of disease and loss of function within the retina by using micropatterning techniques to direct the growth of RPE cells into discrete patches and measuring the effect of patch size on VEGF expression. RPE cells were added to micropatterned fibronectin patches on tissueculture treated polystyrene dishes with a hydrophobicehydrophilic block-copolymer as a blocking agent. Quantitative image analysis of RPE patch morphology and tight junction formation was performed. VEGF expression was measured from ensembles of RPE patches of varying size and was compared to VEGF expression in confluent layers of RPE cells using enzyme-linked immunosorbent assay (ELISA). Levels of VEGF were measured as a function of cell number and patch area. Changes in cell density, cell size, or morphology within the RPE patches were examined. Hypothesizing that VEGF expression was linked to global VEGF concentrations in culture, VEGF expression from RPE patches of varying size were quantified following VEGF agonist administration. This study illustrates how direct cell patterning can be used to influence the secretion of VEGF in RPE tissue models and highlights a path towards mimicking the effects of t issue damage or atrophy in cell culture.
2. Methods
2.1. Fibronectin printing
Microcontact printing was used to pattern fibronectin (Sigma Aldrich, St. Louis,
MO) onto substrates. Stamps with patches of 100, 200, 300, 400 and 500 mm
diameter were made out of poly(dimethylsiloxane) (PDMS), prepared from a Sylgard 184 silicone elastomer kit (Dow Corning, Midland, MI), using soft lithography [7]. The PDMS stamps were sterilized in 70% ethanol and “ inked” with a solution of
50 mg/mL fibronectin overnight. The fibronectin layer was transferred to the sub-
strate by placing the stamp in conformal contact with it for 1 min (Fig. 1). After passivation with 0.7% wt/vol P luornic Ò F-127 (Sigma Aldrich), to prevent protein adsorption and cell attachment to unpatterned regions of the substrate, cells were plated at a concentration of 1 Â 10 6 cells/mL. Thirty minutes after seeding, the media was replaced to prevent non-specific cell attachment.
2.2. Cell culture
ARPE-19 cells (American Type Culture Collections, Manassas, VA) were maintained and passaged in standard culture dishes (Corning; Sigma Aldrich) using DMEM/F12 media (Lonza, Allendale, NJ) with 10% fetal bovine serum (Gibco, Carlsbad, CA) and 20 mL/L L-glutamine-penicillin-G-streptomycin (2 mM, 100 U/mL, 0.1 mg/mL, respectively, Gibco) in a humidified incubator at 37 C in 5% CO 2 . Cells were obtained at passage 11 and used through passage 30.
2.3. Enzyme-linked immunoassays
Aliquots of media from culture wells containing the stamped substrates were
collected (100 mL). VEGF concentrations were assayed using a human VEGF ELISA kit
(Invitrogen, Carlsbad, CA) using a BioTek Synergy 2 microplate reader. The output was reported in pg/mL to account for any volume changes during the experiment. VEGF expression was measured at regular intervals: 4, 24, 30 48, 54, 72 h after the cells were seeded onto the patches.
2.4. Immunohistochemistry and analysis
Substrates with patterned RPE patches were washed in PBS and fixed in 2% paraformaldehyde (Sigma Aldrich) at 4 C for 1 h. The samples were washed 2 times in PBS at RT and permeabilized by exposure to 0.2% Triton X-100 (VWR, West Chester, PA) for 30 min at 4 C. Samples were washed and incubated with primary antibody (mouse anti-ZO-1, diluted 1:100, Invitrogen) for 1 h at 4 C. After washing, the samples were incubated with secondary antibody (Alexa 488 goat anti-mouse, diluted 1:500; Invitrogen) for 30 min at RT. The samples were then stained with Hoechst 33342 and examined using a Zeiss LSM710 confocal microscope and Zen 2010 (Zeiss) software. Image analysis was performed using ImageJ (NIH). First, images were converted from grayscale to black and white (binary) images reflecting stained and unstained areas from the fluorescent micrographs. The image threshold was determined using the triangle method within ImageJ and a set of cells from each sample was outlined as a Region of Interest (ROI). Parameters such as area and number of cells were extracted using the ‘Analyze Particles.’ function. A Student’s t-test was used to determine if significant differences in cell size and tight junction formation were present (p < 0.05).
2

2.5. Agonist
Micropatterned patches of RPE cells were treated with 5 ng/mL VEGF-E (a specific viral VEGF analog targeting VEGF-R2; Fitzgerald, Concord, MA) after 20 h in culture. VEGF expression was measured before the addition of the VEGF-E agonist (at 4 h) and after (24, 30, 48, 54, 72 h).
3. Results
Fig. 2 shows fluorescent images of the 5 stamps after fluorescent fibronectin inking (a), bright field images 30 min after the addition of cells (b), and fluorescent images of nuclei (c) and tight-junction formation (d) after 72 h. Patch sizes and their corresponding diameter and area were verified by measuring the diameter of the fluorescent fibronectin patches (Fig. 2a) in ImageJ (NIH). Cell coverage was measured from at least 10 separate patterns in each array (Fig. 3) and normalized by dividing by the total pattern area to calculate the percentage of cell coverage. Table 1 displays the mean filling efficiency and the mean cell size. Although fewer cells per unit area were present in the smaller patterns, the average cell size did not change as a function of pattern size. The ‘unpatterned’ samples corresponded to cells grown on 35 mm petri dishes treated with fibronectin. After 72 h, cells were fixed and stained for the presence of Zonaoccludens 1 (ZO-1) as an indicator of t ight junction formation (Fig. 4). ImageJ was used to assess the total area of tight junctions formed within each pattern. In order to understand tight junction formation within the patterned compared to unpatterned samples, the results were reported as a percent comparison relative to the tight junctions formed in a monolayer of RPE cells of an unpatterned sample of equal area. The average tight junction formation in smaller pattern sizes was lower and more variable (63 Æ 10% ZO-
1, 100 mm diameter pattern; 74 Æ 7%, 200 mm pattern) compared to
the larger pattern sizes (82e91%). Differences among the samples were not statistically significant. Total VEGF expression was first measured from each array of micropatterned areas after 72 h using an ELISA kit and is reported as the VEGF concentration per cell based on nuclear counts (Fig. 5).
After 72 h, the VEGF concentration per cell was inversely proportional to the patch size, i.e. RPE cells from smaller patches expressed higher levels of VEGF per cell. A monolayer of cells (unpatterned) and no cells on polystyrene surfaces were used as
Fig. 3. Percent cell coverage observed for each patch size. Error bars indicate one standard deviation.
3

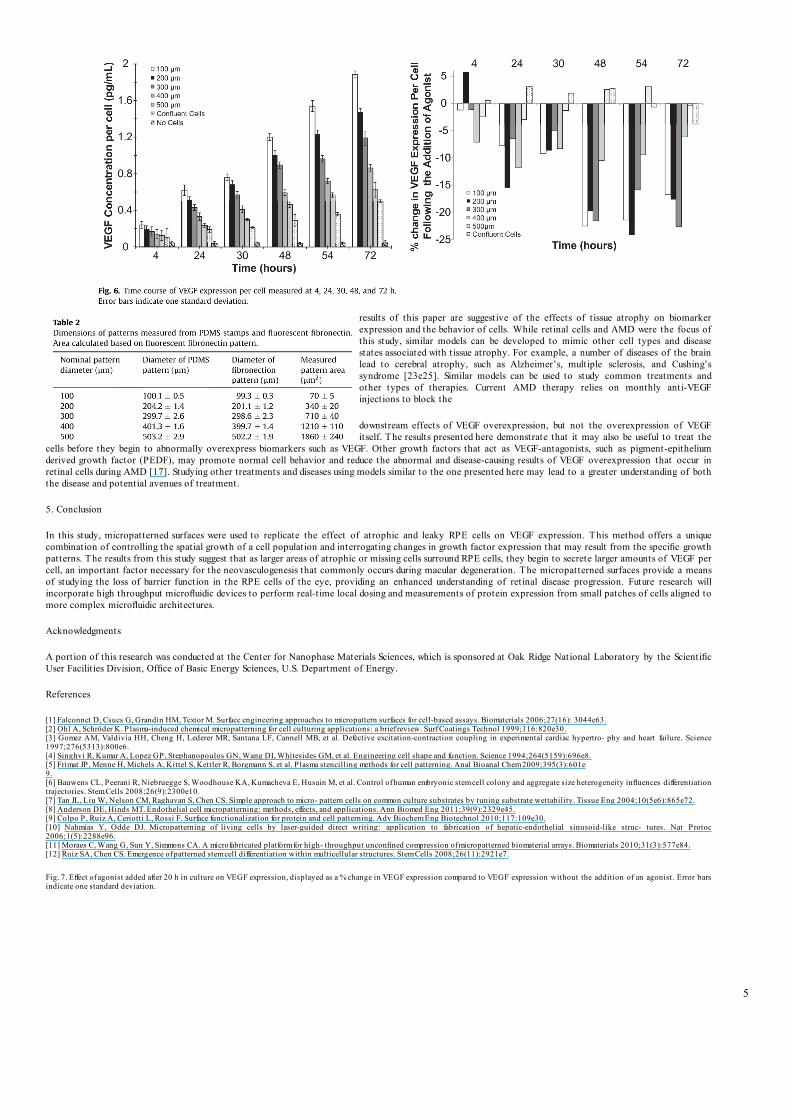
positive and negative controls, respectively. To understand how the concentration of VEGF changes over time, VEGF expression levels were also measured at various intervals (Fig. 6; 4, 24, 30, 48, 54, 72 h). While the level of VEGF was similar 4e24 h after the cells were seeded across the different pattern sizes, a significant difference was observed after 48 h, with smaller patches producing a higher amount of VEGF than larger patches or unpatterned samples (Fig. 6). Cells growing in small micropatterns may experience different local concentrations of VEGF compared to cells in larger patches, and thus alter VEGF expression levels to compensate. To determine if the higher levels of VEGF expression observed in cells grown in small patches was the result of cells responding to lower initial overall levels of VEGF in the RPE microenvironment, a VEGF agonist, VEGF-E, was added to the patterned surfaces at a concentration of 5 ng/mL, 5Â the amount of VEGF observed at 72 h time points, 20 h after the initial cell seeding. VEGF-E was derived from a non-human source and was therefore not detected with the VEGF ELISA. The concentration of VEGF after the addition of the agonist was measured at the same intervals as previous experiments and is
reported as the % change in VEGF expression per cell for each RPE patch size (Fig. 7). While the VEGF expression from the cells in the
positive control and the patterns of 500 and 400 mm diameter did
not change as a result of the additional VEGF-E, the VEGF levels
from the 100, 200 and 300 mm patterns decreased, reaching levels
per cell closer to the larger pattern sizes.
4. Discussion
The micropatterned surfaces were characterized to verify their true area and the amount of cells that adhered to each pattern. The measured diameter (Table 2) found from the fluorescent fibronectin patches (Fig. 2a) was used in all calculations of area to account for small variations in the PDMS mold and the stamping. Variations in the intensity of the fluorescent fibronectin were most likely due to differences in stamping pressure. The size and number of cells in each pattern size was then determined using the nuclear stained images (Fig. 2c) and dividing by the total area of each pattern (Fig. 3). Fig. 3 and Table 1 show that after 72 h, although cells of similar sizes were seeded onto each pattern, the mean filling efficiencies of smaller pattern sizes were lower than for larger patch sizes. This may have been due to the lower cell density resulting in lower cell viability or the mechanistic effects limiting the cells from adhering to smaller pattern sizes [2,13]. The size and morphology of the RPE cells was verified by measuring mean cell size (Table 1) and the percent of t ight junction formation relative to unpatterned cells for each patch size (Fig. 4). Differences between patches were not statistically significant. These results suggest that although there were fewer cells on smaller patterns, the RPE cells were similar in size, morphology and function across patch sizes. That the RPE cells in small patches expressed higher levels of VEGF per cell suggests that these cells may function to maintain a consistent level of VEGF within their local microenvironment. Cells in smaller patches respond by expressing higher amounts of VEGF to maintain basal VEGF levels (Figs. 5 and 6). RPE cells in larger patches can maintain the same basal levels of VEGF expression by expressing smaller amounts of VEGF per cell. Previous studies have shown that VEGF is a modulator of the barrier function in the retinal endothelial and RPE layers [19,20]. The expression of VEGF has similarly been characterized in excised retinal t issue. Human specimens with early and advanced AMD have significantly increased levels of VEGF compared to normal [21]. Normal RPE monolayers can also express higher levels of VEGF under hypoxic conditions [22]. Following the addition of the VEGF agonist to the micropatterned cultures, levels of VEGF expression per cell for the small patch sizes approached the levels of the unpatterned and larger patch sizes (Fig. 7). Adding the agonist effectively increased the amount of VEGF detected by the cultured cells in each sample. The VEGF levels per cell obtained from smaller patch sizes (100, 200,
300 mm) decreased after the VEGF agonist was added. We hy-
pothesize that cells within these smaller patterns reduce VEGF expression levels because of the increased levels of VEGF detected within their local environment. The patches of larger sizes were already exposed to higher levels of VEGF in their microenvironment and therefore showed no change in expression levels when a VEGF agonist was added. As a result , the cells cultured in larger patches maintained their basal VEGF expression. Microcontact printing provides a tool for manipulating the spatial organization of retinal pigment epithelial cells as a means of exploring the impact of atrophy, t issue damage, or loss-of-function within the retina. Combined with targeted biochemical measurements, these patterned growth techniques provide a potentially powerful way of examining the links between growth factor expression, t issue reorganization and the progression of AMD. The
Fig. 4. Tight junction (ZO-1) coverage after 72 h. Each measurement was normalized to the tight junction coverage of confluent layer of cells. Error bars indicate one standard deviation.
4
results of this paper are suggestive of the effects of t issue atrophy on biomarker expression and the behavior of cells. While retinal cells and AMD were the focus of this study, similar models can be developed to mimic other cell types and disease states associated with tissue atrophy. For example, a number of diseases of the brain lead to cerebral atrophy, such as Alzheimer’s, multiple sclerosis, and Cushing’s syndrome [23e25]. Similar models can be used to study common treatments and other types of therapies. Current AMD therapy relies on monthly anti-VEGF injections to block the
downstream effects of VEGF overexpression, but not the overexpression of VEGF itself. The results presented here demonstrate that it may also be useful to treat the
cells before they begin to abnormally overexpress biomarkers such as VEGF. Other growth factors that act as VEGF-antagonists, such as pigment-epithelium derived growth factor (PEDF), may promote normal cell behavior and reduce the abnormal and disease-causing results of VEGF overexpression that occur in retinal cells during AMD [17]. Studying other treatments and diseases using models similar to the one presented here may lead to a greater understanding of both the disease and potential avenues of treatment.
5. Conclusion
In this study, micropatterned surfaces were used to replicate the effect of atrophic and leaky RPE cells on VEGF expression. This method offers a unique combination of controlling the spatial growth of a cell population and interrogating changes in growth factor expression that may result from the specific growth patterns. The results from this study suggest that as larger areas of atrophic or missing cells surround RPE cells, they begin to secrete larger amounts of VEGF per cell, an important factor necessary for the neovasculogenesis that commonly occurs during macular degeneration. The micropatterned surfaces provide a means of studying the loss of barrier function in the RPE cells of the eye, providing an enhanced understanding of retinal disease progression. Future research will incorporate high throughput microfluidic devices to perform real-time local dosing and measurements of protein expression from small patches of cells aligned to more complex microfluidic architectures.
Acknowledgments
A portion of this research was conducted at the Center for Nanophase Materials Sciences, which is sponsored at Oak Ridge National Laboratory by the Scientific User Facilit ies Division, Office of Basic Energy Sciences, U.S. Department of Energy.
References
[1] Falconnet D, Csucs G, Grandin HM, Textor M. Surface engineering approaches to micropattern surfaces for cell-based assays. Biomaterials 2006;27(16): 3044e63. [2] Ohl A, Schröder K. P lasma-induced chemical micropatterning for cell culturing applications: a brief review. Surf Coatings Technol 1999;116:820e30. [3] Gomez AM, Valdivia HH, Cheng H, Lederer MR, Santana LF, Cannell MB, et al. Defective excitation-contraction coupling in experimental cardiac hypertro- phy and heart failure. Science 1997;276(5313):800e6. [4] Singhvi R, Kumar A, Lopez GP, Stephanopoulos GN, Wang DI, Whitesides GM, et al. Engineering cell shape and function. Science 1994;264(5159):696e8. [5] Frimat JP , Menne H, Michels A, Kittel S, Kettler R, Borgmann S, et al. P lasma stencilling methods for cell patterning. Anal Bioanal Chem 2009;395(3):601e 9. [6] Bauwens CL, Peerani R, Niebruegge S, Woodhouse KA, Kumacheva E, Husain M, et al. Control of human embryonic stem cell colony and aggregate size heterogeneity influences differentiation trajectories. Stem Cells 2008;26(9):2300e10. [7] Tan JL, Liu W, Nelson CM, Raghavan S, Chen CS. Simple approach to micro- pattern cells on common culture substrates by tuning substrate wettability. Tissue Eng 2004;10(5e6):865e72. [8] Anderson DE, Hinds MT. Endothelial cell micropatterning: methods, effects, and applications. Ann Biomed Eng 2011;39(9):2329e45. [9] Colpo P , Ruiz A, Ceriotti L, Rossi F. Surface functionalization for protein and cell patterning. Adv Biochem Eng Biotechnol 2010;117:109e30. [10] Nahmias Y, Odde DJ. Micropatterning of living cells by laser-guided direct writing: application to fabrication of hepatic-endothelial sinusoid-like struc- tures. Nat Protoc 2006;1(5):2288e96. [11] Moraes C, Wang G, Sun Y, Simmons CA. A microfabricated platform for high- throughput unconfined compression of micropatterned biomaterial arrays. Biomaterials 2010;31(3):577e84. [12] Ruiz SA, Chen CS. Emergence of patterned stem cell differentiation within multicellular structures. Stem Cells 2008;26(11):2921e7.
Fig. 7. Effect of agonist added after 20 h in culture on VEGF expression, displayed as a % change in VEGF expression compared to VEGF expression without the addition of an agonist. Error bars indicate one standard deviation.
5

[13] Tzvetkova-Chevolleau T, Stephanou A, Fuard D, Ohayon J, Schiavone P , Tracqui P . The motility of normal and cancer cells in response to the combined influence of the substrate rigidity and anisotropic microstructure. Bio- materials 2008;29(10):1541e51. [14] Chopdar A, Chakravarthy U, Verma D. Age related macular degeneration. BMJ 2003;326(7387):485e8. [15] Klettner A, Roider J. Treating age-related macular degeneration e interaction of VEGF-antagonists with their target. Mini Rev Med Chem 2009;9(9):1127e 35. [16] Kvanta A. Expression and regulation of vascular endothelial growth factor in choroidal fibroblasts. Curr Eye Res 1995;14(11):1015e20. [17] Ablonczy Z, Prakasam A, Fant J, Fauq A, Crosson C, Sambamurti K. P igment epithelium-derived factor maintains retinal pigment epithelium function by inhibiting vascular endothelial growth factor-R2 signaling through gamma- secretase. J Biol Chem 2009;284(44):30177e86. [18] Ohno-Matsui K, Yoshida T, Futagami S, Yasuzumi K, Shimada N, Kojima A, et al. Patchy atrophy and lacquer cracks predispose to the development of choroidal neovascularisation in pathological myopia. Br J Ophthalmol 2003;87(5):570e3. [19] Ablonczy Z, Crosson CE. VEGF modulation of retinal pigment epithelium resistance. Exp Eye Res 2007;85(6):762e71.
[20] Georgiadis A, Tschernutter M, Bainbridge JW, Balaggan KS, Mowat F, West EL, et al. The tight junction associated signalling proteins ZO-1 and ZONAB regulate retinal pigment epithelium homeostasis in mice. PLoS One 2010;5(12):e15730. [21] Kliffen M, Sharma HS, Mooy CM, Kerkvliet S, de Jong PT. Increased expression of angiogenic growth factors in age-related maculopathy. Br J Ophthalmol 1997;81(2):154e62. [22] Witmer AN, Vrensen GF, Van Noorden CJ, Schlingemann RO. Vascular endo- thelial growth factors and angiogenesis in eye disease. Prog Retin Eye Res 2003;22(1):1e29. [23] Chetelat G, Villemagne VL, Bourgeat P , P ike KE, Jones G, Ames D, et al. Rela- tionship between atrophy and beta-amyloid deposition in Alzheimer disease. Ann Neurol 2010;67(3):317e24. [24] Chard DT, Griffin CM, Parker GJ, Kapoor R, Thompson AJ, Miller DH. Brain atrophy in clinically early relapsing-remitting multiple sclerosis. Brain 2002;125(Pt 2):327e37. [25] Ragnarsson O, Berglund P , Eder DN, Johannsson G. Long-term cognitive im- pairments and attentional deficits in patients with Cushing’s disease and cortisol-producing adrenal adenoma in remission. J Clin Endocrinol Metab 2012;97(9):E1640e8.
6