Human iPSC- and Primary-Retinal Pigment Epithelial Cells for ...

Retinal Pigment Epithelium Defects in Humans and Mice withMutations in MYO7A: Imaging Melanosome-SpecificAutofluorescence
Daniel Gibbs*,1,2, Artur V. Cideciyan3, Samuel G. Jacobson3, and David S. Williams*,1,21Department of Pharmacology, UCSD School of Medicine, La Jolla, California2Department of Neurosciences, UCSD School of Medicine, La Jolla, California3Department of Ophthalmology, Scheie Eye Institute, University of Pennsylvania, Philadelphia,Pennsylvania
AbstractPURPOSE—Usher syndrome (USH) is a genetically heterogeneous disease with autosomalrecessive deafness and blindness. Gene therapy is under development for use in the most commongenetic variant of USH1, USH1B, which is caused by mutations in the MYO7A gene. This study wasundertaken to identify an imaging method for noninvasively monitoring the RPE component of theUSH1B disease.
METHODS—NIR-autofluorescence (NIR-AF) was examined in USH1B patients with scanninglaser ophthalmoscopy, and retinal thickness with spectral-domain optical coherence tomography.Myo7a-null mouse retinas and purified RPE melanosomes were analyzed by spectral deconvolutionconfocal microscopy.
RESULTS—In USH1B patients, NIR-AF was normal in regions of retained photoreceptors andabnormal in regions lacking photoreceptors. Subtle changes in NIR-AF were associated withintermediate photoreceptor loss. In ex vivo mouse retinas, the NIR-AF source was traced to themelanosomes in the RPE and choroid. Purified RPE melanosomes emitted the same signal.Fluorophores, excited by long-wavelength light, were evident throughout the apical RPE of WTmouse eyecups. In Myo7a-null eyecups, these fluorophores had a more restricted distribution. Theywere absent from the apical processes of the RPE, thus correlating with the melanosome localizationdefects described previously by conventional microscopy.
CONCLUSIONS—The data indicate that melanosomes in the RPE and choroid are the dominantsource of NIR-AF from the posterior region of the eye. NIR-AF is a novel tool that provides sensitiveand label-free imaging of the retina and RPE and is currently the only melanosome-specific,noninvasive technique for monitoring RPE disease in new therapeutic initiatives for retinaldegenerations.
Vision loss in human hereditary retinal degenerations (RDs) is caused mainly by mutations ingenes expressed in the photoreceptors, the retinal pigment epithelium (RPE), or both. In theUsher syndromes (USH), mutant genes also lead to inner ear dysfunction and cause debilitating
Copyright © Association for Research in Vision and Ophthalmology*Each of the following is a corresponding author: Daniel Gibbs, The Salk Institute for Biological Studies, 10010 N. Torrey Pines Road,La Jolla, CA 92037-1099; [email protected]., David S. Williams, Jules Stein Eye Institute, UCLA School of Medicine, 200 Stein Plaza,Los Angeles, CA 90095-7008; [email protected]: D. Gibbs, None; A.V. Cideciyan, None; S.G. Jacobson, None; D.S. Williams, None
NIH Public AccessAuthor ManuscriptInvest Ophthalmol Vis Sci. Author manuscript; available in PMC 2010 June 13.
Published in final edited form as:Invest Ophthalmol Vis Sci. 2009 September ; 50(9): 4386–4393. doi:10.1167/iovs.09-3471.
NIH
-PA Author Manuscript
NIH
-PA Author Manuscript
NIH
-PA Author Manuscript

bisensory disease. The success of human gene therapy in retinas of patients with LCA1–4 haspaved the way for the application of this technique to other blinding disorders, such as the mostcommon form of USH type 1, USH1B, which is caused by mutations in the myosin VIIa(MYO7A) gene.5,6 MYO7A is an unconventional myosin motor protein expressed both inretinal photoreceptors and the RPE.7,8 In photoreceptors, MYO7A appears to participate inopsin transport through the cilium, whereas in the RPE, one of its functions is in the movementof melanosomes. 9,10 Whether gene therapy of USH1B11,12 targets photoreceptors or RPE, orboth, there is a need to monitor RPE-melanosome disease independent of photoreceptor diseaseand vision.
RPE forms a thin monolayer between the photoreceptors and their blood supply, the choroid.13 Noninvasive evaluation of RPE health have depended on the lipofuscin granules foundwithin these cells.14,15 Lipofuscin is a lipid and protein aggregate containing several distinctfluorophores that produce yellow-orange emission spectra when excited by blue light.14–16
Noninvasive imaging methods that take advantage of the autofluorescence (AF) of lipofuscinhave enabled mapping and quantification of RPE disease and its progression in living humaneyes with retinal degenerative diseases.15,17–20 However, conventional lipofuscin imaginginvolves bright short-wavelength illumination that may accelerate the natural history ofRDs21 and possibly complicate outcomes of a clinical trial. Reduced short-wavelengthilluminance methods are being developed. 20
RPE cells also contain abundant intracellular pigment granules, which correspond to the laststage of melanosome maturation—a process that starts early during gestation and is practicallycomplete before 2 years of age in humans.22,23 Melanosomes in the RPE are thought to playa protective role by absorbing radiation, scavenging free radicals and quenching excitedmolecular states.22,24 Alternatively or additionally, melanosomes could mediate light-inducedtoxicity in the RPE.25 They may also contribute to protein degradation after the phagocytosisof outer segment disc membranes.22,26 Until recently, only indirect methods were availablefor imaging the abnormalities of melanin, based on absorption and scattering properties.27–30 Recently, a novel AF signal has been observed by noninvasive imaging of living humaneyes with near-infrared (NIR) excitation light.20,31–38 It has been speculated thatmelanosomes contribute to the NIR-AF signal, but the validity of this hypothesis or the extentof the contribution from different fluorophores has not been defined. In the present study, AFimaging was used in USH1B patients and in Myo7a-null shaker1 mice. The results identifymelanosomes of the RPE and choroid as the endogenous fluorophores that give rise to the NIR-AF signal and set the stage for further development of NIR-AF imaging to define and monitorsubtle melanosome abnormalities in the RPE before and after therapeutic interventions.
MATERIALS AND METHODSHuman Subjects
Patients with USH1B (i.e., with MYO7A mutations) were included.6,30 Subjects P1, P2, andP3 in the current paper correspond to F5,P2, F3,P1, and F14,P1, respectively, in Jacobson etal.6 Informed consent was obtained; procedures adhered to the Declaration of Helsinki andreceived institutional review board approval.
Autofluorescence (AF) Imaging with the Confocal Scanning Laser Ophthalmoscope (CSLO)En face AF imaging was performed in living human eyes with CSLO (HRA2; HeidelbergEngineering GmbH, Heidelberg, Germany) with NIR excitation light at 790 nm and a long-pass blocking filter that allowed detection of fluorescence emissions of >810 nm.20,33–35 Thepower of the NIR light measured at the cornea was 2.5 mW. The high-resolution mode of theangiograph was used where 30° × 30° of retina is sampled onto a 1536 × 1536-pixel, image
Gibbs et al. Page 2
Invest Ophthalmol Vis Sci. Author manuscript; available in PMC 2010 June 13.
NIH
-PA Author Manuscript
NIH
-PA Author Manuscript
NIH
-PA Author Manuscript
and 25-frame video sequences were obtained at the rate of 4.7 Hz. Detector sensitivity was setto 95%. The images were exported from the manufacturer’s software and analyzed asdescribed.20,33–35 NIR-AF signal intensity was measured along a 30-pixel-wide (176-µm)profile passing through the foveola and the center of the optic nerve head. Microscope slideswith purified melanosomes were imaged with the use of an additional 20-D lens at a workingdistance of ~10 mm using a focus setting of 52 D. A 15° setting was used at 768 × 768-pixelresolution spanning a field of view of ~5 mm. Off-axis imaging was used to avoid specularreflections from the cover slide. One hundred consecutive frames were obtained and averagedto increase signal to noise ratio.
Cross-sectional Imaging with Optical Coherence Tomography (OCT)Retinal cross sections were obtained with spectral-domain (SD) OCT imaging (RTVue-100;Optovue Inc., Fremont, CA). The principles of the method and our recording and analysistechniques have been published.6,34,35,39,40 Briefly, overlapping OCT scans that were 4.5mm in length were used to cover the horizontal and vertical meridians up to 9 mm eccentricityfrom the fovea. At least three OCT scans were obtained at each retinal location. Dense,overlapping SD-OCT raster scans (101 raster lines of 512 A-scans each covering 6 × 6 mm)were performed to sample an 18 × 12-mm region of the retina centered on the fovea.Postacquisition processing of OCT data was performed with custom programs (MatLab ver.6.5; MathWorks, Natick, MA).
AnimalsShaker1 mice carrying the 4626SB allele, an effective null mutation of Myo7a,41,42 werebackcrossed onto the C57BL/6 genetic background and genotyped as described.9,43 AlbinoC57Bl/6J-Tyrc-2J (Jackson Laboratories, Bar Harbor, ME) mice were used as a strain-matchednonpigmented control. All animals were 2 to 3 months old and were maintained on a 12-hourlight/12-hour dark cycle, with exposure to 30 to 80 lux of fluorescent lighting during thesubjective daytime. Shaker1 homozygous mutants were also distinguished from heterozygouscontrols by their hyperactivity, head-tossing, and circling behavior. All procedures conformedto institutional animal care and use authorizations and were in accordance with regulationsestablished by the National Institutes of Health and the ARVO Statement for the Use of Animalsin Ophthalmic and Vision Research.
Preparation of Whole-Mount EyecupsEnucleated globes from adult pigmented and albino mice were dissected on ice in Ringer’sbuffer (130 mM NaCl, 3.6 mM KCl, 2.4 mM MgCl2, 1.2 mM CaCl2, 10 mM HEPES withKOH [pH 7.4], and 20 mM EDTA). Eyecups (the posterior hemisphere) were flattened bymaking incisions around the rim, and placed on poly-L-lysine-coated microscope slides withthe neural retina uppermost. A thin rim of silicon sealant was placed around each eyecup, whichwas then mounted in PBS and 1% glycerol, with an optical coverslip. Eyecups were then usedimmediately for microscopy.
Histology and Immunofluorescence LabelingEyes for cryosectioning were immersion fixed in cold (−20°C) 90% methanol/10% MES (100mM MES, 1 mM EGTA, 1 mM MgSO4 [pH 6.9]), rehydrated in PBS and then processed,cryosectioned, and mounted as described previously.10 Incubation of the retinal sections in0.1% sodium borohydride in PBS was omitted to prevent quenching of autofluorescence.
Eyecups for immunolabeling were dissected as described earlier, then fixed by immersion incold 90% methanol/10% MES buffer, rehydrated in 1% goat serum in PBS, and detergenttreated with 1% saponin (Sigma-Aldrich, St. Louis, MO) in PBS. They were incubated
Gibbs et al. Page 3
Invest Ophthalmol Vis Sci. Author manuscript; available in PMC 2010 June 13.
NIH
-PA Author Manuscript
NIH
-PA Author Manuscript
NIH
-PA Author Manuscript
overnight at 4°C with the affinity-purified MYO7A antibody pAb2.28 diluted in blockingbuffer (0.1% saponin, 1% goat serum in PBS), followed by 1 hour at room temperature withAlexa Fluor 594 goat anti-rabbit secondary antibody (Invitrogen, Carlsbad, CA), diluted1:1000 in blocking buffer. Fluorescent probes against filamentous actin (FITC-phalloidin1:200; Invitrogen) and DNA (DAPI, 1:10,000 Molecular Probes) were included with thesecondary antibody incubation. Labeled eyecups were flat mounted (Mowiol; Calbiochem,San Diego, CA), as described earlier.
Purification of Melanosomes from Mouse RPE CellsSheets of RPE cells were isolated from heterozygous shaker1 mouse eyes as describedpreviously,43 pooled, and stored at −80°C until needed. Highly enriched melanosome fractionspurified from RPE sheets were obtained by sequential centrifugation and purification over a50% iodixanol cushion (Optiprep; Sigma-Aldrich), as described previously.10,26 The highly-enriched melanosome pellet was resuspended in PBS, mounted on a microscope slide, andeither used immediately for microscopy or sealed with varnish and shipped to the otherlaboratory.
Autofluorescence and Spectral Deconvolution Confocal MicroscopyMultispectral autofluorescent and immunofluorescent datasets were collected from whole-mount eyecups, retinal cryosections, and enriched melanosome fractions by using the 63× oil,plan apochromat, 1.4-NA objective on a spectral deconvolution scanning laser confocalmicroscope (model FV1000; Olympus, Lake Success, NY), equipped with violet diode (405nm), argon-ion (457/488/514 nm), krypton-ion (563 nm), and helium-neon ion (633 nm) lasers.Four independent photomultipliers (PMTs) were used for detection of emission spectra. Laserintensity, pinhole diameter, PMT gain, PMT black level, scan speed, and image size wereconstant for each excitation wavelength between experiments. Laser irradiance levels at theplane of the sample were: 2.5 (405 nm), 1.4 (488 nm), 6 (633 nm), and 1.5 (563 nm) mW.Acquisition was controlled via the integrated software (FluoView; Olympus) software.
AF datasets were acquired at 633-nm excitation, and emission spectra were collected at 10-nmintervals between 700 and 800 nm, using the λ scan function in blind mode. This spectraldeconvolution function utilizes calibrated diffraction gratings to provide a variable band-passemission filter with 2-nm spectral resolution. AF datasets were acquired at 488-nm excitationand emission spectra collected between 500 and 600 nm, 600 and 700 nm, 700 and 800 nm,or 730 and 760 nm. In both cases, emission spectra were collected at wavelengths sufficientlydistant from the excitation light to prevent contamination of the emission signals by reflectedexcitation light. Emission spectra from fluorescent probes were acquired sequentially usingthe 405/488/563-nm laser lines with the following emission band-pass filters: DAPI (peak 447/BP 60), FITC-phalloidin (536/40), and Alexa Fluor 594 (624/40). Image datasets withassociated metadata were exported as 12-bit.oib files. Image analysis, 3-D reconstruction, andmontaging were performed with two image-analysis programs (ImageJ; developed by WayneRasband, National Institutes of Health, Bethesda, MD; available athttp://rsb.info.nih.gov/ij/index.html, and Photoshop CS3; Adobe Systems, Inc., San Jose, CA).
RESULTSIn Vivo Topography of Retinal Disease and NIR-AF in Patients with USH1B
Results from three representative patients with USH1B demonstrated NIR-AF signaltopography at different disease stages compared with that in a normal subject (Figs. 1A–D).P1 at age 21 had the mildest disease, with a large expanse of central retina showing an NIR-AF signal distribution that was qualitatively similar to that of the 24-year-old normal subject(Figs. 1A, 1B). There was a bright region of higher NIR-AF signal intensity corresponding to
Gibbs et al. Page 4
Invest Ophthalmol Vis Sci. Author manuscript; available in PMC 2010 June 13.
NIH
-PA Author Manuscript
NIH
-PA Author Manuscript
NIH
-PA Author Manuscript

a 2- to 3-mm diameter region centered on the fovea surrounded by a lower intensity signalextending across the macula.20,31,36,38 Cross-sectional imaging showed normal lamination ofthe retina (Figs. 1A, 1B, insets). In P1, retinal degeneration and consequent loss of visualfunction was apparent nasal to the optic nerve head and at eccentricities greater than ~4 to 5mm from the fovea (Fig. 1B, arrowheads). P2 at age 11 shows a central region of higher NIR-AF signal surrounded by a lower signal region (Fig. 1C). The ellipsoid boundary apparent onNIR-AF corresponded to the transition zone between detectable and undetectable outerphotoreceptor nuclear layer (ONL) thickness apparent on cross-sectional imaging (Fig. 1C,inset). P3 at age 61 demonstrated a more severe stage of USH1B retinal disease. Low NIR-AFsignal, forming the background of the image, was interrupted by dark vessels displaying achoroidal pattern (Fig. 1D). Cross-sectional imaging showed a delaminated retina with littleevidence of photoreceptors and a substantial increase in choroidal penetration of the NIRscanning light (Fig. 1D, inset).
NIR-AF signal was quantitatively compared to normal results along a linear profile crossingthrough the foveola and the center of the optic nerve head (Fig. 1E). The profiles of P1 and thenormal subject had similar shapes and there was no statistically significant reduction in signalintensity. ONL thickness was within normal limits in P1 and the normal subject across thecentral region examined (Fig. 1F). In P2, the NIR-AF signal was normal in the central ~4-mmdiameter region. Surrounding this region, P2 signal intensities were at or below the lower limitof normal. The ONL thickness in P2 was normal only for the central ~2-mm-diameter regionsurrounded by an abnormally reduced region. Throughout the central retinal region of P3, NIR-AF signal was abnormally reduced; ONL thickness was reduced to the detection limit of theinstrument. These results suggest that significant reductions in NIR-AF intensity colocalizewith severe degeneration of photoreceptors in USH1B. The contrast between healthier andmore degenerate retinal regions may depend on the signal intensity originating from thechoroid, which is thought to correlate with iris color.31
Ex Vivo NIR-AF Imaging of Mouse Retinal SectionsPigmented (C57BL/6) and albino (C57BL/6tyr/tyr) mouse eyecups were imaged from semithincryosections with a spectral deconvolution scanning laser confocal microscope (SDCM) andthe 633-nm laser line for red excitation of endogenous fluorophores. AF(ex.633) images of theresulting emission spectra were collected at 10-nm intervals from 700 to 800 nm. In pigmentedretinal sections, AF(ex.633) was detected between 730 and 760 nm and localized to the RPEand choroid, as identified by simultaneous DIC imaging (Fig. 2A–C). The AF emissionbetween 730 and 760 nm was reduced greatly in regions of the RPE and choroid containingdensely packed melanosomes, suggesting that much of the emission signal was quenched.Since melanosomes absorb ~790-nm light (see Figs. 1, 4), AF emitted from 633-nm excitationcould therefore be absorbed by neighboring melanosomes, so that it is likely that the totalmelanosome-specific AF is significantly underestimated by these imaging conditions. Nosignificant AF(ex.633) originating from the RPE, choroid, or neural retina was detected at theother emission wavelengths (Supplementary Fig. S1; all Supplementary Figures are online athttp://www.iovs.org/cgi/content/full/50/9/4386/DC1). SDCM imaging of albino retinalsections under identical conditions did not demonstrate any detectable AF in either the RPE/choroid or the neural retina at 730 to 760 nm (Figs. 2D–F) or any of the other emissionwavelengths measured (Supplementary Fig. S1). High-magnification SDCM of pigmentedRPE (Figs. 2G–I) was used to demonstrate that the AF(ex.633) signal localized to individualmelanosomes, identified by concurrent wide-field differential interference contrast (DIC)imaging.
To define the emission spectrum of the AF(ex.633) signal better, we plotted the averagefluorescence intensity from the RPE layer as a function of emission wavelength from
Gibbs et al. Page 5
Invest Ophthalmol Vis Sci. Author manuscript; available in PMC 2010 June 13.
NIH
-PA Author Manuscript
NIH
-PA Author Manuscript
NIH
-PA Author Manuscript

pigmented and albino RPE SDCM datasets (Fig. 2J). Differences in nonspecificautofluorescence between retinal sections, resulting from variations in sample processing werecontrolled for by subtraction of the average background autofluorescence, directly measuredfrom a region of each retina (the inner plexiform layer) without any melanosomes or knownautofluorescent granules present. In pigmented RPE, a major emission peak was identified at730 to 740 nm with a minor peak at 750 to 760 nm; both peaks were absent from albino RPE.Note that nearly all the melanosomes in the RPE of adult pigmented mice are mature (stageIV), and thus contain melanin; whereas, in albino RPE, lack of tyrosinase activity arrestsmelanosome biosynthesis before the deposition of the melanin pigment, so that onlypremelanosomes are present.23 These results demonstrate that the novel fluorophores identifiedby AF(Ex.633) imaging require melanin biosynthesis and specifically colocalize withmelanosomes, but not with premelanosomes, or other organelles in pigmented RPE.
Melanosome versus Lipofuscin AutofluorescenceFor a comparison of the autofluorescence properties of melanosomes with that of lipofuscin,SDCM images were obtained sequentially from the same sections using 488- and 633-nmexcitation (Fig. 3). AF emissions with 488-nm excitation, AF(ex.488), were measured over awide spectrum from 500 to 800 nm and contrasted to emissions with 633-nm excitation, AF(ex.633), over 730 to 760 nm. The maximum AF(ex.488) signal was detected between 500 and600 nm, predominantly in the RPE and the photoreceptor outer segments (OS; Fig. 3A,Supplementary Fig. S2). This result is in agreement with previous reports describing AF(ex.488) of lipofuscin peaking between 500 and 600 nm.15,44,45 AF(ex.488) intensity at 600 to700 nm was detectable but significantly lower (Fig. 3B), consistent with a previous report.46
Of importance, AF(ex.488) at 700 to 800 nm was reduced to 5% of the emission maximum inthe RPE (Fig. 3C) and 2% in the neural retina (Supplementary Fig. S2). No significant AF(ex.488) signal was detected over the 730 to 760-nm emission range (Fig. 3D), in striking contrastto the strong AF(ex.633) signal emanating from the RPE and choroid (Fig. 3E). Although theAF(ex.488) signal at 500 to 600 nm showed some overlap with the AF(ex.633) signal at 730to 760 nm, in the RPE, the two are clearly distinct (Fig. 3F). The peak AF(ex.633) is localizedto populations of melanosomes in the RPE (most evident apically) and choroid. In contrast,peak AF(ex.488) was found predominantly in the RPE cell body and photoreceptor OS. AF(ex.488) did not localize with melanosomes in the RPE and was absent from the heavilymelanized choroidal layer at all emission wavelengths measured, indicating that AF(ex.633)signals represent novel fluorophores specific to melanosomes in the RPE and choroid and arenot a result of cross-talk from lipofuscin AF.
NIR-AF Imaging of Purified MelanosomesTo address the specificity of red- and NIR-AF signals, highly enriched fractions ofmelanosomes, isolated from purified sheets of C57BL/6 RPE, were imaged. The purificationmethod results in an almost pure population of predominantly mature melanosomes with onlyminor contamination from nuclei, mitochondria, and endosomes/lysosomes.26 Isolatedmelanosomes demonstrated strong AF(ex.633) between 730 and 770 nm that was specific formelanosomes identified morphologically by concurrent DIC imaging (Figs. 4A–C). The AFwas significantly less at wavelengths below and above this emission band (Supplementary Fig.S3).
For a comparison of the NIR-AF signals collected in vivo with 790-nm excitation, using CSLO,and ex vivo with 633-nm excitation, using SDCM, the same regions of a microscope slide wereimaged with both systems at equivalent magnification. Identical clusters of melanosomesshowed AF signal with both imaging systems, despite the differences in the wavelength of theexcitation light and spectral bands of the collected emission (Figs. 4D–F, 4G–I). These red-and NIR-AF signals were also exceedingly stable, surviving extended illumination on both
Gibbs et al. Page 6
Invest Ophthalmol Vis Sci. Author manuscript; available in PMC 2010 June 13.
NIH
-PA Author Manuscript
NIH
-PA Author Manuscript
NIH
-PA Author Manuscript

systems, as well as transport between our laboratories. Taken together with the data obtainedfrom retinal sections (Figs. 2–3), these results demonstrate that melanosomes are bothnecessary and sufficient for NIR-AF in RPE cells, and indicate that they are the predominantfluorophores across a relatively broad excitation and emission range, with no significantcontribution from other cellular components, including lipofuscin granules or A2E. Thus NIRautofluorescence microscopy provides sensitive and label-free chemical contrast, specific tomelanin granules in mature melanosomes.
Detection of Melanosome Position Defects in Myo7a-Shaker1 EyecupsNext, we tested whether AF(ex.633) imaging in shaker1 mouse eyecups would providesufficient resolution to detect the previously described altered distribution of RPEmelanosomes. In shaker1 RPE, the melanosomes are absent from the apical processes, beingrestricted to the cell body.9,10 Three-dimensional multispectral SDCM imaging wasperformed on whole-mount eyecups, isolated from pigmented shaker1 and control littermates.In both control and mutant RPE cells, F-actin was distributed normally. Optical sectionsthrough the apical region showed FITC-phalloidin labeling of the apical processes. Themelanosome-specific AF(ex.633) was present as discrete puncta in the RPE cell layer of controland mutant whole-mount preparations, and was absent from the adjacent neural retina.However, in optical sections of the RPE apical processes, it was much more evident in controlthan in mutant RPE (Figs. 5A, 5B). Three-dimensional reconstruction of the apical RPE showedmore clearly that, in the mutants compared with controls, the AF(ex.633) signal was absentfrom the apical processes, which are indicated by the F-actin fluorescence. Instead it waspresent along the bases of the processes (Fig. 5C, 5D). Quantitative image analysis measuringthe peak fluorescence intensity for each channel at each optical section through the RPE layeralso identified a significant basal shift in the AF(ex.633) signal in mutants relative to controls,whereas the fluorescence intensity profiles for F-actin were comparable between mutant andcontrol samples (Figs. 5E, 5F). These results agree with the hypothesis that AF(ex.633)between 730 and 760 nm is highly specific for melanosomes in the RPE and can be usedeffectively to detect defects in the localization of melanosomes without prior labeling.
Imaging NIR-AF in Conjunction with Fluorescently Labeled ProteinsThe successful use of AF(ex.633) to identify melanosomes relative to F-actin in whole-mounteyecups with SDCM suggests that this approach could be used with a variety of differentfluorescent probes. We therefore imaged whole-mount eyecups that had been colabeled withprobes for F-actin (FITC-phalloidin), nuclei (DAPI), and anti-MYO7A (pAb2.2/Alexa594).Images of RPE cells showed that no significant fluorescence cross-talk was evident among thedifferent fluorophores (Supplementary Figs. S4A–D). Hence, AF(ex.633) would be useful forconfocal multispectral imaging of multiple cellular probes in conjunction with melanosomes,where the choice of antibodies and exogenous fluorophores may be limited, and wheretransmitted-light imaging of melanosomes cannot be used (such as in whole-mountpreparations).
DISCUSSIONThere is a long history of investigation of the role of RPE in the visual process and itsrelationship with neighboring photoreceptors. 47 Basic science has continually refined ourunderstanding of the RPE, but noninvasive assays of RPE integrity or health in a clinical settinghave been mainly limited to low-magnification anatomic description using ophthalmoscopyand angiography, and functional testing by stimulation of the entire eye.47 With identificationof the molecular basis of human ocular diseases has come the prospect of increasedunderstanding of pathogenic mechanisms and treatment of previously incurable humanhereditary retinal degenerations.1–4 It is also now possible to make cellular-level measurements
Gibbs et al. Page 7
Invest Ophthalmol Vis Sci. Author manuscript; available in PMC 2010 June 13.
NIH
-PA Author Manuscript
NIH
-PA Author Manuscript
NIH
-PA Author Manuscript

of the neural retina with state-of-the-art imaging methods,48–51 but there are very few methodsavailable for in vivo evaluation of individual or groups of RPE cells despite the fact that RPEhealth is absolutely necessary for the survival of neighboring retinal photoreceptors.13
RPE health can be studied with conventional AF imaging using short-wavelength excitationlight that takes advantage of the endogenous lipofuscin fluorophores.15,18 In vivo images ofindividual RPE cells have been obtained by combining adaptive optics with AF imaging, butthe safety of short-wavelength excitation is a concern,21,52 especially in diseased retinas.53,54 Longer wavelength light has a better safety profile,21 and back-scatter intensity29,30 orpolarization properties55 of NIR light have been used to obtain nonspecific information onRPE health.
A combination of NIR excitation and AF imaging was recently developed.20,31,32 Endogenousfluorophores contributing to the NIR-AF signal have been postulated to include melanin andmelanolipofuscin granules,20,31,32,36 but fluorescence emissions beyond 700 nm have neverbeen evaluated directly in the neural retina, RPE, or choroid. RPE melanosomes are known todemonstrate only very faint autofluorescence emissions in visible wavelengths (400–700 nm)when excited by short-wavelength (300–500 nm) light.56 Cutaneous melanin, however, doesshow an NIR-AF signal.57 A major finding in the present study was the specific attribution ofNIR-AF signal to ocular melanosomes in the RPE and choroid. We demonstrated the importantfinding that lipofuscin granules of the RPE and many other potential fluorophores of the neuralretina or the RPE did not contribute detectably to the NIR-AF signal. Thus, NIR-AF imagingcan now be added to the limited armamentarium of in vivo methods for the direct andmelanosome-specific evaluation of RPE health.
Several molecularly characterized human retinopathies investigated thus far havedemonstrated RPE abnormalities corresponding to abnormally high or low NIR-AF signals.20,33–35 The present work in human USH1B represents the first investigation of a potentialbicellular molecular defect in the photoreceptors and the RPE.9,10,42,43 The ex vivodetectability of defective melanosome localization in the apical RPE of Myo7a-null mice atteststo the potential sensitivity of the NIR-AF imaging to earliest stages of RPE disease. Assumingthat the mutant phenotypes in mouse retina are faithfully represented in human USH1B, ourfinding of apparently normal NIR-AF in patients at early stages of USH1B disease signals theneed for future investigation with advancement of techniques. One possibility may be to includea combination of adaptive optics technology with NIR-AF for cellular-level imaging withsubcellular organelle specificity. In the meantime, longitudinal evaluation of differentparameters of RPE disease progression with the currently available NIR-AF imaging is likelyto be useful for therapeutic interventions intended to modify the natural history of retinaldegenerative diseases.
Supplementary MaterialRefer to Web version on PubMed Central for supplementary material.
AcknowledgmentsThe authors thank Xiaodan Song, Malgorzata Swider, Sharon B. Schwartz, Alexander Sumaroka, and Tomas S.Aleman for critical help and the UCSD Human Embryonic Stem Cell Core for the use of the FV1000 confocalmicroscope.
Supported by grants from the National Eye Institute (EY07042 and EY13203), National Neurovision ResearchInstitute, Foundation Fighting Blindness, Macula Vision Research Foundation, Hope for Vision, Research to PreventBlindness (RPB), and the Ruth and Milton Steinbach Fund. DSW is a Jules and Doris Stein RPB Professor.
Gibbs et al. Page 8
Invest Ophthalmol Vis Sci. Author manuscript; available in PMC 2010 June 13.
NIH
-PA Author Manuscript
NIH
-PA Author Manuscript
NIH
-PA Author Manuscript

References1. Bainbridge JW, Smith AJ, Barker SS, et al. Effect of gene therapy on visual function in Leber’s
congenital amaurosis. N Engl J Med 2008;358:2231–2239. [PubMed: 18441371]2. Maguire AM, Simonelli F, Pierce EA, et al. Safety and efficacy of gene transfer for Leber’s congenital
amaurosis. N Engl J Med 2008;358:2240–2248. [PubMed: 18441370]3. Hauswirth W, Aleman TS, Kaushal S, et al. Treatment of Leber congenital amaurosis due to RPE65
mutations by ocular subretinal injection of adeno-associated virus gene vector: short-term results of aphase I trial. Hum Gene Ther 2008;19:979–990. [PubMed: 18774912]
4. Cideciyan AV, Aleman TS, Boye SL, et al. Human gene therapy for RPE65 isomerase deficiencyactivates the retinoid cycle of vision but with slow rod kinetics. Proc Natl Acad Sci U S A2008;105:15112–15117. [PubMed: 18809924]
5. Weil D, Blanchard S, Kaplan J, et al. Defective myosin VIIA gene responsible for Usher syndrometype 1B. Nature 1995;374:60–61. [PubMed: 7870171]
6. Jacobson SG, Aleman TS, Sumaroka A, et al. Disease boundaries in the retina of patients with Ushersyndrome caused by MYO7A gene mutations. Invest Ophthalmol Vis Sci 2009;50:1886–1894.[PubMed: 19074810]
7. Hasson T, Heintzelman MB, Santos-Sacchi J, Corey DP, Mooseker MS. Expression in cochlea andretina of myosin VIIa, the gene product defective in Usher syndrome type 1B. Proc Natl Acad SciUSA 1995;92:9815–9819. [PubMed: 7568224]
8. Liu X, Vansant G, Udovichenko IP, Wolfrum U, Williams DS. Myosin VIIa, the product of the Usher1B syndrome gene, is concentrated in the connecting cilia of photoreceptor cells. Cell Motil Cytoskel1997;37:240–252.
9. Liu X, Ondek B, Williams DS. Mutant myosin VIIa causes defective melanosome distribution in theRPE of shaker-1 mice. Nat Genet 1998;19:117–118. [PubMed: 9620764]
10. Gibbs D, Azarian SM, Lillo C, et al. Role of myosin VIIa and Rab27a in the motility and localizationof RPE melanosomes. J Cell Sci 2004;117:6473–6483. [PubMed: 15572405]
11. Hashimoto T, Gibbs D, Lillo C, et al. Lentiviral gene replacement therapy of retinas in a mouse modelfor Usher syndrome type 1B. Gene Ther 2007;14:584–594. [PubMed: 17268537]
12. Allocca M, Doria M, Petrillo M, et al. Serotype-dependent packaging of large genes in adeno-associated viral vectors results in effective gene delivery in mice. J Clin Invest 2008;118:1955–1964.[PubMed: 18414684]
13. Bok D. The retinal pigment epithelium: a versatile partner in vision. J Cell Sci Suppl 1993;17:189–195. [PubMed: 8144697]
14. Feeney-Burns L. The pigments of the retinal pigment epithelium. Curr Top Eye Res 1980;2:119–178.[PubMed: 6807609]
15. Delori FC, Dorey CK, Staurenghi G, Arend O, Goger DG, Weiter JJ. In vivo fluorescence of theocular fundus exhibits retinal pigment epithelium lipofuscin characteristics. Invest Ophthalmol VisSci 1995;36:718–729. [PubMed: 7890502]
16. Eldred GE, Katz ML. Fluorophores of the human retinal pigment epithelium: separation and spectralcharacterization. Exp Eye Res 1988;47:71–86. [PubMed: 3409988]
17. Delori FC, Staurenghi G, Arend O, Dorey CK, Goger DG, Weiter JJ. In vivo measurement oflipofuscin in Stargardt’s disease: fundus flavimaculatus. Invest Ophthalmol Vis Sci 1995;36:2327–2331. [PubMed: 7558729]
18. von Ruckmann A, Fitzke FW, Bird AC. Distribution of fundus autofluorescence with a scanning laserophthalmoscope. Br J Ophthalmol 1995;79:407–412. [PubMed: 7612549]
19. Cideciyan AV, Aleman TS, Swider M, et al. Mutations in ABCA4 result in accumulation of lipofuscinbefore slowing of the retinoid cycle: a reappraisal of the human disease sequence. Hum Mol Genet2004;13:525–534. [PubMed: 14709597]
20. Cideciyan AV, Swider M, Aleman TS, et al. Reduced-illuminance autofluorescence imaging inABCA4-associated retinal degenerations. J Opt Soc Am A Opt Image Sci Vis 2007;24:1457–1467.[PubMed: 17429493]
Gibbs et al. Page 9
Invest Ophthalmol Vis Sci. Author manuscript; available in PMC 2010 June 13.
NIH
-PA Author Manuscript
NIH
-PA Author Manuscript
NIH
-PA Author Manuscript

21. Morgan JI, Hunter JJ, Masella B, et al. Light-induced retinal changes observed with high-resolutionautofluorescence imaging of the retinal pigment epithelium. Invest Ophthalmol Vis Sci2008;49:3715–3729. [PubMed: 18408191]
22. Schraermeyer U, Peters S, Thumann G, Kociok N, Heimann K. Melanin granules of retinal pigmentepithelium are connected with the lysosomal degradation pathway. Exp Eye Res 1999;68:237–245.[PubMed: 10068489]
23. Marks MS, Seabra MC. The melanosome: membrane dynamics in black and white. Nat Rev Mol CellBiol 2001;2:738–748. [PubMed: 11584301]
24. Kennedy CJ, Rakoczy PE, Constable IJ. Lipofuscin of the retinal pigment epithelium: a review. Eye1995;9:763–771. [PubMed: 8849547]
25. Rozanowski B, Cuenco J, Davies S, et al. The phototoxicity of aged human retinal melanosomes.Photochem Photobiol 2008;84:650–657. [PubMed: 18086241]
26. Azarian SM, McLeod I, Lillo C, Gibbs D, Yates JR, Williams DS. Proteomic analysis of maturemelanosomes from the retinal pigmented epithelium. J Proteome Res 2006;5:521–529. [PubMed:16512666]
27. Elsner AE, Burns SA, Weiter JJ, Delori FC. Infrared imaging of sub-retinal structures in the humanocular fundus. Vision Res 1996;36:191–205. [PubMed: 8746253]
28. Berendschot TT, DeLint PJ, van Norren D. Fundus reflectance: historical and present ideas. ProgRetin Eye Res 2003;22:171–200. [PubMed: 12604057]
29. Jacobson SG, Cideciyan AV, Sumaroka A, et al. Remodeling of the human retina in choroideremia:rab escort protein 1 (REP-1) mutations. Invest Ophthalmol Vis Sci 2006;47:4113–4120. [PubMed:16936131]
30. Jacobson SG, Cideciyan AV, Aleman TS, et al. Usher syndromes due to MYO7A, PCDH15, USH2Aor GPR98 mutations share retinal disease mechanism. Hum Mol Genet 2008;17:2405–2415.[PubMed: 18463160]
31. Keilhauer CN, Delori FC. Near-infrared autofluorescence imaging of the fundus: visualization ofocular melanin. Invest Ophthalmol Vis Sci 2006;47:3556–3564. [PubMed: 16877429]
32. Weinberger AW, Lappas A, Kirschkamp T, et al. Fundus near infrared fluorescence correlates withfundus near infrared reflectance. Invest Ophthalmol Vis Sci 2006;47:3098–3108. [PubMed:16799056]
33. Cideciyan AV, Aleman TS, Jacobson SG, et al. Centrosomal-ciliary gene CEP290/NPHP6 mutationsresult in blindness with unexpected sparing of photoreceptors and visual brain: implications fortherapy of Leber congenital amaurosis. Hum Mutat 2007;28:1074–1083. [PubMed: 17554762]
34. Aleman TS, Cideciyan AV, Sumaroka A, et al. Retinal laminar architecture in human retinitispigmentosa caused by rhodopsin gene mutations. Invest Ophthalmol Vis Sci 2008;49:1580–1590.[PubMed: 18385078]
35. Herrera W, Aleman TS, Cideciyan AV, et al. Retinal disease in Usher syndrome III caused bymutations in the clarin-1 gene. Invest Ophthalmol Vis Sci 2008;49:2651–2660. [PubMed: 18281613]
36. Kellner U, Kellner S, Weber BH, Fiebig B, Weinitz S, Ruether K. Lipofuscin- and melanin-relatedfundus autofluorescence visualize different retinal pigment epithelial alterations in patients withretinitis pigmentosa. Eye 2009;23:1349–1359. [PubMed: 18791550]
37. Kellner U, Kellner S, Weinitz S. Chloroquine retinopathy: lipofuscin- and melanin-related fundusautofluorescence, optical coherence tomography and multifocal electroretinography. DocOphthalmol 2008;116:119–127. [PubMed: 18080820]
38. Theelen T, Boon CJ, Klevering BJ, Hoyng CB. Fundus autofluorescence in patients with inheritedretinal diseases: patterns of fluorescence at two different wavelengths (in German). Ophthalmologe2008;105:1013–1022. [PubMed: 18415102]
39. Huang Y, Cideciyan AV, Papastergiou GI, et al. Relation of optical coherence tomography tomicroanatomy in normal and rd chickens. Invest Ophthalmol Vis Sci 1998;39:2405–2416. [PubMed:9804149]
40. Jacobson SG, Cideciyan AV, Aleman TS, et al. Photoreceptor layer topography in children with Lebercongenital amaurosis caused by RPE65 mutations. Invest Ophthalmol Vis Sci 2008;49:4573–4577.[PubMed: 18539930]
Gibbs et al. Page 10
Invest Ophthalmol Vis Sci. Author manuscript; available in PMC 2010 June 13.
NIH
-PA Author Manuscript
NIH
-PA Author Manuscript
NIH
-PA Author Manuscript

41. Hasson T, Walsh J, Cable J, Mooseker MS, Brown SD, Steel KP. Effects of shaker-1 mutations onmyosin-VIIa protein and mRNA expression. Cell Motil Cytoskeleton 1997;37:127–138. [PubMed:9186010]
42. Liu X, Udovichenko IP, Brown SDM, Steel KP, Williams DS. Myosin VIIa participates in opsintransport through the photoreceptor cilium. J Neurosci 1999;19:6267–6274. [PubMed: 10414956]
43. Gibbs D, Kitamoto J, Williams DS. Abnormal phagocytosis by retinal pigmented epithelium thatlacks myosin VIIa, the Usher syndrome 1B protein. Proc Natl Acad Sci U S A 2003;100:6481–6486.[PubMed: 12743369]
44. Boulton M, Rozanowska M, Rozanowski B, Wess T. The photoreactivity of ocular lipofuscin.Photochem Photobiol Sci 2004;3:759–764. [PubMed: 15295632]
45. Sparrow JR, Parish CA, Hashimoto M, Nakanishi K. A2E, a lipofuscin fluorophore, in human retinalpigmented epithelial cells in culture. Invest Ophthalmol Vis Sci 1999;40:2988–2995. [PubMed:10549662]
46. Marmorstein AD, Marmorstein LY, Sakaguchi H, Hollyfield JG. Spectral profiling ofautofluorescence associated with lipofuscin, Bruch’s Membrane, and sub-RPE deposits in normaland AMD eyes. Invest Ophthalmol Vis Sci 2002;43:2435–2441. [PubMed: 12091448]
47. Marmor, MF.; Wolfensberger, TJE. The Retinal Pigment Epithelium. New York: Oxford UniversityPress; 1998.
48. Carroll J, Neitz M, Hofer H, Neitz J, Williams DR. Functional photoreceptor loss revealed withadaptive optics: an alternate cause of color blindness. Proc Natl Acad Sci U S A 2004;101:8461–8466. [PubMed: 15148406]
49. Zawadzki RJ, Cense B, Zhang Y, Choi SS, Miller DT, Werner JS. Ultrahigh-resolution opticalcoherence tomography with monochromatic and chromatic aberration correction. Opt Express2008;16:8126–8143. [PubMed: 18545525]
50. Fernandez EJ, Hermann B, Povazay B, et al. Ultrahigh resolution optical coherence tomography andpancorrection for cellular imaging of the living human retina. Opt Express 2008;16:11083–11094.[PubMed: 18648422]
51. Potsaid B, Gorczynska I, Srinivasan VJ, et al. Ultrahigh speed spectral/Fourier domain OCTophthalmic imaging at 70,000 to 312,500 axial scans per second. Opt Express 2008;16:15149–15169.[PubMed: 18795054]
52. Morgan JI, Dubra A, Wolfe R, Merigan WH, Williams DR. In vivo autofluorescence imaging of thehuman and macaque retinal pigment epithelial cell mosaic. Invest Ophthalmol Vis Sci 2009;50:1350–1359. [PubMed: 18952914]
53. Cideciyan AV, Jacobson SG, Aleman TS, et al. In vivo dynamics of retinal injury and repair in therhodopsin mutant dog model of human retinitis pigmentosa. Proc Natl Acad Sci U S A2005;102:5233–5238. [PubMed: 15784735]
54. Delori FC, Webb RH, Sliney DH. Maximum permissible exposures for ocular safety (ANSI 2000),with emphasis on ophthalmic devices. J Opt Soc Am A Opt Image Sci Vis 2007;24:1250–1265.[PubMed: 17429471]
55. Gotzinger E, Pircher M, Geitzenauer W, et al. Retinal pigment epithelium segmentation bypolarization sensitive optical coherence tomography. Opt Express 2008;16:16410–16422. [PubMed:18852747]
56. Boulton M, Docchio F, Dayhaw-Barker P, Ramponi R, Cubeddu R. Age-related changes in themorphology, absorption and fluorescence of melanosomes and lipofuscin granules of the retinalpigment epithelium. Vision Res 1990;30:1291–1303. [PubMed: 2219746]
57. Huang Z, Zeng H, Hamzavi I, et al. Cutaneous melanin exhibiting fluorescence emission under near-infrared light excitation. J Biomed Opt 2006;11:34010. [PubMed: 16822060]
Gibbs et al. Page 11
Invest Ophthalmol Vis Sci. Author manuscript; available in PMC 2010 June 13.
NIH
-PA Author Manuscript
NIH
-PA Author Manuscript
NIH
-PA Author Manuscript

FIGURE 1.NIR-AF images of normal subjects and USH1B patients. (A–D) NIR-AF images of arepresentative normal (N, age 24; green iris), and USH1B-affected patients P1 (age 21; greeniris), P2 (age 11; light brown iris), and P3 (age 61; hazel iris) at different stages of disease.Images are individually contrast-stretched for visibility of features. Arrowheads: transitionzone apparent between the more preserved central retina and the degenerating peripheral retina.Insets: cross-sectional SD-OCT images obtained along the horizontal meridian. NIR-AF signalintensity (E) and ONL thickness (F) measurements along the horizontal profile localized thecorrespondence between photoreceptor loss and AF abnormalities. The lower limit of normal
Gibbs et al. Page 12
Invest Ophthalmol Vis Sci. Author manuscript; available in PMC 2010 June 13.
NIH
-PA Author Manuscript
NIH
-PA Author Manuscript
NIH
-PA Author Manuscript

(mean −2 SD) is shown in each panel (gray trace). Hashed area: the nasal retinal regioncorresponding to the variable location of the optic nerve head (ONH) in different eyes.
Gibbs et al. Page 13
Invest Ophthalmol Vis Sci. Author manuscript; available in PMC 2010 June 13.
NIH
-PA Author Manuscript
NIH
-PA Author Manuscript
NIH
-PA Author Manuscript

FIGURE 2.Confocal spectral detection of AF(ex.633) in mouse retina/RPE sections. (A–C) Pigmentedand (D–F) albino retinas. Emission wavelengths were 730 to 760 nm. DIC images merged withthe peak AF(ex.633) are shown for comparison. (G–I) Higher magnification SDCMmicrographs illustrate colocalization of AF(ex.633) with melanosomes. Arrows: colocalizationof AF with melanosomes. (⋆) Regions of densely packed melanosomes, yet low AF, whichwas probably due to the quenching of the emission signal by secondary absorbance. (J) AF(ex.633) fluorescence intensity was plotted against emission wavelength for pigmented(black) and albino (blue) RPE. A major fluorescence peak at 730 to 740 nm and a minor peakat 750 to 760 nm were present in pigmented RPE, but were absent in nonpigmented RPE (n =3). Scale bars, 25 µm.
Gibbs et al. Page 14
Invest Ophthalmol Vis Sci. Author manuscript; available in PMC 2010 June 13.
NIH
-PA Author Manuscript
NIH
-PA Author Manuscript
NIH
-PA Author Manuscript
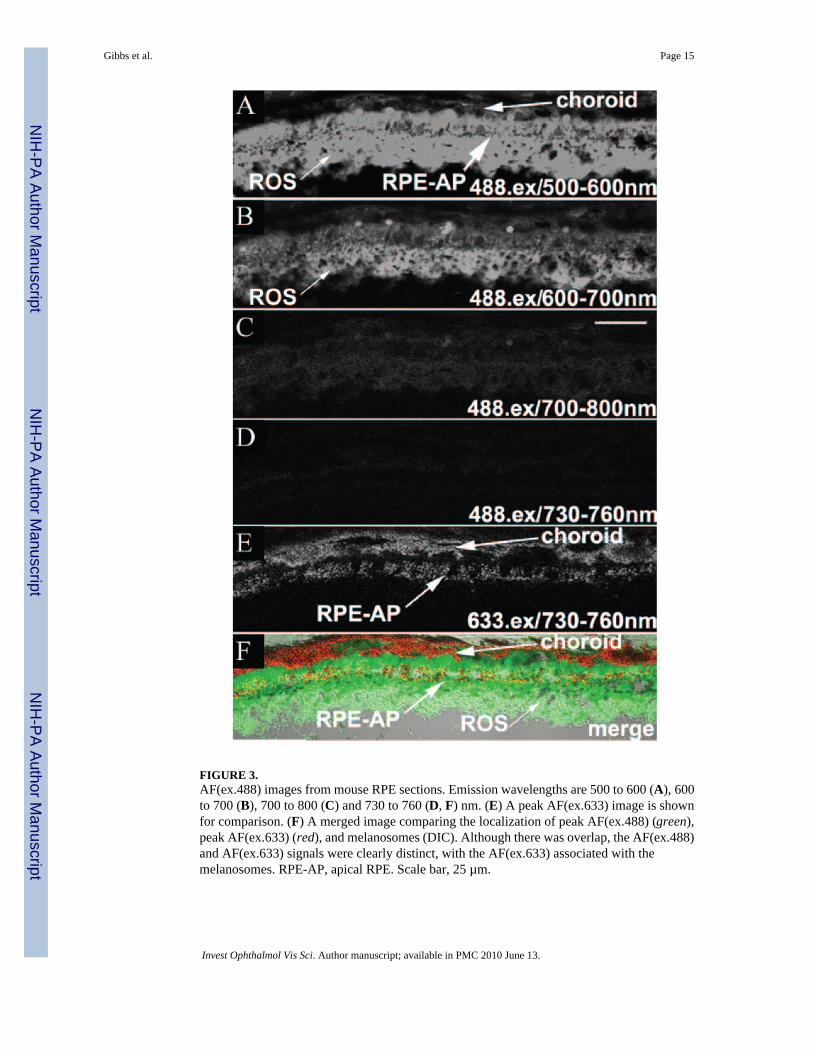
FIGURE 3.AF(ex.488) images from mouse RPE sections. Emission wavelengths are 500 to 600 (A), 600to 700 (B), 700 to 800 (C) and 730 to 760 (D, F) nm. (E) A peak AF(ex.633) image is shownfor comparison. (F) A merged image comparing the localization of peak AF(ex.488) (green),peak AF(ex.633) (red), and melanosomes (DIC). Although there was overlap, the AF(ex.488)and AF(ex.633) signals were clearly distinct, with the AF(ex.633) associated with themelanosomes. RPE-AP, apical RPE. Scale bar, 25 µm.
Gibbs et al. Page 15
Invest Ophthalmol Vis Sci. Author manuscript; available in PMC 2010 June 13.
NIH
-PA Author Manuscript
NIH
-PA Author Manuscript
NIH
-PA Author Manuscript

FIGURE 4.AF imaging of purified melanosomes isolated from mouse RPE sheets. (A–C) DIC andconfocal micrographs of peak AF(ex.633) emission, illustrating colocalization betweenmelanosomes and peak AF(ex.633). (D–I) Low-magnification AF imaging, using either CSLO(D–F) or SDCM (G–I), to image the same region of a microscope slide containing isolatedmelanosomes. Slides were shipped between laboratories; in this case, the “inverted T” signatureof melanosomes clustered with cellular debris (evident in the center) was used to help identifythe given region. Comparable AF patterns are apparent with either AF(ex.790) or AF(ex.633)(E, H). Scale bar, 100 µm.
Gibbs et al. Page 16
Invest Ophthalmol Vis Sci. Author manuscript; available in PMC 2010 June 13.
NIH
-PA Author Manuscript
NIH
-PA Author Manuscript
NIH
-PA Author Manuscript

FIGURE 5.AF(ex.633) imaging of melanosomes in Myo7a-null RPE. Confocal microscopy of whole-mount eyecups, showing single optical sections through the apical processes of control (A) andmutant (B) RPE. AF(ex.633) emitting at 730 to 760 nm is shown in red and FITC-phalloidinlabeling of F-actin in green. The mutant image is slightly oblique. AF was evident only on theright part of the image, where it passed into the cell body. Boxed regions (yellow) were usedfor 3-D reconstruction to generate 90°-rotated projections of control (C) and mutant (D) apicalRPE. AF(ex.633) signals in the control were evident throughout the apical F-actin region. Bycontrast, they are distributed only along the basal aspect of this region in the mutant.Quantification of AF(ex.633) (red) and FITC-phalloidin (green) fluorescence intensities alongthe z-axis of control (E) and mutant (F) apical RPE showed no significant change in actin
Gibbs et al. Page 17
Invest Ophthalmol Vis Sci. Author manuscript; available in PMC 2010 June 13.
NIH
-PA Author Manuscript
NIH
-PA Author Manuscript
NIH
-PA Author Manuscript

localization, but a significant basal shift of AF(ex.633) in mutant compared with the control.Scale bar, 25 µm.
Gibbs et al. Page 18
Invest Ophthalmol Vis Sci. Author manuscript; available in PMC 2010 June 13.
NIH
-PA Author Manuscript
NIH
-PA Author Manuscript
NIH
-PA Author Manuscript
Copyright © 2022 FDOKUMEN