Fouling characteristics of cooling tower water containing ...
361
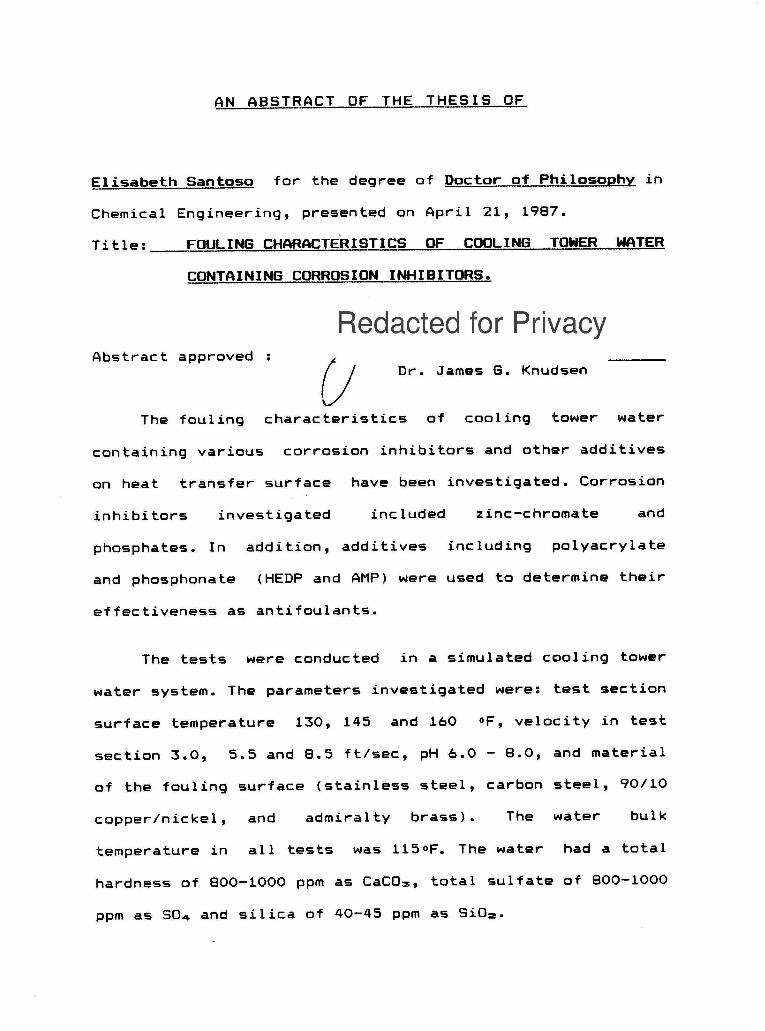
AN ABSTRACT OF THE THESIS OF Elisabeth Santoso for the degree of Doctor of Philosophy in Chemical Engineering, presented on April 21, 1987. Title: FOULING CHARACTERISTICS OF COOLING TOWER WATER CONTAINING CORROSION INHIBITORS. Abstract approved : Redacted for Privacy Dr. James G. Knudsen The fouling characteristics of cooling tower water containing various corrosion inhibitors and other additives on heat transfer surface have been investigated. Corrosion inhibitors investigated included zinc-chromate and phosphates. In addition, additives including polyacrylate and phosphonate (HEDP and AMP) were used to determine their effectiveness as antifoulants. The tests were conducted in a simulated cooling tower water system. The parameters investigated were: test section surface temperature 130, 145 and 160 OF, velocity in test section 3.0, 5.5 and 8.5 ft/sec, pH 6.0 - 8.0, and material of the fouling surface (stainless steel, carbon steel, 90/10 copper/nickel, and admiralty brass). The water bulk temperature in all tests was 1150F. The water had a total hardness of 800-1000 ppm as CaCO3z, total sulfate of 800-1000 ppm as SOA and silica of 40-45 ppm as SiO2.
-
Upload
khangminh22 -
Category
Documents
-
view
0 -
download
0
Transcript of Fouling characteristics of cooling tower water containing ...
AN ABSTRACT OF THE THESIS OF
Elisabeth Santoso for the degree of Doctor of Philosophy in
Chemical Engineering, presented on April 21, 1987.
Title: FOULING CHARACTERISTICS OF COOLING TOWER WATER
CONTAINING CORROSION INHIBITORS.
Abstract approved :
Redacted for Privacy
Dr. James G. Knudsen
The fouling characteristics of cooling tower water
containing various corrosion inhibitors and other additives
on heat transfer surface have been investigated. Corrosion
inhibitors investigated included zinc-chromate and
phosphates. In addition, additives including polyacrylate
and phosphonate (HEDP and AMP) were used to determine their
effectiveness as antifoulants.
The tests were conducted in a simulated cooling tower
water system. The parameters investigated were: test section
surface temperature 130, 145 and 160 OF, velocity in test
section 3.0, 5.5 and 8.5 ft/sec, pH 6.0 - 8.0, and material
of the fouling surface (stainless steel, carbon steel, 90/10
copper/nickel, and admiralty brass). The water bulk
temperature in all tests was 1150F. The water had a total
hardness of 800-1000 ppm as CaCO3z, total sulfate of 800-1000
ppm as SOA and silica of 40-45 ppm as SiO2.
For each test, a fouling resistance time curve was
obtained. This curve was fitted to the equation Rf = Rf* (1-
exp(-(0-ed)/ec)) to yield the values of ec and Rf*. Rf is
the fouling resistance predicted by the regression equation,
Rf* is the asymptotic fouling resistance, e is time, ed is
dead time and ec is the time constant for the asymptotic
decay.
The values of ec and Rf* from regression analysis have
been correlated with the various parameters by the Heat
Transfer Research, Inc., (HTRI) fouling model. For the range
of conditions studied, the correlation equations 7-1 to 7-4
relate the fouling resistance, Rfj to the surface
temperature, wall shear stress and water quality. Seventeen
different water qualities were investigated to determine the
values of 5 parameters, which are specific for each water
quality.
For each of the seventeen water qualities studied
threshold curves for three threshold values of Rf* have been
developed as a function of velocity and surface temperature.
These curves are useful to obtain the conditions required to
maintain a desired value of Rf* in a heat exchanger.
P-OILJL_INIG CHARACTER I ST ICSOF COCILINIG TOWER WATERcom-rn I NI I NG ccolFtIFICIS I ON
I 1111-1I 1E3 I TORS
b y
Elisabeth Santoso'
A THESIS
submitted to
Oregon State University
In partial fulfillment of
the requirements for the
degree of
Doctor of Philosophy
Completed April 21, 1987
Commencement June 1987
APPROVED:
Redacted for Privacy(Of ssor of
maj rChemical engineering Department in charge of
Redacted for PrivacyChairman of Chemical Engineering Department
Redacted for Privacy
Dean of Grad School (I
Date thesis is presented : April 21, 1987
Typed by Utomo Santoso for : Elisabeth Santoso

This thesis is dedicated to my belovedfather Joseph A. Tjitrasmoro, my husbandUtomo, and my lovely baby Sharon Putri.
ACKNOWLEDGEMENT
My deepest thanks are addressed to my major professor,
Dr. James G. Knudsen, for having given me the opportunity to
work on this research project, for his advice,
encouragement, and also for his financial support.
I would like to thank to all the teaching faculty of
the Department of Chemical Engineering, Oregon State
University, for having contributed to my academic and
learning experience, also to Dr. Charles E. Wicks whose
concern and assistance has been most helpful.
I am particularly grateful to Nick Wannenmacher for his
help of equipment maintenance and also to Nick Frederick,
Scott Herbig and Lynne Kilpatric-Howard for their help with
the chemical analyses.
My appreciation is also extended to Heat Transfer
Research, Inc., for providing the research grant for this
project, to Betz Laboratories for conducting the necessary
analyses and for the Du Pont company for conducting the
deposit analyses.
Special thanks are also extended to my husband, Utomo,
and my father J.A. Tjitrasmoro, whose support and
encouragement has made this possible and whose love has made
it worth it.
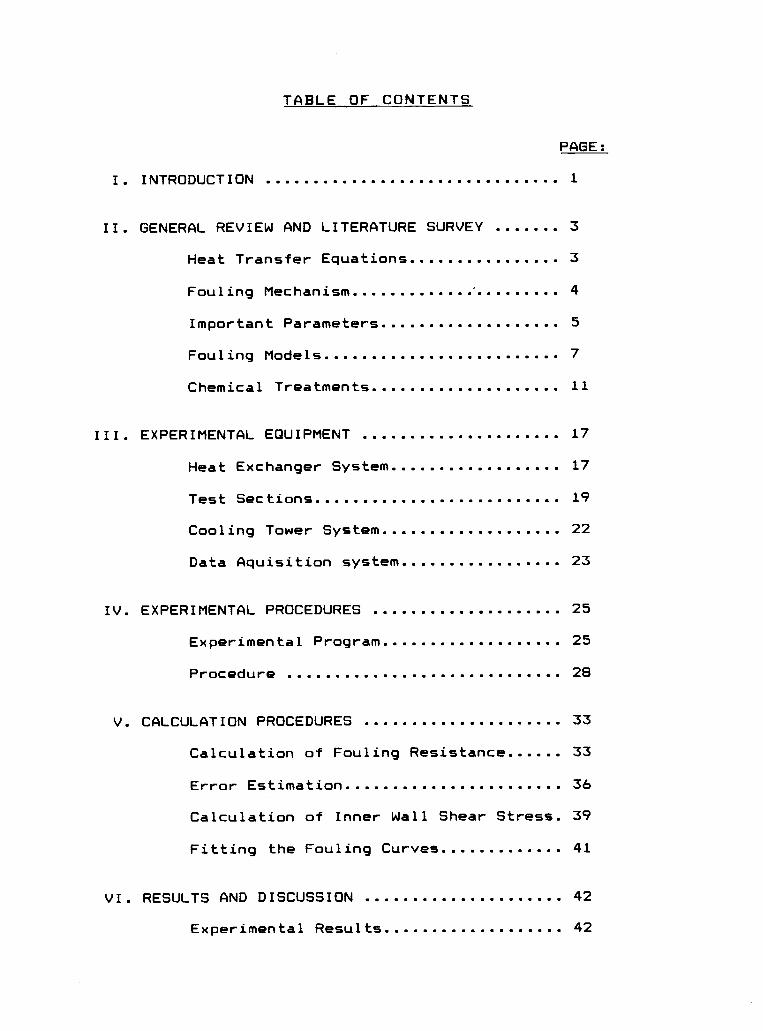
TABLE OF CONTENTS
PAGE:
I. INTRODUCTION 1
II. GENERAL REVIEW AND LITERATURE SURVEY 3
Heat Transfer Equations 3
Fouling Mechanism 4
Important Parameters 5
Fouling Models 7
Chemical Treatments 11
III. EXPERIMENTAL EQUIPMENT 17
Heat Exchanger System 17
Test Sections 19
Cooling Tower System 22
Data Aquisition system 23
IV. EXPERIMENTAL PROCEDURES 25
Experimental Program 25
Procedure 28
V. CALCULATION PROCEDURES 33
Calculation of Fouling Resistance 33
Error Estimation 36
Calculation of Inner Wall Shear Stress 39
Fitting the Fouling Curves 41
VI. RESULTS AND DISCUSSION 42
Experimental Results 42
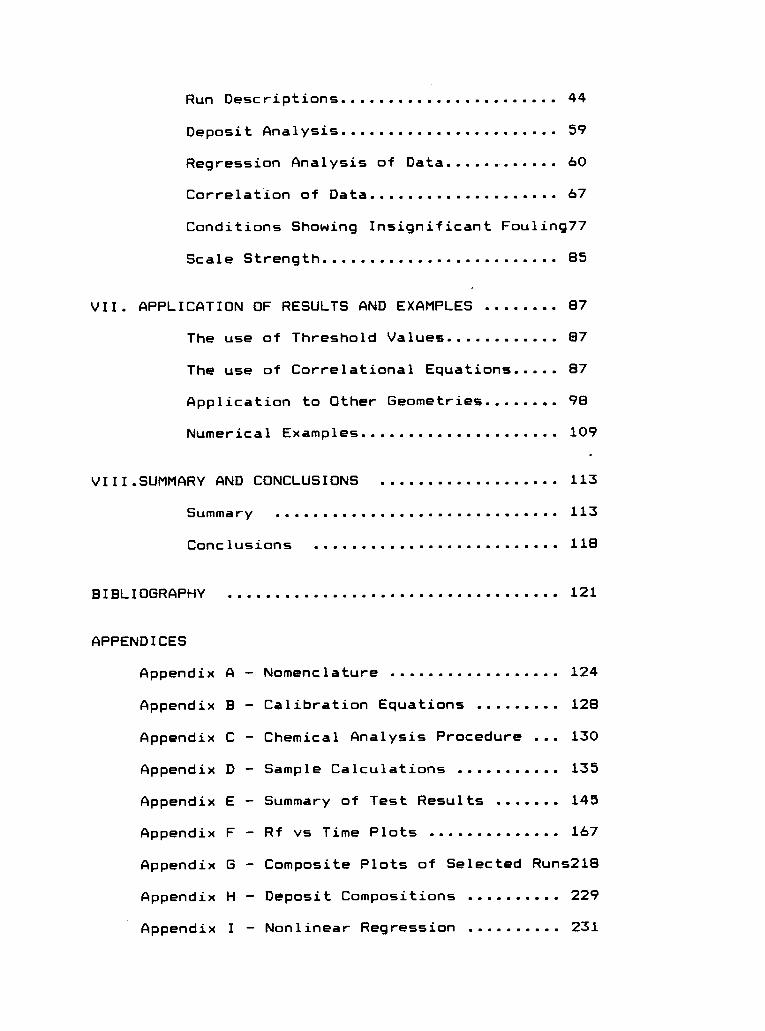
Run Descriptions 44
Deposit Analysis 59
Regression Analysis of Data 60
Correlation of Data 67
Conditions Showing Insignificant Fouling77
Scale Strength 85
VII. APPLICATION OF RESULTS AND EXAMPLES 87
The use of Threshold Values 87
The use of Correlational Equations 87
Application to Other Geometries 98
Numerical Examples 109
VIII.SUMMARY AND CONCLUSIONS 113
Summary 113
Conclusions 118
BIBLIOGRAPHY 121
APPENDICES
Appendix A - Nomenclature 124
Appendix B Calibration Equations 128
Appendix C - Chemical Analysis Procedure 130
Appendix D Sample Calculations 135
Appendix E - Summary of Test Results 145
Appendix F Rf vs Time Plots 167
Appendix G - Composite Plots of Selected Runs218
Appendix H - Deposit Compositions 229
Appendix I - Nonlinear Regression 231
Appendix J - Water Quality 259
Appendix K - System Flowrates 276
Appendix L Summary of Run Statistics 286
Appendix M - Plots of Correlational Curves . 318
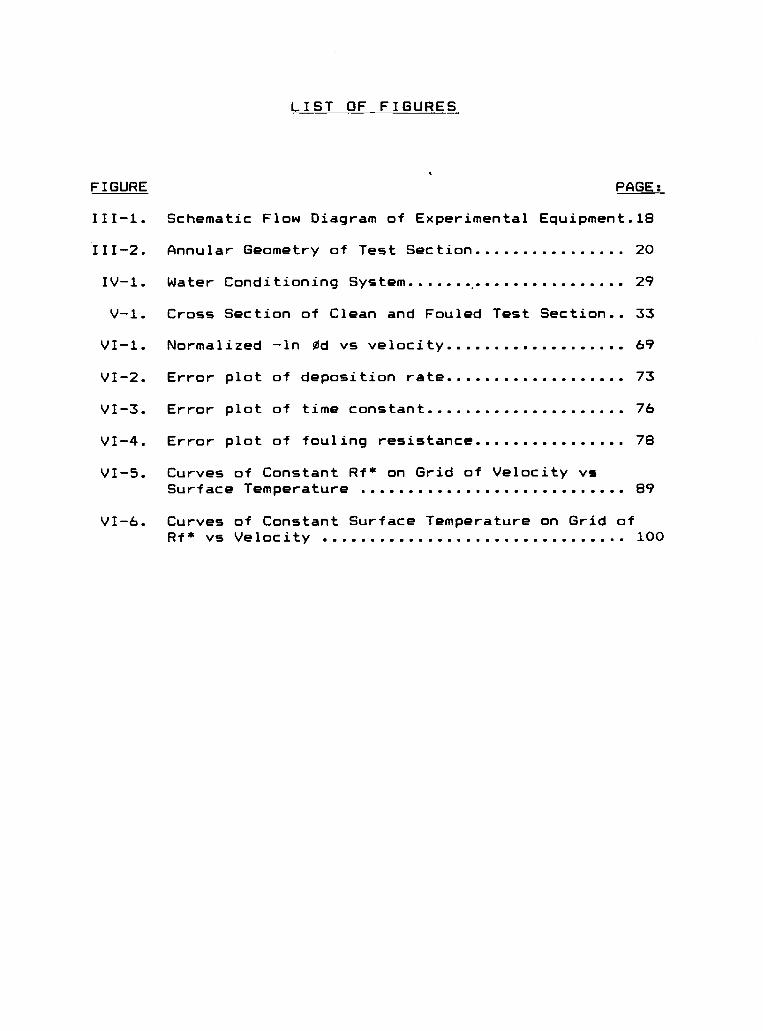
LIST OF FIGURES
FIGURE PAGE:
III-1. Schematic Flow Diagram of Experimental Equipment.18
111-2. Annular Geometry of Test Section 20
IV-1. Water Conditioning System 29
V-1. Cross Section of Clean and Fouled Test Section 33
VI-1. Normalized -ln Od vs velocity 69
VI-2. Error plot of deposition rate 73
VI-3. Error plot of time constant 76
VI-4. Error plot of fouling resistance 78
VI-5. Curves of Constant Rf* on Grid of Velocity vsSurface Temperature 89
VI-6. Curves of Constant Surface Temperature on Grid ofRf* vs Velocity 100
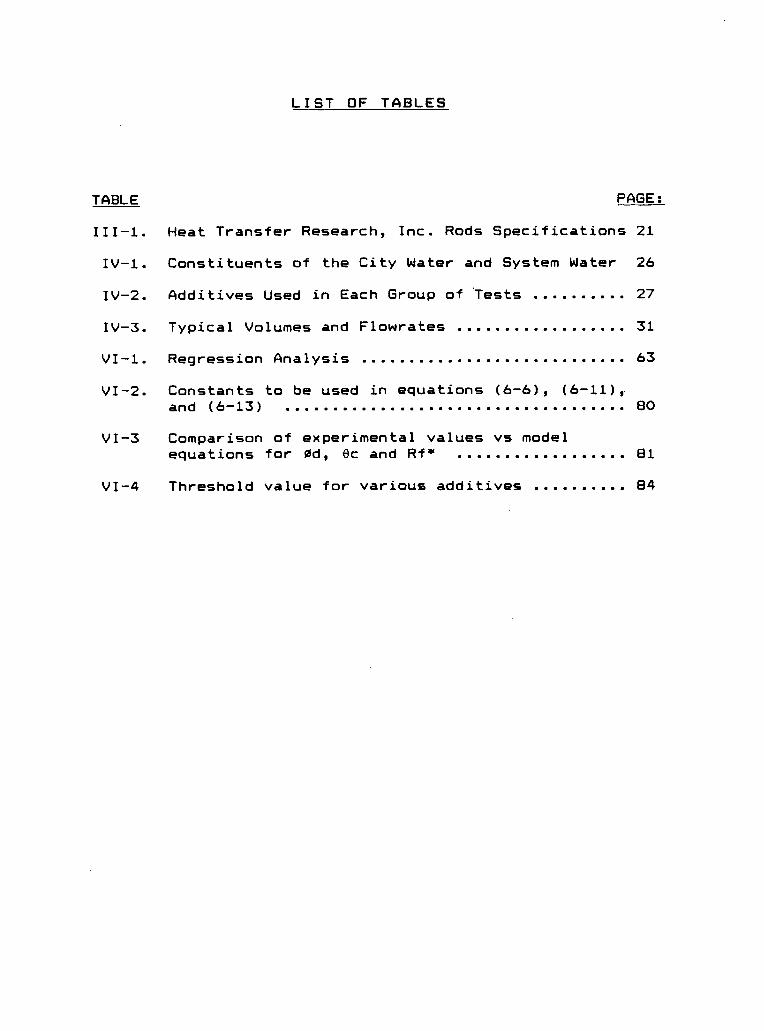
LIST OF TABLES
TABLE PAGE:
III-1. Heat Transfer Research, Inc. Rods Specifications 21
IV-1. Constituents of the City Water and System Water 26
IV-2. Additives Used in Each Group of Tests 27
IV-3. Typical Volumes and Flowrates 31
VI-1. Regression Analysis 63
VI-2. Constants to be used in equations (6-6), (6-11),and (6-13) 80
VI-3 Comparison of experimental values vs modelequations for Od, ec and Rf* 81
VI-4 Threshold value for various additives 84
FOULING CHARACTERISTICS OF COOLINGTOWER WATER CONTAINING CORROSION
INHIBITORS
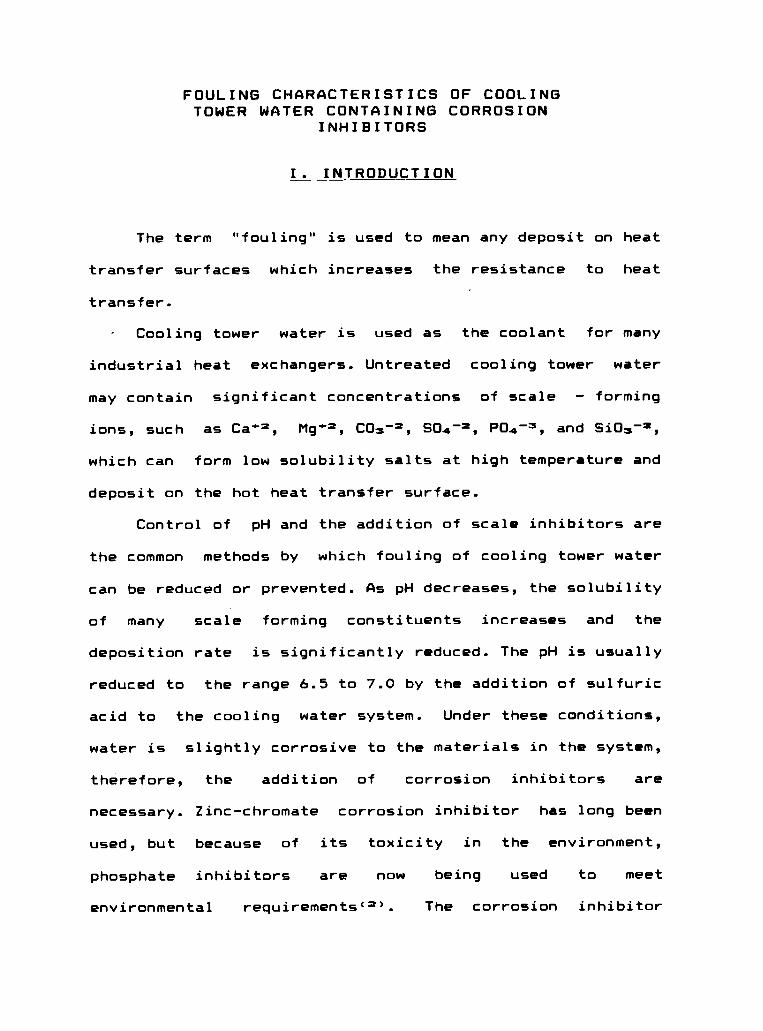
I. INTRODUCTION
The term "fouling" is used to mean any deposit on heat
transfer surfaces which increases the resistance to heat
transfer.
Cooling tower water is used as the coolant for many
industrial heat exchangers. Untreated cooling tower water
may contain significant concentrations of scale - forming
ions, such as Ca'2, Mg' 2, COs-2, SO4-2, PO4-5, and SiO3-2,
which can form low solubility salts at high temperature and
deposit on the hot heat transfer surface.
Control of pH and the addition of scale inhibitors are
the common methods by which fouling of cooling tower water
can be reduced or prevented. As pH decreases, the solubility
of many scale forming constituents increases and the
deposition rate is significantly reduced. The pH is usually
reduced to the range 6.5 to 7.0 by the addition of sulfuric
acid to the cooling water system. Under these conditions,
water is slightly corrosive to the materials in the system,
therefore, the addition of corrosion inhibitors are
necessary. Zinc-chromate corrosion inhibitor has long been
used, but because of its toxicity in the environment,
phosphate inhibitors are now being used to meet
environmental requirements(21). The corrosion inhibitor
2
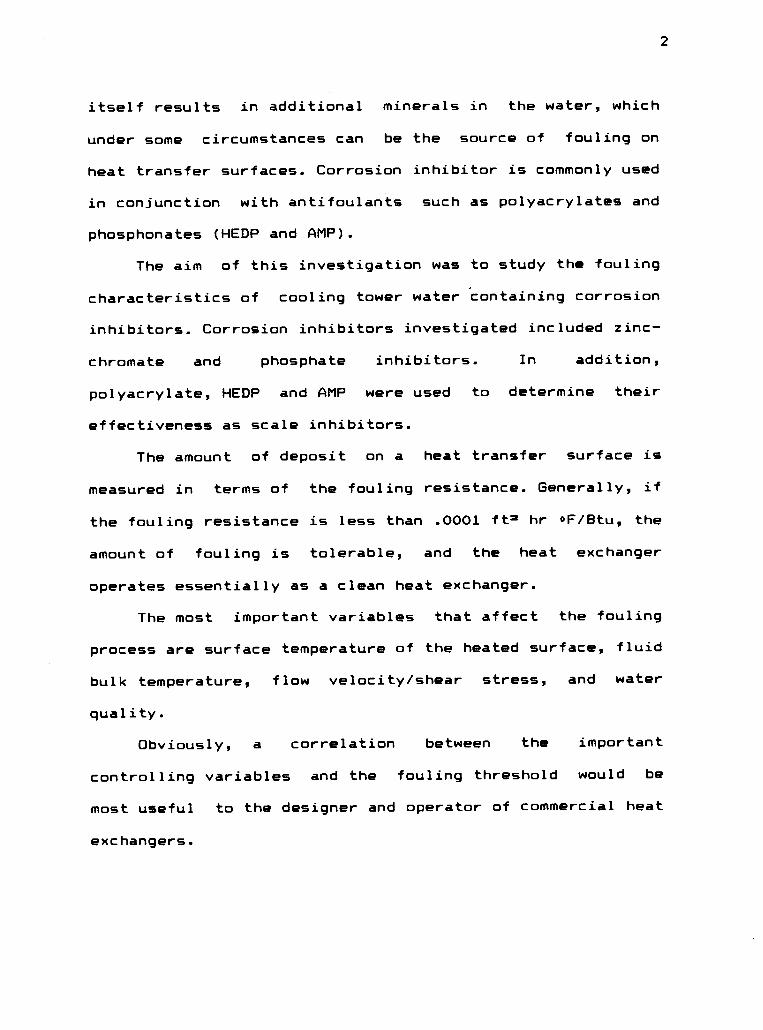
itself results in additional minerals in the water, which
under some circumstances can be the source of fouling on
heat transfer surfaces. Corrosion inhibitor is commonly used
in conjunction with antifoulants such as polyacrylates and
phosphonates (HEDP and AMP).
The aim of this investigation was to study the fouling
characteristics of cooling tower water containing corrosion
inhibitors. Corrosion inhibitors investigated included zinc-
chromate and phosphate inhibitors. In addition,
polyacrylate, HEDP and AMP were used to determine their
effectiveness as scale inhibitors.
The amount of deposit on a heat transfer surface is
measured in terms of the fouling resistance. Generally, if
the fouling resistance is less than .0001 ft hr OF /Btu, the
amount of fouling is tolerable, and the heat exchanger
operates essentially as a clean heat exchanger.
The most important variables that affect the fouling
process are surface temperature of the heated surface, fluid
bulk temperature, flow velocity/shear stress, and water
quality.
Obviously, a correlation between the important
controlling variables and the fouling threshold would be
most useful to the designer and operator of commercial heat
exchangers.
3
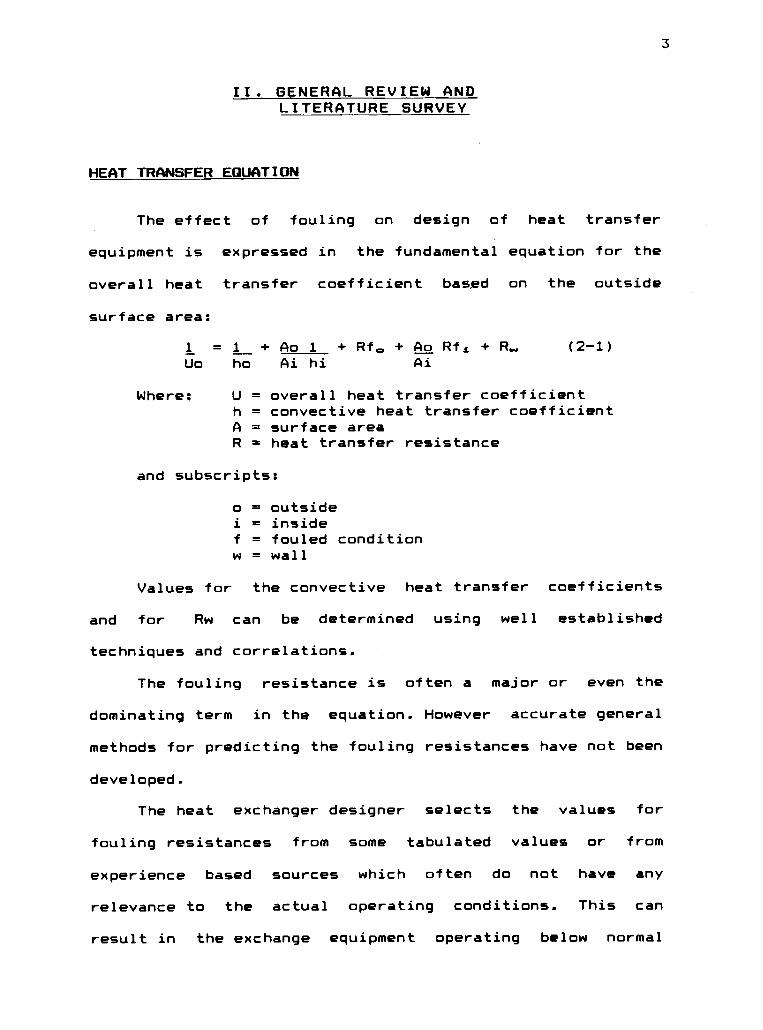
II. GENERAL REVIEW ANDLITERATURE SURVEY
HEAT TRANSFER EQUATION
The effect of fouling on design of heat transfer
equipment is expressed in the fundamental equation for the
overall heat transfer coefficient based on the outside
surface area:
1 = 1 + Ao 1 + Rf. + Ao RfA + RM, (2-1)Uo ho Ai hi Ai
Where: U = overall heat transfer coefficienth = convective heat transfer coefficientA = surface areaR = heat transfer resistance
and subscripts:
o = outsidei = insidef = fouled conditionw = wall
Values for the convective heat transfer coefficients
and for Rw can be determined using well established
techniques and correlations.
The fouling resistance is often a major or even the
dominating term in the equation. However accurate general
methods for predicting the fouling resistances have not been
developed.
The heat exchanger designer selects the values for
fouling resistances from some tabulated values or from
experience based sources which often do not have any
relevance to the actual operating conditions. This can
result in the exchange equipment operating below normal
4
efficiency or over design of the exchanger. Thus there is
substantial incentive to develop correlations which will
reliably predict fouling resistances or determine conditions
under which fouling would not occur.
FOULING MECHANISMS
The primary types of fouling occurring in cooling tower
water systems are crystalization of inverse solubility
salts, sedimentation, corrosion of the heater surface and
biological growth.
Crystalization of inverse solubility salts
One of the most common causes of fouling is due to
crystalization of salts having inverse solubility, i.e. when
the temperature of the system is raised, as by contact with
a hot surface, their solubilities decrease. Common inverse
solubility salts include CaC05, CaSO4, and Mg(OH)2. This
type of fouling is referred to as scaling or precipitation
fouling.
An induction period of a certain time duration is
normally present, during which only negligible fouling
deposition is observed. At a certain point in the fouling
process, the nucleation sites become so numerous they
combine together and the fouling increases rapidly.
Precipitation fouling has been reviewed by Hasson ""
5
Sedimentation
This refers to the deposition of particulate matter
such as rust and dust particles commonly contained in
cooling tower waters. It is frequently superimposed on
crystalization fouling processes. This type of fouling was
reviewed by Gudmundsson ""
Corrosion
Corrosion fouling involves an electrochemical reaction
producing roughening of the surface and corrosion products
which can promote and influence other fouling mechanisms and
hinder heat transfer.
Biological growth
Warm surfaces can provide suitable environments for
bacteria, algae and fungi, which can form layers and reduce
the rate of heat transfer. Biofouling is usually prevented
by adding chlorine. A review of biofouling was given by
Characklis(4)
IMPORTANT PARAMETERS
The parameters that appear to be the most important in
effecting the fouling process are velocity/shear stress,
surface temperature, water chemistry and material of the
heated surface "27).
6
Velocity Effects
Velocity affects the fouling process with respect to
both deposition and removal. For the deposition term;
velocity effects the transport of fouling material to the
surface. The effect of velocity on removal is characterized
by wall shear stress and the mechanical strength of the
deposit.
Temperature Effects
In cooling water systems, the temperature of the
surface is higher than the bulk fluid temperature. In such
cases, the inorganic substances that are inverse solubility
salts may deposit on the high temperature surface. The
surface temperature of the deposit is an important parameter
and the deposition rate function is of the Arrhenius form,
which is characteristic of chemical reactions. Under
constant heat flux conditions, as the temperature within the
deposit increases there will be a portion of the deposit
undergoing additional transformation. Such processes would
affect the strength of the deposit and thereby the removal
rate of the deposit.
Water Chemistry Affects
Generally, pH and the concentration of different
mineral salt components have been used to characterize the
water chemistry. These quantities can be related to fouling
tendencies of water.
FOULING MODELS
The basic equation, which is the starting point of
several postulated models for fouling processes, is based on
the following general material balance.
where:
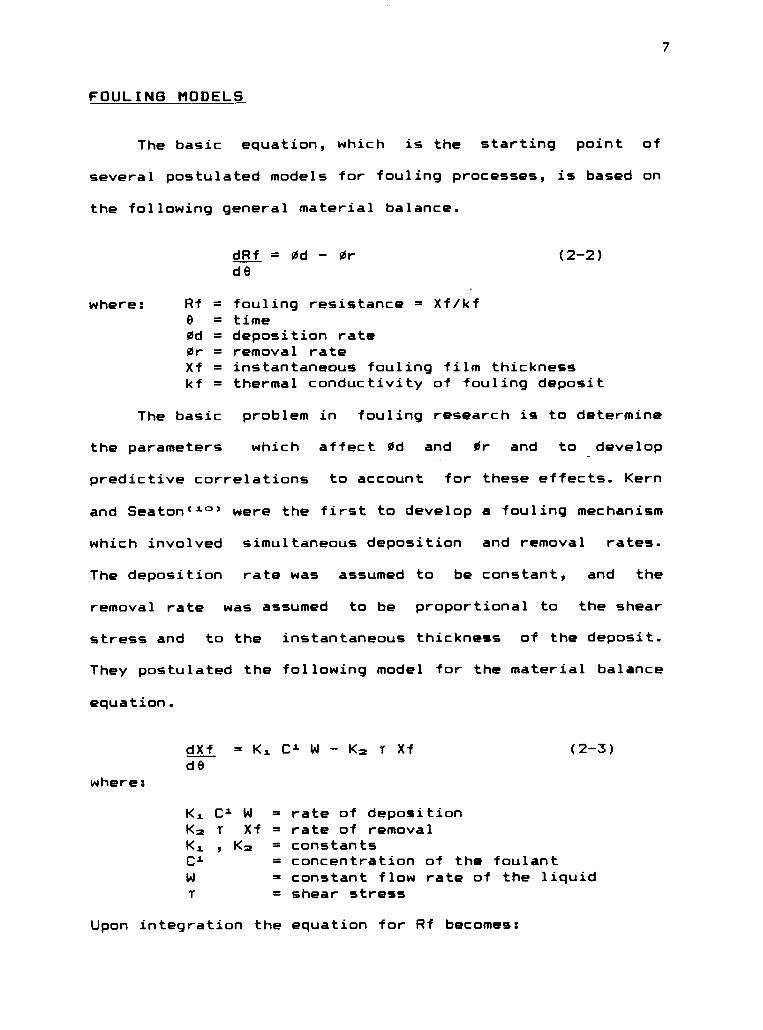
dRf = Od - Or (2-2)de
Rf = fouling resistance = Xf/kf0 = timeOd = deposition rateOr = removal rateXf = instantaneous fouling film thicknesskf = thermal conductivity of fouling deposit
7
The basic problem in fouling research is to determine
the parameters which affect Od and Or and to develop
predictive correlations to account for these effects. Kern
and Seaton"°' were the first to develop a fouling mechanism
which involved simultaneous deposition and removal rates.
The deposition rate was assumed to be constant, and the
removal rate was assumed to be proportional to the shear
stress and to the instantaneous thickness of the deposit.
They postulated the following model for the material balance
equation.
where:
dXf = K. Ci W Km r Xf (2-3)de
K1 C1 W = rate of depositionKm T Xf = rate of removalK1 , Km = constantsC1 = concentration of the foulantW = constant flow rate of the liquidI = shear stress
Upon integration the equation for Rf becomes:
8
with:
and,
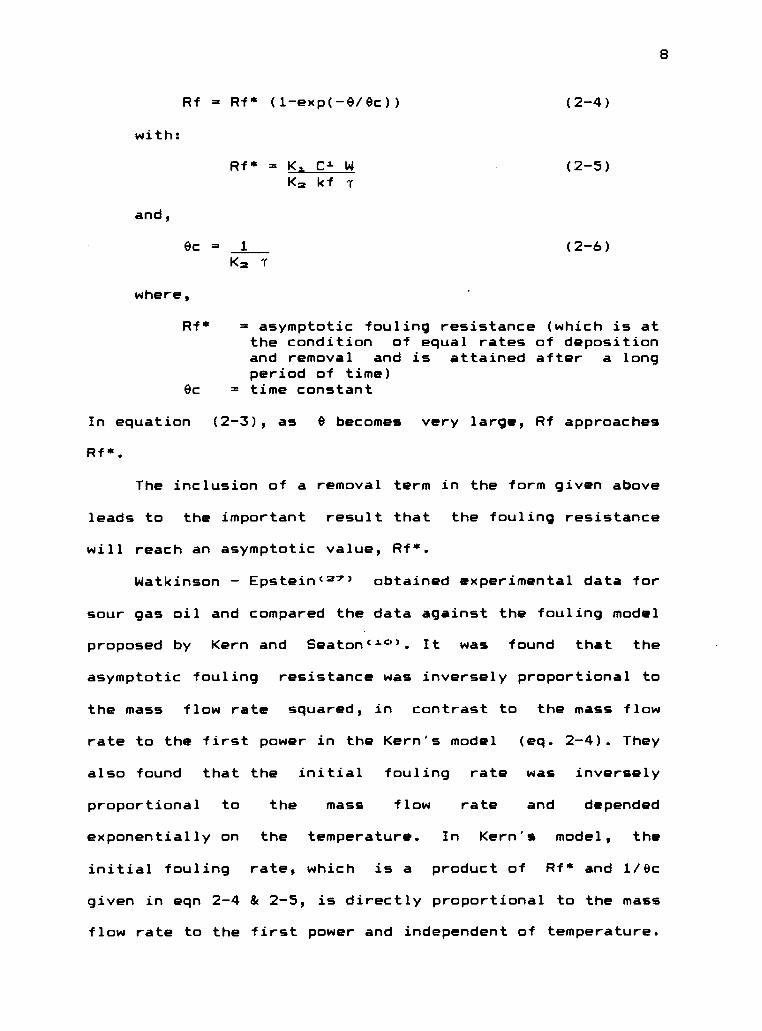
Rf = Rf* (1-exp(-0/0c)) (2-4)
Rf* = K. Cl. W (2-5)Km kf T
eC = 1
K2 T
where,
(2-6)
Rf* = asymptotic fouling resistance (which is atthe condition of equal rates of depositionand removal and is attained after a longperiod of time)
0c = time constant
In equation (2-3), as 0 becomes very large, Rf approaches
Rf*.
The inclusion of a removal term in the form given above
leads to the important result that the fouling resistance
will reach an asymptotic value, Rf*.
Watkinson Epsteinc°7) obtained experimental data for
sour gas oil and compared the data against the fouling model
proposed by Kern and Seaton"c". It was found that the
asymptotic fouling resistance was inversely proportional to
the mass flow rate squared, in contrast to the mass flow
rate to the first power in the Kern's model (eq. 2-4). They
also found that the initial fouling rate was inversely
proportional to the mass flow rate and depended
exponentially on the temperature. In Kern's model, the
initial fouling rate, which is a product of Rf* and 1/0c
given in eqn 2-4 & 2-5, is directly proportional to the mass
flow rate to the first power and independent of temperature.
9
Their term for the removal rate was same to that of the Kern
& Seaton's model
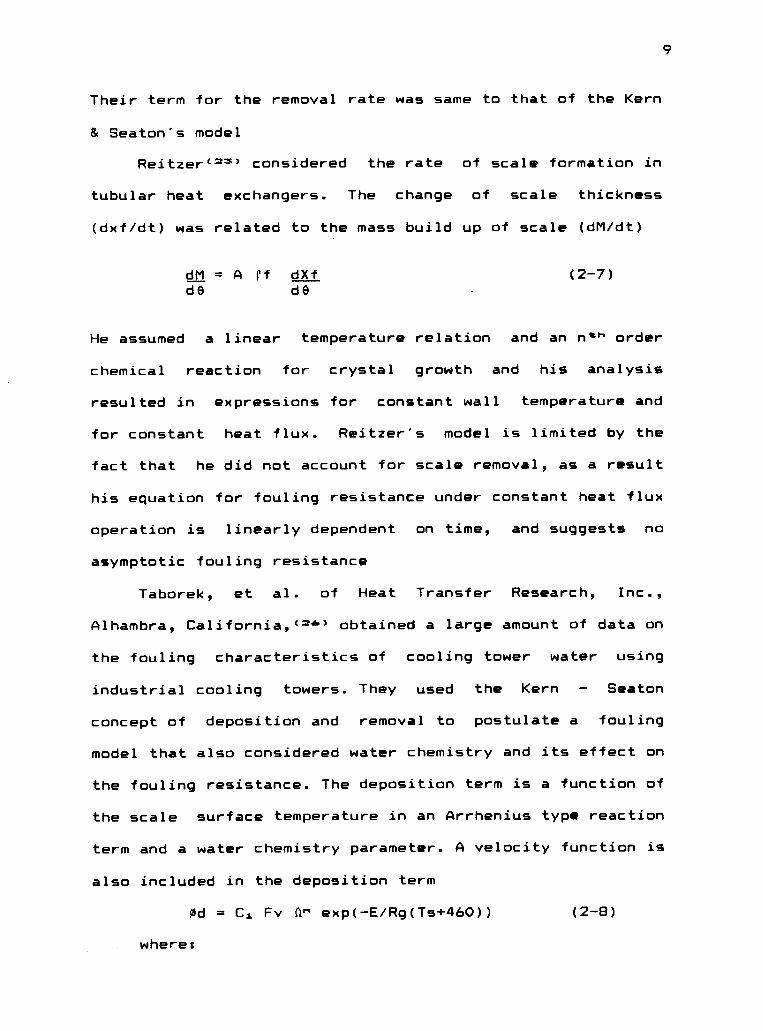
Reitzer"rs, considered the rate of scale formation in
tubular heat exchangers. The change of scale thickness
(dxf/dt) was related to the mass build up of scale (dM/dt)
dM = A rf dXf (2-7)dO de
He assumed a linear temperature relation and an n" order
chemical reaction for crystal growth and his analysis
resulted in expressions for constant wall temperature and
for constant heat flux. Reitzer's model is limited by the
fact that he did not account for scale removal, as a result
his equation for fouling resistance under constant heat flux
operation is linearly dependent on time, and suggests no
asymptotic fouling resistance
Taborek, et al. of Heat Transfer Research, Inc.,
Alhambra, California, (4" obtained a large amount of data on
the fouling characteristics of cooling tower water using
industrial cooling towers. They used the Kern Seaton
concept of deposition and removal to postulate a fouling
model that also considered water chemistry and its effect on
the fouling resistance. The deposition term is a function of
the scale surface temperature in an Arrhenius type reaction
term and a water chemistry parameter. A velocity function is
also included in the deposition term
Od = CI Fv ft" exp(-E/Rg(Ts+460)) (2-8)
where:
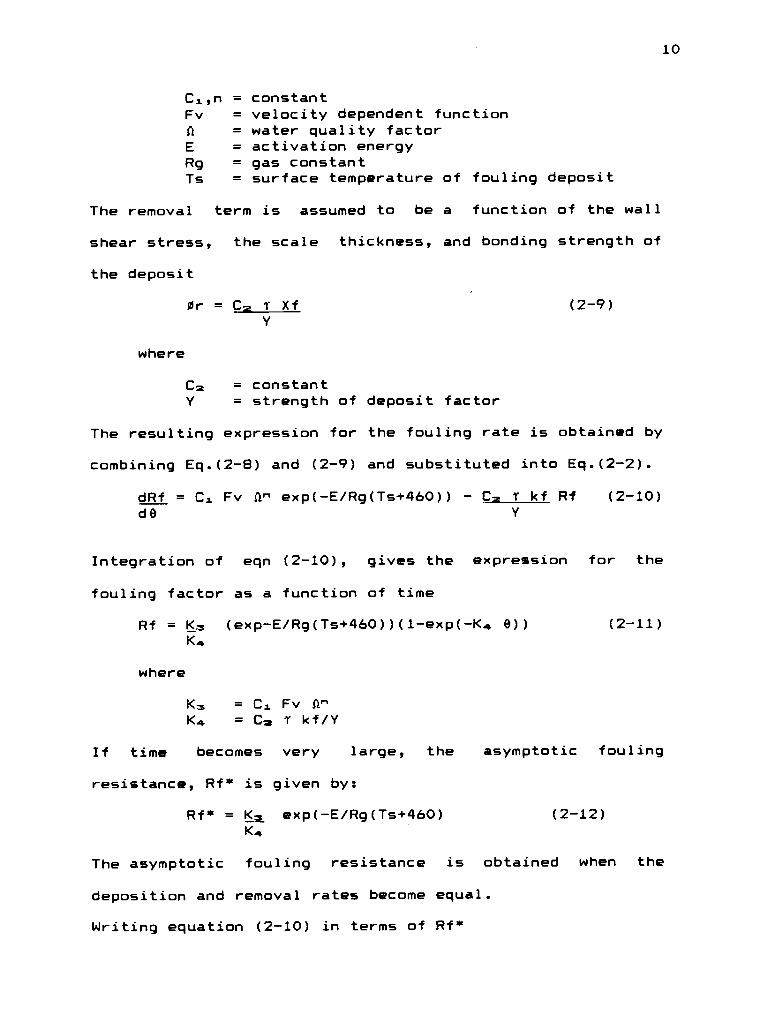
10
Cs.,n = constantFv = velocity dependent functionST = water quality factorE = activation energyRg = gas constantTs = surface temperature of fouling deposit
The removal term is assumed to be a function of the wall
shear stress, the scale thickness, and bonding strength of
the deposit
Or = C2 T Xf (2-9)
where
C2 = constant= strength of deposit factor
The resulting expression for the fouling rate is obtained by
combining Eq.(2-8) and (2-9) and substituted into Eq.(2-2).
dRf = Ci Fv ft^ exp(-E/Rg(Ts+460)) Ca T kf Rf (2-10)de
Integration of eqn (2-10), gives the expression for the
fouling factor as a function of time
Rf = Kz (exp-E/Rg(Ts+460))(1-exp(-K4 0)) (2-11)
where
K4
Km = CI Fv 11^K4 = C2 T kf/Y
If time becomes very large, the asymptotic fouling
resistance, Rf* is given by:
Rf* = Km exp(-E/Rg(Ts+460) (2-12)K4
The asymptotic fouling resistance is obtained when the
deposition and removal rates become equal.
Writing equation (2-10) in terms of Rf*
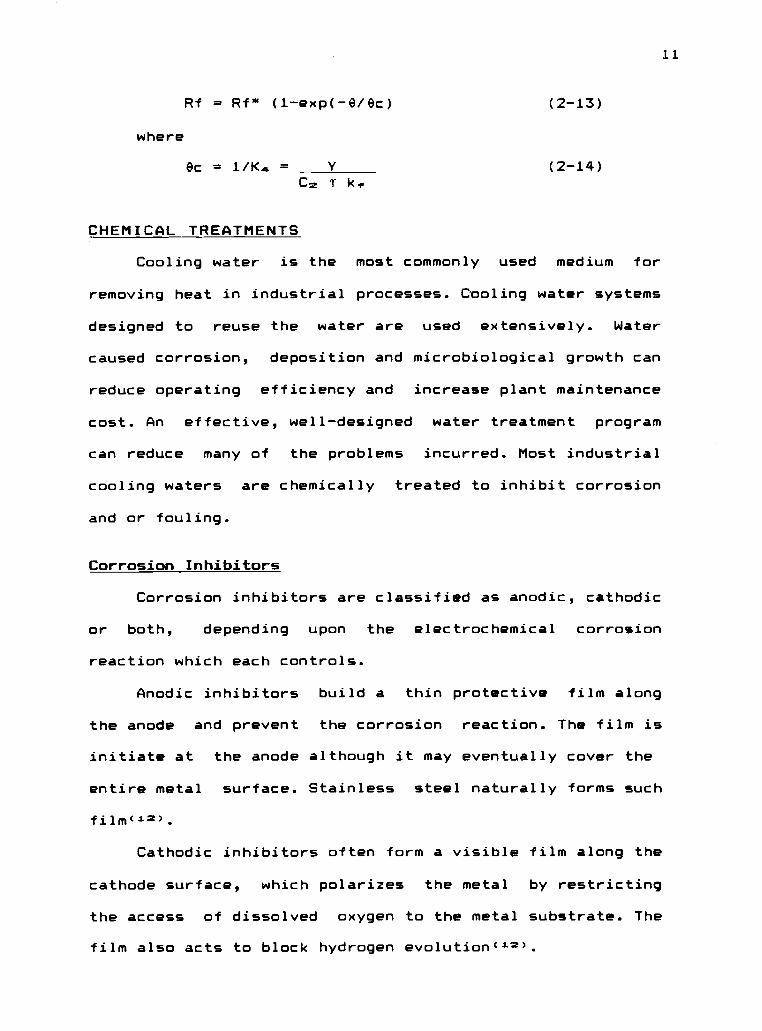
11
where
Rf = Rf* (1-exp(-e/ec) (2-13)
ec = 1 /Ka = YC= T kf
(2-14)
CHEMICAL TREATMENTS
Cooling water is the most commonly used medium for
removing heat in industrial processes. Cooling water systems
designed to reuse the water are used extensively. Water
caused corrosion, deposition and microbiological growth can
reduce operating efficiency and increase plant maintenance
cost. An effective, well-designed water treatment program
can reduce many of the problems incurred. Most industrial
cooling waters are chemically treated to inhibit corrosion
and or fouling.
Corrosion Inhibitors
Corrosion inhibitors are classified as anodic, cathodic
or both, depending upon the electrochemical corrosion
reaction which each controls.
Anodic inhibitors build a thin protective film along
the anode and prevent the corrosion reaction. The film is
initiate at the anode although it may eventually cover the
entire metal surface. Stainless steel naturally forms such
film"2).
Cathodic inhibitors often form a visible film along the
cathode surface, which polarizes the metal by restricting
the access of dissolved oxygen to the metal substrate. The
film also acts to block hydrogen evolutionci).
12
Corrosion inhibition usually results from one or more
of three general mechanisms. First, the inhibitor molecule
is absorbed on the metal surface forming a thin protective
film, either by itstself, or in conjunction with metallic
ions. Second, some inhibitors cause a metal to form a
protective film of metal oxide. Third, the inhibitor reacts
with a potentially corrosive substance in the water").
POLYPHOSPHATES
Polyphosphates are cathodic inhibitors. The molecule
adsorbs or bonds with calcium ions to form a colloidal
particle; these positively charged particles migrate to the
cathode to form a film. Polyphosphates also have the added
benefit of being a scale inhibitor at a threshold levels as
low as 1-5 ppm. One of the most commonly used polyphosphates
is sodium hexametaphosphate('.
The principal problem associated with the use of
polyphosphates is their reversion to orthophosphate.
Orthophosphate is a weak anodic inhibitor which cannot
provide the protection afforded by polyphosphate. The
primary cause of reversion are high temperature and low or
high pH. Calcium can react with orthophosphate, and because
calcium orthophosphate is an inverse solubility salt)it is
usually formed first on heat transfer surfaces.
Metal ions in the water occasionally affect
polyphosphate. Dissolved iron in the water will have both
positive and negative effects on the inhibitor. The
beneficial effect is the strengthening of the film resulting
from the inclusion of iron. Iron, however, can complex with
polyphosphates thereby rendering them useless as inhibitors.
Another disadvantage of using polyphosphate is their
nutrient potential for algal growth, when reverted to
orthophosphate «i °'. Recent technology has substantially
minimized the limitations of polyphosphate by blending them
with other materials.
CHROMATES
This anodic inhibitor forms a highly passive film of
ferric and chromic oxides, similar in composition to that
naturally found on stainless steel, at the anode surface.
Initially formed at the anode, it can eventually protect the
entire metal surface. Chromates can also prevent cathodic
depolarization by adsorption of the chromate on the cathodic
surface, thereby preventing the diffusion of dissolved
oxygen.
The primary problem in the use of chromates is their
environmental toxicity. Chromium like other heavy metals is
known to be toxic to many forms of aquatic lifec).
Chromates are usually used with another cathodic inhibitor
to form a synergistic blend.
ZINC
Salts of zinc are the most commonly used cathodic
13
inhibitors in cooling water systems, they rapidly form a
14
film on the metal surface. Because the film is not very
durable, zinc is usually not used alone, but is found in
many synergistic blends which take advantage of its rapid
film forming abilities.
Zinc presents toxicity problems to aquatic life, and
its use, as is that of chromates, has consequently been
restricted in recent yearsc=".
PHOSPHONATES
Phosphonates can stabilize iron or hardness salts and
form inhibitor films on metal surfaces. Phosphonates do not
hydrolyze as easily as polyphosphates. The most commonly
used phosphonates are amino methylenephosphoric acid (AMP)
and 1-hydroxyethylidene-1, 1-diphosphoric acid (HEDP).
ORTHOPHOSPHATES
Thse are anodic inhibitors. They are rarely used alone
for corrosion control because of the danger of calcium
phosphate formation in the bulk water.
15
SYNERGISTIC BLENDS
In actual plant operation, the use of only one
corrosion inhibitor is rare, usually two or more inhibitors
are blended to utilize the advantages of each inhibitor to
minimize their respective limitations. Frequently, anodic
and cathodic inhibitors are combined to give better total
metal protection (synergism). Also many combination of
cathodic inhibitors can give additional polarization at the
cathode and effectively control corrosion. In less common
situations anodic inhibitors may be combined to give extra
passivation.
Antifoulants
The introduction of antifoulants into cooling water
systems is now as common a practice as the addition of
corrosion inhibitors. As in the case of corrosion
inhibitors, two or more antifoulants are often blended to
maximize their advantages and minimize their disadvantages.
POLYPHOSPHATES
Polyphosphates as sequestrants have been used to
control iron and hardness salts (calcium and magnesium) for
a number of years. A sequestrant is an agent which prevents
an ion from exhibiting its normal property by complexing
with it below stochiometric levels.
16
POLYACRYLATES
Polyacrylates are being used as dispersants.
Polyacrylates can be adsorbed on foulant surfaces imparting
a like charge to them and thereby causin the particles to
remain in suspension because of charge repulsion.
Polyacrylates are also used to coat the surface of heat
transfer equipment to reduce the adhesion of the scale.
PHOSPHONATES
Phosphonates reduce the attractive forces between
individual ion particles by adsorption of the phosphonates
to the particle surfaces. As corrosion inhibitors, they
should be used with zinc, polyphosphate, etc., to provide
multi-metal protection. Phosphonates are better deposit
control agents than polyphosphates, whereas polyphosphates
are as known as superior corrosion inhibitorsc").
17
III. EXPERIMENTAL EQUIPMENT
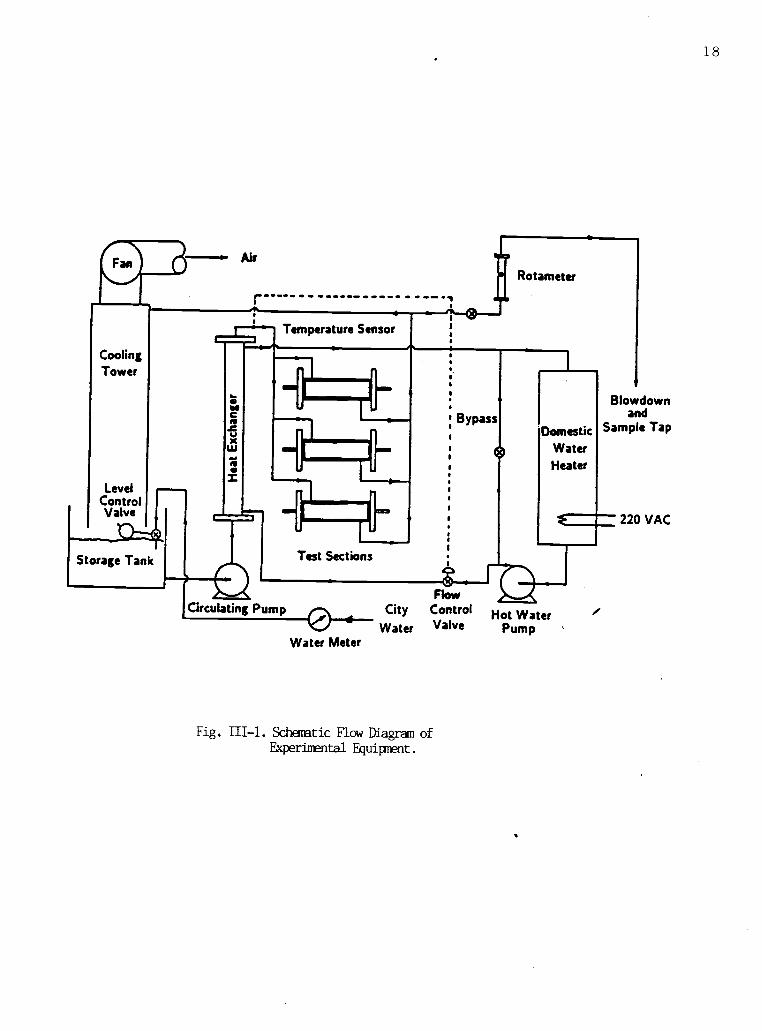
The equipment used in this study was designed to
simulate the operating conditions of a commercial cooling
tower system. A schematic flow sheet of the complete system
is shown in Fig III-1. It consists of three main parts; the
heat exchanger system, test sections and the cooling tower
system. To eliminate the effect of corrosion on the fouling
characteristics as much as possible, non-corrosive materials
are used throughout the cooling tower system. Piping was
primarily of polyvinylchloride (PVC) or chlorinated
polyvinylchloride (CPVC), stainless steel and glass.
HEAT EXCHANGER SYSTEM
In order to maintain a constant bulk temperature of the
water being tested a heat exchanger system was employed. The
heat exchanger system is a closed loop circulating system.
City water, heated to 120 1300F in a 40 gallon domestic
electric water heater is pumped to the shell side of a
counter current shell and tube heat exchanger. The cooling
water to be tested is heated in the tube side of the heat
exchanger. The heat exchanger has 19 stainless steel tubes
with 1/2 in OD, 16 BWG wall, and a length of 7 feet. A
temperature controller regulates the heated water flow rate
F
CoolingTower
LevelControlValve
Rotameter
oN No WO
Storage Tank
Temperature Sensor
Test Sections
Circulating Pump
Water Meter
CityWater
Flow
ControlValve
Fig. III-1. Schematic Flow Diagram of
Experimental Equipment.
DomesticWaterHeater
Slowdownand
Sample Tap
*----- 220 VAC
Hot WaterPump
18
19
to the heat exchanger to maintain a constant water bulk
temperature in the test system.
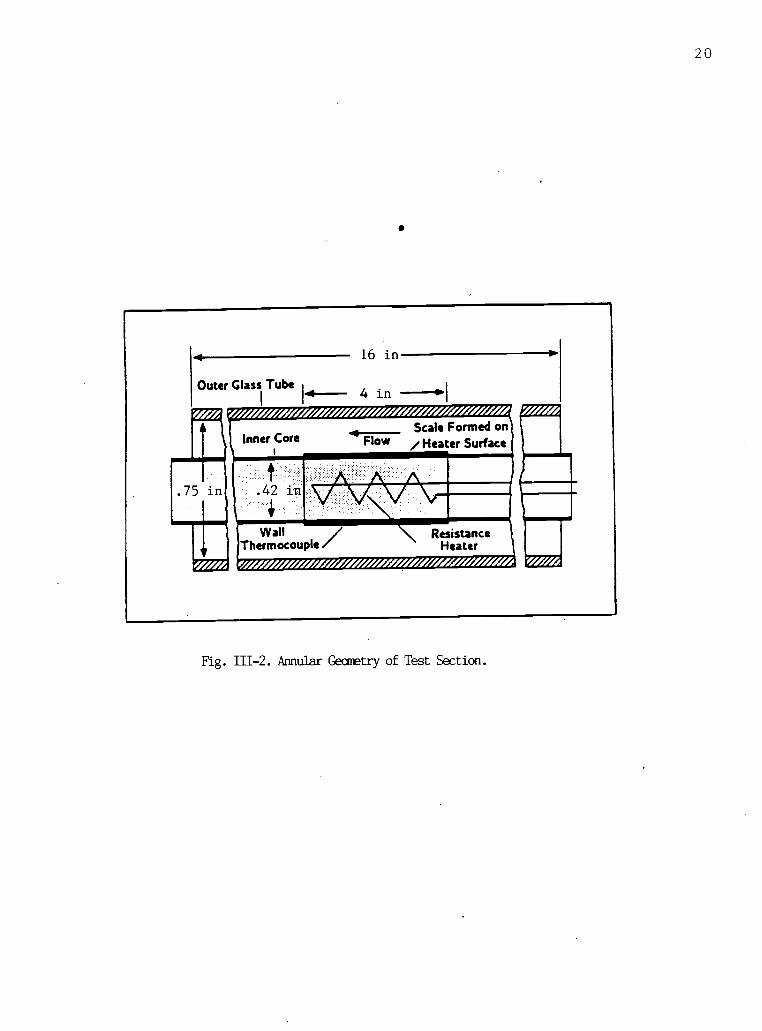
TEST SECTIONS
After the cooling water is heated in the heat
exchanger, it flows through the test sections. A test
section of annular geometry is shown in Figure 111-2. The
heater rod has an outside diameter of .42 in and is heated
electrically over a length of 4 in. Four chromel-constantan
thermocouples are embedded in the heater wall to record the
wall temperature as deposit accumulates on the rod surface.
They are located on the same cross-sectional plane 900 apart
from each other. The outer glass tube has an inside diameter
of .75 in and the overall length of the test section is 16
in. The test sections are mounted in Portable Fouling
Research Units (PRFU) provided by Heat Transfer Research,
Inc., (HTRI).
The test fluid flows through the annular section
between the heater rod and the glass tube. Fouling occurs on
the outside of the heated portion of the inner tube.
Conditions such as flow rate and surface temperature of
the heated section can be set easily to the desired level by
making appropriate adjustment in the flow rate of the water
to be tested and the power input to the heater.
20
Outer Glass Tube
II.75 in
II
Inner Core
.42
16 in1 4 in
Scale Formed onFlow / Heater Surface
A AV V VWall
Thermocouple/ ResistanceHeater
Fig. 111-2. Annular Geometry of Test Section.
21
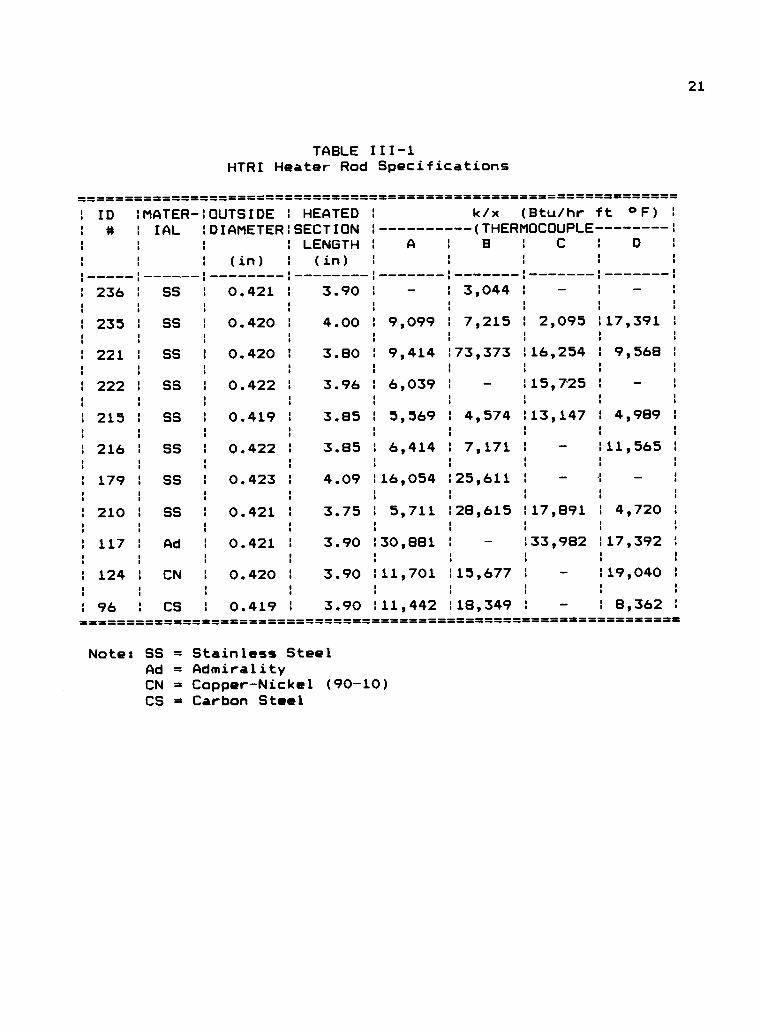
TABLE III-1HTRI Heater Rod Specifications
============ ===========
: ID IMATER-10UTSIDE : HEATED 1
1 it 1 IAL :DIAMETER:SECTION 1
': LENGTH : A
. .. ''
' : (in) : (in) 1,
1 : : :
: 236 1 SS 1 0.421 : 3.90 :
: 235 1 SS : 0.420 1 4.00 : 9,099. . .
1 221 I SS 1 0.420 1 3.80 : 9,414
1 222 : SS : 0.422 1 3.96 : 6,039.
.
.
.
1
.
1 215 : SS : 0.419 : 3.85 1 5,569:
: 216 : SS : 0.422 : 3.85 1 6,414. .
1 179 1 SS : 0.423 : 4.09 :16,054. I : :
1 210 : SS 1 0.421 : 3.75 : 5,711
: 117 1 Ad : 0.421 : 3.90 :30,881. . .
: 124 1 CN : 0.420 : 3.90 :11,701
1 96 : CS 1 0.419 : 3.90 :11,442
==-"=============k/x (Btu/hr ft °F) :
(THERMOCOUPLE 1
.8 1 C D '
' .
: : 1
: 3,044 : -
: 7,215 1 2,095 :17,391 :
. . . .
:73,373 :16,254 1 9,568 :
. . .
: - :15,725 : - 1
1 4,574 113,147 1 4,989 :
. . .
.
.
: 7,171 1 :11,565 :
. 1:
.
:25,611 : - 1 - :
:28,615 :17,891 I 4,720. . .
1 - :33,982 :17,392 :
.
.
.
, 1
:15,677 : :19,040 :
:18,349 : - : 8,362 :
========== ======================== =====
Note: SS = Stainless SteelAd = AdmiralityCN = Copper-Nickel (90-10)CS = Carbon Steel
22
Heater rods and specifications such as dimensions and
thermal resistances of the tube wall are provided by HTR1.
These values of each rod are summarized in table III-1.
COOLING TOWER SYSTEM
The cooling tower system consist of three major parts.
The spray cooling tower, the cooling tower sump and the
blowdown unit. The total volume of cooling tower water in
the system is about 260 1. Cooling water is circulated
through the system, absorbing heat in the heat exchanger and
in the test sections and then is cooled in the spray cooling
tower.
SPRAY COOLING TOWER
The spray cooling tower is a cylindrical empty column 2
feet in diameter, 20 feet high. It is mounted concentrical
above the cooling tower sump. After water flows through the
test sections, it flows to the top of the cooling tower
where it is sprayed through spray nozzles and falls through
the tower. An induction fan at the top of the cooling tower
draws air up through the the tower and out of the top.
COOLING TOWER SUMP
The cooling tower sump is a cylindrical tank 4 feet
high, 34 inches in diameter, with 1/8 inches thick stainless
steel wall. Later in this study, this stainless steel
cooling tower sump tank was replaced with a reinforced
plastic tank of the same size. Water from the cooling tower
23
spray is returned to the cooling tower sump to be
recirculated.
Fortified city water was supplied to the cooling tower
sump from the make up tank through a level control valve to
make up for evaporation and discharge losses. Other
additives to the system were added directly to the cooling
tower sump by means of metering pumps. Sulfuric acid (.05N)
flows by gravity through a solenoid valve which was
activated by pH controller.
BLOW DOWN UNIT
As the cooling tower water evaporates, the
concentration of the mineral constituents increases due to
the input of fortified city water and other additives being
fed continuously to make up for the evaporative losses. In
order to maintain a constant cooling tower water quality
(mineral content), blowdown was withdrawn from the bottom of
the cooling tower sump. A metering pump was used to control
the rate of blowdown from the system, and the discharge was
collected in the calibrated blowdown storage tank.
DATA AOUISITION SYSTEM
Two data Aquisition Systems were utilized. Initially,
from run 117 - 169, only a Digitec 1000 Datalogger was used.
This equipment was capable of scanning the system sensors
(temperature. flow, and power) at desired intervals (one
minute to five hours) and print out the results in
24
millivolts on a paper tape. These data were then processed
on the OSU Central Computer Facility after completion of a
test. The disadvantage of this method of data acquisition
was the difficulty in following the progress of a test on a
day-to-day basis, because the output data was in the form of
millivolts.
Hence, beginning with run 170, a Hewlett-Packard 3540
Data logger was used in conjunction with a Hewlett Packard
HP85 micro computer for data aquisition. With this
combination, it was possible to scan the system at any
desired time during a test. Flows, temperatures, heat
fluxes, fouling resistances, pH, conductivity and
corrosivity could be printed out after each scan. At the end
of a test all data were tabulated and plots of velocity,
surface temperature, fouling resistance, pH, conductivity
and corrosion rate as a function of time were produced by
the computer. Typical time plots for run 173-301 are shown
in Appendix F. Such composite plots are useful in relating
any changes in operating conditions to changes in the
fouling resistance.
25
IV EXPERIMENTAL PROCEDURES
EXPERIMENTAL PROGRAM
Several parameters which significantly affect fouling
were investigated. Three different velocities (3, 5.5 and 8
ft/sec) and surface temperatures (130, 145 and 160 OF) were
covered. The two major water chemistry parameters
investigated were pH, and corrosion inhibitor additives.
Initially, the fouling characteristics were investigated at
the most severe fouling conditions (highest surface
temperature and lowest velocity).
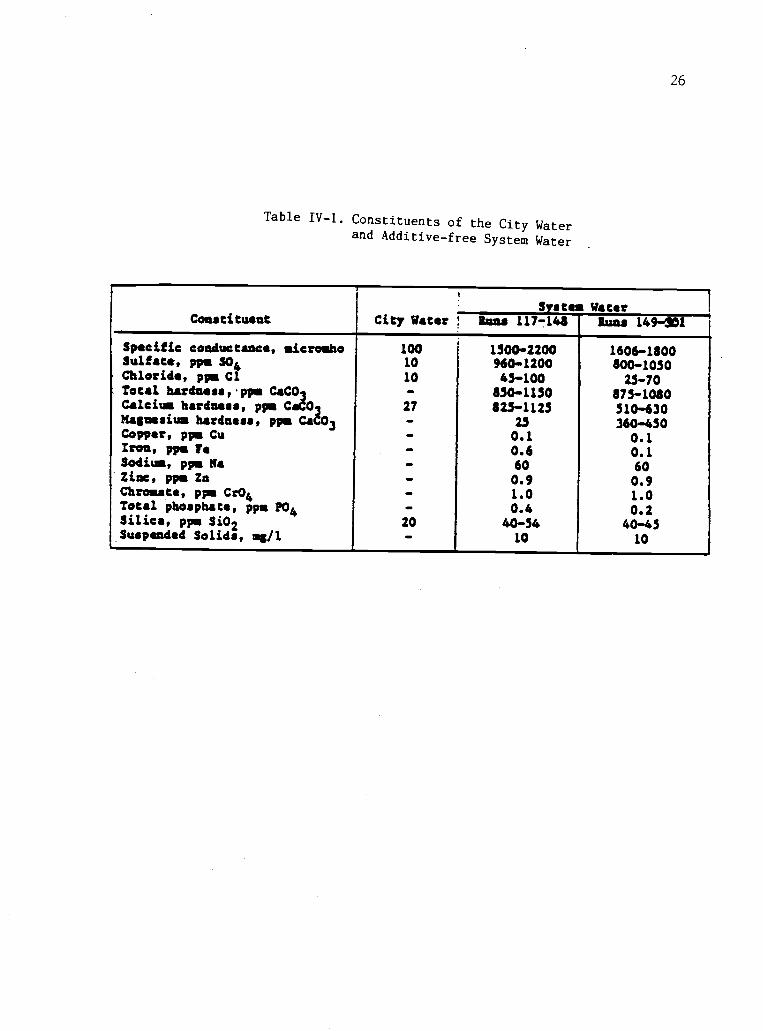
The main constituents of the city water and additive
free system water are shown in Table IV-1. For runs 117 to
148, the total hardness ranged between 850 and 1150 ppm with
magnesium hardness being only 25 ppm and calcium hardness
making up the difference. These are referred to as the low
magnesium tests. Beginning with run 149, the magnesium
hardness was increased to constitute approximately one third
of the total hardness. These are referred to as the high
magnesium tests. The higher level of magnesium was
accomplished by adding the required amount of magnesium
sulfate to the fortifying tank containing the saturated
calcium sulfate.
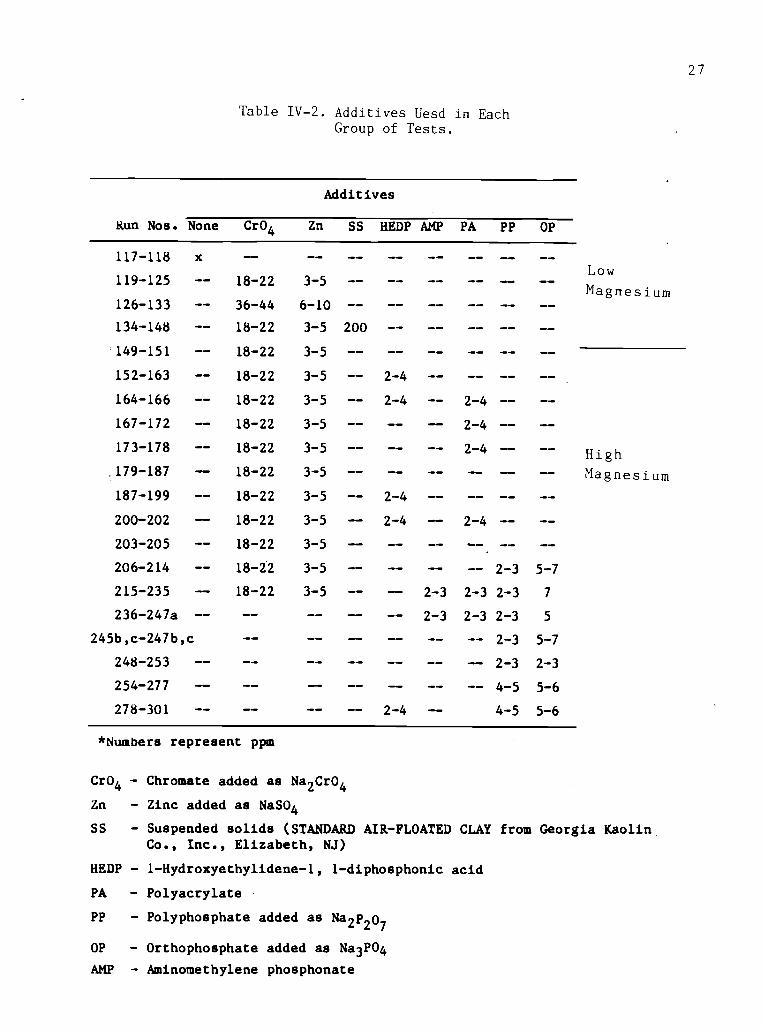
Table IV-2 shows the additives that were used in each
group of tests.
26
Table IV-1. Constituents of the City Waterand Additive-free System Water
Constituent City Water .
Stele WaterRums 117-146 Runs 149-101
Specific conductance, micromho 100 1500-2200 1606-1800Sulfate, ppm 504 10 960-1200 800-1050Chloride, ppm Cl 10 43- 100 23-70Total hardness,ppm CaC01 - 850-1150 875-1080Calcium hardness, ppm CaC0 27 823-1125 510-630Magnesium hardness, ppm CaCO3 - 23 360-450Copper, ppm Cu - 0.1 0.1Iran, ppm Ye - 0.6 0.1Sodium, ppm Ma - 60 60Zinc, ppm Zn - 0.9 0.9Chromate, ppm Cr04 - 1.0 1.0Total phosphate, ppm PO4 - 0.4 0.2Silica, ppm Si02 20 40-54 40-45Suspended Solids, mg/1 - 10 10
27
Table IV-2. Additives Uesd in EachGroup of Tests.
Additives
Run Nos. None Cr04 Zn SS HEDP AMP PA PP OP
117-118 x -- --Low
119 -125 -- 18-22 3-5 -- --Magnesium
126 -133 36-44 6-10 --
134 -148 18-22 3-5 200
149-151 -- 18-22 3-5 --
152 -163 18-22 3-5 2-4 --
164 -166 18-22 3-5 2-4 2-4
167-172 NIMIM 18-22 3-5 -- 2-4 --
173 -178 -- 18-22 3-5 -- 2-4 -- High179 -187 -- 18-22 3-5 -- -- -- -- Magnesium
187 -199 18-22 3-5 -- 2-4 -- --
200 -202 -- 18-22 3-5 -- 2-4 2-4 --
203 -205 18-22 3-5 -- --
206 -214 18 -22 3-5 -- 2-3 5-7
215-235 -- 18-22 3-5 -- 2-3 2-3 2-3 7
236-247a -- 2-3 2-3 2-3 5
245b,c-247b,c -- 2-3 5-7
248-253 -- -- -- 2-3 2-3
254-277 -- -- 4-5 5-6
278-301 -- 2-4 -- 4-5 5-6
*Numbers represent ppm
Cr04 Chromate added as Na
2Cr0
4
Zn - Zinc added as NaSO4
SS Suspended solids (STANDARD AIR-FLOATED CLAY from Georgia KaolinCo., Inc., Elizabeth, NJ)
HEDP - 1-Hydroxyethylidene-1, 1-diphosphonic acid
PA - Polyacrylate
PP - Polyphosphate added as Na2P207
OP - Orthophosphate added as Na3PO4
AMP - Aminomethylene phosphonate
28
PROCEDURE
SYSTEM TO OBTAIN DESIRED WATER QUALITY
The local city water contains about 20 ppm of calcium
hardness and about an equal amount of silica. It is
therefore, necessary to fortify the city water with calcium
to obtain the compositions shown in Table IV-1.
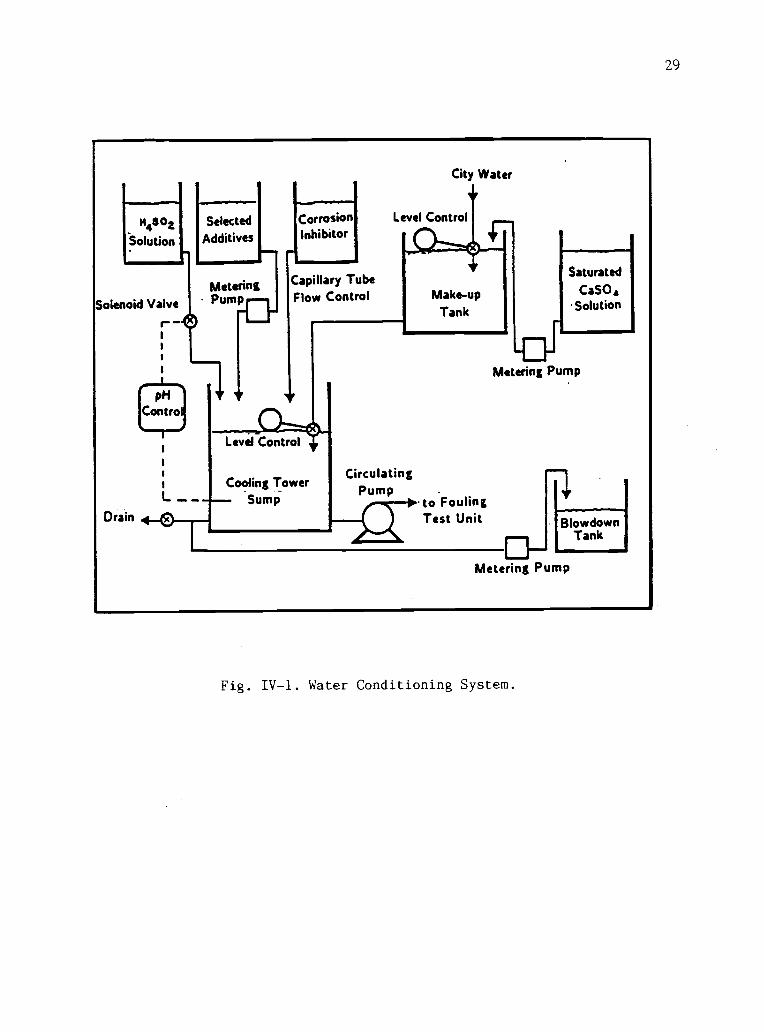
The complete water conditioning system is shown in Fig
IV-1. City water (float controlled) and saturated calcium
sulfate solution (provided by a metering pump) flow into the
well agitated make-up tank. The saturated calcium sulfate
solution (fortifying solution) is prepared by mixing city
water with powdered native calcium sulfate from Fisher
Scientific. For the high magnesium tests, the required
amount of magnesium sulfate also added into the fortifying
solution.
The mixture from the make up tank flows through a float
controlled valve to the cooling tower sump. The water to be
tested was pumped through the cooling tower system by the
circulation pump. The bulk water temperature was adjusted to
the desired set point. The circulation of water was
continued until the hardness and silica concentrations
increased to the desired level, after which the blowdown was
withdrawn from the cooling tower sump by a metering pump to
maintain the desired water quality.
Other materials were added directly to the cooling
tower sump. Zinc-chromate corrosion inhibitor of appropriate
composition flowed by the gravity at a constant rate through
29
yozSolution
Solenoid Valve
Drain
s
s
Control%1111111111110
Selected
Additives
r-Metering
CorrosionInhibitor
Capillary TubeFlow Control
Level Control
s Cooling Tower
0L Sump
City Water
Level Control
Make-upTank
CirculatingPump
to FoulingTest Unit
Saturated
CaSO,Solution
Metering Pump
11B1°Twan"wnTank
Metering Pump
Fig. IV-1. Water Conditioning System.
30
a long capillary tube into the cooling tower sump. Other
corrosion inhibitors and antifoulant (whenever used)
additives were mixed and added together directly to cooling
the tower sump by means of a metering pump.
PH was controlled at the desired level by the addition
of sulfuric acid (.05N) which flowed by gravity through a
solenoid control valve which was activated by a pH
controller.
RUN INITIATION
After the desired water quality for a particular run
was obtained, the heater rods were fitted into the test
sections. Then flow rate and surface temperature were set to
the desired values by making appropriate adjustment in the
flow rate and the power input to the heaters.
The data logger was activated and set to record ten
readings at two minute intervals for calibration purposes,
after which for the remainder of the test, the data logger
was set to monitor the system at five hour intervals when
the Digitec 1000 data logger was used, and at six hour
intervals when the Hewlett Packard 3540 data logger was
used.
PROCESS MONITORING
The system water was analyzed everyday for hardness,
silica, sulfate, chloride and level of additives. Samples
were taken at the beginning and at the end of each set of
runs and were sent to Betz laboratories for complete
analysis. The methods used for water analysis are listed in
appendix C.
Corrosion, conductivity and pH were measured by on-line
instruments and recorded by the data logger.
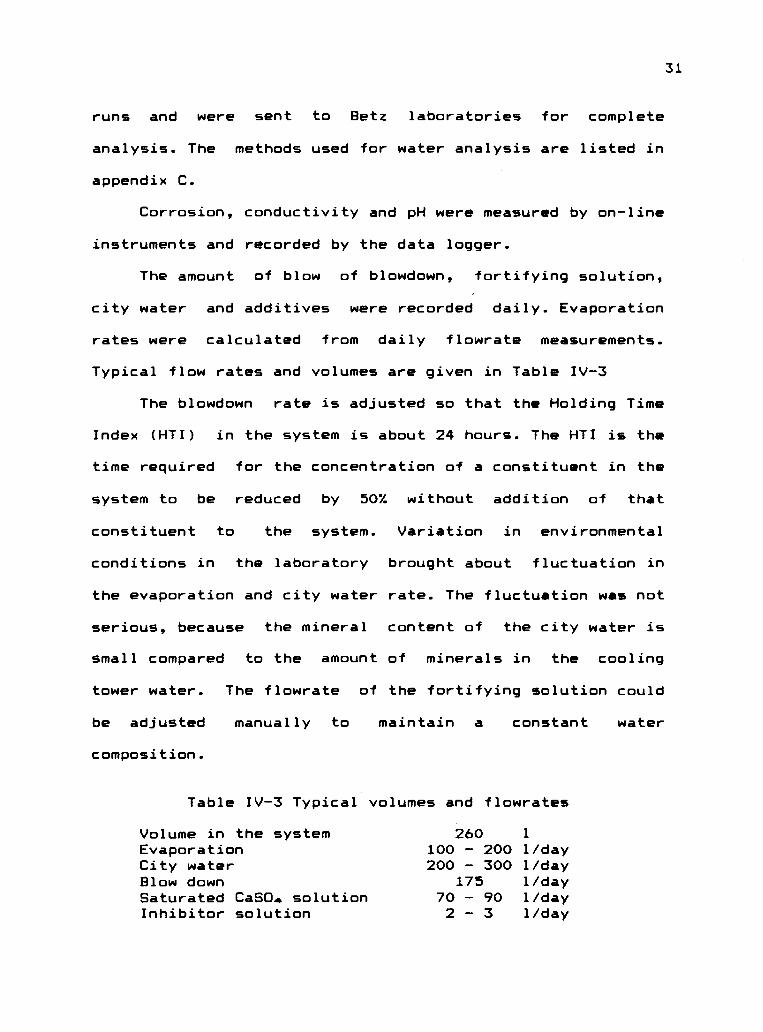
The amount of blow of blowdown, fortifying solution,
city water and additives were recorded daily. Evaporation
rates were calculated from daily flowrate measurements.
Typical flow rates and volumes are given in Table IV-3
The blowdown rate is adjusted so that the Holding Time
Index (HTI) in the system is about 24 hours. The HTI is the
time required for the concentration of a constituent in the
system to be reduced by 50% without addition of that
constituent to the system. Variation in environmental
conditions in the laboratory brought about fluctuation in
the evaporation and city water rate. The fluctuation was not
serious, because the mineral content of the city water is
small compared to the amount of minerals in the cooling
tower water. The flowrate of the fortifying solution could
be adjusted manually to maintain a constant water
composition.
Table IV-3 Typical volumes and flowrates
Volume in the systemEvaporationCity waterBlow downSaturated CaSCI., solutionInhibitor solution
260 1
100 - 200 1/day200 300 1/day
175 1/day70 - 90 1/day2 - 3 1/day
31
32
Flow rates and power levels were monitored daily and
adjusted manually whenever they were found to deviate from
their original set values.
A volume of 100 ml commercial chloride bleach was added
daily directly into the cooling tower sump for control of
biological growth.
RUN TERMINATION
Generally runs were terminated when the fouling
resistance reached a constant value or when essentially no
fouling was observed (i.e. the measured fouling resistance
was less than .0002 hr ft2 0F/Htu after about 150 hr
duration). In many instances, runs were terminated while the
fouling resistance was still increasing. Usually, in these
runs, sufficient data were obtained, so that the
correlational methods used in Section VI were applicable and
it was apparent that the ultimate asymptotic fouling
resistance would not be acceptable in an operating heat
exchanger. When runs were terminated, the heater power and
water flow in the test sections was turned off, the heater
rods were removed from the test sections and the deposit, if
any, was scraped off from the rod. After it was thoroughly
dry, the sample was sent to the DuPont Company for chemical
analysis, and then the heater rods were reused after they
were cleaned by polishing with fine steel wool.
33
V CALCULATION PROCEDURES
CALCULATION OF FOULING RESISTANCE
Clean Fouled
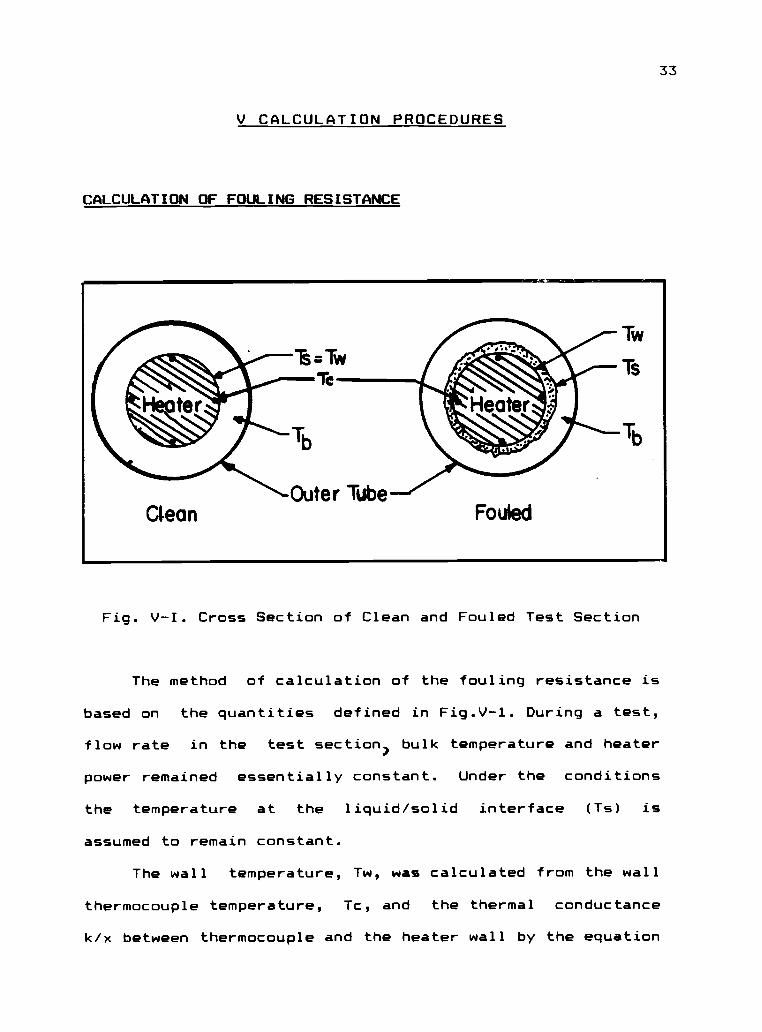
Fig. V-I. Cross Section of Clean and Fouled Test Section
The method of calculation of the fouling resistance is
based on the quantities defined in Fig.V-1. During a test,
flow rate in the test section>bulk temperature and heater
power remained essentially constant. Under the conditions
the temperature at the liquid/solid interface (Ts) is
assumed to remain constant.
The wall temperature, Tw, was calculated from the wall
thermocouple temperature, Tc, and the thermal conductance
k/x between thermocouple and the heater wall by the equation
34
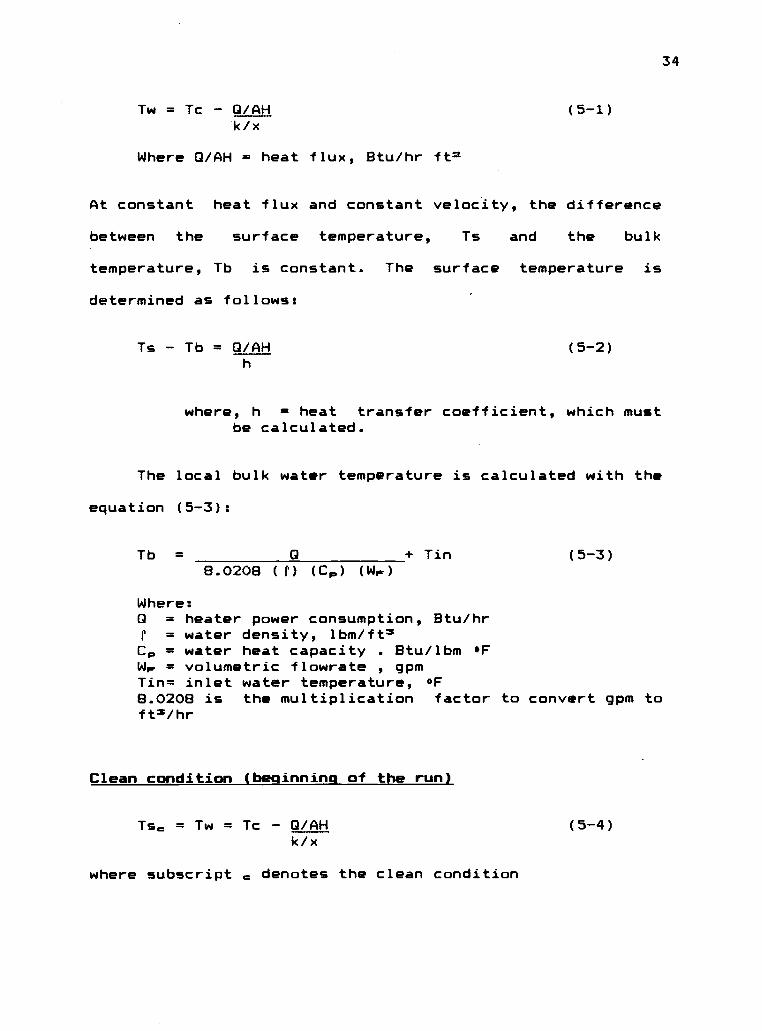
Tw = Tc 0/AH (5-1)k/x
Where 0/AH = heat flux, Btu/hr ft
At constant heat flux and constant velocity, the difference
between the surface temperature, Ts and the bulk
temperature, Tb is constant. The surface temperature is
determined as follows:
Ts Tb = 0/AH (5-2)h
where, h = heat transfer coefficient, which mustbe calculated.
The local bulk water temperature is calculated with the
equation (5-3):
Tb = 0 + Tin (5-3)8.0208 (f) (Cop) (M.)
Where:0 = heater power consumption, Btu/hrP = water density, lbm /ft5C1 = water heat capacity . Btu/lbmWp = volumetric flowrate , gpmTin= inlet water temperature, OF8.0208 is the multiplication factor to convert gpm toft2;/hr
Clean condition (beginning of the run)
Ts. = Tw = Tc - 0/AH (5-4)k/x
where subscript . denotes the clean condition
35
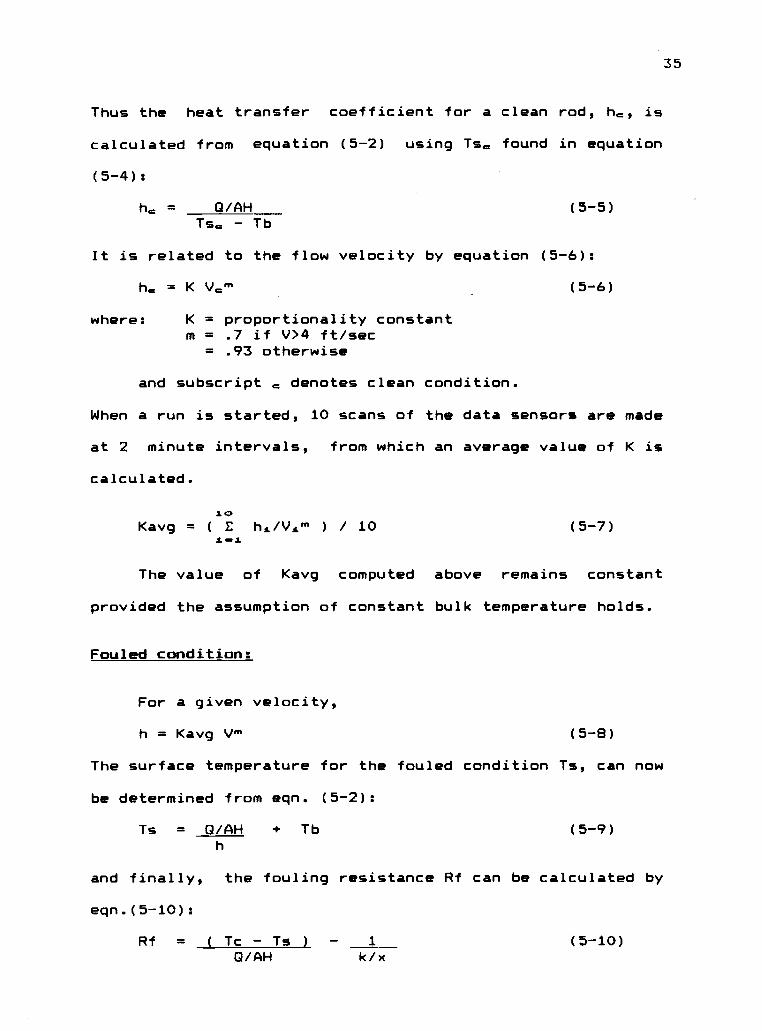
Thus the heat transfer coefficient for a clean rod, h., is
calculated from equation (5-2) using Tse found in equation
(5-4):
h. = 0/AH (5-5)Ts. Tb
It is related to the flow velocity by equation (5-6):
h. = K V.m (5-6)
where: K = proportionality constantm = .7 if V>4 ft/sec
= .93 otherwise
and subscript . denotes clean condition.
When a run is started, 10 scans of the data sensors are made
at 2 minute intervals, from which an average value of K is
calculated.
10Kavg = ( E hi/Vim ) / 10
i-i(5-7)
The value of Kavg computed above remains constant
provided the assumption of constant bulk temperature holds.
Fouled condition:
For a given velocity,
h = Kavg Vm (5-8)
The surface temperature for the fouled condition Ts, can now
be determined from eqn. (5-2):
Ts = O /AH + Tb (5-9)h
and finally, the fouling resistance Rf can be calculated by
eqn.(5-10):
Rf = ( Tc - Is ) 1 (5-10)WAH k/x
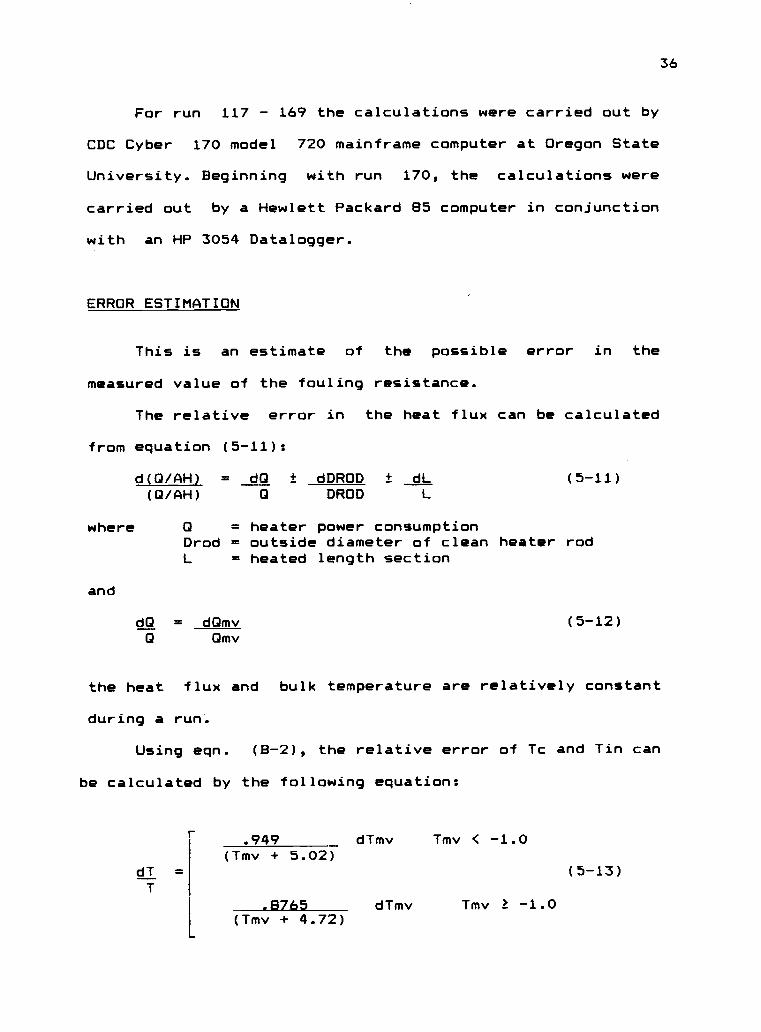
For run 117 169 the calculations were carried out by
CDC Cyber 170 model 720 mainframe computer at Oregon State
University. Beginning with run 170, the calculations were
carried out by a Hewlett Packard 85 computer in conjunction
with an HP 3054 Datalogger.
ERROR ESTIMATION
This is an estimate of the possible error in the
measured value of the fouling resistance.
The relative error in the heat flux can be calculated
from equation (5-11):
d(O/AH) = dO ± dDROD ± dL (5-11)(Q/AH) 0 DROD
where
and
0 = heater power consumptionDrod = outside diameter of clean heater rodL = heated length section
d0 = dOmv (5-12)0 Omv
36
the heat flux and bulk temperature are relatively constant
during a run.
Using eqn. (B-2), the relative error of Tc and Tin can
be calculated by the following equation:
dT =T
.949 dTmv Tmv < -1.0(Tmv + 5.02)
.8765(Tmv + 4.72)
dTmv Tmv k -1.0
(5-13)
37
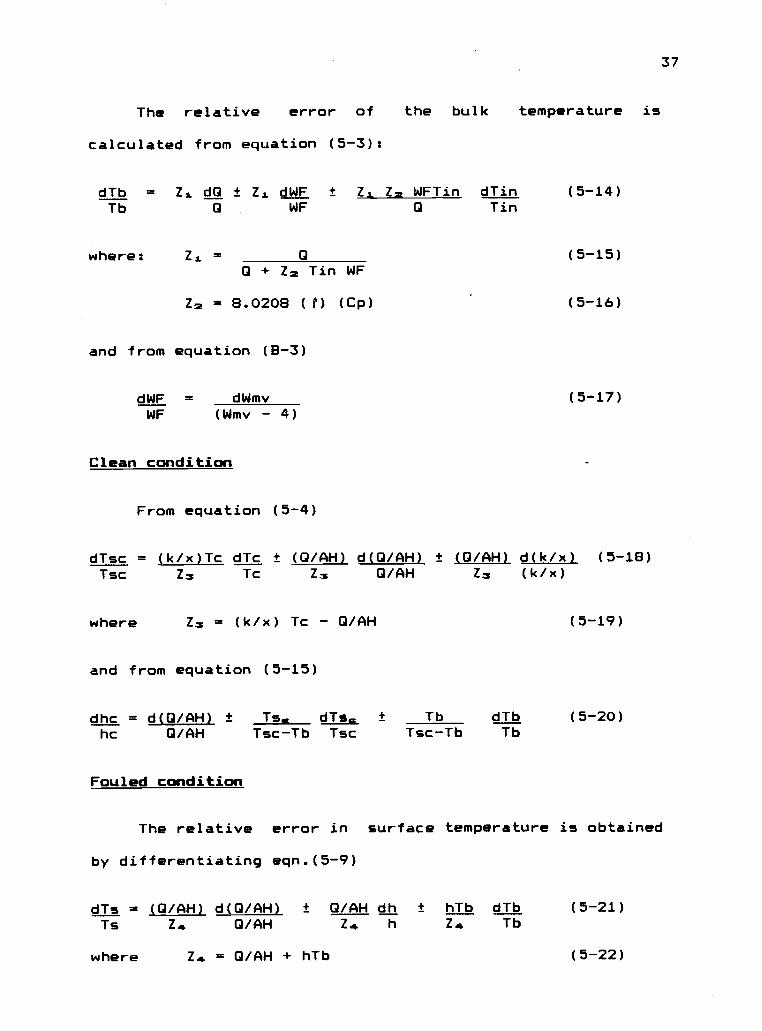
The relative error of the bulk temperature is
calculated from equation (5-3):
dTb = Z. d0 ± Zi dWF ± Zi Zm WFTin dTin (5-14)Tb Q WF Q Tin
where: ZA. = 00 + Zm Tin WF
Zm = 8.0208 (r) (Cp)
and from equation (B-3)
dWF = dWmv (5-17)WF (Wmv - 4)
Clean condition
From equation (5-4)
dTsc = (k/x)Tc dTc ± (Q /AH) d(Q/AH) ± (Q /AH) d(k/x) (5-18)Tsc Zm Tc Z. Q/AH Z3 (k/x)
where Zs = (k/x) Tc - Q /AH (5-19)
and from equation (5-15)
dhc = d(Q/AH) ± Ts. dTs. # Tb dTb (5-20)he Q /AH Tsc-Tb Tsc Tsc-Tb Tb
Fouled condition
The relative error in surface temperature is obtained
by differentiating eqn.(5-9)
dTs = (Q /AH) d(Q /AH) ± Q/AH dh ± hTb dTb (5-21)Ts Z4 WAN Z4 h Z4 Tb
where Z4 = Q/AH + hTb (5-22)
38
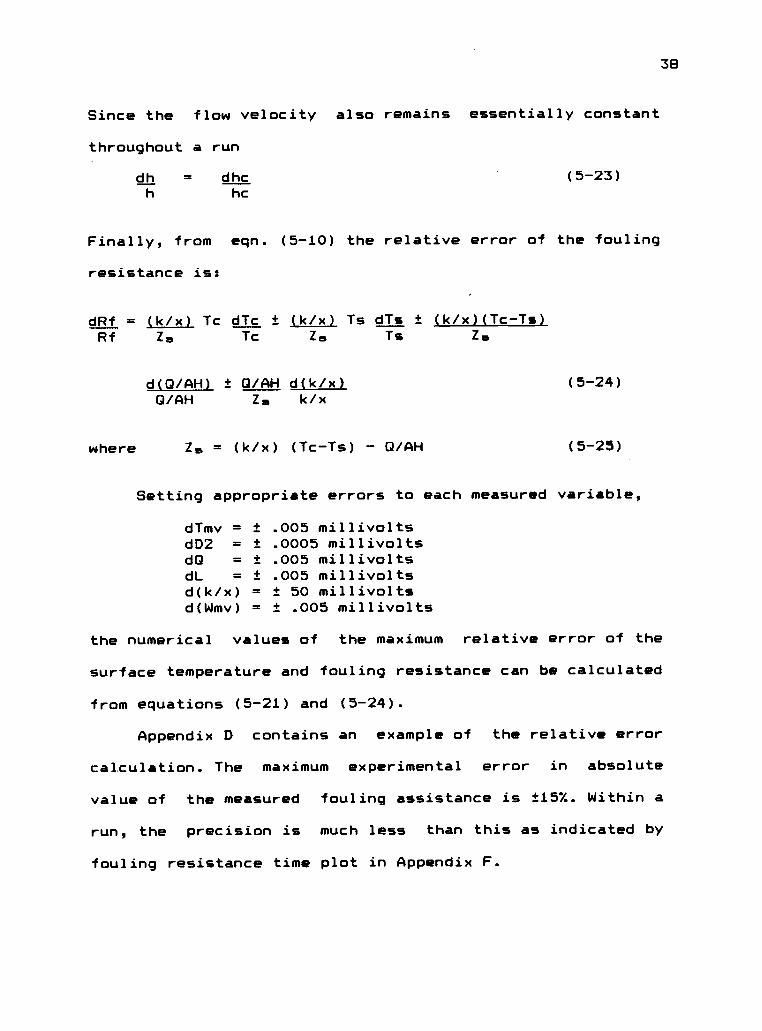
Since the flow velocity also remains essentially constant
throughout a run
dh = dhc (5-23)h he
Finally, from eqn. (5-10) the relative error of the fouling
resistance is:
dRf = (k/x) Tc dTc ± (k/x) Ts dTs ± (k/x)(Tc-Ts)Rf Zs Tc Zs Ts Zs
where
d(Q/AH) ± 0/AH d(k/x) (5-24)0/AH Zs k/x
Zs = (k/x) (Tc-Ts) - Q/AH (5-25)
Setting appropriate errors to each measured variable,
dTmv = ± .005 millivoltsdD2 = ± .0005 millivoltsdO = ± .005 millivoltsdL = ± .005 millivoltsd(k/x) = ± 50 millivoltsd(Wmv) = ± .005 millivolts
the numerical values of the maximum relative error of the
surface temperature and fouling resistance can be calculated
from equations (5-21) and (5-24).
Appendix D contains an example of the relative error
calculation. The maximum experimental error in absolute
value of the measured fouling assistance is ±157.. Within a
run, the precision is much less than this as indicated by
fouling resistance time plot in Appendix F.
39
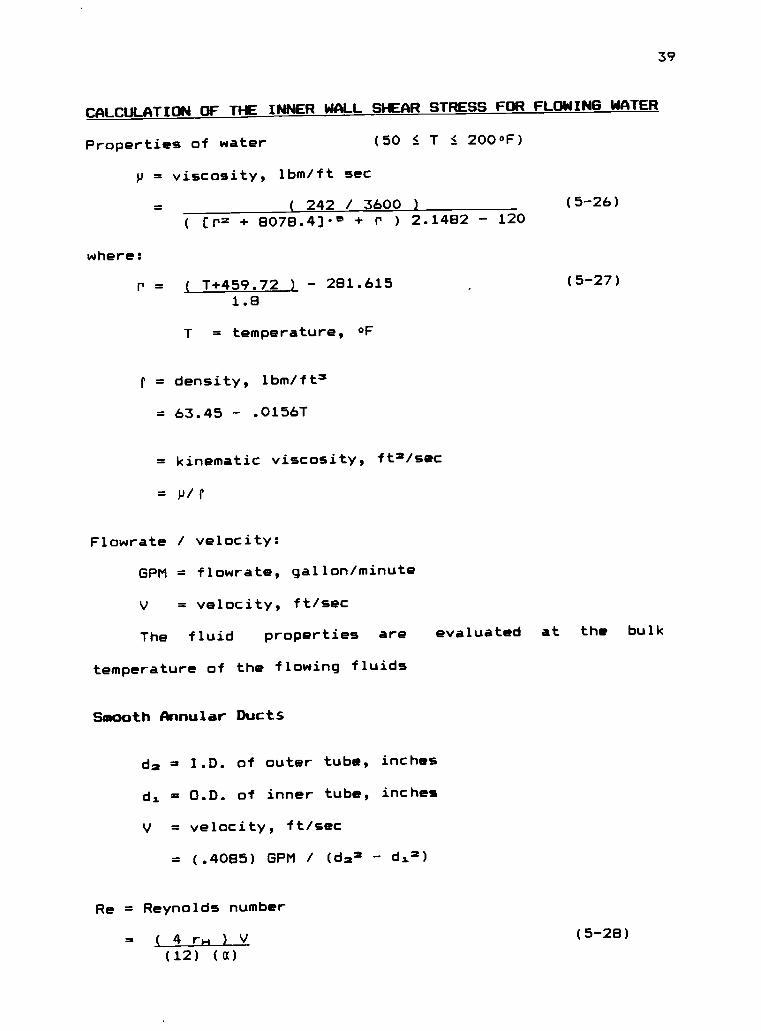
CALCULATION OF THE INNER WALL SHEAR STRESS FOR FLOWING WATER
Properties of water (50 T 2000F)
p = viscosity, lbm/ft sec
( 242 / 3600 ) (5-26)
( Er2 + 8078.4]0 + r ) 2.1482 - 120
where:
r = ( T+459.72 ) - 281.615 (5-27)
1.8
T = temperature, of
r = density, lbm/ft2
= 63.45 - .01567
= kinematic viscosity, ft2/sec
= P1 r
Flowrate / velocity:
GPM = flowrate, gallon/minute
V = velocity, ft/sec
The fluid properties are evaluated at the bulk
temperature of the flowing fluids
Smooth Annular Ducts
dm = I.D. of outer tube, inches
di = O.D. of inner tube, inches
V = velocity, ft/sec
= (.4085) GPM / (d22 dx2)
Re = Reynolds number
= ( 4 rH ) V (5-28)
(12) (a)
40
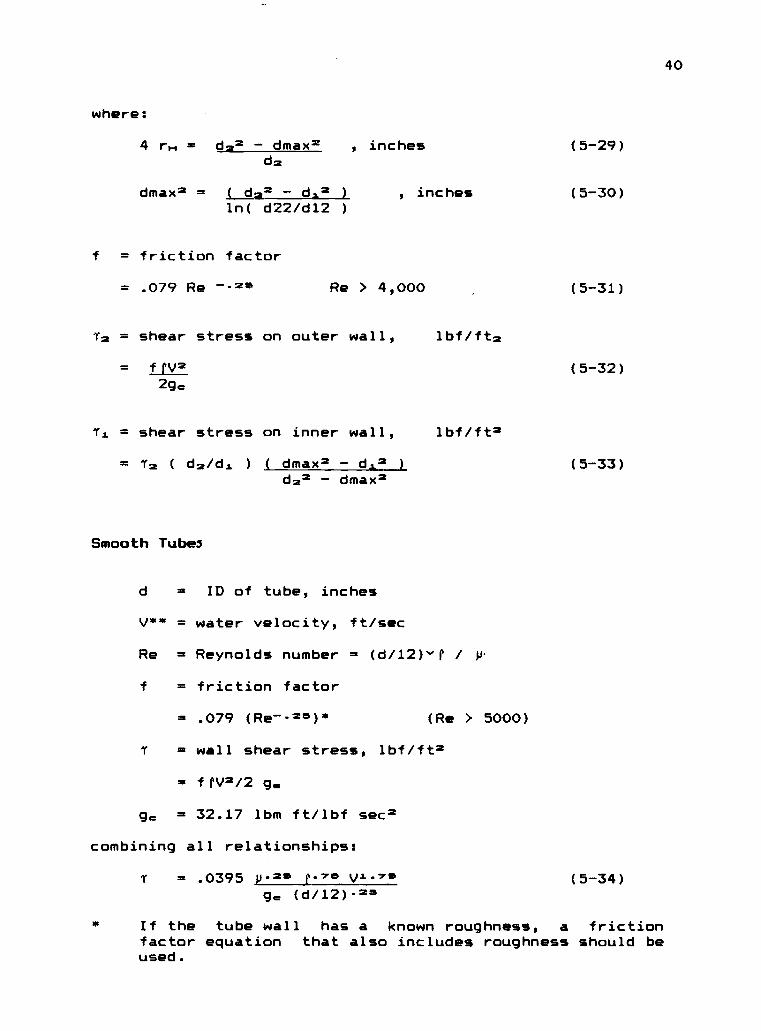
where:
4 rm = dm2 - dmax2 , inchesdm
dmax= = ( d2 -2 d12 1 , inchesln( d22/d12 )
= friction factor
= .079 Re -.25
(5-29)
(5-30)
Re > 4,000 (5-31)
m = shear stress on outer wall, lbf/ftm
= frV22g
ri = shear stress on inner wall, lbf/ft=
(5-32)
= Tm ( dm/di ) ( dmax= d42 ) (5-33)d22 dmax2
Smooth Tubes
d = ID of tube, inches
V** = water velocity, ft/sec
Re = Reynolds number = (d/12)"P /
f = friction factor
= .079 (Re--25)* (Re > 5000)
I = wall shear stress, 1bl/ft=
= frV2/2 g.
g. = 32.17 lbm ft/lbf sect
combining all relationships:
= .0395 p-25 f-7° V"75 (5-34)gm (d/12)-25
If the tube wall has a known roughness, a frictionfactor equation that also includes roughness should beused.
41
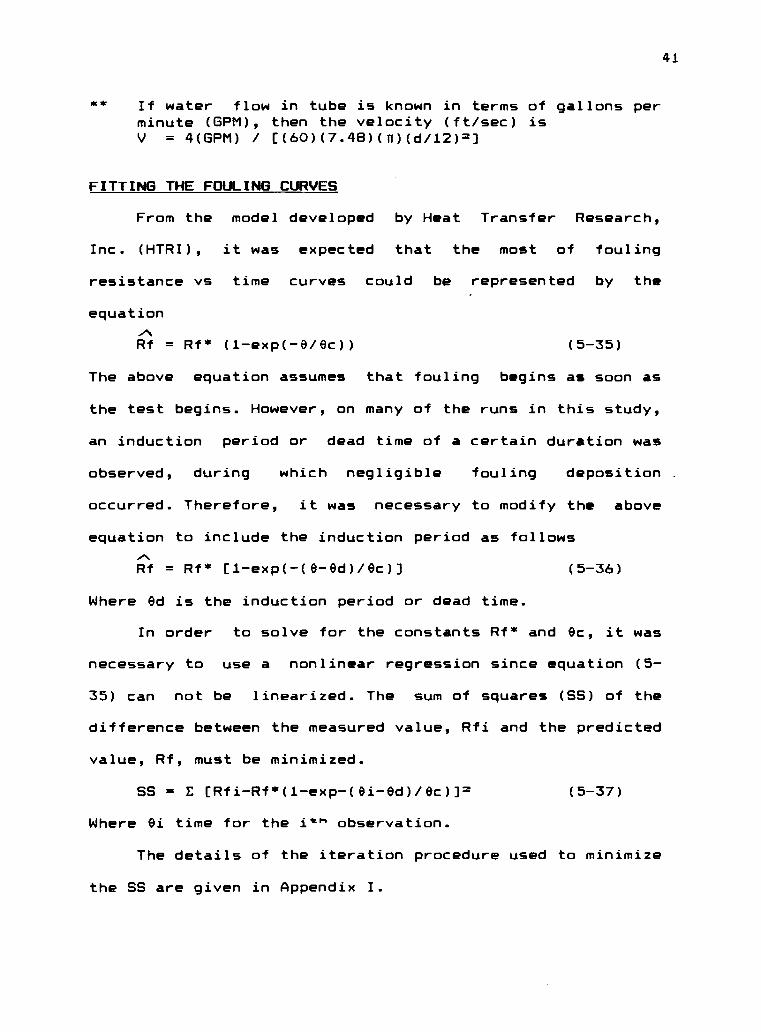
* * If water flow in tube is known in terms of gallons perminute (GPM), then the velocity (ft/sec) isV = 4(GPM) / [(60)(7.48)(11)(d/12)2]
FITTING THE FOULING CURVES
From the model developed by Heat Transfer Research,
Inc. (HTRI), it was expected that the most of fouling
resistance vs time curves could be represented by the
equationARf = Rf* (1-exp(-0/0c)) (5-35)
The above equation assumes that fouling begins as soon as
the test begins. However, on many of the runs in this study,
an induction period or dead time of a certain duration was
observed, during which negligible fouling deposition _
occurred. Therefore, it was necessary to modify the above
equation to include the induction period as follows
Rf = Rf* [1-exp(-(0-0d)/0c)] (5-36)
Where Od is the induction period or dead time.
In order to solve for the constants Rf* and Oc, it was
necessary to use a nonlinear regression since equation (5-
35) can not be linearized. The sum of squares (SS) of the
difference between the measured value, Rfi and the predicted
value, Rf, must be minimized.
SS = E (Rfi-R1*(1-exp-(0i-Od)/Oc))11 (5-37)
Where ei time for the i" observation.
The details of the iteration procedure used to minimize
the SS are given in Appendix I.
42
VI RESULTS AND DISCUSSION
EXPERIMENTAL RESULTS
RUN DATA (RUN 117 THROUGH 301)
The data (both raw and calculated), photographs of
deposit, water analyses are available at Department of
Chemical Engineering, Oregon State University. Average
cooling tower water quality and system flow rates for each
run can are tabulated in appendices J and K, respectively.
The summary of runs containing run number, termination date,
total run time, heater rod number, test section and run
statistics (mean and standard deviation) of bulk, surface
and ambient temperature, heat flux and velocity are listed
in appendix L.
FOULING RESISTANCES
A summary of all runs is shown in table E-1 in Appendix
E. This table indicates the run duration, the run conditions
(velocity, surface temperature, pH), and the additives used.
Appendix F shows plots of the fouling resistance as a
function of run duration, in which beginning with run 173,
adjacent plots of fouling resistance, velocity, surface
temperature and water quality (pH, conductivity,
corrosivity) are shown as a function of run duration. These
plots allow one to determine if variations of any of these
43
parameters during the run has an effect of the fouling
resistance.
The final fouling resistances at run termination are
shown on a series of three dimensional figures, Figs. E-1
through E-18 in appendix E. These are pictorial
representations of all runs grouped according to the cooling
water with the same additives. For a given constant water
quality, the three major parameters of interest are water
velocity in the test section, surface temperature of the
heated section and the pH of the water in the system.
Temperature-velocity matrices are shown at various pH levels
as indicated on the left. Not all of the cells in the
temperature-velocity matrices were investigated. In cell
showing data, the information includes the run number, the
value of the final fouling resistance at the completion of
the test, and the heater rod material. In a cell, there may
be more than one set of data which signifies duplicate or
triplicate runs. The results shown on these figures display
the effect (in a qualitative manner) of velocity, surface
temperature and pH. For a given water quality, it is nearly
always the case that high velocity (8 ft/sec), low surface
temperature (1300F) and low pH (6.0 to 7.0) are conditions
at which virtually no fouling occurred for any of the
additive combinations. The results also show that the final
fouling resistance usually increases with decreasing
velocity, increasing surface temperature, and increasing pH.
44
In the discussion of runs, the reader is also refer to the
plots in appendix F
RUN DESCRIPTIONS
LOW MAGNESIUM TESTS:
1. No additive (Runs 117-118).
The additive free water deposited scale at a pH of
8.6 (run 117), which deposit was removed when the pH
was reduced to 6.8. Run 118 indicates that the water
without inhibitor was in a non scaling condition at a
pH of 6.5.
2. Additive: 20 ppm CrO.,, 4 ppm Zn (runs 119-125)
No significant fouling occurred up to pH of 7.2,
at a velocity 5.5 ft/sec and surface temperature of
1600F (run 122). At pH of 7.8 considerable deposition
occurred with a surface temperature of 1600F,
particularly at a velocity of 3 ft/sec. With this
additive combination, at a pH of no greater than 7.0,
with velocity maintained above 5.5 ft/sec and surface
temperature less than 1600F, fouling was insignificant.
3. Additive: 40 ppm CrO.,, 8ppm Zn (runs 126-133)
At pH of 6.5, no significant fouling was observed
even at a velocity 3 ft/sec and surface temperature
1600F. With this high concentration of inhibitor,
significant deposition occurred at pH 7.0, particularly
at high surface temperature (1600F) and low velocity (3
45
ft/sec). At this pH, a velocity greater than 5.5 ft/sec
and surface temperature below 145°F would be suitable
to minimize fouling.
4. Additive: 20 ppm C,04, 4ppm Zn, 200 ppm SuspendedSolids (run 134-148).
Since equal values of pH were not investigated for
inhibitors with suspended solids and without suspended
solids, direct comparison was not possible. However the
effect of the presence of suspended solids can be
hypothesized by comparing runs at similar pH. At low pH
(6.5-7.0) it appears that higher final value of fouling
resistance are obtained with the presence of suspended
solids. When suspended solids are present, at a pH of
7.0 and surface temperature 1600F, in order to assure
only slight fouling, velocity should be greater than
5.5 ft/sec.
HIGH MAGNESIUM TESTS:
1. Additive: 20 ppm CrOm, 4ppm Zn (runs 149-151,179-187,203-205)
All runs for this additive were at a surface
temperature of 160 0F. The sets of runs 179,180,181,and
203,204,205 at pH 7.5 were duplicates of runs 149, 150
and 151. They do not agree well with runs 149,150 and
151, but agree quite well with each other, except at
velocity of 3 ft/sec. This is because the pH of runs
149,150 and 151 were closer to 8.0 than 7.5. Those runs
were also in better agreement with runs 182-187 which
46
were in the range of pH 8.0. The sets of runs 182, 183
and 184 were performed while the pH changed from 7.7 to
8.2. In runs 149-151, an immersed electrode was used in
the cooling tower sump to determine pH. It was quite
unstable because of the spray from the cooling tower
falling on it.
The significant effect of 'velocity for this
inhibitor combination is shown in Figures (6-1) in
which runs 182,183, and 184 are compared. An increase
of velocity considerably reduces the amount of fouling.
For this inhibitor combination, at pH=7.5, no
fouling would be expected if surface temperature were
maintained below 1600F and velocity above 5.5 ft/sec.
This is in essential agreement with results obtained
with the same additive in the low magnesium water (runs
121 through 125).
2. Additive: 20 ppm Cr04, 4ppm Zn, 3 ppm HEDP, (runs 152-163, 188-199)
All runs were operated at a surface temperature of
1600F. The pH of the series of runs 152-154, 155-157,
158-160, and 161-163 is considered to be in error (low
by about 1 unit). The series of runs 188-190 and 197-
199 were duplicated and they agree quite well except at
velocity 3 ft/sec.
It appears that the presence of HEDP considerably
inhibits fouling. With the addition of HEDP, no
significant fouling appears to occur at pH equal to or

47
less than 8.0, at any surface temperature below 1600F
and any velocity above 5.5 ft/sec. The effect of the
present of HEDP is also shown in fig. 8-2 in which runs
184 (no HEDP) and 196 (with 3ppm HEDP) are compared at
pH 8.0 with all other condition being the same. The
final fouling resistances are .001 and .00017 ft hr
,F /Btu respectively.
3. Additive: 20 ppm CrOA, 4 ppm Zn, 3 ppm PA (runs 167-178).
With this combination of additives, deposition
occurred at pH = 6.5, in which previous combinations of
additives showed virtually no fouling condition even at
pH of 7.5. At pH 6.5, periodic sloughing off the
deposit was experienced for all runs. At this pH,
insignificant fouling only occurred at a velocity of 8
ft/sec and surface temperature of 1300F.
The nature of the deposit at pH 6.5 is such that
as it reached a certain thickness, the shear stress at
the solid liquid interface removed the deposit. As
shown in the fouling resistance time curve in appendix
F, the curves for runs 167, 168 and 169 have nearly the
same sawtooth pattern, indicating periodic removal of
the deposit after a build-up of fouling resistance to
.0002 .0003 ft hr oF/Htu. No effect of velocity is
apparent.
48
The effect of lower surface temperature is evident
in figure E-7. At 1300F and all velocities minimum
deposition occurs. At 1450F, it is expected little
deposition would occur at velocities above 5.5 ft/sec.
Figure G-3 shows the effect of surface temperature in
which runs 167 (1600F) and 170 (1300F) are compared. At
1300F, virtually no fouling occurred, but at 1600F, the
fouling resistance reached values to about .0004 ft2 hr
0F/Btu before the deposit sloughed off, and the fouling
resistance approaches essentially zero before another
periodic build up of the deposit.
The effect of pH is shown in Figures G-4 and 8-5
for runs 171, 174, 177 (1450F, 5.5 ft/sec) and 172,
175, 178 (130°F, 3ft/sec). It appears that in both
plots the results for pH 6.5 and 7.0 were similar, but
much higher fouling resistance were obtained at pH=7.5.
With this additive combination it appears that at
pH=6.5 and surface temperature of 1450F, velocity
higher than 8 ft/sec would be suitable conditions to
minimize fouling. At higher pH values (7.0 and 7.5),
insignificant fouling could be expected at a velocity
of 8 ft/sec and a surface temperature of 1300F.
Comparing the series of runs 179-181 (without
polyacrylate) and series of runs 176-178 (with
polyacrylate), it appears that at pH of 7.5 the
presence of polyacrylate has insignificant influence on
49
the fouling characteristics in the presence of zinc
chromate inhibitor.
4. Additive: 20 ppm CrOA, 4 ppm Zn, 3 ppm HEDP, 3 ppmpolyacrylate (PA), (runs 164-166, 200-202).
All runs with this additive exhibited spontaneous
sloughing of the deposit. Runs 200, 201 and 202 were
duplicate sets of runs 164, 165 and 166. They agree
quite well with each other. Figure G-6 shows the effect
of velocity for runs 200, 201 and 202. Spontaneous
removal of the deposit occurs at about the same value
among these three runs (.001 to .0014 ft2 hr °F /Btu),
indicating that the effect of velocity is
insignificant. Also the fouling resistance time curves
in appendix F for runs 164, 165, 166 indicate the same
behavior. It was apparent that this combination of
additives appeared to produce a deposit which was
easily removed even at low velocity. Here, again with
this combination of additives, significant fouling
occurred at a pH of 6.5.
5. Additive: 20 ppm Cr04, 4 ppm Zn, 3 ppm PP (runs 206-214).
With this additive, the water contained 5-6 ppm
orthophosphate. Significant fouling occurred for all
runs (at pH=6.0 and 6.5), except at a surface
temperature of 1300F and velocity of 8 ft/sec. The
effect of surface temperature is shown in fig. G-7 for
50
runs 206 and 209. As expected, the fouling increased as
surface temperature increased.
The effect of velocity is shown in fig. G-8 for
runs 206, 207 and 208. The velocity has a significant
effect on the fouling.
6. Additive: 20 ppm CrOA, 4ppm In, 2.5 ppm PA, 2.5 ppmAMP, 2.5 ppm PP, 5.5 ppm OP (runs 215 -235).
With this additive, triplicate runs were made at
pH=6.0, surface temperature of 1450F and at three
different velocities. They agree quite well with each
other. Duplicate runs were also made at pH of 6.5,
surface temperature 1450F and velocity 3 ft/sec. They
also agree each other well. At pH=7.0, insignificant
fouling occurred at a velocity of 8 ft/sec and a
surface temperature of 1300F.
The effect of pH is shown in Figures. G-9 through
G-12. Figures 9, 10 and 11 comparing runs 221 and 227;
runs 222 and 228, and runs 223 and 229 respectively.
These figures indicate little effect on fouling until
the pH reached 6.5. Results for pH = 6.0 and pH = 6.5
are nearly identical. However, as shown in fig. G-12
comparing run 230 (pH=6.5) and run 235 (pH=7.0),
considerably increase in fouling occurred as the pH
increase from 6.5 to 7.0. Figs. G-13 through G-16 and
G-17 through G-20 indicate the significant effect of
the velocity and the surface temperature respectively.
51
Comparing the tests with this additive and those
without polyacrylate and AMP, it appears that at
surface temperature of 1600F, no significant difference
is observed, but at 1450F, the presence of polyacrylate
and AMP will cause some reduction in the amount of
deposit.
7. Additive: 2.5 ppm PA, 2.5 ppm AMP, 2.5 ppm PP, and 5.5ppm OP (runs 236-247a).
With this additives, at pH 7.0, velocity of 5.3
ft/sec and surface temperature of 1450F, insignificant
fouling was observed. The effect of the presence of
zinc chromate is shown in fig. G-21 in which runs 235
and 239 are compared at pH of 7.0, velocity 3 ft/sec
and surface temperature of 1300F. Run 239 indicates
very little deposition when the zinc chromate was
absent. Higher fouling resistance was obtained when
zinc chromate was present as shown in run 235. Also
when the fouling resistance vs time curves in Appendix
F, runs 236, 237, 238 at pH=7.0 are compared with runs
215, 216, 217 at pH=6.0, and when runs 240, 241 at
pH=7.0 are compared with run 219/222, 220/223 at pH of
6.0, it is apparent that less fouling would be expected
in the absence of zinc chromate. As indicated in fig.G-
22 through G-24 where runs 238, 239, 241, and 242, 244
247a and 243, 246a respectively are compared, surface
temperature has only a slight effect on the fouling up
to about 1450F. The effect of pH is shown in fig.G-25
52
through G-30 where runs of pH 7.0 are compared with
runs of pH 7.5 for the same surface temperature and
velocity.At surface temperature of 1300F, the curves
are nearly identical but at higher surface temperature
(1450F and 1600F), increasing pH will have the effect
of increasing fouling significantly especially at a
surface temperature of 1600F
The effect of velocity is shown in figs. G-31
through G-34.
B. Additive: 2.5 ppm PP, 5.5 ppm OP (runs 245b 247c).
The series of runs 245b, 246b and 247b resulted
from discontinuing the addition of polyacrylate and AMP
to runs 245a, 246a and 247a after these runs reached
285 hours duration. The effect of the discontinuation
of these additive was negligible since the fouling
resistance continued to increase in the same fashion.
In the case of run 247, some sloughing off the deposit
occurred, but following this occurrence, deposition was
quite rapid and comparable to that prior the removal of
the deposit. The series of runs 245c, 246c and 247c
resulted from reducing the pH from 7.5 used in runs
245b, 246b and 247b to 6.5 after about 100 hours
duration. When the conditions were changed, the
equipment operated continuously and the test sections
were not removed. Reducing the pH resulted in a
significant reduction in the fouling resistance but not
to the value of zero or near zero. This indicated that
53
this pH reduction caused the removal of some
constituents of the deposit.
9. Additive: 2.5 ppm PP, 2.5 ppm OP (runs 248 through253).
Since wall thermocouples were broken in runs 249
and 250, the fouling resistance for those runs (249a-b
and 250a-b) were observed visually. At 1600F, very
little deposition was observed up to pH of 7.5. During
runs 248, 249, and 250, the increase of pH from 6.5 to
7.5 caused only a slight increase in fouling, however
at pH of 7.8, significant fouling occurred at all
conditions observed, (runs 251,252 and 253), and at
this high pH, the deposit was removed periodically.
Figure G-35 is a plot comparing runs 251 (SS) and
252 (Ad) with all other conditions, except heater
material, identical. The fouling rates are about the
same for both runs, but it appears that the deposit is
more adherent to the stainless steel than to the
admiralty, since the fouling resistance is higher for
the stainless steel before the deposit sloughed off.
Figure G-36 is a plot comparing run 252 (Ad) and 253
(C-N). While both runs employed different heater
materials, the major difference between these two runs
is considered to be due to the velocity difference (5.5
and 3.0 ft/sec, respectively).
54
10. Additive: 4.5 ppm PP, 5.5 ppm OP (runs 254-277).
In the range of pH investigated (6.5 to 7.0)
significant fouling occurred at all runs except for run
258 (pH 6.5, velocity of 5.5 ft/sec and surface
temperature of 1600F). At pH = 7.0, periodic removal of
deposit was observed at surface temperature of 160°F.
Using this additive, investigation of different heater
materials was undertaken. Runs 256(SS), 275(99),
276(Ad) and 277(Cu-Ni) are at identical conditions
except for heater material. Runs 256 and 275, which are
exact duplicates, compare with each other quite well.
The composite plots comparing runs 275, 276 and 277 are
shown in fig.G-37, the curves are nearly the same. The
curves for runs 275(SS) and 277(Cu-Ni) are almost
coincident, while that for run 276(Ad) is slightly
higher but not considered significantly different from
the other two.
Fig.G-38 compares runs 254 and 269, which are also
exact duplicate with the same heater rodmaterial (SS).
During runs 272, 273 and 274, at about 33 hours
duration, the solenoid valve controlling sulfuric acid
flow malfunctioned and the pH dropped to about 3. The
pH of 6.5 was reached at 70 hours. During the period of
this very low pH, deposition was ver rapid for all
runs, particularly at low velocity (run 274, 3 ft/sec)
and reached a maximum value of fouling resistance of
about 5x10* for run 272(SS); 7.0x10⁻⁴ for run 273(Ad),

55
and 12x10-4 hr ft2 °F /Btu for run 274(C-Ni). Only in
the case of the high velocity, run 272, 8 ft/sec, and
run 273, 5.5 ft/sec, partial removal of the deposit
occurred after the pH had reached its control value.
These results indicate that even at very low pH,
phosphate inhibitors will deposit under the conditions
of these runs.
As expected, higher fouling resistance was
observed as velocities decreased. High velocity (8
ft/sec) and low surface temperature (1300F) produced
lowest fouling rate. The effect of surface temperature
is shown in fig.G-39 and fig.G-40 comparing runs 255
and 258, and runs 260 and 263 respectively. The effect
of velocity is shown in fig.G-41 and G-42 comparing
runs 254, 255 and 256 and runs 263, 264 and 265
respectively. The effect of pH is shown in fig.G-43 and
G-44 comparing runs 254 and 260, and runs 256 and 262
respectively. At the higher pH of 7.0, a significantly
greater deposition rate is observed and at this pH,
periodic removal of the deposit is also observed.
The combined effect of velocity and surface
temperature on initial deposition rate is shown in
fig.G-45, in which run 257 (8 ft/sec, 1450F) is
compared with run 258 (5.5 ft/sec, 1300F) with all
other conditions being constant. The deposition rates
for both runs were almost the same with very little
fouling taking place. It appeared that the decrease in
56
surface temperature from 1450F to 1300F which would
decrease the tendency for deposition, is equally
compensated by the decrease in velocity from 8 ft/sec
to 5.5 ft/sec which would increase the tendency for
deposition.
11. Additive: 4.5 ppm PP, 5.5 ppm OP, 2.5 ppm HEDP (runs278-301).
With this additive, a number of different heater
materials were investigated extensively. The effect of
material on the heater surface is shown in fig.G-46
through G-52. In figure G-46, the curves for runs
278(SS), 279(Ad) and 280(Cu-Ni) are virtually
identical. In fig.G-47 the curves for run 283(Cu-Ni) is
above that for run 281(SS). But the difference is
considered to be insignificant, since in both cases
fouling is very small. In fig.G-48, run 284(SS) and
286(Cu-Ni) agree well each other. In fig.G-49, the
curves for runs 287(SS) and 289(Cu-Ni) both indicate
periodic removal of the deposit during runs. In each
run, the removal occurs at about the same level of
fouling resistance. On the stainless steel, the rate of
fouling appears to be slightly greater. In Fig.G-50,
the curves for runs 293(SS) and 294(CS) indicate
virtually identical fouling rates for both cases.
However, the initial deposition rate on the carbon
steel is greater, resulting in a slightly greater
absolute value of fouling resistance on the carbon
57
steel compared to that on stainless steel. In fig.G-51,
the curves for runs 296(SS) and 297(CS) are compared at
conditions at which fouling is very low, and again as
shown in fig.G-50 the absolute value of fouling
resistance on the stainless steel was slightly than
that for carbon steel. Fig.G-52 compares run 299(SS) ,
300(CS) and 301(Ad). As observed previously in fig.G-50
and G-51, the curves for CS and SS were nearly the same
with SS showing a slightly lower absolute fouling
resistance. Run 301 (admiralty) shows significantly
higher deposition rate, and the reason is unknown,
since previous runs indicated that admiralty behaved
similarly to the stainless steel and copper-nickel
surfaces.
The effect of surface temperature is shown in
fig.G-53 comparing runs 284 and 287, and in fig.G-54
comparing runs 286 and 289. At the high surface
temperature (1600F), periodic removal of deposit is
observed and the fouling rate is much higher than at
130 OF.
The effect of pH is shown in fig.G-55 comparing
runs 295(pH=7.0) and 298(pH=6.5) and in fig.G-56
comparing runs 281(pH=6.5) and 284(pH=7.0). It appears
that in the range of pH 6.5 to 7.0 the effect of pH is
not significant at conditions of low surface
temperature (1300F), however at a surface temperature
of 1450F, the initial deposition rate appears to be
58
unaffected by pH, but ultimately the fouling resistance
was much greater at the higher pH of 7.0. This is
believed due to a difference in the strength of deposit
produced at different pH values.
Comparing the runs with HEDP and the runs without
HEDP, the effect of the presence of HEDP is shown in
fig.G-57 comparing runs 265 (withdut HEDP) and run 284
(with HEDP) at pH of 7.0, surface temperature of 130°F
and velocity 3ft/sec; and fig.G-58 comparing runs 275
(without HEDP) and 278(with HEDP) pH of 6.5, surface
temperature 1600F and velocity 3 ft/sec. At pH of 7.0
and low surface temperature (1300F), the fouling rate
is significantly less when HEDP was present. At pH of
6.5 and high surface temperature 1600F, HEDP appeared
to have only little significant effect on the fouling
rate, which was slightly less when HEDP is present, but
at these conditions the fouling is unacceptable in
either case, with of without HEDP. Figure G-59 shows
the combined effect of velocity and pH. Comparing runs
283 (CuNi, 3.0 ft/sec, 6.5 pH) and 285 (Ad, 55 ft/sec,
7.0 pH) with other conditions being the same, assuming
that no difference are caused by heater surface
material, (since deposition rate for run 283 is greater
than that of run 285), It appears that increasing
velocity from 3.0 to 5.5 ft/sec, which decreases
deposition tendency, more than compensates for
59
increasing pH from 6.5 to 7.0, which increases
deposition tendency. It appears that both curves may
reach nearly the same asymptotic ouling resistance,
which in either case would be a fairly low asymptotic
fouling resistance.
DEPOSIT ANALYSIS
In most cases, the deposits contained a major
constituent along with a number of minor constituents.
The major constituents of the deposits obtained in
several runs shown in appendix H.
For the runs in which the additive was just zinc
chromate, the major component of the deposits was zinc
silicate with minor amounts of calcium and magnesium
silicate. X-ray diffraction for run 124 indicated that
the major compound of deposit was zinc pyrosilicate
(Zn4(OH)=Si7.H=0). This deposition of zinc silicate
occurs with the silica content in the range of 40 to 55
ppm Si02 and with the zinc concentrations as indicated
in the tests.
For the runs in which suspended solids were added
to the system, there was no evidence of these solids
appearing in the deposit which occurred during these
runs. In addition , water samples were filtered and the
filtered precipitate showed no effidence of zinc
silicate. There appears to have been little or no
60
interaction between the zinc silicate deposit and the
aluminium silicate suspended solids.
When HEDP was present along with zinc chromate,
deposit analysis indicate that the major components of
deposits are zinc and calcium phosphates with a minimum
amount of silica present. This differs from results
when HEDP was absent in which the deposit was mainly
zinc silicate. Thus the presence of HEDP favors the
deposition of phosphates rather than silicates.
When polyacrylate is added along with zinc
chromate, the major constituents of deposit are zinc
silicate and calcium silicate. Thus the presence of the
polyacrylate appears to increase the amount of calcium
in the deposit relative to zinc.
For water containing the phosphate inhibitors, the
major constituent is calcium phosphate.
REGRESSION ANALYSIS OF DATA
A nonlinear regression, employing a fixed value for ed
and giving the least squares values for 8c and Rf* was used
employing equation 5-11.
Some of the runs had a few points at the beginning of
the test when the increase in fouling was sluggish or when
the fouling was low. In this case regression was done using
various values of the dead time (8d) for each run. A value
of dead time was chosen which would give the best least
squares fit.
61
For the runs that had a positive value of fouling
resistance at the beginning of the run, the abscissa was
shifted before performing the regression analysis, these are
indicated in Table VI-1 (see footnotes).
In some cases, the deposit sloughed off during the run,
these are indicated in Table VI-1 (see footnotes), and for
these runs usually a portion of the curve could be fitted to
eq.5-11 ,in which analysis was made using data before a
large decrease of fouling occurred. In some of these runs,
the fouling resistance reached nearly the same value before
each time sloughing occurred. In this case, values of Rf*
obtained from regression equation would be nearly the same
as the value of fouling resistance when sloughing occurred.
Some of the runs were terminated prematurely, because
of power failure, broken wall thermocouple, or other
problems occurred during runs. For these runs, the slope of
the first few points of data was analyzed to determine the
initial deposition rate, Od.
The plots of the fouling vs time curves for some runs
have an increasing deposition rate (concave upward). These
are also indicated in Table VI-1 (see footnotes). Thus a
constant deposition rate model in equation (2-8) does not
fit to these runs. No regression analysis was made for these
runs.
Sometimes the fouling resistance for a run is so low
that the curve fitting procedure was unreliable. Thus the
final value of fouling resistance was used as the asymptotic
62
value, usually between 0 to .0001 ft2 hr 0F/Eltu. However the
data for a few runs with values of Rf* in this range could
be fitted to eq.5-11 and for these runs, values of Ad, Sc,
Rf*, Od and r2 are reported. It is observed that when the
fouling resistance is insignificant ( the value of Rf* is
low),r2 is also low.
For some of the runs, the fouling resistance-time
curves are close to a straight line. These runs were
analyzed according to the linear equation
Rf = Od (e-Ad )
In this case the quantities of Rf* and Ac are meaningless
The results of the regression analysis are given in
table VI-1 in which Ad, Sc, Rf*, Od (= Rf*/0c) and r2 (the
correlation coefficient) are tabulated. In most cases the
model fitted the data quite well. For the remainder of the
data analysis, the resulting values for Ac and Rf* from the
regression analysis were used in the HTRI fouling model. The
data points and the regression curves are plotted in
appendix I.
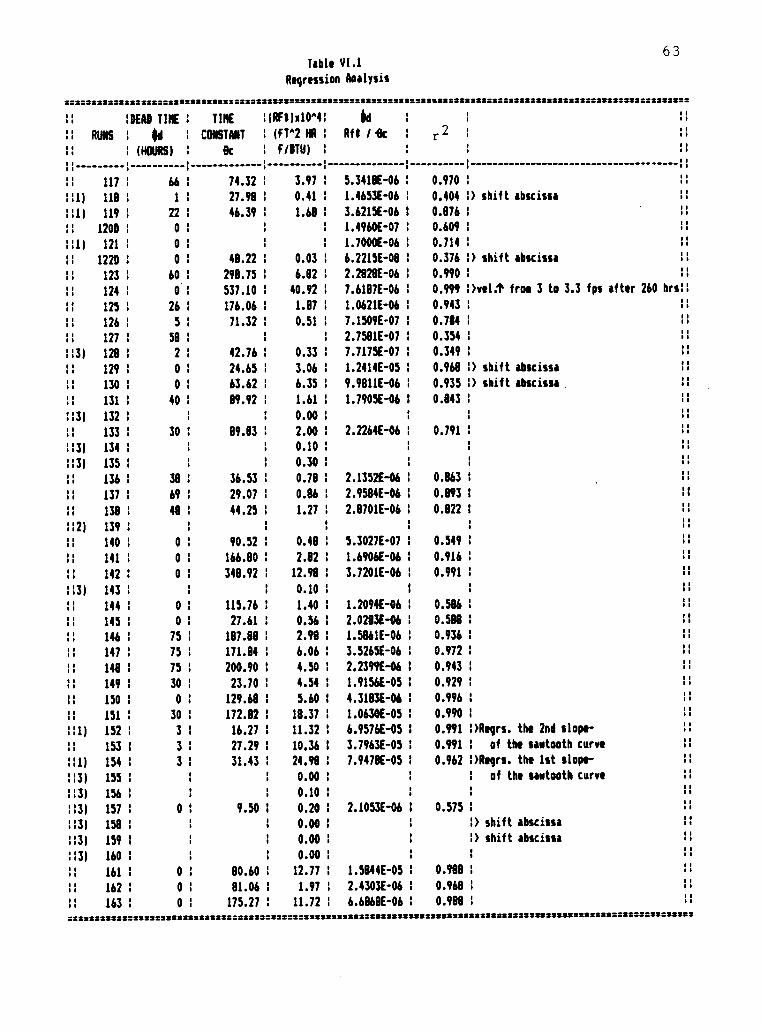
63Table
Regression Analysis
==============222=12:22 1.22221=====22222=22:2222.7222 :2222=222 22222 2222=22iii=2222= ==
I ...
....
, III:1
OfII
I:1)
111)
:I
111)
II
ItI I
I II1....
I I11
I I..
:13)
II
"
:13)
II113)
:13)
II51
III II III
:12)
II
1:
. 5
..
113)
I:
".ItII.I II .
II
1:1)
I II I
1:1)
:13)
113)
:13)
113)
:13)
113)
II
:DEAD TIME 1
RUNS 1 id 1
1 (HOURS) :
: 1
117 I 66 I
118 1 1 1
119 I 22 I
1208 : 0 I
121 I 0 I
122D I 0 1
123 I 60 I
124 : 0 1
125 : 26 1
126 : 5 :
127 1 58 1
128 : 2 1
129 I 0 :
130 I 0 I
131 : 40 I
132 : I
133 1 30 1
134 I 1
.135 :
.
136 : 38 1
137 1 69 1
131 1 48 1
.139 :
.
140 : 0 :
141 1 0 :
142 : 0 I
.143 : '
144 1 0 1
145 : 0 :
146 I 75 I
147 1 75 I
148 1 75 :
149 I 30 :
150 I 0 :
151 : 30 :
152 I 3 I
153 I 3 :
154 1 3 I
.155 :
.
156 I
157 : 0 :
.158 : '
.159 1
.
.160 1 '
161 I 0 1
162 : 0 I
163 : 0 I
TIME l(RFI)1110"41
CONSTANT 1 (FTA2 HR 1
8 c I F/IITU) 1
1 1
74.32 : 3.97 :
27.98 1 0.41 1
46.39 I 1.68 I
. I'
. :'
48.22 I 0.03 I
298.75 I 6.82 1
537.10 I 40.92 1
176.06 1 1.87 1
71.32 I 0.51 1
I:,
42.76 : 0.33 1
24.65 I 3.06 1
63.62 1 6.35 1
89.92 : 1.61 1
0.00 :
89.83 1 2.00 I
. 0.10 :'
,
. 0.30 :
36.53 I 0.78 :
29.07 1 0.86 1
44.25 : 1.27 :
.I
.
90.52 I 0.48 1
166.80 1 2.82 1
348.92 I 12.98 1
,
. 0.10 :
115.76 I 1.40 :
27.61 1 0.56 1
187.88 I 2.98 1
171.84 I 6.06 I
200.90 I 4.50 :
23.70 1 4.54 1
129.68 1 5.60 I
172.82 1 18.37 I
16.27 1 11.32 1
27.29 I 10.36 1
31.43 I 24.98 :
,
. 0.00 :
.
I 0.10 1
9.50 I 0.20 1
0.00 :
0.00 :
. 0.00 :'
80.60 : 12.77 1
81.06 : 1.97 1
175.27 I 11.72 :
id :
MI / ic :
1
5.3418E-06 :
1.4653E-06 1
3.6215E-06 1
1.4960E-07 I
1.7000E-06 :
6.2215E-08 I
2.2821E-06 I
7.6187E-06 I
1.0621E-06 :
7.1509E-07 I
2.7581E-07 I
7.7175E-07 I
1.2414E-05 1
9.9811E-06 1
1.7905E-04 1
2.2264E-06 I
I .
2.1352E-06 1
2.9514E-06 I
2.8701E-06 1
5.3027E-07 I
1.6906E-06 1
3.7201E-06 :
1
1.2094E-06 1
2.0283E-06 I
1.5141E-06 :
3.5265E-06 1
2.2399E-06 :
1.9156E-05 :
4.3183E-06 1
1.0630E-05 :
6.9576E-05 1
3.7963E-05 I
7.9478E-05 I
I
I
2.1053E-06 I
I
,
.
1.5844E-05 I
2.4303E-06 I
6.6868E-06 :
.
.
. ..
r2
. ..
I0 11
1 11
0.970 : ..
0.404 D shift abscissa
0.876 I
0.609 :
0.714 :
0.376 I) shift abscissa
0.990 I 11
0.999 Dvel.t from 3 to 3.3 fps after 260 hrsl:
0.943 I 1:
I I0.784 I I I
0.354 I
I II.
0.349 :..I I
0.968 I) shift abscissaII5 I
0.935 I) shift abscissa
0.843 1i.5 5
.
I
It15
0.791 :
I II I
..
..
0.863 I I I I
0.893 1 1:
0.822 1 11
I..I
0.549 :, .I I
0.916 1 IS
I I0.991 : ..
I I:
0.586 I 1 1
0.588 I
..II
0.936 : . I..
0.972 1..51
I I0.943 : I I
II0.929 1 5 I
If0.996 I ..
..0.990 I ..
0.991 !Mgrs. the 2nd slope-,s"
0.991 : of the saletooth curveI I
0.962 :Amy'. the 1st slope- ISI I
I of the sastooth curve....
..5 I
0.575 1I III
D shift abscissa..It
I> shift abscissaI III
I
II0.988 I i.
0.968 :I IOf
0.918 IIS
SZZZ2ZZUZZ=2111222ZZUZZSZLIZZ2S2SZSZSIZZ=22.1111ISZ2221112 .12X2122 222222 SS= VVZSZVZSIIIZZlinS
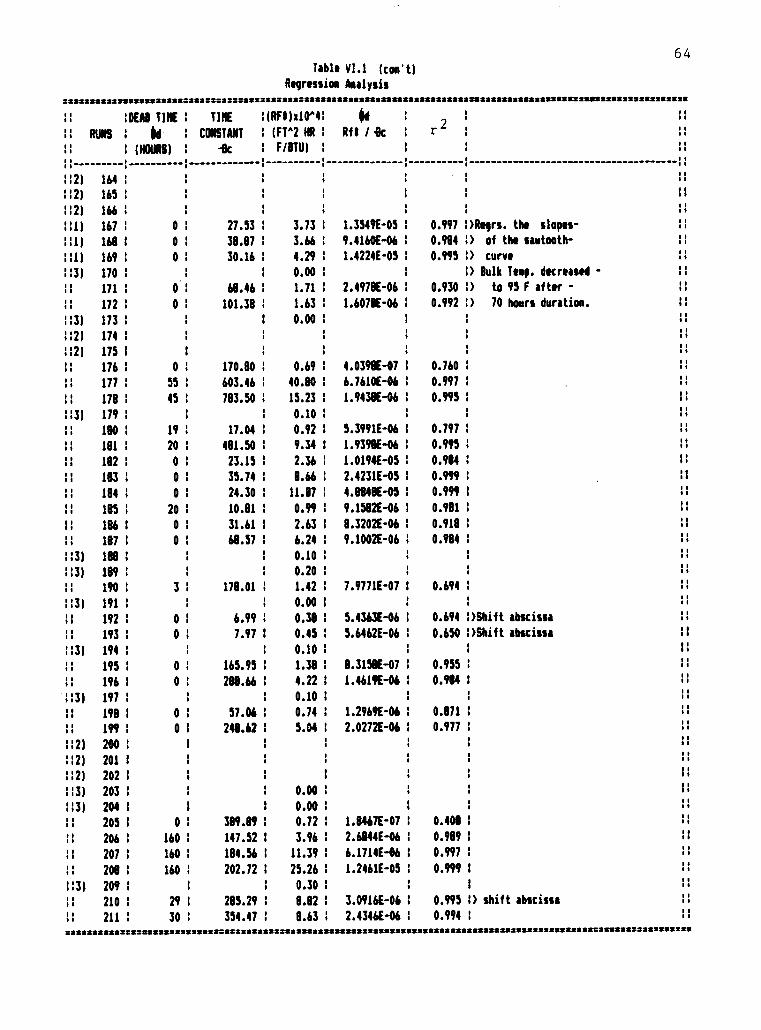
ZZZZZ =i1182232222=22=222=2
64Table VIA (can't)
Regressioe Analysis
11 I IIII :DEAD TIME : TIME 1(1F1)i10441 $d II
Il RUNS I lie I CONSTANT 1 (FYI HR 1 Rft / ic I.
r2
11II
II IIII 1 (HOURS) 1 -11c 1 F/lITU) I 1 II
II : 1 1 1 1
,
--11
:12) 164 1 '.
.
. I
1111
:12) 165 : I
.
. '. 11
112) 166 1
.
.
.
. I . :
, .,1
HI) 167 1 0 1 27.53 : 3.73 1 1.3549E-05 1 0.997 Mays. the slopes- 4111
I:1) 168 1 0 1 38.87 : 3.66 : 9.4160E-06 1 0.984 1) of the santooth-....
:11) 169 : 0 I 30.16 : 4.29 1 1.4224E-05 I 0.995 I) curve.,..
113) 170 1.
. 0.00 1 1 1) Bulk Teep. decreased ....
11 171 1 0 1 68.46 : 1.71 1 2.4978E-06 1 0.930 1) to 95 F after -,III
0101 172 1 0 1 101.38 : 1.63 1 1.6070E-06 : 0.992 1) 70 hours duration. 1:
:13) 173 1
,
. 1 0.00 : 1
.
,
112) 174 1 : 1 S . '.
1:2) 175 1 1 ., .... ,,
II II
II 176 : 0 1 170.80 : 0.69 I 4.0398E-07 1 0.760 1 II
11 II.. 177 : 5S 1 603.46 : 40.80 1 6.7610E-06 1 0.997 1 11
1111 178 1 45 1 783.50 : 15.23 : 1.9438E-06 : 0.995 1
. . 1.1.
113) 179 : . I 0.10 : I .
".. 180 1 19 1 17.04 1 0.92 i 5.3991E-06 1 0.797 1
II 181 : 20 : 481.50 1 9.34 1 1.9390E-06 1 0.995 1
..II 182 : 0 I 23.15 : 2.36 : 1.0194E-05 : 0.984 : 11
:1 183 : 0 1 35.74 , 8.66 1 2.4231E-05 1 0.999 1 11
1111 184 1 0 1 24.30 1 11.87 : 4.8848E-05 : 0.999 1 SS
11 II
I. 185 1 20 1 10.81 1 0.99 : 9.1582E-06 1 0.981 : 11
II186 1 0 1 31.61 1 2.63 1 8.3202E-06 1 0.918 : 1111
11II 187 1 0 1 68.57 1 6.24 1 9.1002E-06 1 0.984 1
1:3) 188 I '. 0.10 S 1 1
1111
113) 189 1 '. 0.20 1 S .
,111
11II
190 I 3 1 178.01 I 1.42 1 7.9771E-07 1 0.694 I IS
:13) 191 1 '. . 0.00 1 '. ..
11 192 1 0 : 6.99 : 0.38 1 5.4363E-06 : 0.694 1)Shift abscissa..11
IIII 193 1 0 1 7.97 1 0.45 1 5.6462E-06 : 0.650 1)Shift abscissa 11
:13) 194 : '. 0.10 1,
. '. 1:
..11 195 1 0 1 165.95 1 1.38 1 8.3158E-07 1 0.955 1 1:
. ,11
11 196 1 0 1 288.66 : 4.22 1 1.4619E-06 1 0.984 1 01
1:3) 197 1 '.
,
. 0.10 :..II
11II
11 198 1 0 1 57.06 1 0.74 1 1.2969E-06 1 0.871 : II
I
11I.
199 : 0 1 241.62 1 5.04 1 2.0272E-06 1 0.977 1
I
1
:12) 200 : 1
1. . . 11
:12) 201 1 1 S.
.
,
.
,
. 11
112) 202 1 1 1 1 '. I 1:
:13) 203 1 1 1 0.00 :.
. 1 II
113) 204 1 1 1 0.00 1 1
,
I IS
1111
11 205 1 0 1 389.89 1 0.72 1 1.8467E-07 1 0.401 1 11
11 II
11 206 : 160 1 147.52 1 3.96 1 2.6844E-06 1 0.989 1 11
'1 207 : 160 : 184.56 1 11.39 1 6.1714E-06 I 0.997 1
IIIt
:I208 1 160 : 202.72 : 25.26 1 1.2461E-05 1 0.999 1
,111
113) 209 1 S .
,
. 0.30 1 S 1 11,,
11 210 1 29 1 285.29 : 8.82 1 3.0916E-06 1 0.995 1) shift abscissa 11
.111
11 211 : 30 1 354.47 1 8.63 1 2.4346E-06 : 0.994 : 11
Z ======
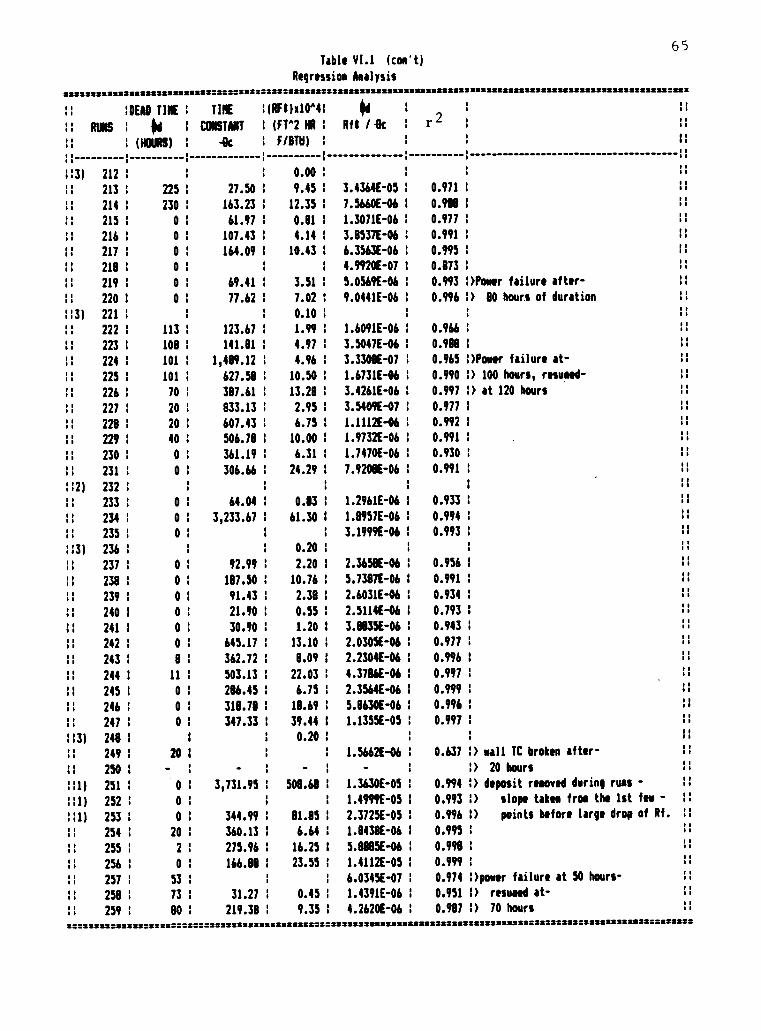
2.2 22 ''222
Table YI.1 (can't)
Regression Analysis
111
11 :DEAD TINE : TINE l(RF1)110441 $1 : .
..11 RUNS : Od 1 CONSTANT 1 (F142 HR I Rik / -0c : r 2 :
11II : (HOURS) : 41c I F/8111) :
:
II: 1 : : 1
65
.222
11
11
::3) 212 1 1 .0.00 1
,
i
i
.
11II 213 1 225 : 27.50 1 9.45 : 3.4364E-05 : 0.971 : :I
,,11 214 1 230 1 163.23 : 12.35: 7.5660E-06 1 0.988 : II
:1 .. 215 1 0 : 61.97 1 0.81 I 1.3071E-06 1 0.977 1
,,..
11 216 1 0 1 107.43 1 4.14: 3.8537E-06 1 0.991 1 IIII
si 217 1 0 1 164.09 1 10.43: 6.3563E-06 1 0.995 I I:11
11 218 : 0 : : , ', 4.9920E-07 1 0.873 :
:1 219 1 0 : 69.41 : 3.51 I 5.0569E-06 : 0.993 :)Power failure after-',
., 220 1 0 1 77.62 I 7.02 1 9.0441E-06 1 0.996 1) 80 hours of duration,,
:13) 221 I '. .' 0.10 1
11 222 : 113 1 123.67 1 1.99: 1.6091E-06 1 0.966 :11
II 223 : 108 I 141.81 1 4.97 I 3.5047E-06 : 0.988 I.,
..
.. 224 :
11II 225 1
..
..226 1
.. 227 :
,,
.. 228 :,.
:1 II 229 :,,.. 230 1
1111 231 :
:12) 232 1
11 11 233 1..11 234 :
:: 235 1
113) 236 :is.. 237 1
238 1
:1 239 1"11 240 I"11 241 1"
242 1,,
1: 243 :"244 1
245 1
246 1
is 247 1.,
113) 248 1
:: 249 I
250 :
::11 251 :
:11) 252 :
:11) 253 1
:1 254 1..
., 255 :
.,
256 :
257 1
258 1
259 1
101 1 1,489.12 I 4.96 : 3.3301E-07 I
101 1 627.58 I 10.50 1 1.6731E-06 1
70 : 387.61 I 13.28 1 3.4261E-06 1
20 : 833.13 1 2.95 I 3.5409E-07 1
20 1 607.43 : 6.75 1 1.1112E-06 I
40 1 506.78 I 10.00 1 1.9732E-06 1
0 1 361.19 1 6.31 1 1.7470E-06 1
0 1 306.66 1 24.29 1 7.9201E-06 1
.
.
.
.
.
.
0 1 64.04 1 0.83 1 1.2961E-06 1
0 1 3,233.67 1 61.30 1 1.1957E-06 1
0 1 I 3.19991-041 1
.
. 0.20 :.
.
0: 92.99 1 2.20 1 2.3658E-06 1
0: 187.50 1 10.76 1 5.7317E-06 1
0 1 91.43 1 2.38 1 2.6031E-06 1
0 1 21.90 1 0.55 1 2.5114E-06 1
0 : 30.90 1 1.20: 3.1135E-06 1
0 I 645.17 : 13.10 : 2.0305E-06 :
8 1 362.72 1 8.09 1 2.2304E-06 :
11 1 503.13 1 22.03 1 4.3786E-06 1
0 1 286.45 : 6.75 1 2.3564E-06 1
0 1 318.78 1 18.69 1 5.8630E-06 :
0 1 347.33 1 39.44 1 1.1355E-05 1
1 I 0.20 1i
.
20 1 1 . 1 1.5662E-06 1
- I .' :
0 : 3,731.95 : 508.68: 1.3630E-05 :
0 1 1 1 1.4999E-05 1
0 1 344.99 1 81.85 : 2.3725E-05 1
20 1 360.13 1 6.64 1 1.8438E-06 1
2 1 275.96 1 16.25 1 5.8815E-06 1
0 : 166.88 1 23.55 1 1.4112E-05 1
53 : 1 . .' 6.0345E-07 :
73 1 31.27 : 0.45 1 1.4391E-06 1
80 I 219.38 1 9.35 : 4.2620E-06 1
0.965 :Amor failure at-
0.990 1) 100 hours, resumed-
0.997 I) at 120 hours
0.977 1
0.992 1
0.991 1
..
..
0.930 Is.11
110.991 1 11
1
II.,
0.933 1 ::
0.994 1
0.993 1 11
0.956 1
0.991 1 :I
0.934 1
0.793 :
0.943 I
0.977 1 .
,.,
0.996 1
0.997 1
0.999 1
11
$$
0.996 : 1:
0.997 :,
.
0.637 I) wall TC broken after-
1111
IS11
so
:) 20 hours..11
0.994 1) deposit removed during runs -
0.993 1) slope taken from the 1st few -
0.996 1) points before large drop of Rf.
0.995 1
0.998 :
0.999 I
0.974 *power failure at 50 hours-
0.951 1) resumed at-
0.117 1) 70 hours
11
1111
11
Io
11
222 S 32 2 2 == 222 2 2.22 22 22 22 3822=iii 2211122:2Z2Z2Z2
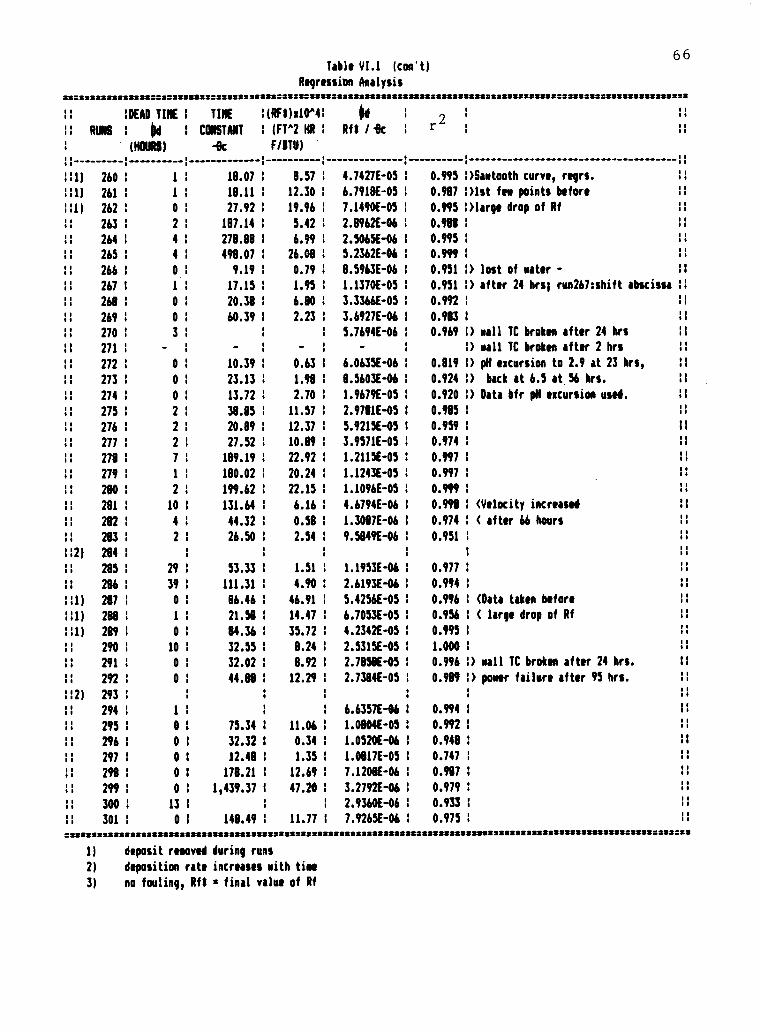
66Table 11.1 (con't)
Regression Analysis
22 2 112222 22 2
11 :DEAD TIME 1 TIME 1(11FI)x10441
11 RUNS id CONSTANT :
(HOURS)
11 1 : :
:11) 260 1 1 1 18.07 :
111) 261 1 1 : 18.11 1
111) 262 1 0 1 27.92 :
II 263 1 2 1 187.14 1
.. 264 1 4 I 278.88 1:1
1111 265 1 4 1 498.07 :II11 266 1 0 1 9.19 11111 267 1 1 : 17.15 1II11 268 1 0 1 20.38 :11II 269 1 0 : 60.39 111
270 : 3 : :11 '
. : .:1 271 :
.
II11 272 : 0 1 10.39 1
1100 273 1 0 : 23.13 :
1111 274 1 0 1 13.72 :
II11 275 1 2 : 38.85 1
II11 276 : 2 : 20.89 1
1111 277 1 2 : 27.52 1::10$1 278 : 7 1 189.19 1
1111 279 1 1 1 180.02 1
11210 : 2 : 199.62 :II
IIII 281 1 10 1 131.64 1
:: 282 : 4 : 44.32 :II
II283 1 2 1 26.50 111
..
.
:12) 214 1
.
1111 285 1 29 : 53.33 1
11 286 1 39 : 111.31 ::1
HI) 287 1 0 : 86.46 1
111) 211 1 1 1 21.58 1
111) 289 1 0 1 84.36 111
290 1 10 1 32.55 1II
II11 291 1 0 1 32.02 1
II292 1 0 1 44.88 1..
:12) 293 :
1111 294 1 1 1
1111 295 : 0 1 75.34 1
II296 1 0 1 32.32 111
II11 297 1 0 1 12.48 1
II298 1 0 1 178.21 1II
11299 1 0 I 1,439.37 1..
..300 1 13 1 1II
11 301 1 0 1 148.49 1
242222 222222222222222222222222222 222222222
22222
(FTA2 HR 1
F/BTU)
1
8.57 1
12.30 1
19.96 1
5.42 1
6.99 1
26.08 1
0.79 1
1.95 1
6.10 1
2.23 1
.'
0.63 1
1.98 1
2.70 1
11.57 :
12.37 1
10.119 1
22.92 1
20.24 I
22.15 1
6.16 1
0.58 :
2.54 :
.
.
1.51 1
4.90 1
46.91:
14.47 1
35.72 1
8.24 1
8.92 1
12.29 1.
.
.'
11.06 1
0.34 :
1.35 1
11.64:
47.20 1
1
11.77:
id 1
Rf / 4c
1
4.7427E-05 1
6.7918E -05 :
7.1490E-05 :
2.8962E-06 1
2.5065E-06 1
5.2362E-06 1
8.5963E-06 1
1.1370E-05 :
3.3366E-05 1
3.6927E-06 1
5.7694E-06 1
6.0635E-06 1
8.5603E-06 1
1.9679E-05 1
2.9781E-05 1
5.9215E-05 1
3.9571E-05 1
1.2115E-05 1
1.1243E-05 1
1.1096E-05 1
4.6794E-06 1
1.3017E-06 1
9.5149E-06 1
1.1953E-04 1
2.6193E-06 :
5.4256E-05 :
6.7053E-0S 1
4.2342E-05 1
2.5315E-05 1
2.7858E-05 1
2.7384E-OS 1.
1
6.6357E-06 1
1.0104E-05 1
1.0520E-06 1
1.0117E-05 1
7.1202E-06 1
3.2792E-06 :
2.9360E-06 1
7.1265E-06 1
2
1 11
r2
1111
1 1:
0.995 1)Sawtooth curve, rears.1111
0.987 1)1st few points before1111
0.995 :Marge drop of RfII11
0.988 : 11II
110.995 1 ..
0.114 1II
0.951 1) lost of water - 11
0.951 1) after 24 hrs; run267:shift abscissa 1:11
0.992 1 ..
0.983 1 11
0.969 1) wall TC broken after 24 hrs ::
:) wall TC broken after 2 hrs0111
0.819 1) pH excursion to 2.9 at 23 hrs, 11
0.924 I) back at 6.5 at 56 hrs.
0.920 1) Data bfr pll excursion used. II
0.985 1 11
0.959 1 11
0.974 1 11
0.197 1 11
0.997 1 1:
0.999 :
0.912 1 (Velocity increased 11
0.974 : ( after 66 hours is
0.951 1
11II
1 ....
0.977 1
110.994 1 11
0.996 1 (Data taken beforeIIII
0.956 1 ( large drop of Rf 1111
0.995 1IIis
1.000 1IIIi
0.996 1) wall TC broken after 24 hrs. 11
0.989 1) power failure after 95 hrs.
1110
0.994 1 1:
0.992 1 11
0.948 1 11
0.747 I 1:
10.917 : 1.
0.979 1
0.933 :
0.975 :IIII
222 22
1) deposit removed during runs
2) deposition rate increases with time
3) no fouling, Rft = final value of Rf
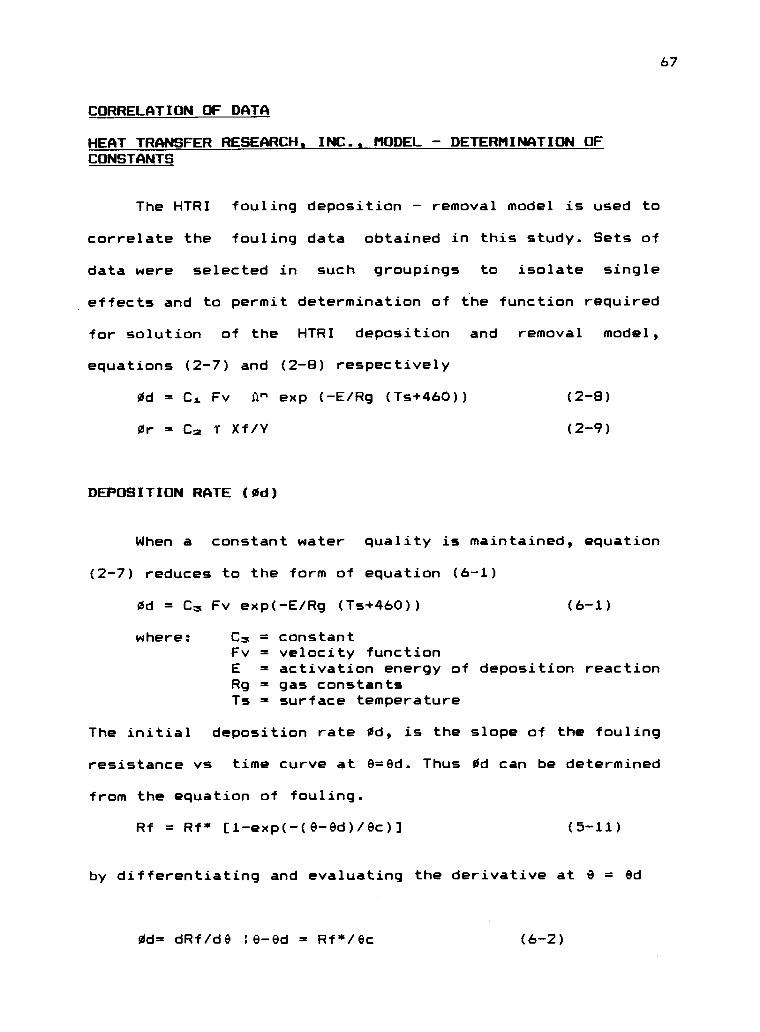
67
CORRELATION OF DATA
HEAT TRANSFER RESEARCH, INC., MODEL DETERMINATION OFCONSTANTS
The HTRI fouling deposition removal model is used to
correlate the fouling data obtained in this study. Sets of
data were selected in such groupings to isolate single
effects and to permit determination of the function required
for solution of the HTRI deposition and removal model,
equations (2-7) and (2-8) respectively
Od = Ci Fv S2^ exp (-E/Rg (Ts+460)) (2-8)
Or = Cm T Xf/Y (2-9)
DEPOSITION RATE (0d)
When a constant water quality is maintained, equation
(2-7) reduces to the form of equation (6-1)
Od = Cm Fv exp(-E/Rg (Ts+460)) (6-1)
where: C-K = constantFv = velocity functionE = activation energy of deposition reactionRg = gas constantsTs = surface temperature
The initial deposition rate Od, is the slope of the fouling
resistance vs time curve at 9=9d. Thus Od can be determined
from the equation of fouling.
Rf = Rf* [1-exp(-(0-0d)/9c)] (5-11)
by differentiating and evaluating the derivative at 19 = ed
Od= dRf/d0 :e-ed = Rf*/19c (6-2)
68
where values of Rf* and $c were predicted from the
experimental data by the regression of equation (5-11)
described in Appendix I.
The experimentally obtained the value of Od was then
used to determine the velocity function Fv and constants Cm
and E of equation (6-1) as described below
The velocity function Fv
Sets of data were selected, each with the same water
quality and surface temperature. Od was plotted versus
velocity on a logarithmic scale to fit the equation
in Od = In Cd. V /C, (6-3)
These plots are shown in Appendix M. Normalizing these
plots by plotting In (0d/C4.) vs velocity (Fig. VI-1), the
average slope of .352 (=1/C7) is obtained with standard
deviation of 11%.
Thus, the velocity function Fv is the form of
Fv = exp(-.352 V) (6-4)
Since Od is proportional to Fv in the model, increasing
velocity will have the effect of decreasing deposition rate.
The velocity function, Fv, was then used for the evaluation
of activation energy E.
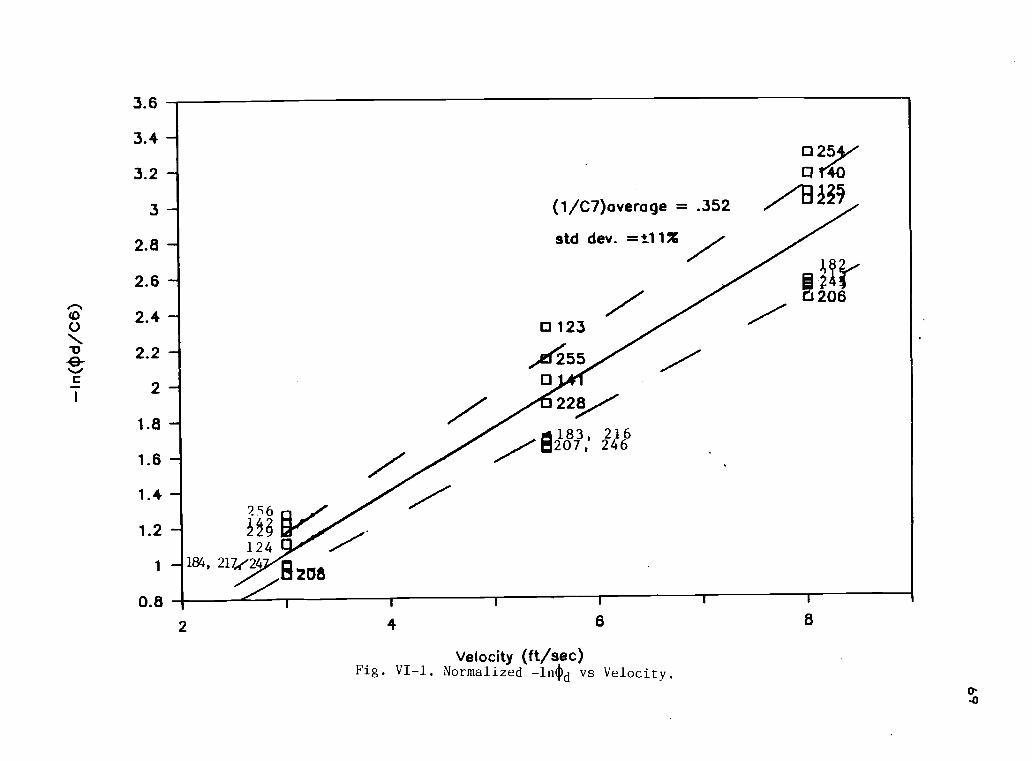
3.6
3.4
3.2
3
2.8
2.6
Z.' 2.4
-13 2.249-
2
1.8
1.6
1.4
1.2
1
0.82
(1/C7)average = .352
std dev. =±.11%
O 123
,e6550
i4 V124
184, 21724 ri208
183, 216..,.../E1207, 246
025C1110
VB 139
206
4 6
Velocity (ft /sec)Fig. VI-1. Normalized -14d vs Velocity.
8

70
The activation energy constant E.
Rewriting equation (6-1), results in equation (6-5)
Od/Fv = C5 exp (-E/Rg (Ts+460))
which can be rewritten as:
ln(Od/Fv) = In C5 (E/Rg)(1/(Ts+460))
(6-5)
(6-6)
Sets of data were selected each with the same water quality.
Ln(Od/Fv) is plotted against (1/(Ts+460)) to determine the
values of E and Cm for each of seventeen water qualities
considered. These plots are shown in Appendix M, the values
of these are tabulated in Table VI-2. Results indicate that
both the constant C5 and activation energy E are dependent
on water quality.
As expected the presence of suspended solids appears to
make the activation energy, E smaller. Since the formation
of nuclei from precipitated ions is an energy consuming
process, and suspended solids can serve as nuclei for
precipitation, thus its presence make the activation energy
smaller.
In general, higher pH has a tendency to increase E.
This is probably because usually a solution with higher pH
has a lower solubility product, result in higher degree of
supersaturation, thus more energy is required for the
formation of nuclei from precipitated ions.
The presence of additional additive(s) such as HEDP,
AMP, polyacrylate, polyphosphate and orthophosphate, also
71
has a tendency lower E, since they provide more
heterogeneous nucleation. The results also indicate that the
value of E has an effect on the value of Cz. A higher or
lower value of E will result in higher or lower C=,
respectively. Thus, the constant C, is also dependent on
water quality. There is a considerable variation of the
activation energy E ranging froM 2.09E5 to 1.44E4
Btu/lbmol. No particular pattern is noted with respect to pH
or the type of additive used. It is therefore appears that
for the present, the individual values of CS and E should be
used with the specific additive combinations for which they
were derived.
With the functions determined above, the model equation
for a deposition rate function Od in equation (6-1) can now
be used to calculate the deposition rate for each water
quality in this study.
In Figure VI-2. the experimentally obtained logarithm
of the deposition rate is plotted against the results
calculated by the model equation (6-1). The standard
deviation of the ratio (experimental values over the model
values) is 1:36%.
REMOVAL RATE
The time constant (0c) in the exponential equation Rf =
Rf* (1-exp(-0/0c)) is the time required for Rf to reach a
value of 63% of the value of Rf*. In three time constant the
fouling resistance is 95% of the asymptotic fouling
resistance.
e = ec , Rf = .63 Rf*
6 = 30c , Rf = .95 Rf*
The time constant 6c was predicted from experimental
data by the regression equation (5-11) as described in
Appendix I. The experimentally obtained $c can now be used
to determine a functional relationship as given in equation
(3-13):
@c =Cm T kf
(3-13)
72
The HTRI model is based on the assumption that the _
characterizing function of the deposit structure Y is an
increasing function with flow velocity, thus
Y a V4' with a>0 (6-7)
However, the HTRI model and other studies to date have not
quantified the effect of temperature on the removal process.
As the temperature within the deposit increases, the
strength of the deposit should be affected and thereby also
the removal rate of the deposit. Thus in the present
analysis it is assumed that Y is a function of both surface
temperature and velocity according to the relation:
Y a V* Ts* (6-8)
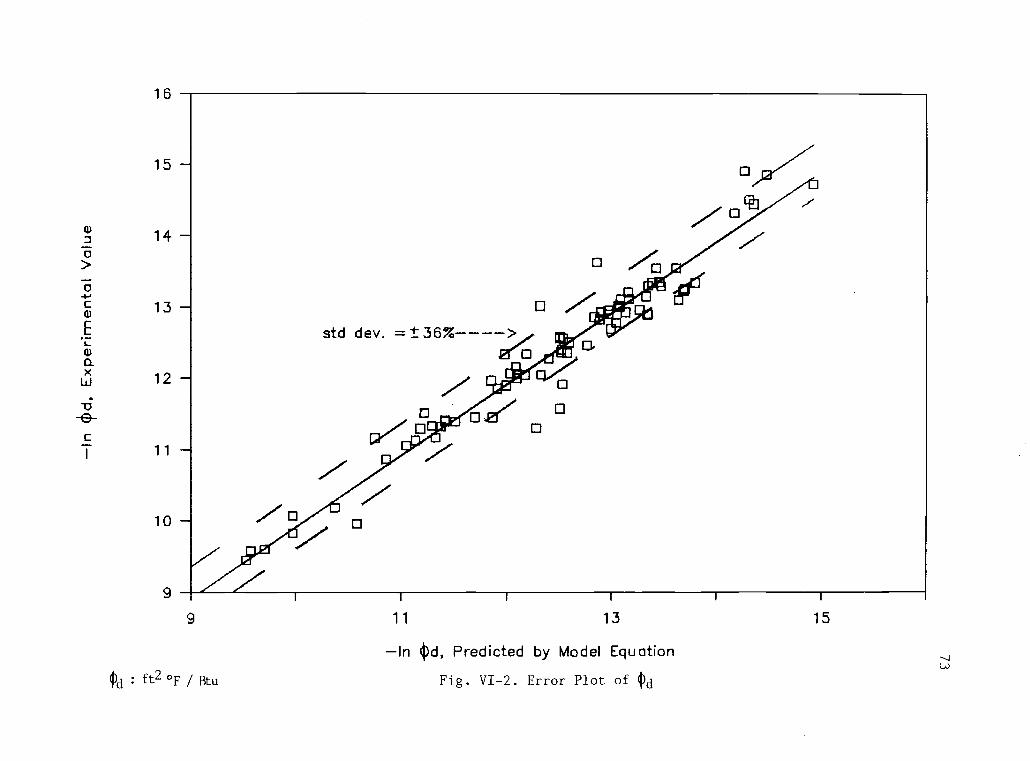
Ctid : ft2 °F / Btu
In Ocl, Predicted by Model Equation
Fig. VI-2. Error Plot of 4d
74
Shear stress not velocity is the more fundamental parameter
in removal rate. For the HTRI test sections with water
flowing at 1150F, the fluid wall shear stress T is related
to velocity by the equation:
(lbf/ft-12) = 1.1159 x 10-.7 V"7° (6-9)
where V = ft/sec.
The calculation of shear stress for the HTRI test
section is described in appendix D. Hence, the removal rate
function $c can be expressed as,:
Oc = Ca. T Tsb with a = (a/1.75)-1 (6-10)
The quantities of CA, a and b for each additive combination
are obtained from the experimental data by multiple linear
regression analysis. The plots of time constant as a
function of surface temperature and velocity are shown for
each water quality in Appendix M. The coefficient CA
includes the proportionality constant relationship in
equation (6-8) and the quantities of Cmkf (which are assumed
constant for each water quality) in equation (2-14). The
values of these removal rate terms ( Cm, 'a' or in terms of
a and 'b') are tabulated in Table (VI-2). CA, a and b appear
to be also dependent upon water quality. The results
tabulated in table (VI-2) indicate that the values of 'a'
for all water qualities are greater than 0, indicating that
the scale strength factor is an increasing function with
velocity. The values of b are either positive or negative.
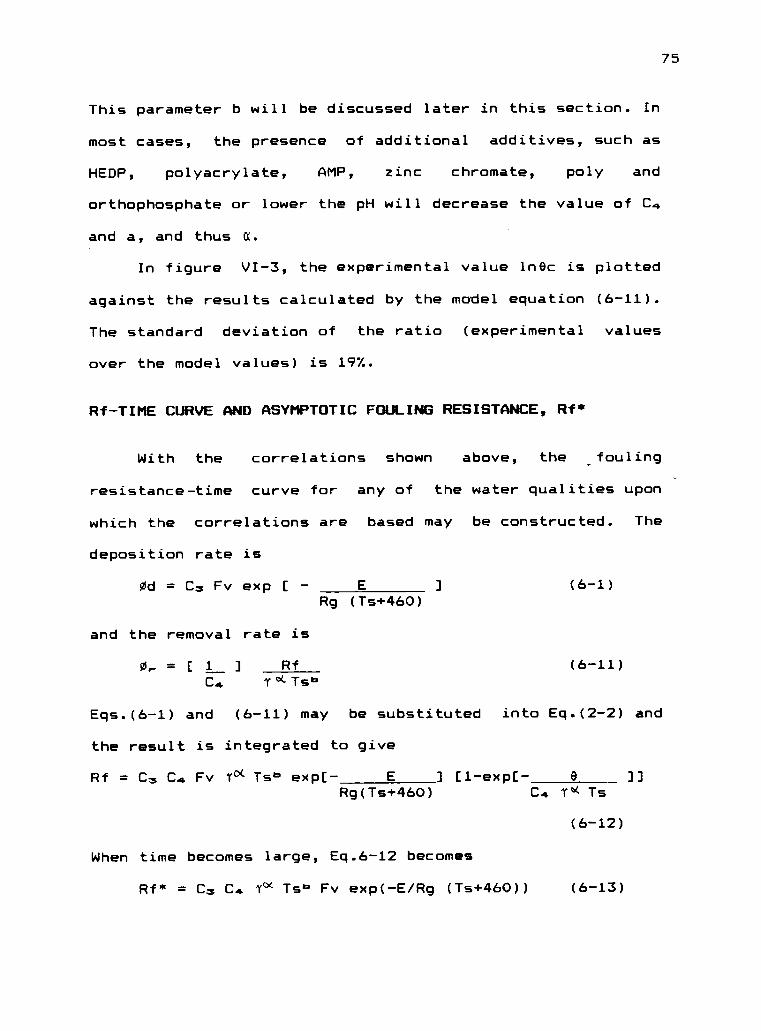
75
This parameter b will be discussed later in this section. In
most cases, the presence of additional additives, such as
HEDP, polyacrylate, AMP, zinc chromate, poly and
orthophosphate or lower the pH will decrease the value of CA
and a, and thus a.
In figure VI-3, the experimental value inOc is plotted
against the results calculated by the model equation (6-11).
The standard deviation of the ratio (experimental values
over the model values) is 197..
Rf -TIME CURVE AND ASYMPTOTIC FOULING RESISTANCE, Rf*
With the correlations shown above, the _fouling
resistance-time curve for any of the water qualities upon
which the correlations are based may be constructed. The
deposition rate is
Od = Cz Fv exp E (6-1)Rg (Ts+460)
and the removal rate is
0, = [ 1 ] Rf (6-11)C4 i°(Tsb
Eqs.(6-1) and (6-11) may be substituted into Eq.(2-2) and
the result is integrated to give
Rf = C3 C4 Fv TO( Tst. exp[- E 3 [1 -exp[- 6 ]]Rg(Ts+460) C4 '04 Ts
(6-12)
When time becomes large, Eq.6-12 becomes
Rf* = Cz C4 T4X Tsb Fv exp(-E/Rg (Ts+460)) (6-13)
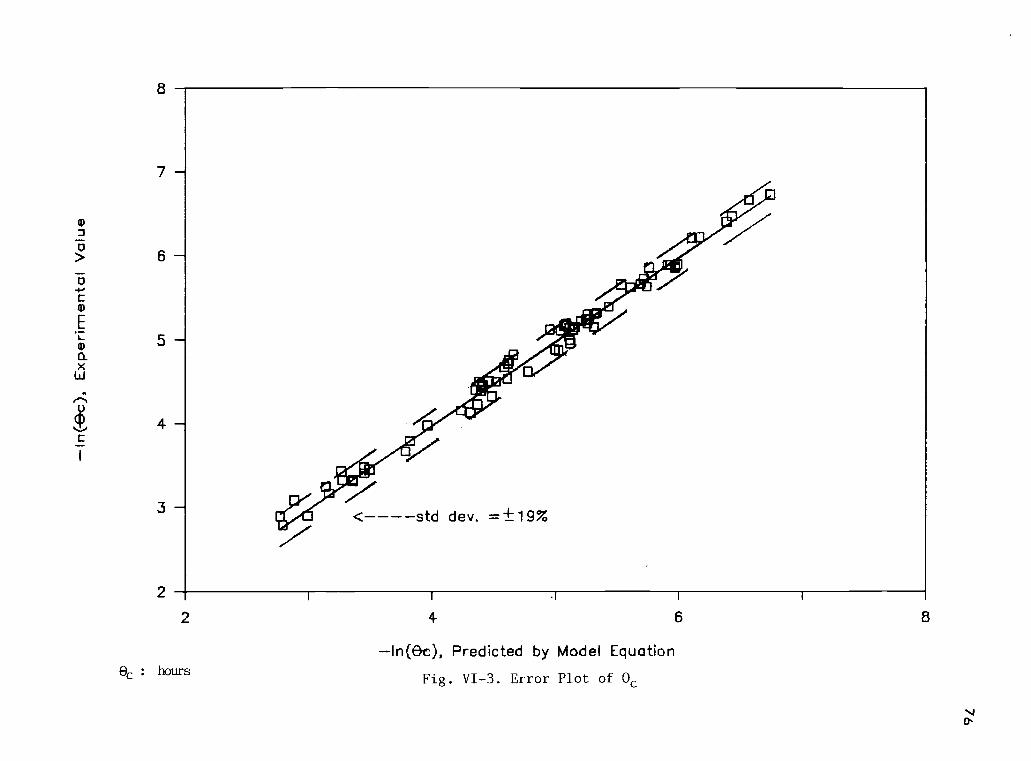
8
7
6
5
4
3
2
2
ec : hours
4
In(Ge), Predicted by Model Equation
Fig. VI-3. Error Plot of Oc
6
77
With all the functional relationships numerically determined
from experimental data, equation (6-13) is now a predictive
model equation for the asymptotic fouling resistance for
each water quality.
In Eqs.6-12 and 6-13, Fv may be obtained from equation
(6-14), (in terms of shear stress)
Fv = exp(-4.6 T -67) (6-14)
The values of the parameters C3, C.', g, b and E may be
obtained from Table VI-2. The use of these parameters are
limited to wall shear stress .08 i 1 i .43 lbf/ft° and
surface temperature 130 1 Is i 160°F and are unique for each
water quality indicated. It has not yet been possible to
develop correlations, so that a single set of parameter will
apply to all water qualities. In figure VI-4, the
experimentally obtained of asymptotic fouling resistance is
plotted against the values determined from the model
equation (6-13). The standard deviation of the ratio
(experimental values over the model values) is 42%.
Table VI-3 presents the comparison of experimental
values and values obtained from the model equation for
deposition rate Od, time constant ec and asymptotic fouling
resistance.
CONDITIONS SHOWING INSIGNIFICANT FOULING:
There were combinations of additive, flow conditions
and surface temperature that for which virtually no fouling
occurred over the duration of the tests. Table (VI-1)

5
Rf* : f t2 hr ° F / Btu
7 9
In(Rf*), Predicted by Model EquationFig. VI-4. Error Plot of Rf*
11
79
indicates that for some runs, the value of Rf* is less then
.0001 ft° hr oF/Eitu which is considered to be negligible.
The conditions of these runs may be used to show those
additive combinations and conditions for which a threshold
value of Rf* = .0001 fta hr OF /Btu will not be exceeded. In
the operation of heat exchangers, it is desirable to operate
with low velocity, high surface temperature, and high pH.
Table (VI-4) presents threshold values of pH, velocity
(shear stress) and surface temperature in the test section
for several additive combinations. The shear stress shown in
this table are calculated from Eq.6-9 for the HTRI test
section with water flowing at 1150F.
In this table the basis of determining the threshold is
the expectation that the asymptotic fouling resistance would
be equal or less than 0.0001 fta hr 0F/8tu. Other bases for
establishing a threshold may be used, such as .0002 or .0003
ft° hr oF/Htu.
As an example of the use of table VI-4, consider the
water used in this study containing 20 ppm CrOm, 4 ppm Zn, 3
ppm HEDP. The fouling resistance would not expected to be
greater than .0001 ft° hr 0F/Btu if these conditions are
maintained: pH lower than 8, velocity in HTRI test section
greater than 5.5 ft/sec or shear stress greater than .220
lbf/ft° and the heater surface temperature less than 1600F.
In term of operating conditions, the best additive in
table VI-4 is the combination 20 ppm chromate, 4 ppm zinc,
and 3 ppm HEDP.
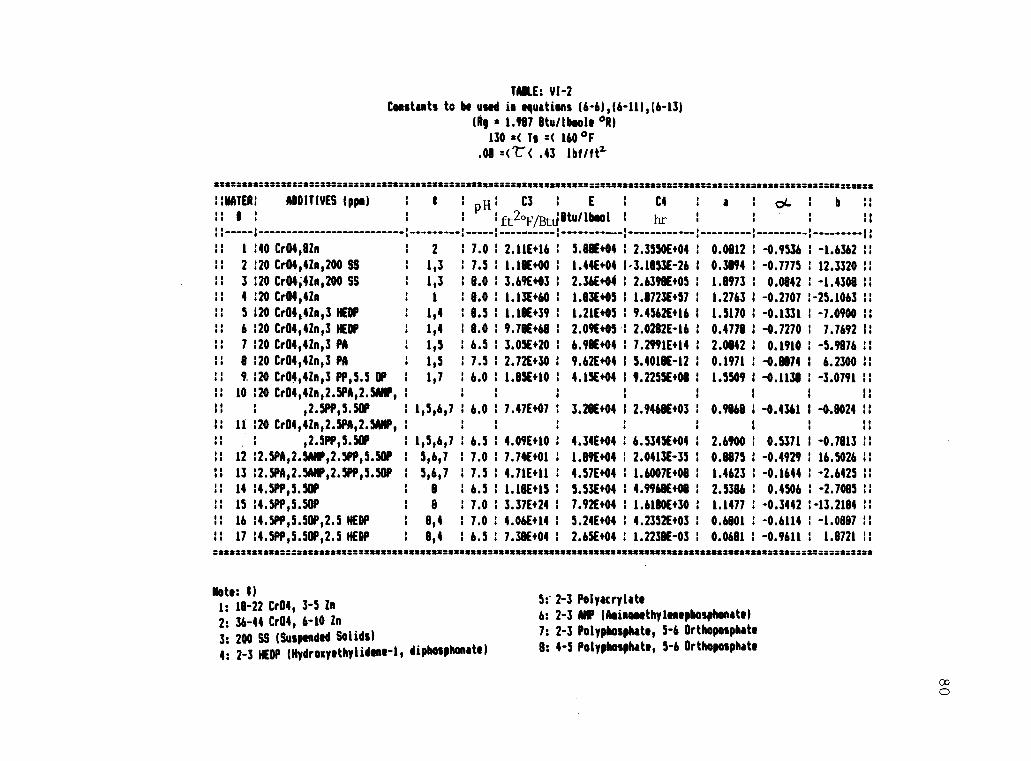
TAKE: VI-2
Constants to be used in equations (6-6),(6-11),(6-13)
(Rq 2 1.907 Itu/lboole °II)
130 z( Ts 2( 160°F
.08 =a7( .43 lbf/ffl
222.2222222222221122222====22211222212222.222.2222222 s_=___ iZZ__az__ Itmassataz-zsz===ammenss
1: WATER: ADDITIVES (ppm) : C3 1 E C4 I a or_ I b
1: I ft2ovatilltu/lbool hr1: 1 1:
1: 1 140 Cr04,111n I 2 7.0 2.11E+16 5.88E+04 2.3550E+04 0.0812 1 -0.9536 I -1.6362 11
11 2 :20 Cr04,41n,200 SS 1 1,3 7.5 1 1.10E+00 1 1.44E+04 -3.1853E-26 0.3894 1 -0.7775 12.3320 11
11 3 :20 Cr04i41n,200 SS 1,3 8.0 1 3.69E+03 1 2.36E+04 1 2.6390E+05 1.8973 1 0.0842 1 -1.4308 :1
4 120 Cr04,4in 8.0 1 1.13E+60 1.03E+05 1.8723E+57 1.2763 I -0.2707 -25.1063 ::
5 120 Cr04,043 HEDP 1 1,4 8.5 1 1.18E+39 1.21E+05 9.4562E+16 1 1.5170 1 -0.1331 1 -7.0900 I:
6 :20 Cr04,41n,3 NEDF 1,4 8.0 9.70E+68 2.09E+05 1 2.0282E-16 1 0.4770 i -0.7270 1 7.7692 1:
7 :20 Cr04,41n,3 PA 1 1,5 6.5 3.05E+20 6.90E+04 1 7.2991E+14 2.0042 0.1910 1 -5.9876 1:
8 120 Cr04,41143 PA 1 1,5 7.5 1 2.72E+30 9.62E+04 i 5.4018E-12 I 0.1971 1 -0.0874 i 6.2300 1:
9.:20 Cr04,01,3 PP,5.5 OP 1 1,7 6.0 1 1.85E+10 4.15E+04 9.2255E+08 1 1.5509 1 -0.1138 1 -3.0791 1:
:1 10 120 Cr04,41n,2.5FA,2.5AMF, 1:
I ,2.5FP,5.50F 1,5,6,7 6.0 1 7.47E+07 3.28E+04 1 2.9468E+03 1 0.9868 -0.4361 1 4.8024 11
11 11 120 Cr04,41n,2.514,2.5AMP,II I
,2.5141,5.50F 1,5,6,7 6.5 1 4.09E+10 4.34E+04 6.5345E+04 2.6900 1 0.5371 I -0.7813 1:
:1 12 12.5141,2.5AMF,2.5PF,5.50, 5,6,7 7.0 7.74E+01 1.09E+04 2.0413E-35 0.1875 1 -0.4929 16.5026 ::
1: 13 12.5FA,2.5AMF,2.5FP,5.50F 5,6,7 7.5 4.71E+11 4.57E+04 1.6007E+08 1.4623 -0.1644 -2.6425 11
1: 14 14.511,5.50F 1 0 6.5 1.18E+15 5.53E+04 4.9960E+08 2.5386 1 0.4506 1 -2.7085 ::
11 15 14.5PP,5.50F 1 8 7.0 3.37E+24 7.92E+04 i 1.6180E+30 1.1477 1 -0.3442 -13.2104 ::
:1 16 14.511,5.50P,2.5 NEDP 1 8,4 7.0 4.06E+14 5.24E+04 1 4.2352E+03 0.6101 1 -0.6114 -1.0887 1:
11 17 14.511,5.50F,2.5 HEDP 8,4 6.5 7.38E+04 . 2.65E+04 1.2238E -03 0.0681 1 -0.9611: 1.8721 1:
2 2 222Z
Note: t)
1: 18-22 Cr04, 3-5 In
2: 36-44 Cr04, 6-10 in
3: 200 SS (Suspended Solids)
4: 2-3 NEP (Hydroxyethylidene-1, diphosphonate)
5:
6:
7:
8:
2-3 Polyacrylate
2-3 MP (Aoinomethylenephosphonate)
2-3 Polyphosphate, 5-6 Orthoposphate
4-5 Polyphosphate, 5-6 Orthoposphate
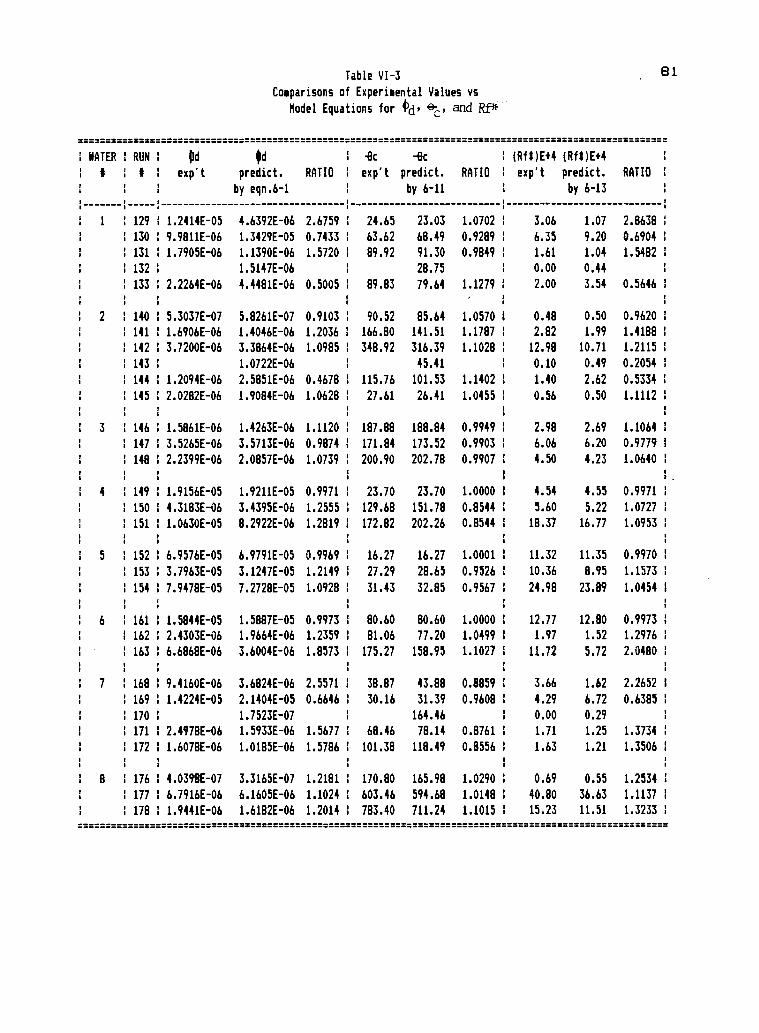
Table VI-3
Comparisons of Experimental Values vs
Model Equations for 4d' 44E, and Rf*
i
WATER RUN 1
I I I
Id
exp't
Id
predict.
by eqn.6-1
RATIO
1 8c
exp't
-8c
predict.
by 6-11
2
RATIO
22..22
(RfOE+4 (Rf1)E+4
exp't predict.
by 6-13
m
RATIO
1 129 1.2414E-05 4.6392E-06 2.6759 24.65 23.03 1.0702 3.06 1.07 2.8638
130 9.9811E-06 1.3429E-05 0.7433 63.62 68.49 0.9289 6.35 9.20 0.6904
131 1.7905E-06 1.1390E-06 1.5720 89.92 91.30 0.9849 1.61 1.04 1.5482
132 1.5147E-06 28.75 0.00 0.44
133 2.2264E-06 4.4481E-06 0.5005 89.83 79.64 1.1279 2.00 3.54 0.5646
2 140 5.3037E-07 5.8261E-07 0.9103 90.52 85.64 1.0570 1 0.48 0.50 0.9620
141 1 1.6906E-06 1.4046E-06 1.2036 1 166.80 141.51 1.1787 I 2.82 1.99 1.4188
142 3.7200E-06 3.3864E-06 1.0985 348.92 316.39 1.1028 12.98 10.71 1.2115
143 1 1.0722E-06 45.41 1 0.10 0.49 0.2054
144 1.2094E-06 2.5851E-06 0.4678 1 115.76 101.53 1.1402 1 1.40 2.62 0.5334
145 2.0282E-06 1.9084E-06 1.0628 27.61 26.41 1.0455 0.56 0.50 1.1112
3 1 146 1.5861E-06 1.4263E-06 1.1120 187.88 188.84 0.9949 2.98 2.69 1.1064
147 3.5265E-06 3.5713E-06 0.9874 1 171.84 173.52 0.9903 6.06 6.20 0.9779
148 2.2399E-06 2.0857E-06 1.0739 200.90 202.78 0.9907 1 4.50 4.23 1.0640
4 149 1.9156E-05 1.9211E-05 0.9971 23.70 23.70 1.0000 1 4.54 4.55 0.9971
150 4.3183E-06 3.4395E-06 1.2555 129.68 151.78 0.8544 1 5.60 5.22 1.0727
151 1.0630E-05 8.2922E-06 1.2819 172.82 202.26 0.8544 18.37 16.77 1.0953
5 1 152 6.9576E-05 6.9791E-05 0.9969 16.27 16.27 1.0001 11.32 11.35 0.9970
153 1 3.7963E-05 3.1247E-05 1.2149 27.29 28.65 0.9526 1 10.36 8.95 1.1573
154 7.9478E-05 7.2728E-05 1.0928 1 31.43 32.85 0.9567 24.98 23.89 1.0454
6 161 1 1.5844E-05 1.5887E-05 0.9973 1 80.60 80.60 1.0000 1 12.77 12.80 0.9973
162 1 2.4303E-06 1.9664E-06 1.2359 1 81.06 77.20 1.0499 1 1.97 1.52 1.2976
163 1 6.6868E-06 3.6004E-06 1.8573 1 175.27 158.95 1.1027 1 11.72 5.72 2.0480
7 1 168 1 9.4160E-06 3.6824E-06 2.5571 1 38.87 43.88 0.8859 1 3.66 1.62 2.2652
1 169 1 1.4224E-05 2.1404E-05 0.6646 1 30.16 31.39 0.9608 1 4.29 6.72 0.6385
170 1 1.7523E-07 1 164.46 1 0.00 0.29
171 1 2.4978E-06 1.5933E-06 1.5677 1 68.46 78.14 0.8761 I 1.71 1.25 1.3734
172 1 1.6078E-06 1.0185E-06 1.5786 I 101.38 118.49 0.8556 1 1.63 1.21 1.3506
8 1 176 1 4.0398E-07 3.3165E-07 1.2181 1 170.80 165.98 1.0290 1 0.69 0.55 1.2534
177 1 6.7916E-06 6.1605E-06 1.1024 1 603.46 594.68 1.0148 1 40.80 36.63 1.1137
178 1 1.9441E-06 1.6182E-06 1.2014 1 783.40 711.24 1.1015 1 15.23 11.51 1.3233
1=2
Si.
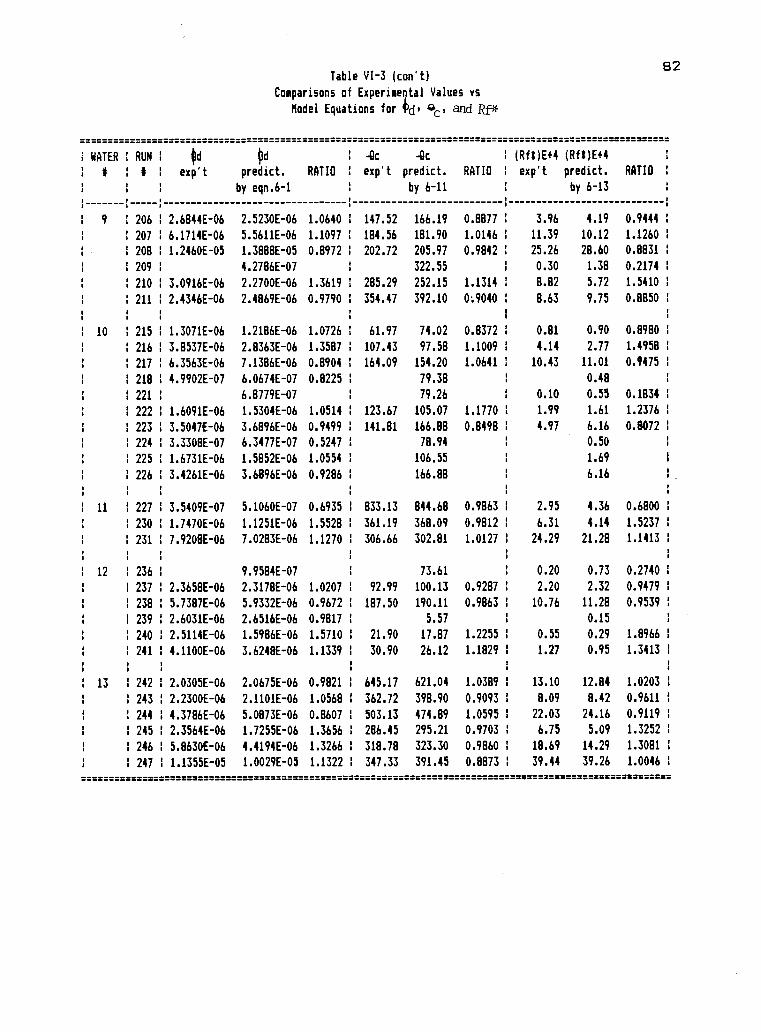
Table VI-3 (con't)
Comparisons of Experimental Values vs
Model Equations for i)d, 4(2' and FT*
82
WATER 1 RUN
# # exp't predict.
by eqn.6-1
RATIO exp't
-Oc
predict.
by 6-11
RATIO
(RfI)E+4 (Rft)E+4
exp't predict.
by 6-13
RATIO
9 206 1 2.6844E-06 2.5230E-06 1.0640 147.52 166.19 0.8877 3.96 4.19 0.9444
207 6.1714E-06 5.5611E-06 1.1097 184.56 181.90 1.0146 11.39 10.12 1.1260
208 1.2460E-05 1.3888E-05 0.8972 202.72 205.97 0.9842 25.26 28.60 0.8831
209 4.2786E-07 322.55 0.30 1.38 0.2174
210 3.0916E-06 2.2700E-06 1.3619 1 285.29 252.15 1.1314 8.82 5.72 1.5410
211 2.4346E-06 2.4869E-06 0.9790 1 354.47 392.10 0:9040 8.63 9.75 0.8850
10 215 1.3071E-06 1.2186E-06 1.0726 61.97 74.02 0.8372 0.81 0.90 0.8980
216 3.8537E-06 2.8363E-06 1.3587 107.43 97.58 1.1009 4.14 2.77 1.4958
217 6.3563E-06 7.1386E-06 0.8904 164.09 154.20 1.0641 1 10.43 11.01 0.9475
218 1 4.9902E-07 6.0674E-07 0.8225 1 79.38 0.48
221 1 6.8779E-07 1 79.26 1 0.10 0.55 0.1834
222 1 1.6091E-06 1.5304E-06 1.0514 1 123.67 105.07 1.1770 1 1.99 1.61 1.2376
223 1 3.5047E-06 3.6896E-06 0.9499 1 141.81 166.88 0.8498 1 4.97 6.16 0.8072
224 1 3.3308E-07 6.3477E-07 0.5247 1 78.94 0.50
1 225 1 1.6731E-06 1.5852E-06 1.0554 1 106.55 1.69
226 1 3.4261E-06 3.6896E-06 0.9286 1 166.88 6.16
11 1 227 1 3.5409E-07 5.1060E-07 0.6935 1 833.13 844.68 0.9863 1 2.95 4.36 0.6800
1 230 1 1.7470E-06 1.1251E-06 1.5528 1 361.19 368.09 0.9812 1 6.31 4.14 1.5237
231 1 7.9208E-06 7.0283E-06 1.1270 1 306.66 302.81 1.0127 1 24.29 21.28 1.1413
12 1 236 1 9.9584E-07 1 73.61 1 0.20 0.73 0.2740
237 1 2.3658E-06 2.3178E-06 1.0207 1 92.99 100.13 0.9287 2.20 2.32 0.9479
238 1 5.7387E-06 5.9332E-06 0.9672 1 187.50 190.11 0.9863 1 10.76 11.28 0.9539
239 1 2.6031E-06 2.6516E-06 0.9817 1 5.57 0.15
240 1 2.5114E-06 1.5986E-06 1.5710 1 21.90 17.87 1.2255 1 0.55 0.29 1.8966
241 1 4.1100E-06 3.6248E-06 1.1339 1 30.90 26.12 1.1829 1 1.27 0.95 1.3413
13 1 242 1 2.0305E-06 2.0675E-06 0.9821 1 645.17 621.04 1.0389 1 13.10 12.84 1.0203
243 1 2.2300E-06 2.1101E-06 1.0568 1 362.72 398.90 0.9093 1 8.09 8.42 0.9611
244 1 4.3786E-06 5.0873E-06 0.8607 1 503.13 474.89 1.0595 1 22.03 24.16 0.9119
1 245 1 2.3564E-06 1.7255E-06 1.3656 1 286.45 295.21 0.9703 1 6.75 5.09 1.3252
246 1 5.8630E-06 4.4194E-06 1.3266 1 318.78 323.30 0.9860 1 18.69 14.29 1.3081
1 247 1 1.1355E-05 1.0029E-05 1.1322 1 347.33 391.45 0.8873 1 39.44 39.26 1.0046
211 s s X 21222==
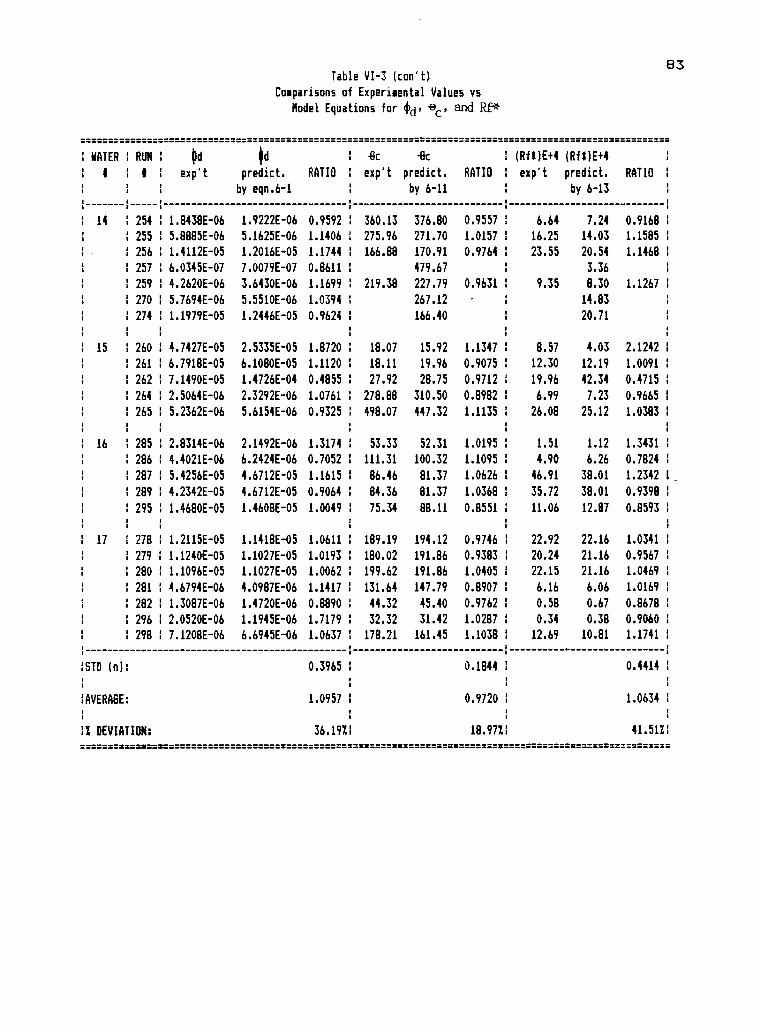
83Table VI-3 (can't)
Comparisons of Experimental Values vs
Model Equations for +d' oc, and Rf*
WATER 1 RUN 1
II t
fd
exp't
fd
predict.
by eqn.6-1
RATIO
ilc
exp't
8c
predict.
by 6-11
RATIO
2
1 (Rft)E+4 (Rft)E+4
1 exp't predict.
by 6-13
RATIO
14 254 1.8438E-06 1.9222E-06 0.9592 1 360.13 376.80 0.9557 6.64 7.24 0.9168
255 5.8885E-06 5.1625E-06 1.1406 275.96 271.70 1.0157 16.25 14.03 1.1585
256 1.4112E-05 1.2016E-05 1.1744 166.88 170.91 0.9764 23.55 20.54 1.1468
257 1 6.0345E-07 7.0079E-07 0.8611 479.67 3.36
259 4.2620E-06 3.6430E-06 1.1699 219.38 227.79 0.9631 1 9.35 8.30 1.1267
270 1 5.7694E-06 5.5510E-06 1.0394 267.12 14.83
274 1.1979E-05 1.2446E-05 0.9624 166.40 20.71
15 260 1 4.7427E-05 2.5335E-05 1.8720 18.07 15.92 1.1347 8.57 4.03 2.1242
261 6.7918E-05 6.1080E-05 1.1120 1 18.11 19.96 0.9075 12.30 12.19 1.0091
262 7.1490E-05 1.4726E-04 0.4855 27.92 28.75 0.9712 19.96 42.34 0.4715
264 2.5064E-06 2.3292E-06 1.0761 278.88 310.50 0.8982 6.99 7.23 0.9665
265 5.2362E-06 5.6154E-06 0.9325 498.07 447.32 1.1135 26.08 25.12 1.0383
16 1 285 1 2.8314E-06 2.1492E-06 1.3174 1 53.33 52.31 1.0195 1.51 1.12 1.3431
286 1 4.4021E-06 6.2424E-06 0.7052 111.31 100.32 1.1095 1 4.90 6.26 0.7824
287 5.4256E-05 4.6712E-05 1.1615 1 86.46 81.37 1.0626 1 46.91 38.01 1.2342
289 1 4.2342E-05 4.6712E-05 0.9064 1 84.36 81.37 1.0368 35.72 38.01 0.9398
295 1 1.4680E-05 1.4608E-05 1.0049 1 75.34 88.11 0.8551 11.06 12.87 0.8593
17 1 278 1 1.2115E-05 1.1418E-05 1.0611 1 189.19 194.12 0.9746 1 22.92 22.16 1.0341
279 1 1.1240E-05 1.1027E-05 1.0193 180.02 191.86 0.9383 1 20.24 21.16 0.9567
280 1.1096E-05 1.1027E-05 1.0062 199.62 191.86 1.0405 1 22.15 21.16 1.0469
281 1 4.6794E-06 4.0987E-06 1.1417 131.64 147.79 0.8907 1 6.16 6.06 1.0169
282 1 1.3087E-06 1.4720E-06 0.8890 1 44.32 45.40 0.9762 1 0.58 0.67 0.8678
296 1 2.0520E-06 1.1945E-06 1.7179 1 32.32 31.42 1.0287 1 0.34 0.38 0.9060
298 1 7.1208E-06 6.6945E-06 1.0637 1 178.21 161.45 1.1038 1 12.69 10.81 1.1741
!STD (n): 0.3965 1 0.1844 1 0.4414
!AVERAGE: 1.0957 1 0.9720 1 1.0634
. I
IX DEVIATION: 36.1911 18.97%1 41.51%1
222=2 2 2
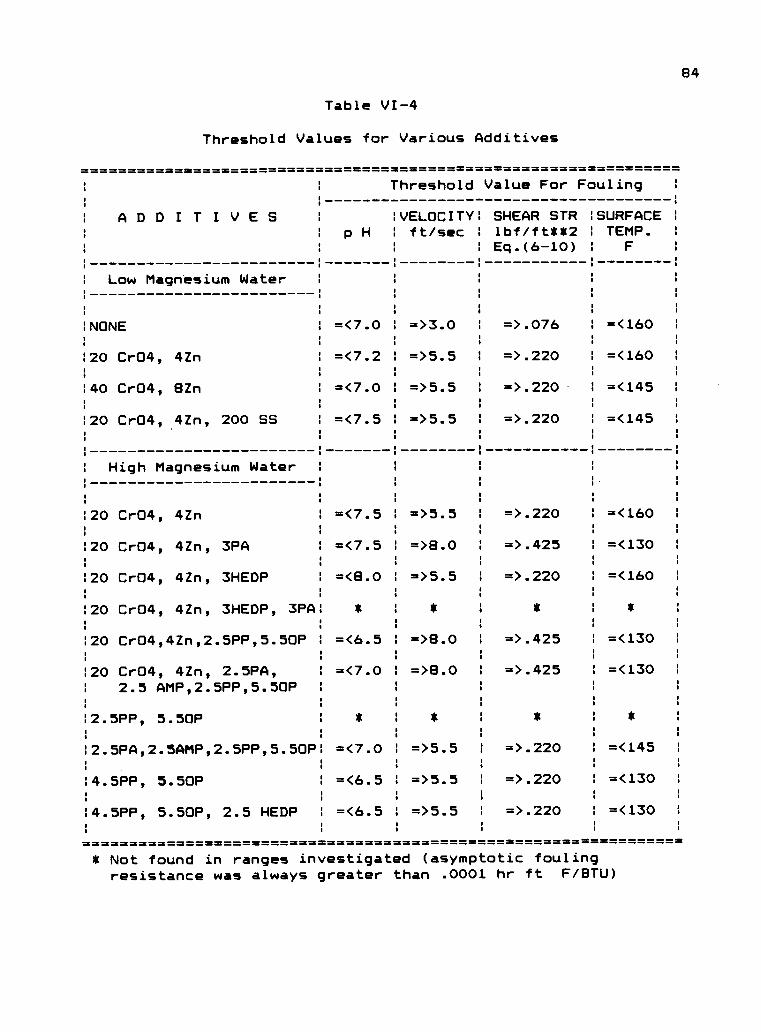
84
Table VI-4
Threshold Values for Various Additives
= = =
. Threshold Value For Fouling'
! :
ADDITIVES :VELOCITY: SHEAR STR !SURFACE :
.
. p H : ft/sec 1 lbf/ft**2 ! TEMP. :
. . .'
.
: Eq.(6-10) : F '
: Low Magnesium Water
:NONE : =<7.0 : =>3.0 : =>.076 1 =<160 1
1
.
. :
.
.
120 Cr04, 4Zn 1 =<7.2 : =>5.5 : =>.220 : =<160 !
. . . . .
:40 Cr04, 8Zn : =<7.0 : =>5.5 : =>.220 : =<145 :
:20 Cr04, 4Zn, 200 SS : =<7.5 ! =>5.5 : =>.220 I =<145 :
1
1 High Magnesium Water ! ! ! !
!
.
.
.
,
.
.
,:
!
.
, ..
. ..
:20 Cr04, 4Zn : =<7.5 : =>5.5 I =>.220 : =<160 1
.. .
. . . . .
:20 Cr04, 4Zn, 3PA 1 =<7.5 : =>8.0 : =>.425 : =<130 1
. . ,
. . 8 . .
:20 Cr04, 4Zn, 3HEDP : =<8.0 ! =>5.5 : =>.220 : =<160 1
1 ! : :
:20 Cr04, 4Zn, 3HEDP, 3PA! * * * *
:20 Cr04,4Zn,2.5PP,5.50P : =<6.5 I =>8.0 : =>.425 =<130 :
. . .
. . . . .
:20 Cr04, 4Zn, 2.5PA, : =<7.0 1 =>8.0 I =>.425 : =<130 :
. ' . .: 2.5 AMP,2.5PP,5.50P : ' .
.
. . , . .
i 1 i .I
. * ,
. *.
.:2.5PP, 5.50P : * : * .
.
.
1
.
.
:2.5PA,2.5AMP,2.5PP,5.50P: =<7.0 : =>5.5 : =>.220 I =<145 :
:4.5PP, 5.50P : =<6.5 : =>5.5 1 =>.220 : =<130 :
. , . . .
. . . .
:4.5PP, 5.50P, 2.5 HEDP ! =<6.5 : =>5.5 : =>.220 : =<130 :
* Not found in ranges investigated (asymptotic foulingresistance was always greater than .0001 hr ft F/8TU)
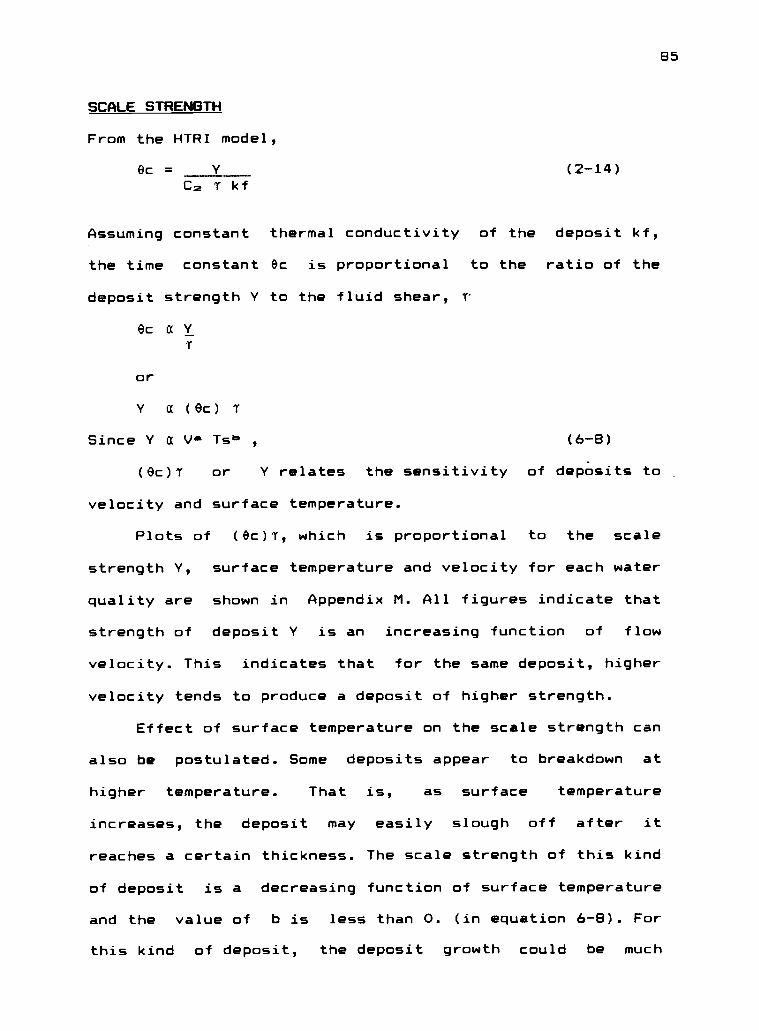
85
SCALE STRENGTH
From the HTRI model,
ec = Y (2-14)Cm r kf
Assuming constant thermal conductivity of the deposit kf,
the time constant ec is proportional to the ratio of the
deposit strength Y to the fluid shear, T.
ec a Y
or
Y a (Oc) I
Since Y a v.. Tsb , (6-8)
(0c)i or Y relates the sensitivity of deposits to
velocity and surface temperature.
Plots of (0c)i, which is proportional to the scale
strength Y, surface temperature and velocity for each water
quality are shown in Appendix M. All figures indicate that
strength of deposit Y is an increasing function of flow
velocity. This indicates that for the same deposit, higher
velocity tends to produce a deposit of higher strength.
Effect of surface temperature on the scale strength can
also be postulated. Some deposits appear to breakdown at
higher temperature. That is, as surface temperature
increases, the deposit may easily slough off after it
reaches a certain thickness. The scale strength of this kind
of deposit is a decreasing function of surface temperature
and the value of b is less than 0. (in equation 6-8). For
this kind of deposit, the deposit growth could be much
86
easier controlled by fluid shear (even low shear stress will
probably have good effect on removal of deposit). On the
other hand when b>0, solid encrutations may result as
surface temperature increases. It can be concluded from the
scale strength and deposit analysis, that even if the
deposits have similar composition, their strengths are
different as different additives are added or a different pH
is used. Thus the water quality appears to strongly
influence, the strength of the deposit and thus the fouling
process.
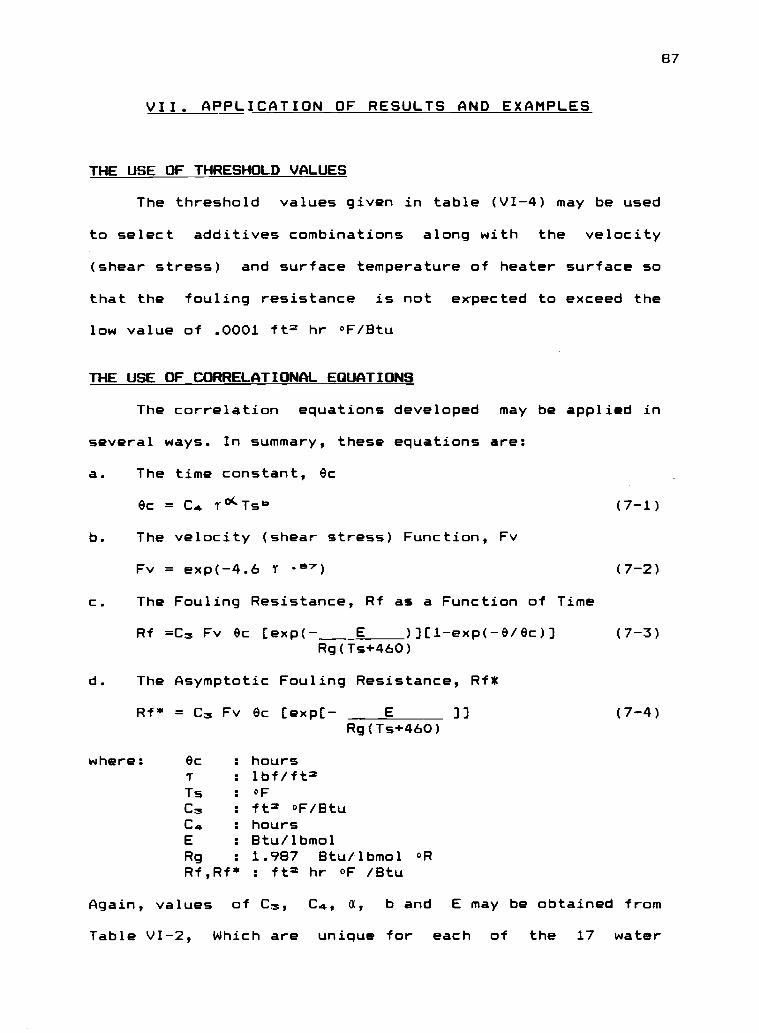
87
VII. APPLICATION OF RESULTS AND EXAMPLES
THE USE OF THRESHOLD VALUES
The threshold values given in table (VI-4) may be used
to select additives combinations along with the velocity
(shear stress) and surface temperature of heater surface so
that the fouling resistance is not expected to exceed the
low value of .0001 ft2 hr of /Btu
THE USE OF CORRELATIONAL EQUATIONS
The correlation equations developed may be applied in
several ways. In summary, these equations are:
a. The time constant, Oc
Oc = C4 1°(Tsb (7-1)
b. The velocity (shear stress) Function, Fv
Fv = exp(-4.6 T "v7) (7-2)
c. The Fouling Resistance, Rf as a Function of Time
Rf =C5 Fv ec [exp(- E )][1-exp(-0/0c)] (7-3)Rg(Ts+460)
d. The Asymptotic Fouling Resistance, Rf*
Rf* = C3 Fv Oc [exp[-Rg(Ts+460)
where: Oc : hours: lbf/ft2
Ts : of
C5 : ft2 0F/BtuC4 : hoursE : Btu/lbmolRg : 1.987 Btu/lbmol oRRf,Rf* : ft= hr of /Btu
(7-4)
Again, values of C5, C4, a, b and E may be obtained from
Table VI-2, Which are unique for each of the 17 water
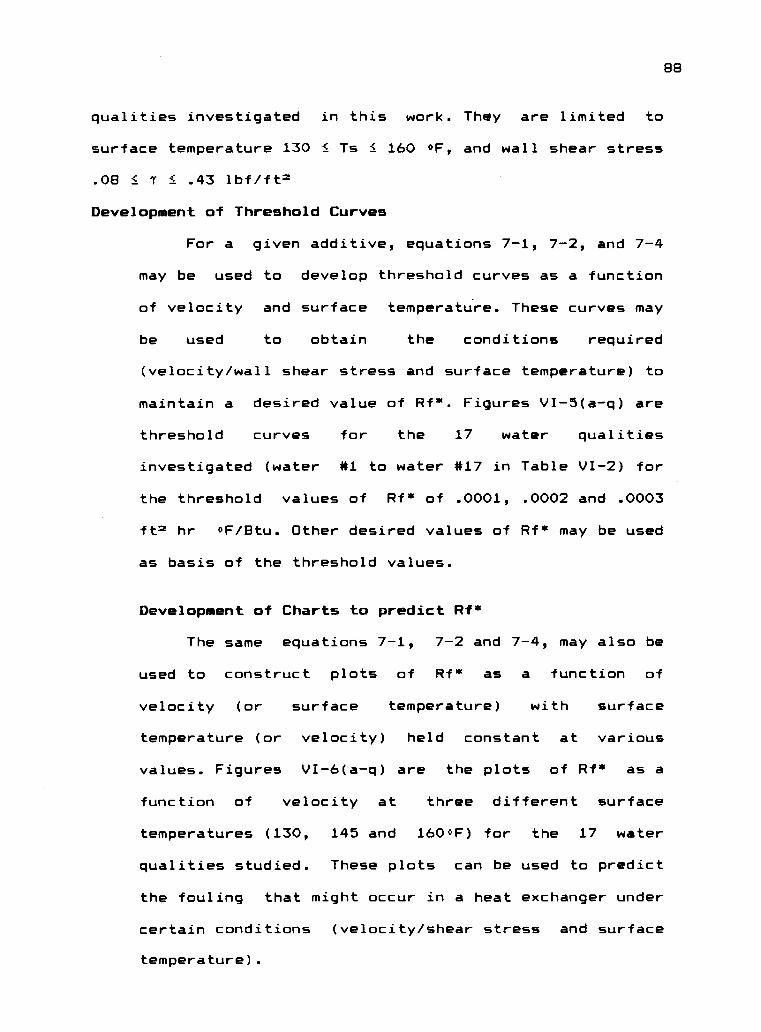
88
qualities investigated in this work. They are limited to
surface temperature 130 i Is 1 160 OF, and wall shear stress
.08 i 1 i .43 lbf/ft2
Development of Threshold Curves
For a given additive, equations 7-1, 7-2, and 7-4
may be used to develop threshold curves as a function
of velocity and surface temperature. These curves may
be used to obtain the conditions required
(velocity/wall shear stress and surface temperature) to
maintain a desired value of Rf*. Figures VI-5(a-q) are
threshold curves for the 17 water qualities
investigated (water #1 to water #17 in Table VI-2) for
the threshold values of Rf* of .0001, .0002 and .0003
ft2 hr oF/Eitu. Other desired values of Rf* may be used
as basis of the threshold values.
Development of Charts to predict Rf*
The same equations 7-1, 7-2 and 7-4, may also be
used to construct plots of Rf* as a function of
velocity (or surface temperature) with surface
temperature (or velocity) held constant at various
values. Figures VI-6(a-q) are the plots of Rf* as a
function of velocity at three different surface
temperatures (130, 145 and 160°F) for the 17 water
qualities studied. These plots can be used to predict
the fouling that might occur in a heat exchanger under
certain conditions (velocity/shear stress and surface
temperature).
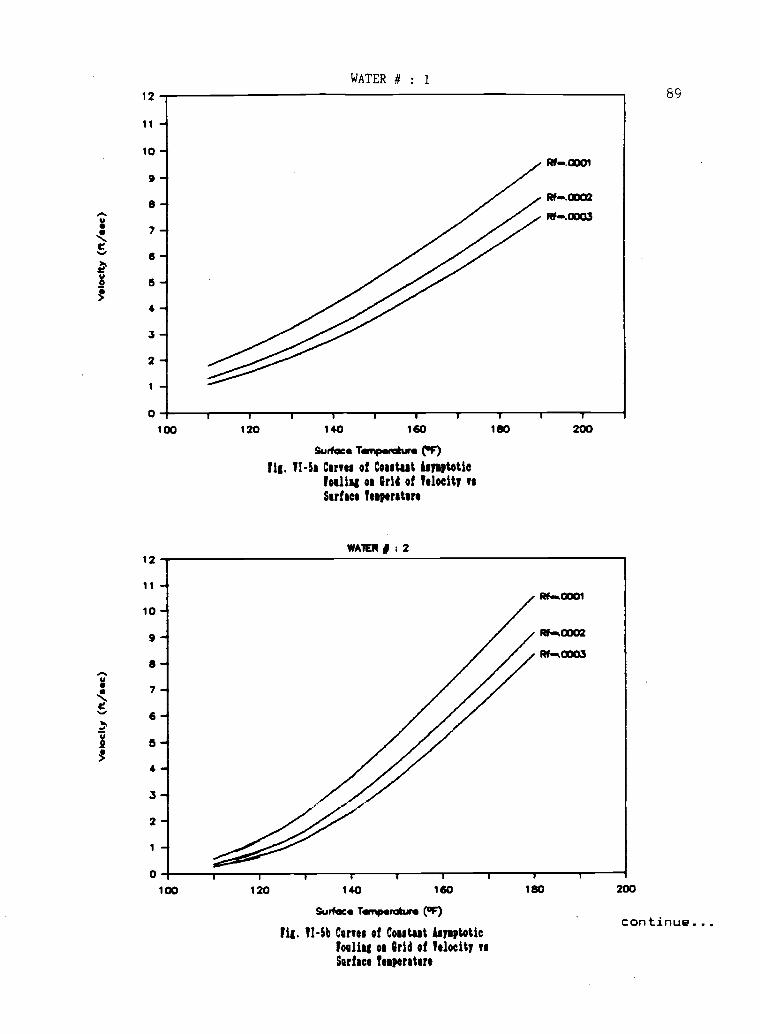
12
11-1
10 -1
9 -
8 -
7 -
6 -
a -4 -
3 -,
2 -
1 -
0 ,
WATER # : 1
Rf-.0001
Rf.0002
Rf..0003
100
12
11 -
10
9 -
8-7
6-6-4
4 -
3 -
2-1 -
r
1201
140 160
Surface Temperahre ('F)
[is. VI-58 Curves of Coutut bysptotiebelly os Grid of Veloeity vs
Surface ',operators
WA1ER # ; 2
180 200
0 r
Rf....0001
R1...0002
Rf.0003
100 120i I I I
140 160 180
Surface Temperature (°F)
!is. VI-51) Curves of Contact Isysptotic
/alias os Grid of Velocity vs
Surface Tesperatere
200
89
continue...
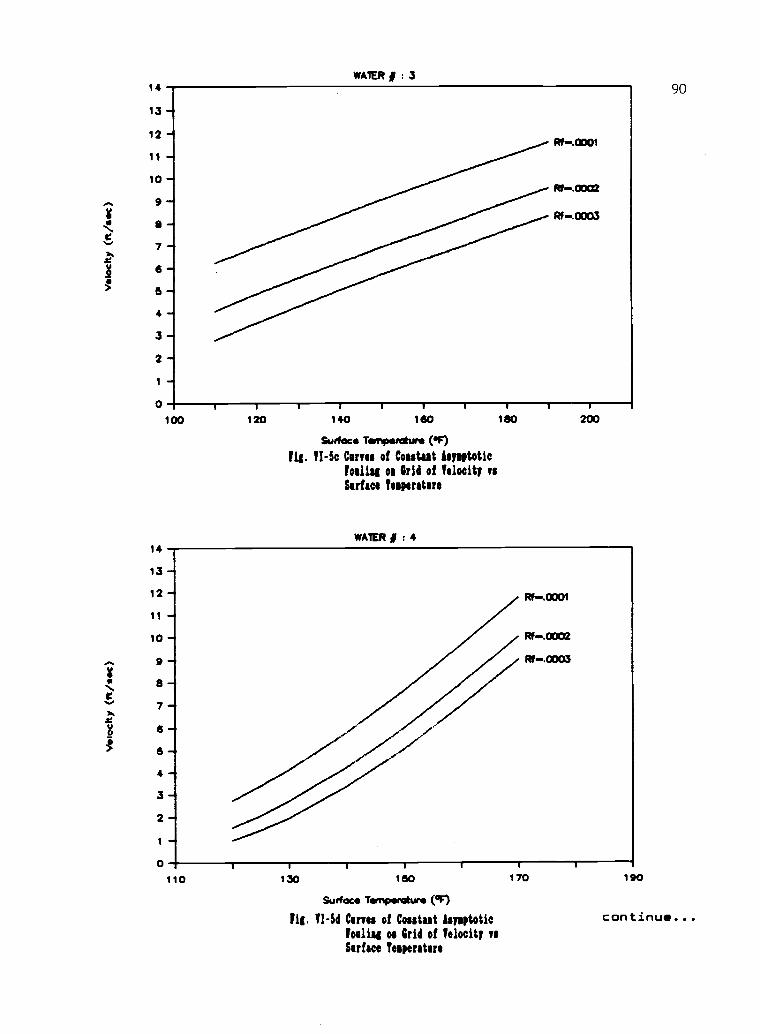
14
13
12-'11
10
9-4
a-7-6-
4-3-2-1-0
WATER # ; 3
Rf.0001
Rf...0002
Rf -.0003
100
14
13 -
12
11 -4
10
9 -*
a -
7 -.
6 -
4
3 -4
2 "4
0
120 140 160 160
Solace Temperature
fig. TI -Sc Carves of Contest Asymptotic
Tulin os Grid of Velocity vs
Striae* Tesperatere
WATER # : 4
200
Rf.0001
Rf...0002
Rf.0003
110 130 160
Surface Temperature (4F)
fig. VI-Sd Carves of Cosstast Isysptotic
[alias os Grid of Velocity vs
Surface Tesperatore
170 190
90
continue...
16
15
14
13
12
11
10
9
6
7
6
6
4
3
2
1
0
WA .9 # 6
15
14
13
12
11
10
9
8
7
6
a
120 140 160
Suffix* larponiture (PF)/4, 71-Se Cortes of Contort leysptetic
koalas of arid of Velocity to
Striae() feaperatore
WATER # s 6
180
140 150 160
Scorfince 74rripsookure (°F)
fig. 71-5f Coma of Coastast loyeptotic
ballot ot Grid of Velocity VV
Sorface Tesperators
170 160
continue...

14WATER 0 : 7
13 -
12 -
11
10
9 -0-
k7
6 -6-4
3-2-
0
110
24
22 -
20 -
19-
16 -
14 -
12 -
10-
130 180
Surface Times mituns (IF)
fig. VI-51 Curves of Coutut Isysptotic
/any os Grid of Velocity vs
Surface fesperatere
WATER # : 8
M.0001
W4002
Rf -.0003
170
92
190
6 -4
4-2-O
Rf.0001
Rf....0002R/...0003
100 120 140 160
Surfxs Temperature (pF)
fib. TI-Si Curves of Coastast Isysptotic
/alias os Grid of Velocity vs
Surface iesperatare
180
continue...
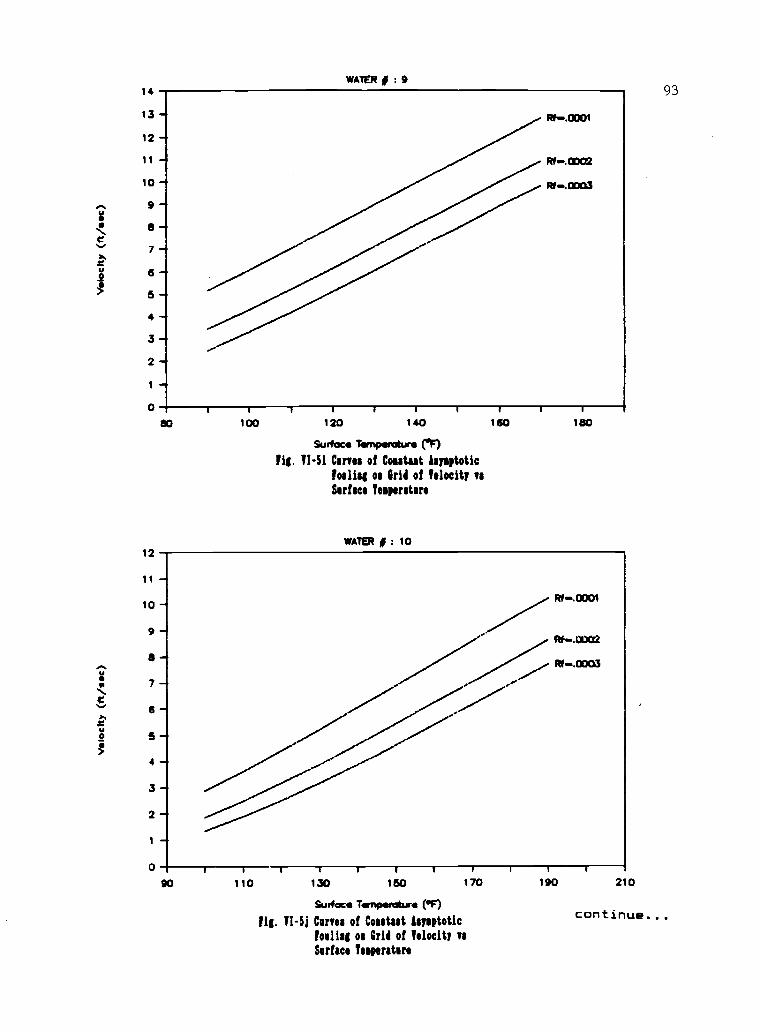
7
WATER 0 : 9
6
6
Rfr.. 0001
RI ..0002
Rf -.0003
80 100 120 140 160 180
Surface Temperature en
fig. VI-Si Curves of Contest Asymptotic
foellsg os Grid of Velocity vs
Serface Temperature
WATER 0 : 10
0
90I I I I t
110 130 160
Surface Temperature (°F)
fib. VI-53 Carves of Cosstast Asymptotic
follisg la Arid of Velocity vs
Surface Tesperatere
v I
170I I
190 210
93
continue...
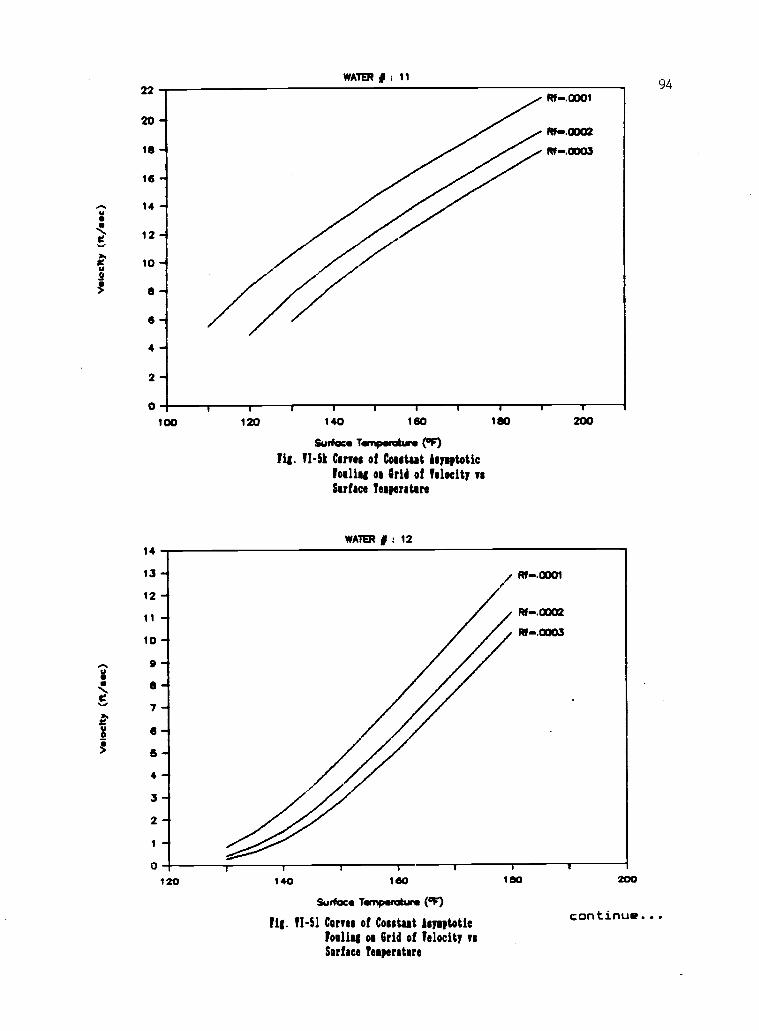
22
20-
19 -1
16 -/
14
12 -/
10
a-6-4-
2-0
WATER # : 11
Rf.0001
190002M0003
100
14
13-+
12
It10
9a7 -
6 "1
a -
4
3
2
1 "
0
120 140 160
Surface Torpoindhune (IF)
fig. 11-5k Curves of Cosstast Isysptotic
foslisg os Grid of Velocity vs
Surface Tesperature
WATER # : 12
190 200
Rf.0001
Rf.0002
Rf -.0003
120 140 160
Surface Tomponlhans (0F)
Fig. 11-51 Carves of Cosstast Isysptotic
Foully os Grid of Velocity vs
Surface Tesperatere
190 200
94
continue...
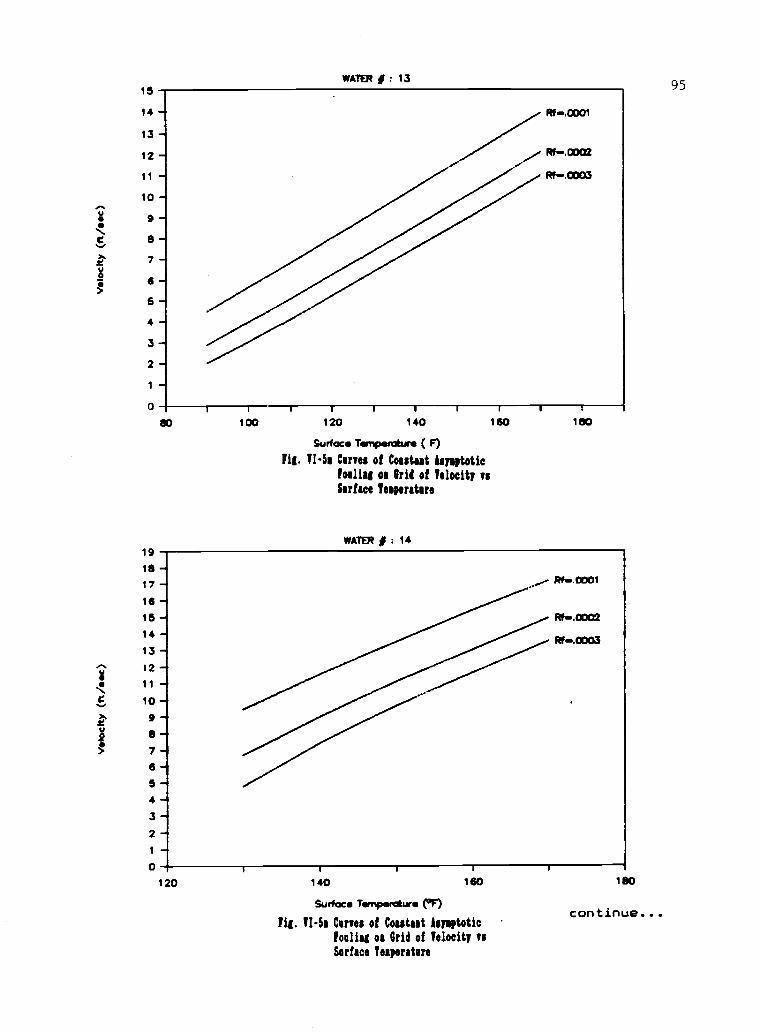
16WATER # : 13
14 Ftf..0001
12 -
13-4Rf.0002
11 -
10 -4
9 -8 -4
7
6-6-4
3 -4
2 -I
0 I I I I
80 100 120 140
19
18 -417
16-4
16 -4
14 -13 -12
re 11
1 0
9 -48 -47 -4
6 -45 -4
4 -4
3 -4
2
1 -4
0
120
Surface Temperature ( F)
fig. II-52 Carves of Coastaat isroptotic
[maim oc Grid of Velocity vs
Surface Imperatore
WATER # 14
160 180
I I
140 160
Surface Temperature (°F)
fig. II -Ss Carves of Coastaat Isloptotic
Podia' os Grid of Velocity vs
Surface Imperatore
180
continue...
95
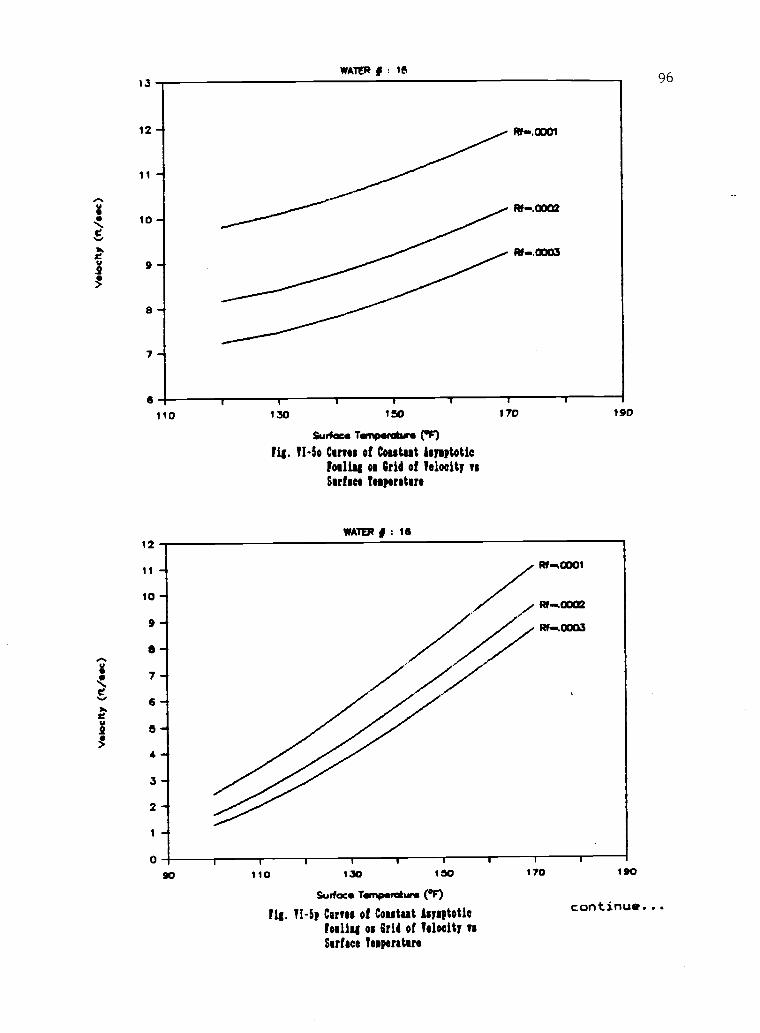
12
11 -
109-a
7 -
6
5-4
3-r
210
Surface Tempengure (°F)
[is. VI-So Carves of Coutut Isysptotic
follig of Grid of Velocity vs
Serfage Tesperstare
WATER # : 16
90 110r
130I
150
Surface TernpenAure (°F)
fib. VI-Sp Caves of Coutut isyaptotic
[maim os Grid of Velocity vs
Surface Temperature
I I
170 190
continue...
96
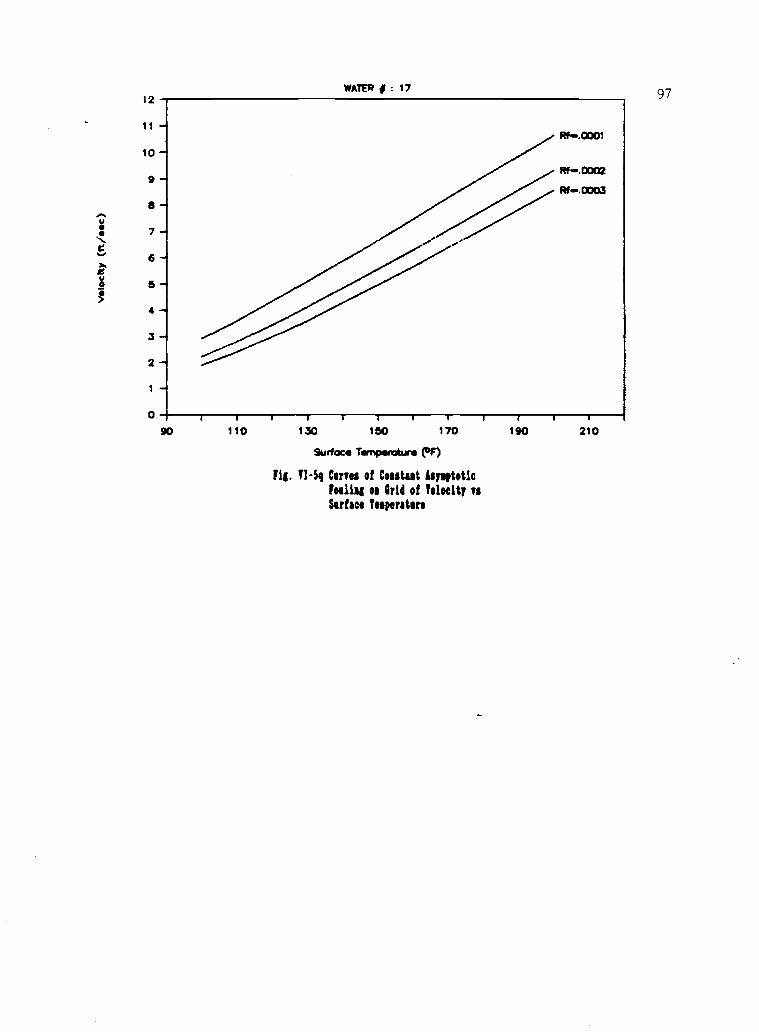
9-e7 -
654
3-21-'
0
WATER # 17
Rf...0001
Rf.0002Rf...001:13
90 110 130 150 170 190 210
Surface Temperature (0F)
!is. II-541 Carves of Coestaat Isysptotie
/albs os Grid of Velocity vs
Striae* Tesperattre
97
98
Development of Fouling Resistance Time Curves
Eqs.7-1 to 7-3 may be used to develop the fouling
resistance-time curves. The coefficient CzFvelc [exp(-
E/Rg(Ts+460))) in Eq.7-3 is equal to Rf*. Thus Eq.7-3
may be written in terms of Rf*,
Rf = Rf* (1-exp(-0/0c))
Once the time constant Oc and asymptotic fouling
resistance Rf* are determined from Eqs.7-1 and 7-4
respectively, the time required for the fouling to
reach a certain fraction of the asymptotic fouling
resistance can easily be determined. As mentioned
previously, the time constant is the time required for
Rf to reach a value of 637 of the value of Rf*. In
three time constant the fouling resistance is 95% of
the asymptotic fouling resistance.
0 = Ac Rf = .63 Rf*
= 3 ec , Rf = .45 Rf*
APPLICATION TO OTHER GEOMETRIES
The results obtained in this study may be applied to
flow in other geometries. Since the velocity used is the
velocity in the HTRI test section, the more fundamental
approach would be to use the wall fluid shear stress in
other geometries. The corresponding shear stresses in other
geometries should be used for comparable deposition
behavior. Figures VI-5(a-q) are threshold curves for the 17
99
water qualities investigated, each for the threshold values
of Rf* of .0001, .0002 and .0003 ft2 hr 0F/Htu. Other
desired value of Rf* may be used as a basis of the threshold
value.

0
N
18
17 -4
16-'15 -4
14
13
12
11 -t0 -9-8-7
6 - 146°F5 -4 -*3 -2 -- 130°F
1
0
1
WATER # ; 1
100
3 5
Vsk>cny (Vsec)
fig. VI-la Carves of Cosstast Surface ?superstore
oa Grid of Asymptotic loons*
lesistasce vs Velocity
7 9
fig. VI -Sb Ceres of Contest Surface iesperatare
oc Grid of Asymptotic fouling
lelistaace vs Velocity
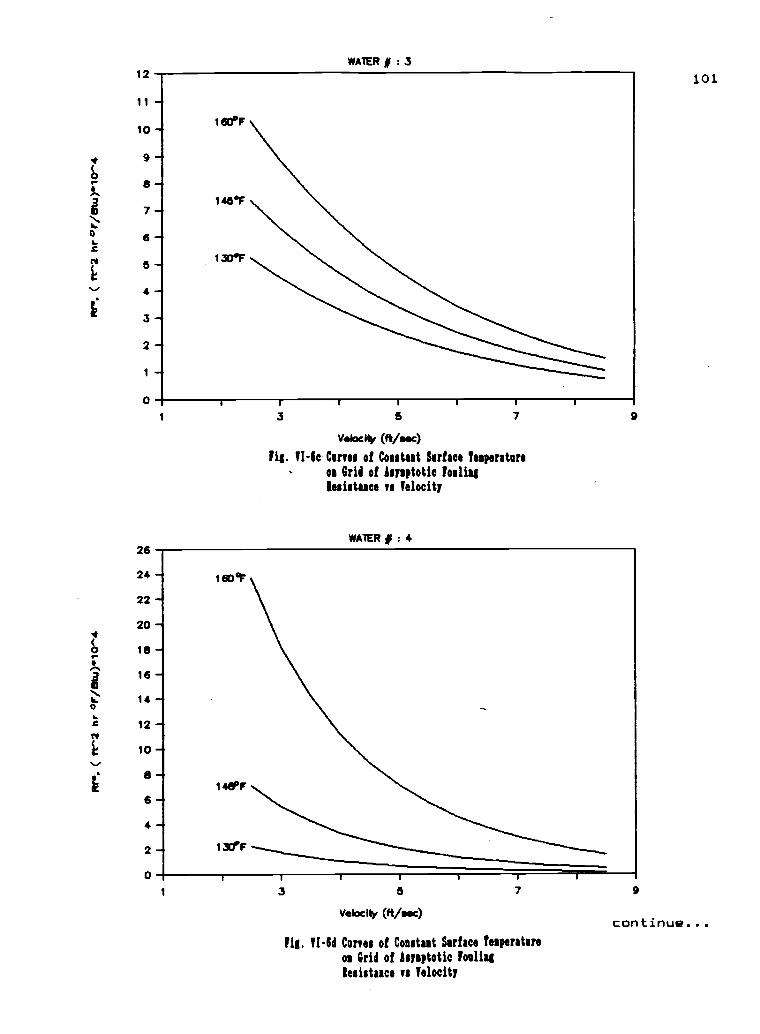
12
11 -
160°F10
9-A
8-3 146°F
6-I.c
5 -ft
I
0
.0
01
4 -I
3
2 -`
1 -
26
24 -
22
20 -1
18 -
16
14 -4
12
10-
8
4
2
0
1
WAlER # 3
3 5
Velocity (/t /sec)
fig. 11-10 Corm of Coutut Surface %operators
ol Grid of Asymptotic foelisg
Resistance vs Velocity
7
WAlER dr : 4
9
148°F
130°F
I I
3 5
Velocity (ft /Mc)
7 9
Aid. II-6d Curves of Contest Surface Temperature
os Grid of Asymptotic loons(
Resistssce vs Velocity
101
continue...
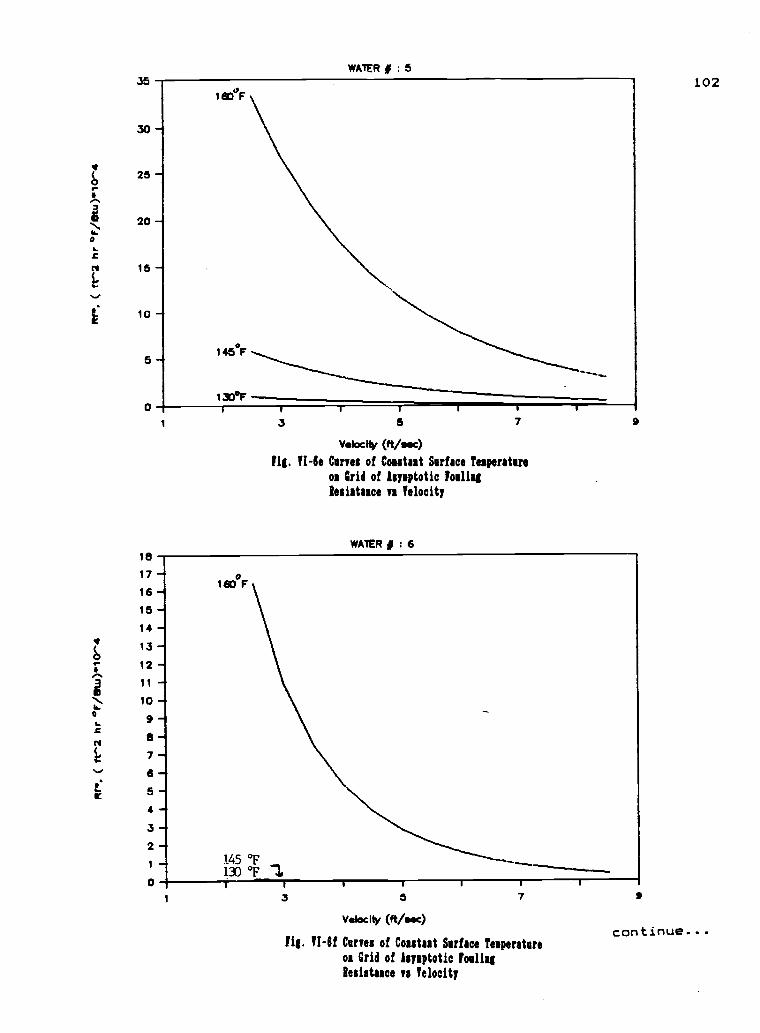
0
N
WATER I : 535
30
25-4
20
15
10--
5
0
1600F
145°F
130°F
3 5
Velocity (k /ow)
fig. VI-6e Curves of Contest ham Tesperatsre
os Grid of Isysptotic
lesistasce vs Velocity
7
WAlER # : 6
9
18
17160oF16 -
15 -IA -13
12
11
1 0 -
7 -8 -5 -
3 -2 -
1 4 5 °F
130 °F
102
3 5
Velocity (ft /eisc)
fig. VI-If Curves of Cosstast Surface Tesperatsre
os Grid of Imptotic hong
lesistasce vs Velocity
7 9
continue...
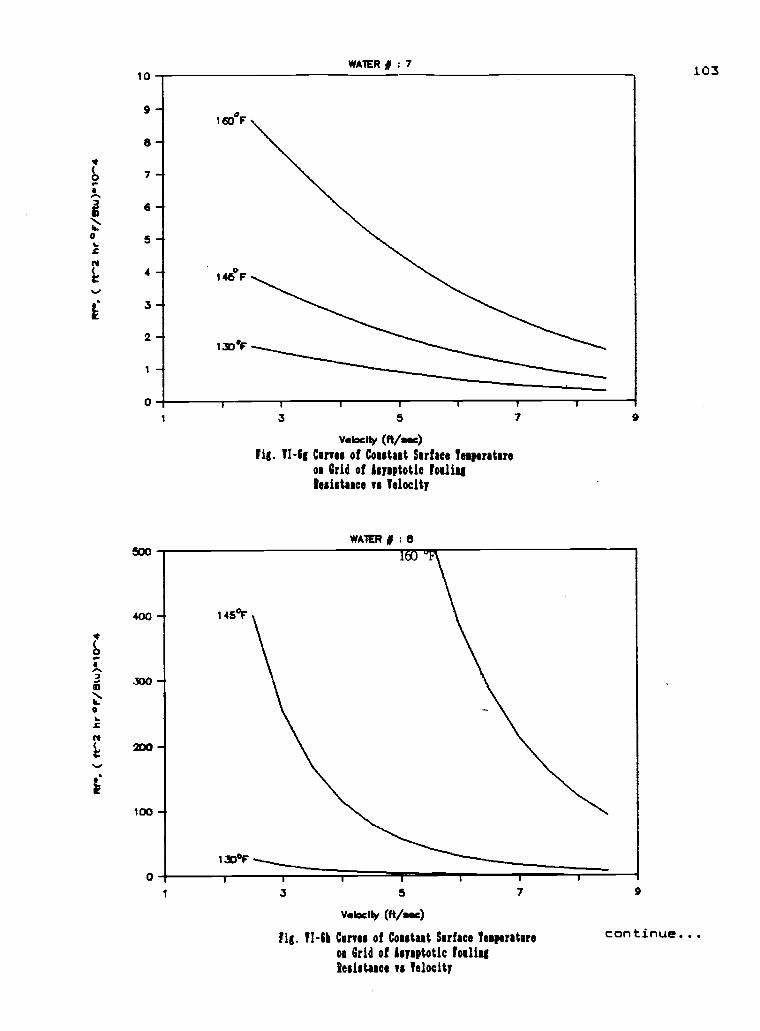
0
C4
10
9
0 -
7 -4
6
5-4
3
2 -
1 -
0
WATER # : 7
3 5
Velocity (fk/sec)
Fig. VI-6g Curves of Constant Surface Tesperature
on Grid of Isymptotic fooling
Resistance vs Velocity
WATER # : 8
7 9
400 145°F
100 -
0-130°F
160
3 5 7 9
Velocity (fl /roc)
Fig. VI-6! Curves of Constant Surface Temperature
on Grid of Isyiptotic fooling
Resistance vs Velocity
103
continue...
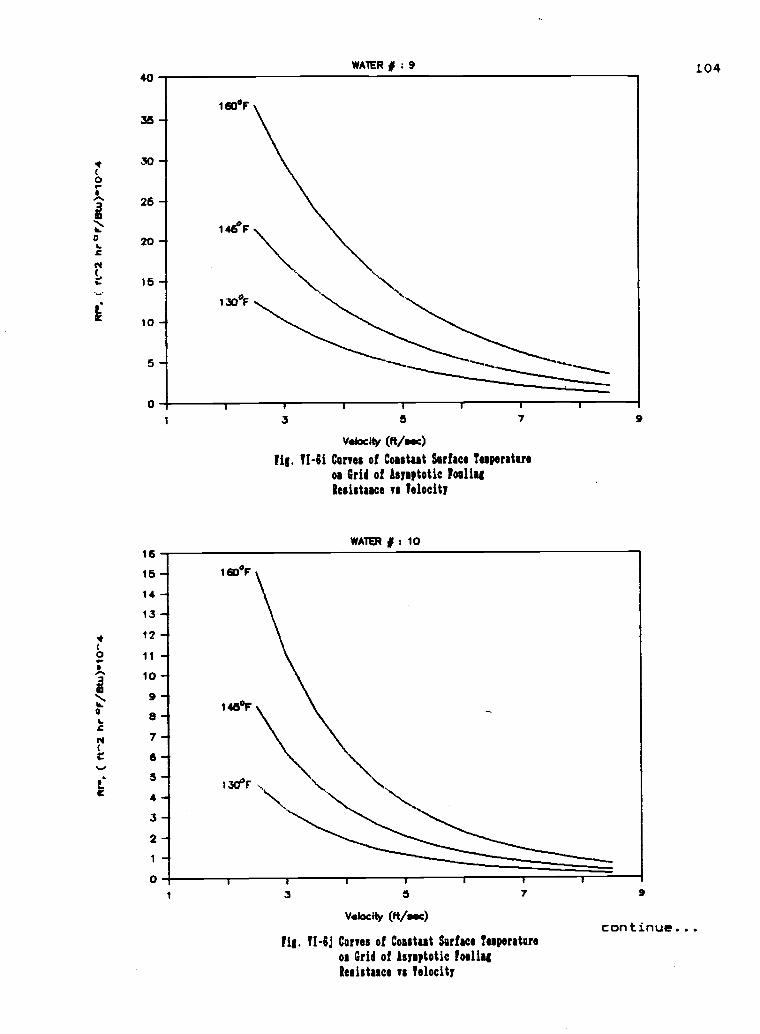
40
35
30-(0
iJb.
25
0 20.c
N
15
10
WATER 0 : 9
50
16
15 - 1613°F
14-4
13
12-11
10
9-8
7
is --
5
4 -4
3-2 -4
1 -
3 5 7
)4142city (ft /sec)
Fig. TI-6i Curves of Coasted Surface Tesperature
os Grid of loyoptotic holism
Resistalice vs Velocity
WATER # : 10
9
146°F
130°F
1 3 5 7 9
Velocity (k /ow)
Fig. TI-6j Curves of Coestut Surface Temperature
oa Grid of Isylptotic lollies
Resistisce vs Velocity
104
continue...
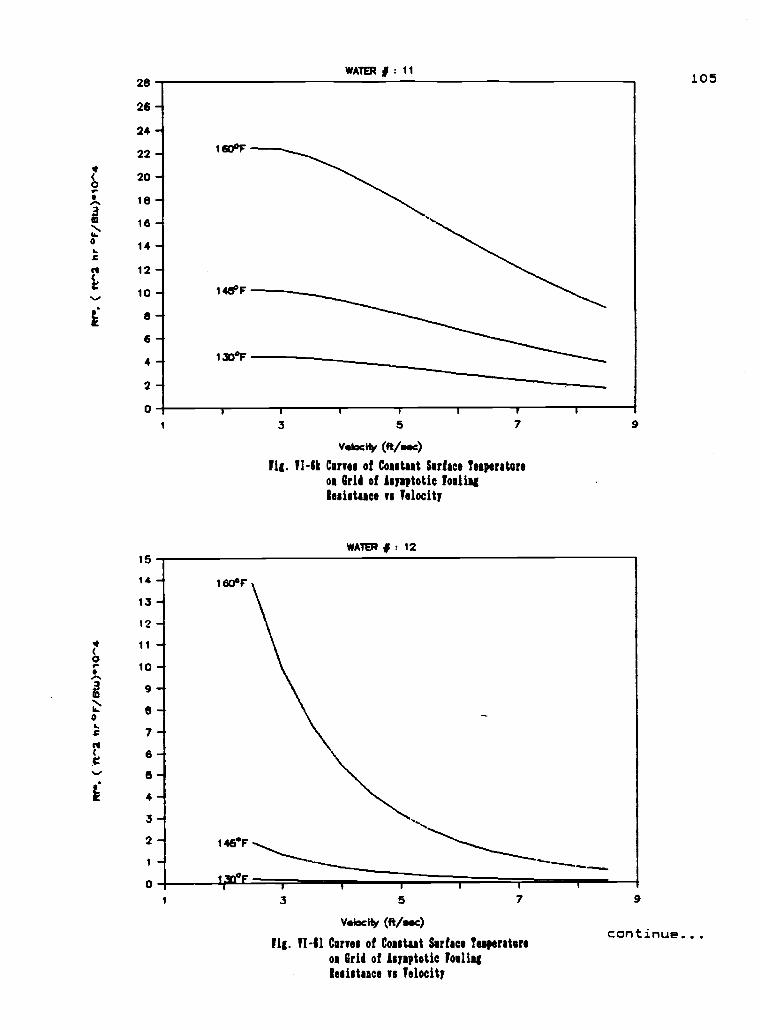
zeWATER 11
26
24
22
20
18
16
0 14 -4
r1 12
0, 10
8
6
4 -4
20
160°F
14EPF
130°F
1 3 5
15
14
13
12 -'
11
10-9-4
8
7
VeSocily (ft/sec)
fig. VI-It Carves of Contest Surface Temperature
°a Grid of Isylptotic folliag
Resistaace vs Velocity
WATER 12
9
7
6
5 -4
4
3 -4
2 -4
1
0
160°F
146°F
3 5
Velocity (ft/sec)
fig. VI-11 Curves of Contest Surface Yeaperatere
os Grid of isyaptotic Foglia*
Resistaace vs Velocity
7 9
105
continue...
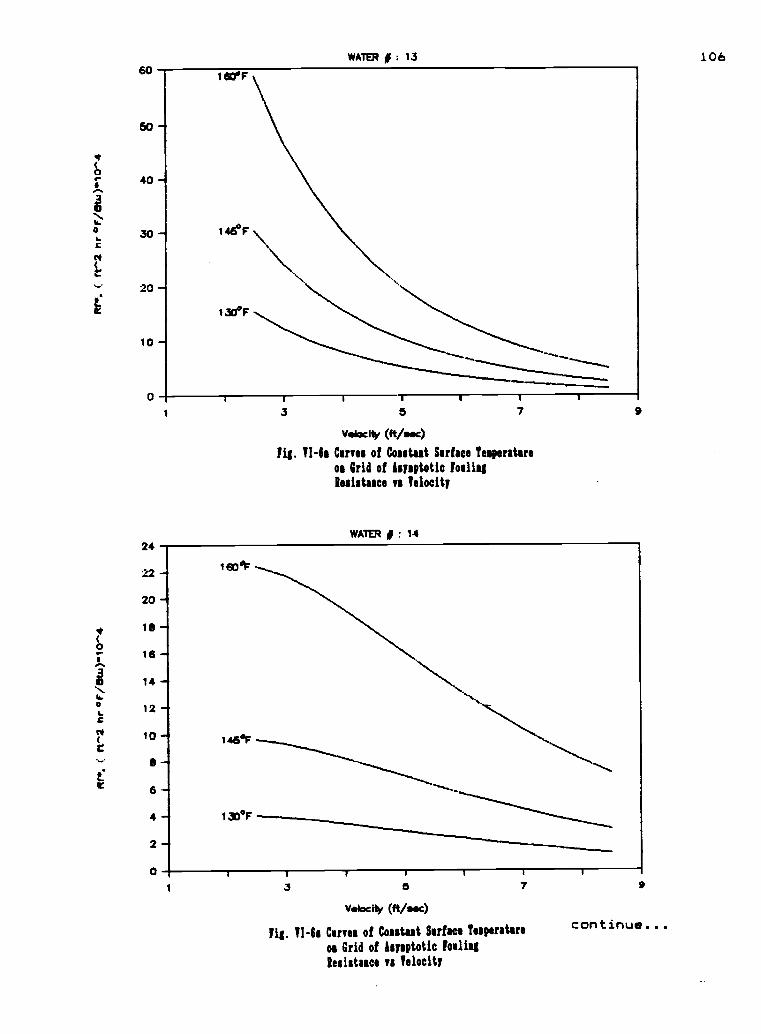
0
tr
60WATER 0 : 13
50 -1
40 -4
30
20
10-
0
24
160°F
130°F
3
Velocity (ft/mac)
7
flu. VI-le Curves of Coastatt Surface fesperatore
os Grid of isysptstic !minim
lesistaace vs Velocity
WATER # : 14
9
22 -
20 -
18
16-
14
12
10-4
ea*
146°F
6-
4 130'F
2
0
3 a 7
Velocity (ft /ow)
fig. VI-6s Curves of Cosstast Surface Tesperatore
os Grid of isyiptotic bong
teoistaace vs Velocity
9
continue...
106
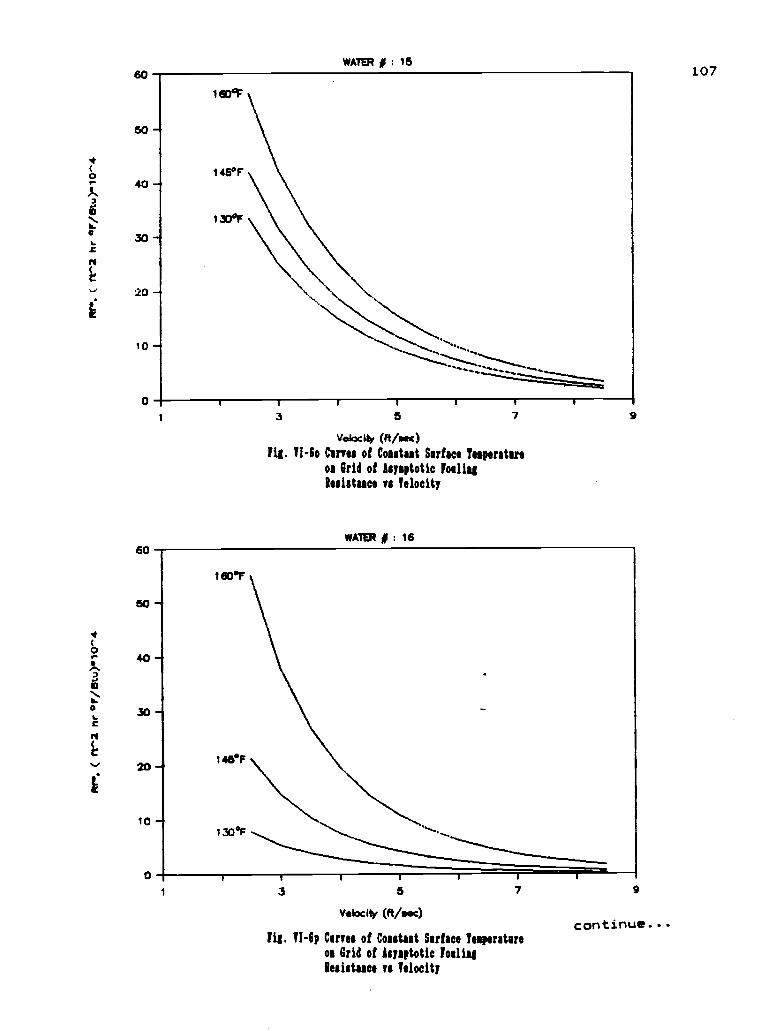
0
O
0
I
60
50
WATER 0 : 15
40
30
20
10-4
0
60
50
40
145°F
133°F
3 5 7 9
Velocity (fifeemc)
fig. 1I-6o Curves of Coestast Surface ?aspirators
om Grid of Isysptotic ?alias
Assistasce vs Velocity
WATER 0 : 16
30
20
10-4
0
160°F
146°F
130°F ss.
3 5 7 9
Velocity (ft /sec)
fig. VI -6p Carves of Contain Surface Tesperatire
oc Grid of Asymptotic foaling
lesistatce vs Velocity
continue...
107
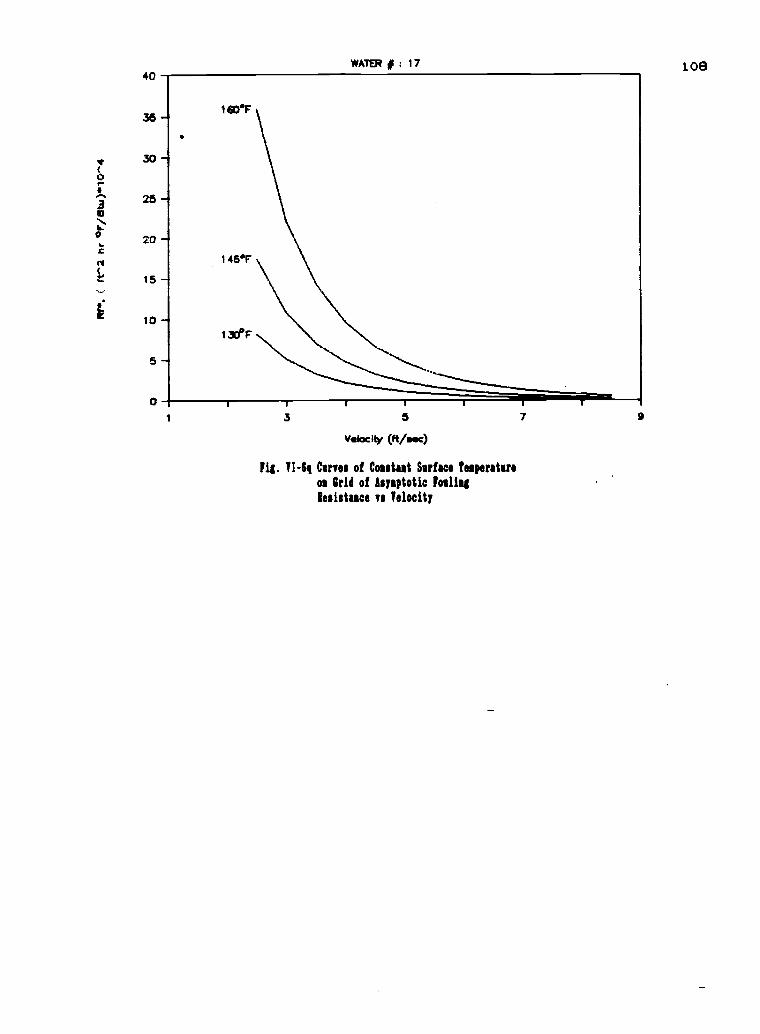
40
36
30
26-"
20
15
10
5
0
WATER # ; 17
160°F
145F
130°F
3 5
Vsloc Ity (ft /sec)
Fig. 1I-61 Cleves of Coldest Sadao %operators
oa Grid of Isyaptotic
Resistatce vs Velocity
7 9
1.08

109
NUMERICAL EXAMPLES
The use of threshold values
Consider water flowing in a 1 in I.D. tube at 1000F
with a wall surface temperature of 1450F. The high hardness
water contains the additive 2.5 ppm PP, 5.5 ppm OP, 2.5 ppm
AMP and 2.5 ppm PA. The pH is 7.0 (water no.12 in Table VI-
2). From Table VI-4, the wall shear stress should be greater
than .220 lbf/ft2, so that the fouling resistance would not
be greater than .0001 ft0 hr 0F/Btu after a long duration of
operation.
At a bulk temperature of 1000F for water:
f = 61.9 lbm/ft5
p = 4.6 x 10⁻⁴ ibm /ft sec
Determine velocity required to give wall shear stress of .22
lbf/ft2. Use Eq. 5-34:
.22 = (.0395) E(4.6)(10-m)72' (61.9)" p''5(32.17) (1/12)25
From which
V = 7.0 ft/sec
Determination of the Velocity-Surface Temperature Curve fora given value of Rf*
Water is flowing in a 0.75 inch I.D. smooth tube, at a
bulk temperature of 1000F. For both water No.1 (Table VI-2)
determine the relationship between velocity and surface
temperature so that the asymptotic fouling resistance would
not be expected to be greater than 0.0005 hr ft2 oF/Htu
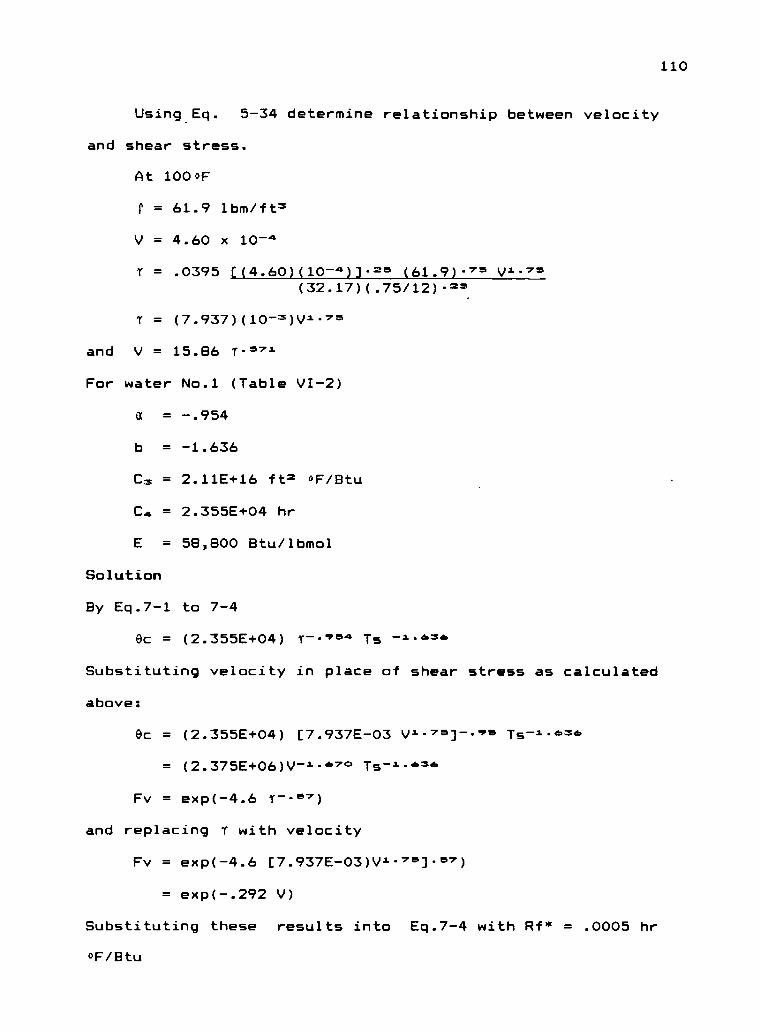
110
Using Eq. 5-34 determine relationship between velocity
and shear stress.
At 1000F
P = 61.9 lbm/ft5
V = 4.60 x 10⁻⁴
T = .0395 [(4.60)(10-4)]-25 (61.9)-75 V1-75(32.17)(.75/12)-2'
T = (7.937)(10-5)V2--75
and V = 15.86 T-571
For water No.1 (Table VI-2)
a = -.954
b = -1.636
Cm = 2.11E+16 ft2 of /Btu
= 2.355E+04 hr
E = 58,800 Btu/lbmol
Solution
By Eq.7-1 to 7-4
Oc = (2.355E+04) T--"P64 Ts --L.856
Substituting velocity in place of shear stress as calculated
above:
Oc = (2.355E+04) [7.937E-03 V2-.75]--*"5 Ts-1-454
= (2.375E+06)V-1 -67° Ts-1 -656
Fv = exp(-4.6 T--57)
and replacing T with velocity
Fv = exp(-4.6 [7.937E-03)W-75]-57)
= exp(-.292 V)
Substituting these results into Eq.7-4 with Rf* = .0005 hr
of /Btu
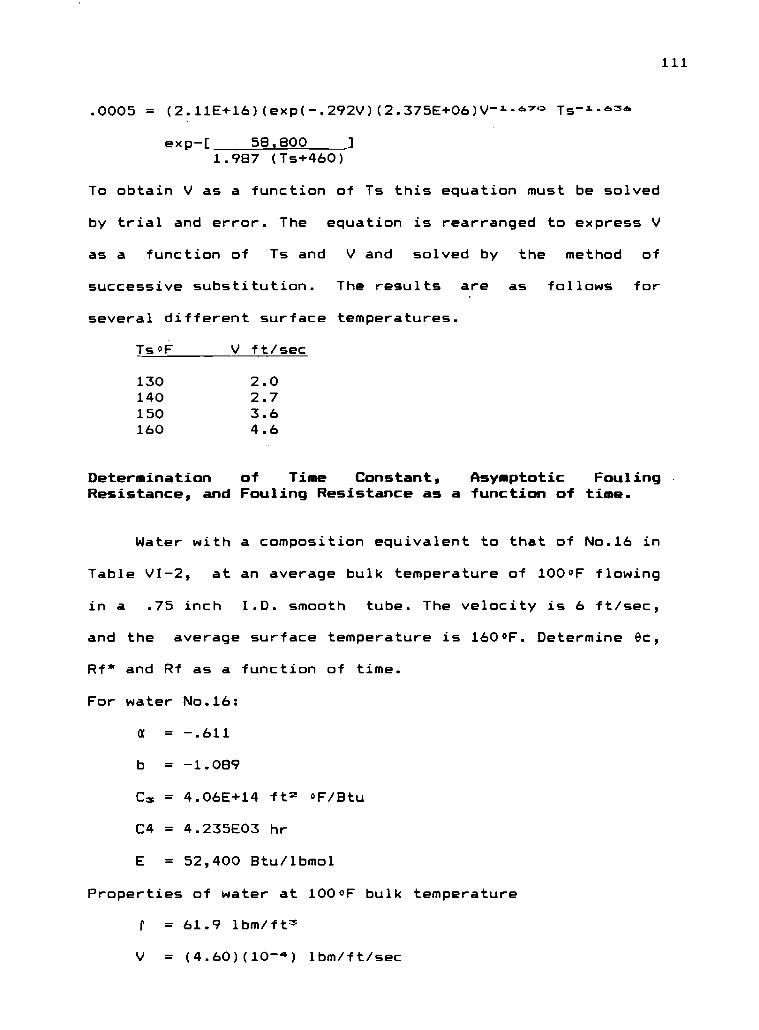
111
.0005 = (2.11E+16)(exp(-.292V)(2.375E+06)V-"*.7° Ts-"66
exp-[ 58,8001.987 (Ts+460)
To obtain V as a function of Ts this equation must be solved
by trial and error. The equation is rearranged to express V
as a function of Ts and V and solved by the method of
successive substitution. The results are as follows for
several different surface temperatures.
TsOF V ft/sec
130 2.0140 2.7150 3.6160 4.6
Determination of Time Constant, Asymptotic FoulingResistance, and Fouling Resistance as a function of time.
Water with a composition equivalent to that of No.16 in
Table VI-2, at an average bulk temperature of 1000F flowing
in a .75 inch I.D. smooth tube. The velocity is 6 ft/sec,
and the average surface temperature is 1600F. Determine Oc,
Rf* and Rf as a function of time.
For water No.16:
a = -.611
b = -1.089
C3 = 4.06E+14 ft 0F/Btu
C4 = 4.235E03 hr
E = 52,400 Btu/lbmol
Properties of water at 1000F bulk temperature
P = 61.9 lbm/ft
V = (4.60)(10-4) ibm /ft /sec
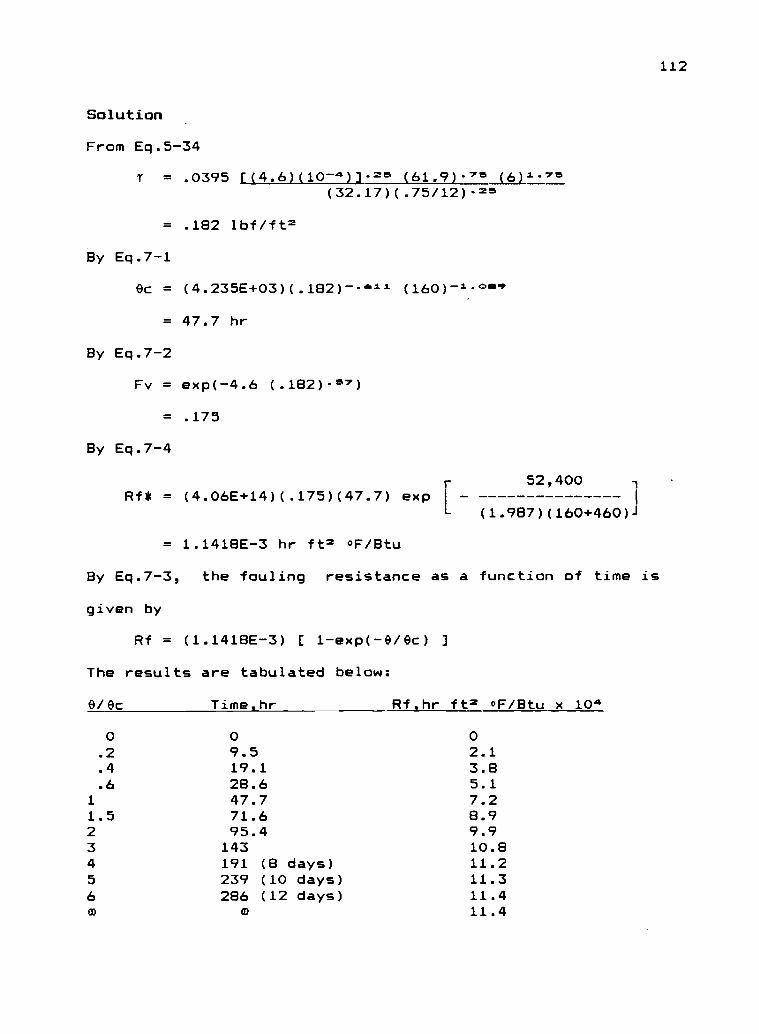
Solution
From Eq.5-34
T = .0395 [(4.6)(10-4)] =5 (61.9)-.7° (6)"7°(32.17)(.75/12)."
= .182 lbf/ft=
By Eq.7-1
Oc = (4.235E+03)(.182)-ail (160)-'
= 47.7 hr
By Eq.7-2
Fv = exp(-4.6 (.182)"")
= .175
By Eq.7-4
52,400Rf* = (4.06E+14)(.175)(47.7) exp
(1.987)(160+460)1
= 1.1418E-3 hr ft= oF/Eitu
By Eq.7-3, the fouling resistance as a function of time is
given by
Rf = (1.1418E-3) [ 1-exp(-0/$9c) ]
The results are tabulated below:
0/ ec Time,hr Rf,hr ft= oF/Htu x
0 0.2 9.5.4 19.1.6 28.6
1 47.71.5 71.62 95.43 1434 191 (85 239 (106 286 (12m m
02.13.85.17.28.99.910.8
days) 11.2days) 11.3days) 11.4
11.4
112
113
VIII SUMMARY AND CONCLUSIONS
SUMMARY
Zinc-chromate is the most common treatment used in the
past and is an effective corrosion inhibitor, but because of
its toxicity to the environment, it is being replaced by
phosphate inhibitors. In this study, both inhibitors were
tested with different additive combinations. The results
show that they could be used without significant fouling as
long as suitable flow conditions were maintained. However
some were found to be considerably more effective than
others. The pH, velocity (shear stress), and heater surface
temperature significantly influence the fouling
characteristics of the various additive combinations that
have been studied. High velocity (8 ft/sec), low surface
temperature (1300F) and low pH (6.0 to 7.0) are conditions
at which virtually no deposition occurred for any of the
additive combinations.
The water with no inhibitor deposited calcium carbonate
at pH of 8.6 but not at a pH of 7.0. The fouling
characteristics of water containing high magnesium hardness
with 20 ppm CrO4 and 4 ppm Zn is not significantly different
from the water which contained virtually no magnesium
hardness. With this additive combination, it was determined
that at a pH level of 7.2 to 7.5, there was minimum fouling
if velocity is maintained greater than 5.5 ft/sec and
surface temperature less than 1600F. For water with 40 ppm
114
Cr04, 8 ppm Zn, fouling occurred at pH of 7.0, but fouling
could be minimized at this pH level when velocity is
maintained greater than 5.5 ft/sec and surface temperature
maintained lower than 1450F. With zinc-chromate inhibitor,
the deposit was mainly zinc silicate.
The presence of suspended solid in water containing 20
ppm Cr04 and 4 ppm Zn appears to slightly increase the
tendency for fouling. At pH 7.5, fouling could be minimized
if velocity is greater than 5.5 ft/sec and surface
temperature lower than 1450F. No interaction was apparent
between the zinc silicate deposit and aluminum silicate
suspended solids.
For water containing 20 ppm Cr04, 4 ppm Zn and 3 ppm
polyacrylate, at pH of 6.5 deposition occurred at surface
temperature of 1600F and all velocities investigated.
Periodic sloughing off the deposit occurred during the runs
and the curves are virtually identical at all velocities. In
all cases when fouling resistance reached about .0003 to
.0004 ft hr oF/Eltu, the deposit is removed followed by a
sudden drop in fouling resistance to a value near zero. At
pH of 7.5, insignificant fouling would be expected as long
as velocity is greater than 8 ft/sec and surface temperature
is 1300F or lower. The deposit with this additive
combination was zinc and calcium silicate. The presence of
polyacrylate appears to increase the the amount of calcium
in the deposit relative to zinc.
115
For water with the additive of 20 ppm Cram, 4 ppm Zn,
and 3 ppm.HEDP, insignificant fouling could be expected at
pH of 8.0, velocity above 5.5 ft/sec and surface temperature
is 160°F or lower. The presence of HEDP appeared to have a
beneficial effect in terms of extending the pH and surface
temperature threshold and permitting to use of velocities
less than 8 ft/sec. With this additiv'es combination, the
major constituents of the deposit are calcium and zinc
phosphate with a minimum amount of silica present. The
presence of organic phosphate (HEDP) appears to favor the
deposition of phosphates rather than silicates.
When 20 ppm CrOm, 4 ppm Zn, 3 ppm HEDP and 3 ppm
polyacrylate were added into the water, significant fouling
occurred at pH of 6.5, surface temperature of 1600F and at
all velocities investigated. In all cases when a fouling
resistance reached a value of .0008 to .0009 ft2 hr OF /Btu,
sloughing of the deposit occurred and a sudden drop of
fouling was noted. Velocity appeared not to be a significant
parameter.
With the water containing 20 ppm CrOm, 4 ppm Zn, 2.5
ppm polyphosphate and 5.5 ppm orthophosphate insignificant
fouling would be expected at pH of 6.5, velocity of 8 ft/sec
and surface temperature of 1300F. In the pH range of 6.0 -
6.5, the addition of 2.5 ppm polyacrylate and 2.5 ppm AMP to
this water caused reduction in the fouling tendency.
For the water containing 20 ppm CrOm, 4 ppm Zn, 2.5 ppm
polyphosphate, 5.5 ppm orthophosphate, 2.5 ppm polyacrylate
116
and 2.5 ppm AMP, insignificant fouling could be expected at
pH of 7.0_or lower, velocity greater than 8 ft/sec, and
surface temperature lower than 1300F. The absence of zinc
chromate in this water resulted in less fouling, and
insignificant fouling could be expected at the same pH, but
at velocity greater than 5.5 ft/sec and surface temperature
lower than 1450F.
For zinc chromate inhibitors, the best additive
composition was 20 ppm CrO4, 4 ppm Zn, and 3 ppm HEDP.
The effect of discontinuing the addition of 2.5 ppm
polyacrylate and 2.5 ppm AMP in water containing 2.5 ppm
polyphosphate and 5.5 ppm orthophosphate was negligible and
the fouling rate behaves in much the same manner as when
polyacrylate and AMP were added to the water.
The effect of reducing pH 7.5 to 6.5 in water
containing 2.5 ppm polyphosphate and 5.5 ppm orthophosphate
resulted in a significant reduction in the fouling
resistance but not to the value of zero fouling resistance,
which indicates that this pH reduction caused the removal of
only some of the deposit.
For the additive combination of 2.5 ppm polyphosphate
and 2.5 ppm orthophosphate, little fouling was observed up
to pH of 7.5. However at pH of 8.0, extensive fouling
occurred and the deposit was removed periodically.
For water with 4.5 ppm polyphosphate and 5.5 ppm
orthophosphate, significant fouling occurred in the pH range
6.5 - 7.0 with greater fouling at the higher pH. For water
117
containing phosphate inhibitors at this level, insignificant
fouling could be expected at pH less than 6.5, velocity
greater than 5.5 ft/sec, and surface temperature lower than
1300F. When 3 ppm HEDP is added in addition to these
phosphate additives, at surface temperature of 1600F, the
presence of HEDP has no significant effect on the fouling
characteristics of water containing no HEDP. However at low
surface temperature (1300F), the presence of HEDP reduces
the fouling rate by about one half. When HEDP is present, a
longer time is taken to reach the asymptotic fouling
resistance.
Fouling of phosphate inhibitors was investigated on
four different heater surface materials: stainless steel,
carbon steel, 90/10 copper-nickel, and admiralty. No
significant difference was observed in the fouling rate on
these surfaces. The only difference noted was that during
the initial part of the tests, carbon steel always showed a
slightly greater initial deposition rate; but after this
initial period, the rate of fouling was virtually the same
as that on the other material surfaces.
The correlation of fouling data for seventeen different
water qualities using the HTRI model has provided parameters
which are specific for each water quality.
From this correlation, the asymptotic fouling
resistance as well as the fouling resistance-ime curve may
be predicted using the corresponding parameters for each
water quality. The correlation equation obtained for time
118
constant may used as a basis for determining the time
required for the fouling resistance reach a certain fraction
of the asymptotic fouling resistance.
Threshold curves developed for the seventeen different
water qualities may be used to select velocity/shear stress
and surface temperature of heater surface for each of those
water qualities, so that the fouling resistance is not
expected to be greater than some desired threshold value of
Rf*
Scale strength was found to be a strong function of not
only velocity/shear stress, but also surface temperature.
The results of this study can be applied to other
geometries, such as flow inside tubes, where the wall shear
stresses for flow inside tubes can be matched to those in
the annular test sections in which the tests were conducted.
In this study, under closely controlled conditions, the
fouling resistance obtained was in the absence of airborne
suspended solids, process leaks, biofouling, and corrosion.
Under field conditions, these factors may be contribute to
the fouling as well, Thus in the field the fouling
resistance may possibly have a higher value than that
obtained in the laboratory.
CONCLUSIONS
THE FOLLOWING SPECIFIC CONCLUSIONS ARE PRESENTED:
1. Velocity / shear stress, surface temperature and pH
significantly influence the fouling characteristics of
119
cooling tower water containing various additive
combinations.
2. It is possible to minimize fouling resulting from the
addition of corrosion inhibitors by maintaining certain
values of the controlling parameters.
3. Zinc chromate and phosphate inhibitors were tested with
different additives. Some were found to be considerably
more effective than others. Almost all could be use
successfully as long as the controlling parameters were
maintained at appropriate values.
4. High velocity (8 ft/sec), low surface temperature
(1300F) and low pH (6.0 - 7.0) are conditions at which
virtually no fouling occurs for any of the additive
combinations investigated.
5. For the zinc chromate inhibitor, the best additive
composition was 20 ppm Cr04, 4 ppm Zn, 3 ppm HEDP. It
could be expected to give Rf* < .0001 ft2 oF/Htu at V>=
5.5 ft/sec, TS =< 1600F, pH =< 8.0.
6. For the phosphate inhibitors at 4.5 ppm PP and 5.5 ppm
OP, Rf* < .0001 ft2 hr °F /Btu could be expected at V =>
3.0 ft/sec, TS =< 130 OF, pH =< 6.5.
7. Virtually no effect of the material of the heater
surface was observed with the exception of carbon steel
which exhibited slightly higher fouling rate at the
120
onset of a test, but the rate of fouling soon
approached to that for other materials.
8. The H.T.R.I. (Heat Transfer Research, Inc.)
deposition/removal fouling model correlates the fouling
data for 17 different water qualities. Thus, given
surface temperature (Ts) and shear stress (1), then
time constant (0c), asymptotic fouling resistance (Rf*)
and fouling resistance as a function of time (Rf=f(0))
may be calculated for a specific water quality.
121
BIBLIOGRAPHY
1. American Public Health Association, The AmericanWaterworks Association and the Water PollutionControl Federation. "Standard Methods for theExamination of Water and Wastewater". 14th Ed.Boyd Printing Co., Albany, New York (1975).
2. Boies, D.B., Levin, J.E., Baratz, B. "Technical andEconomic Evaluation of Cooling Systems BlowdownControl Techniques". Environmental ProtectionTechnology Series, EPA-660/2-73-026, November(1973).
3. Bott, T.R., Walker, R.A. "Fouling in Heat TransferEquipment". The Chemical Engineer, pp. 391-395,November (1971).
4. Charaklis, W.G. "Microbial Fouling". Proceedings of anInternational Conference on Fouling of HeatTransfer Equipment. E.F.C. Somerscales and J.G.Knudsen editors. Hemisphere Publishing Corp., NewYork, p. 251 (1981).
5. Fischer, P, Suitor, J.N., Ritter, R.B. "FoulingMeasurement Techniques". Chemical EngineeringProgress, Vol. 71, No. 7, pp. 66-72, July (1975).
6. Gudmundsson, J.S. "Particulate Fouling". Proceeding ofan International Conference of Fouling of HeatTransfer Equipment. E.F.C. Somerscales and J.G.Knudsen editors. Hemisphere Publishing Corp., NewYork, (1981).
7. Hasson, D., Avriel, M., Resnick, W., Rozeman, T. andWindriech, S. "mechanism of Calcium CarbonateScale Deposition on Heat Transfer Surfaces".Industrial and Engineering Chemistry Fundamentals,Vol.7, pp. 59-65, (1968).
8. Hasson, D. "Precipitation Fouling". Proceeding of anInternational Conference of Fouling of HeatTransfer Equipment. E.F.C. Somerscales and J.G.Knudsen editors. Hemisphere Publishing Corp., NewYork, p. 527, (1981).
9. Kern, D.Q., Seaton, R.E. "A Theoretical Analysis ofThermal Surface Conference". Chicago, Ill., Vol.1,p. 170, August (1966).
122
10. Kern, D.Q., Seaton, R.E. "Surface Fouling How toCalculate Limits". Chemical Engineering Progress,Vol.55, pp. 71-73, June (1959).
11. Knudsen, J.G. "Apparatus and Techniques for Measurementof Fouling of Heat Transfer Surfaces". in Foulingof Heat Transfer Equipment, Somerscales, E.F.C.and Knudsen, J.G., eds., Hemisphere PublishingCorp., New York, pp. 57-81, (1981).
12. Knudsen, J.G. "Drew Principles of Industrial WaterTreatment". Drew Chemical Corporation, New Jersey,6th ed. (1983).
13. Knudsen, J.G., Katz, D.L. "Fluid Dynamics and HeatTransfer". Robert E Krieger Publishing Co. NewYork (1979).
14. Knudsen, J.G. "The Effect of Corrosion Inhibitors onthe Fouling Characteristics of Cooling TowerWater". Progress Report to Heat Transfer Research,Inc., No.1, July 1983, No.2, January 1984, No.3,July 1984, No.4, January 1985, No.5, July 1985,No.6, January, 1986. Department of ChemicalEngineering, Oregon State University, Corvallis,Oregon 97331.
15. Knudsen J.G., Santoso, E., Du-qi, Xu "The Effect ofZinc Chromate Corrosion Inhibitors on the FoulingCharacteristics of Cooling Tower Water". AICHESymposium Series, Vol. 80, No. 236 (1984).
16. Knudsen J.G., Santoso, E., Du-qi, Xu "The Effect ofCorrosion Inhibitors on the FoulingCharacteristics of Cooling Tower Water". Paperno.134, presented at Corrosion 85, NationalAssociation of Corrosion Engineers, Boston, Mass.,March 1985.
17. Knudsen J.G., Santoso, E., Breske, T.C., Chenoweth,J.M., Donohue, J.A. "The Effect of CorrosionInhibitors on the Fouling Characteristics ofCooling Tower Water". paper presented at the 8thInternational Heat Transfer Conference, SanFrancisco, August 1986.
18. Knudsen J.G., Santoso, E., Breske, T.C., Donohue, J.M.,Chenoweth, J.M. "Fouling Characteristics ofCooling Tower Water Containing Phosphate CorrosionInhibitors". paper presented at 2nd ASME JSMEThermal Engineering Joint Conference, Honolulu,March 1987.
123
19. Lee, S.H., Knudsen, J.G. "Scaling Characteristics ofCooling Tower Water". ASHRAE Transactions, Vol.85,Part 2, No.2528, pp. 281-302 (1979).
20. Morse, R.W., Knudsen, J.G. "Effect of Alkalinity on theScaling of Simulated Cooling Tower Water". Vol.55, pp. 272-278 (1977).
21. Nathan, C.C., Donohue, J.M. "Causes and Prevention ofWater-Side Fouling in Industrial Heat ExchangeEquipment". paper for presentation at HeatTransfer Research, Inc., Boulder, Colorado, July(1974).
22. Puchorius, P.R. "Controlling Deposits in Cooling WaterSystems Material Performance". Vol. 11, No. 11,pp. 19-22, November (1972).
23. Reitzer, B.J. "Rate of Scale Formation in Tubular HeatExchangers". Industrial and Engineering ChemistryProcess Design and Development, Vol. 3, pp. 345-348 (1964).
24. Story, M.K. "Surface Temperature Effects on FoulingCharacteristics of Cooling Tower Water". AICHESymposium Series No. 174, Vol. 74, pp. 25-29(1978).
25. Suitor, J.W., Marner, W. J., Ritter, R. B. "The Historyand Status of Research in Fouling of HeatExchangers in Cooling Water Service". Presented atthe 16th National Heat Transfer Conference, August1976.
26. Taborek, J., Aoki, T., Ritter, R.B., Palen, J. W.,Knudsen, J.G. "Fouling The major UnresolvedProblem in Heat Transfer". Chemical EngineeringProgress, Vol. 68, pp. 59-67, February (1972), andVol. 68, pp. 69-78, July (1972).
27. Watkinson, A.P. and Epstein, N. "Fouling in a Gas OilHeat Exchanger". Chemical Engineering SymposiumSeries, Vol. 65, (1969).
28. Watkinson, A.P., Martinez, 0. "Scaling of HeatExchangers by Calcium Carbonate". ASME Journal ofHeat Transfer, Vol. 97, pp. 504-508 (1975).
APPENDICES
124
APPENDIX A
NOMENCLATURE
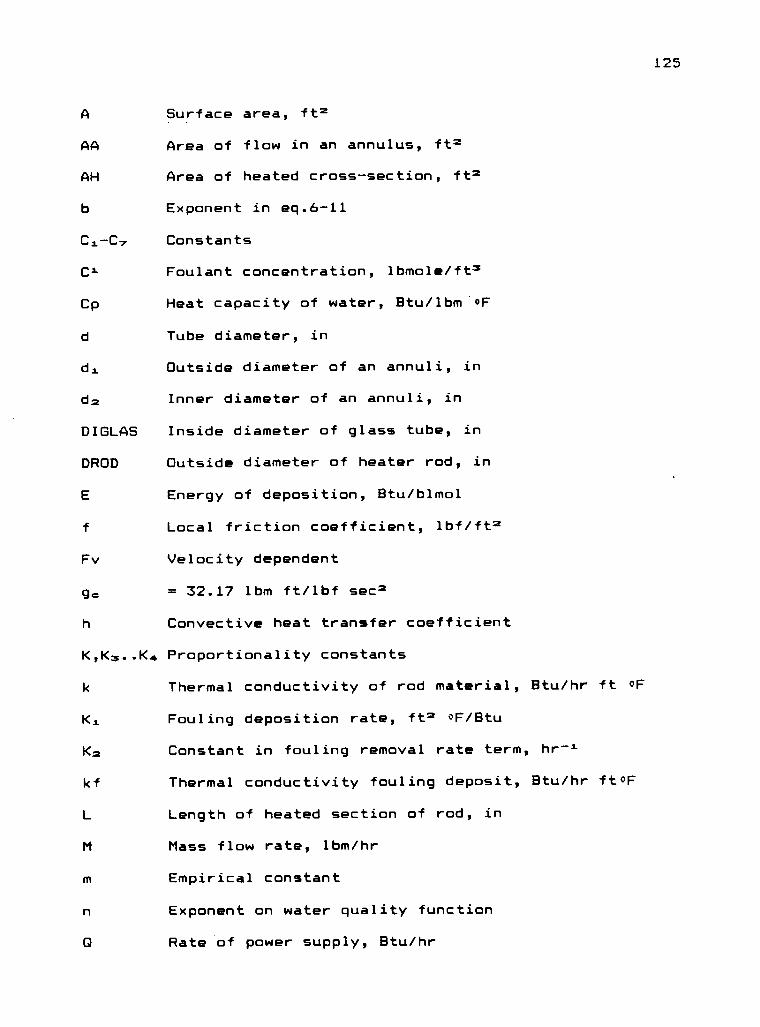
A Surface area, ft2
AA Area of flow in an annulus, ft2
AH Area of heated cross-section, ft2
b Exponent in eq.6-11
C1 -C, Constants
Foulant concentration, lbmole/ft3
Cp Heat capacity of water, Btu/lbm'oF
d Tube diameter, in
dl Outside diameter of an annuli, in
dm Inner diameter of an annuli, in
DIGLAS Inside diameter of glass tube, in
DROD Outside diameter of heater rod, in
E Energy of deposition, Btu/blmol
f Local friction coefficient, lbf/ft2
Fv Velocity dependent
g= = 32.17 lbm ft/lbf sect
h Convective heat transfer coefficient
K,Km..K4 Proportionality constants
k
K
Km
kf
L
M
m
n
0
Thermal conductivity of rod material, Btu/hr ft of
Fouling deposition rate, ft2 of /Btu
Constant in fouling removal rate term, hr-1
Thermal conductivity fouling deposit, Btu/hr ft0F
Length of heated section of rod, in
Mass flow rate, lbm/hr
Empirical constant
Exponent on water quality function
Rate of power supply, Btu/hr
125

126
Omv Power transducer reading, millivolts
r2 Correlation coefficient
R Heat transfer resistance, ft2 hr OF /Btu
Re Reynolds number
Rf Fouling resistance, ft2 hr OF /Btu
Rfi Fouling resistance of it' point, ft2 hr OF /Btu
(Rf), Final fouling resistance, ft2hr OF /Btu
Rf* Asymptotic fouling resistance, ft2 hr 0F/Btu
Rg Universal gas constant, Btu/lbmol oR
SS Sum of squares deviations
Temperature, OF
Tb Local bulk water temperature, OF
Tc Wall thermocouple temperature, OF
Tin Inlet bulk water temperature, °F
Tmv Temperature, millivolts
Is Temperature of fouling deposit surface, OF
Tw Wall temperature, OF
U Overall heat transfer coefficient, Btu/hr ft°
Fluid velocity, ft/sec
W Mass flow rate, lbm/hr
WF Volumetric flowrate, gpm
Wmv Flow transducer, millivolts
xf Instantaneous fouling deposit thickness, in
x/k Thermal resistance of tube wall, ft2 hr 0F/Btu
Variables defined in section V
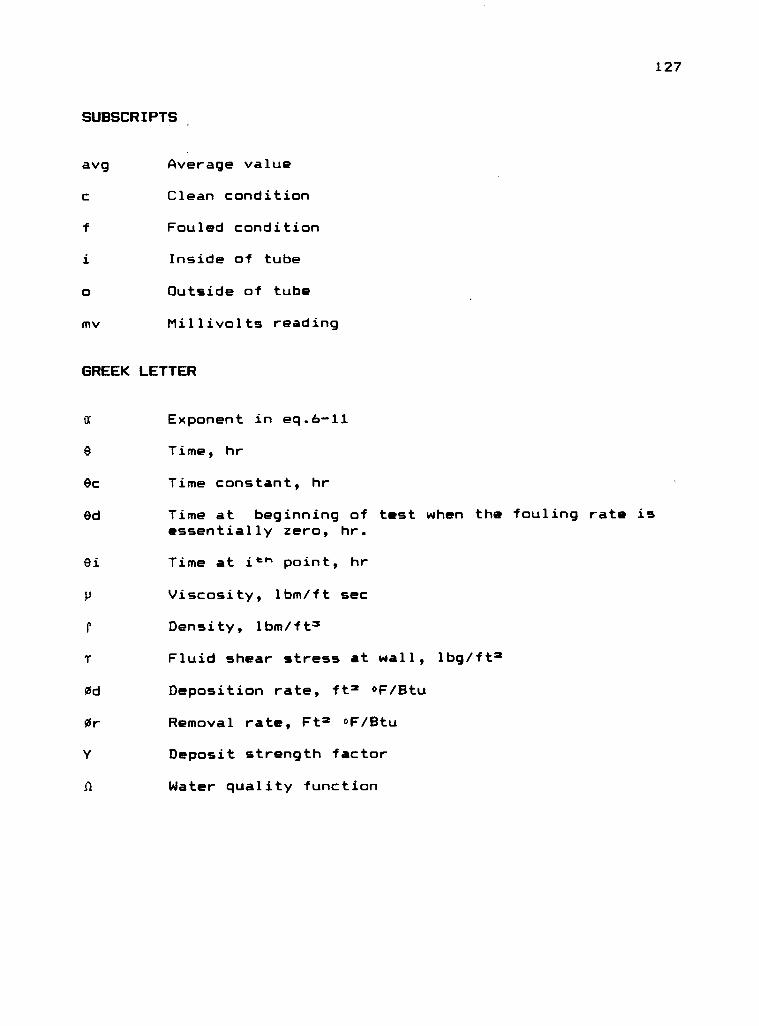
127
SUBSCRIPTS
avg Average value
c Clean condition
f Fouled condition
i Inside of tube
o Outside of tube
my Millivolts reading
GREEK LETTER
a Exponent in eq.6-11
0 Time, hr
ec Time constant, hr
Od Time at beginning of test when the fouling rate isessentially zero, hr.
Oi Time at its point, hr
p Viscosity, lbm/ft sec
P Density, lbm/ft
T Fluid shear stress at wall, lbg/ft2
Od Deposition rate, ft OF /Btu
Or Removal rate, Ft OF /Btu
Y Deposit strength factor
n Water quality function
128
APPENDIX B
CALIBRATION EQUATIONS
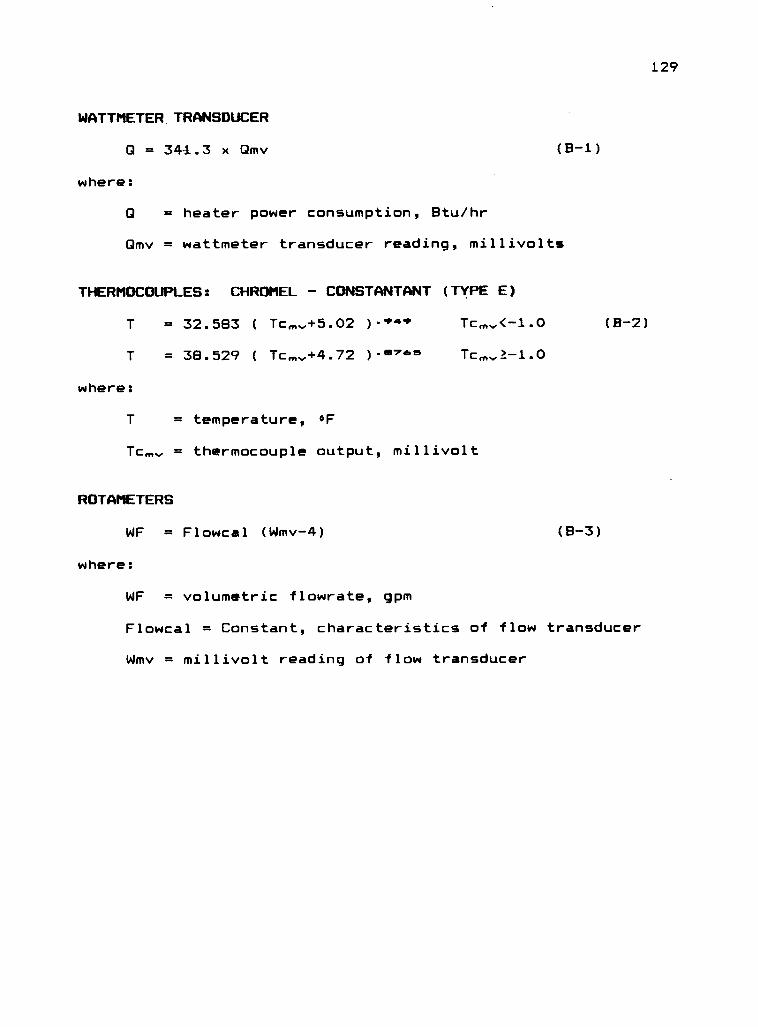
129
WATTMETER. TRANSDUCER
0 = 341.3 x Omv
where:
0 = heater power consumption, Btu/hr
Omv = wattmeter transducer reading, millivolts
(8-1)
THERMOCOUPLES: CHROMEL - CONSTANTANT (TYPE E)
T = 32.583 ( Tcm+5.02 Tcm,<-1.0 (8-2)
T = 38.529 ( Tcm,+4.72 )""d"" Tcm,k-1.0
where:
= temperature, OF
Tcm, = thermocouple output, millivolt
ROTAMETERS
WF = Flowcal (Wmv-4) (B-3)
where:
WF = volumetric flowrate, gpm
Flowcal = Constant, characteristics of flow transducer
Wmv = millivolt reading of flow transducer
130
APPENDIX C
CHEMICAL ANALYSIS PROCEDURES
131
Sample of the circulating water was analyzed daily for
total hardness (TH), calcium hardness (CaH), sulfate (904),
chloride (C1), silica (Si), and chromate (Cr04), zinc (Zn),
suspended solids (SS), orthophosphate (OP), polyphosphate
(PP), HEDP, AMP when they were added. Samples were also
taken at the beginning and at the end of each run.
Analysis for TH, CaH, Cl, and M-ilk were carried out
using analysis kits provided by Chemax, Inc. Industrial
Chemistry. Cr04, Zn, OP, PP, HEDP and AMP were analyzed
using chemical test kits and equipment from Hach Chemical
Company.
Suspended solids was analyzed using the procedure
outlined in Standard Method(1).
CHEMAX DROP TEST PROCEDURES
The procedures for each test are basically identical.
Initially, the titration bottle is filled with the sample to
the mark (10m1). After appropriate amount of reagents are
added, the solution is then titrated drop wise with titrant
solution to an endpoint, noticed by a specific color change.
TOTAL HARDNESS TEST
The reagents used are:
Reagent 1 : ammonium chloride-amonium hydroxide buffer
Reagent 2 : calmagite solution (0.2%)
Reagent 3 : EDTA solution (0.5%)
Five drops of reagent 1 and three drops of reagent 2 are
added to the 10 ml sample. If hardness is present, the
132
solution turns from lavender to red. This solution is then
titrated with reagent 3 using microburet until the last
trace of violet has disappeared, and the solution turns
blue.
TH (ppm CaC0m) = 150 (ml of reagent 3 used)
CALCIUM HARDNESS TEST
The reagents used are:
Reagent 1 : potassium hydroxide solution (8N)
Reagent 2 : Calver 2 indicator
Reagent 3 : EDTA solution (0.5%)
Two drops of reagent 1 and one capsule pillow of reagent are
added to the 10 ml sample. If calcium is present, the
solution turns to red. The solution is then titrated with
reagent 3 using microburet until the last trace of violet
has disappeared, and the solution turns to blue
CaH (ppm CaC0z) = 150 (ml of reagent 3 used)
Magnesium hardness, MgH (ppm CaC0z) is the difference
between total and calcium hardness.
CHLORIDE TEST
The reagents used are:
Reagent 1 : potassium chromate solution (5%)
Reagent 2 : silver nitrate solution
Two drops of reagent 1 are added to the 10 ml sample. The
solution is then titrated dropwise with reagent 2 until the
red-orange methylene end point is reached. One drop of
reagent 2 used is equivalent to 5 ppm as NaCL
133
M ALKALINITY TEST
The reagents used are:
Reagent 1 : mixed bromo-cresiel green and methyl red
solution (0.1%)
Reagent 2 : sulfuric acid (0.0503N)
One drop of reagent 1 is added to the 10 ml sample, if
alkalinity is present, the solution will turn to blush-
green. The solution is then titrated dropwise until the
color turns to red.
M-alk (ppm CaC0) = 5 (number of drops of reagent2
used)
HACH PROCEDURE
The chemical reagents used for the silica, sulfate,
zinc, chromate, phosphates and phosphonates tests are
supplied by Hach Chemical Company. Most of them are in the
powder from, packaged in individual pre-measured
polyethylene capsules called "powder pillow", which each
capsule contains the exact amount of reagent for each test.
The test were carried out using colorimeter model DRA 6418
and its manual procedures for the test was used.
GRAVIMETRIC ANALYSIS - SOLID DETERMINATION PROCEDURE"'
The gravimetric analysis is based on determination of
constituents of material which involves weighing,
filtration, evaporation and combustion.
TOTAL SUSPENDED SOLIDS TEST
The sequence procedures and drying are:
134
1. The prewashed and dried filter from desiccator is
transferred with a tweezer to balance and the weight is
measured. The filter is then placed in a filtration
appartus and the suction is applied.
2. 50 ml sample is poured through the filter. Distilled
water is used to rinse first the sample container, then
the filter holder and finally the filter.
3. The filter is then removed with a tweezer and dried for
1 hour at 1030C using an aluminium desk to hold the
filter in drying oven. Finally the filter is cooled in
the desiccator before it is reweight.
SS(mg/1) = [weight from(3)mg weight from(1)mg]x 100050

135
APPENDIX D
SAMPLE CALCULATIONS
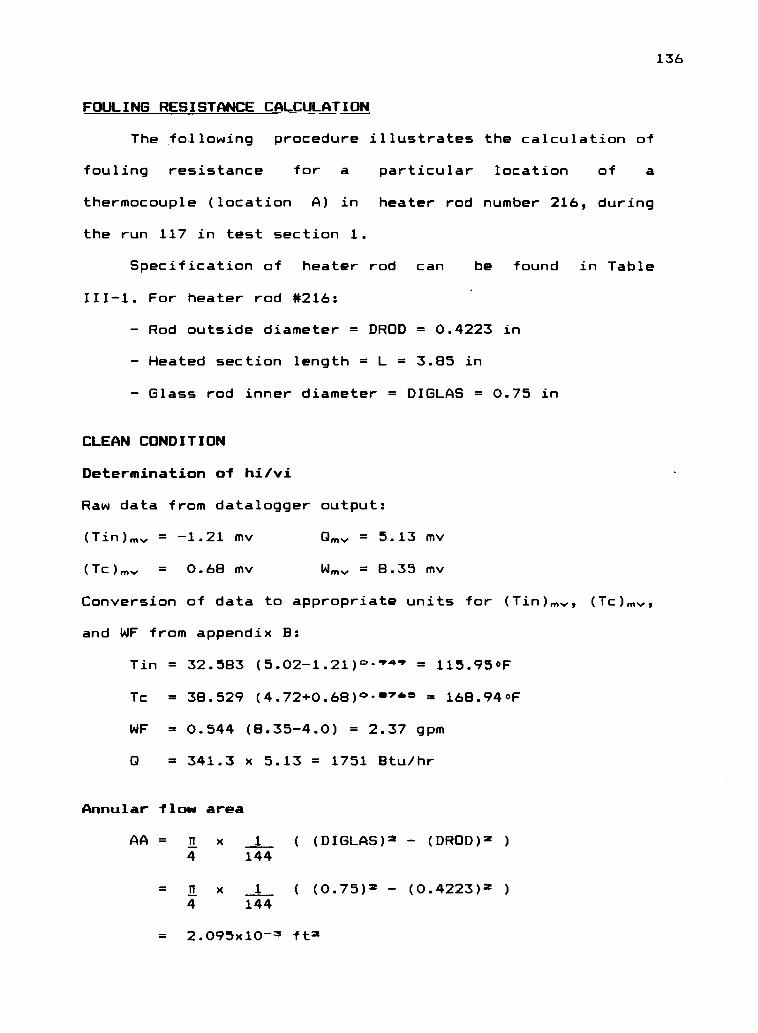
136
FOULING RESISTANCE CALCULATION
The following procedure illustrates the calculation of
fouling resistance for a particular location of a
thermocouple (location A) in heater rod number 216, during
the run 117 in test section 1.
Specification of heater rod can be found in Table
III-1. For heater rod #216:
Rod outside diameter = DROD = 0.4223 in
Heated section length = L = 3.85 in
Glass rod inner diameter = DIGLAS = 0.75 in
CLEAN CONDITION
Determination of hi /vi
Raw data from datalogger output:
(Tin) = -1.21 my 0m, = 5.13 my
(Tc)m, = 0.68 my Wm, = 8.35 my
Conversion of data to appropriate units for (Tin),,, (Tc)m,,
and WF from appendix B:
Tin = 32.583 (5.02-1.21)°- = 115.950F
Tc = 38.529 (4.72+0.68)0-°" ° = 168.940F
WF = 0.544 (8.35-4.0) = 2.37 gpm
Q = 341.3 x 5.13 = 1751 Btu/hr
Annular flow area
AA = n x 1 ( (DIGLAS)2 - (DROD)' )
4 144
= n x 1 ( (0.75)2 (0.4223)2 )
4 144
= 2.095x10⁻³ ft2
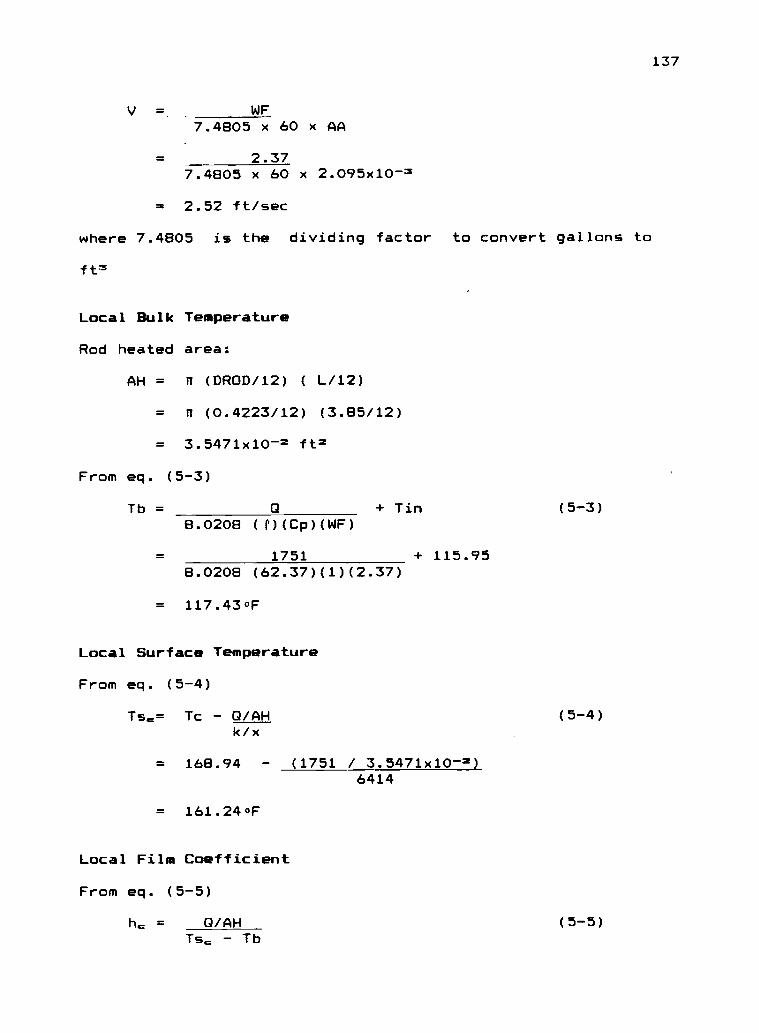
V = WF7.4805 x 60 x AA
2.377.4805 x 60 x 2.095x10-2
= 2.52 ft/sec
where 7.4805 is the dividing factor to convert gallons to
ft'5
Local Bulk Temperature
Rod heated area:
AH = n (DROD/12) ( L/12)
= n (0.4223/12) (3.85/12)
= 3.5471x10⁻² ft2
From eq. (5-3)
Tb = 0 + Tin (5-3)8.0208 (e)(Cp)(WF)
1751 + 115.958.0208 (62.37)(1)(2.37)
= 117.430F
Local Surface Temperature
From eq. (5-4)
Ts.= Tc - 0 /AHk/x
= 168.94 - (1751 / 3.5471x10⁻²)6414
= 161.240F
Local Film Coefficient
From eq. (5-5)
h. = 0 /AHTs. Tb
(5-4)
(5-5)
137
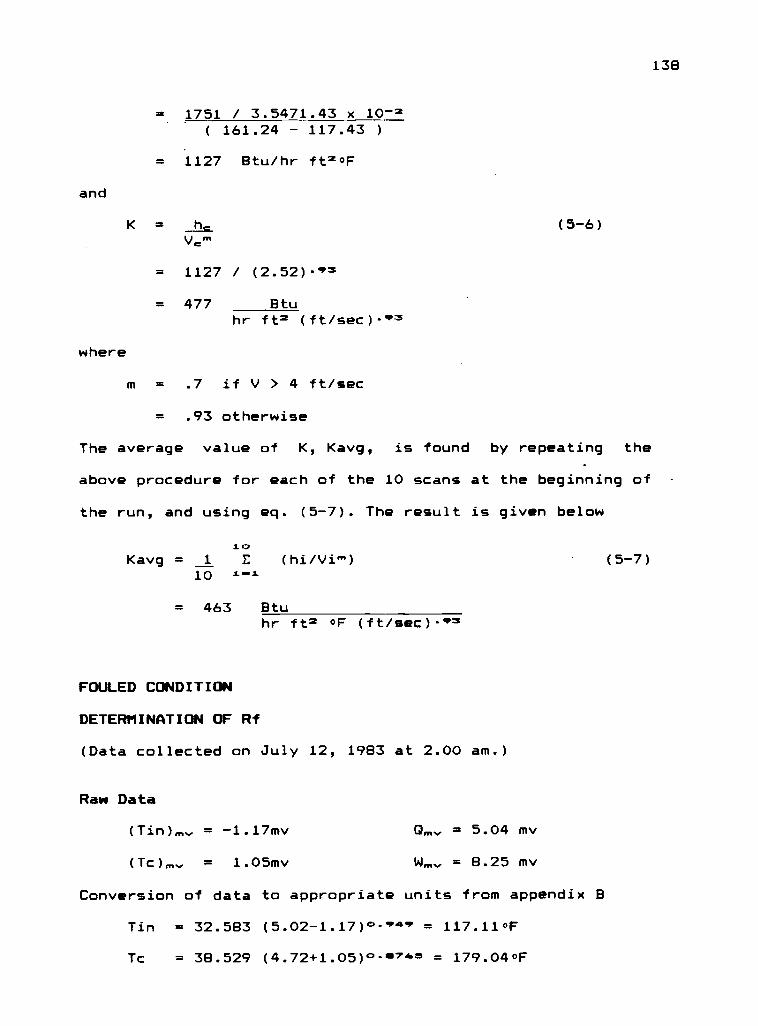
1751 / 3.5471.43 x 10-2( 161.24 117.43 )
= 1127 Btu/hr ft2oF
and
K = hV=m
= 1127 / (2.52)
= 477 Btuhr ft2 (ft/sec).:3
where
(5-6)
.7 if V > 4 ft/sec
.93 otherwise
The average value of K, Kavg, is found by repeating the
above procedure for each of the 10 scans at the beginning of
the run, and using eq. (5-7). The result is given below
10Kavg = 1 E (hi/Vim)
10
= 463 Btuhr ft2 °F (ft/sec)-
FOULED CONDITION
DETERMINATION OF Rf
(Data collected on July 12, 1983 at 2.00 am.)
Raw Data
(Tin)m, = -1.17mv Om, = 5.04 my
(Tc)m, = 1.05mv Wm, = 8.25 my
Conversion of data to appropriate units from appendix B
Tin = 32.583 (5.02-1.17)°- = 117.110F
Tc = 38.529 (4.72+1.05) D-274'5 = 179.040F
(5-7)
138
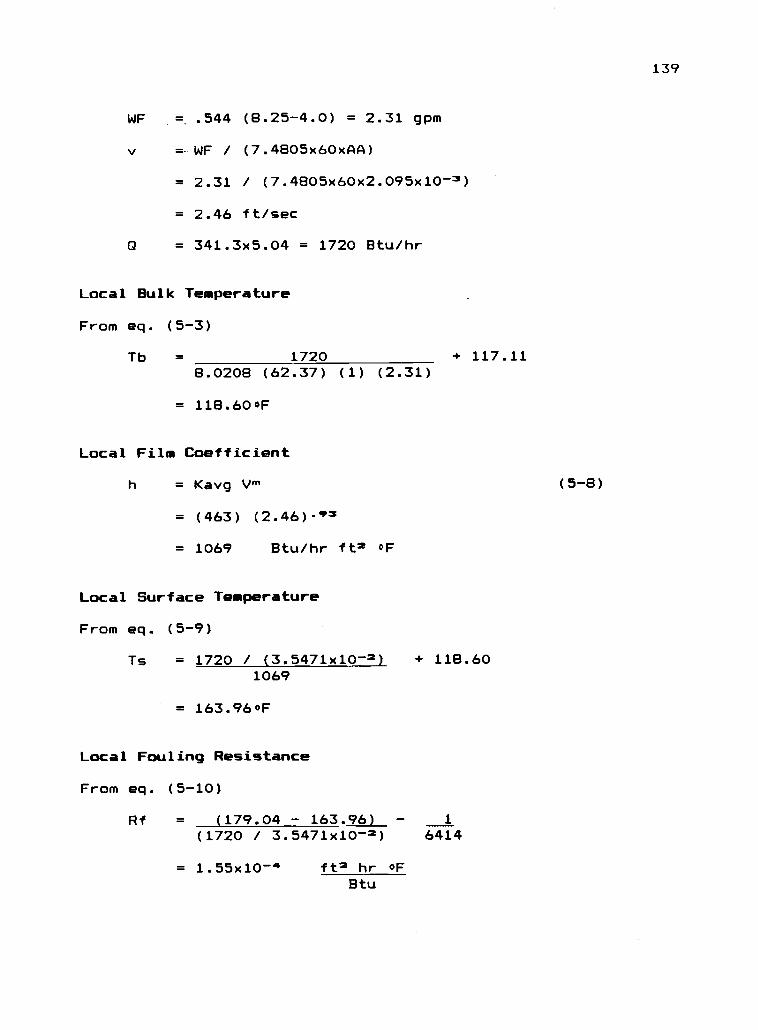
WF = -.544 (8.25-4.0) = 2.31 gpm
v = WF / (7.4805x6OxAA)
= 2.31 / (7.4805x60x2.095x10-2)
= 2.46 ft/sec
0 = 341.3x5.04 = 1720 Btu/hr
Local Bulk Temperature
From eq. (5-3)
Tb 1720 + 117.118.0208 (62.37) (1) (2.31)
= 118.600F
Local Film Coefficient
h = Kavg vm
= (463) (2.46)-93
= 1069 Btu/hr ft2 of
Local Surface Temperature
From eq. (5-9)
Ts = 1720 / (3.5471x10⁻²) + 118.601069
= 163.960F
Local Fouling Resistance
From eq. (5-10)
Rf = (179.04 - 163.96) - 1
(1720 / 3.5471x10⁻²) 6414
= 1.55x10⁻⁴ ft2 hr ofBtu
(5-8)
139
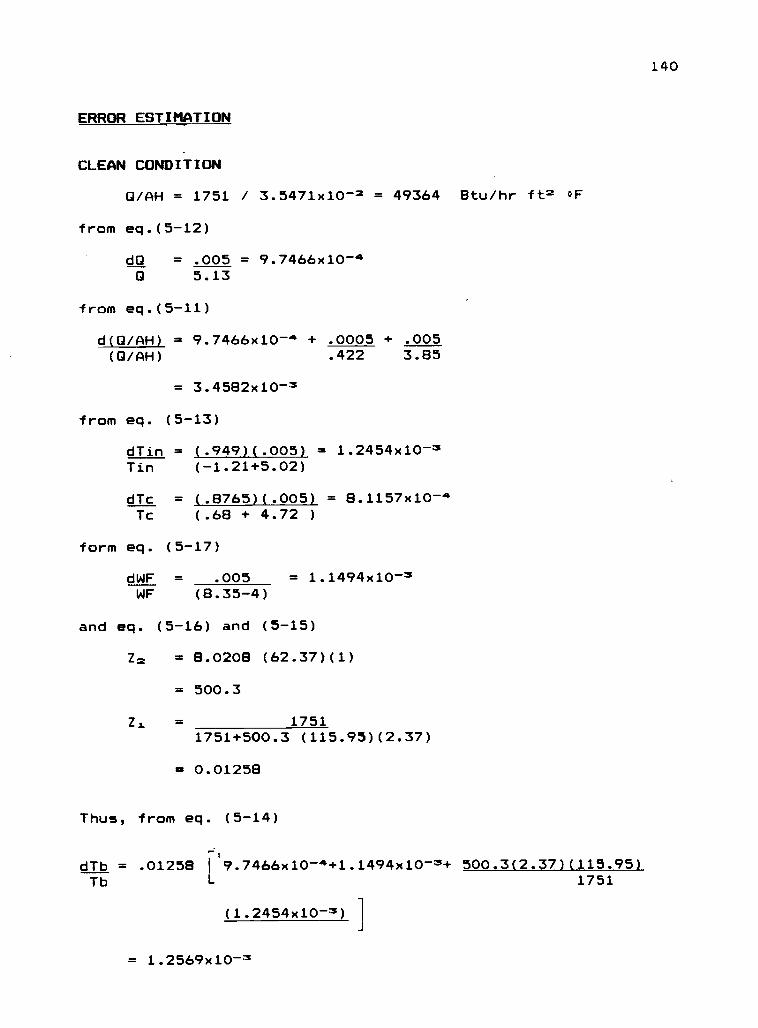
140
ERROR ESTIMATION
CLEAN CONDITION
0/AH = 1751 / 3.5471x10-2 = 49364 Btu/hr ft2 OF
from eq.(5-12)
d0 = .005 = 9.7466x10-45.13
from eq.(5-11)
d(Q /AH) = 9.7466x10⁻⁴ + .0005 + .005(0/AH) .422 3.85
= 3.4582x10⁻²
from eq. (5-13)
dTin = (.949)(.005) = 1.2454x10⁻²Tin (-1.21+5.02)
dTc = (.8765)(.005) = 8.1157x10⁻⁴Tc (.68 + 4.72 )
form eq. (5-17)
dWF = .005 = 1.1494x10⁻²WF (8.35-4)
and eq. (5-16) and (5-15)
Zm = 8.0208 (62.37)(1)
= 500.3
Z. = 17511751+500.3 (115.95)(2.37)
= 0.01258
Thus, from eq. (5-14)
dTb = .01258 1 9.7466x10⁻⁴ +1.1494x10 -3+ 500.3(2.37)(115.95)Tb L 1751
(1.2454x10⁻²) 1
J
= 1.2569x10⁻²
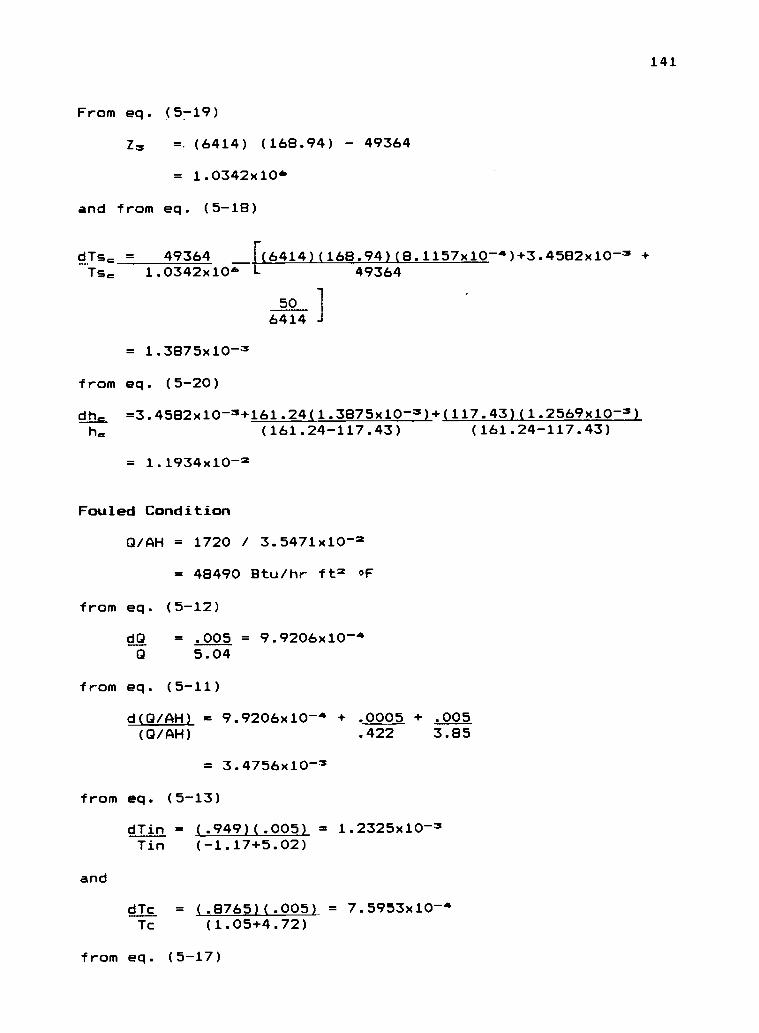
141
From eq. (5-19)
Zm =.(6414) (168.94) - 49364
= 1.0342x10⁶
and from eq. (5-18)
dTs. = 49364 [(6414)(168.94)(8.1157x10⁻⁴)+3.4582x10- +
Ts. 1.0342x10⁶ 49364
50 16414 -I
= 1.3875x10-
from eq. (5-20)
dh =3.4582x10⁻³+161.24(1.3875x10-)+(117.43)(1.2569x10-)h. (161.24-117.43) (161.24-117.43)
= 1.1934x10-
Fouled Condition
Q/AH = 1720 / 3.5471x10-2
= 48490 Btu/hr ftz of
from eq. (5-12)
dO = .005 = 9.9206x10-45.04
from eq. (5-11)
d(0/AH) = 9.9206x10⁻¹ + .0005 + .005(Q/AH) .422 3.85
= 3.4756x10⁻³
from eq. (5-13)
dTin = (.949)(.005) = 1.2325x10⁻³Tin
and
dTc
(-1.17+5.02)
= (.8765)(.005) = 7.5953x10*Tc (1.05+4.72)
from eq. (5-17)
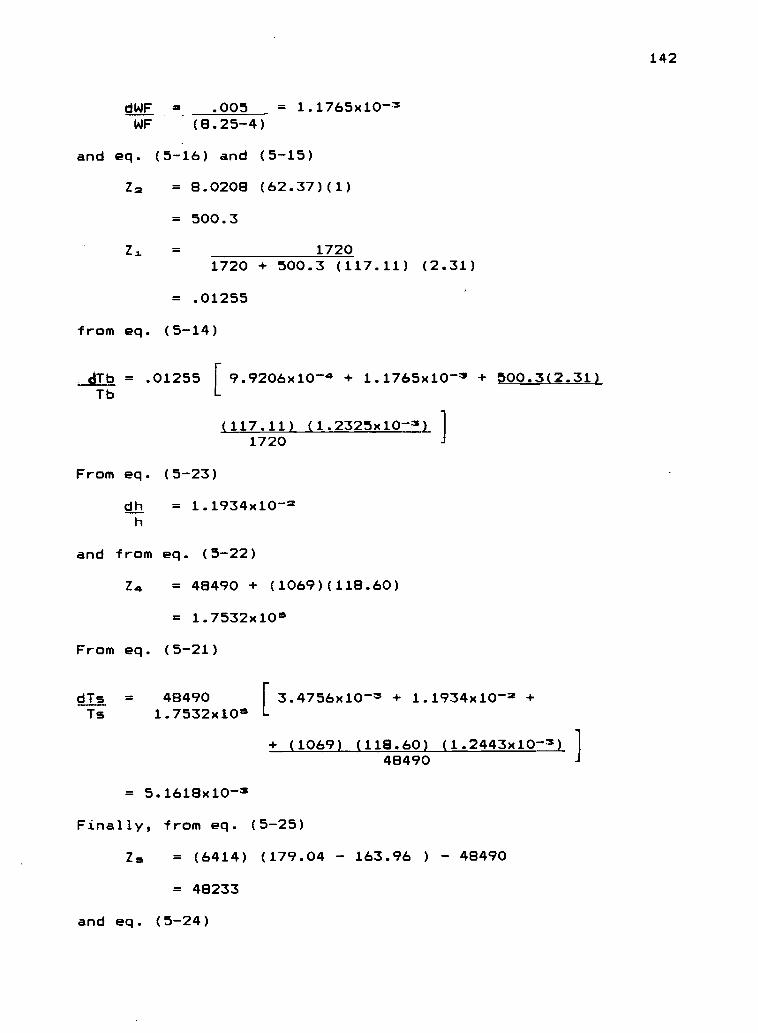
142
dWF = .005 = 1.1765x10⁻³WF (8.25-4)
and eq. (5-16) and (5-15)
Zm = 8.0208 (62.37)(1)
= 500.3
17201720 + 500.3 (117.11) (2.31)
= .01255
from eq. (5-14)
dTb = .01255 [ 9.9206x10⁻⁴ + 1.1765x10⁻³ + 500.3(2.31)Tb
(117.11) (1.2325x10⁻³)1720
From eq. (5-23)
dh = 1.1934x10-h
and from eq. (5-22)
Z4 = 48490 + (1069)(118.60)
= 1.7532x10°
From eq. (5-21)
dTs = 48490 3.4756x10⁻³ + 1.1934x10⁻⁷ +Is 1.7532x10°
(1069) (118.60) (1.2443x10⁻³)48490
= 5.1618x10⁻¹¹
Finally, from eq. (5-25)
Z5 = (6414) (179.04 - 163.96 ) 48490
= 48233
and eq. (5-24)
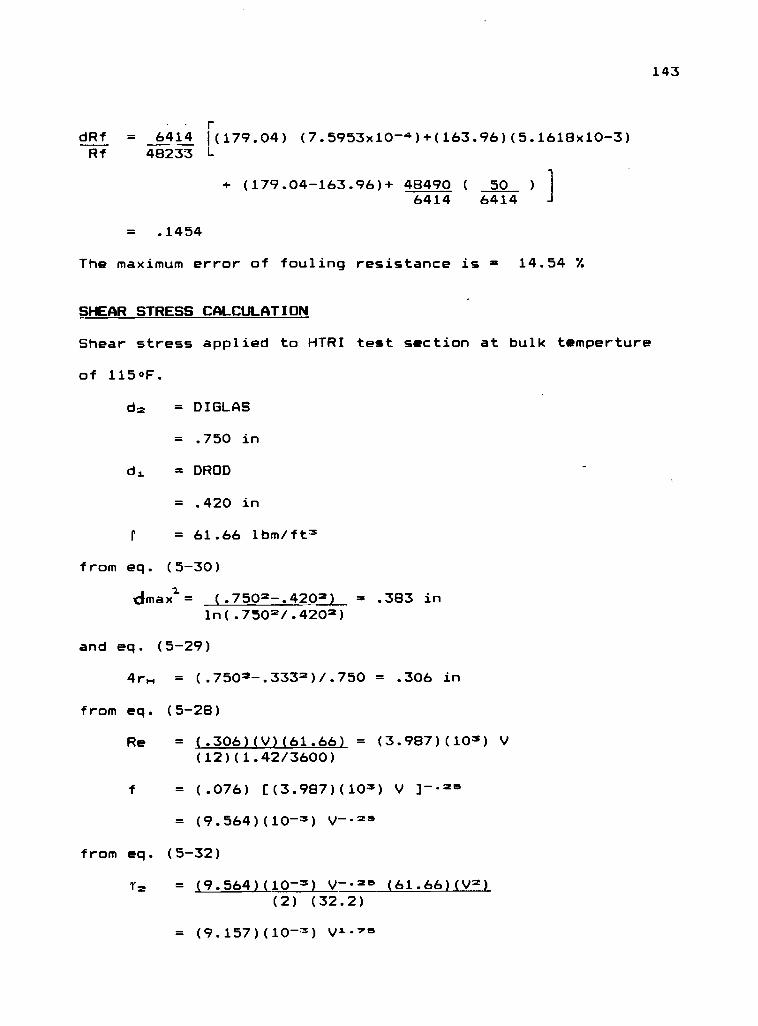
143
rdRf = 6414 1(179.04) (7.5953x10-.4)+(163.96)(5.1618x10⁻³)Rf 48233 L
+ (179.04-163.96)+ 48490 ( 50 )
6414 6414
.1454
The maximum error of fouling resistance is = 14.54 %
SHEAR STRESS CALCULATION
Shear stress applied to HTRI test section at bulk temperture
of 1150F.
dm = DIGLAS
= .750 in
c12. = DROD
= .420 in
61.66 lbm/ft3
from eq. (5-30)
dimakl= (.7503-.4202) = .383 inln(.7503/.4202)
and eq. (5-29)
4rH = (.7502-.3332)/.750 = .306 in
from eq. (5-28)
Re = (.306)(V)(61.66) = (3.987)(103) V(12)(1.42/3600)
f = (.076) ((3.987)(103) V ]--35
= (9.564)(10-3) V--33
from eq. (5-32)
12 = (9.564)(10-3) V--2e. (61.66)(V2)(2) (32.2)
= (9.157)(10-3) V-'
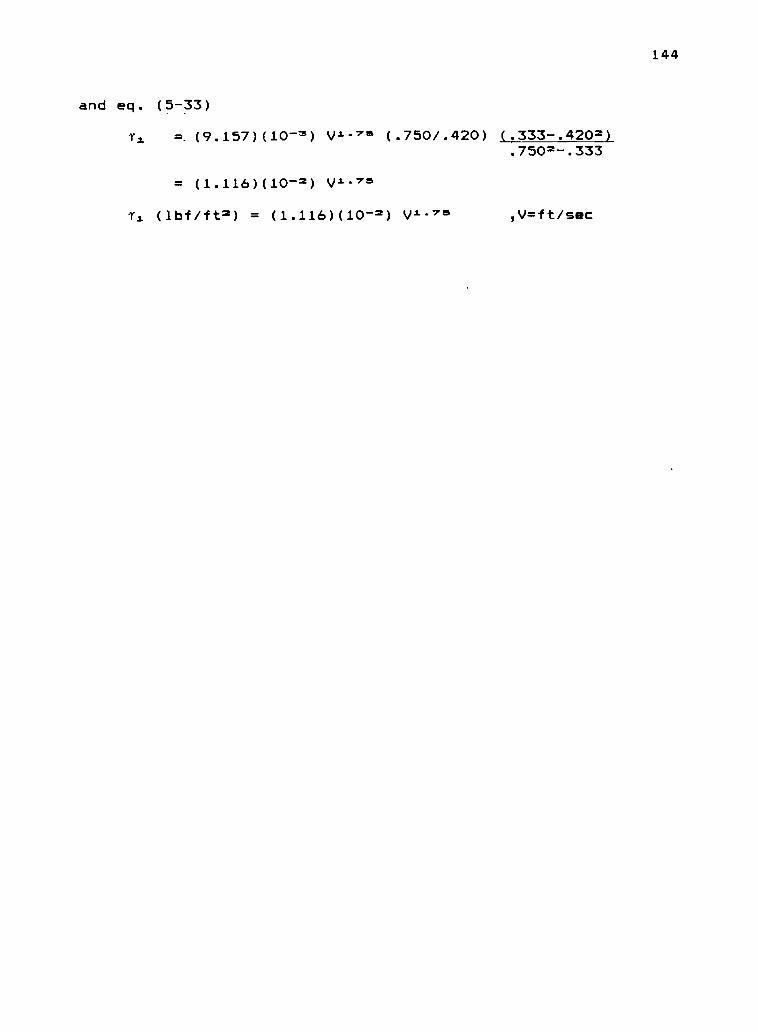
38S/14=A6 cc-TA (c-OT)(9TT'T) = (c4k/kCII) '1
cc-TA (=-0T)(9TT.T) =
222.--zOGL. (=OZt7.-222.) (OZ1./OGL') cc-TA (c-OT)(LGT.6) -=
(22_G) .ba pue
ti7T
145
APPENDIX E
SUMMARY OF TEST RESULTS
146
A summary of runs 117 through 301 in run sequence is
shown in table E-1. This table indicates the run duration,
the run conditions (velocity, surface temperature and pH),
and additives.
The results for the final fouling resistance are shown
in the series of figures E-1 through E-18. These are
pictorial representation of all 185 runs grouped according
to the cooling water with the same additives in each figure.
Temperature-velocity matrices are shown at various levels
and the pH levels are indicated on the left. Not all cells
in the matrices were tested. Those cells that contain a
number in the lower part of the cell indicate that a test
was run and this number is the run number. The numbers in
the centers of the cells indicate the value of the final
fouling resistance, (Rf)p, (ft oF/Htu)x104, at the
completion of a test. When a cell is divided in half (or
third) by a broken line, contains two (or three) sets of
numbers, these are duplicate runs. When the symbol "#" is an
indication that the fouling resistance was still increasing
at a significant rate when the run was terminated. The
asterisk (*) indicates that the deposit removal occurred
during a run. In this case, the (Rf)p value reported is the
highest value observed during the test.
The symbols CS, Ad, and C-N refer to Carbon Steel,
Admiralty and 90/10 copper/nickel. If non of these symbols
appear, the material used is stainless steel.
Another notations used in the appendix is given below:
147
Run no : number of test run
** : acid leak during run
*** : wall thermocouple failed during run
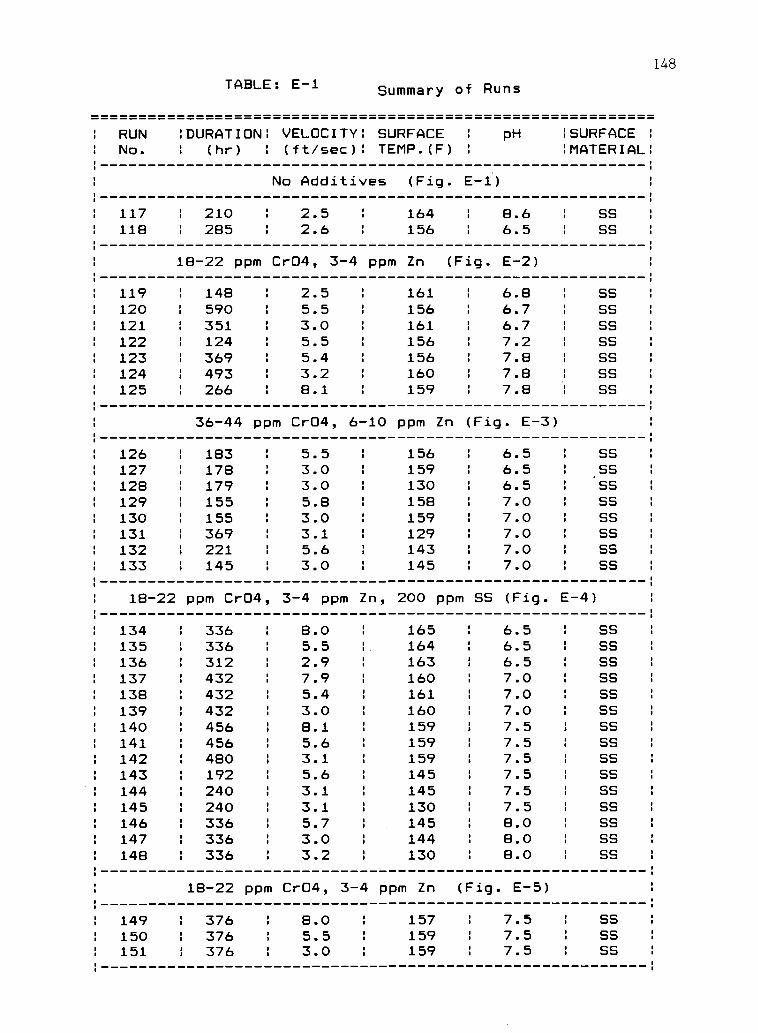
148
TABLE: E -1 Summary of Runs
: RUN :DURATION: VELOCITY: SURFACE : pH SURFACE :
No. ! (hr) (ft/sec): TEMP.(F) :MATERIAL:
No Additives (Fig. E-1)
117 : 210118 : 285
2.5 164 8.6 SS2.6 156 6.5 SS
18-22 ppm Cr04, 3-4 ppm Zn (Fig. E-2)
119 148 2.5 161 6.8 SS120 590 5.5 156 6.7 SS121 351 3.0 161 6.7 SS122 124 5.5 156 7.2 SS123 369 5.4 156 7.8 SS124 493 3.2 160 7.8 SS125 : 266 8.1 159 7.8 SS
36-44 ppm Cr04, 6-10 ppm Zn (Fig. E-3)
126 183 5.5 156 6.5 SS127 178 3.0 159 6.5 SS128 179 3.0 130 6.5 SS129 155 5.8 158 7.0 SS130 155 3.0 159 7.0 SS131 369 3.1 129 7.0 SS132 221 5.6 143 7.0 SS133 145 3.0 145 7.0 SS
18-22 ppm Cr04, 3-4 ppm Zn, 200 ppm SS (Fig. E -4)
134 336 8.0 165 6.5 SS135 336 5.5 164 6.5 SS136 312 2.9 163 6.5 SS137 432 7.9 160 7.0 SS138 432 5.4 161 7.0 SS139 432 3.0 160 7.0 SS140 456 8.1 159 7.5 SS141 456 5.6 159 7.5 SS142 480 3.1 159 7.5 SS143 192 5.6 145 7.5 SS144 240 3.1 145 7.5 SS145 240 3.1 130 7.5 SS146 336 5.7 145 8.0 SS147 336 3.0 144 8.0 SS148 336 3.2 130 8.0 SS
18-22 ppm Cr04, 3 -4 ppm Zn (Fig. E-5)
149 376 8.0 157 7.5 SS150 376 5.5 159 7.5 SS151 376 3.0 159 7.5 SS
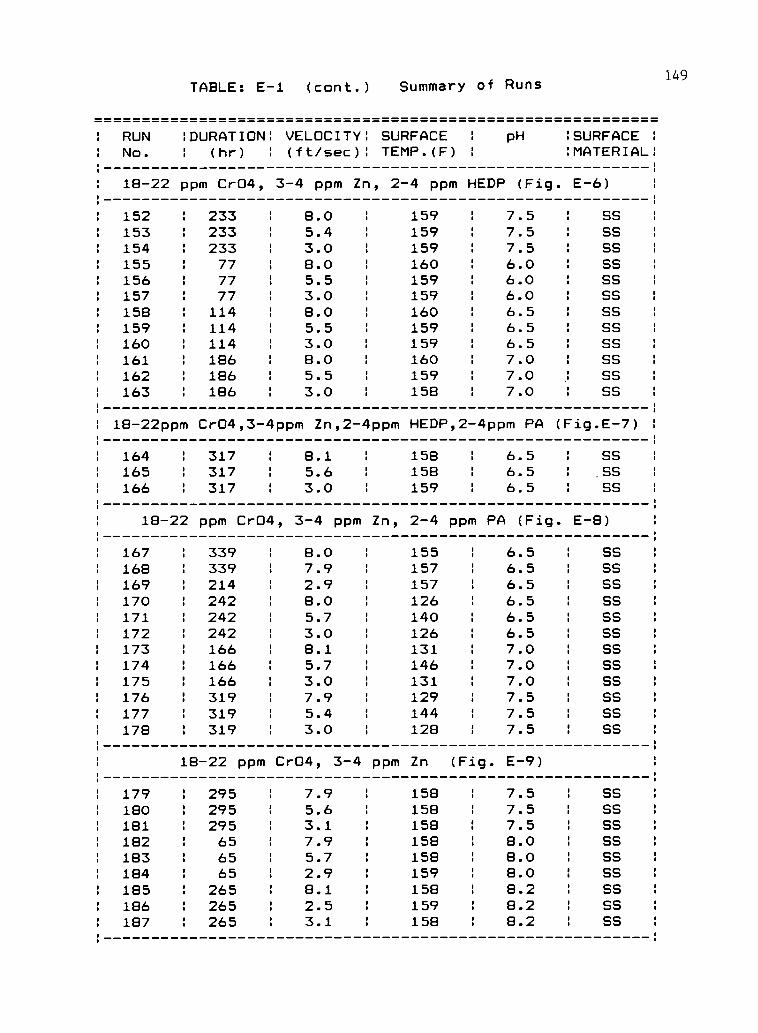
RUNNo.
TABLE: E-1 (cont.)
:DURATION: VELOCITY:(hr) i (ft/sec):
Summary of
SURFACE 1
TEMP.(F)
Runs
pH :SURFACE:MATERIAL:
18-22 ppm Cr04, 3-4 ppm Zn, 2-4 ppm HEDP (Fig. E-6)
152 233 8.0 159 7.5 SS153 233 5.4 159 7.5 SS154 1 233 3.0 159 7.5 SS155 77 8.0 160 6.0 SS156 77 5.5 159 6.0 SS157 1 77 3.0 159 6.0 SS158 1 114 8.0 160 6.5 SS159 1 114 5.5 159 6.5 SS160 1 114 3.0 159 6.5 SS161 186 8.0 160 7.0 SS162 186 5.5 159 7.0 SS163 186 3.0 158 7.0 1 SS
18 -22ppm Cr04,3-4ppm Zn,2-4ppm HEDP,2-4ppm PA (Fig.E-7)
164 317 8.1 158 6.5 SS165 1 317 5.6 158 6.5 SS166 1 317 3.0 159 6.5 SS
18 -22 ppm Cr04, 3-4 ppm Zn, 2-4 ppm PA (Fig. E-8)
167 339 8.0 155 6.5 SS168 339 7.9 157 6.5 SS169 1 214 2.9 157 6.5 SS170 1 242 8.0 126 6.5 SS171 242 5.7 140 6.5 SS172 1 242 3.0 126 6.5 SS173 166 8.1 131 7.0 SS174 t 166 5.7 146 7.0 SS175 1 166 3.0 131 7.0 SS176 319 7.9 129 7.5 SS177 319 5.4 144 7.5 SS178 1 319 3.0 128 7.5 SS
18-22 ppm Cr04, 3-4 ppm Zn (Fig. E-9)
179 t 295 7.9 158 7.5 SS180 1 295 5.6 158 7.5 SS181 1 295 3.1 158 7.5 SS182 1 65 7.9 158 8.0 SS183 65 5.7 158 8.0 SS184 S 65 2.9 159 8.0 SS185 1 265 8.1 158 8.2 SS186 1 265 2.5 159 8.2 SS187 1 265 3.1 158 8.2 SS
149
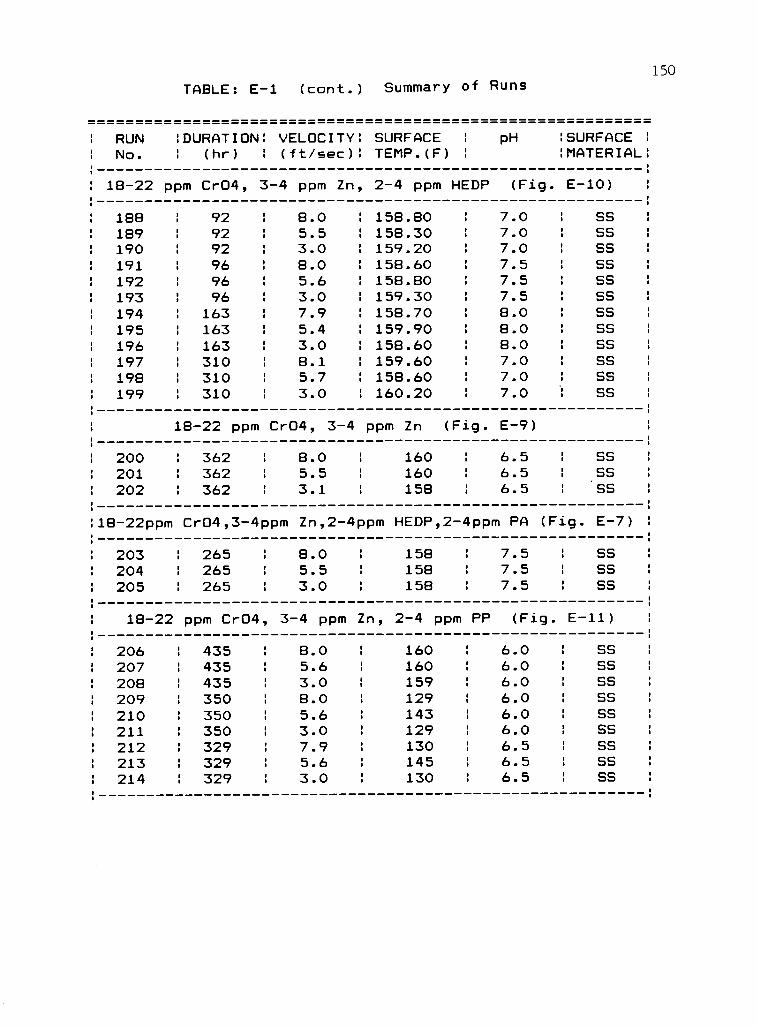
150
TABLE: E-1 (cont.) Summary of Runs
RUN :DURATION: VELOCITY: SURFACE 1 pH SURFACENo. : (hr) : (ft/sec): TEMP.(F) : :MATERIAL!
18-22 ppm Cr04, 3-4 ppm Zn, 2-4 ppm HEDP (Fig. E-10)
188 92 8.0 158.80 7.0 SS189 92 5.5 1 158.30 7.0 SS190 92 3.0 159.20 7.0 SS191 96 8.0 1 158.60 7.5 SS192 96 5.6 158.80 7.5 SS193 t 96 3.0 159.30 7.5 SS194 163 7.9 158.70 8.0 SS195 1 163 5.4 159.90 8.0 SS196 163 3.0 1 158.60 8.0 SS197 310 8.1 159.60 7.0 SS198 310 5.7 158.60 7.0 SS199 310 3.0 160.20 7.0 SS
18-22 ppm Cr04, 3-4 ppm Zn (Fig. E-9)
200 362 8.0 160 6.5 SS201 362 5.5 160 6.5 SS202 362 3.1 158 6.5 SS
18-22ppm Cr04,3-4ppm Zn,2-4ppm HEDP,2-4ppm PA (Fig. E-7)
203 265 8.0 158 7.5 SS204 265 5.5 158 7.5 SS205 265 3.0 158 7.5 SS
18-22 ppm Cr04, 3-4 ppm Zn, 2-4 ppm PP (Fig. E-11)
206 435 8.0 160 6.0 SS207 435 5.6 160 6.0 SS208 1 435 3.0 159 6.0 SS209 l 350 8.0 129 6.0 SS210 I 350 5.6 143 6.0 SS211 1 350 3.0 129 6.0 SS212 I 329 7.9 130 6.5 SS213 S 329 5.6 145 6.5 SS214 329 3.0 130 6.5 SS
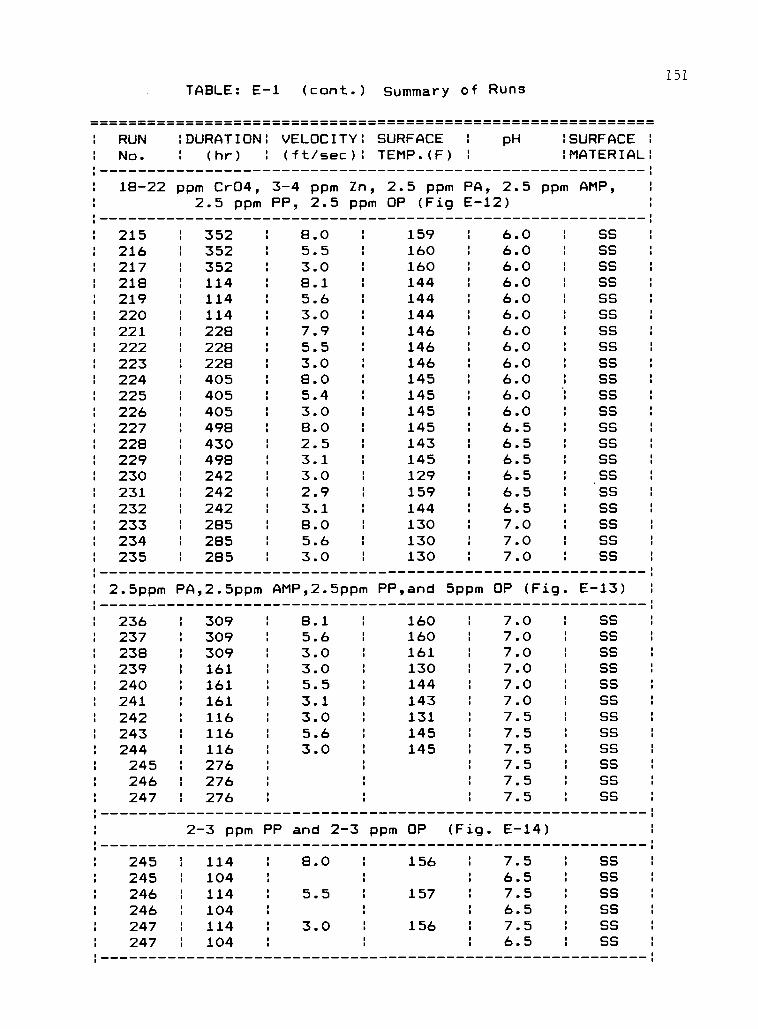
151
RUNNo.
18-22
TABLE: E-1 (cont.) Summary of Runs
:DURATION: VELOCITY: SURFACE I pH(hr) (ft/sec): TEMP.(F)
ppm Cr04, 3-4 ppm Zn, 2.5 ppm PA, 2.52.5 ppm PP, 2.5 ppm OP (Fig E-12)
:SURFACE:MATERIAL:
ppm AMP,
215 1 352 8.0 159 6.0 SS216 1 352 5.5 160 6.0 SS217 : 352 3.0 160 6.0 SS218 : 114 8.1 144 6.0 SS219 : 114 5.6 144 6.0 SS220 : 114 3.0 144 6.0 SS221 1 228 7.9 146 6.0 SS222 : 228 5.5 146 6.0 SS223 1 228 3.0 146 6.0 SS224 : 405 8.0 145 6.0 SS225 : 405 5.4 145 6.0 SS226 1 405 3.0 145 6.0 SS227 : 498 8.0 145 6.5 SS228 : 430 2.5 143 6.5 SS229 : 498 3.1 145 6.5 SS230 : 242 3.0 129 6.5 SS231 : 242 2.9 159 6.5 SS232 1 242 3.1 144 6.5 SS233 1 285 8.0 130 7.0 SS234 : 285 5.6 130 7.0 SS235 : 285 3.0 130 7.0 SS
2.5ppm PA,2.5ppm AMP,2.5ppm PP,and 5ppm OP (Fig. E-13)
236 : 309 8.1 160 7.0 SS237 : 309 5.6 160 7.0 SS238 : 309 3.0 161 7.0 SS239 I 161 3.0 130 7.0 SS240 : 161 5.5 144 7.0 SS241 : 161 3.1 143 7.0 SS242 : 116 3.0 131 7.5 SS243 I 116 5.6 145 7.5 SS244 : 116 3.0 145 7.5 SS245 : 276 7.5 SS246 : 276 7.5 SS247 : 276 7.5 SS
2-3 ppm PP and 2-3 ppm OP (Fig. E-14)
245 1 114 8.0 156 7.5 SS245 1 104 6.5 SS246 1 114 5.5 157 7.5 SS246 : 104 6.5 SS247 1 114 3.0 156 7.5 SS247 I 104 6.5 SS
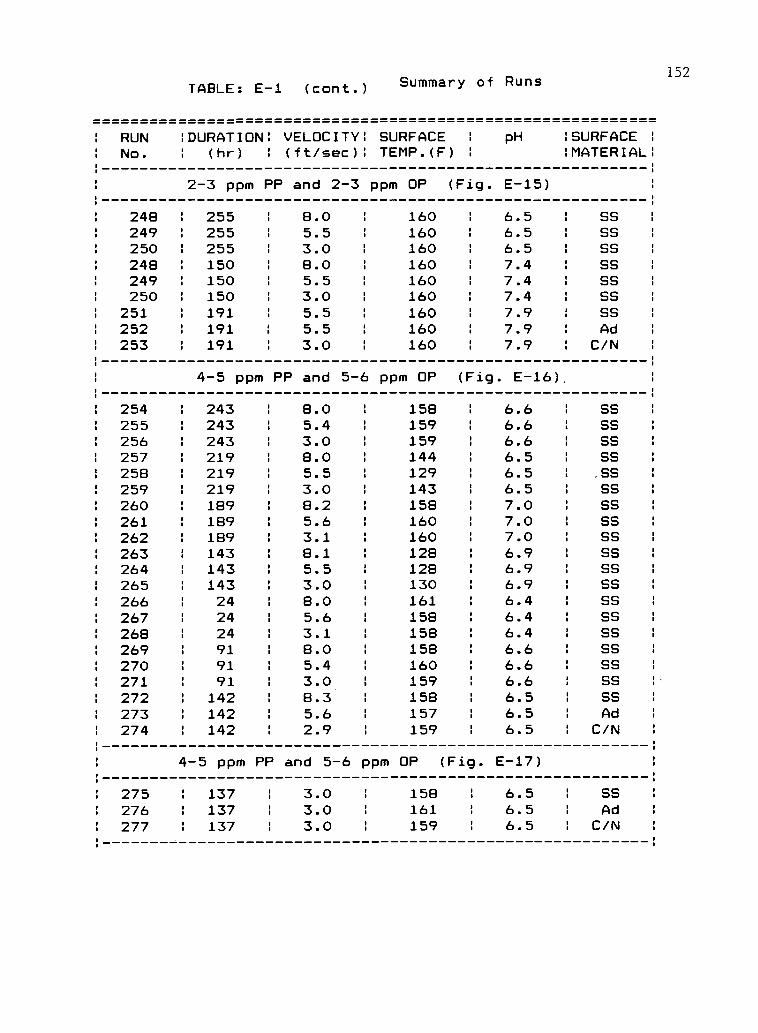
: RUN: No.
:DURATION::
TABLE: E-1 (cont.)
VELOCITY:(hr) I (ft/sec):
2-3 ppm PP and 2-3
Summary of
SURFACE :
TEMP.(F)
ppm OP (Fig.
Runs
pH
E-15)
SURFACE :
:MATERIAL:
248 255 8.0 160 6.5 SS249 255 5.5 160 6.5 SS250 255 3.0 160 6.5 SS248 150 8.0 160 7.4 SS249 150 5.5 160 7.4 SS250 150 3.0 160 7.4 SS
251 191 5.5 160 7.9 SS252 191 5.5 160 7.9 Ad253 191 3.0 160 7.9 C/N
4-5 ppm PP and 5 -6 ppm OP (Fig. E-16)
254 243 8.0 158 6.6 SS255 243 5.4 159 6.6 SS256 243 3.0 159 6.6 SS257 219 8.0 144 6.5 SS258 219 5.5 129 6.5 SS259 219 3.0 143 6.5 SS260 189 8.2 158 7.0 SS261 189 5.6 160 7.0 SS262 189 3.1 160 7.0 SS263 143 8.1 128 6.9 SS264 143 5.5 128 6.9 SS265 143 3.0 130 6.9 SS
266 24 8.0 161 6.4 SS
267 24 5.6 158 6.4 SS268 24 3.1 158 6.4 SS269 91 8.0 158 6.6 SS270 91 5.4 160 6.6 SS271 91 3.0 159 6.6 SS272 142 8.3 158 6.5 SS273 142 5.6 157 6.5 Ad
274 142 2.9 159 6.5 C/N
4-5 ppm PP and 5-6 ppm OP (Fig. E-17)
275 : 137 3.0 158 6.5 SS
276 I 137 3.0 161 6.5 Ad277 : 137 3.0 159 6.5 C/N
152
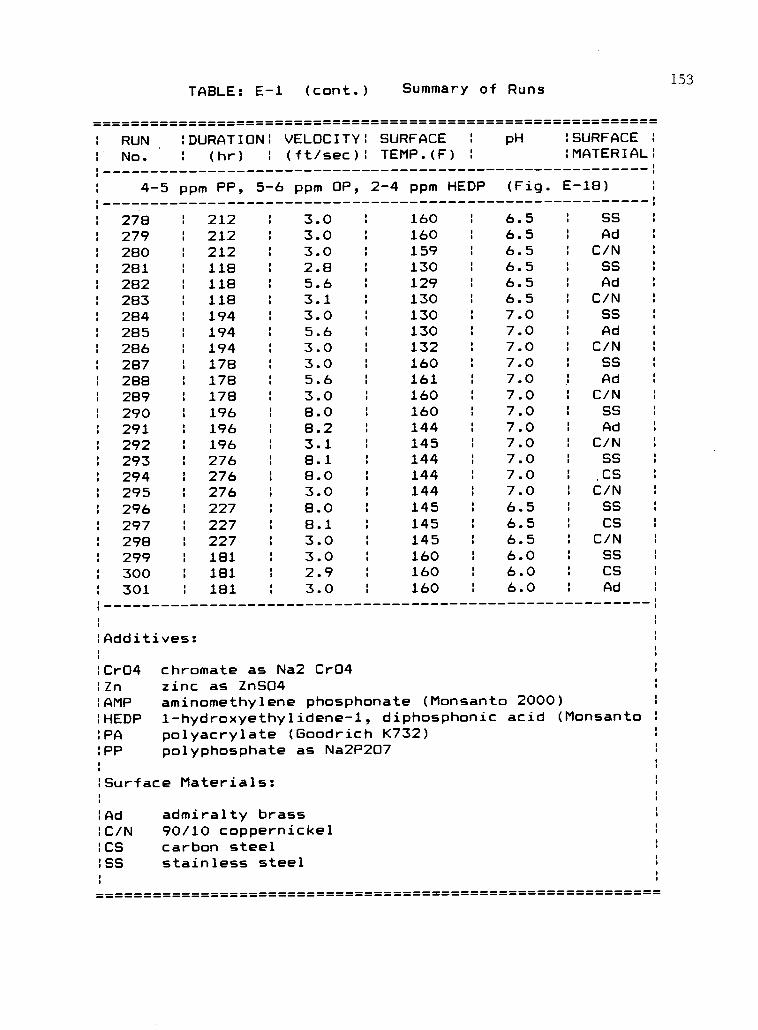
TABLE: E-1 (cont.) Summary of Runs
RUN :DURATION: VELOCITY: SURFACE : pH :SURFACE :
No. : (hr) 1 (ft/sec): TEMP.(F) :MATERIAL:
4-5 ppm PP, 5-6 ppm OP, 2-4 ppm HEDP (Fig. E-18)
278279280281282283284285286287288289290291292293294295296297298299300301
.'
.'
: .
.'
.'
.'
.'
,'
.'
.'
,'
.'
.'
.'
,'
i'
.'
.'
i'
.'
.'
.'
.'
.'
212212212118118118194194194178178178196196196276276276227227227181181181
3.03.03.02.85.63.13.05.63.03.05.63.08.08.23.18.18.03.08.08.13.03.02.93.0
160160159130129130130130132160161160160144145144144144145145145160160160
6.56.56.56.56.56.57.07.07.07.07.07.07.07.07.07.07.07.06.56.56.56.06.06.0
:
:
:
1
:
:
:
:
:
SSAd
C/NSSAd
C/NSSAd
C/NSSAd
C/NSSAd
C/NSSCS
C/NSSCS
C/NSSCSAd
:Additives:
:Cr04 chromate as Na2 Cr04:Zn zinc as ZnSO4:AMP aminomethylene phosphonate (Monsanto 2000):HEDP 1-hydroxyethylidene-1, diphosphonic acid (Monsanto:PA polyacrylate (Goodrich K732):PP polyphosphate as Na2P207
:Surface Materials:
:Ad admiralty brass:C/N 90/10 coppernickel:CS carbon steel:SS stainless steel
153
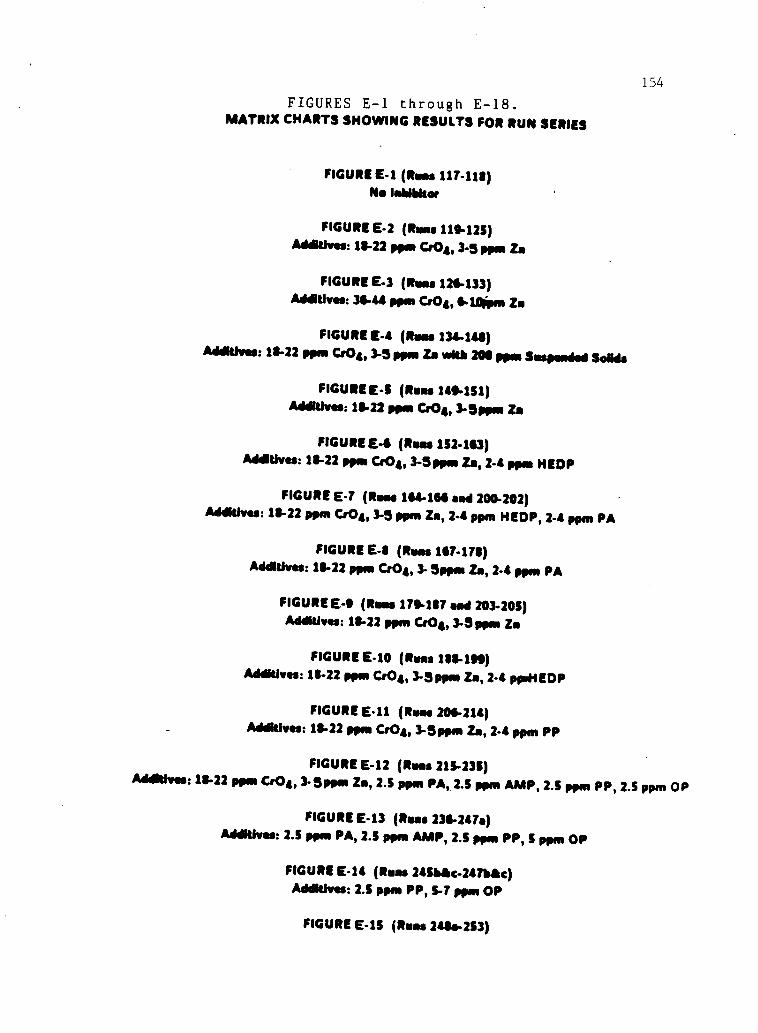
154
FIGURES E-1 through E-18.MATRIX CHARTS SHOWING RESULTS FOR RUN SERIES
FIGURE E-1 (Russ 117-118)No WNW.,
FIGURE E-2 (Rees 119-125)Addithres: 19-22 ppm Cr04, 3-5 ppm Zs
FIGURE E-3 (Rees 126.133)Additives: 39.44 ppm C:04,9-10ipm Zs
FIGURE E -4 (Rees 134-148)Additives: 18-22 ppm Cr04, 3-5 ppm Zs with 206 ppm Suspended Solids
FIGURE E-5 (Rees 149-151)Additives: 18-22 ppm 004, 3-5ppas Zs
FIGURE E-6 (Rees 152-163)Additives: 18-22 ppm C:04, 3-5ppm Zee, 2-4 ppm HEDP
FIGURE E-7 (Roes 164-166 sad 200-202)Additives: 19-22 ppm C:04, 3-5 ppm Zs, 2-4 ppm H EDP, 2-4 ppm PA
FIGURE E-11 (Rees 197-178)Additives: 18-22 ppm Cr04, 3- 5ppees Zee, 2.4 ppm PA
FIGURE E-9 (Rees 179-187 and 203-20S)Additives: 18-22 ppm Cr04, 3-3ppm Zs
FIGURE E-10 (Rees 188-199)Additives: 18-22 ppm Cr04, 3-5 ppm Zs, 2-4 ppil EDP
FIGURE E-11 (Rues 206-214)Additives: 18-22 ppm Cr04, 3-5 ppm Zs, 2-4 ppm PP
FIGURE E-12 (Rees 215-235)Additives: 19-22 ppm Cr04, 3- 5ppen Zs, 2.5 ppm PA, 2.5 ppm AMP, 2.S ppm PP, 2.5 ppm OP
FIGURE E-13 (Rums 239-247s)Additives: 2.S ppm PA, 2.5 ppm AMP, 2.5 ppm PP, S ppm OP
FIGURE E-14 (Russ 245bic247bac)Additives: 2.5 ppm PP, 5-7 ppm OP
FIGURE E-1S (Rees 2488-253)
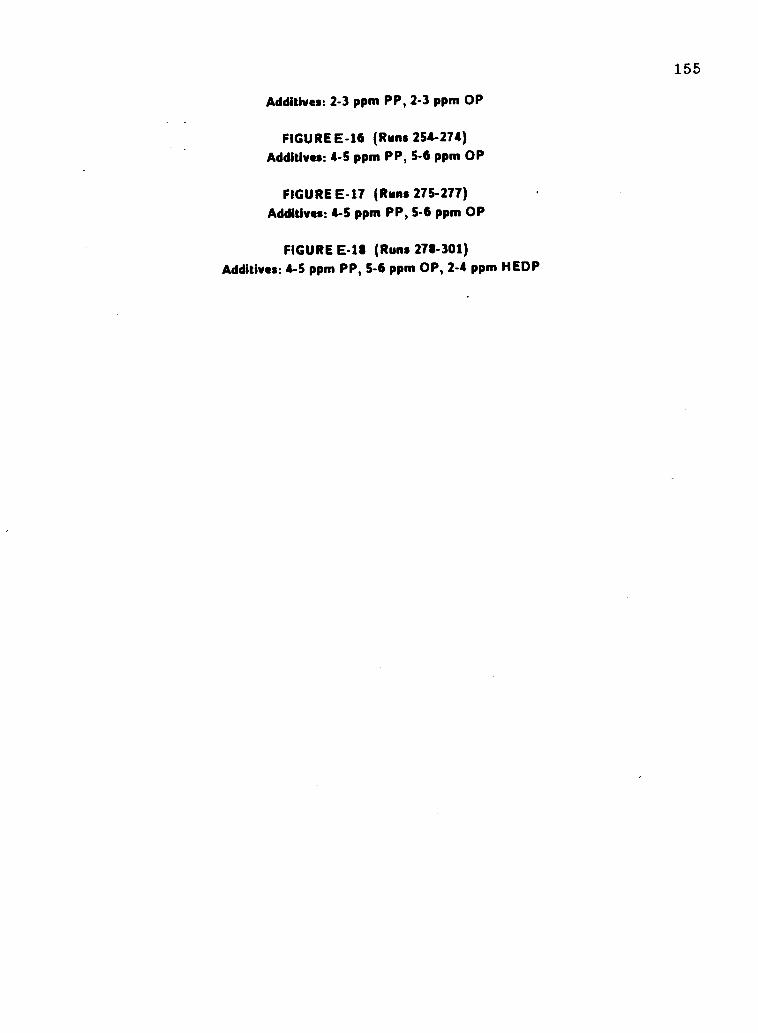
155
Additives: 2-3 ppm PP, 2-3 ppm OP
FIGURE E-16 (Runs 254-274)
Additives: 4-5 ppm PP, 5-6 ppm OP
FIGURE E-17 (Runs 275-277)
Additives: 4-5 ppm PP, 5-6 ppm OP
FIGURE E-18 (Runs 271-301)
Additives: 4-5 ppm PP, 5-6 ppm OP, 2-4 ppm HEDP
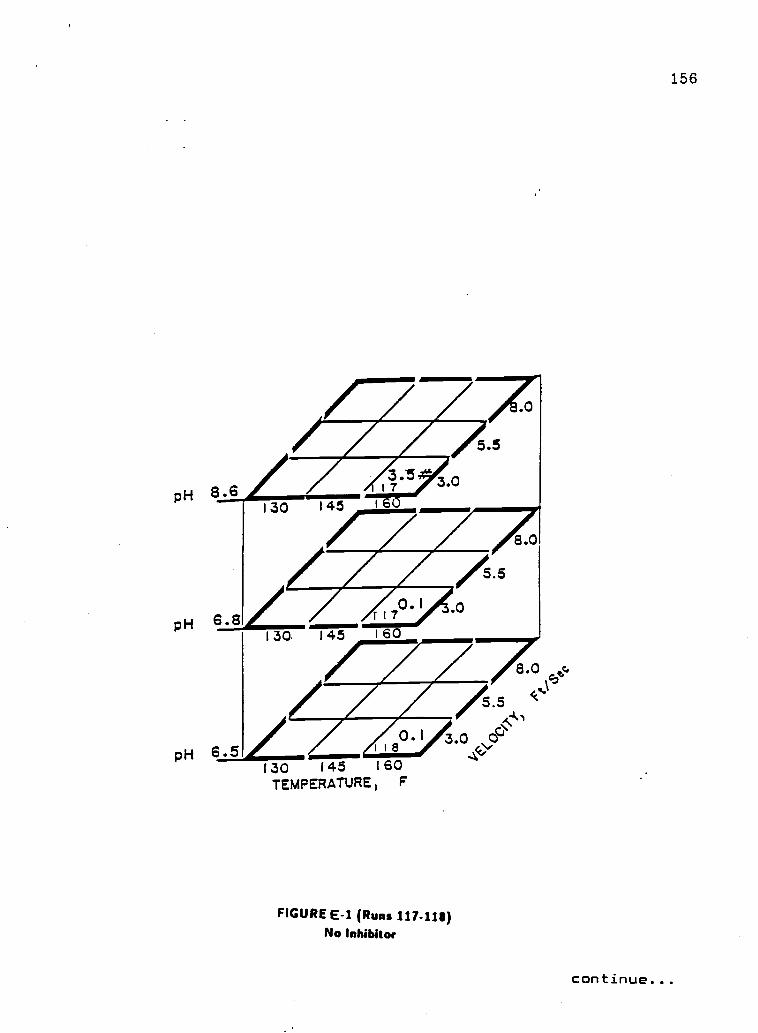
130 145 160TEMPERATURE, F
FIGURE E-1 (Runs 111-1111)No Inhibitor
156
continue...
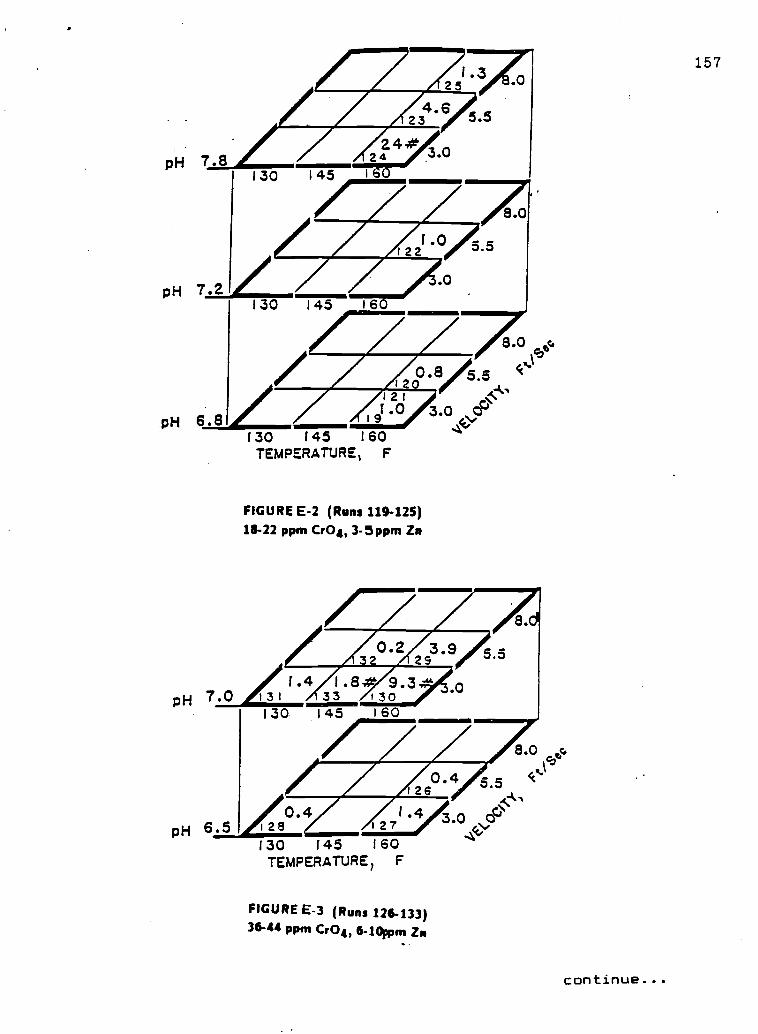
pH 7.8
pH 7-2
Arv 251.3
4.623
24#24
130 145
3.0
5.5
8.0
1.0122
pH 8-8
130 145 160
12121
191.0130 145 160
TEMPERATURE, F
0.8
FIGURE E-2 (Runs 119425)18-22 ppm Cr04, 3-5 ppm Zn
5.5
8.0 4
5.5
3.0 Or
3.929
1.4 1.8 9.3pH 7.0 131 33 130
130. 145 160
0.4126
pH 6.0.4
1281.4
127 3.0
130 145 160TEMPERATURE, F
FIGURE E-3 (Runs 126-133)36-44 ppm Cr04, 6-10Fum Zn
5.5
continue...
157
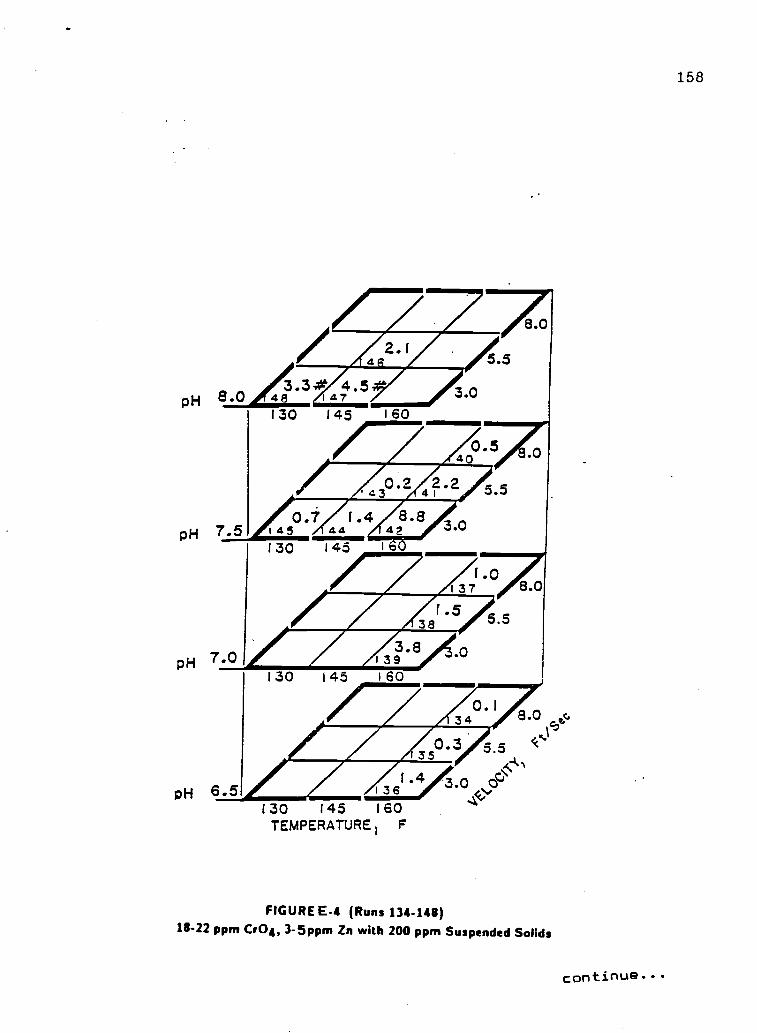
pH 8.0
pH 7.5
pH 7.0
Air 5.5
3.30 4.548 47130 145 160
3.0
0.540
42.2 5.5
0.7 f.4145 44130 145
3.0
1.0137
ArAliPr5.5Air 3.8139
pH 6.5
130 145 160
36
8.0
8.0
350.3
1
1.4
130 145 160TEMPERATURE F
8.0
5.5 ('c.
3.0 (fj
FIGURE E-4 (Runs 134-148)18-22 ppm Cr04, 3 -5 ppm Zn with 200 ppm Suspended Solids
continue...
158
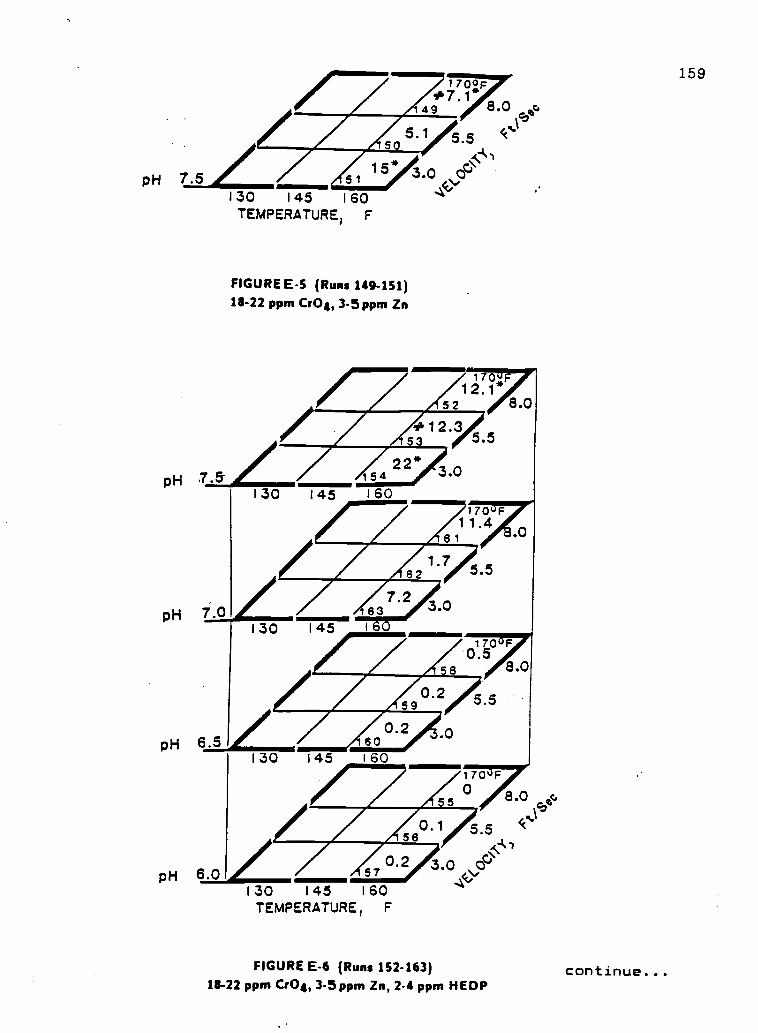
pH 7.5
pH 7.5
pH
130 145 160TEMPERATURE, F
FIGURE E-5 (Runs 149-151)18-22 ppm Cr04, 3-5 ppm Zn
.0
pH 6.5
pH 6.
1541 30 1 45 160
8.0 boa
5.5 FS
""\3.0
4\'0`"
170,.1 2. 1-
52 8.0
*1 2.35
22*3.0
5.5
170 F1 1.4
61
1.762
130 145
7.263 3.0
5.5
170F0.5
8 8.0
0.259
0.260
1 30 I45 160
5
5.5
170 F0Ar0
56
0.257
I30 I45 I60TEMPERATURE, F
8.0 boo
.1 5.5 <<`"
3.0 0C>
FIGURE E-6 (Runs 152-163) continue...18-22 ppm Cr04, 3-5 ppm Zn, 2-4 ppm HEDP
159
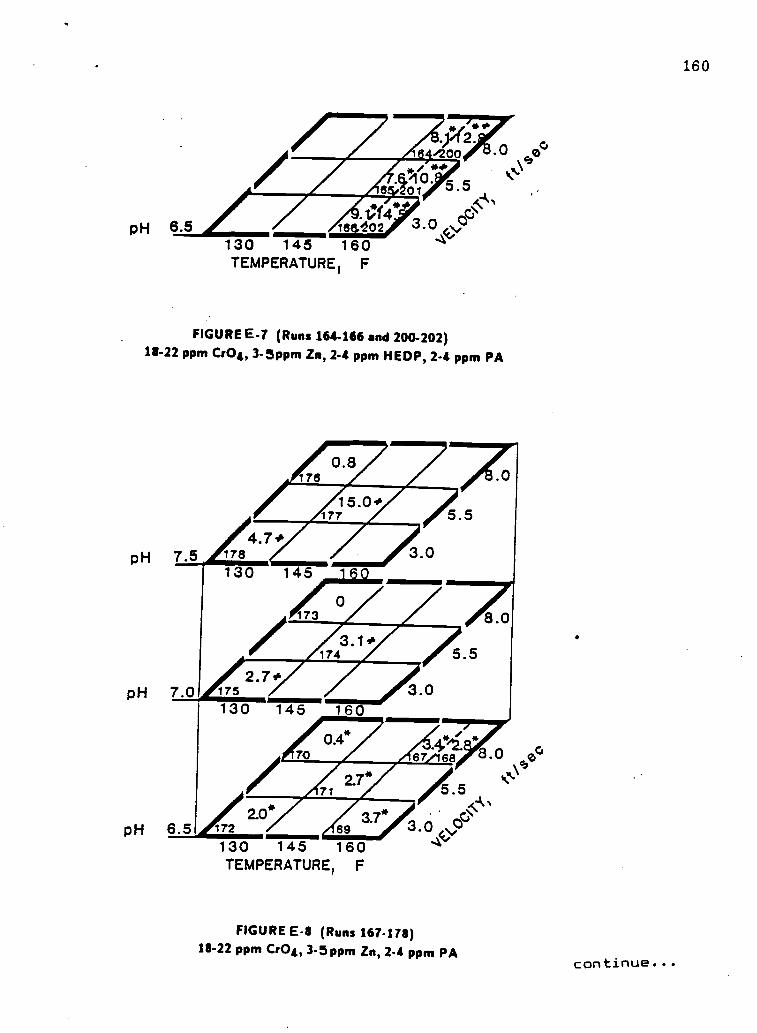
130 145 160TEMPERATURE F
FIGURE E-7 (Runs 164-166 and 200-202)18-22 ppm Cr04, 3- 5ppm Zn, 2-4 ppm HEDP, 2-4 ppm PA
130 145 160TEMPERATURE, F
FIGURE E-8 (Runs 167-178)18-22 ppm Cr04, 3-5 ppm Zn, 2-4 ppm PA
continue...
160
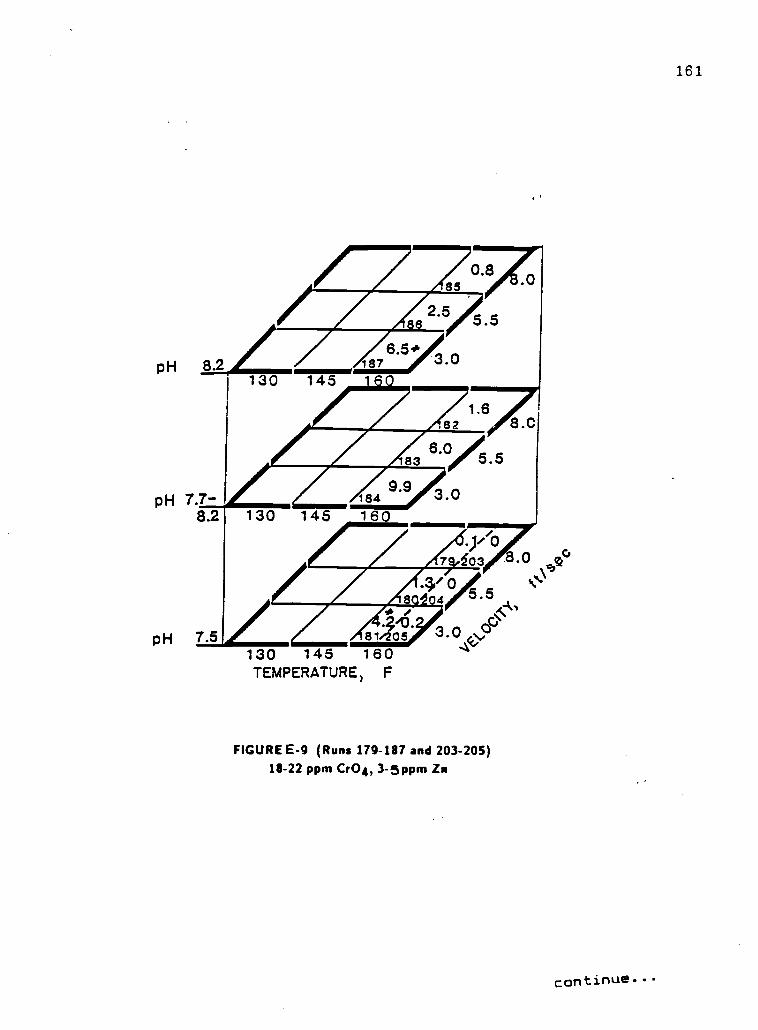
130 145 160TEMPERATURE) F
FIGURE E-9 (Runs 179-187 and 203-205)18-22 ppm Cr04, 3-5ppm Zn
continue..
161
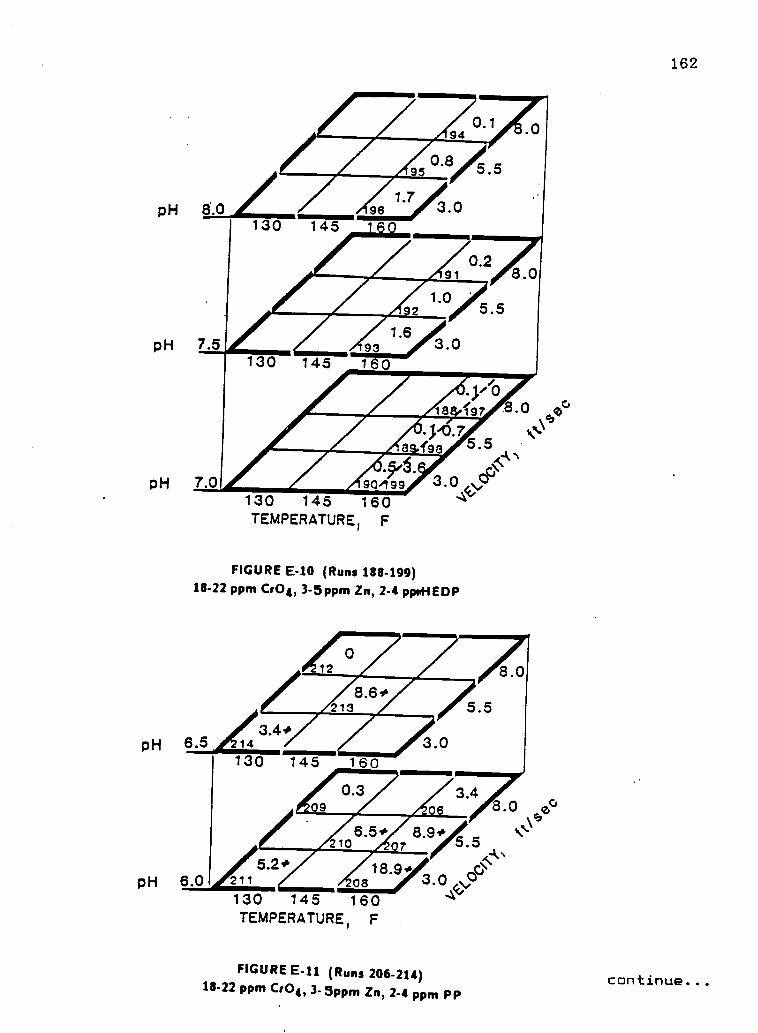
130 145 160TEMPERATURE, F
FIGURE E-10 (Runs 188-199)18-22 ppm Cr04, 3-5 ppm Zn, 2-4 ppnHEDP
130 145 160TEMPERATURE, F
162
FIGURE E-11 (Runs 206-214) continue...18-22 ppm Cr04, 3- 5ppm Zn, 2-4 ppm PP
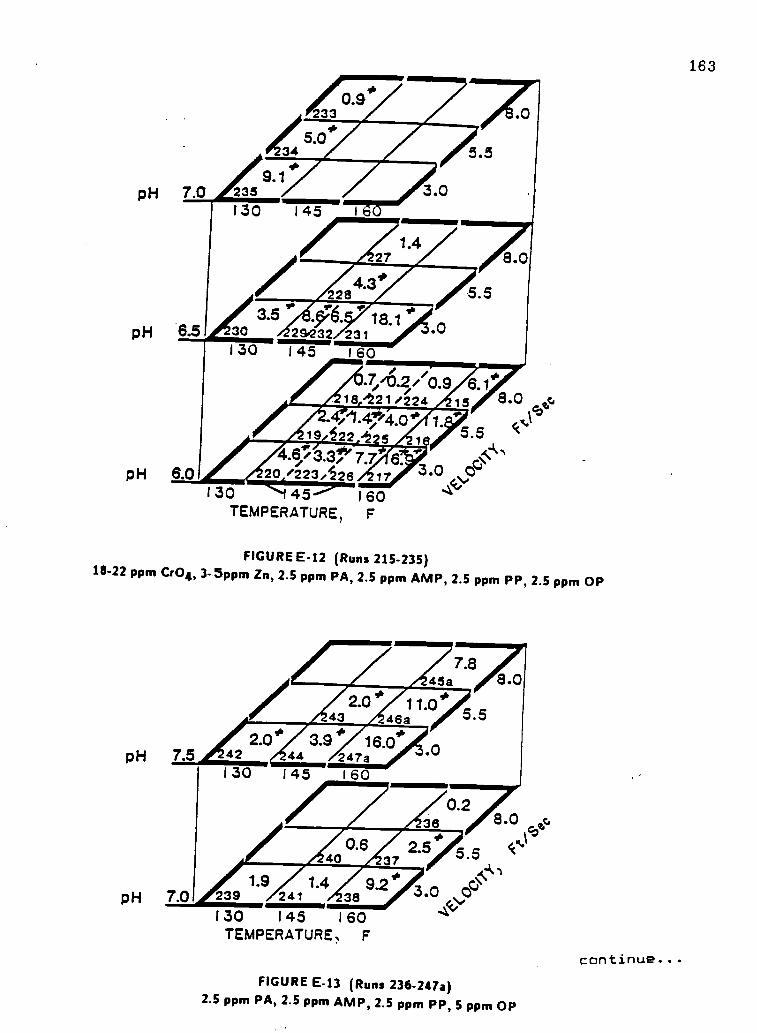
pH 7.0
pH 6.
PH 6.0
0.9233
345.0Alr
5.59.1 4.
235130 145
3.0
1.427 8.0
AV"3.5 6 18.1
30 29232 231130 145 160
-7/6.3/0.918 '221/224
"IP
4.6y3.3/ 7.7 620 /223/226 17
130 45 160TEMPERATURE, F
5.5
6.1#15
1
8.0 etc.k
16 5.5 '3.0
FIGURE E-12 (Runs 215-235)18-22 ppm Cr04, 3 -5ppm In, 2.5 ppm PA, 2.5 ppm AMP, 2.5 ppm PP, 2.5 ppm OP
pH 7.5
pH 7.0
7.845a
11.046a
2.0* 19 16.0*42 44 247a130 145 160
37
1.9239
1.4241 38
9.2
130 145 160TEMPERATURE, F
38
5.5
0.2
8.0
c°1'
8.0 c,
2.5 5.5I
os-1/41
3.0 OC>4.,"
FIGURE E-13 (Runs 236-247a)2.5 ppm PA, 2.5 ppm AMP, 2.5 ppm PP, 5 ppm OP
163
continue...
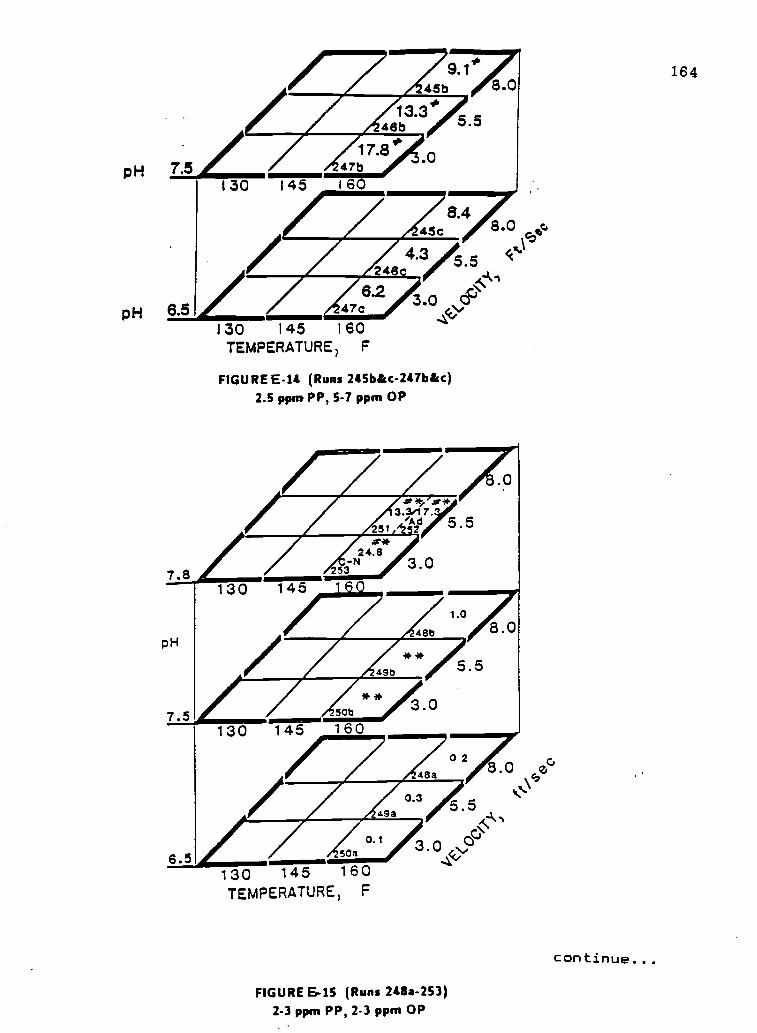
pH 7.5
pH 5.5
7.8
pH
7.5
6.5
130 145 160TEMPERATURE? F
FIGURE E-14 (Runs 245b &c- 247b&c)2.5 ppm PP, 5-7 ppm OP
c°
8.0 tc.
l5.5
<1/41
3.0 CP
130 145
At*, or*3.3/17:7
v 2'Ad 5.5
24.6
253N 3.0
48b
1.0
* *49b 5.5
**SOb
130 145 1603.0
8.0
.e 49a
0248a
0.3
0.150a
130 145 160TEMPERATURE, F
FIGURE E-15 (Runs 2411a-253)2-3 ppm PP, 2-3 ppm OP
continue...
164
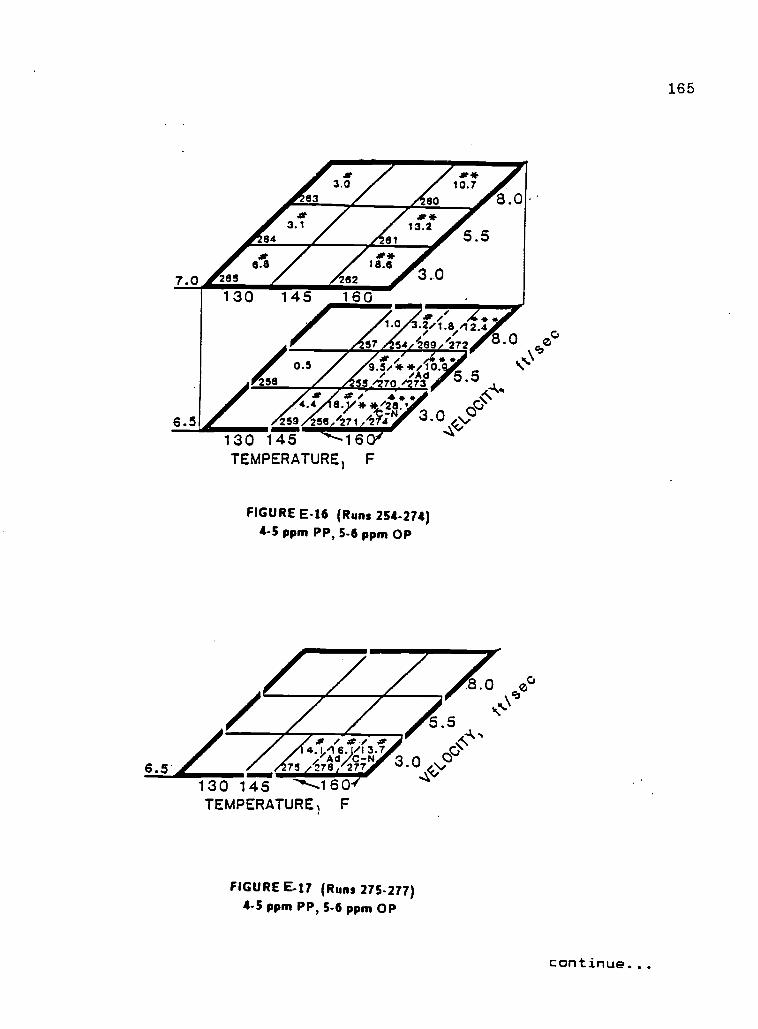
7.0
6.5
6.5
3.0Ai 60
.te*10.1
es r 8.0
APIIIVAli5.5ASTAIA73.0
130 145 160
1
.**1.0 3.2/1.8 42.4
57 54 289 272
0.5 9.5/**/10./ Ad258 55 70 /273
4.4 / 4sy**:28.1259 258/271/2fZN
30 145 "1"--16011
TEMPERATURE) F
8.0 zc'co
FIGURE E-16 (Runs 254-274)4-5 ppm PP, 5-6 ppm OP
130 145 '--.160TEMPERATURE) F
FIGURE E-17 (Runs 275-277)4-5 ppm PP, 5-6 ppm OP
continue...
165
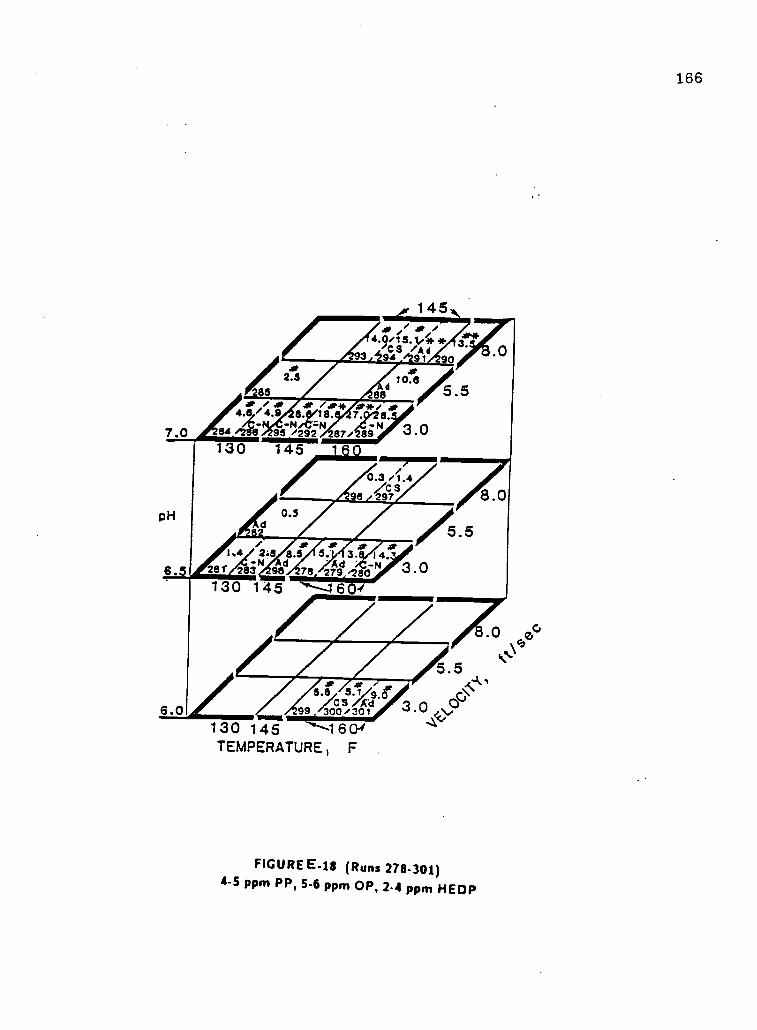
7.0
pH
6.5
6.0
145/
4.0/15.1/0 /Ad3 94 91 9
2*.3 10.8JP
a65 8841. .1 4, aft / arit Arie / 04.8 4.9 a. 18. 7. a.
84 /2 8- 95 /292 287/289130 1 5
0.5d
3.0
or0.3 /1.4/CS
Arga 1/ xr * *1.4 2.5 8.5 3/ 3- 14.d Ad -N281 2 3 N
95 78, 279/280130 145 "f"----160.1
3.0
3.
5.5
8.0
5.5
5.84* ale
5.1A.5.8 "d99 3001301
130 145 1604TEMPERATURE 1 F
FIGURE E-18 (Runs 278-301)4-5 ppm PP, 5-6 ppm OP, 2.4 ppm HEDP
166
167
APPENDIX F
FOULING RESISTANCE (Rf) VS TIME - PLOTS
Beginning with run 173, these symbols are used on pH,
conductivity, and corrosion rate vs time plots, unless
otherwise specified.
0: pH
+ : conductivity (mmhos/cm)
6 : corrosion rate (mpy)
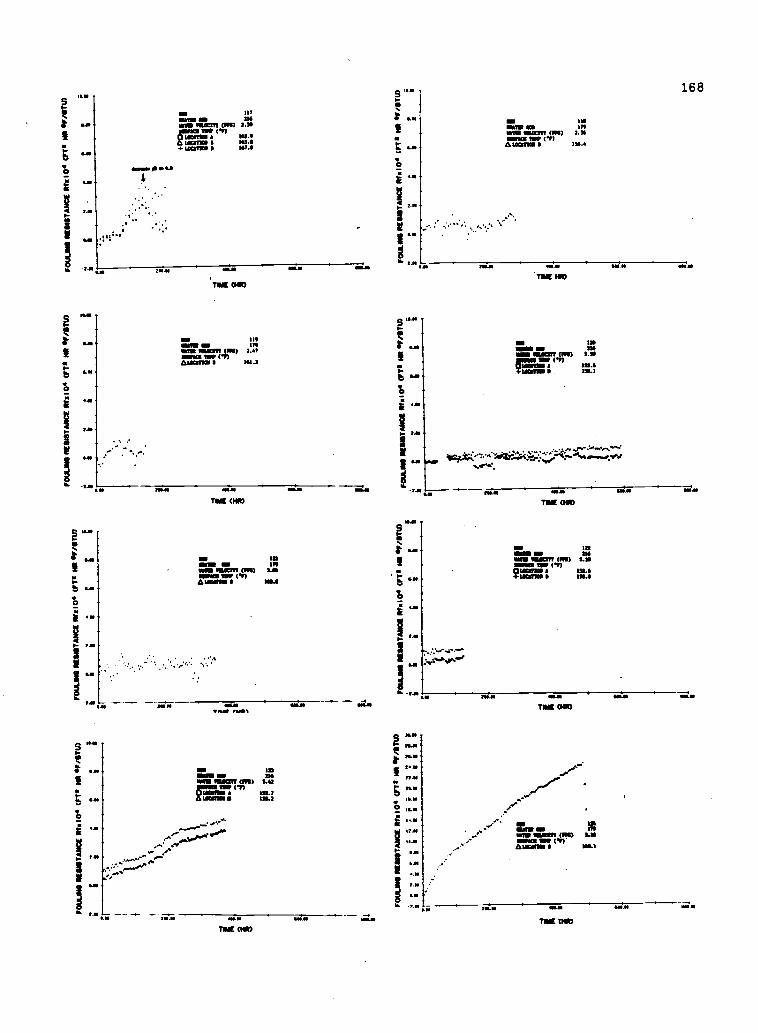
rotte
n R
ES
IST
AN
CE
RIK
104
(F
I. M
R O
F/S
TU
)
FO
ULI
NG
RE
SIS
TA
NC
E If
R 1
04 W
TI N
I OF
/ST
U)
FO
ULI
NG
RE
SIS
TA
NC
E h
i 104
WT
I NA
OF
IST
U)
FO
ULI
NG
RE
SIS
TA
NC
E R
ix 1
04 M
a N
O IF
/UT
U)
8I. II i
;
$ I
4),N
t
If
31
i!gi
i
32a
!Si&
a
$
1111
1
31
;aa
4-1
4101
111
!!! ;VE
FO
ULI
NG
RE
SIS
TA
NC
E R
h I 0
6 M
T M
R O
F/II
TtO
r2
.2
; ;12
41
4.
FO
UU
NS
NE
SIS
TA
NO
IE R
IR I
coC
FT
O 1
0 O
F/S
TU
)
I;
St 1
.I1
FO
ULR
IS R
ES
IST
AIIC
E 1
0810
4 IF
TI M
R 6
F/S
TIA
;
111"1
h%
FO
ULI
NG
RE
SIS
TA
NC
E R
ts10
6 (F
T. H
P 6
F/S
TU
I
;;I a I
31
141. if
!!
1))
piI
0) OD
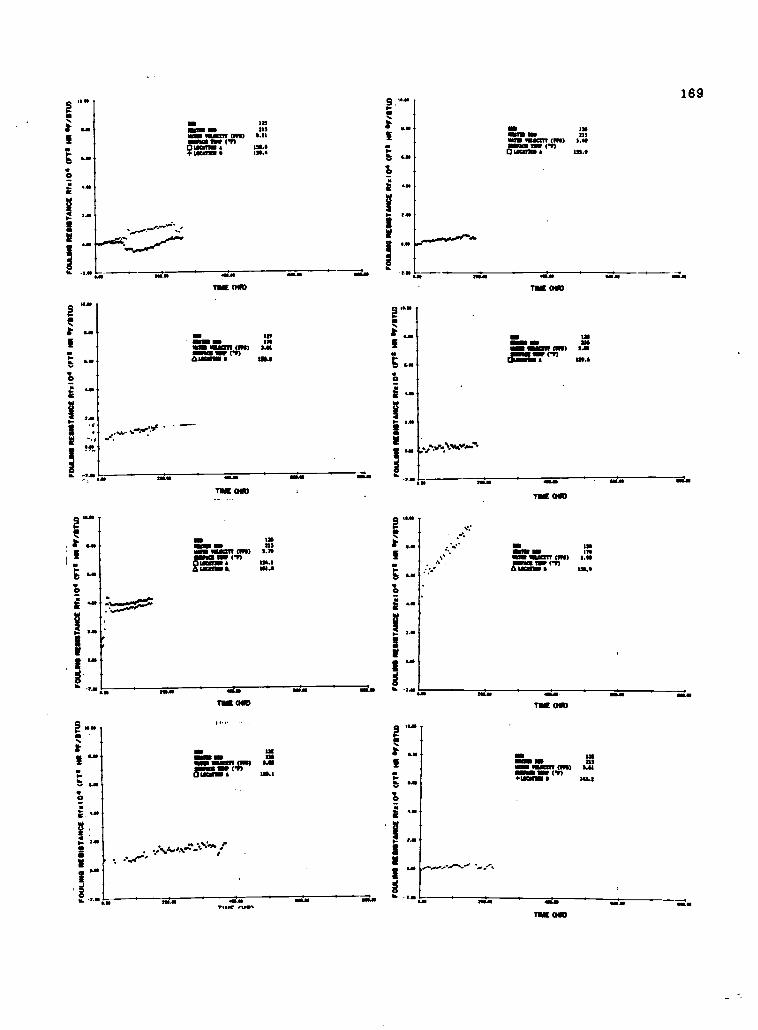
Jib
1 /101
55
5
4I
OW
v0120/ 30N11IIIIIR
1Y talf10,1
3
01110/11. al ILA .0111111 3011111111111311001110/
01(11/410 MI 1A
) 0111/10 301111111111130 Oorricca
2
01.11.0/4 w eLJ) .0110 30011/111110111110111110i
5"::!!
F.E
1 ;N
a! ;
hI
.t3
.i
3
II3
3!
.33
35
33
!3
3!
01/111,14 Illi via 4111 0000111103111011-1110401/11/4 al m
ai) to I nv norraosui amino.
S011.11/4 MI 81.0 .01 R
N 3011111(1183111 gM
1110.
i;IF
53
3
-;
33
5
slip .0 I xim 30N
11ae1e30 ON
I-Iffed
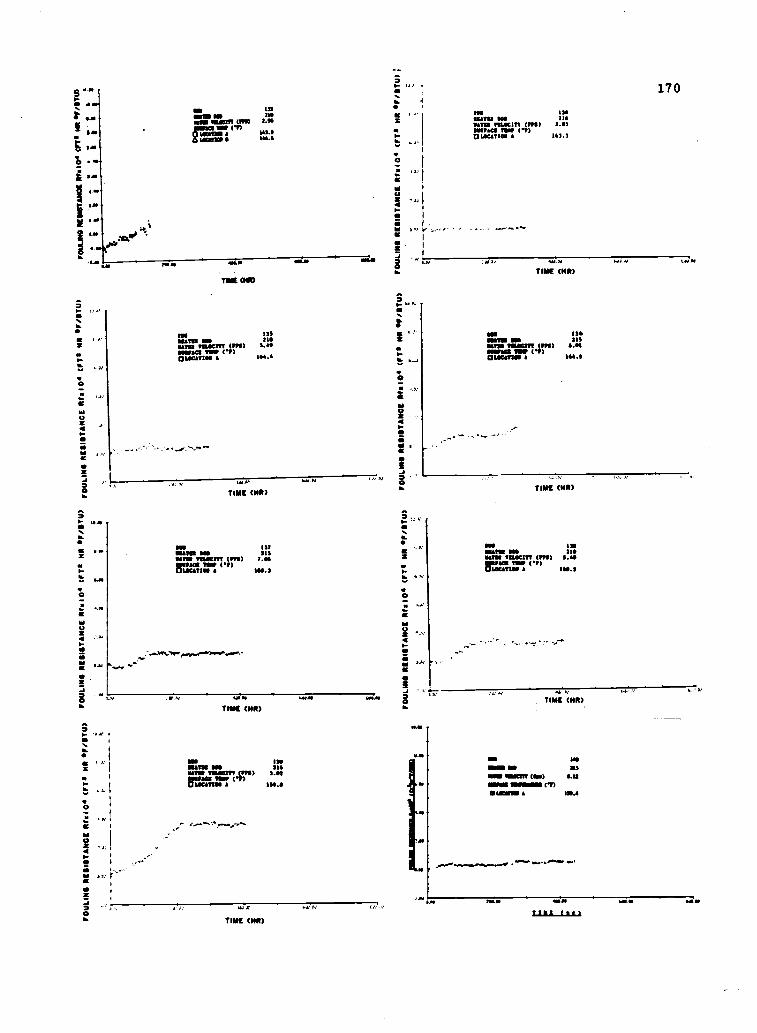
FO
ULI
NG
RE
SIS
TA
NC
E Il
ia 1
04 (
FT
* N
M //
/// 1
).-
.
;'t
, x-
..,
E
a
a
FO
ULI
NG
RE
SIS
TA
NC
E R
fa I
04 C
FI*
111
1 F
/ST
Y)
;;
;a
FO
ULI
NG
RE
SIS
TA
NC
E R
as 1
06(F
T*
NR
F/S
TU
)
FO
ULI
NG
RE
SIS
TA
NC
E R
ag 1
04 U
T*
NR
F/S
TU
/
a1
r.-
ISSN
Y.
°PE
gi
I
'.3
FO
ULI
NG
RE
SIS
TA
NC
E W
s 10
4 (F
T*
NO
III,S
TU
)
FO
ULI
NG
RE
SIS
TA
NC
E F
M 1
06 0
*Te
NS
SF
/ST
U)
;;
;*
; I
t
FO
ULI
NG
RE
SIS
TA
NC
E M
a 10
4 (F
T*
NM
0F
/IIT
U)
;
a
O
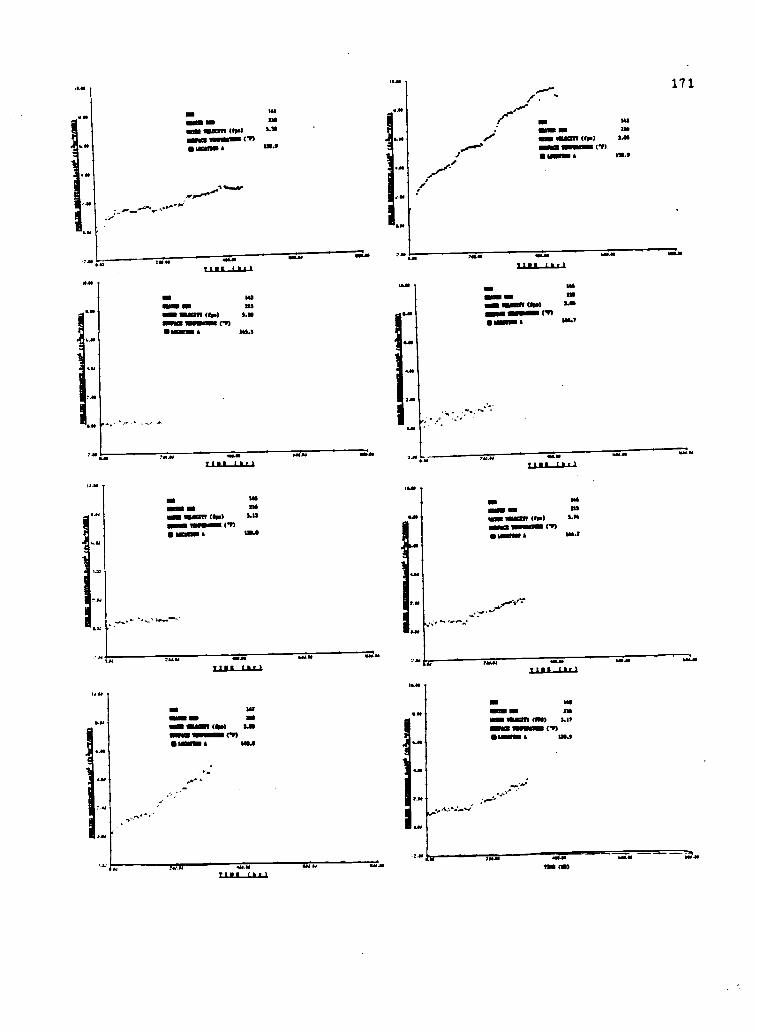
54
35
4I
5''T
IIIEV
lr75Prniiii. Ord
aid
1!!
3mm
iraw:in. ine.: I
11!
;I
UD
I5
a
1
F
1
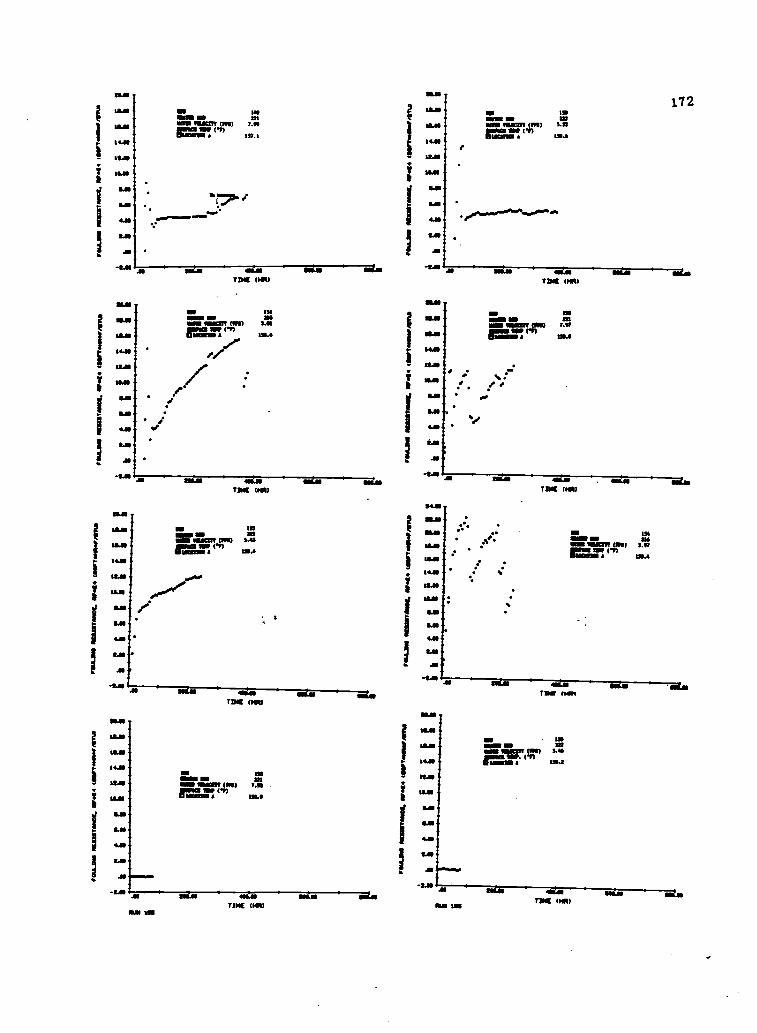
04111/o/a0A41/1/1 111yram
may
IF
ti1\1
euiveraraain sar maram
st Nam
e
I11111.3 313;
; ;! 333 4
inallii~eu01111
Icas.7C
MO
anr111 SK
IMP
/1110111.010L110111
.101N1111111311 N
I1O/
011411~011111 O
WN
Of T
edm
ayamm
um sum
OIN
AS
IIIM 011111114
I11S/41011091 24111 W
IN.11111131Iurns.
Inaill/JWociJIM
I)D
esi'1O
M1111111311 0111110,1
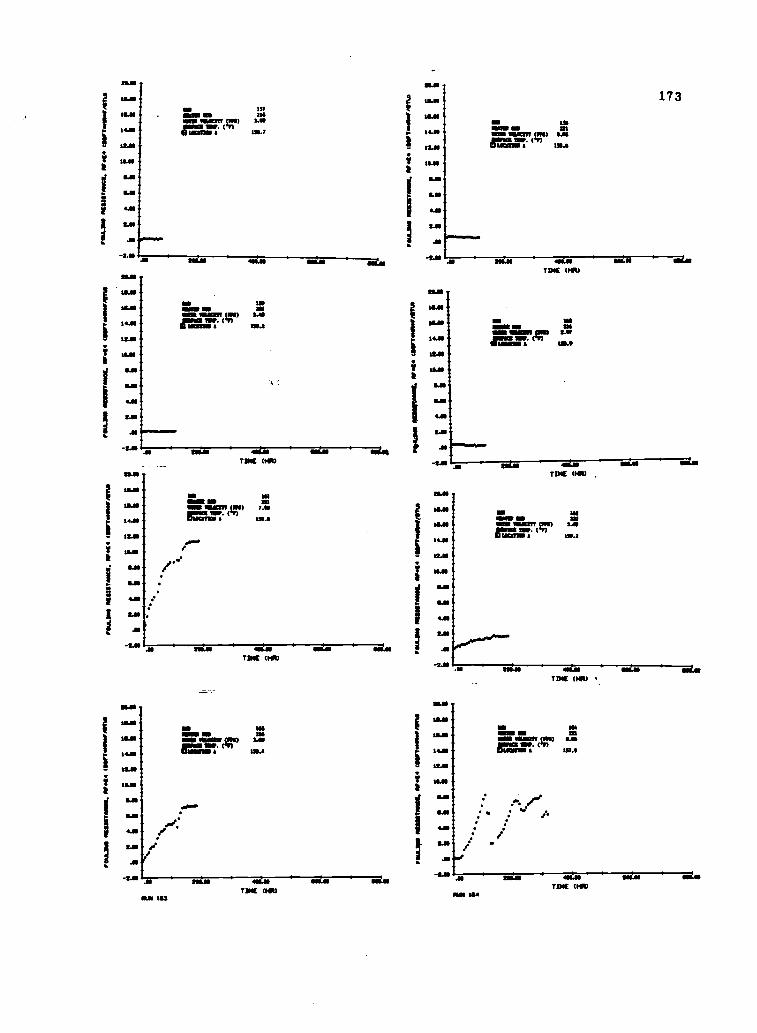
IFO
ULI
NS
111
1111
11T
AN
OE
, re.
(4 t1
1117
1001
1TI
is
..N
.1fp
"i
.offl I
F F-
r111
.11.
1111
1 11
11.1
11S
TA
NC
II. M
K. I
MM
OO
MM
AIT
UI
IMO
LAI@
ICIII
ITA
NC
E. M
,K4
CIII
IFT
0111
11,0
1111
,11
ii;;;;
Iiiii
i ;I;
;;;Il
itti
I1
'I
-....
....s
%I
41.1
11
IA
iI
31
if
;NE
ir!
Eli
ITP.
;Ez
ati
FO
ULI
NG
NC
IIIIT
AN
CI.
nrea
INIT
emoi
scril
lne
F.
task
ip 1
1111
1118
1huM
g, T
r.14
111
11W
7011
111W
AT
IOP
OuL
ami 1
1111
1111
11M
a11.
IiN
44 4
1111
1441
1MitI
P1
ovul
e fi
gnav
ai/S
.1.
.14
INIT
OG
OIC
AM
Illre
m.IN
S P
ISIU
ST
OM
IS. R
I414
;k;;;
;;Thi
l ;11
;;;;I
titt!
ks
ill I
bky
k
t
111
,..,
.,.
hi.
pi%
.I
3.1
41
ii
IA
- t
E in
I- r
! ;ii
! hi
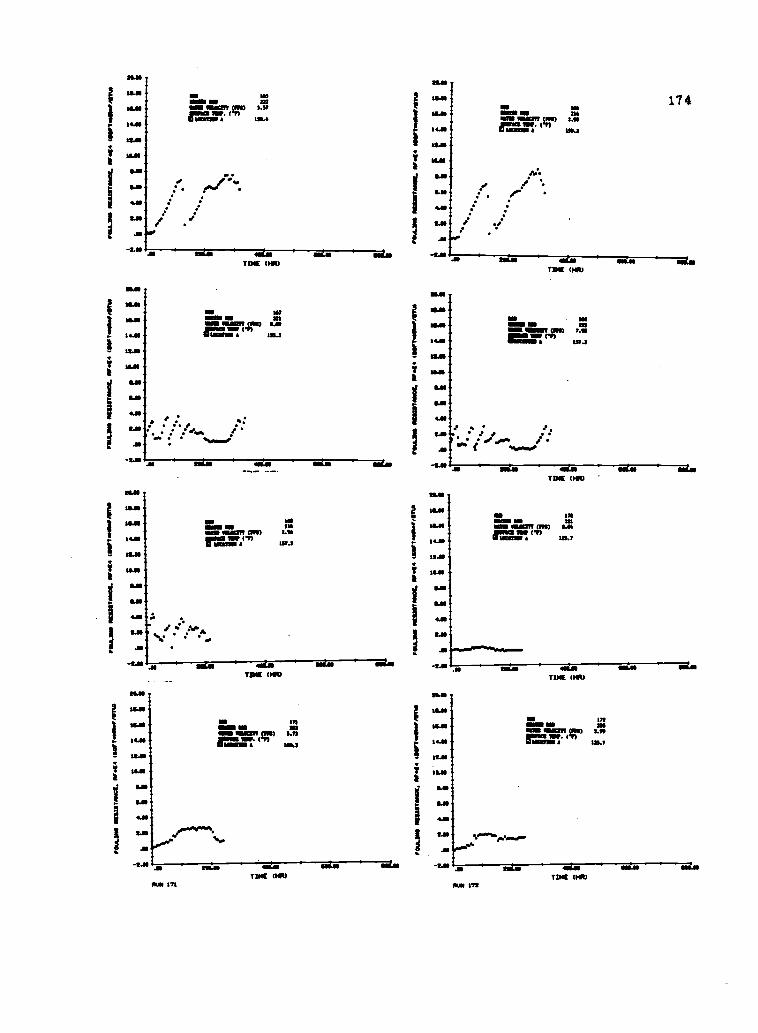
4.e.
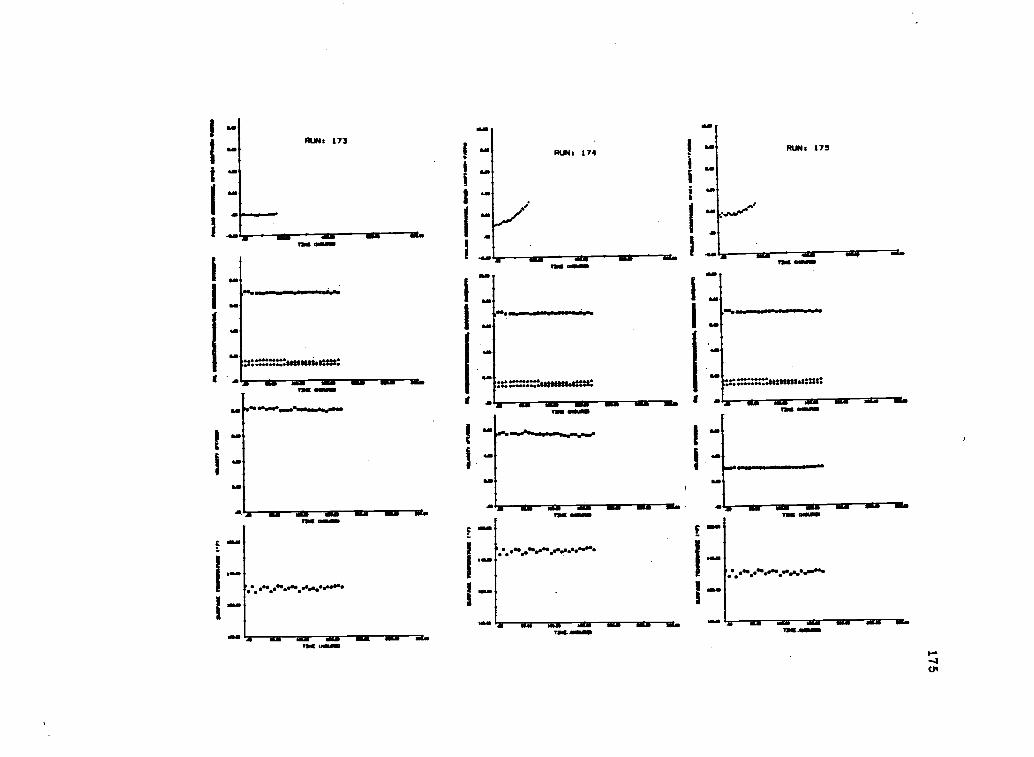
Vt
%to 1i
$411"StebOtt
ow°
...0:I0141411.414*.
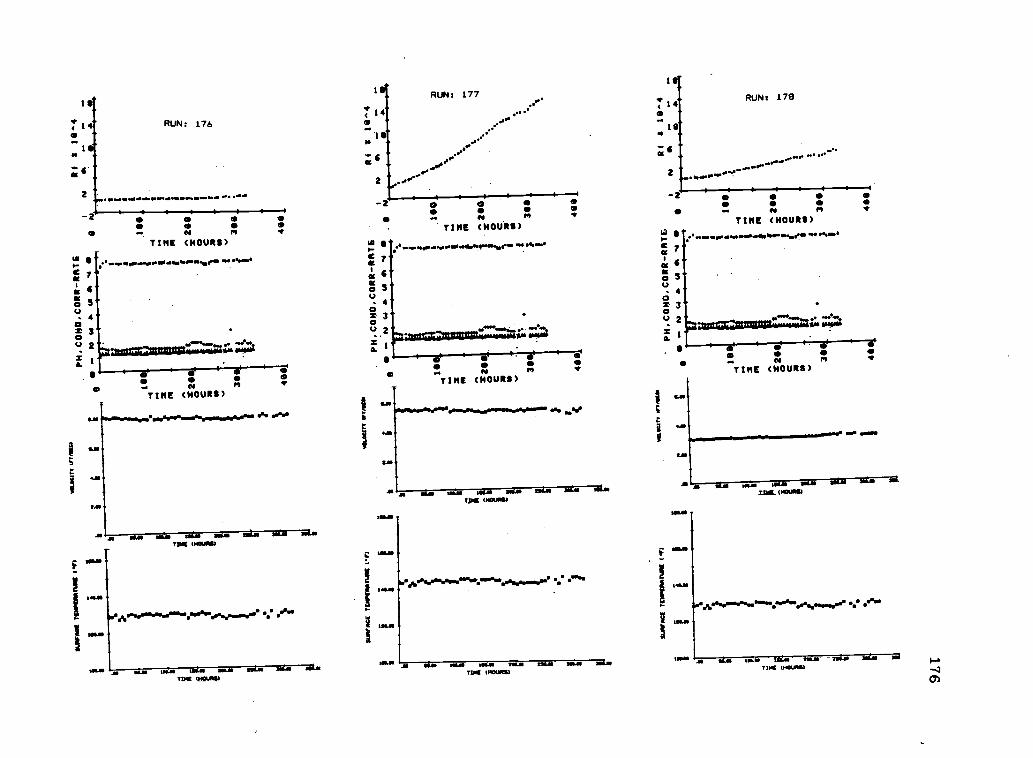
4 1
04
-2
RUN: 1764
eses esr N
TINE (HOURS)
om
ose
1
s 7
6
ocp
4OO(.1
111.
S
3
2 macm:amome4716,1rp
0 0 0
TIME (HO URS)
11141 CORIUM
14
'to
RUN: 177
0
11
7
w
o 54
0r 3
t.) 2
z ,a.
S
TIME (HOURS)
uraizazamnaleww:7.61101 w 042
1 4
1S
ss2
RUN: 178
rr
-rI I I I V
eV
TIME (HOURS)
5TIME (HOURS)
MAI
TAR 1101X1111
s:
1014, MAO TONTIM CROUPS)
N0is 6o 5
40z 30
*
0.
wl`ar 0410411
es 0 so
T INE (HOURS)
1 (HOUND
TINE (1OURSI
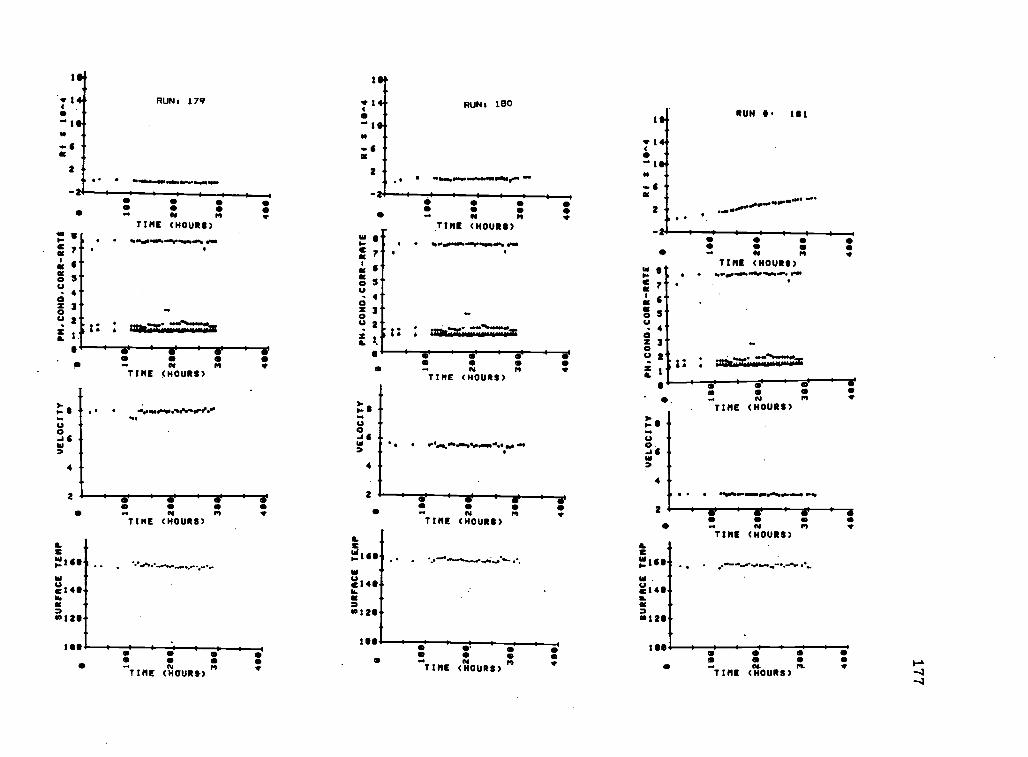
1S
91*. RUN: 179
.
-
2 -. .
-2
eN ft
4111=
N 7,
o 54O
z 30u 2z
S
s-S
0-1 6W
TIME (HOURS)
SI
SN
TIME (HOURS)
*owe...%0~0.0bee
TIME (HOURS)W- S
7
o 3
4Oz 3oo 2
:011=41.41=:Za.
TIME (HO URS) M
. N n f . a nTIME (HOURS)
ISO
TIME (HOURS)
1, 4111 't , 1O 0 1
01
o e e. al
TIME (HOURS)m
zWilts
c140U.
=0120
1SS
.
RUN S. 151
So 44 eN n wTIME (HOURS)-........
7
S
3
4
3
2
S
: Mill=1=Z:M$ el 4 01 4 01
.. N MTIME (HOURS)
. N nTIME (HOURS>
.% wile .
W -uw14S-U.o12S-
-
e
TIME (HOURS)
ISO. oII-.TIME
444ea-
(HOURS)m
si
w
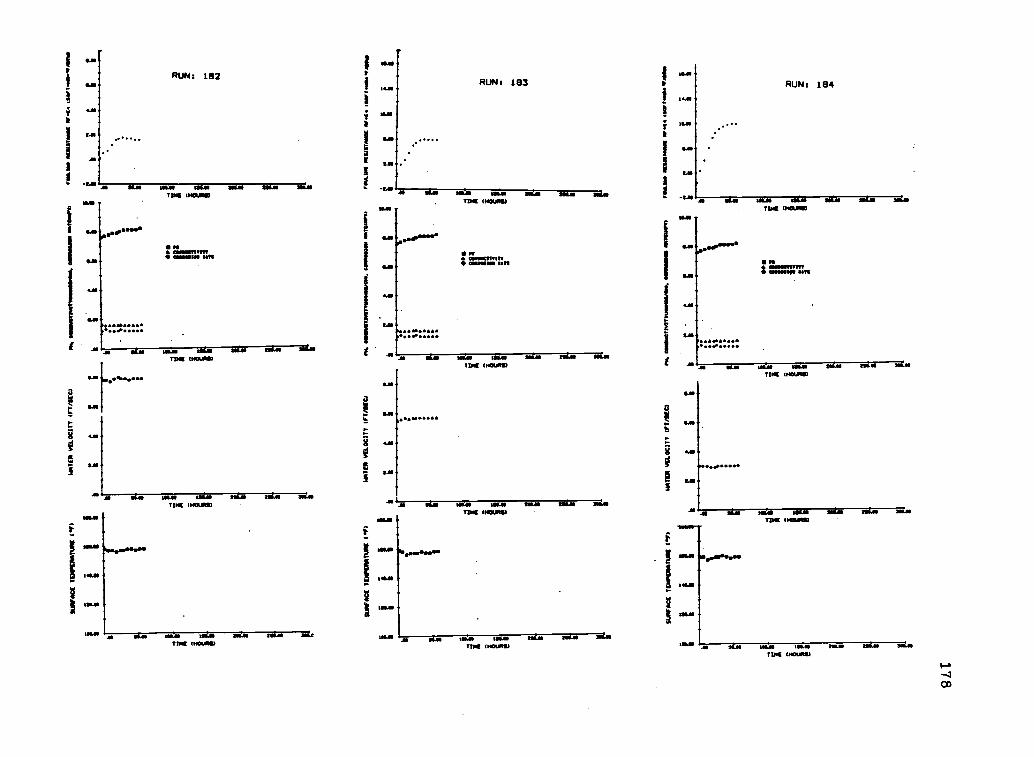
SU
RF
AC
E T
EM
:WM
(.1
4W
AT
ER
VE
LOC
ITY
(F
T/S
EC
)11
46 1
1111
1111
111T
IVIIT
OIN
INIM
Ille.
CIO
NN
INIM
ON
011
1111
1/13
CO
MM
ain
ialn
rain
INV
I tee
rloaW
ollin
s
SU
I1F
AC
E T
EN
IES
AT
UIE
RF
)
SU
RF
AC
E T
ER
OM
MA
TIS
IE tF
)
YA
TE
S V
ELO
CIT
Y tI
TA
MIC
aP
ol. 1
/001
1111
,411
1410
0., e
alel
eaN
N d
ale/
!ro
am O
RS
ISM
ICE
MK
, aso
rtw
Ile M
UIM
S
MA
TE
R V
ELO
CIT
Y IF
T/S
EC
Tea
raus
Tpa
rraw
asta
r. 0
1110
1111
11m
ime
4111
1510
011
areg
110
11M
WV
OIN
IM
9L1
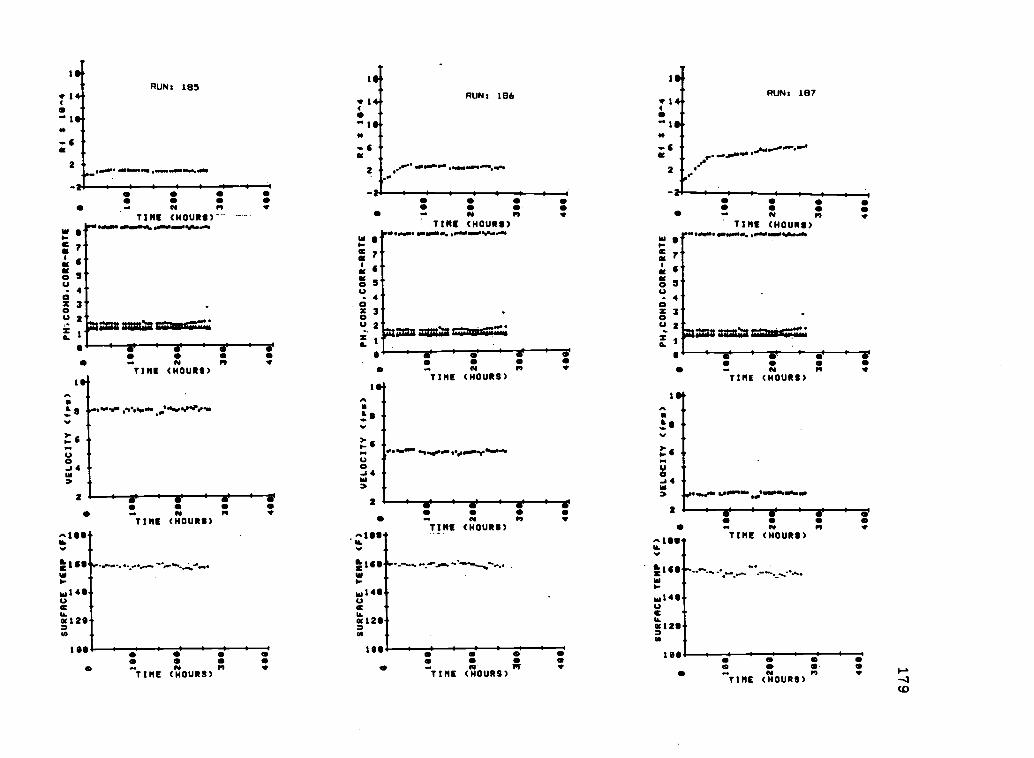
I S.
+6K
2 -
RUN: 185
0
I
7 1 4.-
-" 1 5-N -Ni
2
RUN: 186
IRUN: 187
7 1 4
"IO*VP 6
.. w000ff.s,e
2
2.O 14 0
TINE (HOURS)----- N 0 ft
TIME (HOURS)
- 40z 3u 2
a23211SLCZMIII1
:4
TIME (HOURS)
we
3-,.
00...I 4
2
.IS
lee
NTIME (HOURS)
0 0
TIME (HOURS)*
W 0c 7
00o 5
4
z 3
c.) 2Man =lib =12II=0;z
w
PoWP of...800,..owswOWNsoft
,P- es W."
0J 4
2
.. * mTIME (HOURS)
T IME (HOURS).1+14
141 -
140w111-
c10142S-m
ISS. & I
00
TIME (HOURS) w
W5-
7
at
o 54
0z 3u 2z
TIME (HOURS)..m .11....1160....11118W.OWWO
a aamb sz:usirft;
TIME (HOURS)ro
. ea mTIME (HOURS)
100 00 s
3-4N 0.
TIME (HOURS) -.1
QD
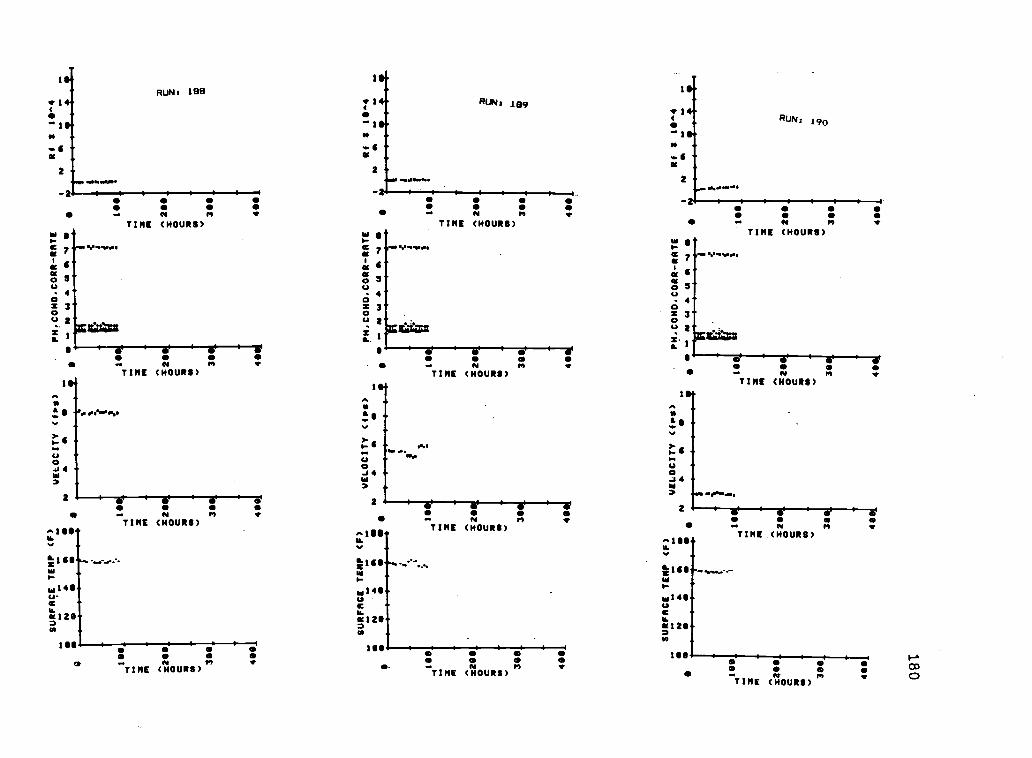
SURFACE TEMP (F)
..
.. st
o.VELOCITY ( (Ps )
om
aN
aa
a0
mono.
/*
C
.190
.10
..
x3
am
o.
.z200
= o20
cC
aa
to
a.
.390
30
400
PM. COMO, CORR-RATE
R f
i 111.4
I14
4,4
".T
#4
.I
1 , 4
t I
1;1
i I
-t1 0f11
I II,
...
-.I
lez
.... z
..P
I
02
210.
a
31
v311.
400
4001
400_
SURFACE TEMP (F)
VELOCITY ( f Ps)
emaaa mama
sow.
s4
44
1*. .e
Ie..
fIS
m m299_
020
CC
aa
3410.,
401_
11
_4100_
3 m om400
C a-
v300
081
30
499
p14. COND. CORR-RATE
04.
Rf i 10.4
C a a
391
2 211
0 a
3
49
401
a
a
SURFACE TEMP (F)
VELOCITY ( f as)
PM, COMO. CORR-RATE
ma
.0
100_
2200
O C a
390_
490.,4
aRI S 10.4
041
,
Is
129
C a a
30
490
C a 411
301
40
8
4
rS
I4
II t 2 0
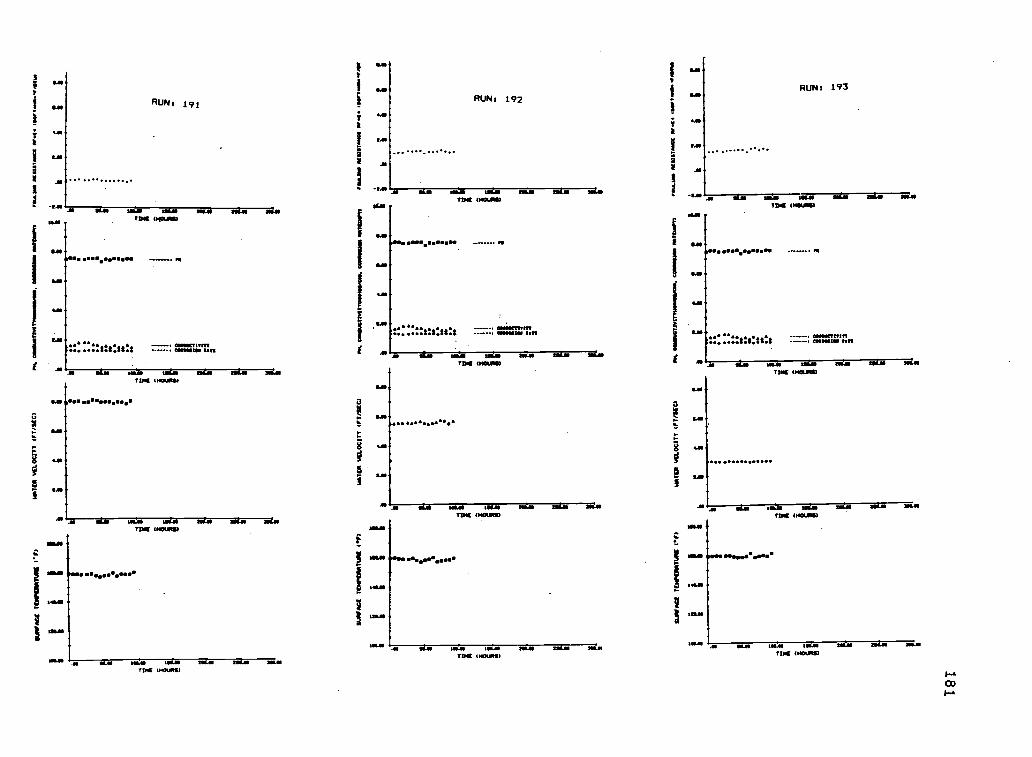
2
I
Y
1
20
ILO
I
L. 22:::22::::8:te:1
SAS 242
aV
RUN: 191
1111.211 LfSali(142212M
.14.122.2. ..... Pe
1MS2211222200111412 Ian
TIP* %MOPS,
'FDIC (MUM
mwas 1141 MAO 215.211 212.55
TIK 1221222.2)
V
v
a
8f
ILA
a
RUN: 192
.
1211.0 tam raw :viaTIM MOM)
2D2C (NOUNS)
IN MAI11121 (HOURS)
RUN: 193
mai sm. saa212R 1.122111263
ameserturr_sat_ 2411
ISLIO MAI11121E 0201.11252
S.
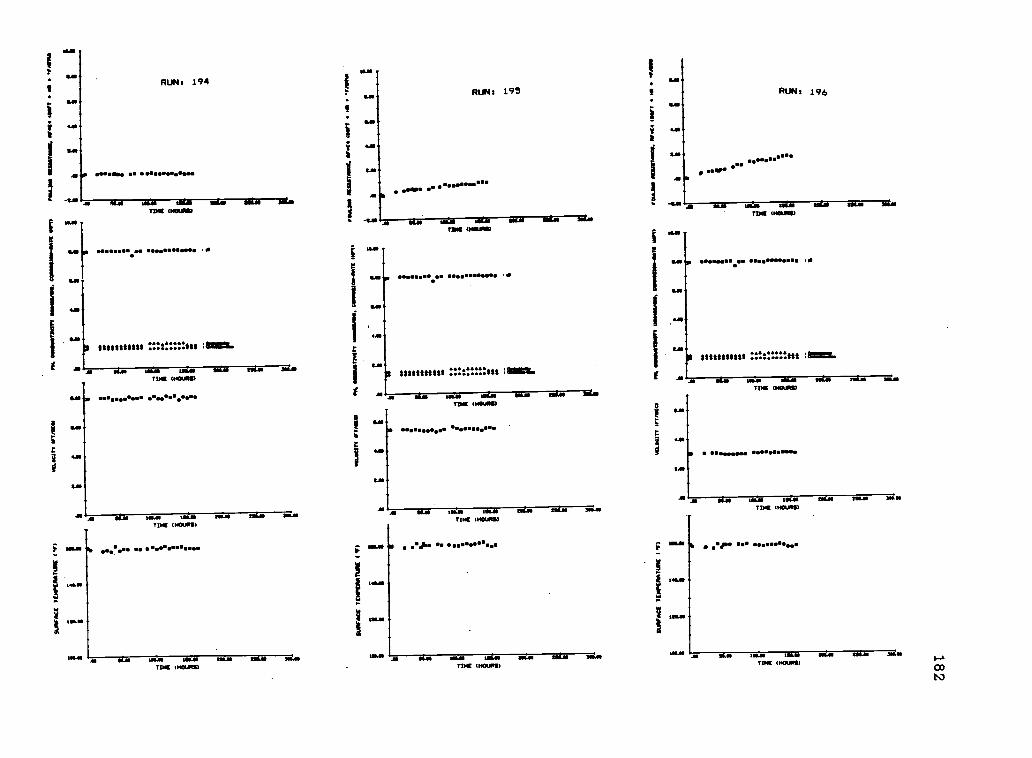
I
RUN: 195
OOOOO 06.6 0..6060..0
2411
a O11.1.LNI MO MAO
INOUR0)
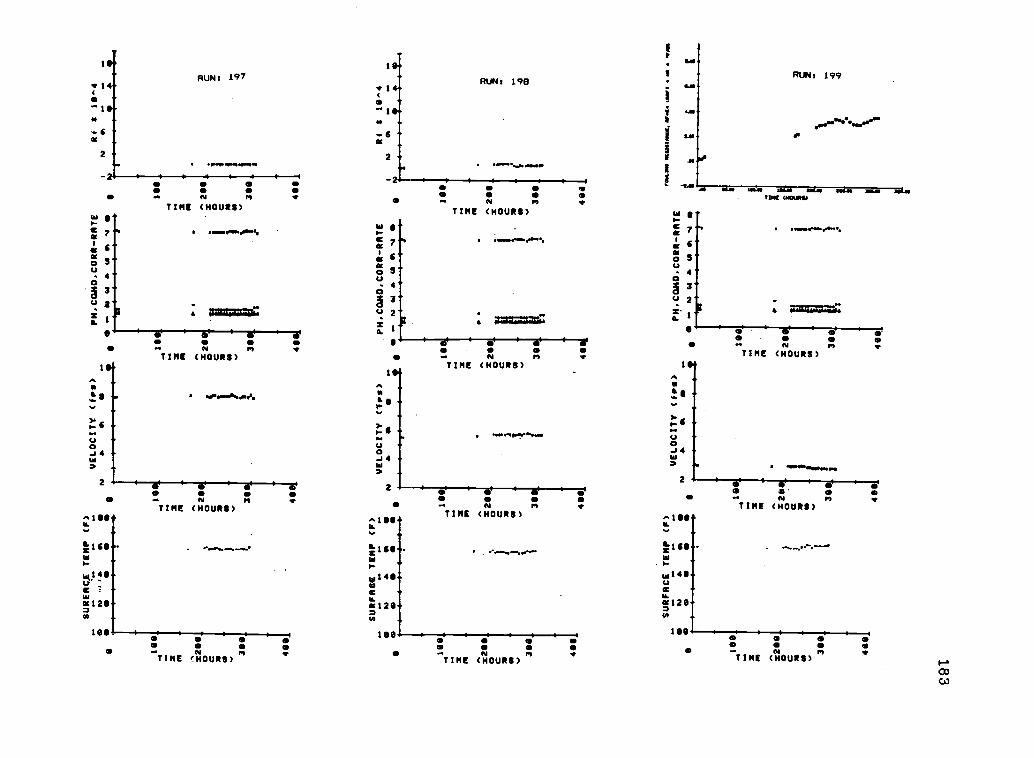
SUREAC.E TEMP (F)
VELOCITY (fps)
ON
01
N0.
01
14 1
1, 4
1114
.160
z m a x200
220
Co C
22
o o)
...
.0
390
t301
409_
499
PM.CQMO.CORR-RATE
N
leIS
O
no x2
2
3 4
I
SURFACE TEMP (F)
VELOCITY (fns)
PM.COAO.CORR-RATE
Na
01
Nas
a*
.199
z20.
0 0
3.
4,
14
- -
SURFACE 0
TEMP t1
.10 el-
m 0z20
0 0-
360_
406_
(F) i
NVELOCITY
00
(fps)
-4
.19-
z m.
21111
o c
300_
: i
no
to-
...
r t
409_
Ci
eN
1
x296
2
3 4
2 ^205
O onof
3 1
Rf S 18^4
NOt
-a
.11
4 Ti
1_2 z260
-
IC0
i
:i
1,..
3 1
..
PA.CAMO.CORR-RATE
450_
RI t
10^01
N01
I 411
111?
4?G
2
rom
an 0
0111
1111
01.
40 e
llOIT
1011
00
.19
. z m a26
z o a 2 op
386
49
1 I1 1
4l
. z m a x 29
0 c :
309
498
a4
II
1i )
ti
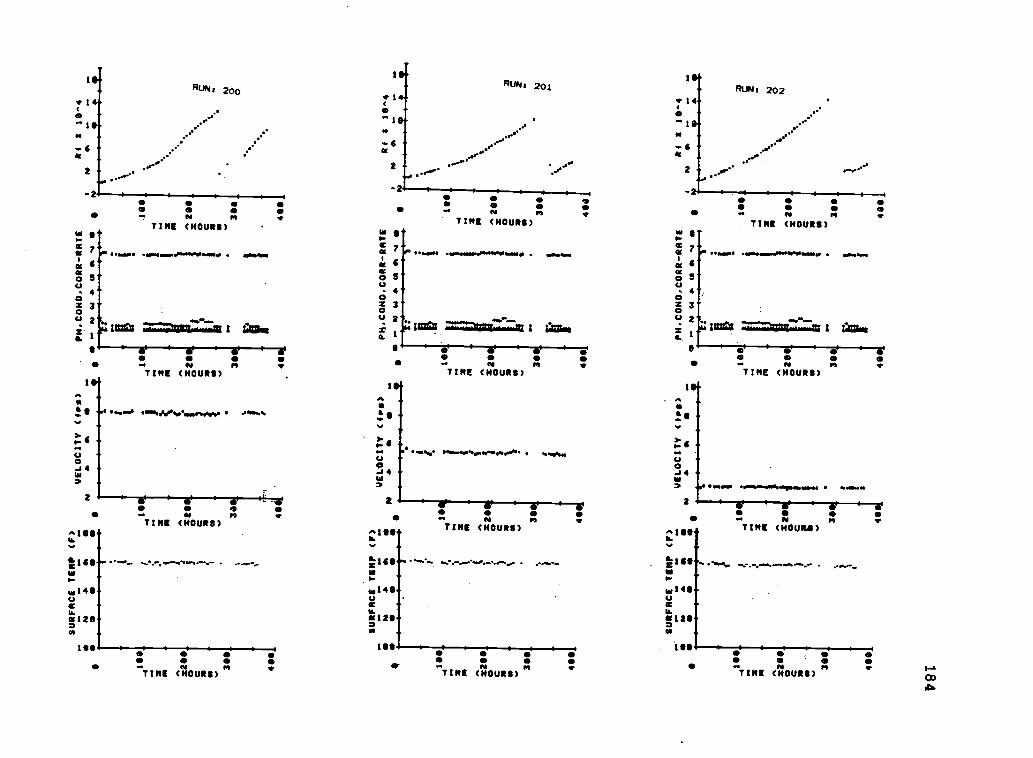
14-
-6 -at
2 -
RUN: 200
d.r
..21--TIME (MOUES)
1
T IME (MOUES)
"ftvo ofte..%
J4
2
T IME (HOURS)
TIME (MOUES)
RUN: 201
14
ft6
C
RUN: 202
toN s
TIME (HOURS)
7
6
4
3
1
A
-.J 4
TIME (HOURS)
sa: . ft n
TIME (MOUES/
e ft
T IME (HOURS),.1111,
46 146.ft."".I.
.
.pm -
m14.-
li12-o
-
ISE.01
0-
T IME (HOURS)"
-aC 1.1
r- . W... assft6'
ao 5'u
4',o
3-zo
21..
aIMICS ::::40::::12I CalsG.z 1"
9'-'-+-to4-4-74ao-4-70-4--TN n v
TIME (HOURS)
AO
6
0J4
.4m100 .~.0.4%.44mmiw ft..
^ISO
t1S
m114C120l
T IME (HO WL)
........
oTIME (MOUES)
0.11
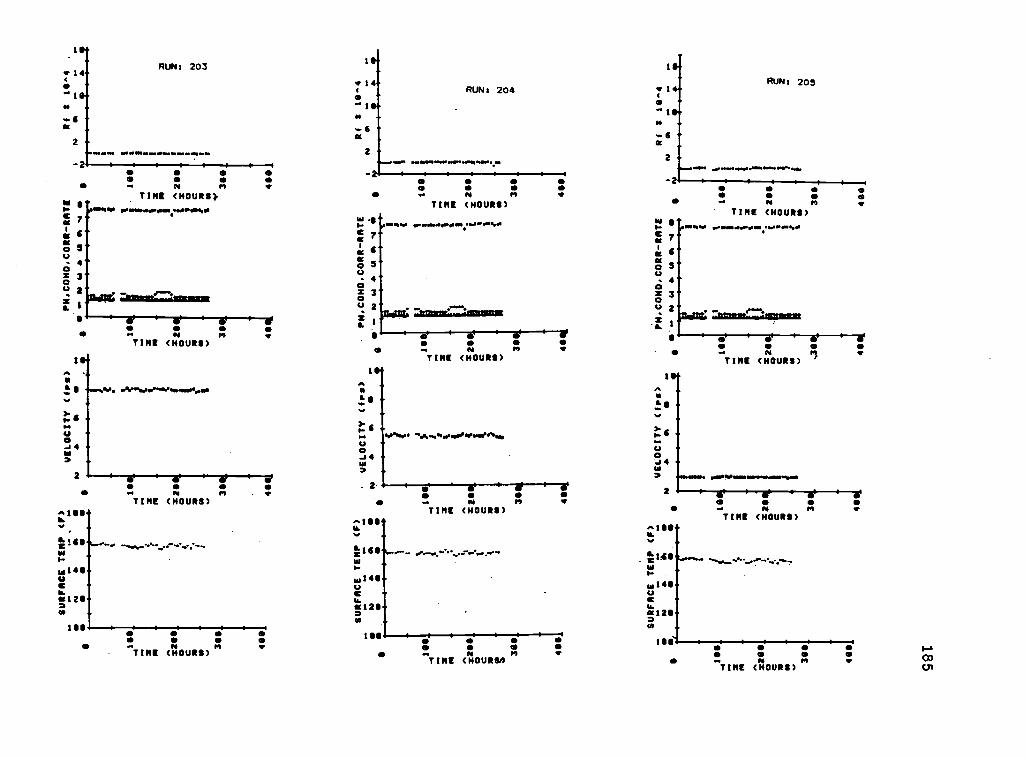
a . N
mailM wwwwwwove*Asin.0TIME (HOURS)
4
n *
NTIME (HOURS)
1-6
Oa4a
2
Afteess.9.0
T IME (HOURS),k186-
. a^1884*
W
$040-0
1211-0 -
6
RUN, 204
.oo. N n *
TIME (HOURS)1614
c1
4
0 50
40x 300 2
S
. N nTINE (HOURS)
I 6
00-'4
. 2
. N nTIME (HOURS)
10. l
osTIME (HOURS)
W
IRS oe to eN N
T IME (HOURS)
.t
RUN, 205
... N *TINE (HOURS)
4W
2
TIME (HOURS)
011140=111.1111
4111"....
wI411-0c -
5125-00 _
. ft nTIME (HOURS)
rAOD. a N .
TIME (HOURS) CM
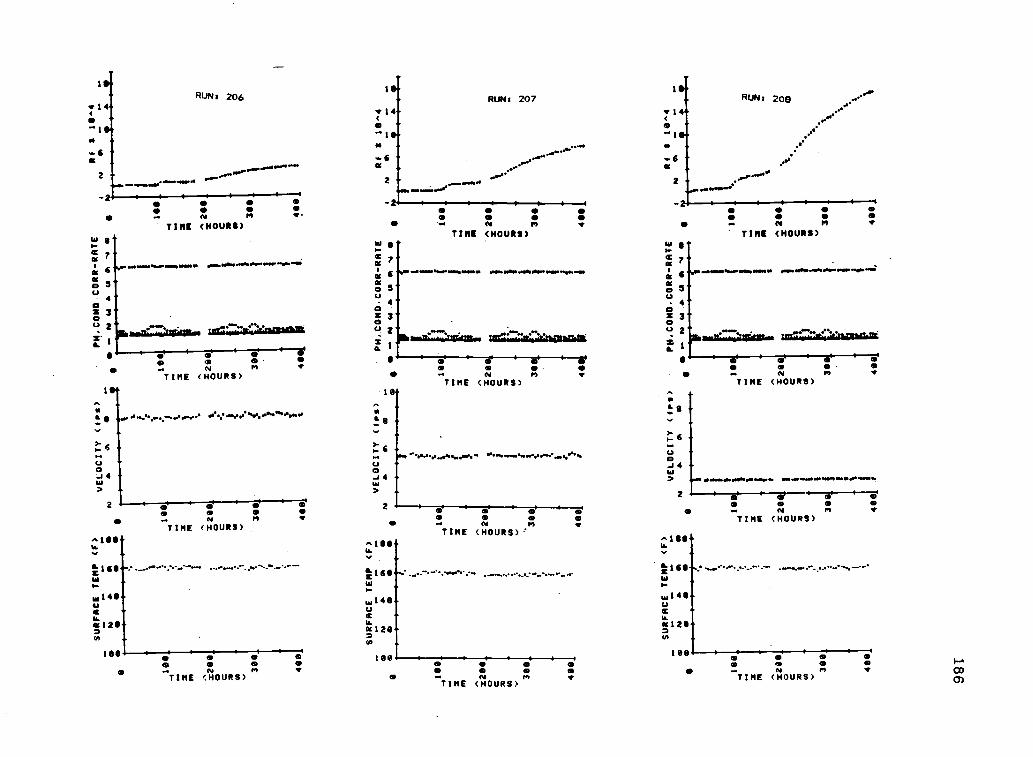
RUN: 206
(
.1N
et
RUN( 207
....".................".
.....
714
1
*... sCIC
RUN:
.40....".............
208
.,,..
...'
0..."
0 000V
*14 *14
-.111-et
...S
2 -...................""
...........e*"."-2. 0
O 0O.. N re rTINE (HOURS)
W ec
1 ,ccatco 5
- 40
300 2001g:::::46000, 114401°"ZWIEW0Man0
..*
0 00. N M
TIME (HOURS)
:"%.40,..s.
O-14W3
2 j O I el el el
VTIME (HOURS)
ISO
oso
3-
TINE (HOURS) TINE (HOURS)W L1
',atao 5
4O
30.) 2SL
3-
.16:6.4winik. .0.143gagsbounat
Le
6
U0
3
2
u.
TIME (HOURS)
T IME (HOURS)
...........lli1. ..w1441-s)a -atso. 1203 -
ISO 1
as to 0 0 0... N r* *
TIME <HOURS) .. IVTIME (HOURS)
)-,ro-
OJ 4W
2
00O as
... N m rTIME (HOURS)
.. N pi, *TIME (HOURS)
,....................-
1 o
co 0PI r
^100IL
wt411-ta
3
Le 0GB 0
... N r*TIME (HOURS)
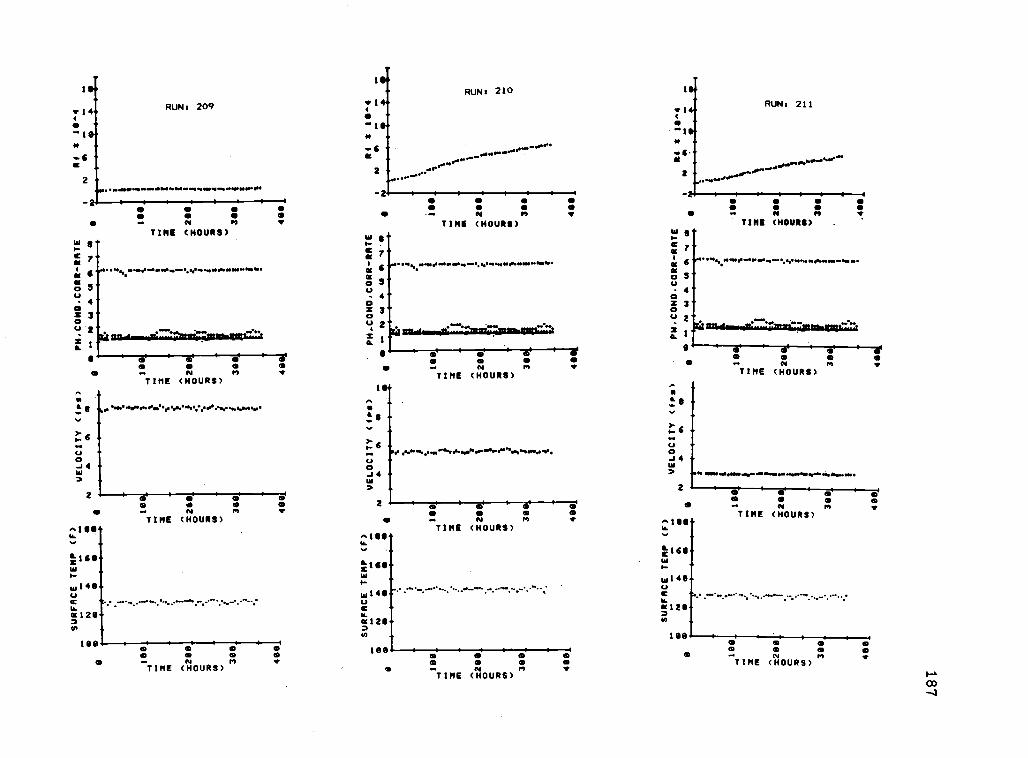
o. N m
TINE (HOURS)
4
3
.ssdamoss.-.zsurisialualignuaiia.....
0 0 0m
.. N mTIME (HOURS)
.6u -O
e
2 l 1 $ t l . so 1 NI
01a N O* N 14 11.
TIME (HOURS)-111111-a... '
&ice-sWH
I..
14
m
a2 -..
RUN: 210
-* $ I
ses e.. N N *
TIME (HOURS)
7
6
4
3
2
I
oo
. N nTIME (HOURS)
0J4
2 m 0---4-70. N N I.TIME (HOURS)
^IRS-.a
wm.14-u W145=
a129-a120-m _
199
TIME (HOURS)
100 m 1 N 1 m 1 0-1
m mr
TIME (HOURS)
RUN: 211
.......n.ro2 . ..........0.
.........
-* ( 1 1 000000
N0* N It v.
TIME (HOURS)Wor 7NN 6o 3
- 40z 30u 2
ex.
S 0m m
... N :4
TIME (HOURS)
e
I-6
2
TIME (HOURS)
r
VTIME (HOURS)
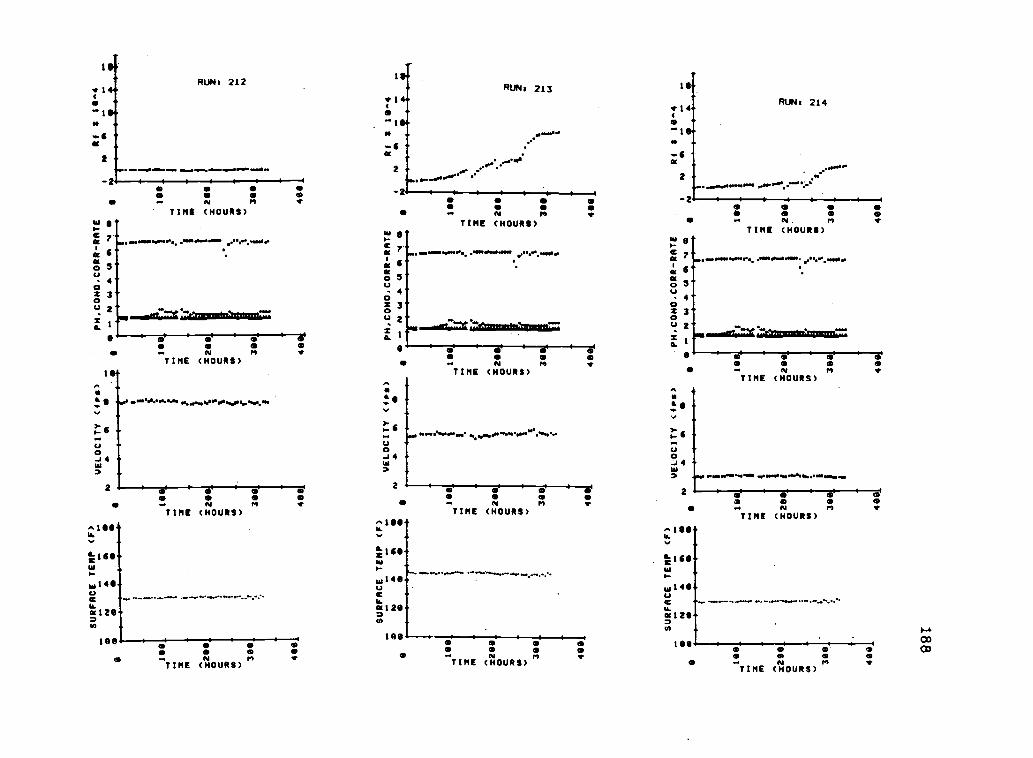
7RUN: 212
6 1 I 6 6 4 4
00 0
TIME (HOURS)W O.C
N,....100.006... 00/09.0.080
0 6-o S-u
4-oz 3-u 2-
s
I"eS
a.
1
1 =II
me
.. N MTIME (HOURS)
6-6
0.64
3
20. N m
TIME (HOURS)
^I59-
ee
m See. ea
TIME (HOURS)
of,
o 5
40z 3
u 2z . mmialaWTAI:aaaMMOMUMO:
sl a.
0
it 6
4J
4
e e. N mTIME (HOURS)
2 mis o e
* - N mTINE (HOURS)
^100 -sa
ISO& (Li=169zz wW I. -
w140....--.......------.................-w140 uu c -
066.
66.
120. 0120-m mm . -
0100 100m o
616 616
m m 0 m e (16m m *O ... m y ~TIME (HOURS)TIME (HOURS)
0
6
5
4
3
2
TIME (HOURS)
3.t
04
O e oO 0. N. m
TIME (HOURS)
*Zia
S
2 e o m ma 0 m m
al . N m *TIME (HOURS)
-1OOU.
0120-
OD100OD
6.6
TIME (HOURS)

19
-6
2
2
tEl 213
6 ft/sec 20 PP.160 611 4 r6.0 PM 2.3 p
1.3 pm2.3 pp7 PP.
Cr 04isAMPPAPPOP
PP & CP increased
0.. N nTIME (HOURS)
ow
6
O4
Oz0u 2
.f. .
19
laizacparis woe0o.. m pi
TIME :HOURS)
;I: ......1*."6
^100
169
.149,UC01210
10
0 4TIME (HOURS)
6011 116
5.5 ft/see 20 pp Cr 04160 P 4 Pp 2m6.0 PO 1.3 pp 411
2.3 pp. PA2.5 pp PP7 pp OP
PP & CP increased.
e ee o o e
O . N ft
TIME HOURS)
w s
m1 ,
o S
4OOz 3
L. 2
z
... ft .4
TIME :HOURS)
4.WOW.WOMOVAMmft4AMO*,,,
",11116,
.140-uCaO 121-0
IGO
TIME 'H OURS,
19
2
3 ft/sec160r4.0 PM
400 217
20 pp. Cr 044 ppm 242.3 pp. 411112.$ pp. PA2.3 Pp. PP7 pe OP
pp & CP increased
rr.rL
o esap- N m
TIME (HOURS)
0 g
Cst1 ,.aco 5U0it 3
u 2s .
o o.o
N mTIME :HOURS)
A
at 6
00_14
2
+avo. ..~.404...m..4.0.4.0
... N MTINE (MOURS)
^1
.149ucaO 129=e -
I-- .---.
IIo
o
No o
. PJ MTIME (HOURS,
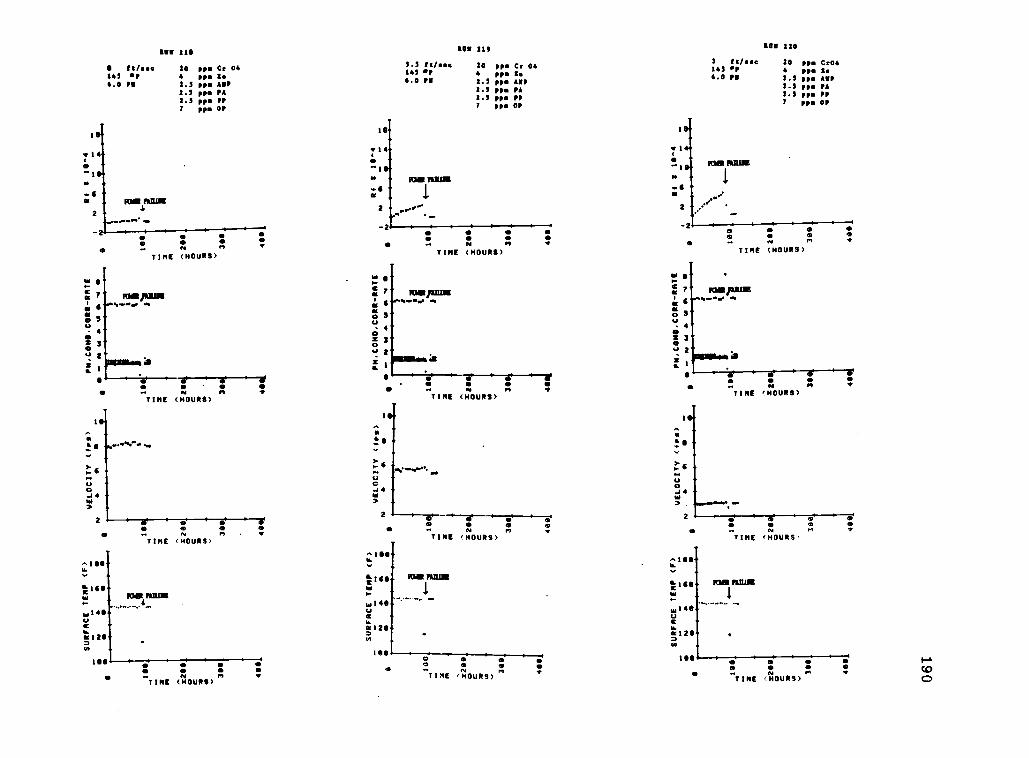
411 21$
Wass 20 Cr 04143 4 s Ea6.0 PU 2.2 pp. ARP
2.2 PA2.5 PP7 OP
+l4
-10
1KYR 12111/1111
4
o0.
TIME
e0N(HOURS)
00m
00
1240,1510ME%,»*.p
00. m
TIME (NOUNS>m
11 215 220
5.5 (1/6.4 20 pm Cr 04145 4 fa4.0 PU 2.5 AMP
2.5 m PA2.5 PP7 OP
IS
14 *1< <0*1 ..1*
N
2
0. N N *
TIME (HOURS)
micepum6 *or
ftO 3- 40z 30u
Io
a 1-..6 .......0.0......
uu eo 4..1 4
-awW 3
NTINE (HOURS)
2 02
e es 0 0... N M .TINE (HOURS)
m1,U.
N
3 tt/4.4145 024.0 0
20 pe Cr044 ppm ia2.3 pm AMP2.2 pp. PA2.3 m PP7 OP
0o 0 o 0O 0 03 o- N M *
TIME (HOURS)
0J4
so0 0 o» N NTIME (HOURS)
2 00.8»...
0 2 N 00
N 0 0 0 e. N m * 0 .TIME !HOURS)
N m I
e.166
.14
LLw120N
100 : . .I061
0Ai o so o o o 00 0 0 0 o .4 m m
0TIM[ (m OURS)
mN
-TINE 'HOURS)
H
r1.
L ISOw
.14.U
o 12.o
ISO
0
TINE (HOURS
Ids Faun.1
0 410
ft
TINE (HOURS)
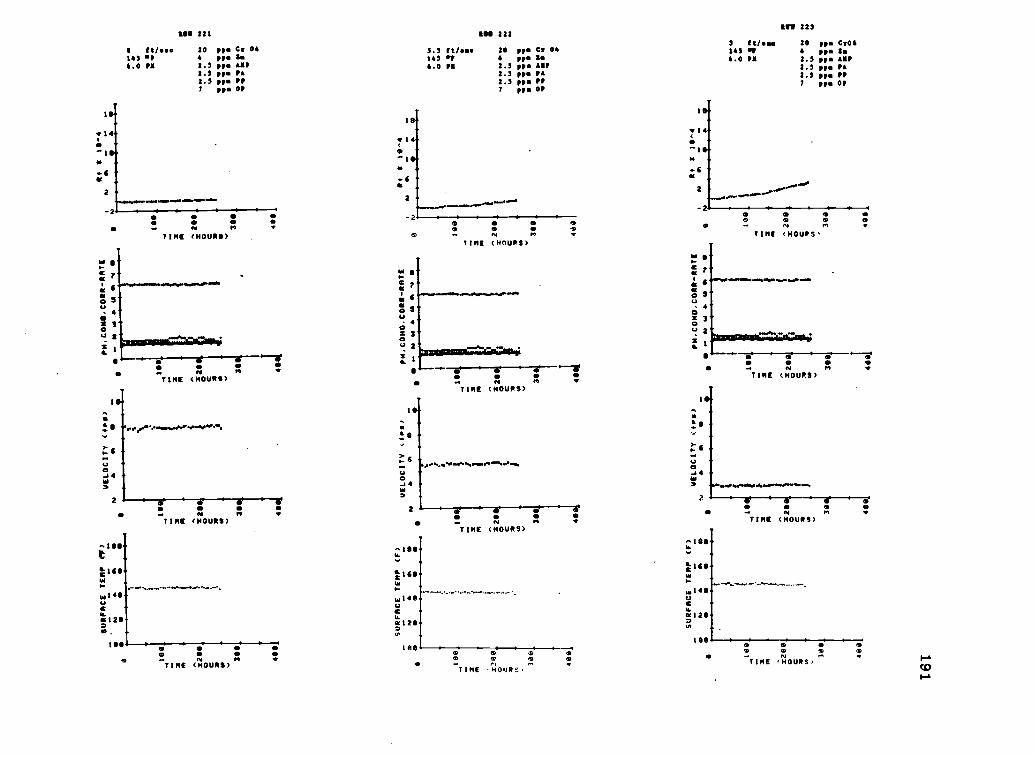
so
I It/u.163 01,6.0 PS
EVE 221
20 pp. Cr 06m im
2.5 pp. AMP3.3 pp. PA1.3 PP7 ppm OP
... NTINE (HOURS)
ceto
oO 3
20u 2
S I,
ft
TIME (HOURS)
NTIME (HOURS)
U
128.
0S
TIME (HOURS)
5.3 ft /...162 816.0 PU
EVE 212
20 ppm Cr 064 S.2.3 PP. ARP2.3 e z2.3 m PP7 pp. OF
KU 223
3 Woes 20 ppm CFO*I43 of 4 6 Zs6.0 PU 1.3 pp. AMP
2.3 pp. PA3.3 m PP7 pp. OP
18
Is 14
o-r 6
2
IS
I
6
wwMomm.**
so
to r
ft 6el
3U
4
z 3
.4 2
21
S
^ISO
2616
.140
=12=
ISO
TIME (HOURS,
woo..
W0Cfto
Atsoo
2U
40z 300 2
Sa.
rIES
616M.
.14U
0128UI
*O
TIME (HOURS)
*W.
6
1--ir
Wm 4,1 , s
... es nTIME (HOURS)
.--0
0
TIME (HOURS)
nTIME (HOURS)
S
... NTIME (HOURS)
n
as'0
1.go* 9 0 9 0S
TIME 'HOURS.TIME ,HOURS,
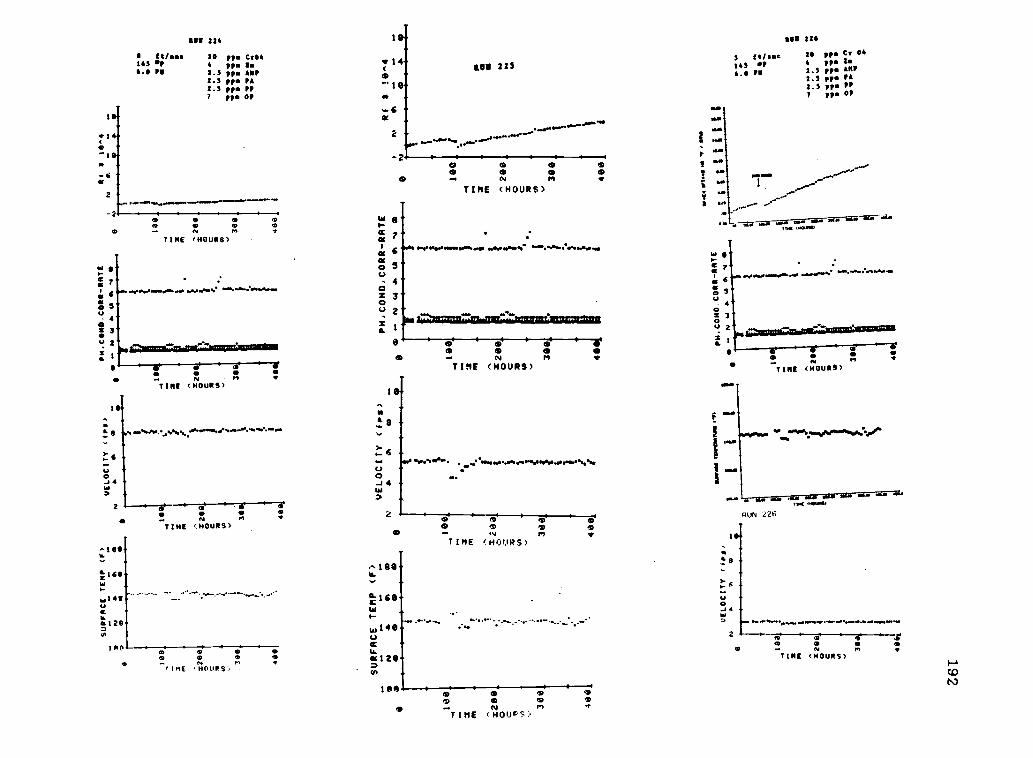
14
62
-2
4 Et/see143 el6.0
RSV 224
30 Pp Cr044 PP41 8.2.3 pp. AMP2.3 pp PA1.3 pp. PP7 pp. OP
o e 0o 0 0
N MTIME 'HOURS)
2 airasualtheneZianizs
a
a-1- 6
00 4W
2
O mTIME (HOURS)
^100
tagsW.140U
o120ui
100
0 1 .10 0
N mTIME (HOURS)
0 0 00 0
O VTIME ,HOUS,
O m mm m to
m .. ori IS
TIME (HOURS)
7
6
4
3
2
0
IR-
;
C
S
r.1.1
SO
G A
C
a0at
S
ROO 114
3 Wise 10 ppm Cr 04
142 7 4 pp is.0 PO 2.3 ppm AMP
1.5 pp. PA2.3 ppm PP7 ppm OP
40z
02
2 timussrolnateassousisI
TIME (HOURS)
2 etiI
8 , ,,,,,I iiim ID 9 "sc .. N PI ..
T I mE !HOURS)
- 180 -IL
_
a. 1 6 -w
Ie. -A 1 I 1
m a: 9 0
9 a Co 9a -. rm
T I ME (NHOUPS:
.,
0 o0 0
a mTIME (HOURS)
RUN 226
10-
0JA
2
4.4 474.4..............**.mrrwmo oo o 0 0O N m 1r
TIME (HOURS)
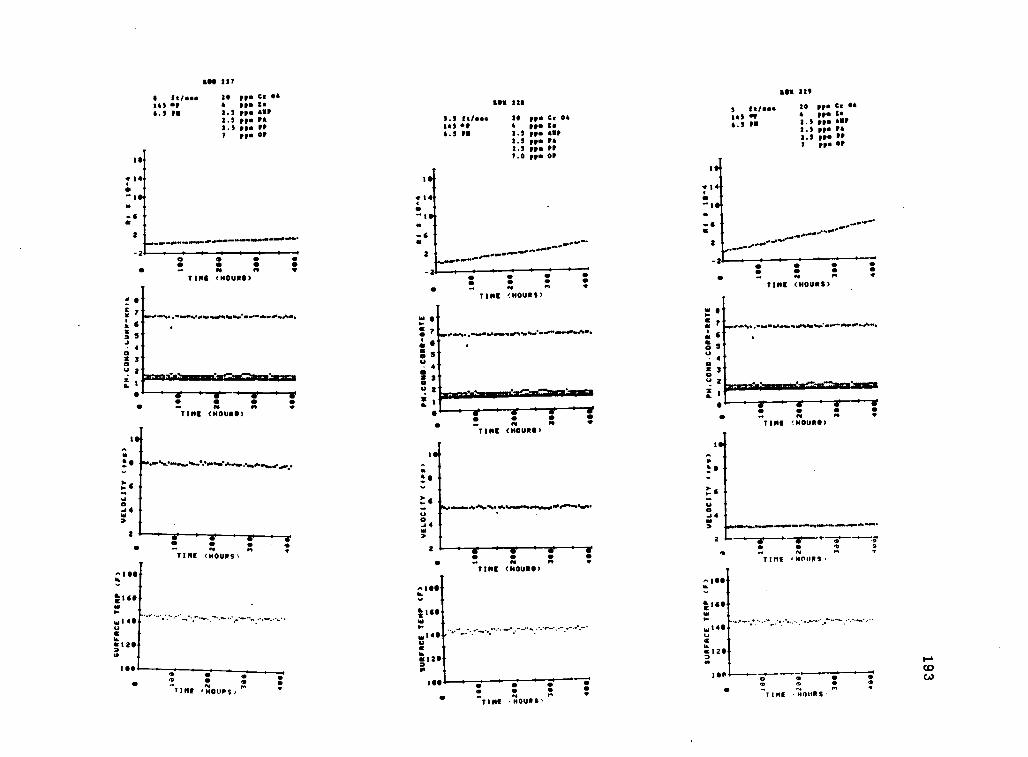
is
1214
2
6
3
4OZ
2
ts.
!a
*t0
IN
4 4
2
o
2641 227
2 22/21.24 20 pp Cr 04145 4 pp to6.5 PS 2.5 pp 4111,
2.5 pm PA2.5 re7 m OP
. 2 ,
o .6
.. C NTIME (NOUNS)
N
0ms
T IME <COMO
TIME THOUPSN
^10
Itco
.160
N120
100o a
mo4.
'TIME 'C0.OUPS,'
1117
:T14
lrN -
*6N
2
2
411 226
3.5 Et /..e 20 pp Cr 04145 m 4 pm ts6.5 PO 1.5 pm ASP
2.5 PA2.5 PP7.0 OP
IS
sr 14
1 0-
6N
2
2
... N m21144 ' NOUNS>
.44.40 047 .2.******
42
TIME <COUPS/
..........°22..
74
TIME thou's)
s
o 42
TIME 140U0S,
MI 121
3 22/..r 10 Cr 04
245 IV 4 p Zs.3 PS 2.5 pm AMP
1.5 pm PA2.5 p PP7 m OP
.. N IN
TIME (NOUNS)
2
NTIME "NOUNS)
INMA.,z
N zN N .r 7
TIME 'HOURS.
1407 o .. . 0
o . *TIME 'HOOPS
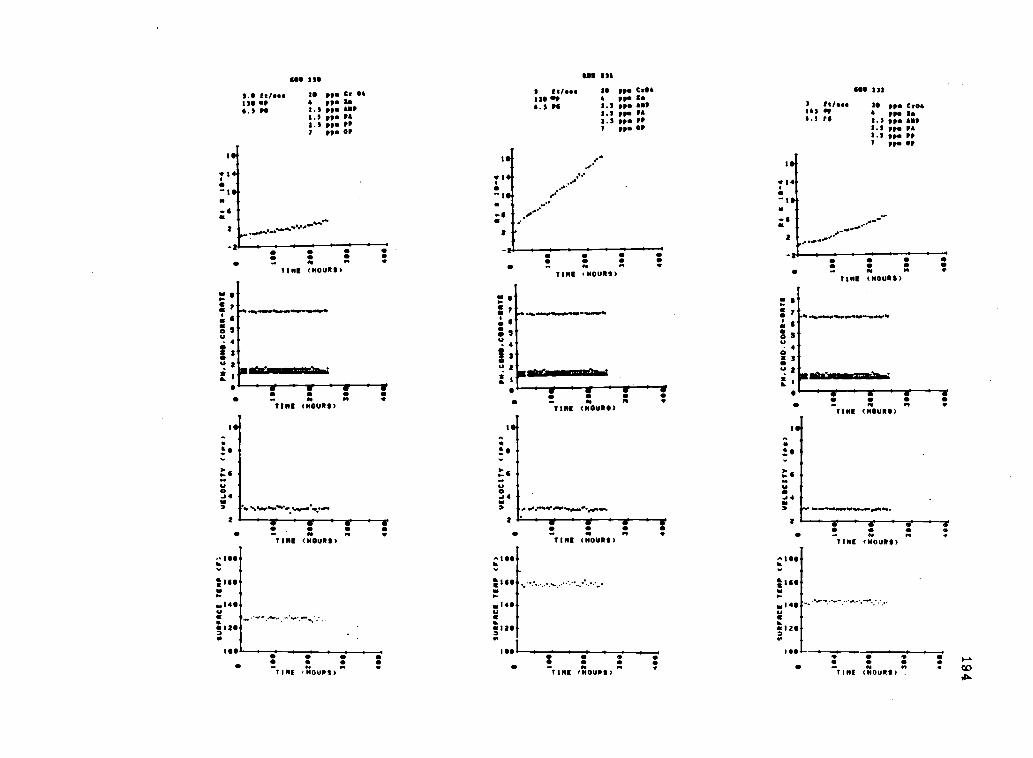
I 44
+4
2
2
ROO 120
3.0 It 30 ppm Cr 04130 op pips 2.2 re 3.2 pp AMP
3.2 ppm 41.2 pp PP7 ppm OP
tint (Howes)
ft
T IME (MOUND)
r
.1111
2 .5 .......2
aTIN[ (NOUNS)
;.11111
4.1202
10
TINE ..00PS)
010 112
1 et/4 10 pope CM1130 pp. 2..3 PO 1.2 pp ASP
1.2 per PA2.) pp PP7 pp OP
le-
:144 e.
II .0
2 V
2.T.-1.T---- ft n
TIM[ ..OURS)
OD
6
9
1M
we
6
Oa. 4
Z 34, 2 02I .
0./ 4
T INE
.00,0,06.0.,2
TINE (NOUNS)
+10ft
Ilse014.123N
100
,
ftTIME (MOORS)
3 trim142 OF.2 76
BOO 332
20 ppm Cr0pm im
2.3 ppa ANP2.2 pp. PA2.2 ppm PP7 ppm or
.. ft n
TINE ONOURS)
TIME (MOUE)
0.4 4 ...........
240 o
- m n .TINE .11011112)
m1a
1160
N.140
MI203
I II
TIME (NOUNS) .
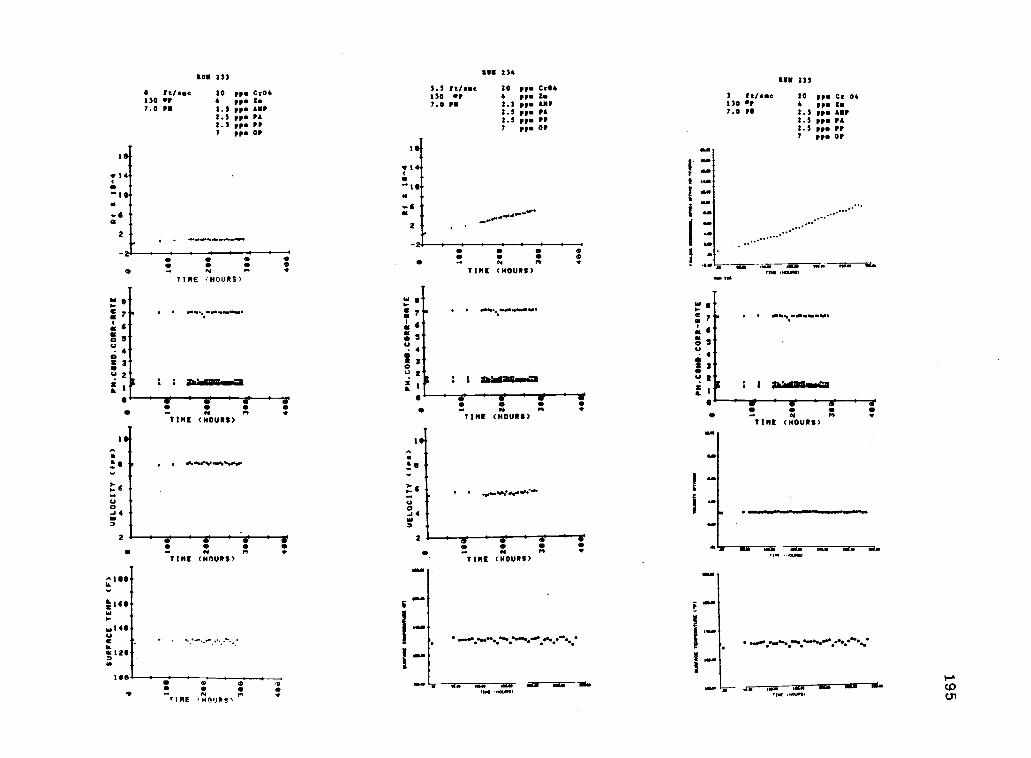
S
1307.0
III
tt/mem07PM
233
204
2.52.52.37
pp.pp.pp.pp.pppp.
Cr04ZsAMPPAPPOP
2.21307.0
111111
ft/mom
0
234
2042.52.22.27
pp.pp.pp.pp.pp.pp.
Cr04ZsAMPPAPPOP
*14
06
0 00 0
.. N M 0TIME NOUNS)
6fto- 40
3
2: I aelaa214411
a.
111
T IME (NOUNS)
0m N MTIME <HOURS)
14
6at ..
oM2
0.0 .. N n
TIME (HOURS)
me
64
- 4
u: 214:11gatMa=
2 I
ft
TIME (HOURS)ft
.
0J43
20 NTIME (HOURS)
I
3 ft/see130 of7.0 PO
III 235
20 pp. Cr 044 pp. Z2.3 pp. AMP2.3 pp. PA2.3 pp. PP7 pp. OP
.
0
*-"'......-"
14 04
u 2
...MIK 010.81
....,..ftWomMOWO
: i 611:101244.4101
T IME (HOURS)
n1616W
.1441.
4120
100
6
........r.,...,...
MON
fM.
M.
m.
MAO r
...,....mon."....,..
mTIME HOUPSN
0M
-a Si. lamogm MUM 4. Mr 1.1.1
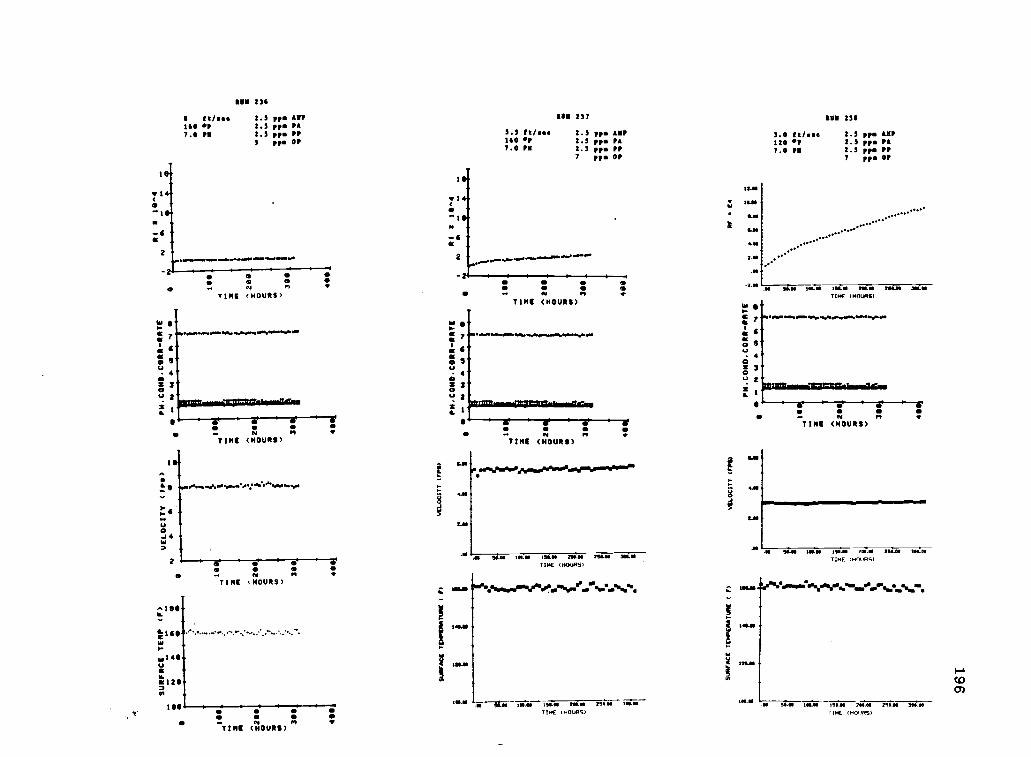
$ ft/e160 *IP7.0 PM
1111 236
1.3 pp AMP2.3 pp PA1.3 pp. PPS pp. OF
4.4
O
TINE (HOURS)
WF
aO 5U
40Z 3
u 2za.
a
l0
N PS
T IME (HOUR[)
2
8
N N wTIME (HOURS)
^1,
1soTIME (HOURS)
ROM 137 IOU 130
3.3 ft/e 1.3 pp. AMP 3.0 ft/e 2.5 pp AMP140 P 2.3 pp PA 120 or 2.3 pp. PA7.0 PM 1.3 pp PP 7.0 PM 2.3 pp. PP
7 pp OP 7 pp OP
1 O-
a
.6
2 ..... .4444444.04.4.0.444
2'I , 4 I
a- a N .TINE (HOURS)
444.44.044
ft
T IME (HOUSE)
aM
2.40
fp.tamtlaaaadtoftorloariPotimadvaala
sim MN 154.88 MN 258.40 MIATIME (HOURS)
MIN 1'.Nekene44...14,41 ...404444%
1148.41
NILO
"." SIN OLIN MAW 211.14 254 04 304.04
TIME I HOURS)
8
S.
W
w 6
7
a 6aO 5U
4
z 300 2
a
***
............ "..*.
.811 MISS 04.40 154.84 210.91 254114 344.44TIME 1 HOURS)
444
. al
TINE (HOURS)n
514041441044141
MN MIN I54.04 704.40 258.04 340.05
TIME (HOURS)
:"..+..%%. ".".....:".
. 511.04 MIN 50.84 714. 250.08 300.40TIME (HO .RS)
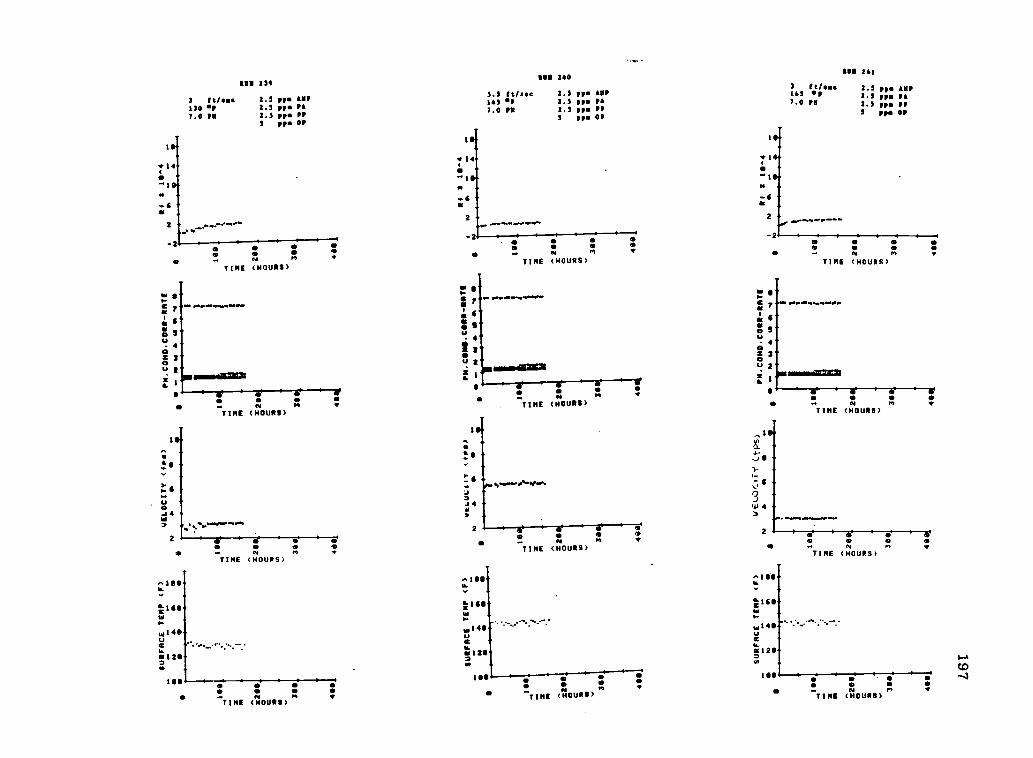
RV' 131
3 ft/see 1.3 pp. AMP130 0 2.3 p PA7.0 2.3 PP
3 pm OP
14 Tt4
1 1
NNoo
2
3.3 ft/see143 .7.0 PR
CM 240ROM 241
1.3 pp. AMP2.3 PA2.3 pp. FP3 OP
1N
es 0es
-2
om
s ope
o - N m - N m 0 0
TIME (HOURS)TIME (HOURS)
es . N nTIME (HOURS)
3 ft/see143 OP
2.3 m AMP2.3 p* FA
7.0 PR 2.5 p FP5 OP
p
?
-
$
40
to
AlmoodEMOM1
T IME (HOURS)
1S-
a
U0A4a
2 t ijo
TIME (HO URS)
o11011
e'.
100 t I, o. . s oo
oe
* nTIME (HOURS)
o
N
s
m 0
U '$
4
0 ti mmosoll=k
NT IME (HOURS)
TIME (HO URS)
o * sis
TIME (HOURS)
Je
,3 6
W 4a
2
O
*T IME (HOURS)
a.omO
TIME (HOURS)
-
^ItN
1160,
U
1211.
tee t
CID4o"I
TIME (HOURS)

ROO 241
3 It/see 2.3 AMP
130 oF 2.3 pp. PA7.3 PU 2.3 m PP
5 pp. 01
eso. N M
TIME (HOURS)
N M.TIME (HOURS)
2 0 0
TIME (HOURS)
NTIME (HOURS)
2
IMO 143
3.3 It/.es 1.3 m ASP143
2.3 pp. PA
7.3 PM 2.5 pp VP3 ppm OP
TIME (HOURS)
00
N NTIME (MOURN)
2
NTIME (HOURS)
RO 244
3 ft/.se 2.3 pp. AMP141 2.3 PA7.3 PU 2.3 Pp. PP
3 pp OP
2
.. op nTIME (HOURS)
W
a 902
400u 2
e .- N nTIME (HOURS)
6
0
.0
7. o' I 1o
T IME (HO URS)
ti.
....
s.
44111 tI6rW,.14 .14,u ua ,
5120- 512-120O oo o .
1 IBS o I-+o oo o o o CO- N M , . m m r COTIME (HOURS) TIME (HOURS)
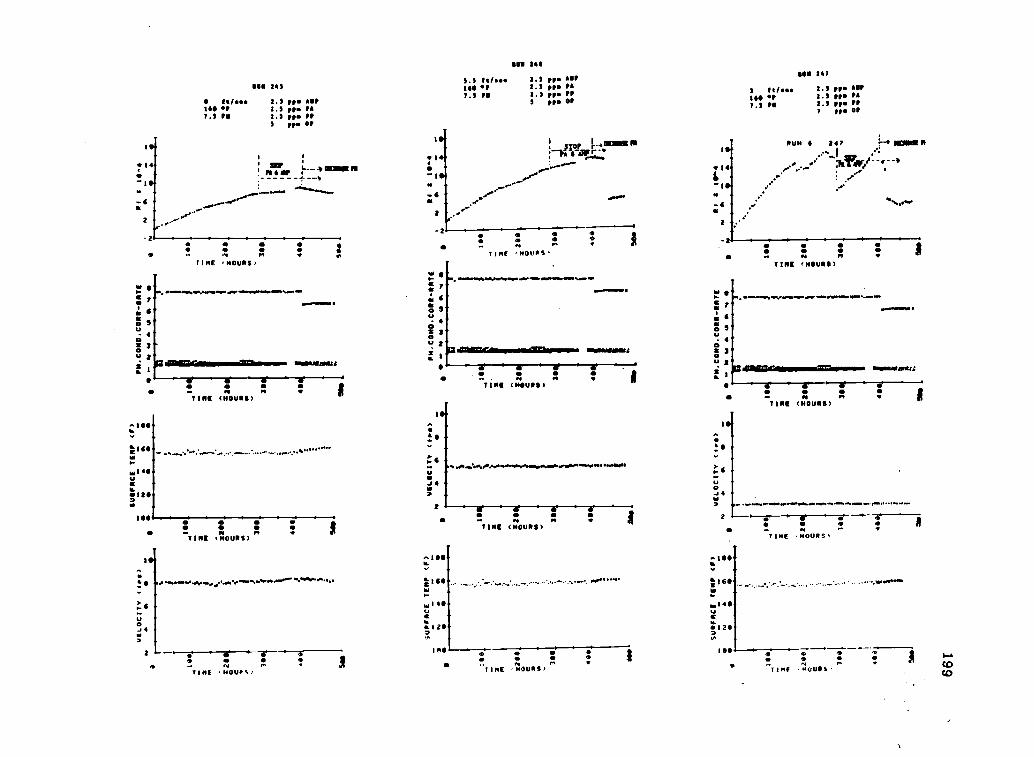
SU 343
6 14/.44 2.5 pp. AMP160 1.1 p PA7.2 PO 2.1 pp. PP
5 p Of
alIs.
14.14 4 ! ......
o si, :---.114MENUM 0 '....
............Is44 ,...e
4. '............ ".....,........ .6 ..,....
....,'6
..
.0.- a.
...-..2 .".
5.) 24/84416 Or7.5
In 140
1.2 pp. kr1.1 pp. PA2.5 p ftS q01
! nor 1-4immeirmr-lm COIF r '
2asis
, N 4.
TIRE 'HOURS)
F,
1a
40Z0u 2
I
asix.111
816111111MOIMmonmaila1 onmosce
aIM
'&160
II
.140
O 122
i
10.
U04
2
_2
w
a1ao 9
40ti 3
a 1- a ...
TIME sin:01105s
u 2
a
44.
411110Caimssamallaomma mrasease
TIME (MOUE/
T IME (COM
0es
TIME 0101.111S)
-e--V
TIME 'MOORS'
SI
.140U
120
I Or0
NTIME ,Noults
I
14/8441607.2 PE
SIM 107
1.2 pp. AMPas p FA1.1 pp. ft7 pp OF
.:-4 WM. NNUN 11 247
. Assirff.,e-**14i
...
: #.
".10-0
e ....6 .4,..0.0a
2
2,
41 0 0 10 0 0
TINE MOUN,
1104 ..j
W 0
I
UaZ
u 2
a. I
T IME (1400116>M.
S..11111.
......444 P
100010011:2
i
ii
-J
2A
TIME HOURS,
.160
II"
.140U
12020
100 0N n ...
TIME ..OURS.
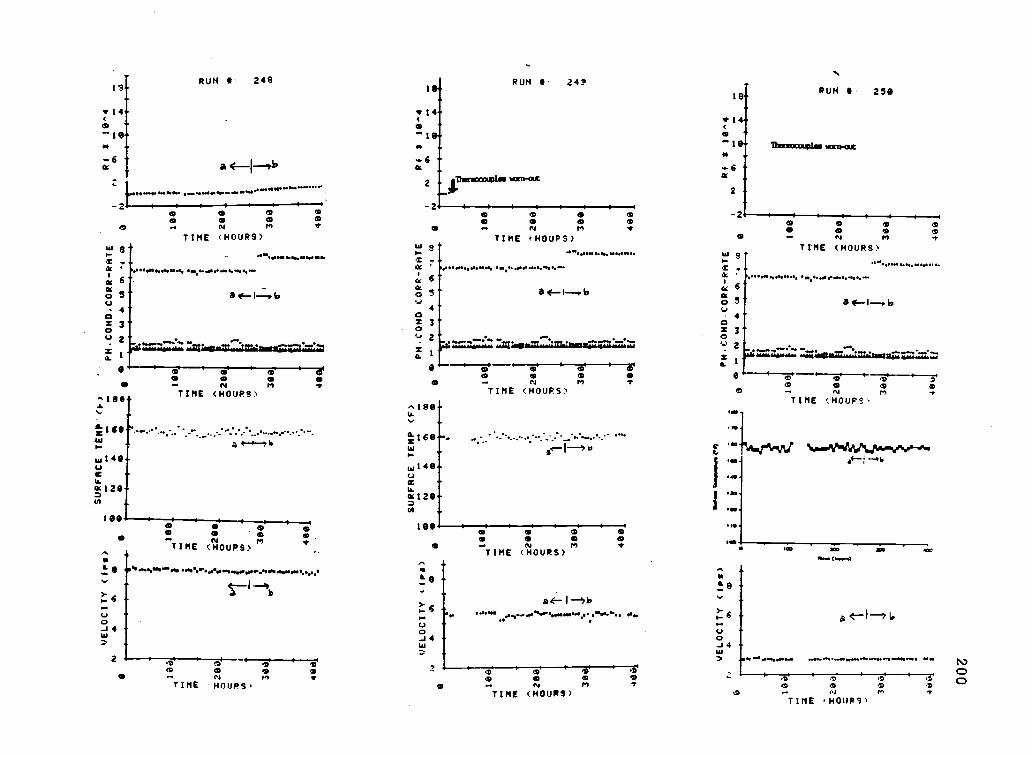
RUN 248
.... 6 - ... 6
ac a (---1-1,10 Ik
}$
..- -................---0-....-.-----.a a a I I I I
0 0 0 00 0 0 0
0 we N MP 0TIME (HOURS)
La 94DI a - .. ................ .1 -.c - .4, I...........0).... I ..11...04, .....IL.........DC . 1.11000...140.41/4e
11 6"at 6.. GC
4k.oic 5 a E-- I--s la5- a t-1--.b o.....,U 4'4- 0C
RUN 249
m ms co m..I N 14
TIME 'HOURS)
""o0
z 3 z 3-, o tj 2
odisariZiuzuhar. 7,V4, .74.* :00aztazatino-) 2x 1a. 14". a.
0 - co 0 0 1 dito 0 0-. tv r, 1
TIME (HOURS)
I -----sro co' co e.a. 0 c.
O _. N M eTIME (HOURS)
^180-u.
18RUN 250
IP 14
Tharazauplas kcan-atz
-6at
TIME8.1.0
soso
-r(HOURS)
6
a (L" b4
231
0'
-TIME ',HOURS
a)-r
sap
rea' 160- ....1C
...,............---.IL I 60*- ...- -.2-........--..-_-...-_%.'.....-..- -I"W- usz 0 141.1.14a 110.1.411/44101A44,"-', I L.I..
ai... 1 ..-311,
IL
U ka 140-Uz - I
IAD .
.11.
1.11 40
04 120 U.I 1 a .1M ft 120 -to _ D 1 .2..N-
10010m m m so lee, 0 0 a) o0 m... m m 1 a)TIME (HOURS)
N M 1, 0 ... N F) I' MO MO MOTIME (HOURS)... ......0....1^g ...o........*coo ...00,..........."...o.
toot .o.o....
>.. ..6 -U- - a <-1>i,o ....- I 4 - a.)o u
-i-
au 4 0O -41 J4
IL.7? , A.) ".......0 G.*. ..........s..................*2 op 0 9 2 --.CD 0 0 0 0 eD
42 I of IN IV V 0 0 0 ., 0 0TIME HOURS,. o .. N 1.1 V
St0 0 0 9.... N M VTIME (HOURS)TIME HOURS )
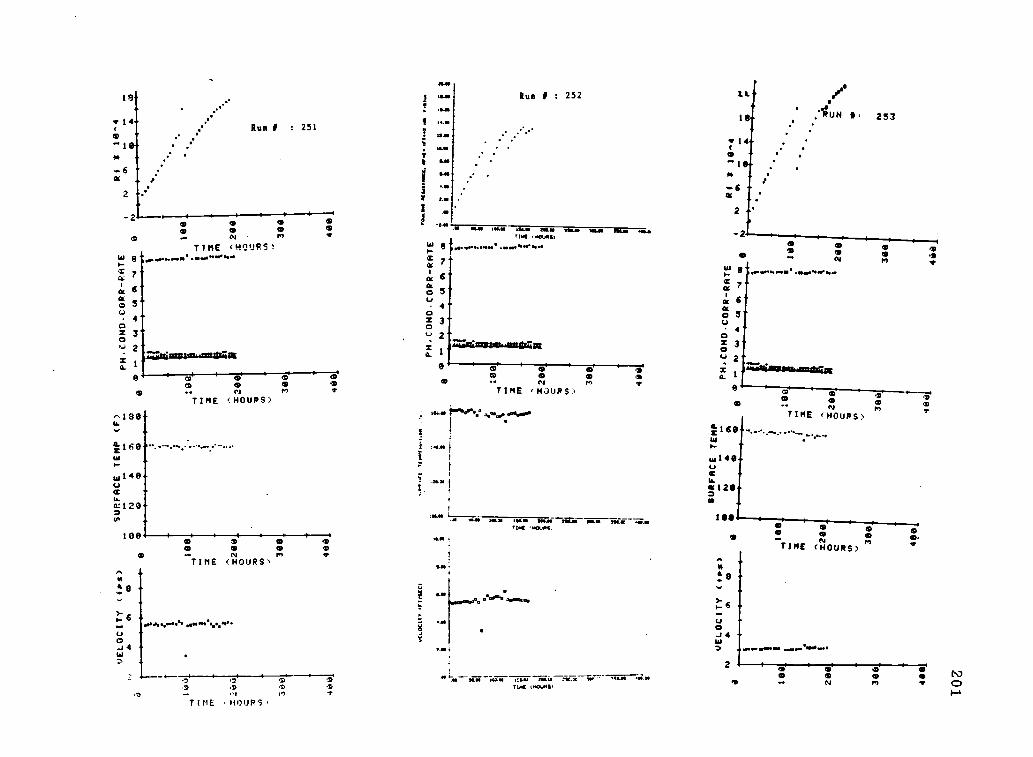
Run : 251
TIME 44^.0
7a;1
6'
O 54 -
x 3
2 :Zraxiassuo..auS4111a. I
or I 64
TIME (HOURS)
^180-w
_
Run : 252
MI NM sal.. rum Nem ma ram Mar A*.
d
7
6-5
4
3-
2
1
0
ea
a so *0
4..wesonstawiss1ts7all
co eaco 0... ClTIME 'HOURS)
00M
007CD
wI40
a=120-m
100 1 1 1 1 1 f 1
aos
a
TIME !HOURS'
a -
6
u -oJ 4
st
o o oo o o
TIME .MOURSr
,alw
n t,
on.=Iona Mal Ma CW.
11. ...RS111.40
0.61
11
19
714
6
/e
RUH , 253
acs
oc0
z0
a.
0'
CD
mm... N
........ %*
1744.11011Hazdarani
m0M
m.2*
0-
TIME (HOURS)
W
w140-o
-wa120-a -
ISOma MAI .114.0
m.TIME (HOURS)
to
pee ea", grft,1.
4.0 0.1 4
2as" too ;44.10 KIAN 744.2 MAC W
clataCksMS
0N
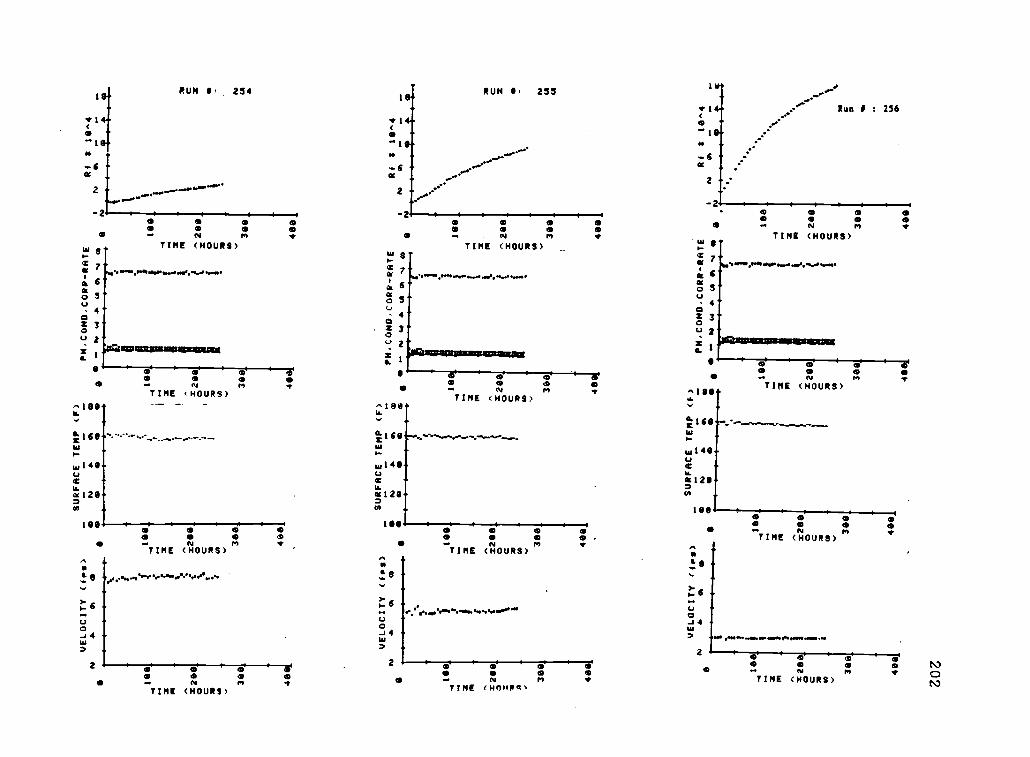
19-
TI4-o
*
-6
2
2
8
7
6
5
4
3
2
O
RUN , 254
1 I Im 0 to0 0
RUN , 255
a
O 0O 0 0 0
*N to)
a
1 Rua I : 236
m e m m0 m 0
- N m *TIME (HOURS)- m m a
TIME (HOURS)
o oo o oN M
TIME tHOURS)
6
5
4
3
2
^189v.
I$111tAIIm m m 0m 0. N M *
TIME (HOURS)m .sIL a........,...........".........,,v
TIME (HOURS)8
e m om 0 oN M T ^I8-
TINE (HOURS) ..
t16111..m-
112
U 140.
w140tl
U.
TIME (HOURS)
a 6ao 5U
40z 3
u 2
-aa(129..
_
Ms
Za. I
0 o oo oN m
TIME (HOURS)
189. :m m mo m m. N MTIME (HOURS)
)-
-0...........m.......600.00... 0O -I 40 uw
4...........N.....w..
,2 m a- o m
2 o m 0o 0 0 a o m - N Mom a o .. N am
0* TIME (HOURS)
-TIME (HOURS)w M
T TIME (HOIMPql
odea
00r
N3
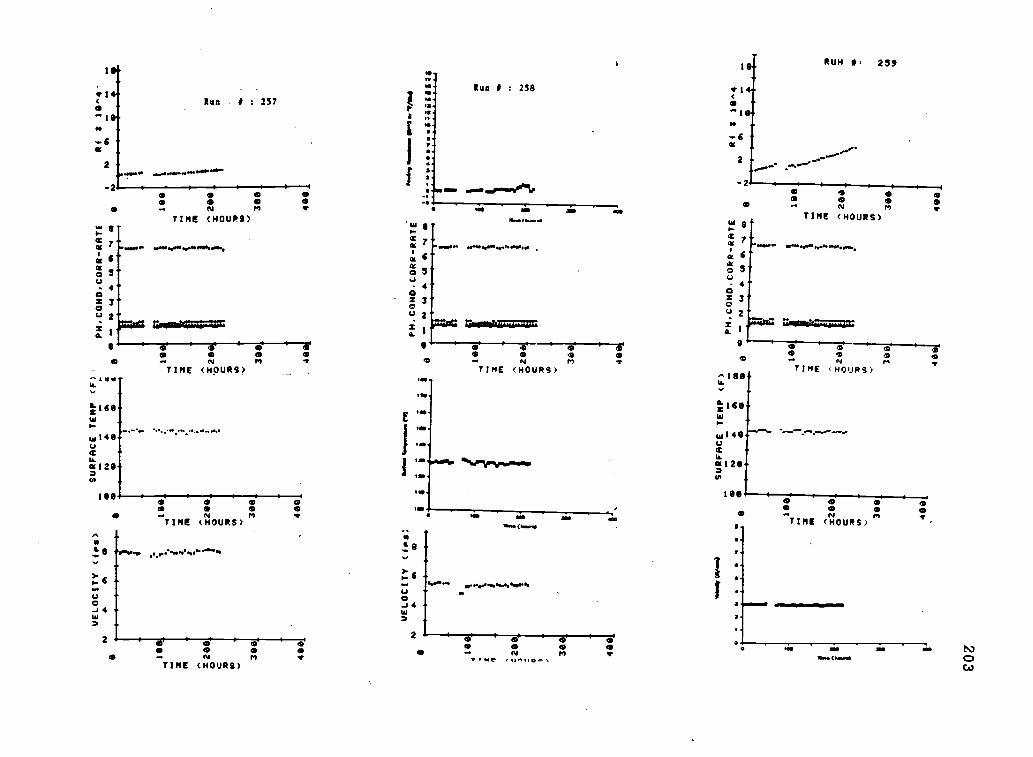
10
In
VELOCITY (fox)
NA
*.t
SURFACE TEMP (F)
so
N+
A0
44
-o190-
x290
x209.
00
300
406
390.
,490.
VELOCITY (fox:
N
199
:200
4
300
400
4414
.14/
W4.
4
I
Gah
mP
A
PHoCONO.CORR-RATE
-...
.. N
-4199
2 '200
399
.49
S
PM,CONO.CORR-RATE
e 190
1
'200
C
300
SURFACE TEMP (F)
4..4 N
A00
000
x280
0 C UI
390
190
1
40
PM,COND,CORR-RATE
es,
N 4
41.
147
1 N
-4190
m xze
e
0
306
490
NA
,ftw
Am
4441
A*A
VA
N
4:af
iggi
r46
S =
Rf i
19^4
NA
0It)
A
100
ns
C200
3
NN
300
490
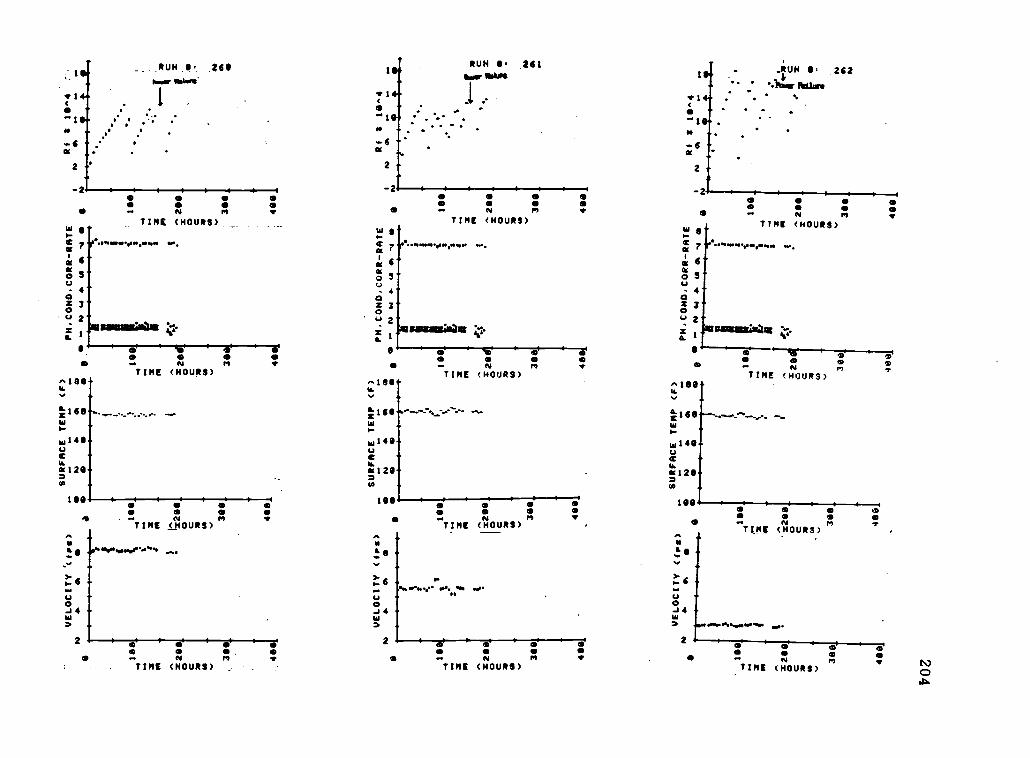
110
.RUH.11.
26
Pow
Orfore.
14-
.
6 -
2-2.
dt
W
0 0
0
0
0 . N m
TIME
(HOURS)
76
a4
32
10
Welly10
sousioCialm
y.
00
o 0 0
...
N m
TIME
(HOURS)
0 0 0
TIME
SOURS)
r1
1-6
RUN
O.
211
imm
rIbbms
..
"."
N Nl
V
TIME
(HOURS) i TIME
(HOURS)W I
at
7ft 6o 5U
- 40
z 3o
Z1011111M
an
&
0
^lee-
0 m
..
N m
TIME
(HOURS)
=16
....
W
-Mwi49-(4a
w0120- m0 .
1SS 0 0 0 0 100
1
04
o 0 0 0 0 0 0
0 . m * 0 0
.TIME
(Hm
oOURS)
TIME
(HOURS)
M
-1,.
00
W 0
w.
6o
at 5U
4O
z 30
U 2
soluizInass
00
0
"180 -
w140U
o120=0
90 m
.. N m
TIME
(HOURS)
III..U
42
m 0 0 0
0 0 0 o
. N m
TIME
(HOURS)
;tee.
... ?
«- «
«
6.....
-....
...N.
.....
..........
...
w -
0J4W0
.
2 0 0 0 0
0 o
0 . N m r
TIME
(HOURS)
4.0 N
TIM
E
(HOURS)
00
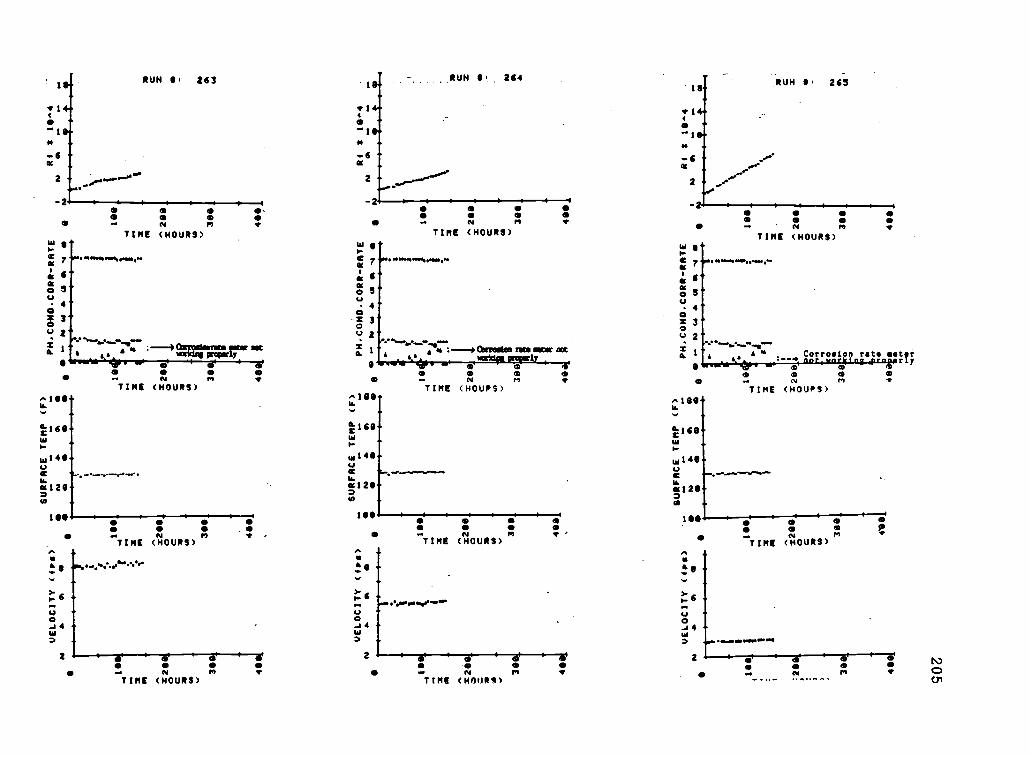
RUN , 263
mTIME (HOURS)
m-e
W eI.R lisl.e.........ca '
0.
ao 5u. 4Og 3C.) 2
net4 o'01Nrila
ea oo
... N m 11.
TIME (HOURS)^160-w
1.166-1
(04LLa120
Ise.o
I-
0-.I 4
2
TIME (HOURS)
TIME (HO URS)
o o oes et o. N m '
TIME (HOURS)Wc
.
0 3o
4oz 3oa., 2
maa. a i 4. I
6 so
N MTIME (HOURS)
^160*U.
a
TIME (HOURS)
RUN . 265
N
7
6
S
4
3
2
weiroms,
TIME (HOURS)
"
om
--4 Corrosi n rate !waist.:
o eaaa.. N VI
T I ME (HOURS)"1e
&Ise-:
w140
o12-=o -
30 o aro
0ft
TIME (NOURS)ma
.::09
1..
u0.J4 j4
2
T IME (HOURS)
2 oIS
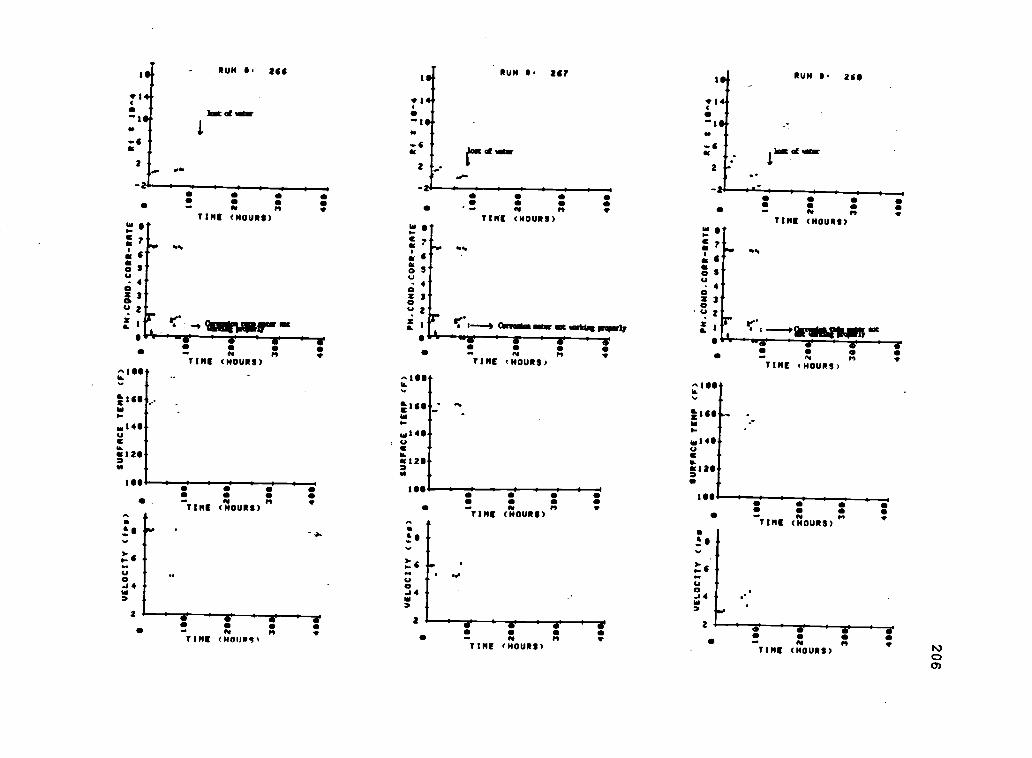
SURFACE TEMP (11 )VELOCITY f 44,N A N a
x 260
360
4011.
VELOCITY ( 042 )N ft
20
3
0
VELOCITY CI 46o
-.106
x2
3
90Z
z20
30
0
PM. COMO, CORR-RATE
0
SURFACE TEMP (F)N.0..0
-4 $
100
z20
300
0_
100
;200C
1
400
N14
M.COMD,CORR-RATE
811
2060
306.
400 A
t1 I i 0 0
I. I2 4' reIII aow
c I020 z" 2oN e
...
aI a
..
1
3063
0
R f t 1.4
? t . I
f 10.4N o$ ? t
I
SURFACE TEMP (F)N MISS M.COMO.CORR-RATE
6
1 SO
R f 1.4I N ft" Ts0 -
row
111
a
s di
NC2 260
C 0
3 3. a
40 400.
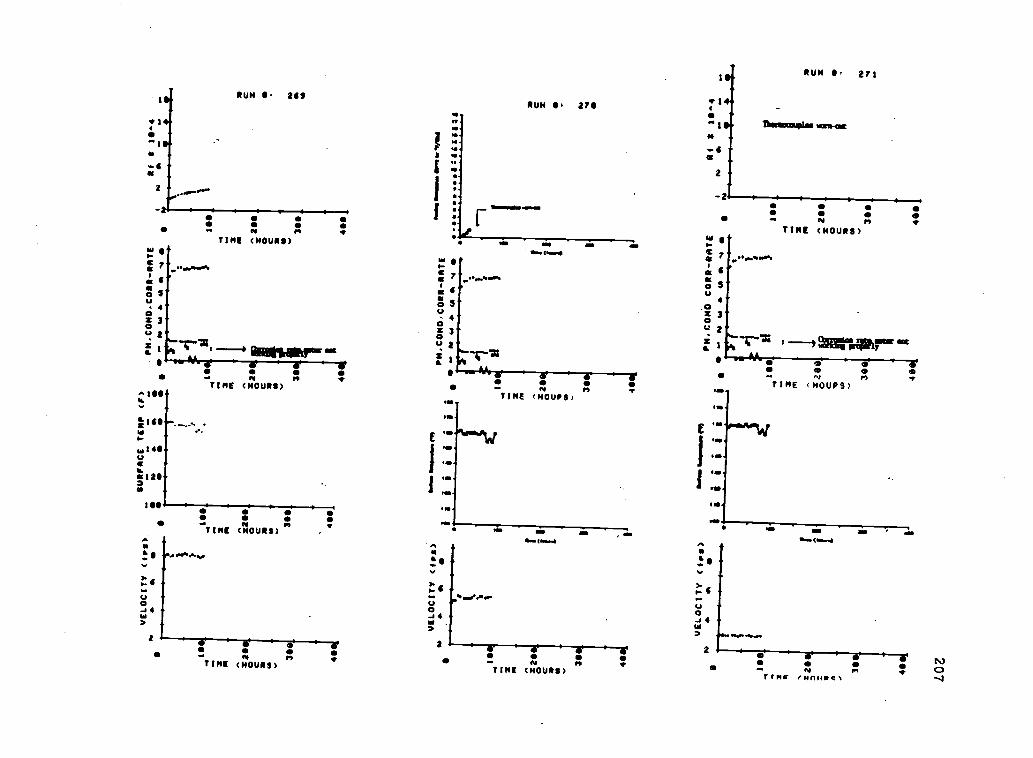
SURFACE
TE
ND
( F )
VELOCITY ( vs)
...
PN.CONO.CORR-RATE
Rf * 1 ..4
TN
a41
1.
.6
is ao...ftw^avo
L"
"N
.1
-In
(I
):'
....
.1i
.4.4
..
.11
1.C
1 ..
IGO
.11
410
0.4
INP
Im
Ior
:...
3;
ztS
2z
oo
z:2
41^
20,
Cc
C0 e
0.a
1la
tit...
....
.
IV.0
11,
303
351
341
1
IR C
4
VELOCITY
f s)
N41
.w
25 4
VELOCITY (f11)
NA
ICI
20 3 4 LO
Z
4411
6.6.
44,(
4)
I
PN.CONO.CORR-RATE
4, 64.4
6.66
6.44
0611
16.1
6111
4
2 C
DO
N. 4
('A
25 311
,
4
S.1
!I
41
1200 31
0
400
AN.CONOCORR-RATE
...N
M&
6 f
t)1
C
Rf * 10.'4
ISO
.
1.
4
- I.2
; 200
zo c to
at31
1,.-
4 ,
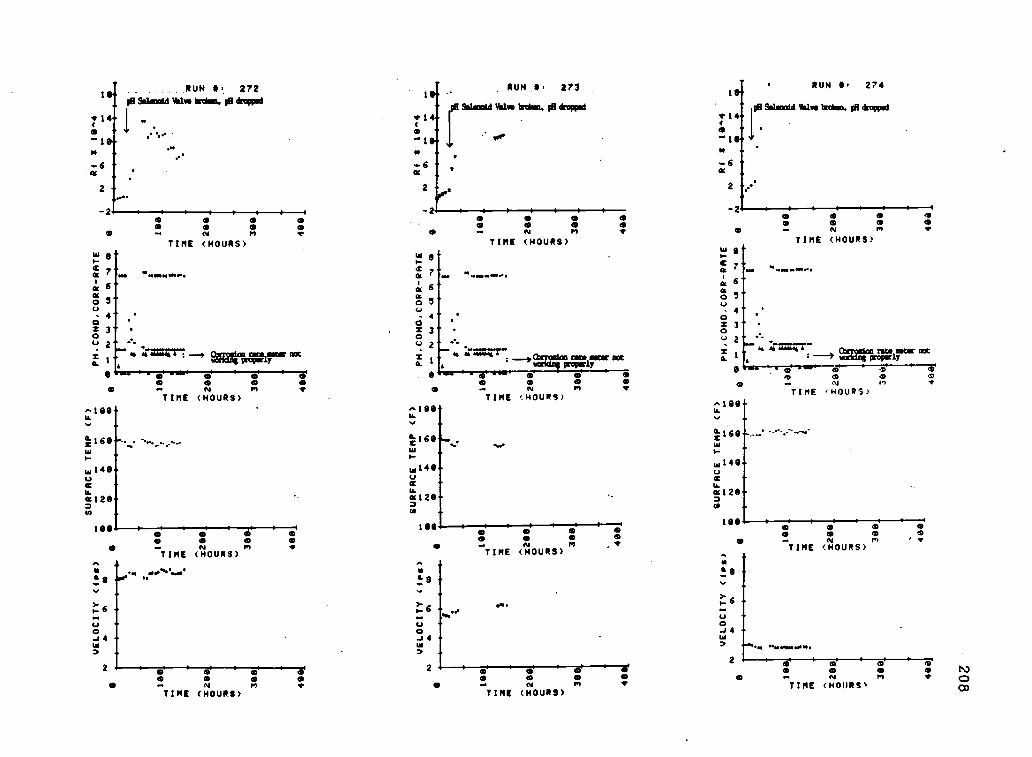
RUH 8 272pESalanaidIababedeln.
7
6er
2ym
o m mm m m mm .. N M
TIME (HOURS)8
6
a4
3
2Y x=711 M/ilaaratairmr not
apeCpt
TIME (HOURS).I89U.
m110169-,0-.
wl49.
0(1203
ISO
TIME (HOURS)
0-14
9
2
.6 .4
o TIME (HO URS)
RUH 10, 273
6
o m om 0 S m
o . N M *TIME (HOURS)
8
7
6
5
4
3
2
RUH II, 274
m so m mm m m S
m . m mTIME (HOURS)
7
6
5
4
3
2
"MMIMMWe
...........4=47. Ai AI 4 Mit 0408f Cat-..-, : ..) =aliraPerliaN24=ANIMIOC
9 0 0 I)9 a' ,
.V 0 0 00 0 0 0 0 Vm
~TIME (HOURS)N M f TIME ,HOURS,
^ISO-ti
2'1604..W
wI49-um-taC129-3m -
I88
o
p
m6 S
1
TIME (HOURS)*
3. sft
J4
2
S S S
TIME (HOURS)
^188 -IL
w
w140
ILm120-3
-
I88-0
N M ,*TIME (HOURS)
2 O 0 m 0O m m
m . ft m *TIME (HOURS"
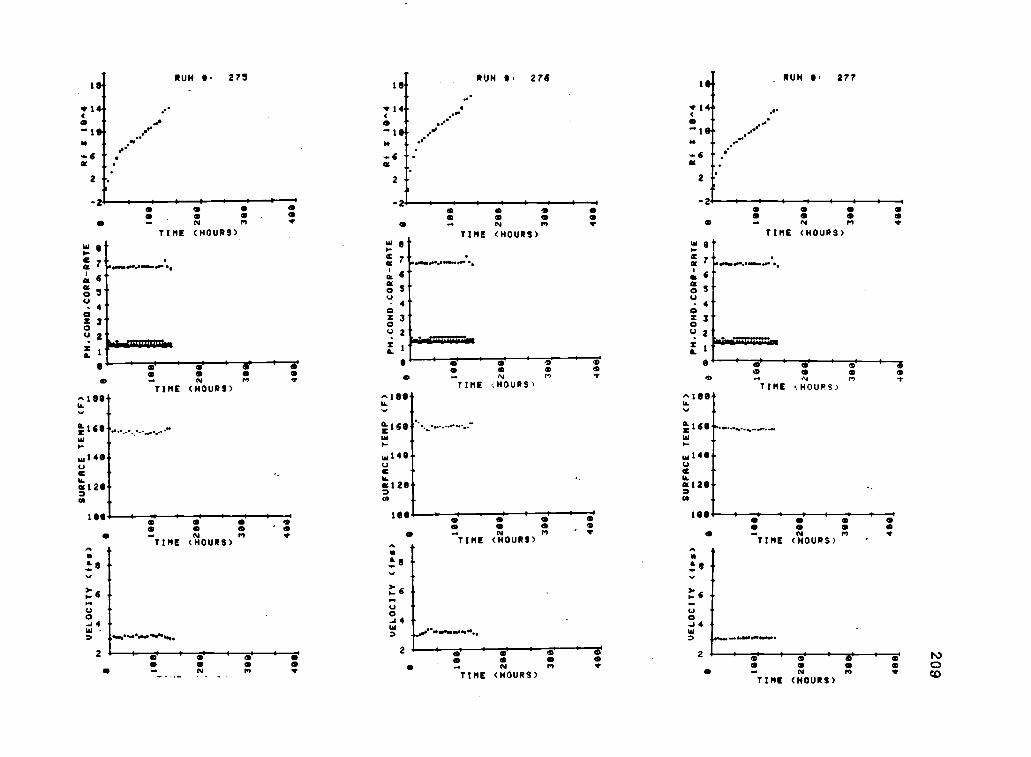
SURFRCE TEMP (F)
VELOCITY ( f ps)
N,
A0
NA
ones
I k 1
4180
4_4100
melee
1... x
. xn
m
PM,COMO.CORR-RATE
.4
...
^260
0x269_
o1280
cc
,m
oo
....
..
390
366
38
49k
406_
199
^ 296
0 C
399
498
C N II
SURFACE TEMP ( F )
..
R I
t18'.4
VELOCITY (des)
PA.00140,CORR-RATE
K.
o.
«
s4'
s.$
;?
NA
O9 seems@
.ftw.un vos
.198
i)-
ISO
i ?
:
.10k
!...
i
160-
.14
c,
1.,
)-....
e.
3.
..
_.
.,
..
^,
x206
x280_
x206
^ 266_
.-
x 0c
cC
CA
mm
oo
oo
....
.....
ft
yy
388_
306
N390_
a398
488
400_
VELOCITY ( f os )
SURFACE TEMP (F)
..
.N
AONAA0
aGoosoo
t
108
.100
.410
.m
II
I
Am
x208
30
498
60Z
x289
0 C
399
400
a
PM. COMO. CORR-RATE
..... N
O.
486_
0
- 4108
Il
I199
3 rn
3 Irn ; 2
"x208
3961
350
4601
469
A C N
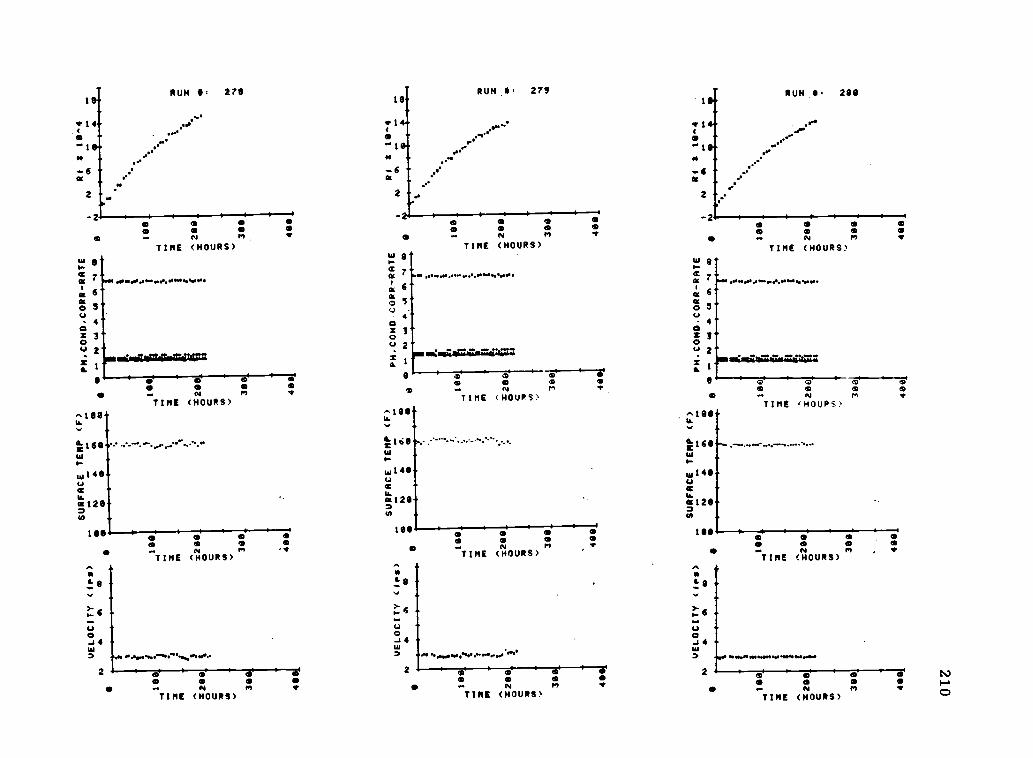
14
RUH . 278
..r. .0
0 0
TIME (HOURS)
0.. N mTIME (HOURS)
^180-4
w 1 46-uR -4m120-
106,
N
0
04
0(HOURS)~TIME P.'
2 m om m 0. N mTIME (HOUR!)
011.
18
*14
.1
N
rc
RUN 0.
44.
.4*
279
v 1
m". 1
N
RUN 0. 280
....'"..
.0
2
e
6"
S'4
1-
2-
o sm 0N m
TINE (HOURS)-.........4-
I 0M4:40174M07IIM.
w g
6'
8"o8"4'
Oz 1'
.
0s 0 m0. N m v
TIME (HOURS)
Pinek."1."1"41"446M"6 0 . lir-----lr
e m m me - m m v
TIME (HOUPS)
C.
^186.
W'Y.
^lee-14.
_ w
w146. 0146-
m126-=m
m120--
7m -
166 P l 4e 0 0co
TIME (HOURS)
100.
TIME
ml0
(HOUPS)
r,r.U04
2
mN4.8
m.-8(.10-14
2
TIME (HOURS)
TIME (HOURS)
0 mS.
mmm
mmm
TIME (HOURS)
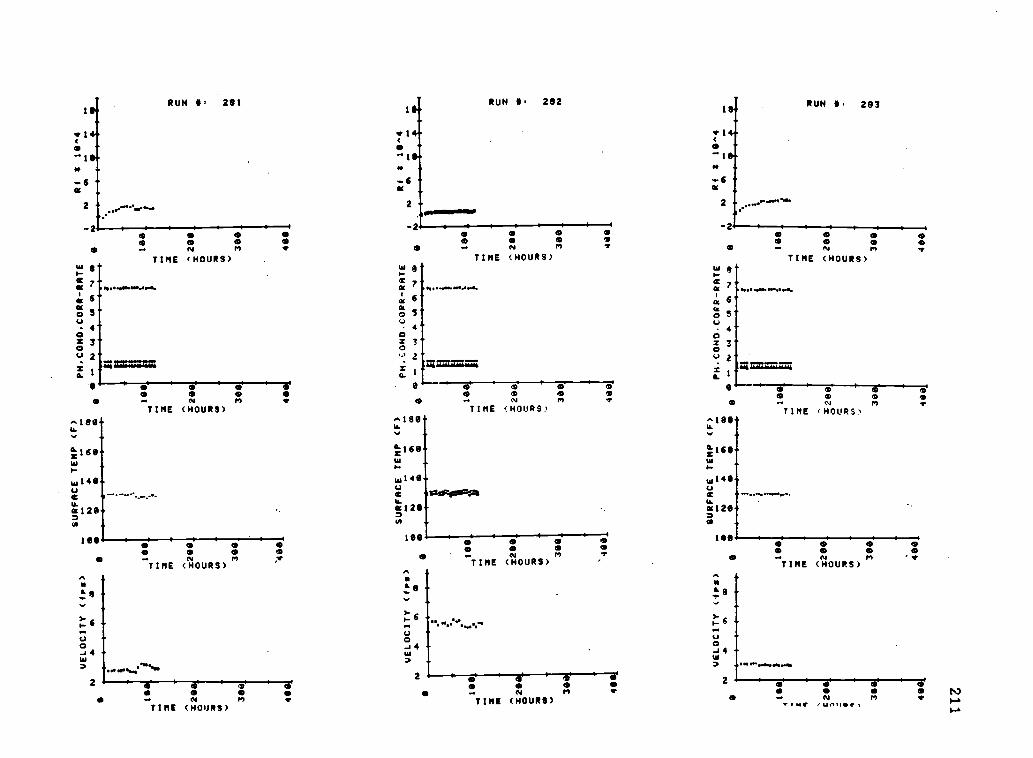
aw
o 5
4
z 3
u 2
za
RUN St 281
00 0 0
TIME eNOURS)
22===o m aO m m
m . m mTIME (HOURS)
-188.a
a-168-
01
6
RUN S. 282
00 0 0 0
0*
RUN 8, 293
TIME (HOURS)
U4-
= 3 -
2.qgraia2=z 1
a
TIME (HOURS)
8 0 m0
mO 0 tot i.
m 1,1
.. N M V 00 0 M.. N
TIME (HOURS)M *
TIME (HOURS)',MI-L,.
... .
180-a
=168-w_048- w14S-u stsraza aa128. a128-=0 .
1118.es
0TIME (HOURS)
m0w
TIME (HOURS)
%168-1
048
a4(128-
r -
0-m
I 0 0 1411.
ma 4I 1
e
TIME (HOURS)m *
OURS) .
o'"TIME (HOURS) ;34
,*
..
N411
0- 6
0-14
2
8
5
04
mmm
....
TIMEN(HOURS)
0M
2 0 I et el
vIme ,Ll110S,

X140
I
w
RUN , 284
o 0 0m m 0 m. N M VTIME (HOURS)
7
6
4
3
2
lee
a.e
3-I.-
U0-1 4W
V.% 0v...ft goom.
0
2
O mm e m
N MTIME (HOURS)
Im m m
m mm
TIME (HOURS)
400±
o mo N
TIME (HOURS)
e m mm 0 me . N MTIME (HOURS)
+6oc
2
2
RUN . 286
o o 0 0mmm m0. N
.1.
TIME (HOURS)a W
7 Of* .. 11.44OC
6 ft 6oco 5U
4 4
3 2 302 4.. 2
1
.21 m,
0V
TIME (HOURS)"188-w
t160 zawv1. 1.w140
C
0(128-9
lee
TIME (HOURS)
w148-uU.&120-o
188
TIME (HOURS)
11TIMEIOURS).r1I
(1 V
e
UO-1 4
3
2
uO-14 -W
2
-
-
mmm
S0.4.
0TTMC
00N
runwip*,,
00M
00
TfmgNe4m110el
I os
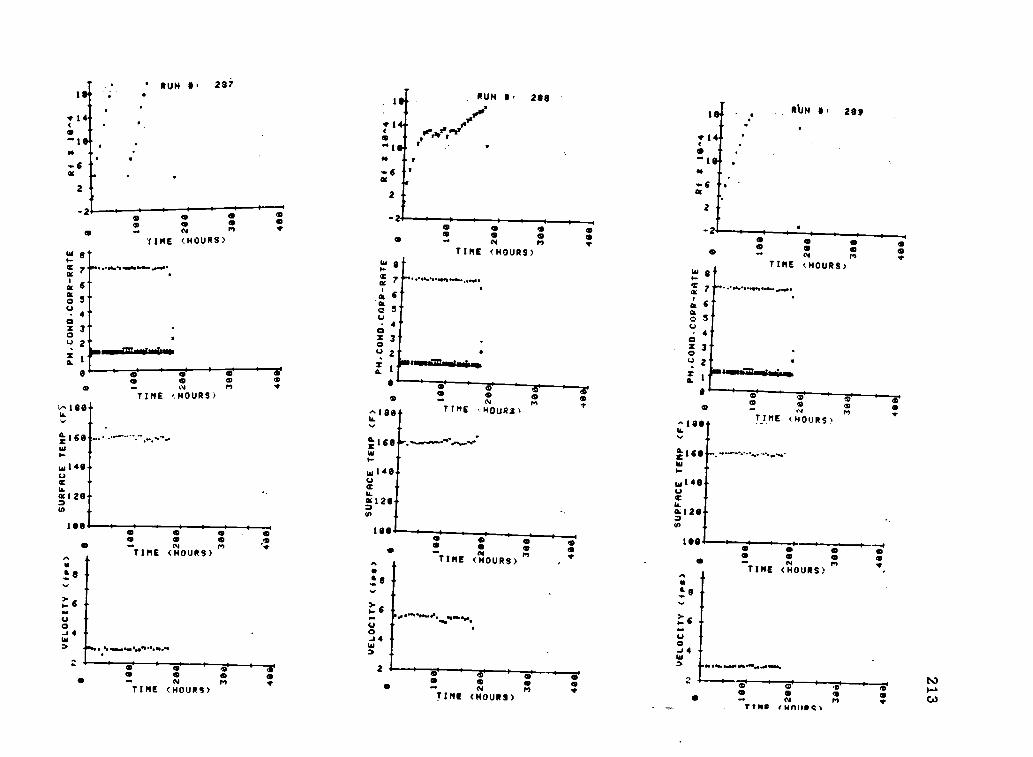
RUM ' "RUN
7
ow*0
0
at
O
7
6
3
4
3
2
1
0
e)(*
TIME ( HOURS)
-.""r".
co
F 8p..0 7of
GI6
4.o 5c.,
- 4oz 30C.) 2
zo.
0
0
s
Oco 0
MH. 011 RS)TIMt
(A""
100 I 6: miso
o TIME (TOURS) M
TIME ("u")
299
mr 1 4
-1
6at
O coco
a)as co
co
RUN , 289
N rn * co com O m
o 01 M 1-TIME
.-
m so(HOURS)
I
4
....,. .........
TIME (HOURS)
cs 64.
........
0
Us5
c 7
U
a:
o
z .....1
.
4.
0co
m-TIME N
oor-,com
mo 0
z 3C.) 2
o o^189 .1.011113 . ... N M
HOURS)u....
(040-
tu
wiaa-
cu
--
c
' ms co to o
Is.
0 0
ft120
O 0m ...
o
a of
.
(n
10 /0I
00insm O
..-
so
-TIME (HOURS)aS)
OAl
^y .
-TIME (HOURS).., .*
.... .
, e -2
0...I 4
.
n. .......0
- *w '
coal o
w
o_14
2
o.co
cvo
M ."
U
i 40, "4-1:
twilit."
CY
2
st .
O--.
TIME
s a)
(HOURS)N0
r)O
,..
TIM'
4/o 4/
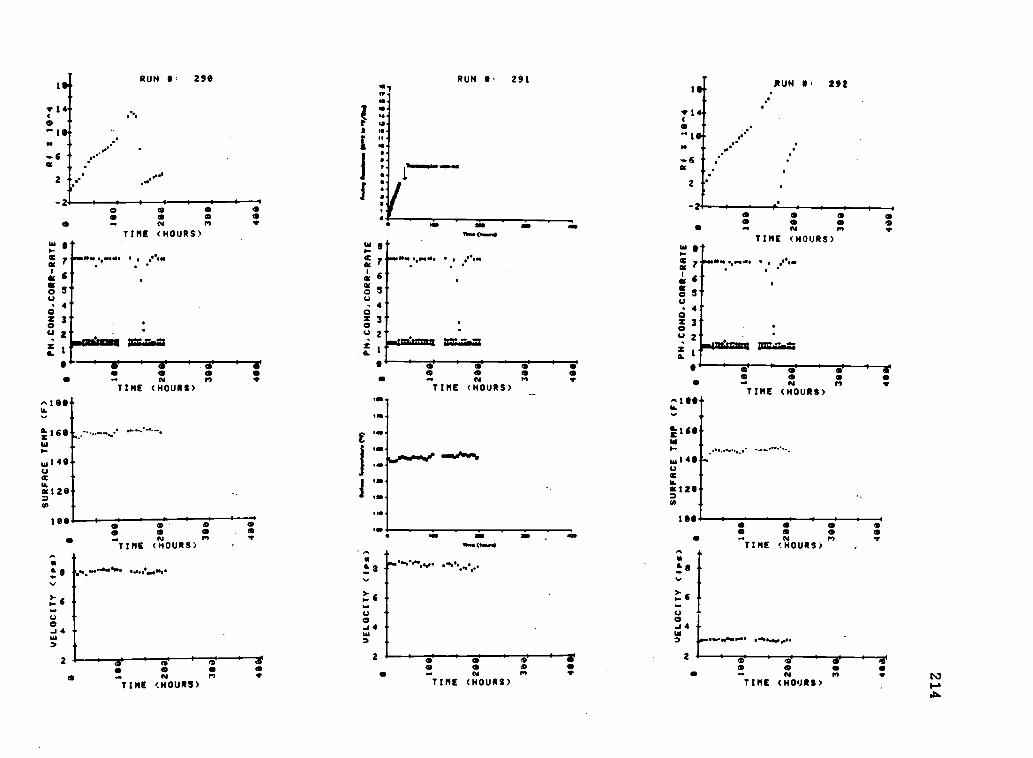
o0 0
.. N nTIME (HOURS)
e
c 1.41.6
6
o 5
40Z 3Tu 2
1
=Qa.
0
0 ' et el 4'
TIME (HOURS)
49
04
2
0*0
TIME (HOURS)
0,5.01
O 0 0... N mTIME (HOURS)
Nal17n.
1....
I ..
I7
f a
7
6
4
3
2
1
RUM , 291
11414
fibIlme(145
11.
1.
'a.lib
120
511
1
0O
0 0
TIME (HOURS)
6,1aaane .45NW%
lbws (1011
1.
U0J4
20-. N mTIME (HOURS)
o 0 0.. m n
TIME (HOURS)W
C
a 6aoU
40z 30U 2za. a
%me
y1146 M.UC
0
O 0 0...4 N mTIME (HOURS)
IMO 01
0.. N M yTIME (HOURS)
2 1 1 1 1 41 5 el 1 410
0 N M 4. COTIME (HOURS) 1-4
st.
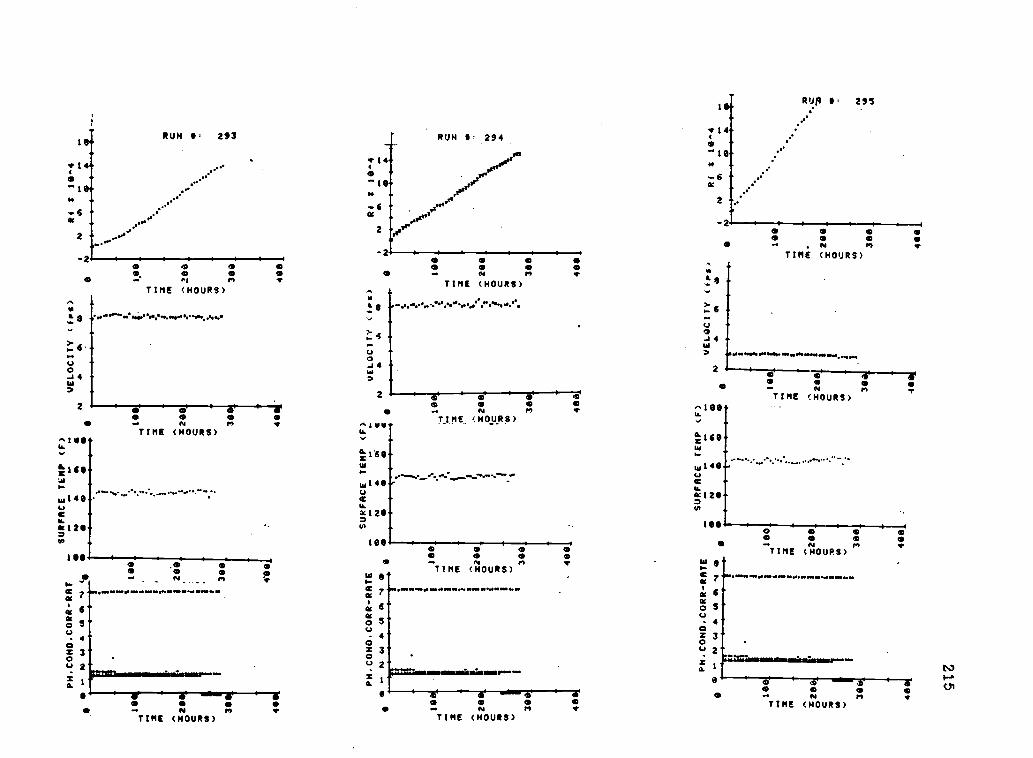
RUH S 293
TIME (HOURS)
_6
04
2
RUN 0' 294
O./_eel*
2
RUO , 295
m m m m61 m e 0
46 -. . N mTIME (HOURS)
OO
m0 0
TIME (HOURS) Vs 9
-
6 -
U
...a 4
J42
O
ea
m-2
mm o 0
0 ... N mTIME (HOURS)
O .00
_ m
0
TIME (HOURS)
41111.LL
=160 -
W 140-,U
a120-=o -
100
a
o mN mo 4 TIME (HOURS)
O 0 m 0 "ISO-.. m mTIME., (HO
y wTMURS) ,__.
0
TIME (HOURS)0
6
3
4
3
2
06
TIME (HOURS)
L160-
a-
-w6120-6 -
100
7
6
4
3
2
0
TIME (HOURS)
FCT
TIME (HOURS)
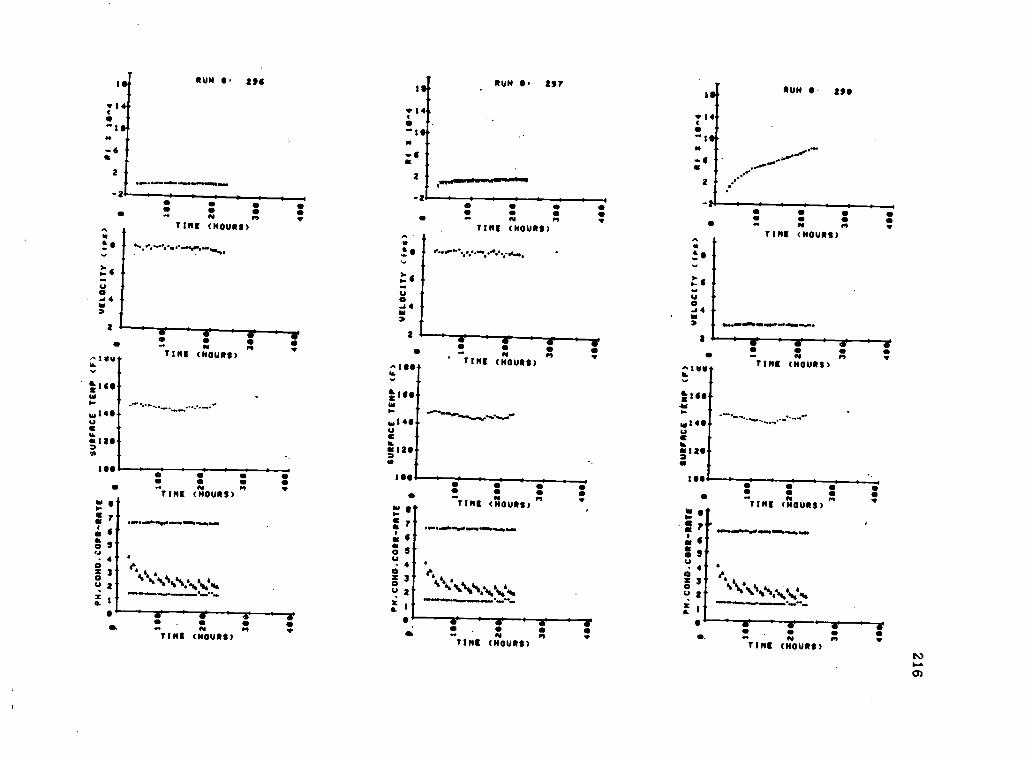
S
N
RUN , 236
TIMEN n(HOURS)
N
RUN O. 237
a ,
2 r,,woroworowwwwwww
-2
I-6
UA
3:6
.44N
2
^14u
=IRS
w14U
ft 1221I I I
TIME (HOURS)
TIME (HOURS)
S
7
S
4
1
2
o.
3
2
nN..
TIME (HOURS)
^166 -w
6160-N
wiseU
a120,
100
ft
TIME (HOURS)
0 000 0TIME (HOURS)W
ft
ftoU0zU
go
6
3
4
3-2
..1101,
TIMEft
INCURS)TINE (HOURS)
ft
IM
14-
' ...
RUN 0- 230
N nTIME (HOURS).
^IVY.
6 140,4r
w140U
24[120..
1
TIME (HOURS)ro
w g0 a,a
4aO 4U
4
z 3LI a
z I
TINE (HOURS)
.M.1400....010e+.ftftm
ft
TIME (HOURS)
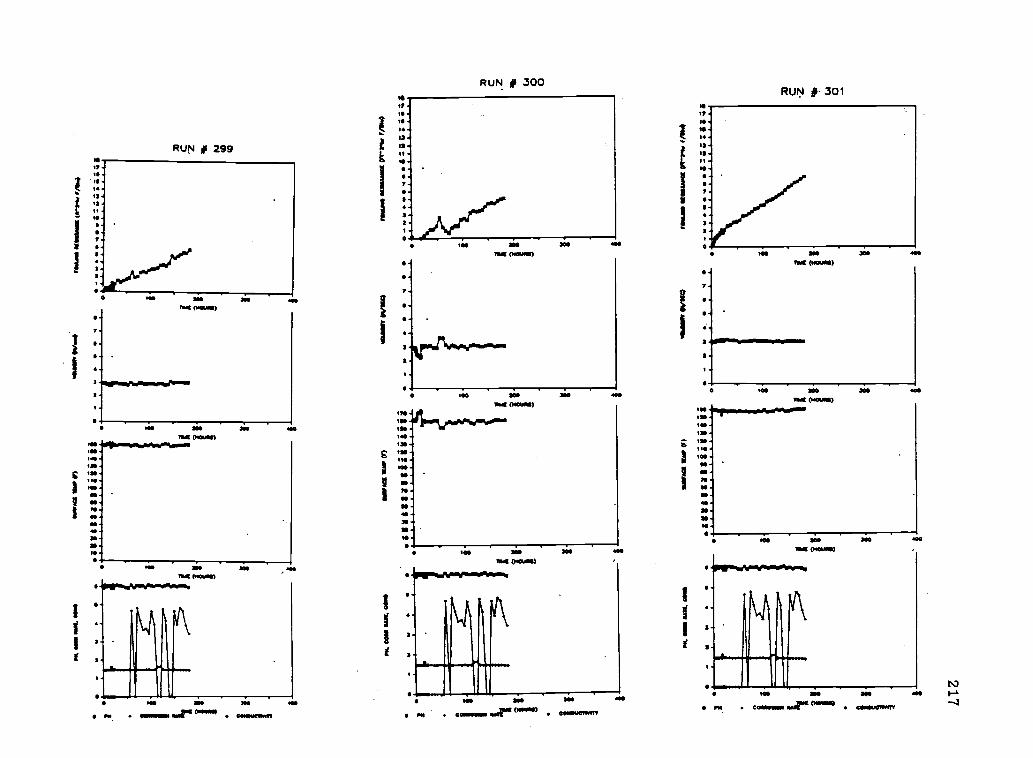
RUN # 299
I
I
7
3
7.
1011SO
IN
1M.
70
sor.
aN.
asMt 04000)
10 310
108 0014111811810.004/440011014.01.
3
11\
1.
4..
0
230
11111 NO 3111 011011001.1 111r C0011CON1
I
I
I
RUN # 300
yearL01.4.1.5110.002
3
1
700 3044
lit (N010110
1M 10ma mamma
11011.410003000001110.
10110.0010117
I
I
RUN 0 301
18 010805)
140
:261saeM
as70
M.ago
100
N313 MOWS,
1.0 300040111111)
3811811104.01.010001055400%
30
00._101 310 301
-1"e 040011001 C0110811.1 1141.8 NI1110313/7

218
APPENDIX 6
COMPOSITE PLOTS OF SELECTED RUNS
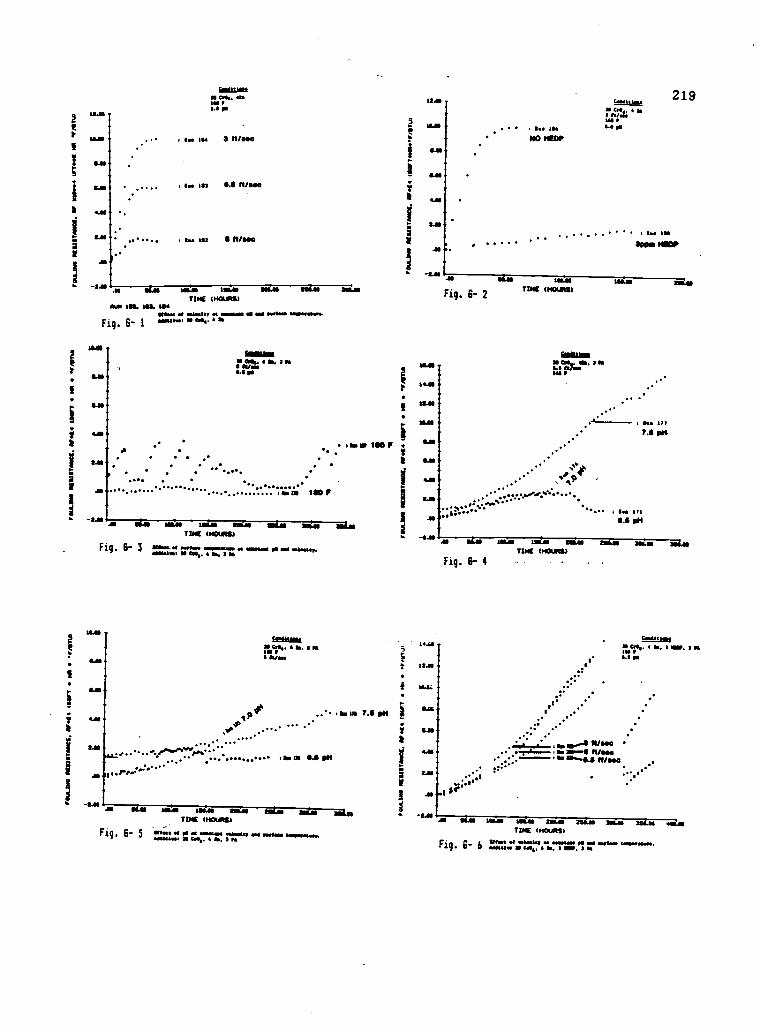
.
SMOMMENom.. 41.Ide PO. pi
2415.15 Ass 1s w MAO asr
TINE ONNOID11111 1aa. 1113.
Irst 4 terra ea roma al1 sr errs arrears.alarri N Calls. 11.
Fig. 6- 1
TD (H .m$
Fig. 6- 3 ars. « arr rarer. at arr. 311 mit tramadrart N Copi. N.IN
a
I
I
N
I
a
a
I
gala
N.
SAS
.10
1 los 154NO HIED/
Crier*za Cr , 4 u.ru.t.1411 P5.5 pm
AS ais 1101./11 1135.511
219
Sops IMP
EarTD 0101M
Fig. 6- 2
1441
Fig. 6- 4
Fig. 6- 5 Wien el pm r orourt riser as1 mars 1111114..se.rarer N Co. N. I PAFig. 6- 6
N. 3 MOP. INHO.1 pl
tile"-..,1.30.-4 tu..6xi...Ls woos
.
ULM tamTINE (HOURS)
altar af radar r arr. 011 ar _I_ rarer.MOW. MI 545. N. ) WIC 3 IS

1J/
..t.:f
rin, 4 is. LS I4.4
NIMESSI SW, IL LS SPND6.0t tam Itiese
220
.111/11
I ...'....tJIS
12.111
......ALSO
t So IS lee O T .' .. Is. al
1111/11
TIME imOuRS/
Fig. 6- 7 is". ". 717
TOG
Fig. 6- I 116.1 a . 1464 .111 r. 460.
Fig. 6-11
Tin 1110110
Mon 1/ asl 4.444. 44111444mos411InSou 44011. ISE 14. LS ma SI. LS ma Et1.1 W. GS.
Fig. 6- 8
ISM120S OONAIND
M.... se1=44. P enISMO al 4Sgns msossows.4444 USW, es 1 a
man
Fig. 6-10
TINE MOMS
Mr WI P a amass .4/4//as r 84. nposomra.4144444 SI PI. SM. Ns Is. 1.1 so b. Ls w.LS so P. so a.
Fig. 6-12
TINS (MAW
aim of 01 a ammo woo/ ad mins mons..asersa. pm Mk .. 1.1 .a t LS ape N.LI as W. sp
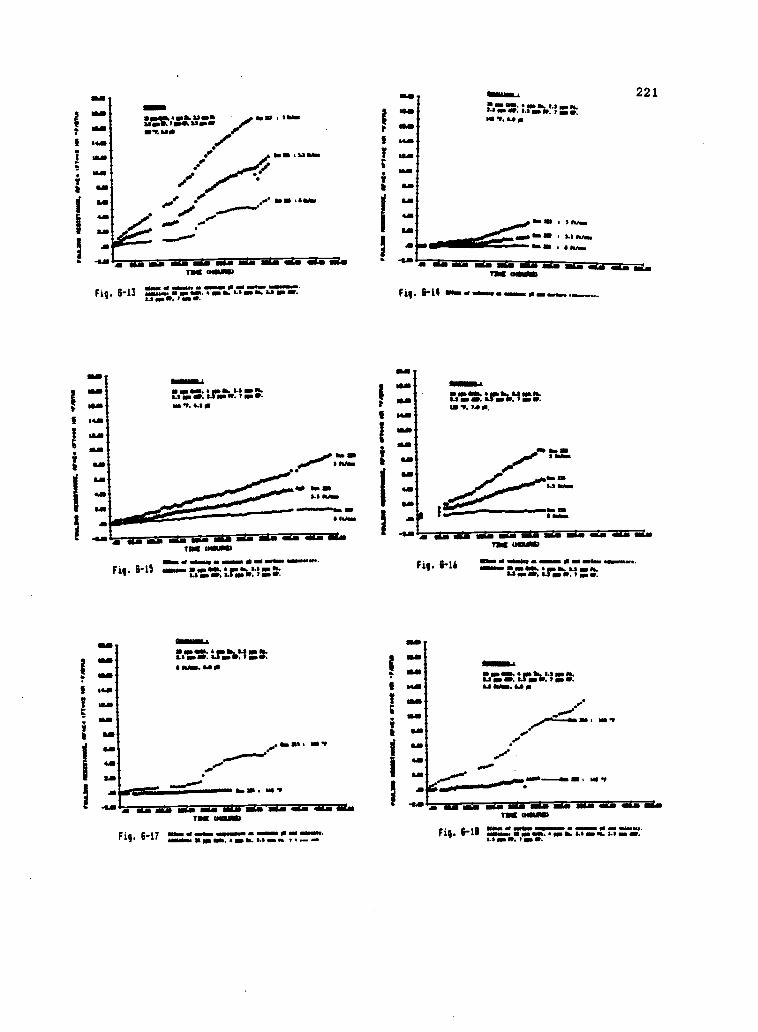
'Sguya. w1141.41
blocfs
la
et a«..sa. olosa
UN
MU
* 0.4111M
.1111111
IL
mam
a. to.La W
aillirrylea
wars. el 441 F
aM
IRO
*
iII-1:g
OLL
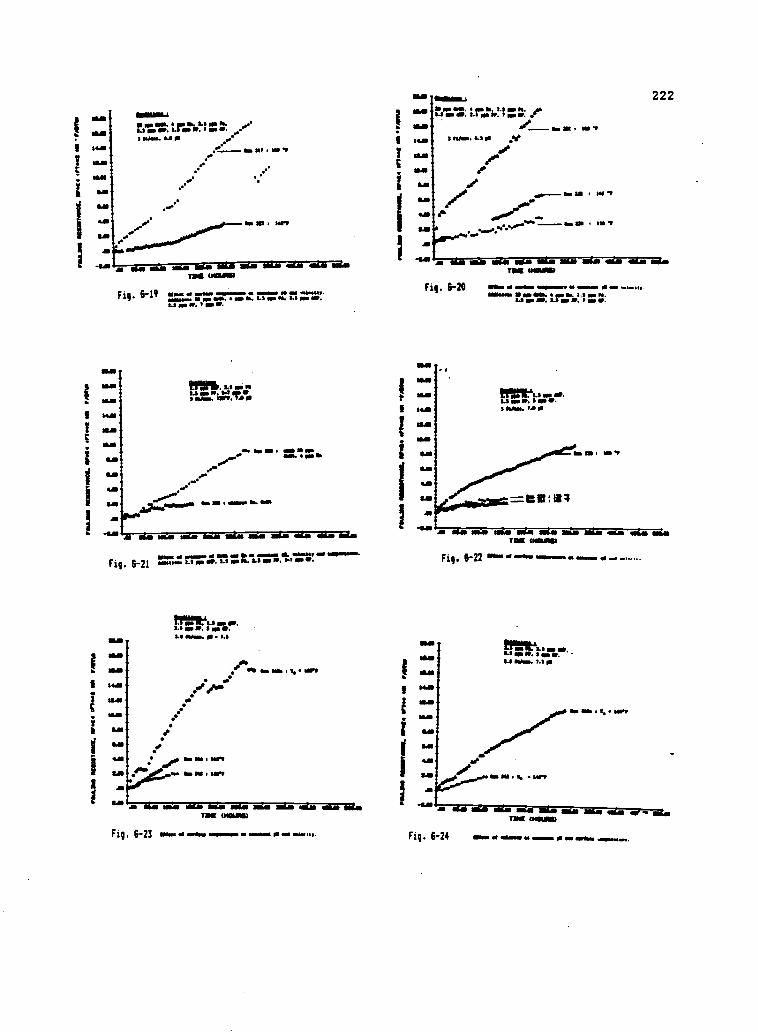
MUM ISIS14140L 44 016 NI MT th;%;;;Ititt .6;;;; 1 litil 4; ;11;;;; gill I! . 1%;1' b
a. II I. \N r . ..., t t cr......\ - c.
illi / i 11 t 1\ . %;
: : ill %
i I I i 14 ill 1:
I. t C Ilia %..
I t II ii %c
q.t ! II it g I \ a .` if
! il II g- Ii: I° C; s \ iir p; I\ si i
Fr i :If. \
II I IiI.
ass Is
I1.:
_r \E
I I II
C6 F
;i
1
'A
I ill e Is iCI
f t 1 1,1 1 II I
II I r
11- I I
mums sevr. rP O I. 4/411UNI 111431N0. 41, 014 is 40111110
MUM 1.411.11111114. OW* 1411 mow POLON, 1114111T4N114, 111444 W44011411 /411 MIAs 41411111141101411. 11/4 01«. MI voi11
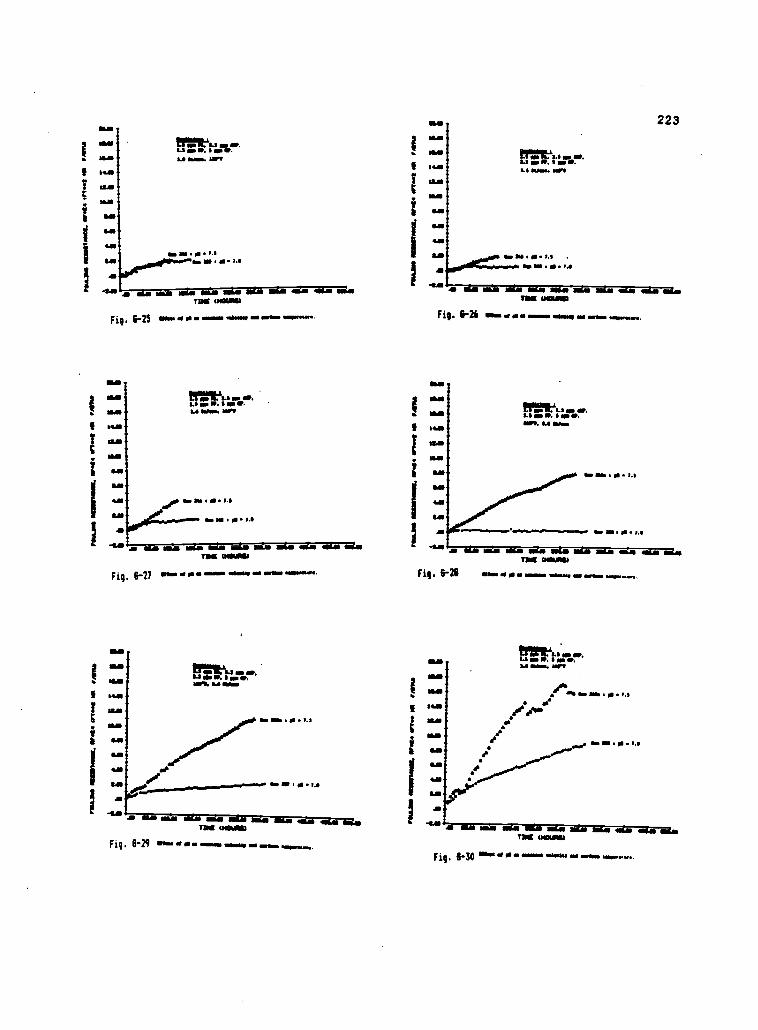
Willi
IPS
ID.L. 1,1111.710N
OS
SIIIN
V 111111111111111
WA
WA
w P
.LJI 1./81 iON
SILO
WIN
I
IAaL
I-II
aura es swum
ior vonsuese annum
ow. el w
as was nw
asals arm.
111111/4se *oars oat vssrasnal suns.
aura w w
an W/A
I ./WW
WW
WII
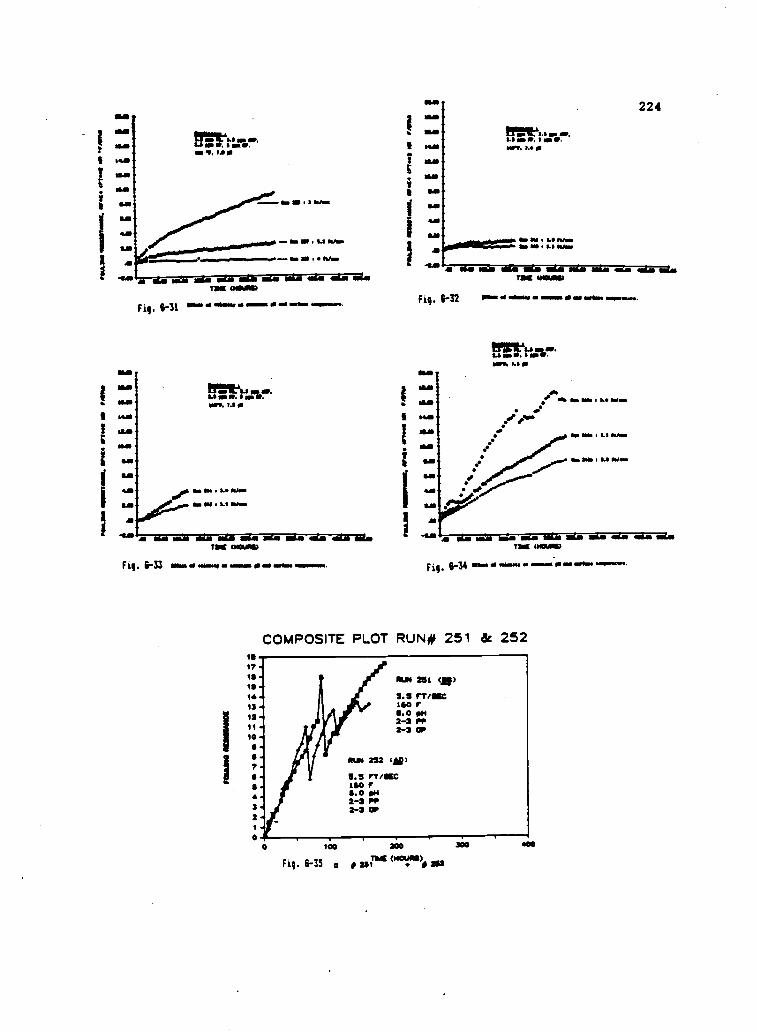
um NM.BM ra
../.........."..".......... In III s SA Wm
Imo IN OlAw
.......-- r XS It/
Tit 010.0Fig. 6-31 ow. mamas/ ommlint all =Mr ammomre.
TITS CNOURIN
Fig. 6-33 60... a ars., 0 ml mime Imemon.
Fig. 6-32
SIM
eam Ma . Wow
4." /es'
a Woo
WY I i.e Woo
0.:011ILO
Tat 01011110
TMB MI r =Moo
roe.LS OM IL SIN
MM. 1.11
TOE MOUND
Fig. 6-34 mime mown...
COMPOSITE PLOT RUN# 251 & 252
Fig. 6-35 asil." ("°". )dt sat
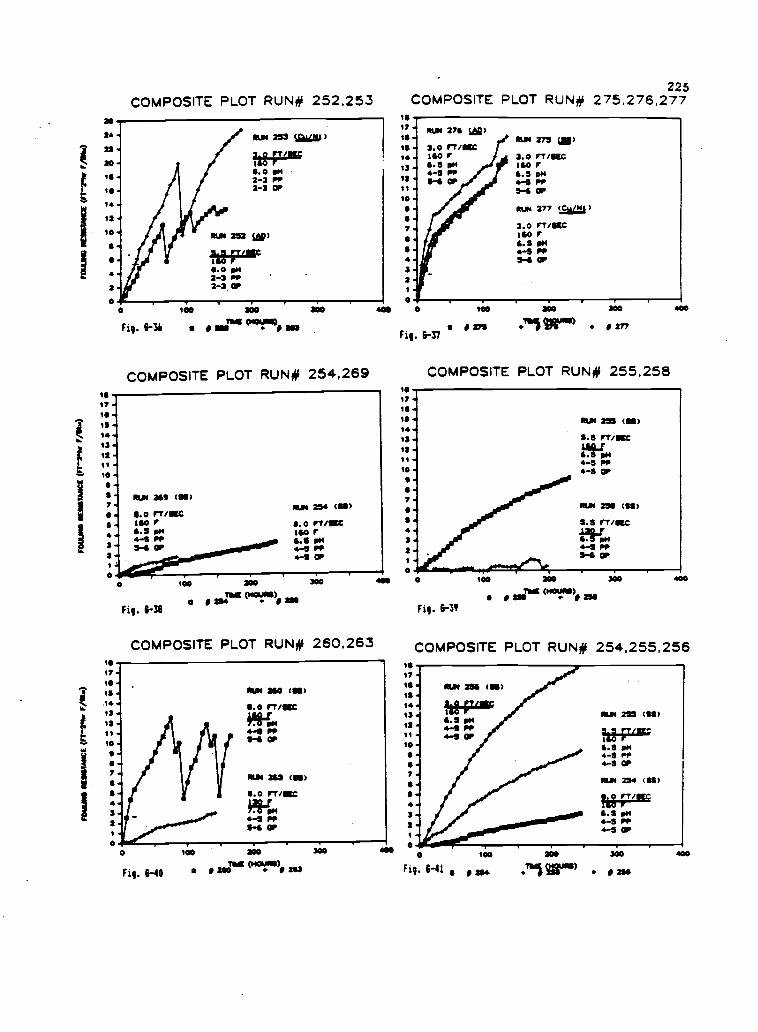
I
sa
24
22
20
is
is1
10
o
a
0
225COMPOSITE PLOT RUN# 252,253 COMPOSITE PLOT RUN# 275.276.277
0
Fig. 6-36
10011255
II NS
20004011110
163
COMPOSITE PLOT RUN# 254,269
17.HI1514-13 -12t t10 .
a.7.8
2 -1
0
111
1710111
.14131211
10
7
$
32
0
RUM (U)8.0 FT/UTIGO rIL 5 PH4-5 p09-11 OP
Fig. 6-38
100
OW 234 (IS)
8.0 rwoom150 rs.s pN4-5 PP4-5 OP
200 300
TOK oox.P.No).0 254
COMPOSITE PLOT RUN# 260,263
Fig. 6-40
100 200 300
75K OOK)o . (H
200 41 203
1$17HI11111-13ti10 -I .1
a7.
32
RUM 271 im)
3.0 117/811C140 F5.5 pH-7 pr
Si OP
KM 275 tip3.0 FT /SIC150 r1.5 pit-5 pp5-4, OP
TUN 277 <Small)
3.0 FT/SU160 F5.5 pH-5 pp5-4 OP
100
Fig. 6-378 I VII
17tOIIi41312ti10
11
87.a.
3-2
15
iIa
17
1312it10
7.
5
32t
aoo 300
*Tel tr) 277
COMPOSITE PLOT RUN# 255,258
100 200 300
1551 (HO410
ME# 21111
Fig. 6-39
00
COMPOSITE PLOT RUN# 254,255,256
Fig. 6-41 8 us 4TUli taill" 254
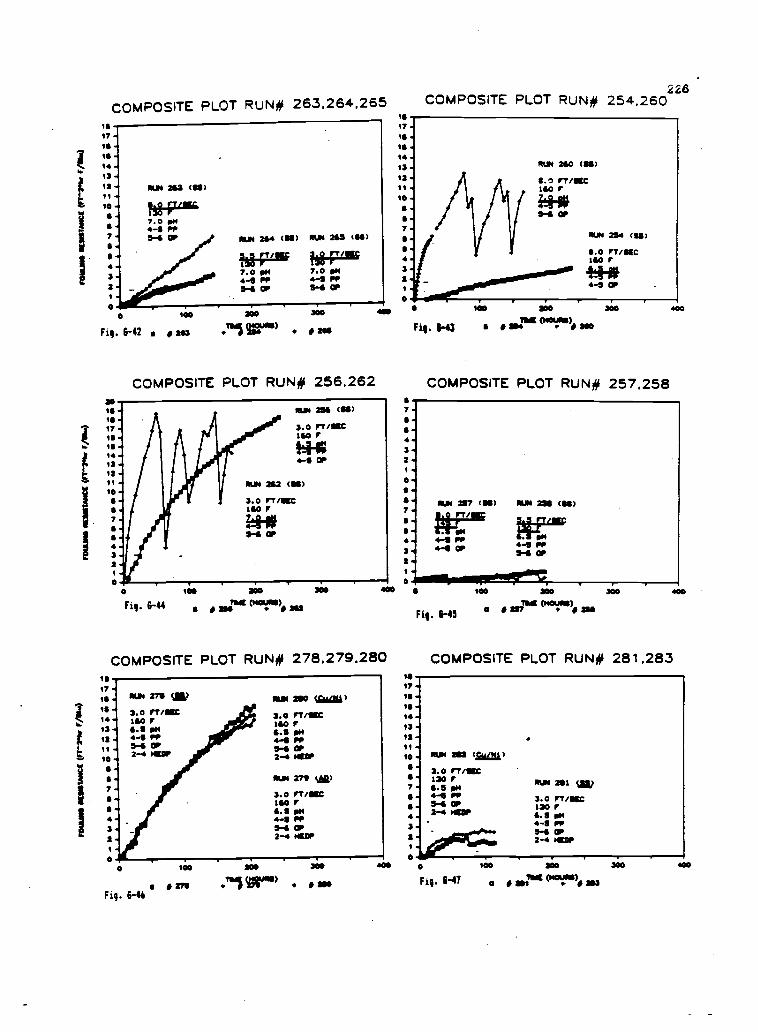
COMPOSITE PLOT RUN# 263,264,265
Fig. 6-42
21ill
i171IS
i1413
i;1211
110
1
67
1 32
0
263
300 300
:11 u4" 2116
COMPOSITE PLOT RUN# 256,262
010
Fig. 6-44
10 300 300
I My" ("nil% 262
IS
17
1IS
113
12
11
10
7
32
COMPOSITE PLOT RUN# 254,260226
100 200 300
Fig. 6-43 as,2111 "el% 200
COMPOSITE PLOT RUN# 257,258
00
711
3-2-
S..IM 267 (SI) ISM 22 (/S)
7rT
, MON.1 +43 PP
3 4.41 OP 4.41 PP311 or
2
.P.11.101.1111W51111.9."17000 100 200
any 0401001)Fig. 6-43
U7 2.11
COMPOSITE PLOT RUN# 278,279,280111
17ISIS14.
1312
II
Fig. 6-44
276 781 ( re) 200
17IS10 '414131211
10
7 .
IS
3a.I
40.141o tie
Fig. 6-47
00
COMPOSITE PLOT RUN# 281,283
OUN 262 (Can)
3.0 'Tam130 r.5 044-5 PP3-6 or2-4 463P
RUM 261 SW
3.0 117/25C130 F6.5 0014-5 PP5-6 or2-4 HEW
300 300
TINE 0/0(.101)ni XU
00
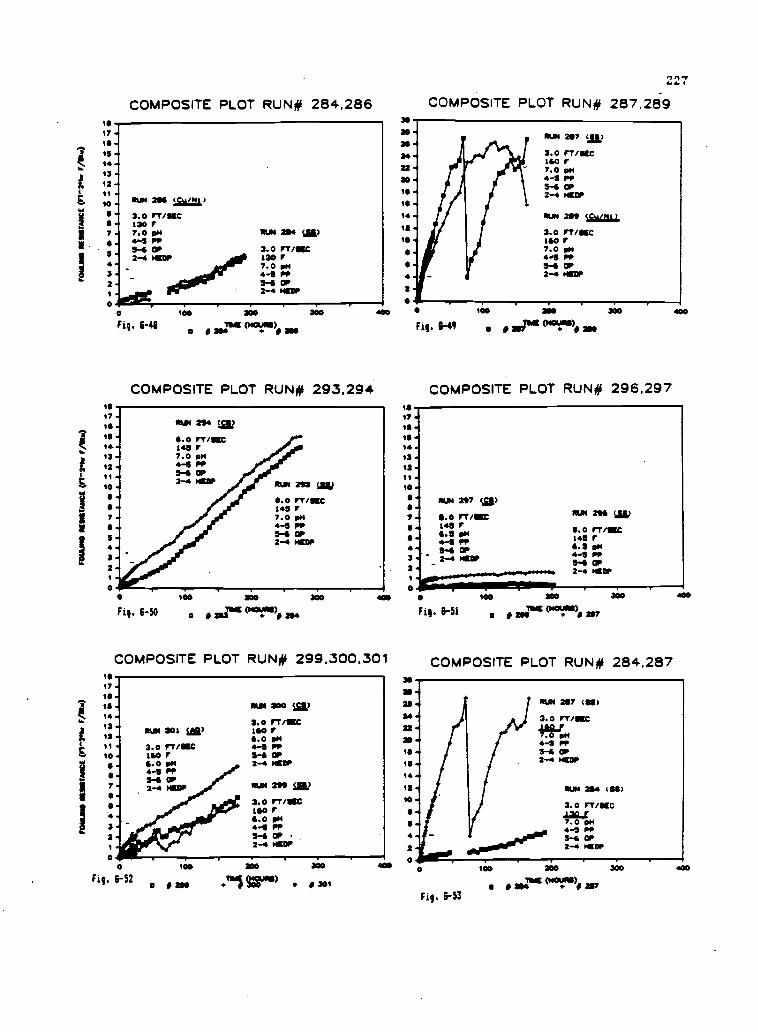
IS
17
.
IS14 .
13
12
11
10
COMPOSITE PLOT RUN# 284,286
5 -
5 .7 -
!I
4-32
0 0100:
RUN 2 (Cu/N1)
3.0 mac130 r7.0 pH4-5 PP5-G OP2-4
RUN 264 taw
3.0 MOM130 r7.0 pH4. PP5-G OP2-4 HUMP
O 100 300 300
Fig. 6-41 aa see
IS
17
IS114.
13 .
12
11 -
10
.
57.55
32
0O 100 SSIO 300
Fig. 6-50 125a114 (1110 11. 211111
COMPOSITE PLOT RUN# 293.294
400
COMPOSITE PLOT RUN# 299,300,301
17
1 IS
15i1312
10
7
COMPOSITE PLOT RUN# 287,289
IS14112
10
2O
RUN 207 iii2
3.0 rTee160r7.0 pH4-5 PP5-G OP2-4 HOOP
RUN 289 tag=
3.0 macIGO I'7.0 pH4.5 ro,5.4 OP2-4 HOW
100 110
Fig. 6-49
VI13.
Vb.IS.
13-12
II
p.0 mew RUN MK gu7
I!: rooM
4.1 PP 145 r
35-6 OP4-5 PP
2 " 2-4 14500,
0100 300 300 400
Fig. 6-51 WSftic (mows)
2070
jest (MUM)NW Ma
COMPOSITE PLOT RUN# 296,297
400
RUN 257 ijap
3111
24-22
30 .
114 -
t*S
.
3
2-1
00
2
COMPOSITE PLOT RUN# 284,287
RUN 287 (IS)
3.0 rristc
4.5 pp5-6 OP2-4 NSW
Fig. 6-52
100 200 XX/
/ass *In WS) p 301
Fig. 6-53
100
RUN 254 (SS)
3.0 rriscc
7.0 pM4-5 PP5-6 OP2-4 HIM
250 300 400
2S7165 (Mira%
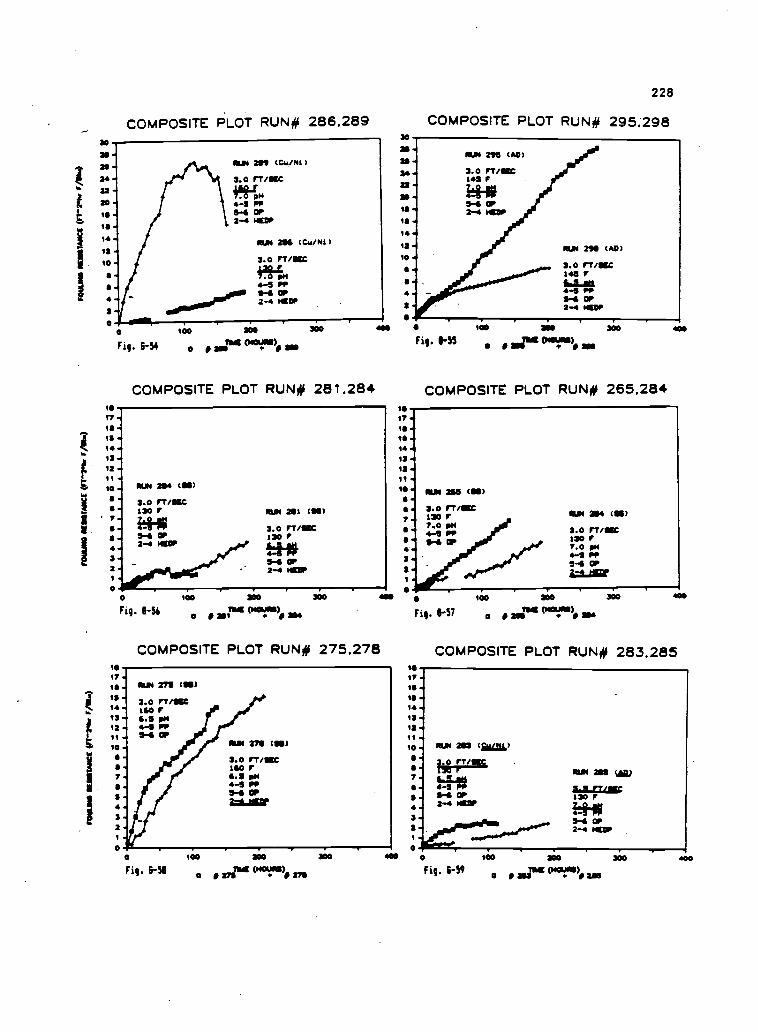
30
2$
as24
sa. 22
ao
111
10
14
12
10
4
2
00
Fig. 6-54
COMPOSITE PLOT RUN# 286.289
100 300 300
0_1sTS5 (14 0U05)
01 MI
COMPOSITE PLOT RUN# 281,284
400
IS17151514 .131311
10
COMPOSITE PLOT RUN# 275,278
5-57
I321
00
Fig. 6-58
100 200 300
Tag (muss)275 27
30
31110.30.
30 .IS.IS
la -4le
S41.
0
Fig. 8-55
228
COMPOSITE PLOT RUN# 295.298
117IINI14 4131211
I4111II711
54'-321
0
Fig. 8-57
01.111 295 (AD)
3.0 rT/sac145 r
1440541 OP2-4 1.111))P
*SO
100 >a 300
mpg 00101115ISO
COMPOSITE PLOT RUN# 265,284
IS17IS15141.131211
10 -9
57.II .1S.4.3
00 300'
100 200 300
1511 (1901100)Sri .100
40
COMPOSITE PLOT RUN# 283,285
SUN 251 CciattV
141÷0541 OP2-4 MEW
100
SUN 2115 (ea)
&Li:UM130 r
5.4 OP2-4 MVP
(""fill), assFig. 6-59300

229
APPENDIX H
DEPOSIT COMPOSITION
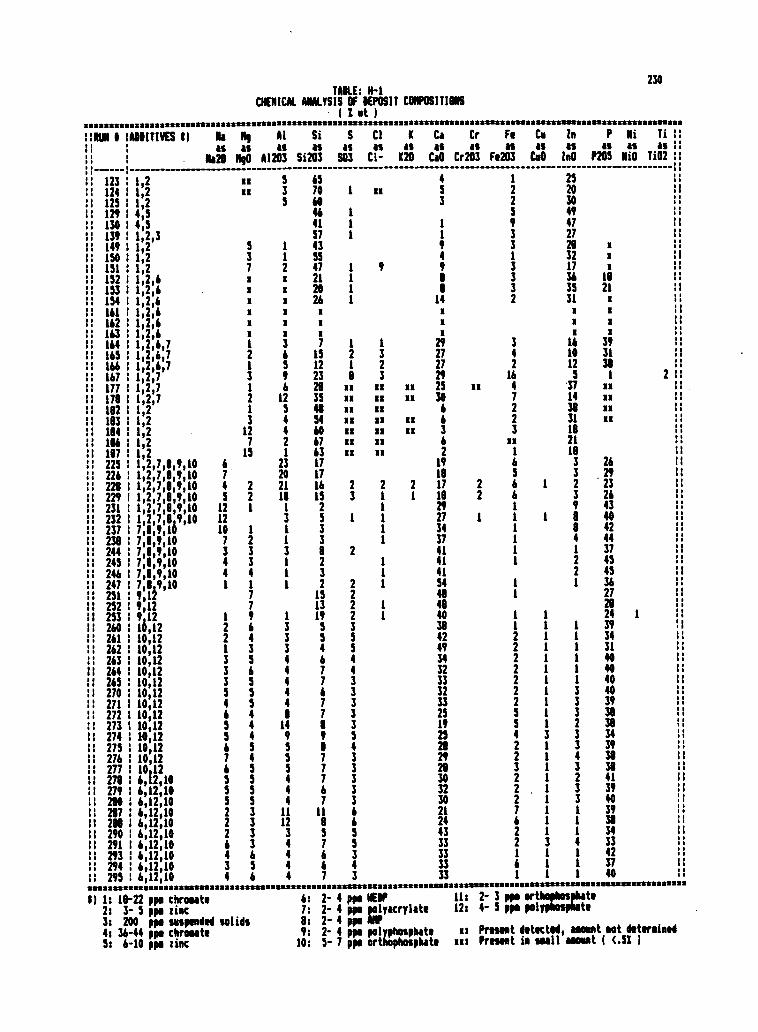
1,1,11011 I lADIITIVES I)
123
4
i
12
125
1. 129
IS 13011
SI,11. 139
149
s:
:I 151
50
152
153SI11 154
1: 161
162
16311 164
1
166
1 6:111
1610101 177
178
182SO0. 183
1841: 1
18611 0711 225f.11 226
228
22911 231
23211 23711 238II 24411 245
I: 246
II 247
251252 9,12
II 253 9,12
II 260 10,12
261 10,12
:1 262 1 10,1211 263 10,1211 264 10,12
II 265 1 10,12
1: 270 10,12': 271 10,12
11 272 10,12
273 1 10,1211 274 10,12
11 275 10,12
1: 276 1 10,1211 277 1 10,1211 278 6,12,10:: 279 6,12,101: 290 6,12,10
1: 287 1 6,12,101: 288 1 6,12,10
:1 290 6,12,10
1: 291 6,12,10 6 3 4
11 293 6,12,10 4 6 4
11 294 : 61210 3 S 4
:1 295 6:12:10 4 6 4iSSIS8888288U 222222 WS* 222222222 2881112 222222222222 882282 2222222222 2/12SMESUOUS8811228811USURSIMISSUUSIXSUMS
aaa
TABLE: H-1
CHEMICAL ANALYSIS OF DEPOSIT COMPOSITIONS
Na 11, Al
as as as
Na28 1110 A1203
1,2 xx 5
1,2 xx 3
1,2 5
4,5
4,5
1,2,3
1,2 5 1
1,2 3 1
1,2 7 2
1,2,6 x x
1,2,6 x x
1,2,6 x x
1,2,6 x x
1,2,6 x x
1,2,6 x
1,2,6,7 1 1
1,2,6,7 2 6
1,2,6,7 1 5
1,2,7 3 9
1,2,7 1 6
1,2,7 2 12
1,2 1 5
1,2 3 4
1,2 12 4
1,2 7 2
1,2 15 1
1,2,7,8,9,10 6 23
1,2,7,1,1,10 7 20
1,2,7,8,9,10 4 2 21
1,2,7,8,9,10 5 2 18
1,2,7,8,9,10 12 1 1
1,2,7,8,9,10 12 3
7,8,9,10 10 1 1
7,8,9,10 7 2 1
7,8,9,10 3 3 3
7,8,9,10 4 3 1
7,1,9,10 4 4 1
7,8 9,10 1 1 1
9,1f 7
7
1 9 1
2 6 3
2 4 3
1 3 3
3 5 4
3 6 4
3 5 4
5 5 4
4 5 4
6 4 15 4 14
5 4 96 5 5
7 5
6 3 5
5 5 4
5 3 4
5 5 4
2 3 11
2 3 12
2 3 3
230
Si
as
Si203
6570
6046
41
57
43$5
4721
2026
x
x
x
715
12
2328
3548
54
6067
63
17
17
16
15
2
53
3
82
3
2
15
1319
5
54
6
7
7
67
7
1187
7
16
7
11
8
7
6
7
( 1 et )
S Cl
as as
S03 Cl-
1 xx
1
1
1
1 9
1
1
1
1 1
2 3
1 2
8 3
xx xx
xx xx
xx xx
xx xx
xx xx
xx xx
xx xx
2 2
3 1
1
1 1
1
1
21
1
2 1
2
2 1
2 1
3
5
5
4
4
3
3
3
3
3
5
4
3
3
33
3
6
6
5
3
3
4
3
K
asK20
xx
xx
xx
xx
2
1
Ca
asCa0
4
5
3
1
1
9
4
9
11
14
x
x
x
2927
27
2925
30
66
3
6
2
19
1117
18
292734
37
41
41
41
54414840384249
34
32
33
3233
2519
252129
20303230
21
24
4333
33
3333
Cr
as
Cr203
xx
2
2
1
SOMS8841228811.
Fe Co Zs
as as as
Fe203 Coo ZnO
1 25
2 20
2 30
5 49
9 47
3 27
3 28
1 323 17
3 36
3 35
2 31
x
x
x
3 16
4 10
2 12
16 5
4 177 14
2 38
2 31
3 18
xx 21
1 18
6 3
5 3
6 1 2
6 3
1 91 1 8
1 8
1 4
1 1
1 2
2
1 1
1
1 1
1 1 1
2 1 1
2 1 1
2 1 1
2 1 1
2 1 1
2 1 3
2 1 3
5 1 3
5 1 2
4 3 3
2 1 3
2 1 4
3 1 3
2 1 22 1 3
2 1 3
7 1 1
6 1 1
2 1
3
1
42
1 1
1
1
6 1
1 1 1
Pas
P205
1
1
1111
21
x
x
x
x
3931
38
1
xx
xx
xx
xx
26
29
23
264340
42
44
37
45
45
36
27
2824
39
34
31
40
4040
40
39
3838
34
39
383841
39
40
3938
34
33
3740
Ni
as
Ni0
1
Ti 11
as 1:
TiO2 11
1111.1
:I111111..
11....
..
..
11
11
I'
1i
1I....1111... .
....
1!
11
2 II
1111111/11.,........11
..
..
..
..
111111....
::110 1
..
..
11..
11
11
It
I.....,...
1:
11
1111
1111....
1:1111............
1111
If11
:1
11
I:
11
:1
111111
11
II..
11
II
1) 1: 18-22 ppm chromate 6: 2- 4 ppe HEIP
2: 3- 5 ppm zinc 7: 2- 4 ppm polyacrylate
3: 200 ppm suspended solids 8: 2- 4 ppm AMP
4: 36-44 ppm chromate 9: 2- 4 ppm polyphosphate
5: 6-10 pps zinc 10: 5- 7 ppm orthophosphate
11: 2- 3 ppm orthopyphosphahosphate
12: 4- 5 ppm pod te
x: Present detected, assent mot determined
xx: Present im small mood l (.51 1

231
APPENDIX I
NONLINEAR REGRESSION
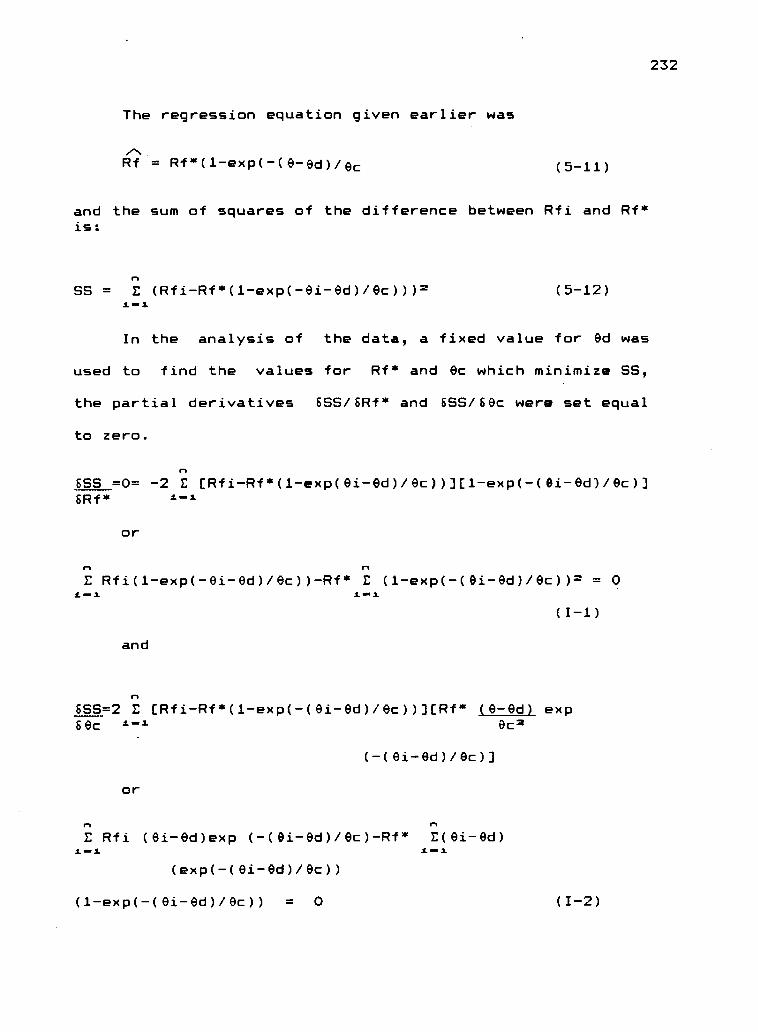
The regression equation given earlier was
Rf = R1*(1-exp(-(0-0d)/61c (5-11)
and the sum of squares of the difference between Rfi and Rf*is:
SS = E (Rfi-Rf*(1-exp(-0i-8d)/0c))) (5-12)
In the analysis of the data, a fixed value for Od was
used to find the values for Rf* and 8c which minimize SS,
the partial derivatives SSS/SRf* and SSS/Sec were set equal
to zero.
SSS =0= -2 E [Rfi-Rf*(1-exp(8i-Od)/8c))][1-exp(-(0i-8d)/fic)]SRf*
or
E Rfi(1-exp(-8i-8d)/8c))-Rf* E (1-exp(-(8i-8d)/0c))== = 0
and
SSS=2 E [Rfi-Rf*(1-exp(-(0i-Od)/8c)))(Rf* (0-0d) expSec oac2
(-(8i-Od)/Oc)]
or
E Rfi (8i-8d)exp (-(81-09d)/8c)-Rf* E(Oi-8d)1.1
(exp(-(0i-8d)/8c))
(1-exp(-(9i-8d)/03c)) = 0 ( 1-2)
232
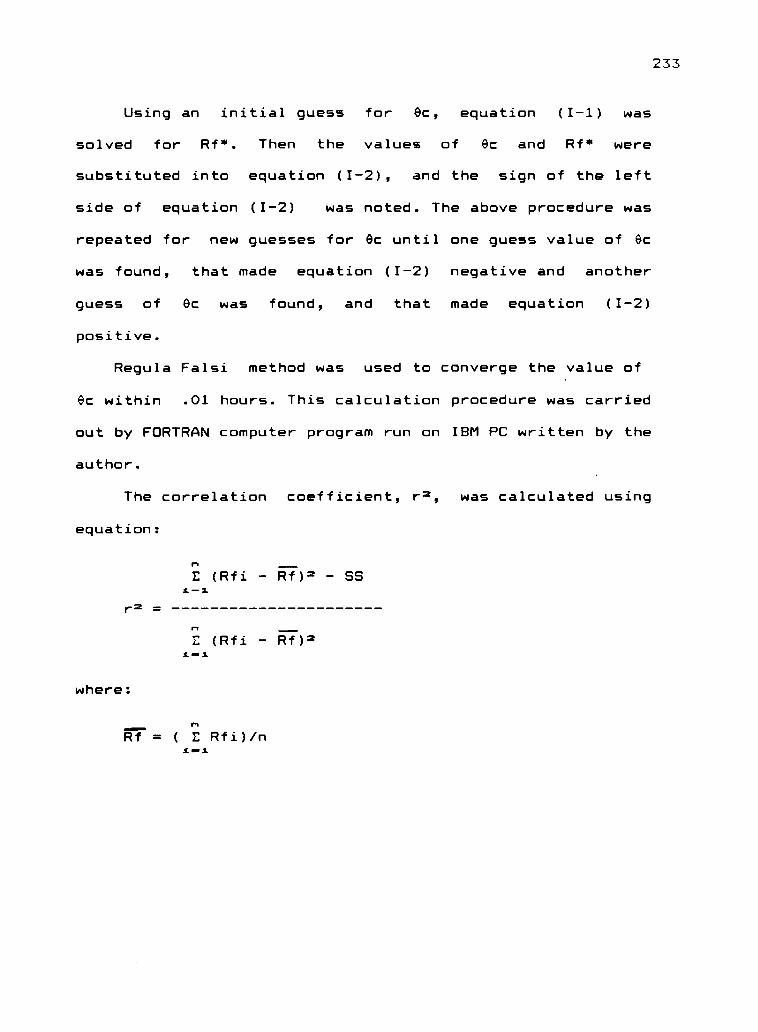
233
Using an initial guess for 8c, equation (I-1) was
solved for Rf*. Then the values of ec and Rf* were
substituted into equation (I-2), and the sign of the left
side of equation (I-2) was noted. The above procedure was
repeated for new guesses for ec until one guess value of ec
was found, that made equation (I-2) negative and another
guess of ec was found, and that made equation (I-2)
positive.
Regula Falsi method was used to converge the value of
ec within .01 hours. This calculation procedure was carried
out by FORTRAN computer program run on IBM PC written by the
author.
The correlation coefficient, r=, was calculated using
equation:
r=
where:
rs
E (Rfi Rf = - SS1-1
f l -E (Rfi - Rf )=L1
Rf = ( E Rfi) /n
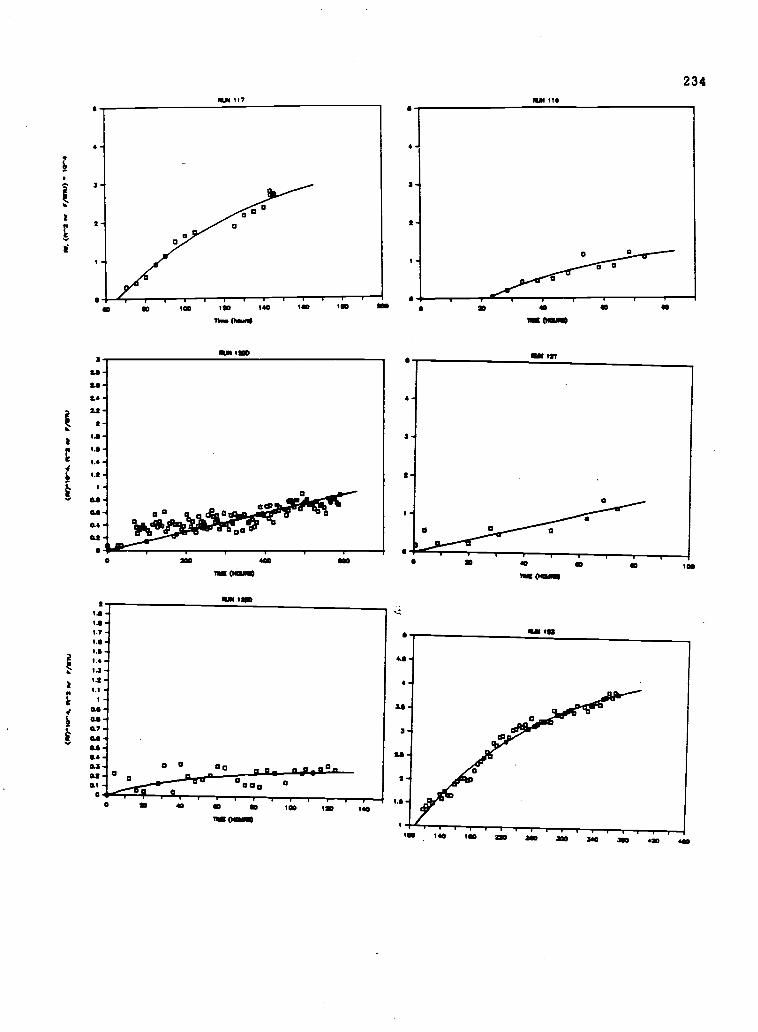
aaa
-
(raa/aa gas) le
" 3 3 Z 2 "
3 32 °
0,11!.,*:tRil^
33 3 3 3 ;
rue/..4
cal',..o6.(//)
I
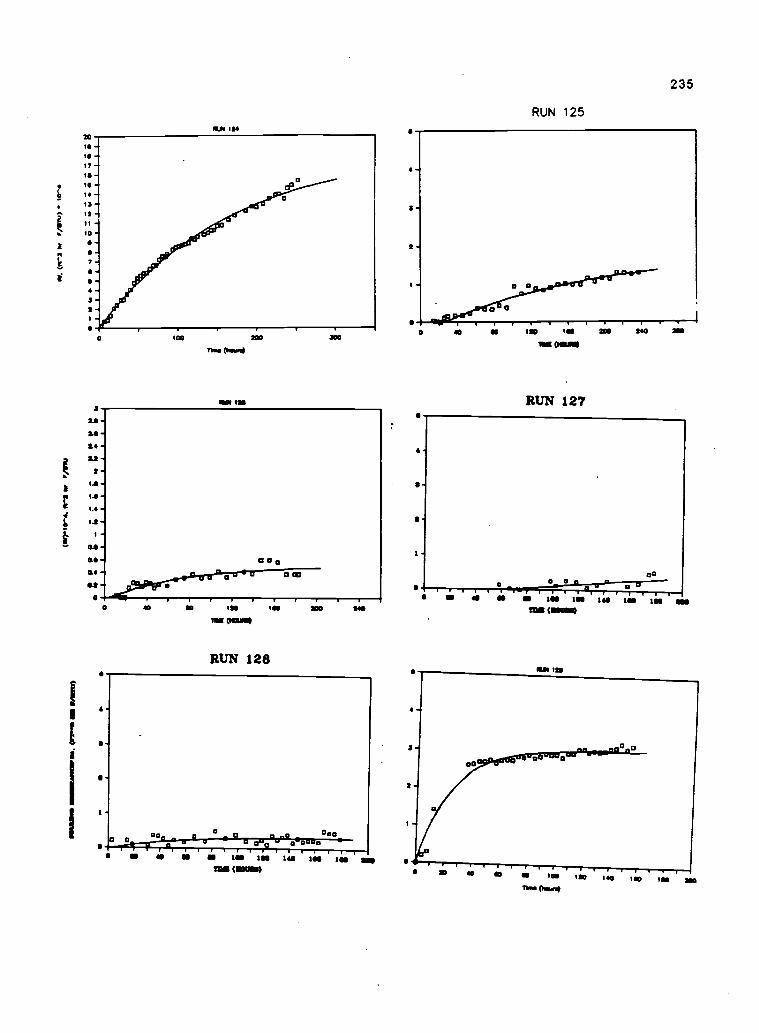
12420111 -
1.-17-1 4
10-
13-1211
10
11
7
11
32
0
2.4
100 200
Two (11
RUN ON
300
CI 13
0 OD
O 40 110 l 1110
11111 DODOS
RUN 128
235
RUN 125
RUN 127
4
a-
1
oo0 0
1110 40 110 11111 1E1 1441 100 100 SrSOO 240 1311D (D01.
O 0000 0 0o Cia 0 0YYYYYY 1...1111, TYS, a 11. NO iM 1611 1110 /SS On
LDS (18011110)
ALIN 'a
SD 40 10 100 120 140 100 1110 100now Dew*
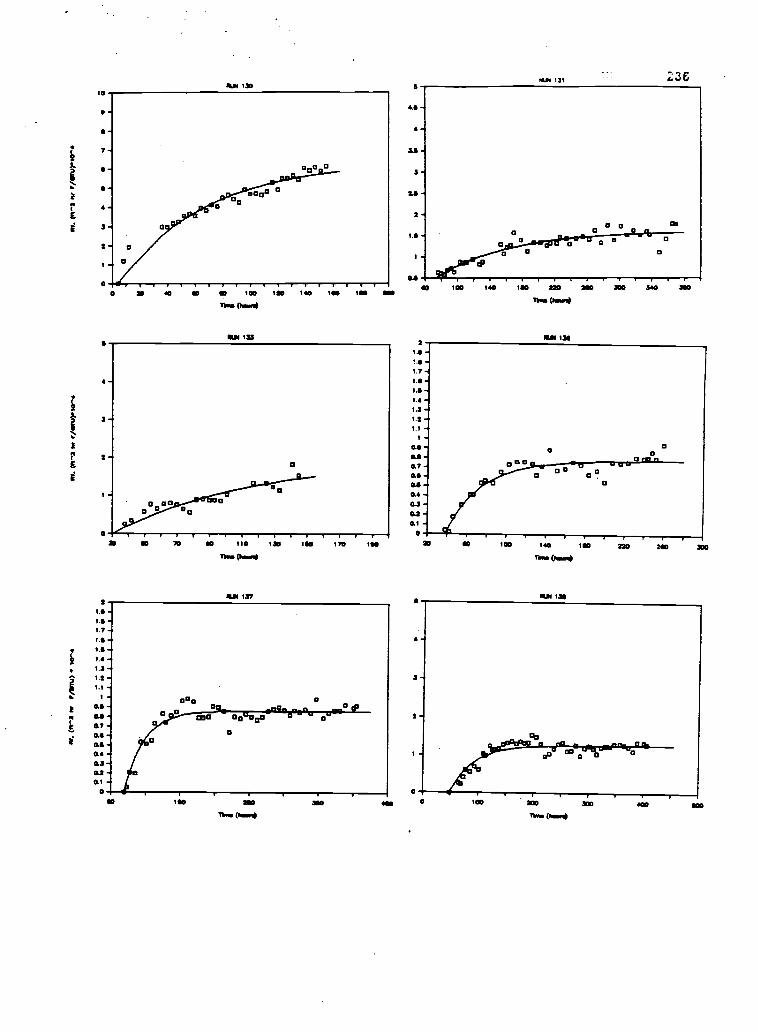
a
I--8
a
0aa
0
0
3"
3"
3
8
v-ot4ruo/a ns e..w su
0
0
0:a0a
0
I.
FI
Tw
ly t. 11
1":3'd-:371;3;° .8
1,0'4nm/a
r-u)
5
(rualae.u) 'at
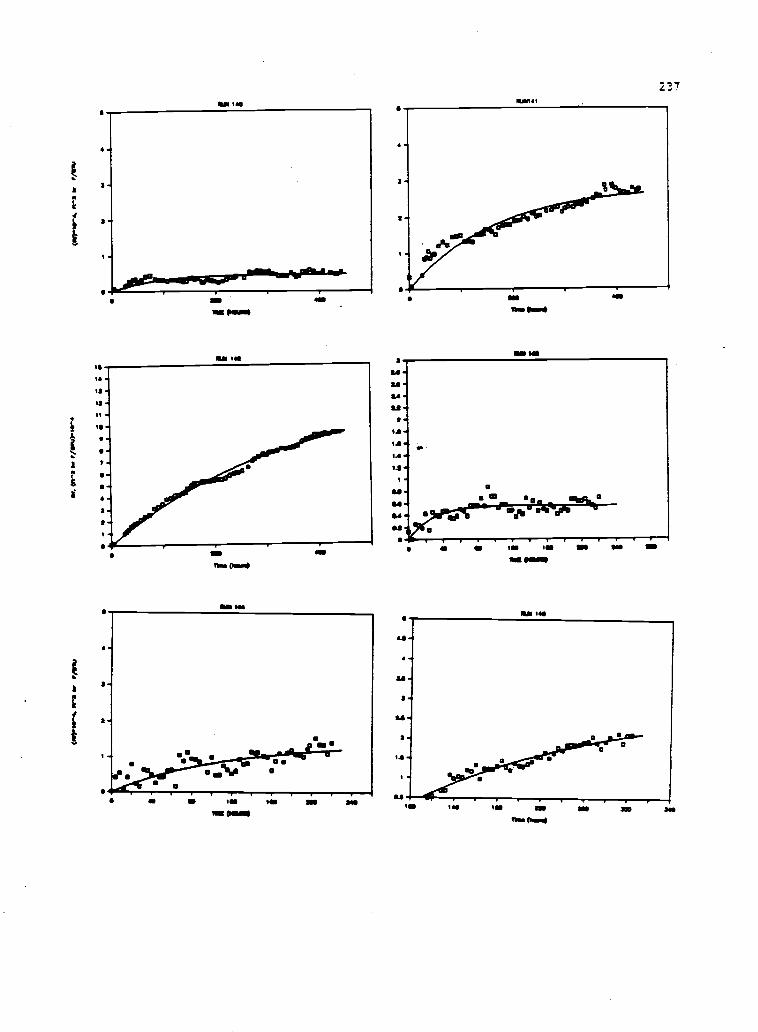
ry
3
VI
gasia a (al V-esU
U)
g-gu.(fue/a w g-u)
nu)/a.(r)
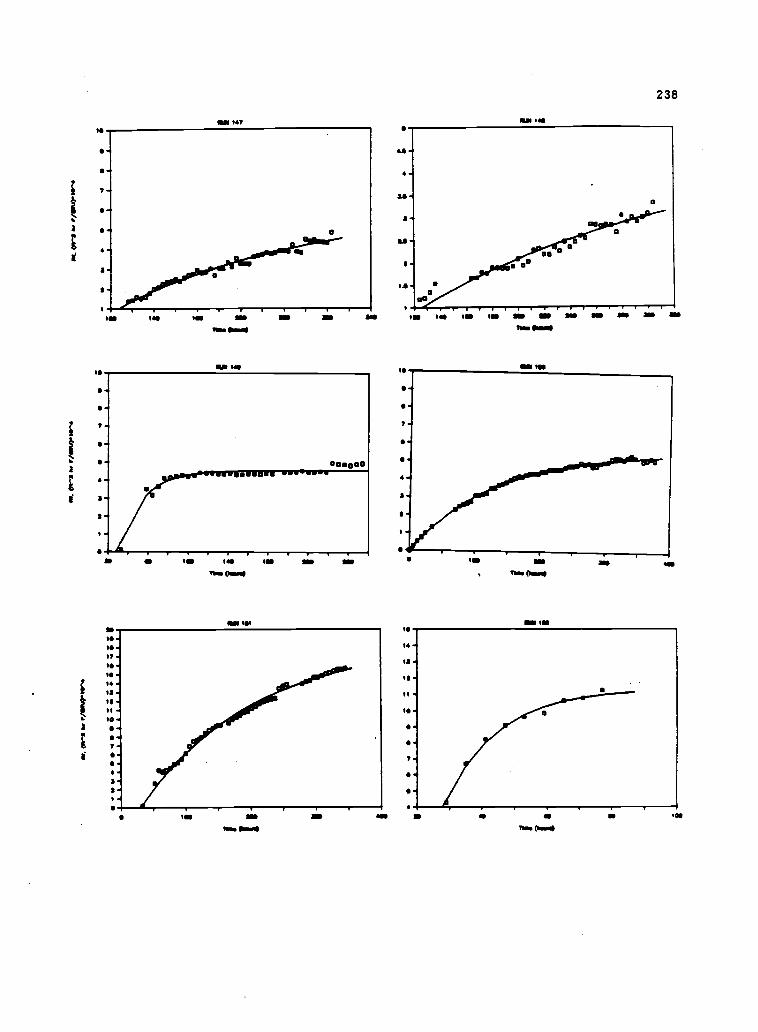
13
11II
7
3I-.
I. lablam an=
3
ale1017
1
lab 1 1alms am=
at 151
11
ext 147
O
,doodA-
1
s:
3
2
I
rI
111
Ilma posy
238
sa 10
la
lab 1 SO 111 11111 MO a= non Ow*
MI la
alb
7
1/*°1"WibdWIr:1
lbw awe
114
13
11
1111
11
7
a
at
Tao (kw*1
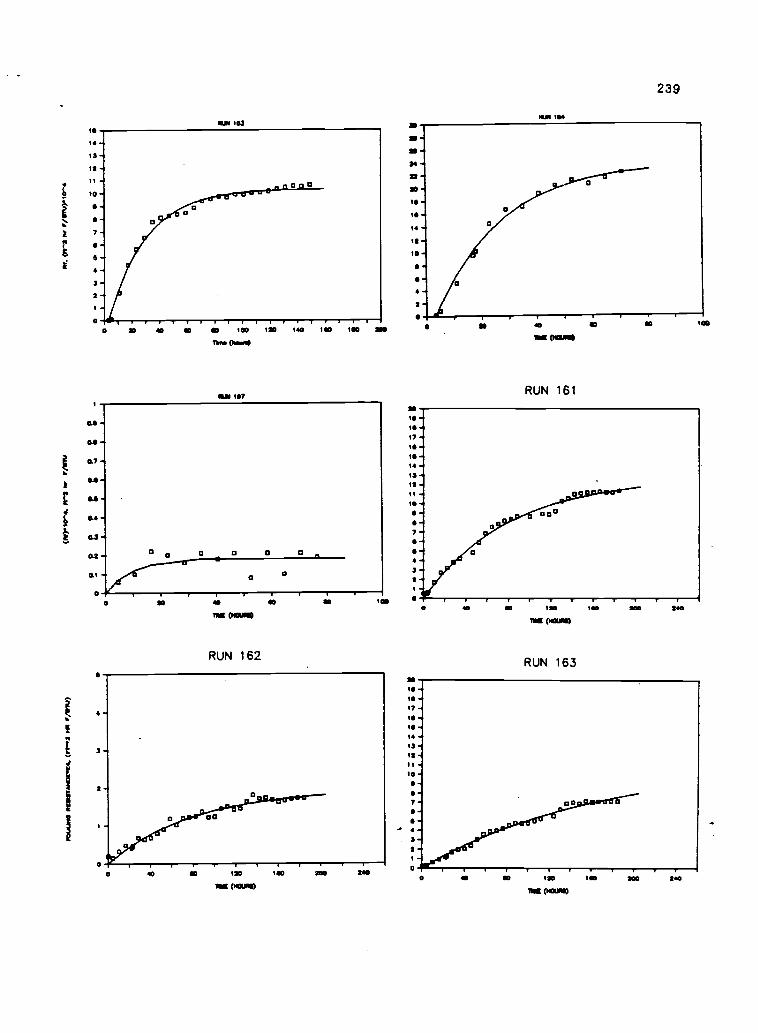
I
-I
4 11 II A N A
2
3 I .1 r. T i.- o0
1....otArusia .1 11-44 'am
3 0
3 3 ; 3 3 ; ; 3 ; °
nu / a Ai ru v...ot.(a0
T1 ilI 0
- II
0
(num/ a um e....u) 13XPII111311 corona'
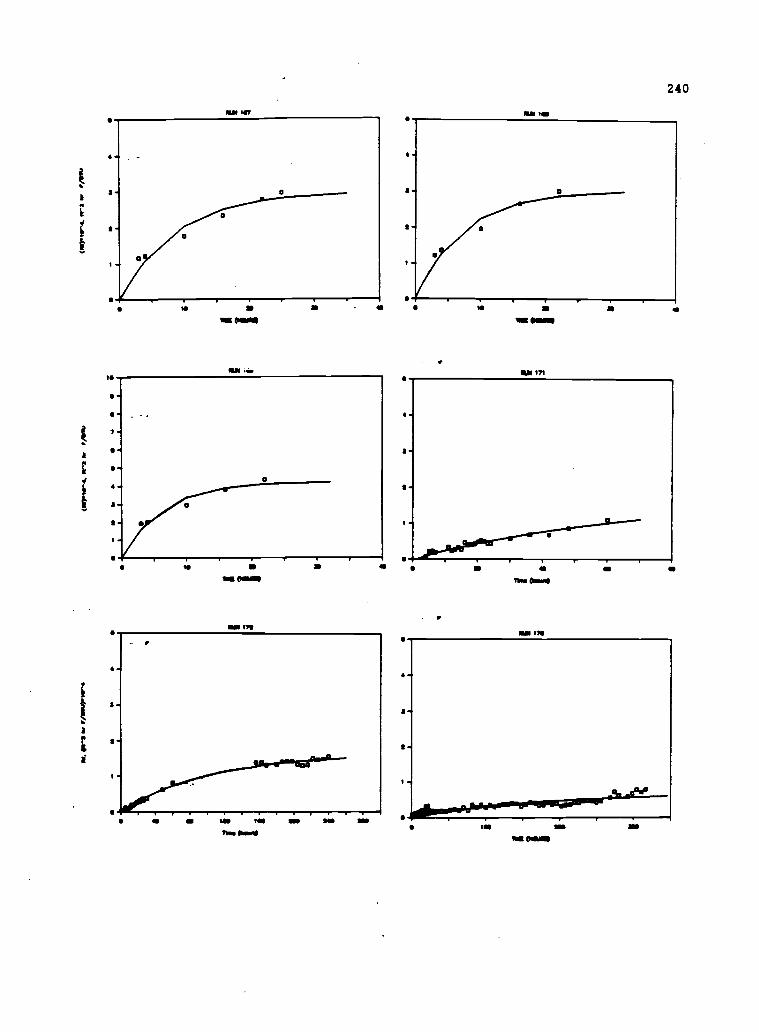
Sii
ese/4 elC
.1,444,11)
I!
nae/ae..Jr
1,41Ale)
-aa-s
I1
b
ri
...ocAnaiehl
B.A
. le
Ii
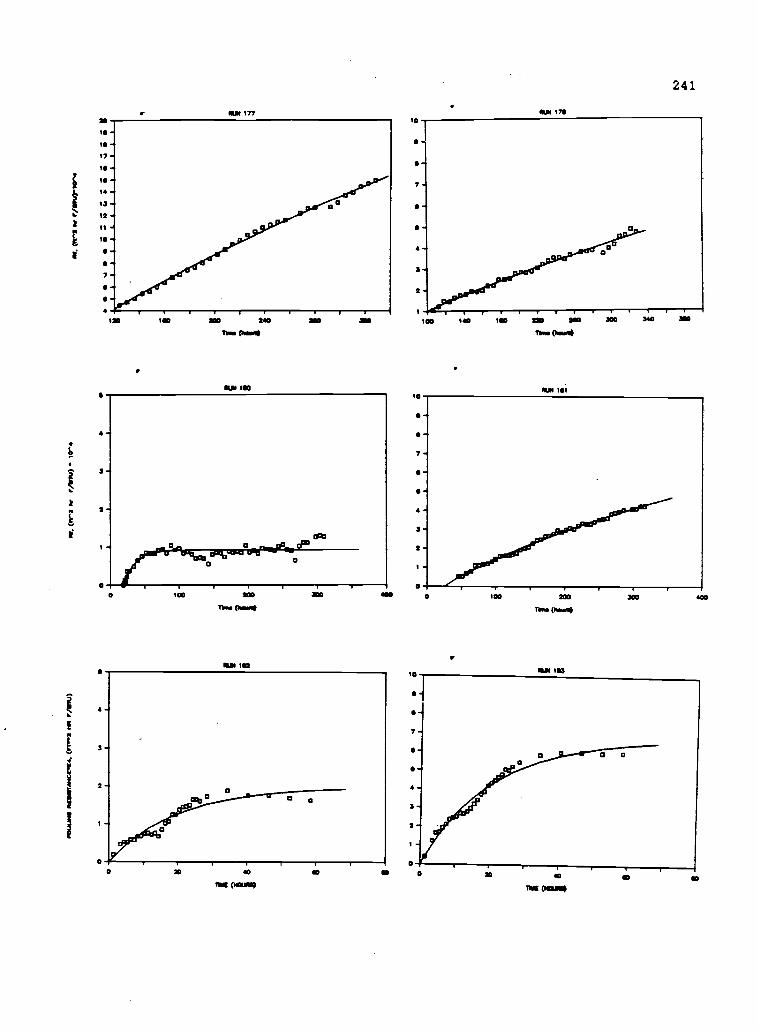
O
O
-aa
a
eesAnae/a w
z..es)
14I
*.et . (nue/a " c.-r) es
O
O
O
00
Outo/a w
10.10 V71.420.11113e w
inner
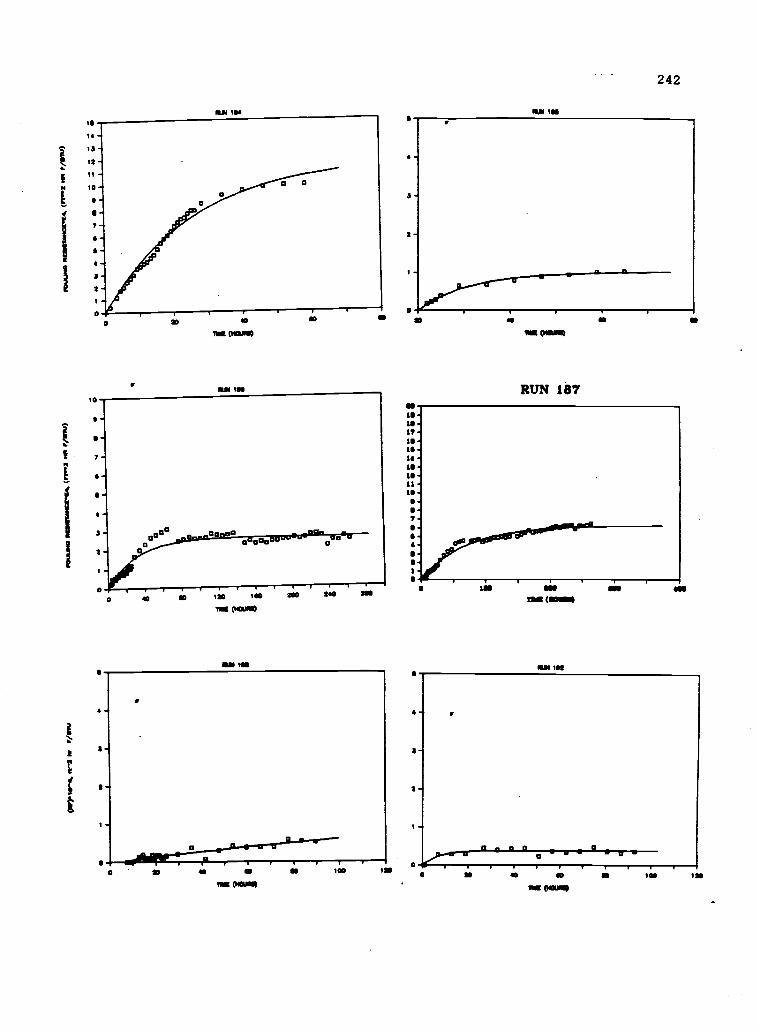
2
0001/0/4 101 g.0.0 N
e7o300101830 1011100d
o
IpIp
8
-I-1
a8
N-9I
1w
I0 -8
0
(floo/O w
mooLa) N
ak.020011100 09010011
r
O-s
0I
-Ia$
0
a
eu0 /4 or woo sooto(m
)
0 I
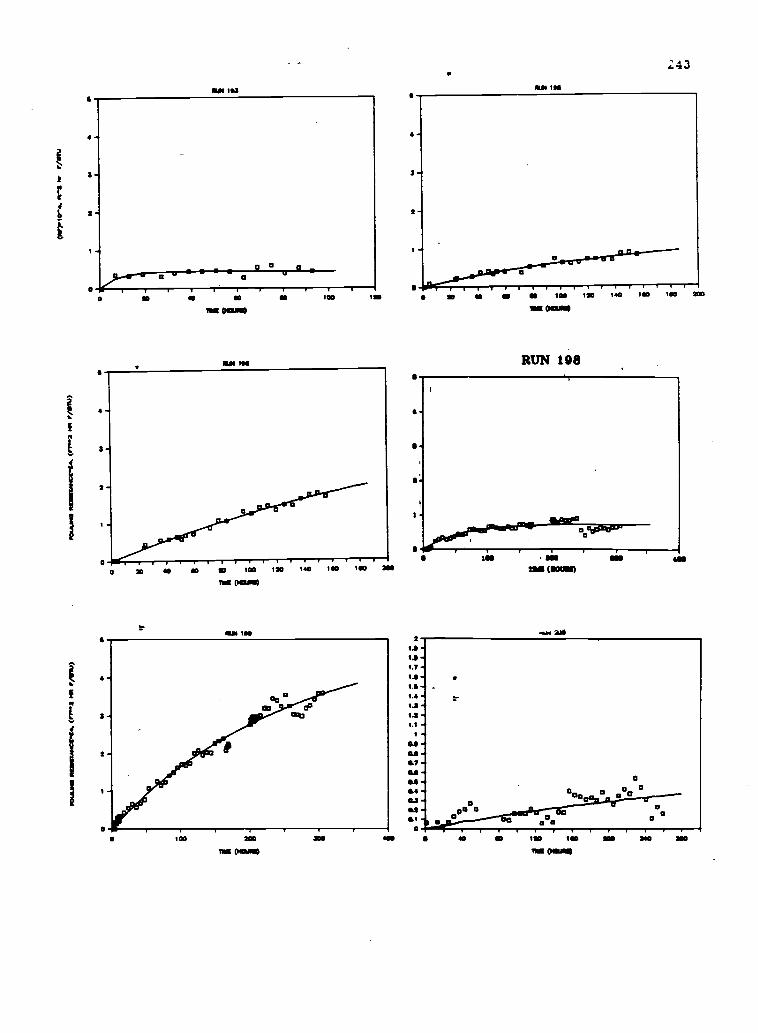
1
2
P
T
a
aa
a
nue/a ae was ....andana
^
-A
O
eD
vvl
A'
(ALIVA '141.1:1110.18111311 Dunned
O
L
Iit - 3 3 3 3 3 ;
iA
(nembe w tv.aa) wevaeuevessasses asennot
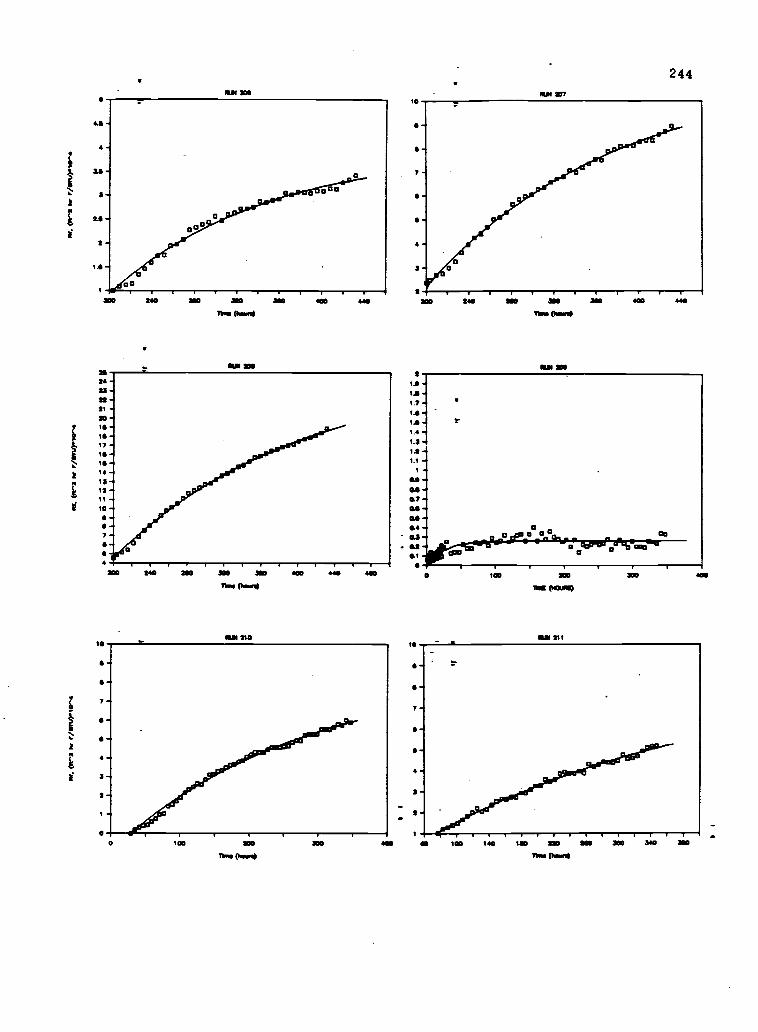
v_lI
....e..(nae/A
.. ic.-11 'am.....et.(rual
&A
d 'RI
I
F
1
I0
IT
s...ot.(nas/4 MI r..4 "m
a
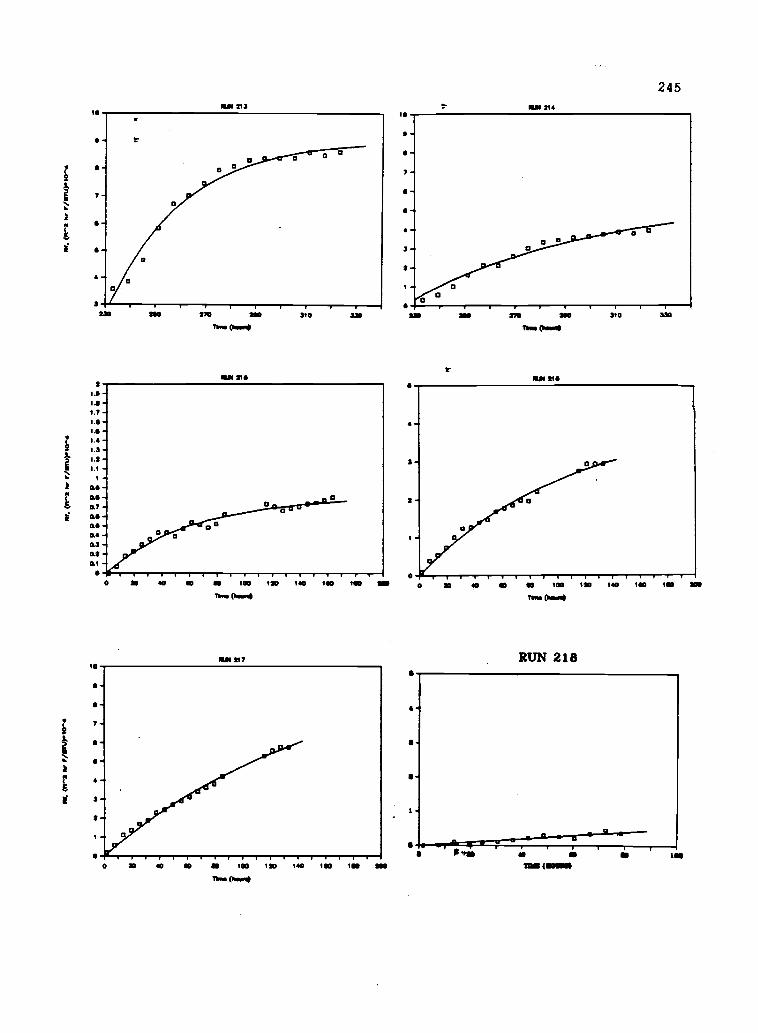
Cs 1
IriF
1Its
....rst(ru lat..44
A
At
_a_a
_s
ddddddddei.
tr...orts(tus/AA
seat)
'IN
0
S
A.torts(tua/4
N 11.40
'me
O
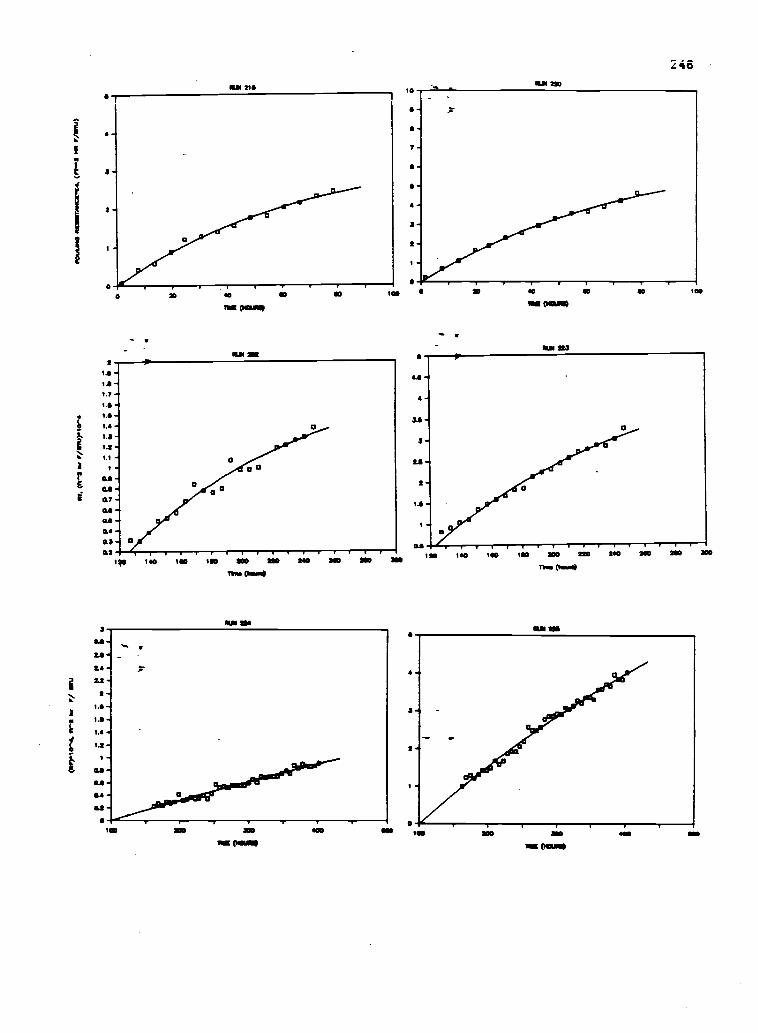
I
awrs
e-4.
Ira
.IV
.C:C
C-;
:;;.C
:C It
0M 1
IVI I
I 1I
M.
an-2
ger
r/O
niru
p-4.
CC
:::C
:--6
a
a
Foun
o go
asno
scav
os.
AS
IU)
O-
8-e
8
C
C V
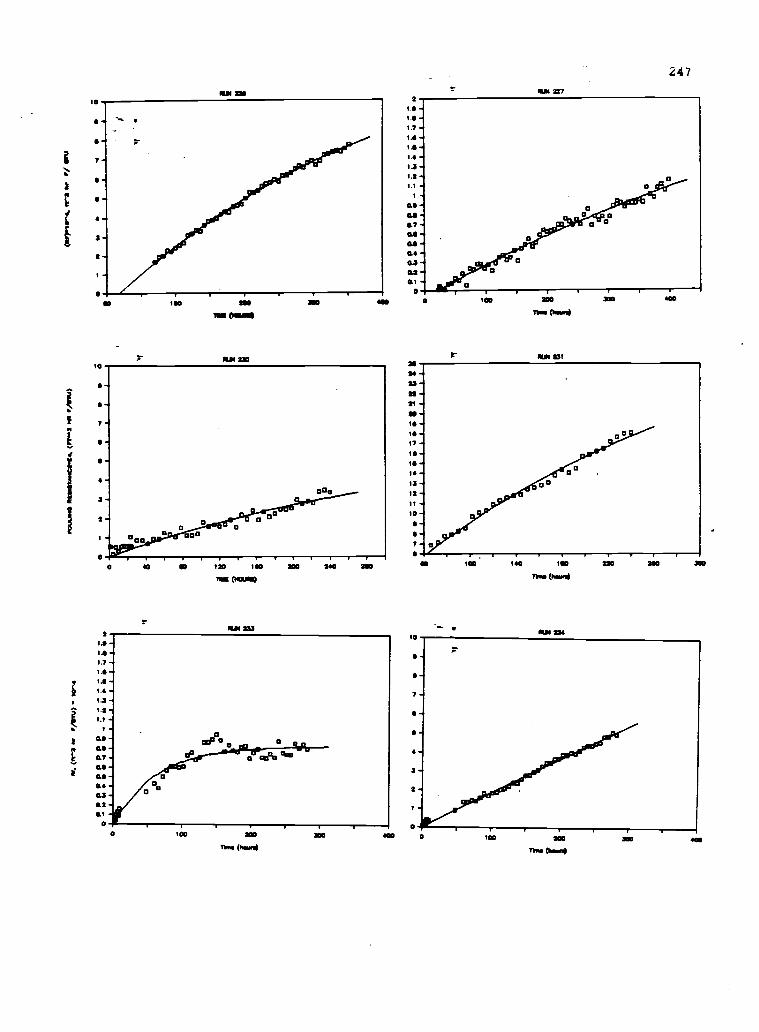
_IaP
.1,11etg,41,1!--aliv.q, "eldiodoe
18
aanW
u .1,01404
.0
ItI
la.
00
aa
a
0T
iI
8328;8
a
(rv*faV
Ikaratfristorini ilunnao
0
I
la,
0
II
-1-8
...04(N
1/4e40
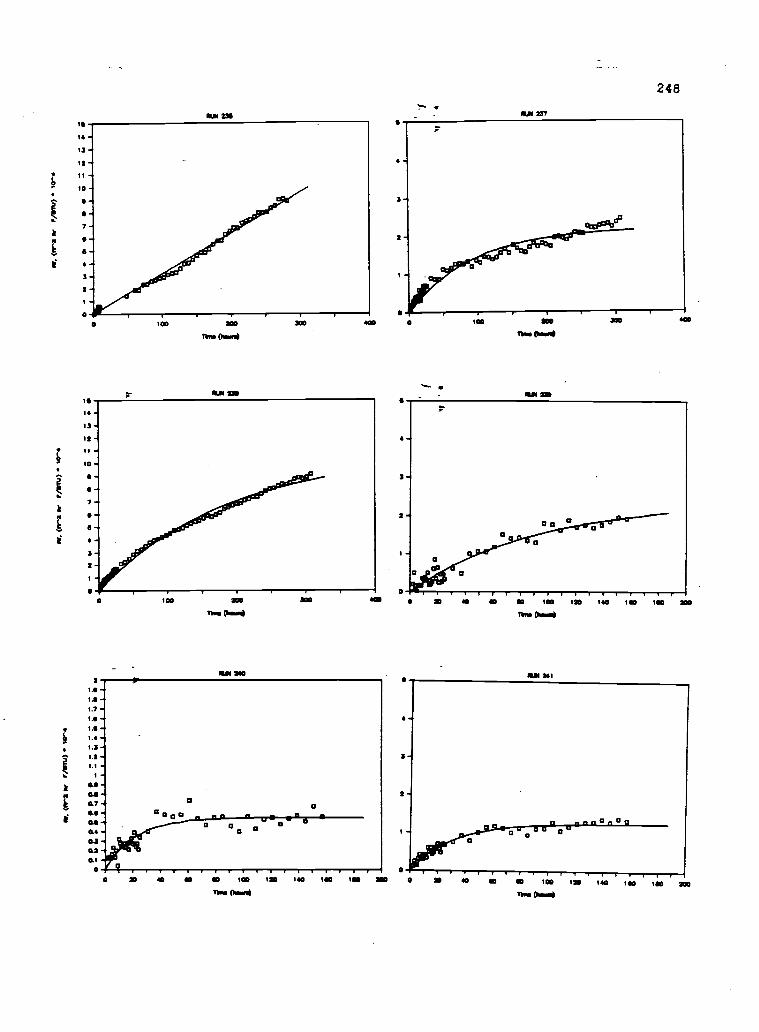
O
V I
(fril
kr
PA
M)
1411
"4
0 !C
C:::
1:::-
.L11
11A
S
a O O OO
O
L I s
e
yr. (
IraM
/Tr)
10
At.
(fr2
1U
r,*
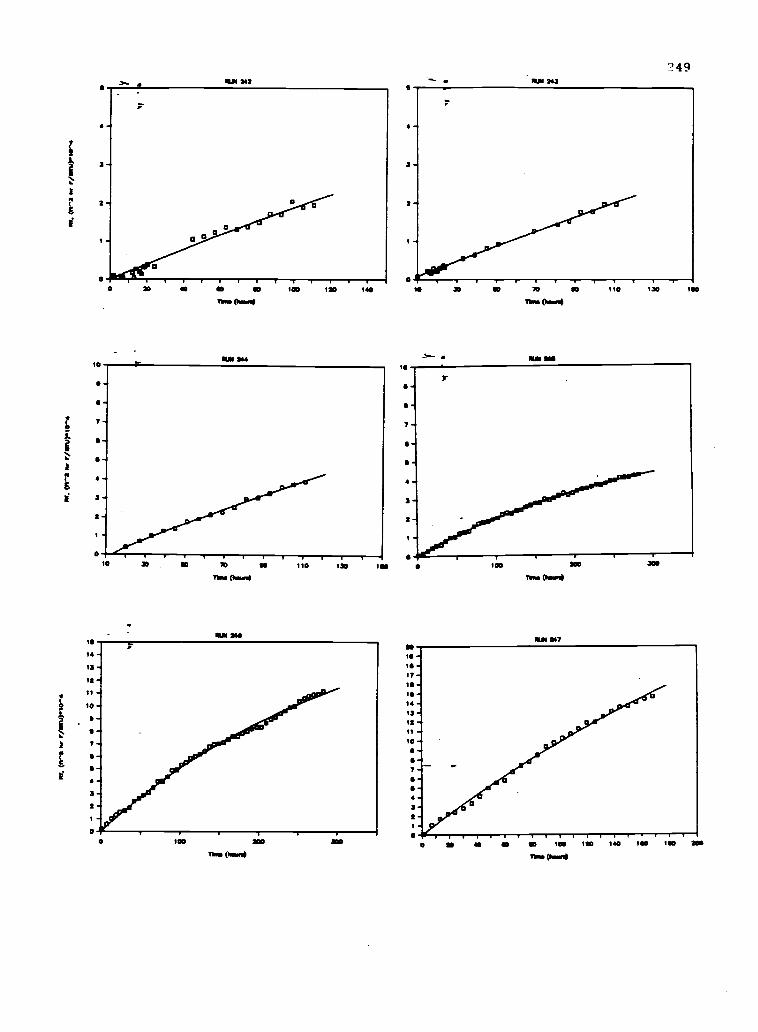
8
...et.(flo/a wr.-40
aas
IA
-I8
0
s.....ot.(rue/a wr..4s)
e
"'sr
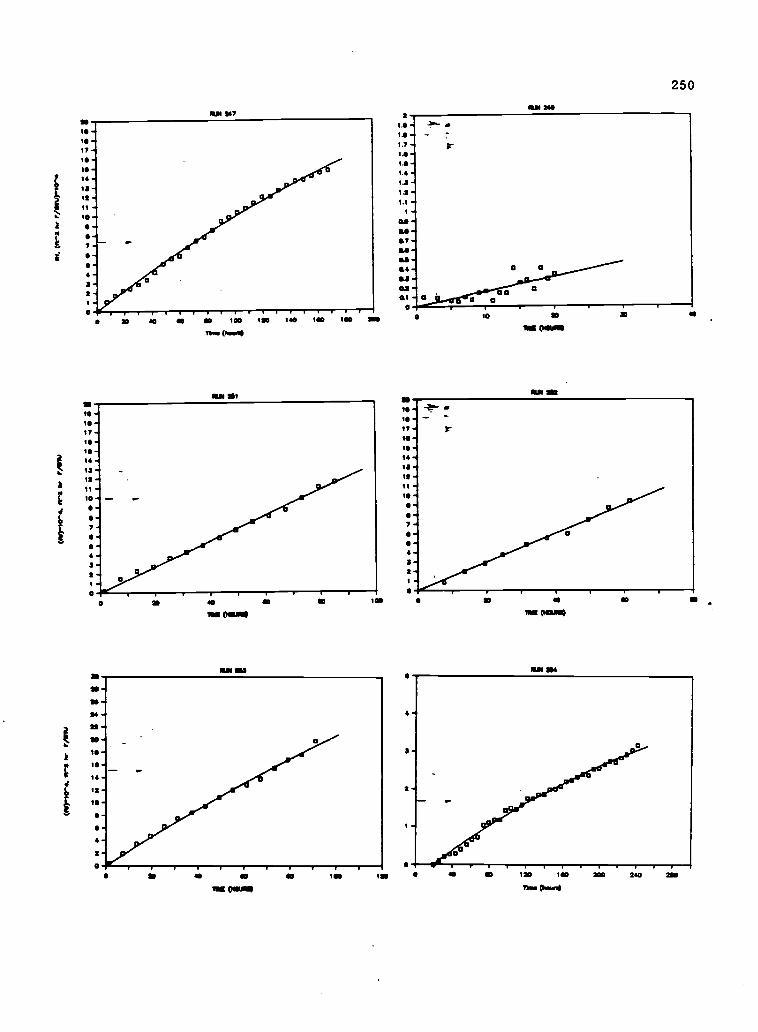
(140
10^4
. W.2
kr
PA
W(1
111)
.111
".4.
Ir.2
11r
IIVIV
RO
V
I
C
(w"3
t. //
)141
.
V
I I
C
.ece
ttstr
e--.
IP is
.41
ILL
0 I
o0
C
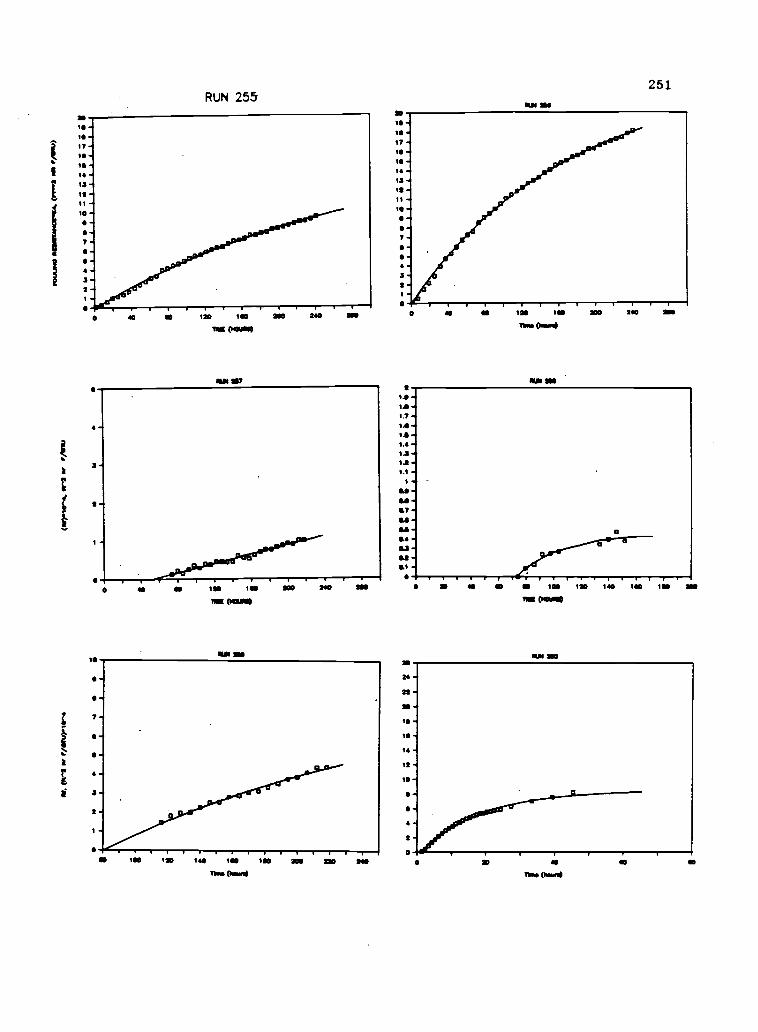
7010 -4111.17-I0
-1 -
12-_11
100-57
--
4
21
00
251RUN 255
40 110 120 100 200 240
1 (IOC
LIN 157
120 100
71554010m0
ROI !NI
2011 240 f.
O222 -20-1 -,
-It -10
a-a-
-
a-0
ID 40 00 SO 100 120 140 140 II* fag
DIE (10015
NUN 210
. . I .
20 40 40
lb.. Ourr40
40
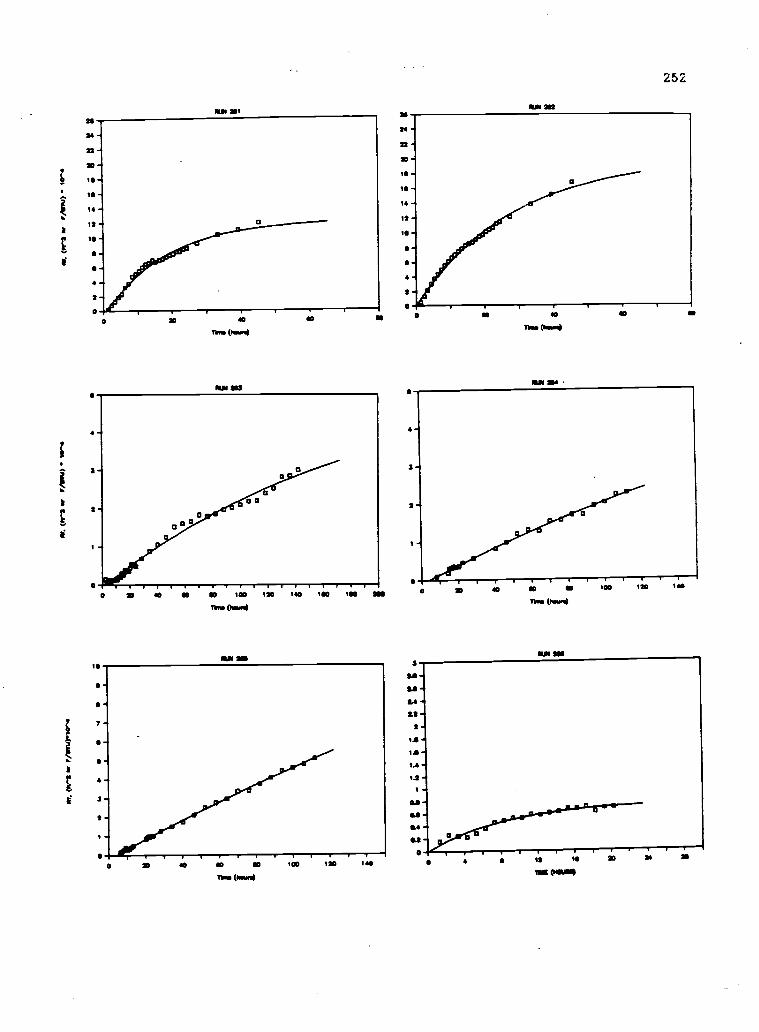
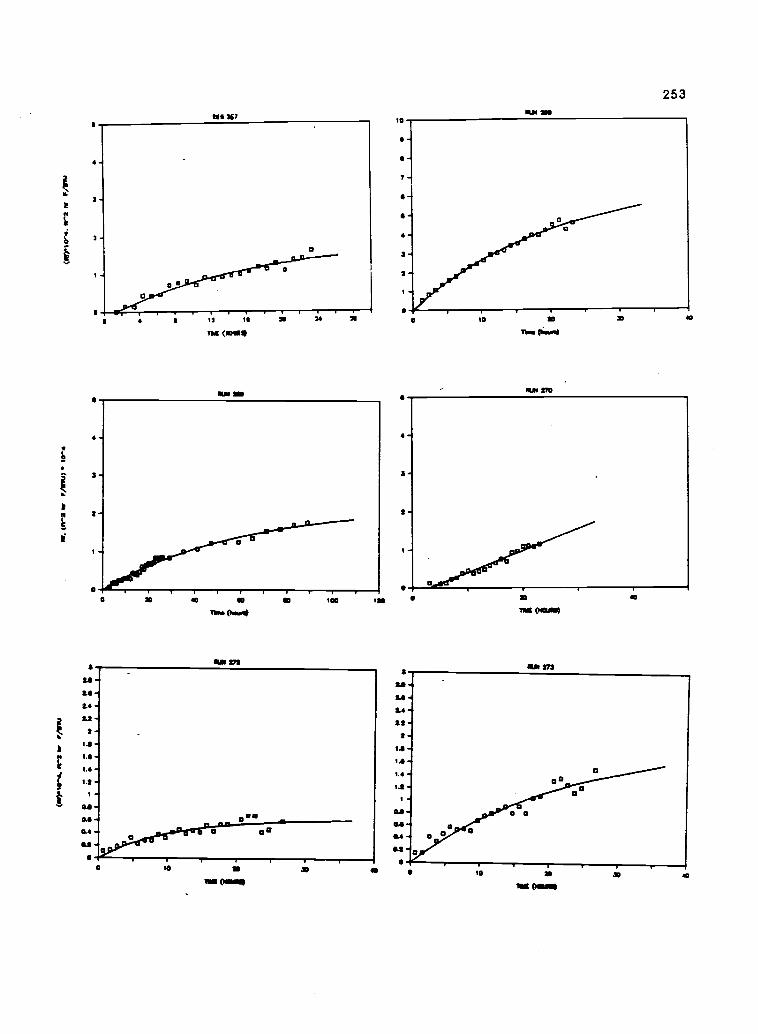
Nil/ 4 141
of . (nW " e..u) 'so
" 3 3 3
a0
ous/A r R
ao 1p.t.011)
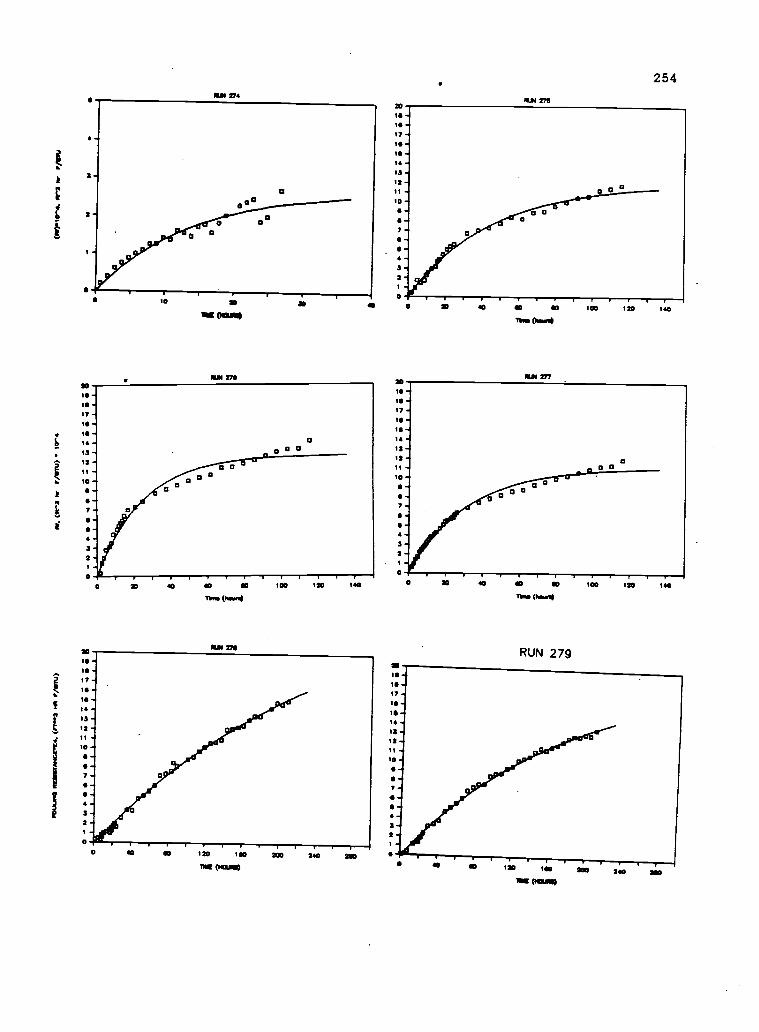
0
NM 274
10
0 aa
a
10
MIK (MM.
SUN 770
30 40
00 0
a
20111
IS17
.111
14
13
12 -11
10
7
32
0
30 40 SO 10 100 120 140
Tim Sewn.
IOM 270
r If IF .W TIP IIO 40 10 120 1110 200 240 WO
100 (1411171
254
O 0 40 SO 40
Thse Omni
20IS .ISIfIS .
1413
12 -II -10 -
.7
3 -
1
IIS17
IS1131211
10
7
3a
MUM 277
100 120 140
O 10 40 0 110 100 120 140
711Is Ossol.
RUN 279
120 100
71111 010110
240
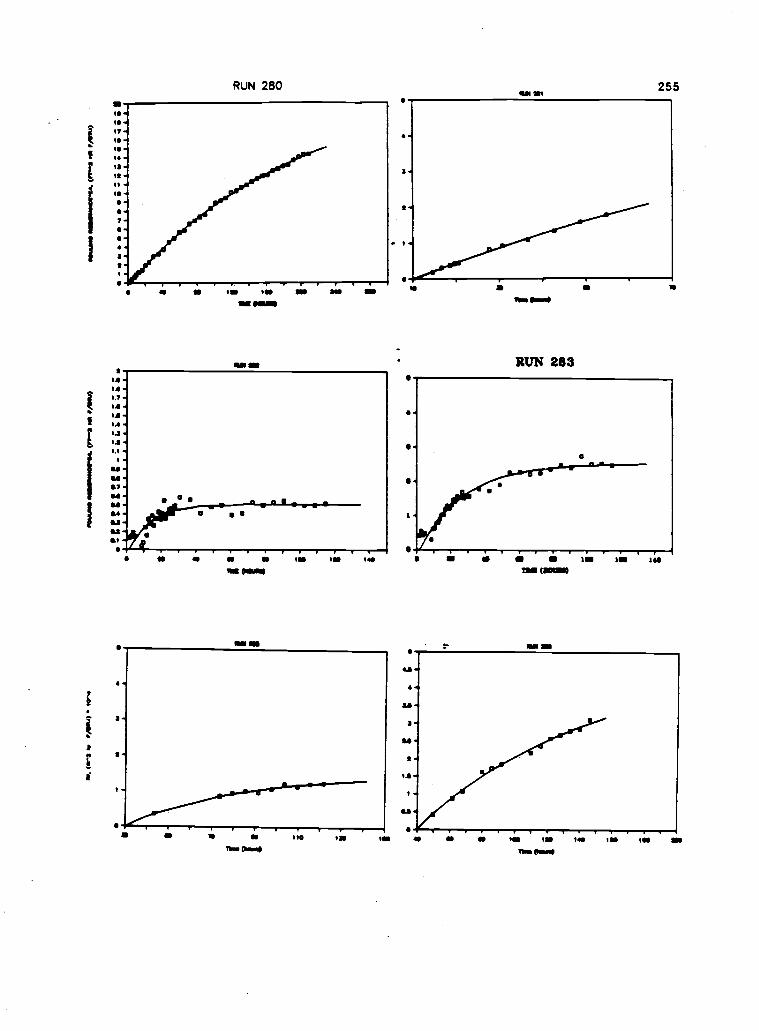
t
12:
RUN 280
ie Ile lel11111 Pent
SID
1 1 1(110
lo toenwa
GAM 71255
a151 01
RUN 283
a 11. lie110 MOM
IUD 1Tim (1
141 IS 1
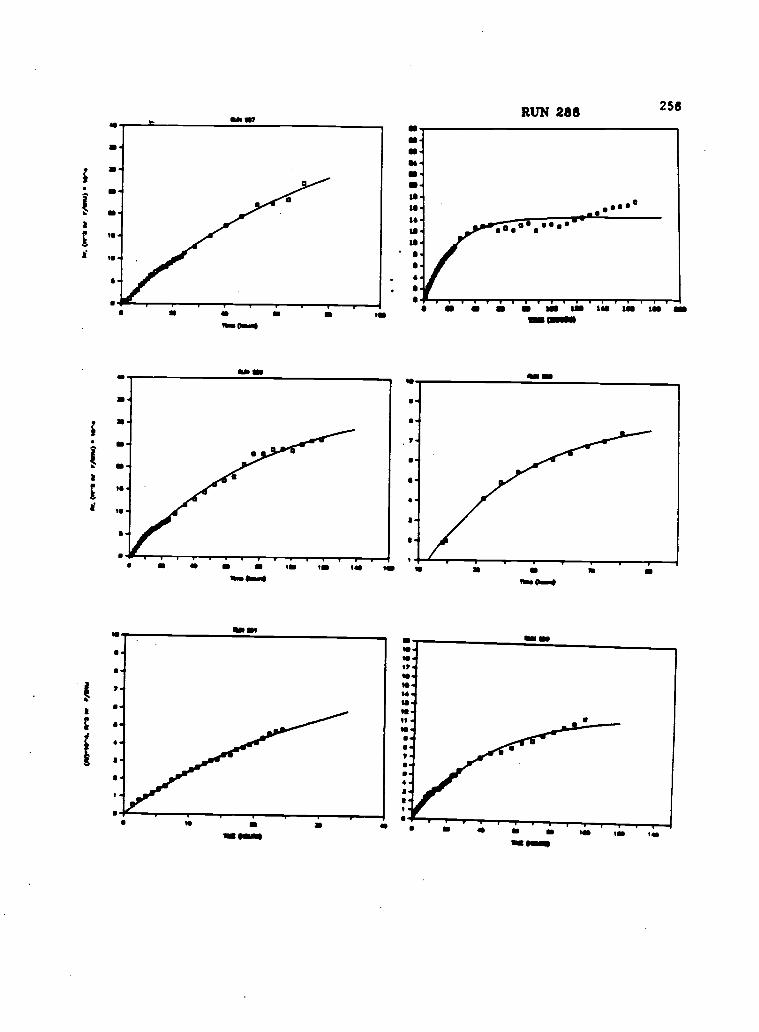
11
Sll WS lIlS 1411 IN in SOD
COI 01111111111
111111 Sill
a
!
i
I
a NMI la
RUN 288 256
I-S..
. a
ai ID7'7SD
is
II *
.
a a a a laa. 01...
Ma al
'a la 1
a11111)1111110
ID
a a a SD
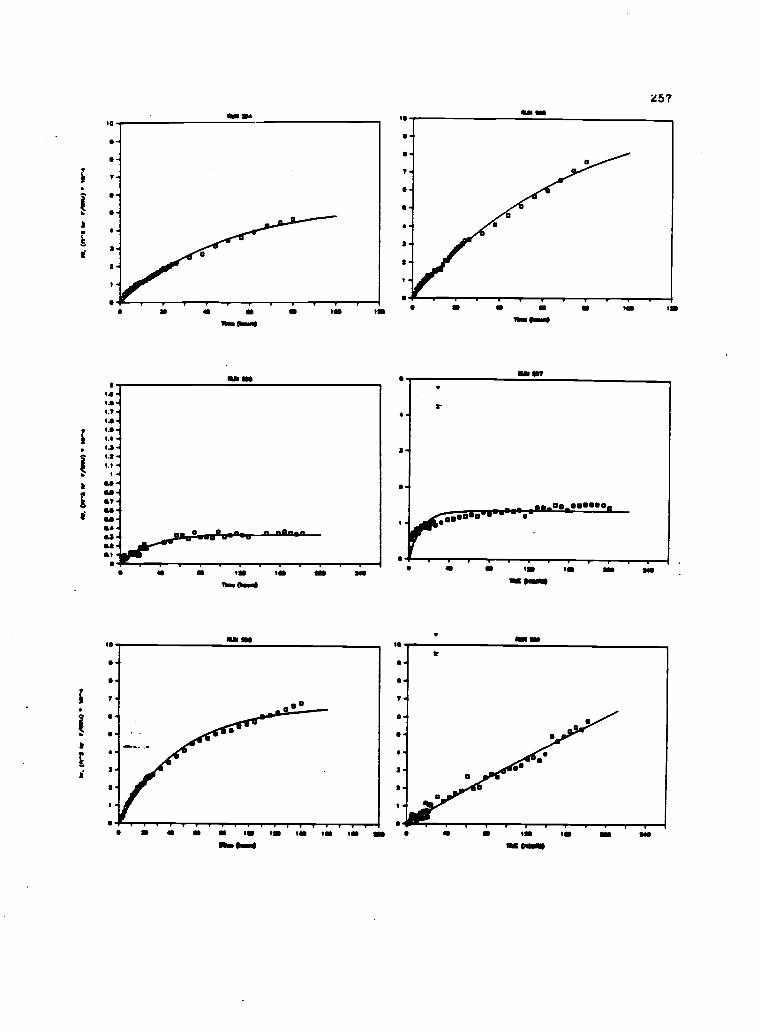
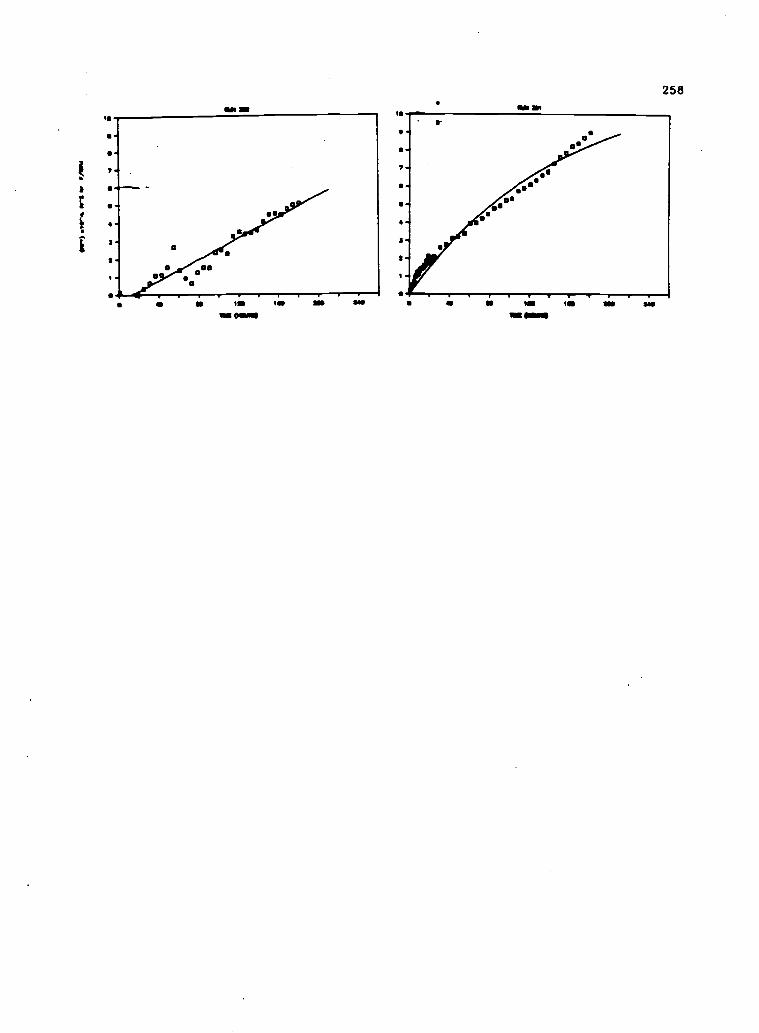
I.
X
3
1
(11110111
Ile
258
IS ISmit Imo
259
APPENDIX J
COOLING TOWER WATER QUALITY
Total hardness : ppm CaCO3
Calcium hardness : ppm CaCO
Sulfate : ppm SO4
Chromium : ppm Cr04
Zinc : ppm Zn
HEDP : ppm PO4
Silica : ppm Si02
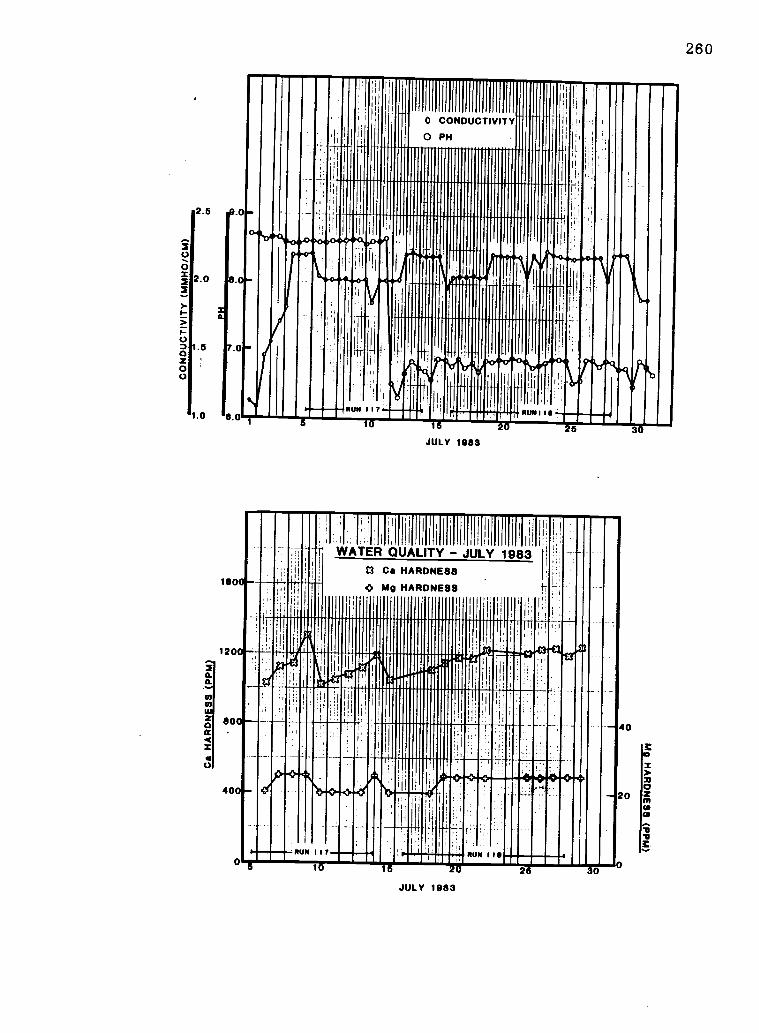
.o
7.0
4.0
0
2
0 0 z 0
2.5
2.0
0.
1.5
1.0
I 111 10
11111111111111i
I
011111111111111111111 11111111111111111111 1111111111111
.......o11.41111111111111111 r11.11111
10011111rill
1111111111111111111111 IIII
1.1 .=mill 111
26
180
120
$O
JULY 1113
JULY 1113
40
20
0
260
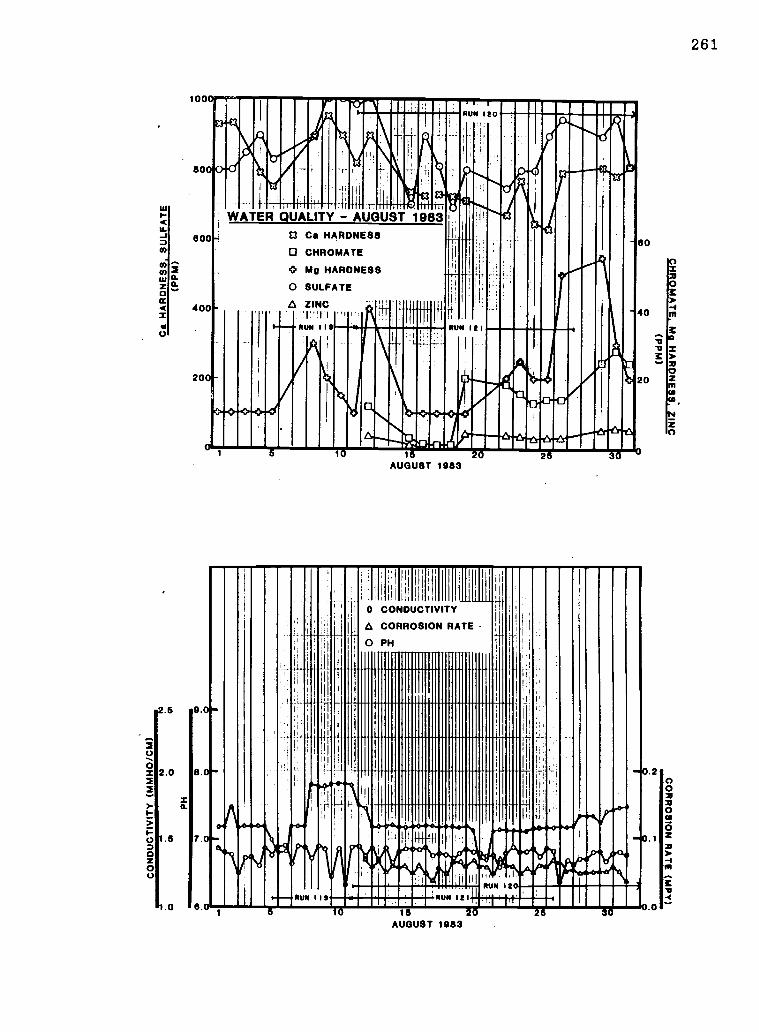
I-<LL-1
3Ii
0CC
Xa0
2.5
2.0
1.5
.0
100
-4- "111"111 11.11.91107
.111111111"thiql1/11P11"1
WATER QUALITY AUGUST19611E3 Ca HARDNESS
CHROMATE
O Mg HARDNESS
0 SULFATE
A ZINC "
I II
PUN I If
k 1111[1111A °111111111i
GOO
600
400
20
9.
4.
7.
8.
AUGUST 1983
111111111111111d111111 11111111
III I 1111111111111111111111111111111111111H
11111111111111111111111111111111111111111
1,11111111 II kiliiiititt11041110111
II"11111M2=11111111111051111.1.1111.15
25
60
40
AUGUST 1983
.2
0
261
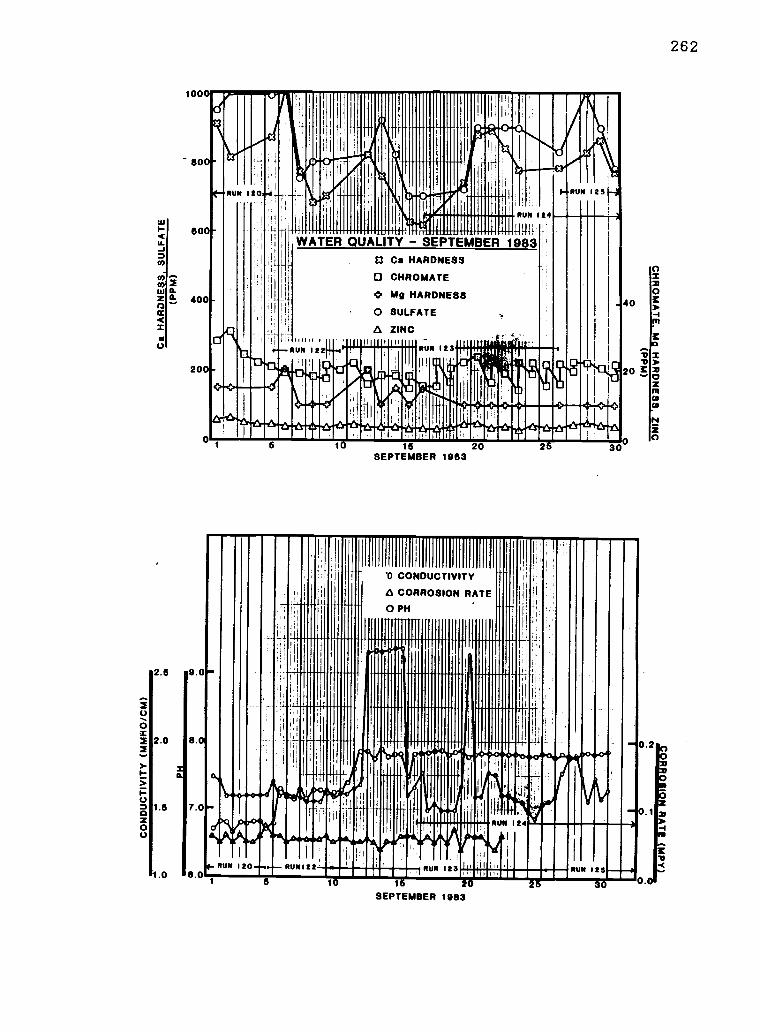
wI-<LL
COCO
COwz0
0
-2.5
100
80
80
I I. 111111
NAN .0011Ndillion
400
20
i ' 1 I.. .
.
Iry i0011.0 usiiiiiiimi .°
omm.... .
111111. liqh4r1all Immi WIWINOMMWWWWWiiiiimaginnwidAggigaimigigiwfilwawwitAA0
9.0
2.0 8.0
1.5 7.0
.0 6.0
1 5 1
SEPTEMBER 1983 2016 2
40
a20
-4
300
111
111
30SEPTEMBER 1983
0.2
0.1
262

I- < 60 LL _a
CO
CO
a tu a. 0 ". 400
100
SO
200
$0
40
O
0
2 p 0
2 2 >-
O z 0
2.0
1.5
1.0
S.
11.0
8.0
7.0
OCTOBER 1863
I
10 16 OCTOBER 1989
20 26 30
2.0
1.0
263
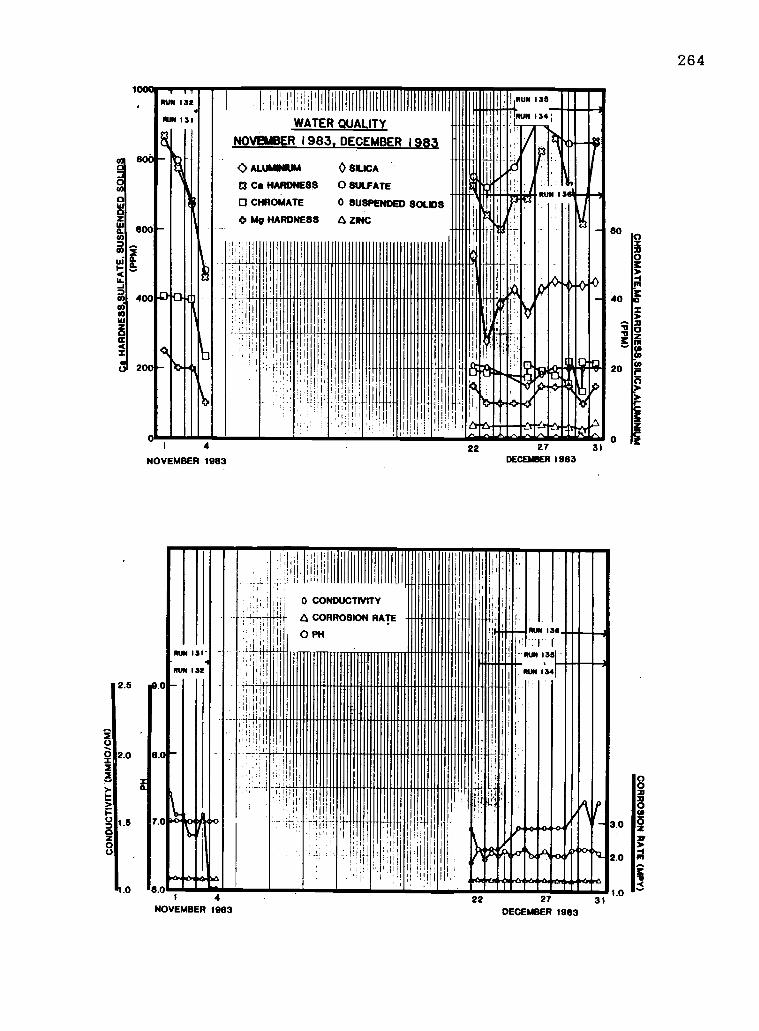
us
I'
x
11
. :
.
: ,
.11111100000,
:. .: 411.,
.
.
oluimmilimmillilloilibli.1000011101101,110., ,, i
II 1 1 -111.11,11ii.0......,,,...._
III 11111111111
I ollomilimillimiliimmil11111 ii ""1110011111illiiiiiii iiiimilli
111111111111111111111111111111111111 1111111111111111
1011111
111111111111111111111111
1111111111
.,. 010i011
iliiiiligil
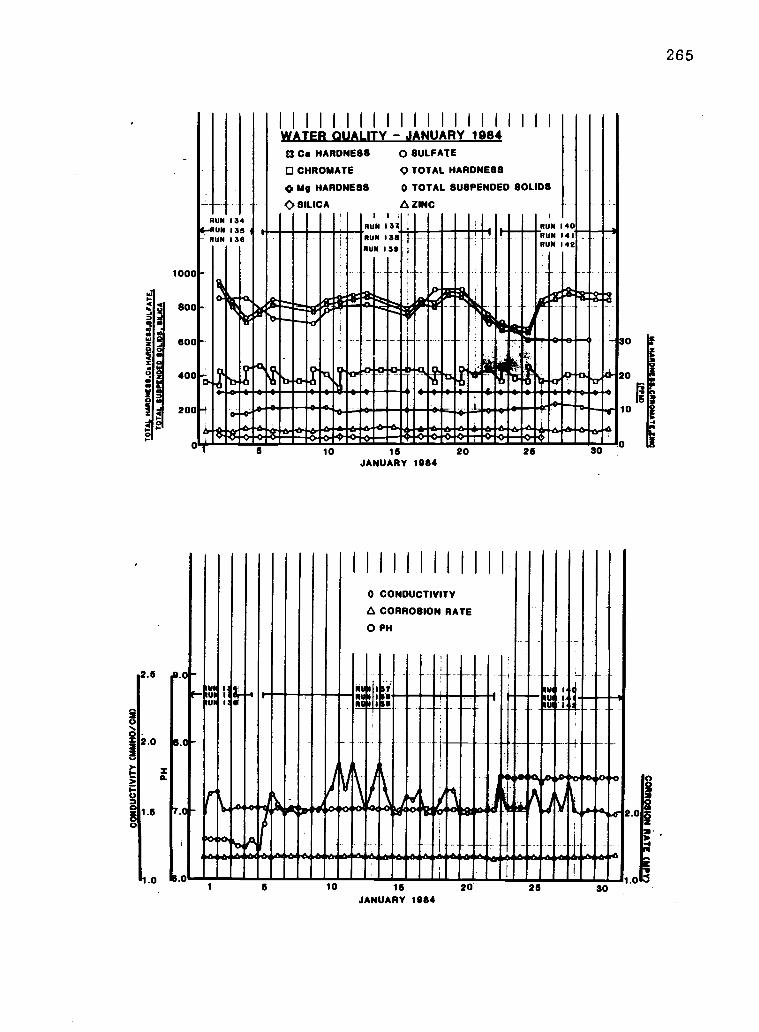
a
0I-
1000
800
eoo
400
200
2.5 41.0
2.0
1.6
1.0
7.
41.0
111111111111111111111WATER QUALITY JANUARY 1984a Ca HARDNESS
CHROMATE
O Mg HARDNESS
0 SILICA
0 SULFATE
0 TOTAL HARDNESS
0 TOTAL SUSPENDED SOLIDS
A ZINC11 I
RUN 134 !
1 RUN
VON1
:001111'IubliowlamoillinkulAwnOwi6wwwwWINIENNNOMMENINNUM wormywanilibmemmummummINNOINI
".12-V0t110===utlttuilinim
lluf lum
um 14
10 16 20 26 30JANUARY 1984
0 CONDUCTIVITY
A CORROSION RATE
0 PH
Rua o,gUa 14PUI 14
30
20
10
6 10 16JANUARY 1984
20 26
2.0
1.030
a
265
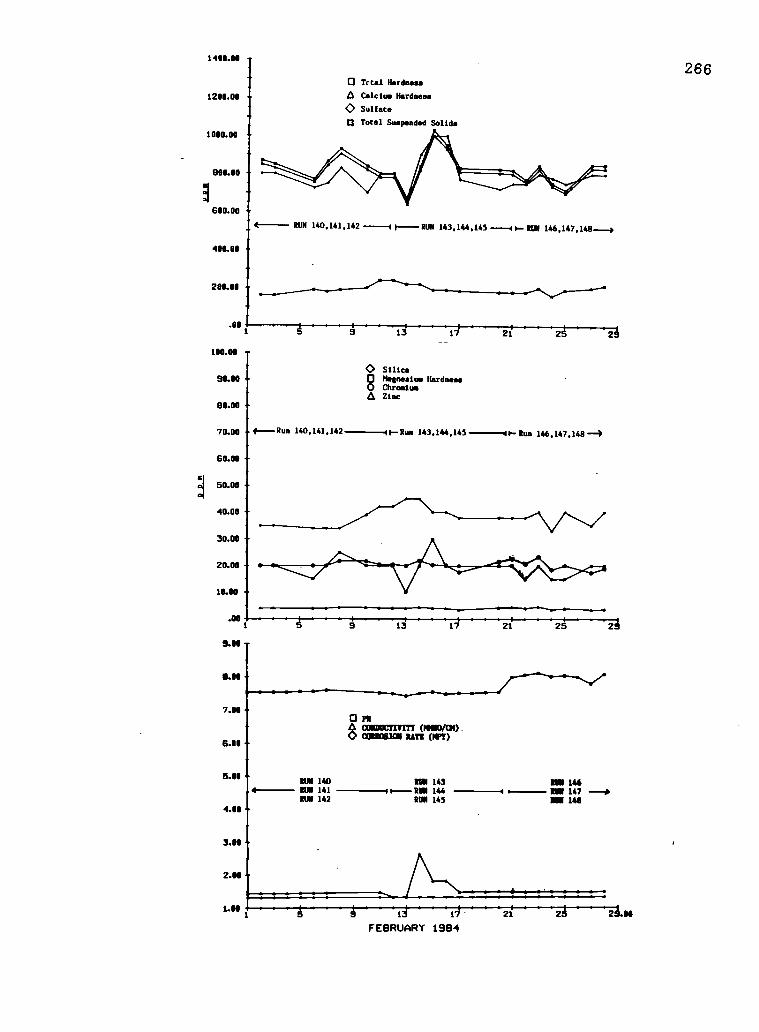
1400.111
1218.00
1010.00
900.00
600.00
4011.00
2110.01
.001
O Trial HardnessCalcium Hardness
O Sulfate3 Total Suspended Solids
4-- RUN 140,141.142 1 RUN 143,144,145 RUN 146.147.148--a
13
0 Silica0 Magnesium Hardness0 ChromiumA Zinc
21
70.00 d---Run 140.141.142 1--Run 143.144,145---a0- Run 146,147,148*
1LN
7.11
6.11
5.00RUN 140
4---- RUN 1411111 142
4.011
3.11
2.1111 -
O re4 cowman 177 0011o/00.
cceeosiali UTE (lEY)
NUN 143RUN 144RUN 145
ROB 146ION 147 --ItNOM 146
d 21
FEBRUARY 1984
266
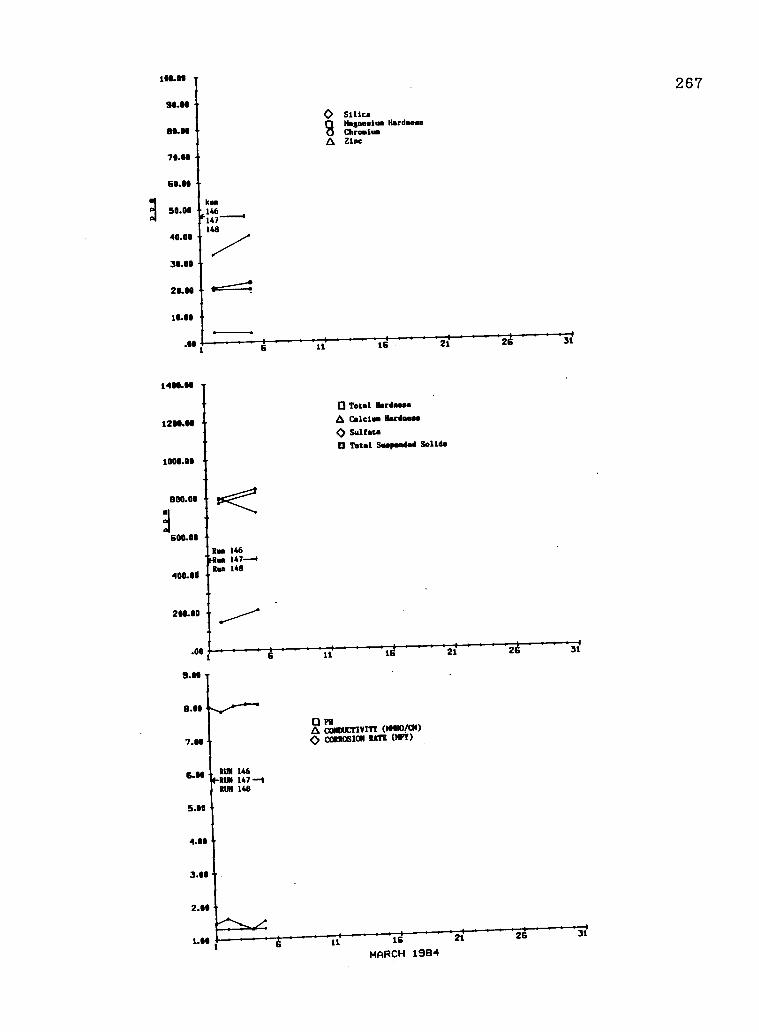
100.00
90.00
80.11
78.80
60.00
50.00
40.00
30.00
28.88
111.01
.110
14N.110
0 SilicaMagnesium Hardness
0 ChromiumZioc
CITotal Hardee..
1214.00n Calcium Maass*
0 Sulfate
a Racal Smspeaged Solid.
1000.00
800.00
600.00
400.00
200.00
.00
9.00
8.08
7.80
5.00
4.00
3.00
2.00
1.00
Rum 146an 147-4Rua 148
11
Q PHcortavcrivin poso(01)CORROSION RATE (MPY)
RUN 146RUN 147-4RUN 148
21 31
11 16 21 26 31
MARCH 1984
267
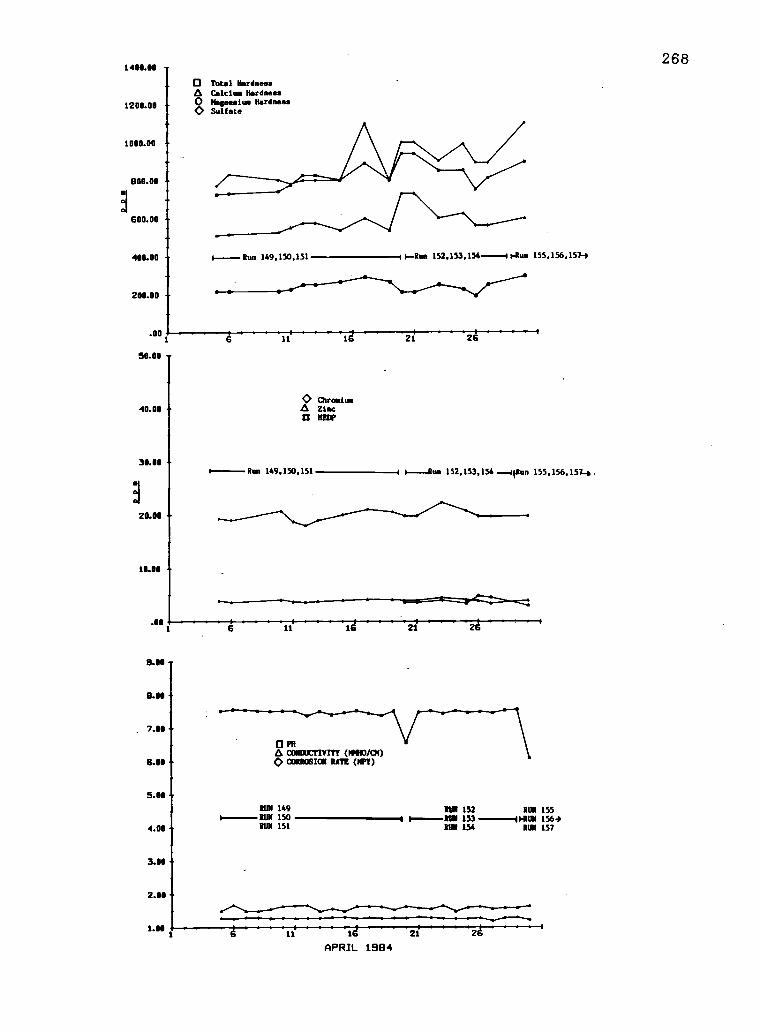
1400.00
1200.00
1000.00
800.00
600.00
400.00
200.00
.00
50.00
40.00
30.00
20.00
10.011
0 Total Hardness
et Calcium HardnessgHmaaealue HardnessSulfate
Run 149,150,151 152,153,154 rRun 155,156,1574
5.00
8.00
7.00
6.00
5.00
4.00
3.00
2.00
1.00
0 ChromiumAl zinctT HOP
Run 149,150,151 a 1--Run 152,153,154 lean 155,156,157.4.
CI FRCONDUCTIVITY (WINO/CN)CORROSION RATE (*T)
RUN 1491RINI 150
RUN 151
RUN 152RUN 153RUN 154
RUN 1550018 156.0RUN 157
APRIL 1984
268
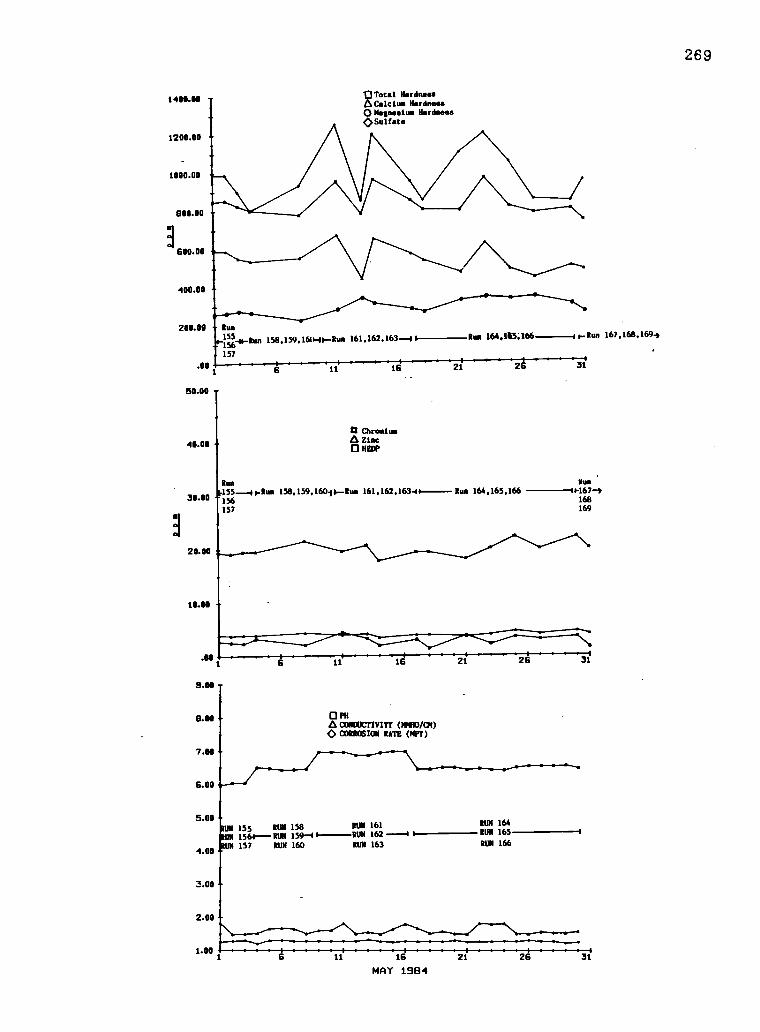
1400.00
1200.00
1000.00
800.00
600.00
400.00
O Total HardnessA Calcium Hardness0 Magnesium Hardness*Sulfate
200.00 Rua
155155.11-Run 158,159,160-11Run 161,162,163-1
.00157
1
50.00 -
40.00 -
Rum 164,165166 1,..Run 167,168,1694
-
11 16 21 31
12 ChromiumZinc
0 HEDP
Run
30.00 -015655op-Rua 158,159,160.0.-Rua 161,162,1634
20.00
157
Run 164,165,166Nun
p167-1168169
10.00 -
9.00 -
8.00 0 PHconucrum oisiogio
0 CORROSION RATE (MPY)
5.00 -RUN 155 RUN 158 RUN 161
RUN 1561 RUM 159-11---RUN 162RUN 157 RUN 160 RUN 163
3.00 -
2.00 -
1.001 11
RUN 164RUN 165
RUN 166
16 21 26 31
MAY 1984
269
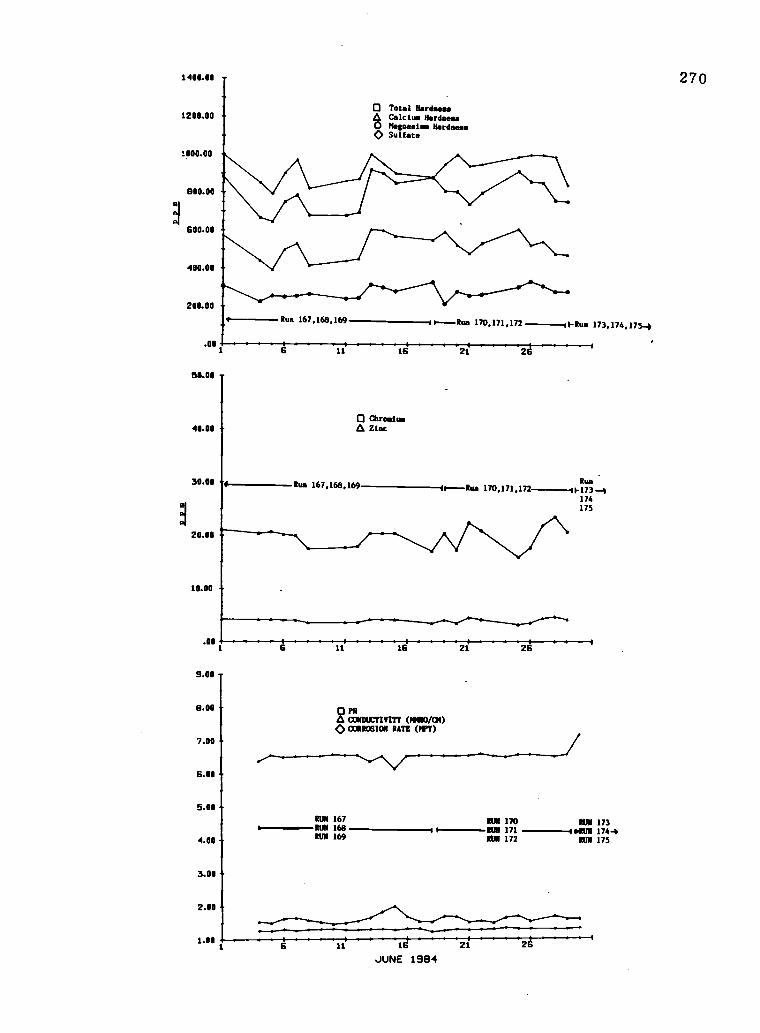
14011.011 -
1200.00
1000.00
800.00
600.00
400.00
200.00
0 Total HeroismCalcium Hardness
0 Magnesium Hardness<> Sulfate
.00
56.00
40.00
Rue 167,168,169
4 11
Chromiuei Zinc
0----Run 170,171,172 9-Run 173,174,175-9
21
30.00 Rua 167,168,1691 Run 170,171,172
20.011
10.00
.00
Run1-173-9174175
9.00 -
8.00 -
7.00
6.00
5.00
4.00
3.00 -
2.00 -
1.00
11 16 21 26
GPMA CONDUCTIVITY (MMNO/CM)<>CORROSION RATE (MPT)
RUN 167RUN 168RUN 169
RUN 170RUN 171RUN 172
RUN 173RUN 174-*RUN 175
6 11 16 21 26
JUNE 1984
270
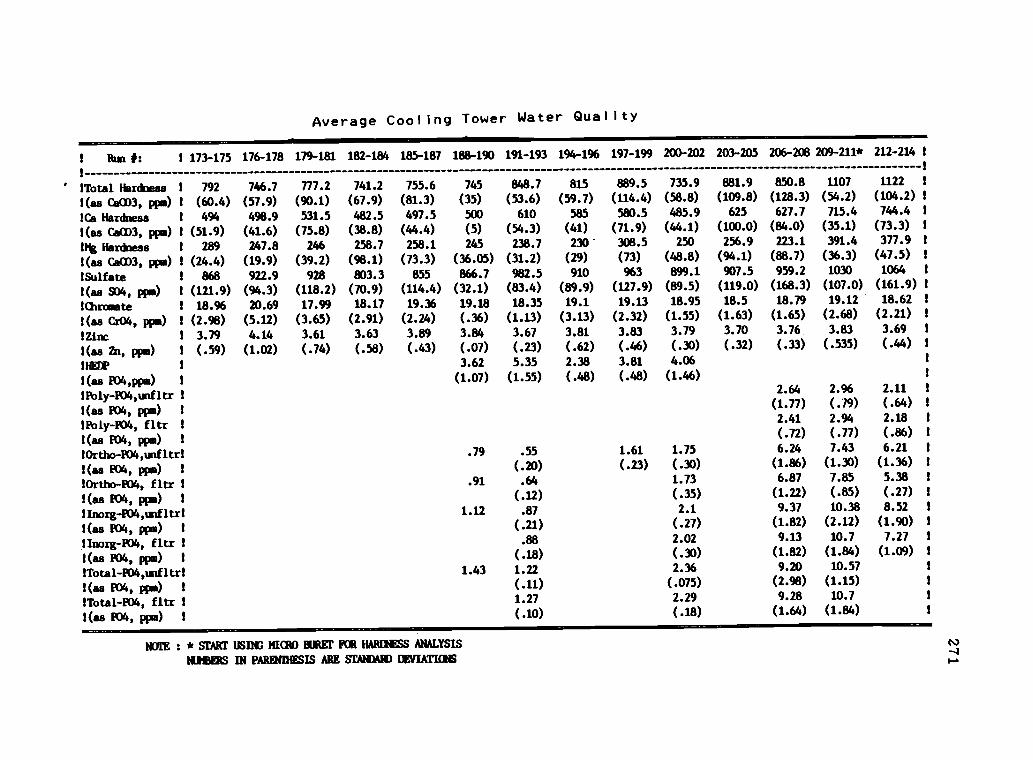
Average Cooling Tower Water Quality
Rum #: 173-175 176-178 179-181 182-184 185-187 188-190 191-193 194-196 197-199 200-202 203-205 206-208 209-211* 212-214 I
!Total Hardness I 792 746.7 777.2 741.2 755.6 745 848.7 815 889.5 735.9 881.9 850.8 1107 1122 I
I(as Ca003, ppm) I (60.4) (57.9) (90.1) (67.9) (81.3) (35) (53.6) (59.7) (114.4) (58.8) (109.8) (128.3) (54.2) (104.2) 1
!Ca Hardness I 494 498.9 531.5 482.5 497.5 500 610 585 580.5 485.9 625 627.7 715.4 744.4 I
!(as Ca003, ppm) ! (51.9) (41.6) (75.8) (38.8) (44.4) (5) (54.3) (41) (71.9) (44.1) (100.0) (84.0) (35.1) (73.3) !
Ut Hardness I 289 247.8 246 258.7 258.1 245 238.7 230 308.5 250 256.9 223.1 391.4 377.9 I
!(as CAC03, ppm) I (24.4) (19.9) (39.2) (98.1) (73.3) (36.05) (31.2) (29) (73) (48.8) (94.1) (88.7) (36.3) (47.5) !
!Sulfate 868 922.9 928 803.3 855 866.7 982.5 910 963 899.1 907.5 959.2 1030 1064 !
I(as 904, ppm) I (121.9) (94.3) (118.2) (70.9) (114.4) (32.1) (83.4) (89.9) (127.9) (89.5) (119.0) (168.3) (107.0) (161.9) I
!Chromate 18.96 20.69 17.99 18.17 19.36 19.18 18.35 19.1 19.13 18.95 18.5 18.79 19.12 18.62 I
!(as Cx04, ppm) ! (2.98) (5.12) (3.65) (2.91) (2.24) (.36) (1.13) (3.13) (2.32) (1.55) (1.63) (1.65) (2.68) (2.21) !
!Zinc 3.79 4.14 3.61 3.63 3.89 3.84 3.67 3.81 3.83 3.79 3.70 3.76 3.83 3.69 !
!(as 2n, ppm) I (.59) (1.02) (.74) (.58) (.43) (.07) (.23) (.62) (.46) (.30) (.32) (.33) (.535) (.44) 1
THEM 3.62 5.35 2.38 3.81 4.06
!(as PO4,ppm) ! (1.07) (1.55) (.48) (.48) (1.46)
!Poly-PO4,unfltr !2.64 2.96 2.11 I
!(as PO4, ppm) I(1.77) (.79) (.64)
!Po1y-PO4, fltr I2.41 2.94 2.18 I
I(as PO4, ppm) I(.72) (.77) (.86) !
1Ortho-PO4,unfltrl .79 .55 1.61 1.75 6.24 7.43 6.21
I(as PO4, ppm) I (.20) (.23) (.30) (1.86) (1.30) (1.36) !
!Ortho-PO4, fltr I .91 .64 1.73 6.87 7.85 5.38 !
!(as PO4, ppm) 1(.12) (.35) (1.22) (.85) (.27) 1
1Inorg-PO4,unfltr! 1.12 .87 2.1 9.37 10.38 8.52 !
I(as 1104, ppm) I (.21) (.27) (1.82) (2.12) (1.90) I
lInotg-PO4, fltr ! .88 2.02 9.13 10.7 7.27
I(as PO4, ppm) 1(.18) (.30) (1.82) (1.84) (1.09) I
!Total-PO4,unfltr! 1.43 1.22 2.36 9.20 10.57
I(as PO4, ppm) !(.11) (.075) (2.98) (1.15)
!Total-PO4, fltr I 1.27 2.29 9.28 10.7
I(as PO4, ppm) I(.10) (.18) (1.64) (1.84)
NOTE : * START USIIC MICRO BURET FOR HAREMS ANALYSIS
NUNBEILS IN PAREHRIESIS ARE ammo ELNIATIONS

Average Cooling Tower Water Quality
I Run 1: 1 215-217 218-220 221-223 224-226 227-229 230-232 233-235 236-238 239-241 242-244 245-247 245-247 245-247 1I I(a) (b) (c) II I
!Mud liminess I 1019 1012 1066 1122 1165 1187 1213 1315 1287 1328 1438 1296 1125 I1(as 08003, pp,) ! (61.6) (52.3) (42.3) (73.5) (44.5) (104) (89.3) (120) (156) (99.2) (59.0) (46.9) (48.5) II II!Ca !larders I 667 633 705 755 785 791 830 903 902 971 1066 940 845 I1(as W03, ppm) I (41.9) (62.5) (31.1) (52.3) (49.3) (38.1) (60.0) (94.8) (171) (54.7) (45.7) (57.9) (46.4) 11 ItIt liminess I 352 380 361 367 380 396 393 412 386 357 374 356 280.3 I1(as Ca003, ppm) 1 (27.6) (18.8) (38.2) (38.1) (41.4) (80.1) (44.6) (48.5) (56.0) (78.4) (46.9) (13.0) (15.2) 1t II!Sulfate I 947 910 1019 1065 1096 1238 1167 1189 1142 1220 1364 1267 980 I1(as SD4, ppm) 1 (85.6) (66.8) (38.3) (110) (84.3) (178) (135) (143) (181) (51.0) (102) (47.1) (66.8) II 1
IICIzamsta I 18.7 19.0 17.7 18.8 18.5 18.5 18.8I1(as (06, -. - __ __ __ __04, ppm) I (2.04) (2.08) (2.62) (3.15) (2.29) (1.99) (3.71)II 1tIn= 1 3.75 3.79 3.55 3.76 3.71 3.69 3.75 _ - - - - - I1(as 2n, pps) 1 (0.41) (0.42) (0.32) (0.63) (0.46) (0.40) (0.74)1I ItIPbly-Nmehste I 2.56 2.71 2.29 2.72 2.90 1.99 2.43 2.31 2.60 2.31 2.30 2.30 2.30 I1(as PO4, ppm) 1 (0.52) (0.42) (0.50) (0.37) (0.65) (0.47) (0.81) (0.25) (0.35) (0.20) (0.07) 1I II
10e12m-Phospbsts 1 7.14 6.67 7.57 .7.44 7.50 7.16 6.49 4.92 4.88 4.25 5.03 3.90 9.50 I1(as PO4, pp) 1 (1.10) (1.47) (0.54) (0.72) (0.68) (0.54) (0.88) (0.25) (0.27) (0.16) (0.39) II IIIAN P ! 2.57 2.44 2.95 3.12 2.68 2.01 2.94 3.49 3.61 3.71 4.09 I
1(as PO4, ppa) I (0.44) (0.54) (0.81) (1.18) (1.25) (1.23) (1.68) (1.18) (1.15) (1.09) (0.10) 1I II
1831.1.0 I 28.8 28.0 28.5 30.6 34.4 30.0 33.0 36.0 38.0 33.0 36.0 30.0 34.0 I1(as $102, ppm) I (2.76) (1.25) (2.12) (0.5) 1I I
I
'PH I 6.00 6.00 6.03 6.05 6.47 6.46 7.02 7.00 7.03 7.50 7.42 7.48 6.48 I1 I (0.05) (0.00) (0.04) (0.13) (0.07) (0.05) (0.08) (0.02) (0.02) (0.10) (0.10) (0.02) (0.08) II I
I
tint : NUMBS DI PARMIHISIS ABE SMEARD !SWIM=
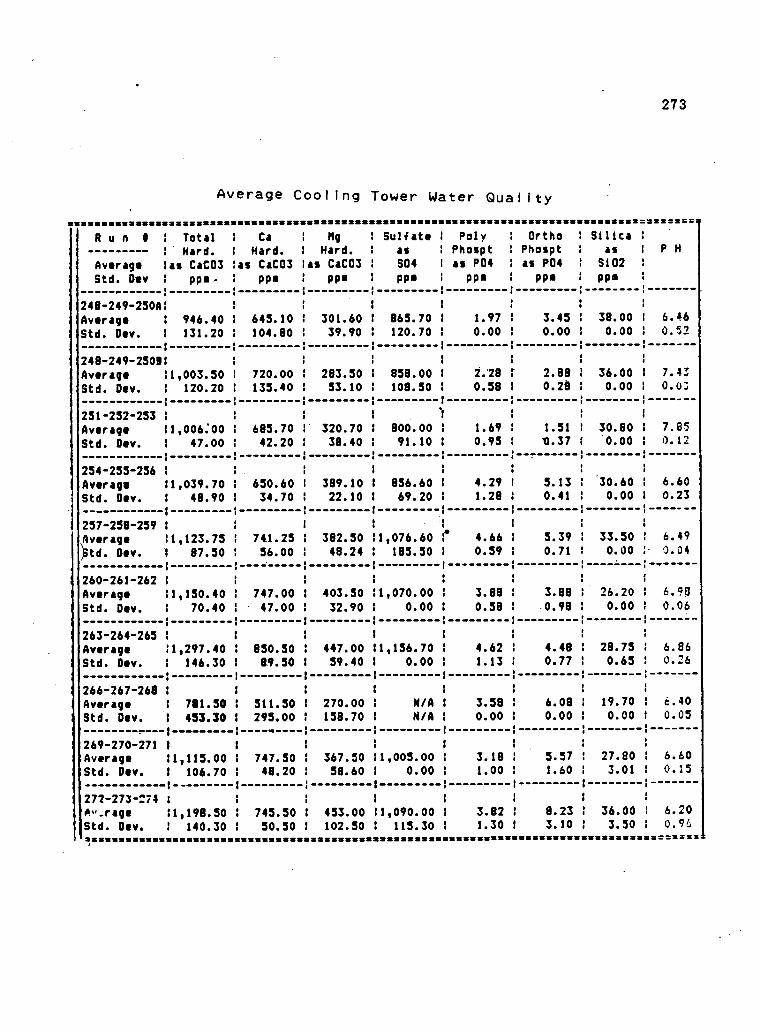
273
Average Cooling Tower Water Quality
RunIll TotalI Hard.
Average as CaCO3Std. Div 1 pp.-
1
248-249-250A:Average 1 946.40Std. Dev. 1 131.20
:
248-249-25081Average 11,003.50Std. Dev. 1 120.20
1
251-252-253 1Average 11,006:00Std. Div. 1 47.00
1
254-255-256 1
Average :1,039.70Std. Dev. 1 48.90
1
257-258-259 :
\Average 11,123.75td. Dev. 1 87.50
I
260-261-262 1Average 11,150.40Std. Dev. : 70.40
1
263-264-265 1
Average 11,297.40Std. Dev. 1 146.30
1
266-267-268 1Average 1 781.50Std. Dev. 1 453.30
- 1
269-270-271 1
Average 11,115.00Std. Div. 1 106.70
1 - -
272-273-274 1
0,,_rage :1,198.50Std. Dev. 1 140.30
1
I
:
:
.'
1
1
1
.
.
I
I
I
.
I
:
:
1
.
.
1
1
I
.
.
:
:
1
.
.
:
1
1
..
1
1
1
.
8
:
1
1
1
1
1
-1..
I
1
Ca I
Hard. I
as CaCO3
PPR :
I
.
.
645.10 1
104.80 I
1
.
.
720.00 I
135.40 I
:
I
685.70 1
42.20 1
1
.
.
1
34.70 1
1
.
.
74.1.25 1
56.00 1
1
:
747.00 1
47.00 1
:
:
850.50 1
89.50 1
1
.
.
511.50 1
295.00 1:
.
.
747.50 1
48.20 1
:
.
.
745.50 I
50.50 1
Mg
Hard.
as CaCO3
ppm
301.6039.90
283.5053.10
320.7038.40
389.1022.10
382.5048.24
403.5032.90
447.0039.40
270.00158.70
367.5058.60
453.00102.50
1 Sulfate!I as :
1 SO4 1
: ppm 1
I 1
1 1
1 865.70 1
1 120.70 1
t 1
.
1 858.00 1
I 108.50 1
1 1
i
I 1
1 800.00 1
1 91.10 1
1 :
a: .
1 856.60 1
1 69.20 1
1 1
1.
11,076.60 r1 185.50 1
: : 1
. .
11,070.00 1
1 0.00 1
1 1
1 1
11,136.70 1
1 0.00 1
1
::1
1 N/A 1
1 N/A 11 1
. .
.
11,005.00 1
1 0.00 1
1 1
11,090.00 1
1 115.30 1
Poly I
Phospt 1
as PO4 1
ppm :
!
.
1.97 1
0.00 I
:
.
.
2.28 r0.58 1
1
I
i
1.69 1
0.95 :
:
.
.
4.29 1
1.28 1
:
.
.
4.66 1
0.59 1
I
.
.
3.88 1
0.58 1
:
.
.
4.62 1
1.13 1
1
.
3.58 1
0.00 1
1
.
.
3.18 1
1.00 1
1
:
3.82 1
1.30 1
OrthoPhosptas PO4
12130
3.450.00
2.880.28
1.51'0.37
3.130.41
5.390.71
3.880.98
4.480.77
6.080.00
5.571.60
8.233.10
1
:
1
1
:
.
1
1
1
1
.
.
1
1
I
I
8
I
I
I
.
1
1
:
.
1
1
.
1
1
:
.
I
1
1
.
1
1
:
1
1
:
.
.
1
1
Silicaas
Si02
pp.
38.000.00
36.000.00
30.800.00
650.60 30.60
0.00
33.500.00
26.200.00
28.750.65
19.700.00
27.803.01
36.003.50
:
I
:
1
.
.
1
1
:
1
1
1
1
I
1
:
.
.
1
1
1
.
1
1
;
1
1
1
1
I
:
.
.
1
1
1
1
1
1
.
I
:
P H
6.460.52
7.430.0:
7.850.12
6.600.23
6.490.04
6.980.06
6.860.26
6.400.05
6.600.15
6.200.9G
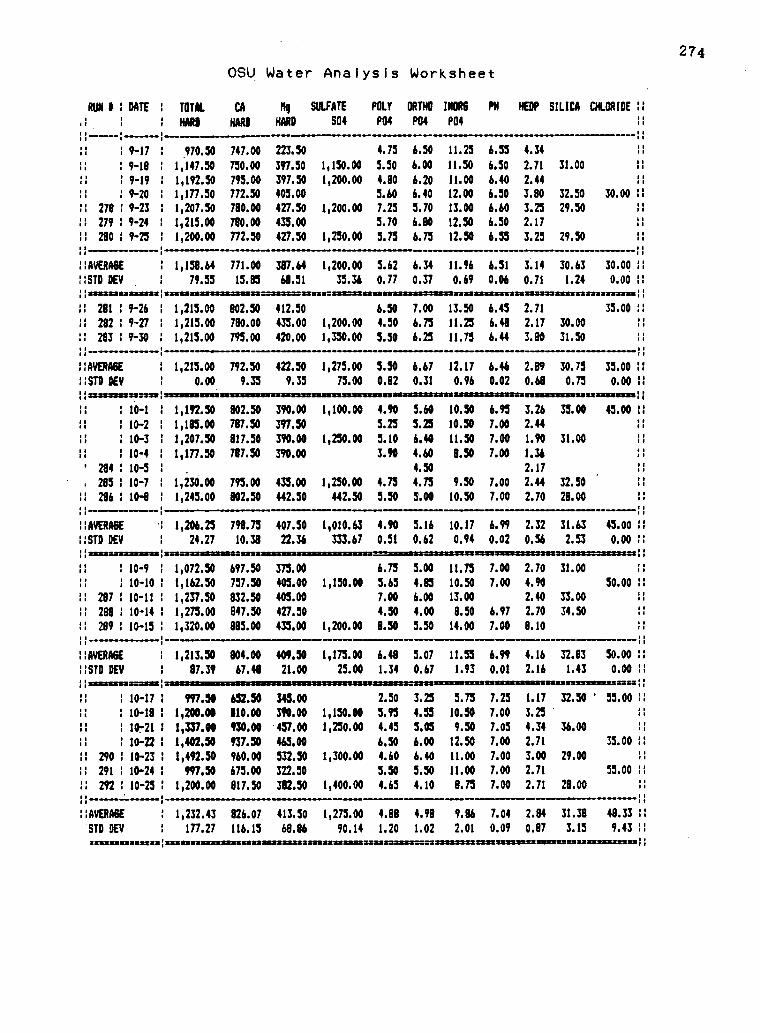
274
OSU Water Analysis Worksheet
RUN $ DATE 1 TOTAL CA Mg SULFATE POLY ORTHO 11018 PH HEDP SILICA CHLORIDE 11
HARI HARI HARD SO4 PO4 PO4 PO4
11 9-17 1 910.50 747.00 223.30 4.75 6.50 11.25 6.53 4.34 11
11 9-18 1 1,147.50 750.00 397.50 1,150.00 5.50 6.00 11.50 6.50 2.71 31.00"..
:: 1 9-19 1 1,192.50 795.00 397.50 1,200.00 4.80 6.20 11.00 6.40 2.44 .,..
.. 9-20 1 1,177.50 772.50 405.00 5.60 6.40 12.00 6.50 3.80 32.50 30.00 11
11 278 1 9-23 1 1,207.50 780.00 427.50 1,200.00 7.25 5.70 13.00 6.60 3.25 29.50.,"
11 279 9-24 1 1,215.00 780.00 435.00 5.70 6.80 12.50 6.50 2.17,...
If 280 1 9-23 1 1,200.00 172.50 427.50 1,250.00 5.75 6.75 12.50 6.35 3.25 29.501111
11 1 If
11AVERAM 1 1,158.64 771.00 387.64 1,200.00 5.62 6.34 11.96 6.51 3.14 30.63 30.00 11
11STD DEV 1 79.55 15.85 68.51 35.36 0.77 0.37 0.69 0.06 0.71 1.24 0.00 11
szszurssmassn sseasleauszazzszza3zaszzass-......szsassmossirsassessaineassszszetasszazzumssim-zz--2---== I
11 281 : 9-26 1 1,215.00 802.50 412.30 6.50 7.00 13.50 6.45 2.71 35.00 1:
11 282 1 9-27 1 1,215.00 780.00 435.00 1,200.00 4.50 6.75 11.25 6.48 2.17 30.00
:1 283 1 9-30 1 1,215.00 795.00 420.00 1,350.00 5.50 6.25 11.75 6.44 3.80 31.50
11 11
..AVERAGE 1,215.00 792.50 422.50 1,275.00 5.50 6.67 12.17 6.46 2.89 30.75 35.00 :1
11STD DEV 1 0.00 9.35 9.35 75.00 0.82 0.31 0.96 0.02 0.68 0.75 0.00 11
1;szassasassassz sitawassasssassuussmassaszszzanssuaszsmasawasszsasszsassasszassmassassessusszazzasasssall11 1 10-1 1 1,192.50 802.50 390.00 1,100.00 4.90 5.60 10.50 6.95 3.26 35.00 45.00 11
11 1 10-2 1 1,185.00 787.50 397.50 5.25 5.25 10.50 7.00 2.44 11
11 1 10-3 1 1,207.50 817.50 390.00 1,250.00 5.10 6.40 11.50 7.00 1.90 31.00
11 1 10-4 1 1,177.54 787.50 390.00 3.90 4.60 8.50 7.00 1.361111
' 284 : 10-5 1 4.50 2.1111
. 285 1 10-7 1 1,230.00 795.00 435.00 1,230.00 4.75 4.75 9.50 7.00 2.44 32.50
11 286 1 10-8 1,245.00 802.50 442.50 442.50 5.50 5.00 10.50 7.00 2.70 28.00 11
11
11AVERA6E 1,206.25 798.75 407.50 1,010.63 4.90 5.16 10.17 6.99 2.32 31.63 45.00 11
11STD DEV 1 24.27 10.38 22.36 333.67 0.51 0.62 0.94 0.02 0.56 2.53 0.00 11
1; sszszazzszazas szat=sasassass-srassausszsawaszazzsmassasssassesassmesszasszaciessamsmazzazza=wszassl11 1 10-9 1 1,072.50 697.50 375.00 6.75 5.00 11.75 7.00 2.70 31.00
11 1 10-10 1 1,162.50 757.50 405.00 1,150.00 5.65 4.85 10.50 7.00 4.90 50.00 11
11 287 1 10-11 1 1,237.50 832.50 405.00 7.00 6.00 13.00 2.40 33.00
:1 288 : 10-14 1 1,275.00 847.50 427.50 4.50 4.00 8.50 6.97 2.70 34.50
11 289 1 10-15 1,320.00 885.00 435.00 1,200.00 8.50 5.50 14.00 7.00 8.101111
;;AVERAGE 1 1,213.50 804.00 409.50 1,175.00 6.48 5.07 11.55 6.99 4.16 32.83 50.00 1:
11STD DEV 1 87.39 67.48 21.00 25.00 1.34 0.67 1.93 0.01 2.16 1.43 0.00 11
11=zsz==pes szassx=xxaszsmszzaszatssassrassigassimsszmzszsza10-17 1 997.50 652.50 345.00 2.50 3.25 5.75 7.25 1.17 32.50 55.00 11
11 1 10-18 1 1,200.00 810.00 390.00 1,150.00 5.95 4.55 10.50 7.00 3.25 11
11 1 10-21 1 1,337.00 930.00 457.00 1,250.00 4.45 5.05 9.50 7.05 4.34 36.00 1111
10-22 1 1,402.50 931.50 40.00 6.50 6.00 12.50 7.00 2.71 33.00 1:
1: 290 1 10-23 1 1,492.50 960.00 532.50 1,300.00 4.60 6.40 11.00 7.00 3.00 29.00
11 291 1 10-24 1 997.50 675.00 322.50 5.50 5.50 11.00 7.00 2.71 55.00 11
11 292 1 10-25 1 1,200.00 817.50 382.50 1,400.00 4.65 4.10 8.75 7.00 2.71 28.00 11
11AVERA6E 1 1,232.43 826.07 413.50 1,275.00 4.88 4.98 9.86 7.04 2.84 31.38 48.33 11
STD DEV 1 177.27 116.15 68.86 90.14 1.20 1.02 2.01 0.09 0.87 3.15 9.43 11
zzassrassassassassuszszazz-zzazzazaseasszatasszsm-mmazszsmszszzast-2==--sass-...uss1
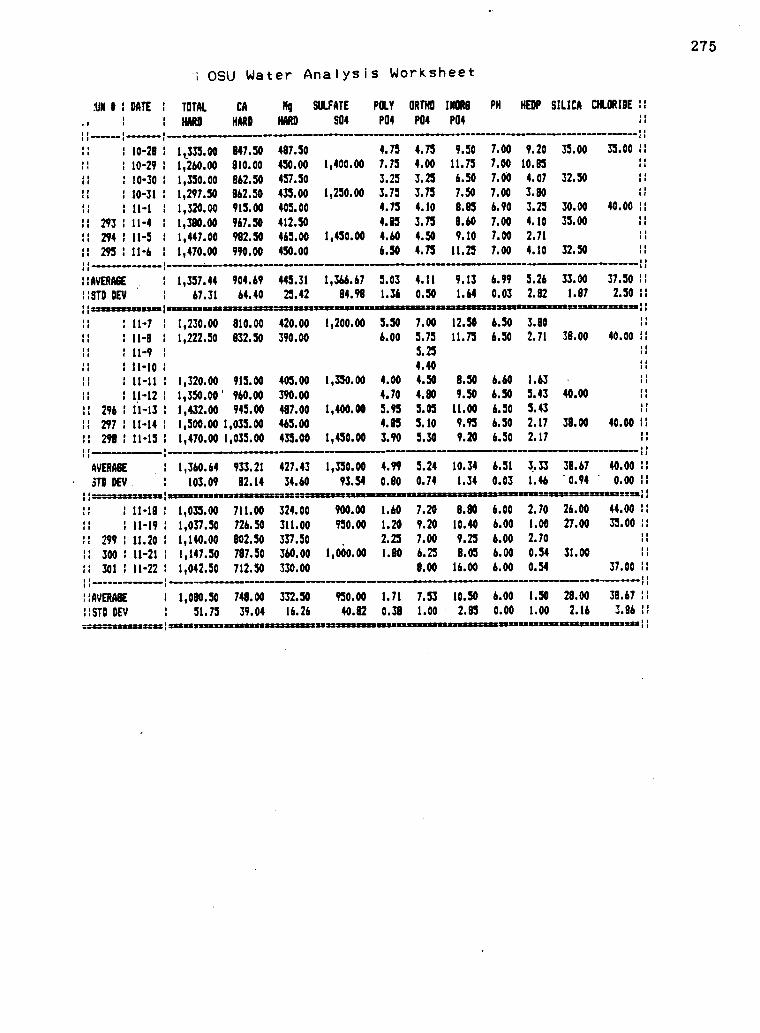
275
:UN 8 I
1
: 1 - - - :
IIII 1
11II 1
IIII 1
11 II 1
11II 1
11 293 1
II 294 1
II 295 1
1:
1:AVERAGE
1:STD DEV
DATE 1
1
1 OSU Water Analysis Worksheet
TOTAL CA Ng SULFATE POLY ORTHO IRONS
HARD HARD HARD SO4 PO4 PO4 PO4
PH HEDP SILICA CHLORIDE 1:
1:
11-10-28
10-29
10-30 1
10-31 1
11-1
II -4 1
11-5 1
11-6 1
1t335.00
1,260.00
1,350.00
1,297.50
1,320.00
1,380.00
1,447.00
1,470.00
847.50
810.00
862.50
862.50
915.00
967.9
982.50
990.00
487.50
450.00
457.50
433.00
405.00
412.50
465.00
450.00
1,400.00
1,250.00
1,450.00
4.75
7.75
3.25
3.75
4.75
4.85
4.60
6.50
4.75
4.00
3.25
3.75
4.10
3.75
4.50
4.75
9.50
11.75
6.50
7.50
8.85
8.60
9.10
11.25
7.00
7.00
7.00
7.00
6.90
7.00
7.00
7.00
9.20
10.85
4.07
3.80
3.25
4.10
2.71
4.10
35.00
32.50
30.00
35.00
32.50
35.00 II
11
11
1:
40.00 11...,
I:
11
1
1
1,357.44
67.31
904.69
64.40
445.31
25.42
1,366.67
84.98
5.03
1.36
4.11
0.50
9.13
1.64
6.99
0.03
5.26
2.82
33.00
1.87
11
37.50 11
2.50 11
: ; zszszszszasszz 1 szzszszsaszszszzasszz=zasszsasszasszszzassasszszszszszszsasszszszszszszszszsz==as..--zsza 1 ;11II 11-7 1,230.00 810.00 420.00 1,200.00 5.50 7.00 12.50 6.50 3.80 11
IIII 11-8 1,222.50 832.50 390.00 6.00 5.75 11.75 6.50 2.71 38.00 40.00 II
..
.. 1 11-9 5.25 1:
II IIII 11-10.... 11-11 1,320.00 915.00 405.00 1,350.00 4.00
4.40
4.50 8.50 6.60 1.63
..
1:
11 1 11-12 1 1,350.00' 960.00 390.00 4.70 4.80 9.50 6.50 5.43 40.00 11
11 296 1 11-13 1 1,432.00 945.00 487.00 1,400.00 5.95 5.05 11.00 6.50 5.43 Ii
11 297 , 11-14 1 1,500.00 1,035.00 465.00 4.85 5.10 9.95 6.50 2.17 38.00 40.00 11
II 298 1 11-15 1 1,470.00 1,035.00 435.00 1,450.00 3.90 5.30 9.20 6.50 2.17..,.
11 11
AVERAGE 1 1,360.64 933.21 427.43 1,350.00 4.99 5.24 10.34 6.51 3.33 38.67 40.00 :1
STD DEV 1 103.09 82.14 34.60 93.54 0.80 0.74 1.34 0.03 1.46 .0.94 0.00 If
1 zszaszszszliss-raszszszszszszsmszszszass .... zzszszsu-szszals -1,-;;rizz-azzzszszsz11 1 11-18 1 1,035.00 711.00 324.00 900.00 1.60 7.20 8.80 6.00 2.70 26.00 44.00 :I
11 1 11-19 1 1,037.50 726.50 311.00 930.00 1.20 9.20 10.40 6.00 1.00 27.00 35.00 11
11 299 1 11.20 1 1,140.00 802.50 337.50 2.25 7.00 9.25 6.00 2.70
11 300 : 11-21 1 1,147.50 787.50 360.00 1,000.00 1.80 6.25 8.05 6.00 0.54 31.00
11 301 11-22 1 1,042.50 712.50 330.00 8.00 16.00 6.00 0.54 37.00 :1
11 1:
1:AVERABE 1 1,080.50 748.00 332.50 950.00 1.71 7.53 10.50 6.00 1.50 28.00 38.67 11
1:STD DEV 1 51.75 39.04 16.26 40.82 0.38 1.00 2.85 0.00 1.00 2.16 3.86 11
zzzszzazzszszszs ; sans - assess ssiZZZSZIMS12121311.31111ZSMIZZ zusszszzass===zzzs=s sz 11
276
APPENDIX K
SYSTEM FLOWRATES
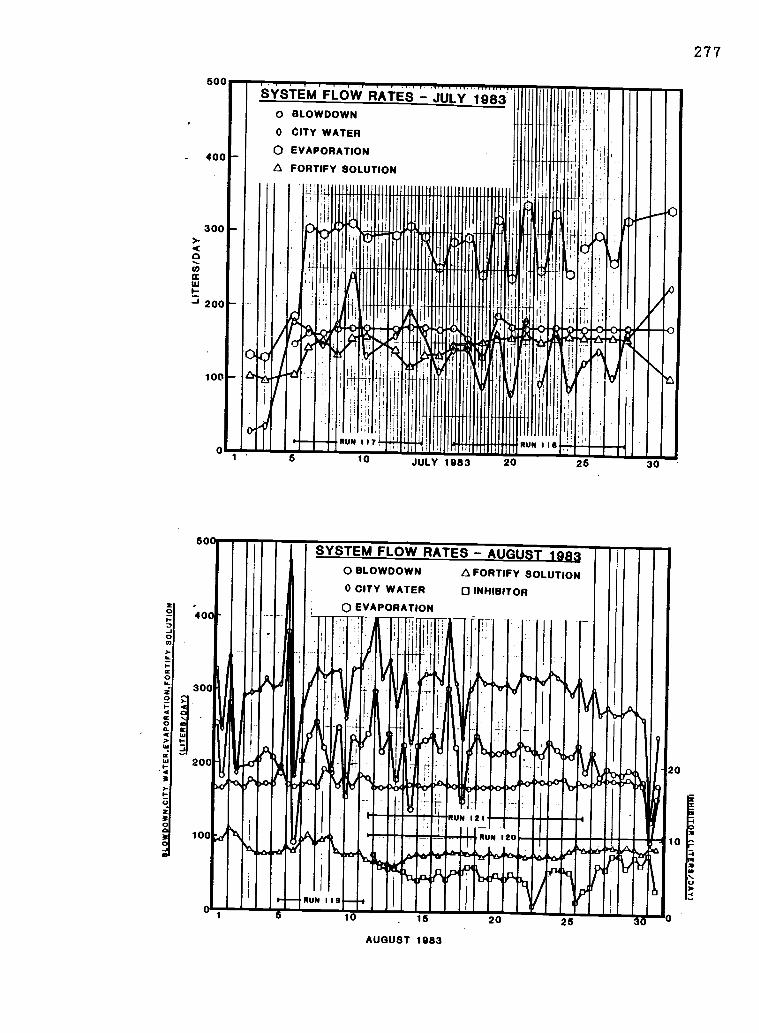
500
400
300
0co
200
100
500
277
10 JULY 1963 20 26
400
Ip300
20
11
i1111111I
iL31111 0.,:J:JVA?1
SYSTEM FLOW RATES - AI
30
eibk.10Plillt25 010 16
AUGUST 1963
20
20
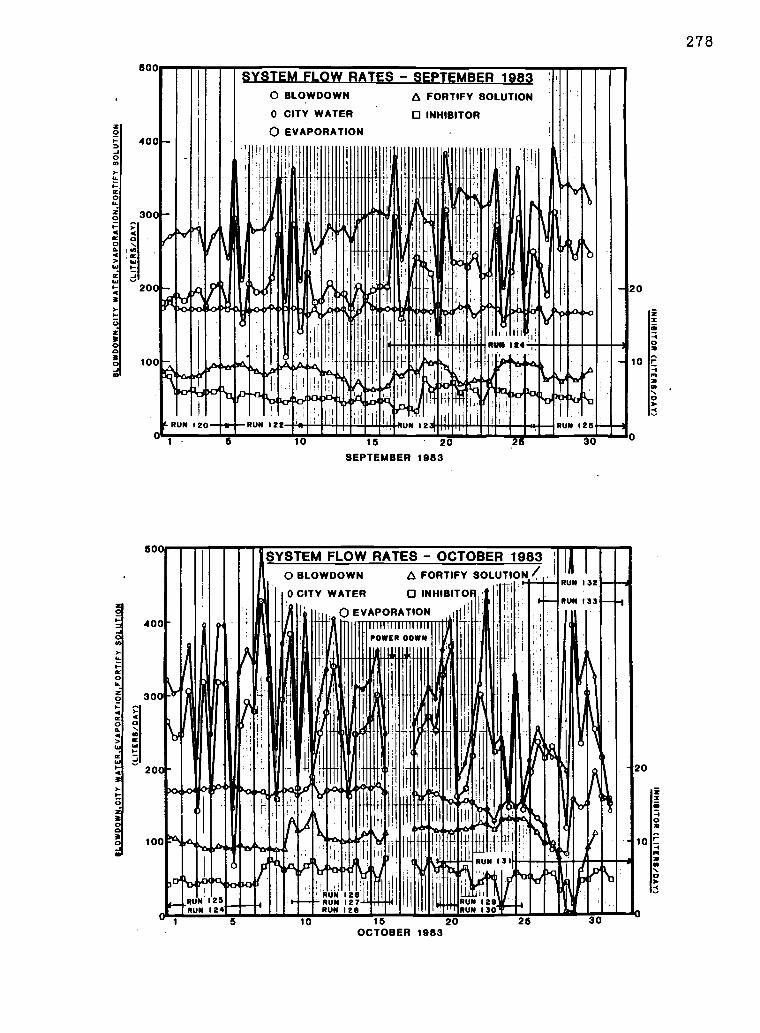
CC
4
1-.
3
40
500
400
300
hi
200
100
0
0I-CC041,1
50
RUN
SYSTEM FLOW RATES SEPTEMBER 1983
.
I1
...
11
RUN
00
Oi I
1
1.
IIII
122
SLOWDOWN
CITY
EVAPORATION
III
i.
i1
twilit
WATER
I
jviillo'F ill 1
'PPM
I 1
11111111
A FORTIFY
INHIBITOR
1.q111r.
11.
Pitlagif
SOLUTION
l'
i L.,
RUN
il,t 4
it
Iiioi
'
VII
t.41...m.nrwhow1111
I
*11PuAi RUN 125120
IIIIII1111111111lMllIlllUN 12
111111111111111111111111111110111M
400
300
20
10
1 10 15 20SEPTEMBER 1983
26
20
10
0
I. .,
IIMIP11116*111i
1
RUNRUN
'.
125124
N.s
'SYSTEM FLOW RATES - OCTOBER 1983 ; 1
RUN
RUN
I
132
133.----I
-3I0 SLOWDOWN A FORTIFY SOLUTION
ii
0 CITY
I
.1
I
'.41111i
WATER
0
\
1
EVAPORATION
1
III
JP
POWER DOWN
II
INHIBITO
Ilt
I il
11
111
I
I
I
lir
el
I
Ig
II
I
I
' 9iO4
RUN
lialApo
I.
. .
I ie. I
I
Ill
IN
RUN-1131
RUN 129UIIRUN 130
I1 5 10 15 20
OCTOBER 198325
20
10
278
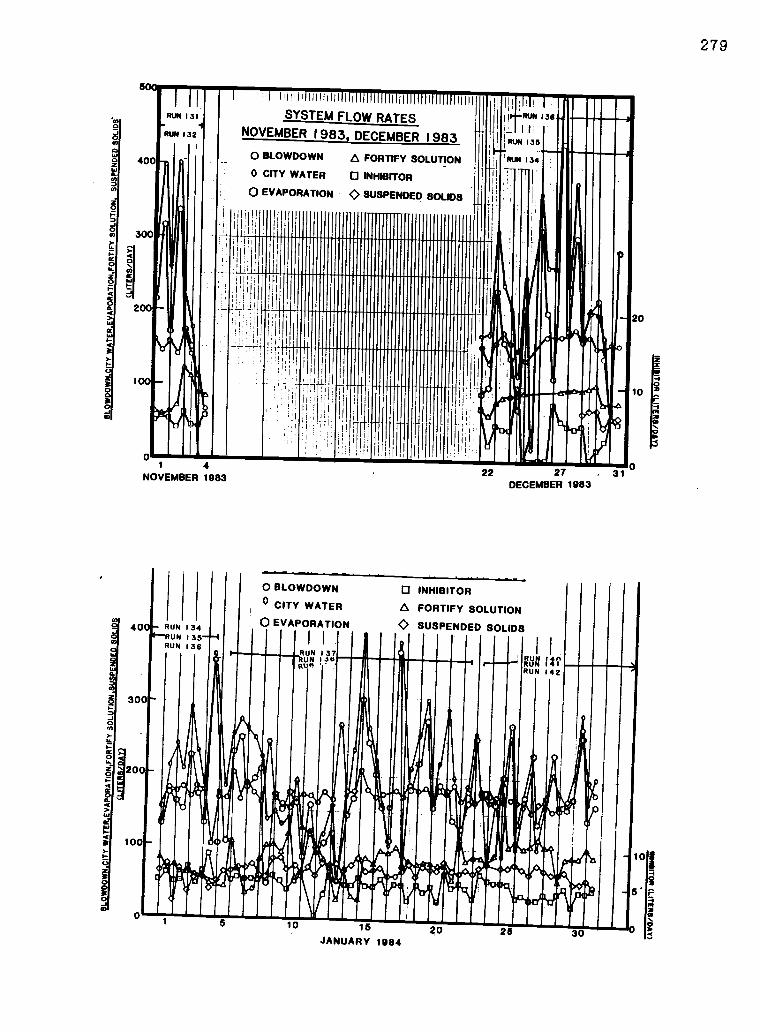
Iii,.111111iffilf1111111111111111111111111111111111111
SYSTEM FLOW RATESNOVEMBER 1983, DECEMBER 1983
0 SLOWDOWN
0 CITY WATER
0 EVAPORATION
4NOVEMBER 1983
40
30
2
100
A FORTIFY SOLUTION
INHIBITOR
0 SUSPENDED SOLIDS
. 31022 27DECEMBER 1983
- RUNIRUN
RUN
1
1.
134135136
.
O
°0
SLOWDOWN
CITY
EVAPORATION
WATER
RUN
I
1371.50
1
INHIBITOR
A FORTIFY
0 SUSPENDEDSOLUTION
SOLIDS
:'":'I
AlRUN
I
I
It?142
?
.
.i.d; ,ii..
.
.
UNRUN
"
:,. oito
,
ki,
.
1 5 10 15
JANUARY 198420 30
0
279
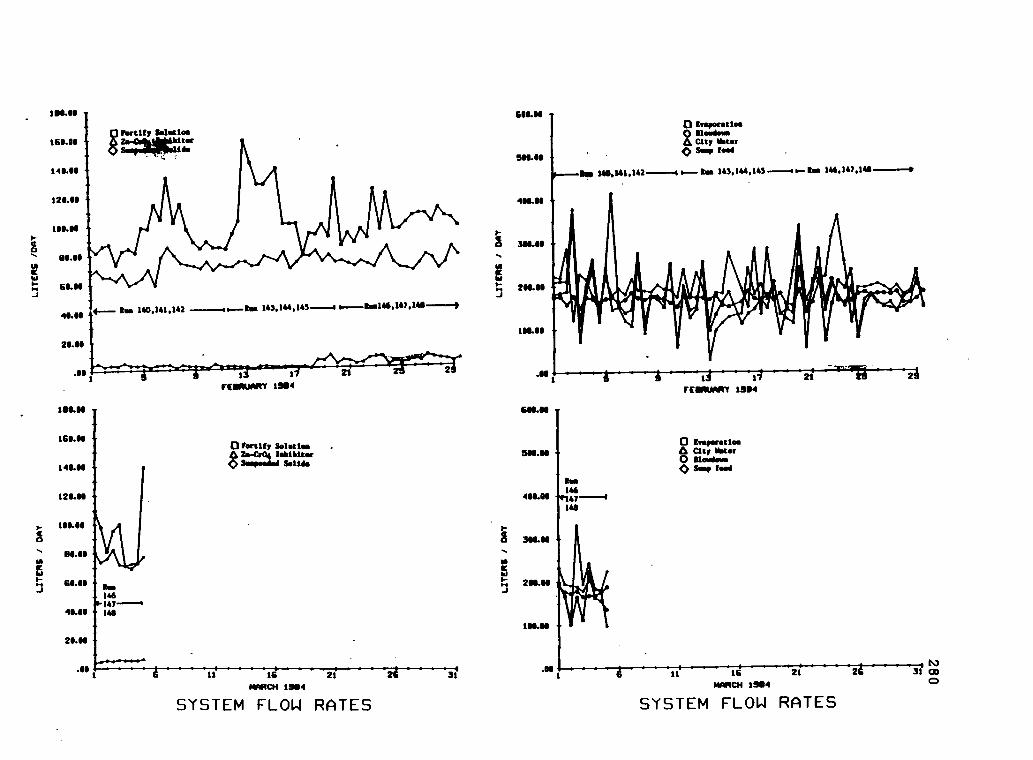
Fortify Solsticefore s
4---- Rue 140.141.142 .--Sos 143.144.143--1
rteaumeT 1994
['Fortify Solutionlehibiter2s-Or040 Isti Solids
SYSTEM FLOW RATES
31
ISLOI -O Rwsperstioe
ou..+...City Vow
MOMSump food
1---11ye 140.141.142-----ss los 143,144.145 46 RIM 146.147.141.1
IFESSUARY 1904
O SveyorsticoQ fat, literO Sloriew0 Sump hod
SYSTEM FLOW RATES
31 COO
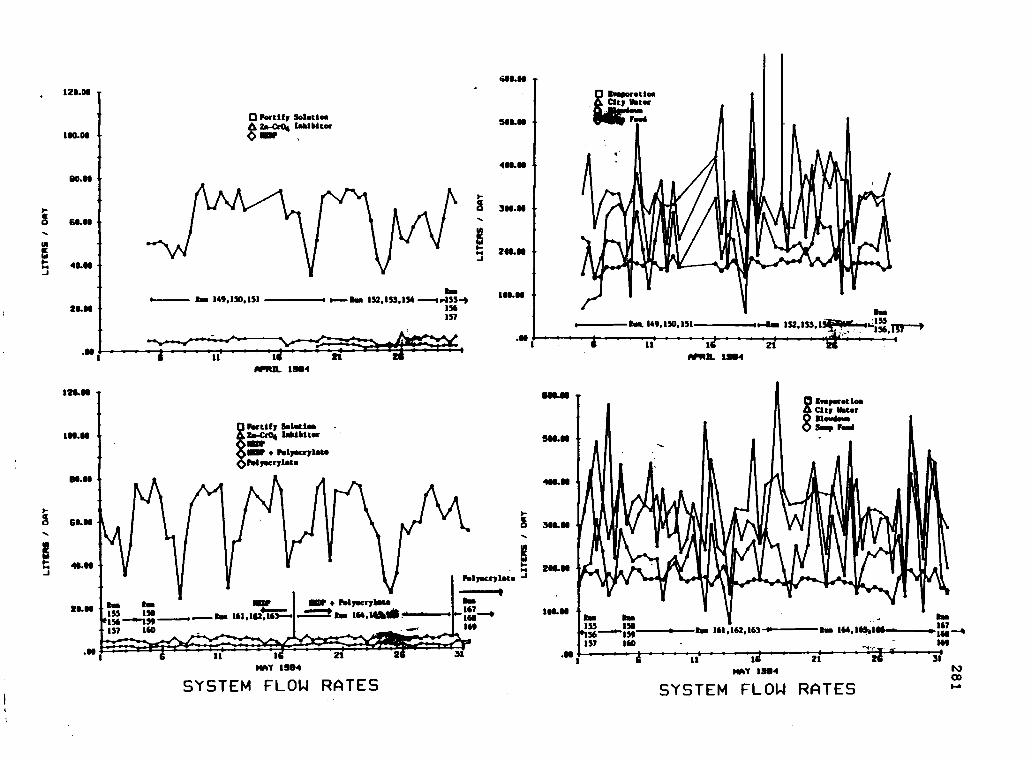
prettify Solstice
87A-Cr04 Inhibitor1031
ass 149,130.151 Roe 152,153,154 --1r155-0156157
1211.66 -
UM
21.11
1
APRIL 1304
irectify Soletioe2e-Ct04 lektitot1161211112 Pelyecryleterellecrylets
SUMaveporstioeCity *AarBlew....sump Food
osolous
MA am155 156136 "x'159157 160
ass 161,1112.16.3--.
11
MAY 13114
SYSTEM FLOW RATES
MI I
Ise67
Aso 161,162.163 164.1401,11111 IM 9169
a 11
MAY 1311421
SYSTEM FLOW RATES
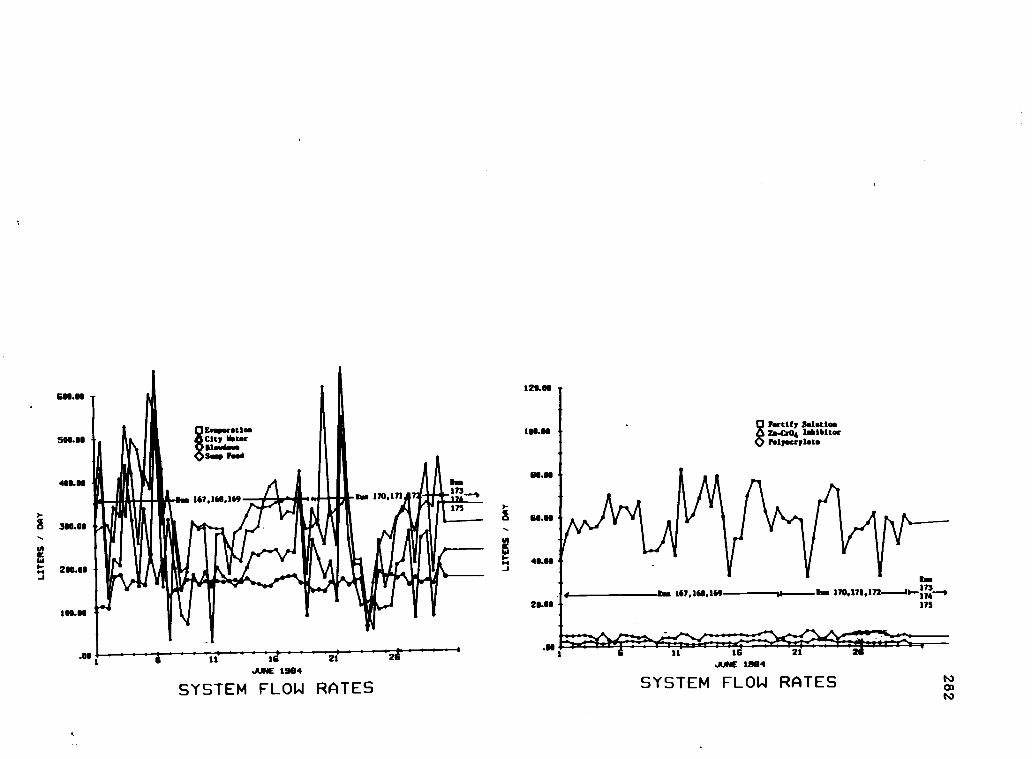
COLN
506.88
486.96
300.00
200.00
100.96
.00
1
EvaporationCity WaterSloodounSump Food
JUNE 1904
SYSTEM FLOW RATES
121488
160.68
08.811
68.68
48.08
MU
gFortify SolotioaEa.404 InhibitorFolyscrylate
7-/Roo
tos 167.168.169 Rum 170.171,172173
/--174"173
.9811 1 21
JUNE 1904
SYSTEM FLOW RATES
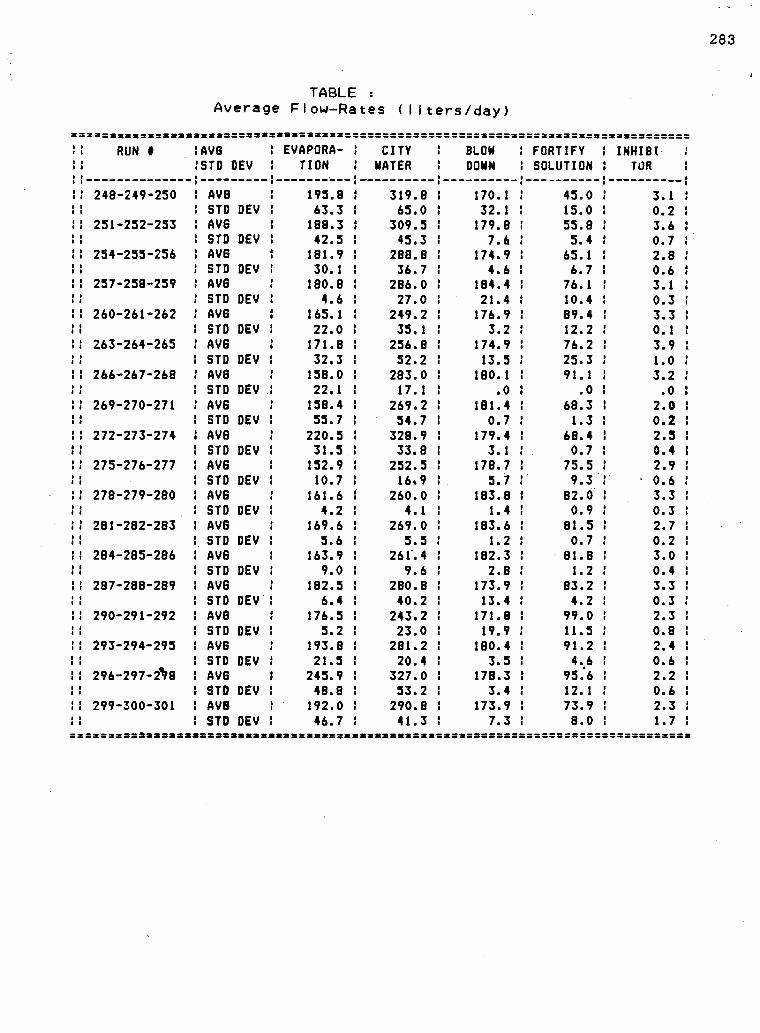
TABLE :
Average Flow-Rates /liters /day)
_= 2......========I RUN I :AVG I EVAPORA- 1 CITY BLOW I FORTIFY 1 INHIBI1 1 :STD DEV 1 TION 1 WATER DOWN 1 SOLUTION TOR11 1
1: 248-249-250 AV8 1 195.8 1 319.8 170.1 1 45.0 3.11 STD DEV 1 63.3 1 65.0 32.1 1 15.0 1 0.211 251-252-253 AVG 188.3 1 309.5 179.8 I 55.8 3.61 11 1 STD DEV 42.5 1 45.3 7.6 1 5.4 1 0.711 254-255-256 AVG 181.9 1 288.8 174.9 1 65.1 1 2.81 I1 1 STD DEV 30.1 1 36.7 4.6 1 6.7 1 0.611 257 -258 -259 AVG 180.8 1 286.0 184.4 1 76.1 1 3.11 11 1 STD DEV 4.6 1 27.0 21.4 1 10.4 1 0.31: 260-261-262 AVG 165.1 1 249.2 176.9 1 89.4 1 3.3
STD DEV 1 22.0 : 35.1 3.2 1 12.2 1 0.1
11 263-264-265 AV6 171.8 1 256.8 174.9 1 76.2 1 3.91: STD DEV : 32.3 52.2 13.5 I 25.3 I 1.011 266-267-268 AVG 158.0 : 283.0 180.1 1 91.1 1 3.21: STD DEV 1 22.1 : 17.1 .0 I .0 .0
1: 269-270-271 AVG 158.4 1 269.2 181.4 1 68.3 1 2.0O
11
1 STD DEV 1 55.7 1 54.7 0.7 1 1.3 1 0.21: 272-273-274 AVG 220.5 1 328.9 179.4 1 68.4 I 2.51: STD DEV 1 31.5 1 33.8 3.1 1 0.7 1 0.411 275-276-277 AVG 152.9 1 252.5 178.7 1 75.5 1 2.9
STD DEV 1 10.7 1 16.9 5.7 : 9.3 1 0.611 278-279-280 AVG 161.6 260.0 183.8 1 82.0 1 3.3
STD DEV 1 4.2 : 4.1 1.4 1 0.9 1 0.311 281-282-283 AV8 169.6 269.0 183.6 1 81.5 1 2.7
STD DEV 5.6 1 5.5 1.2 1 0.7 1 0.2If 284-285-286 AVG 163.9 1 261.4 182.3 1 81.8 1 3.0
STD DEV 1 9.0 : 9.6 2.8 1 1.2 I 0.41: 287-288-289 AVG 1 182.5 1 280.8 173.9 1 83.2 1 3.3
STD DEV 1 6.4 1 40.2 13.4 1 4.2 1 0.3290-291-292 AVG 1 176.5 1 243.2 171.8 I 99.0 1 2.3
STD DEV 5.2 1 23.0 19.9 1 11.5 I 0.811 293-294-295 AV6 193.8 1 281.2 180.4 1 91.2 1 2.4
STD DEV 1 21.5 1 20.4 3.5 1 4.6 0.611 296-297-A8 AVG 245.9 1 327.0 178.3 1 95.6 1 2.2
STD DEV 1 48.8 1 53.2 3.4 1 12.1 1 0.6:: 299-300-301 AV8 1 192.0 1 290.8 173.9 1 73.9 1 2.3
STD DEV 1 46.7 1 41.3 7.3 1 8.0 1 1.7=-Maznamsms= ===== sum= =a 5=2
283
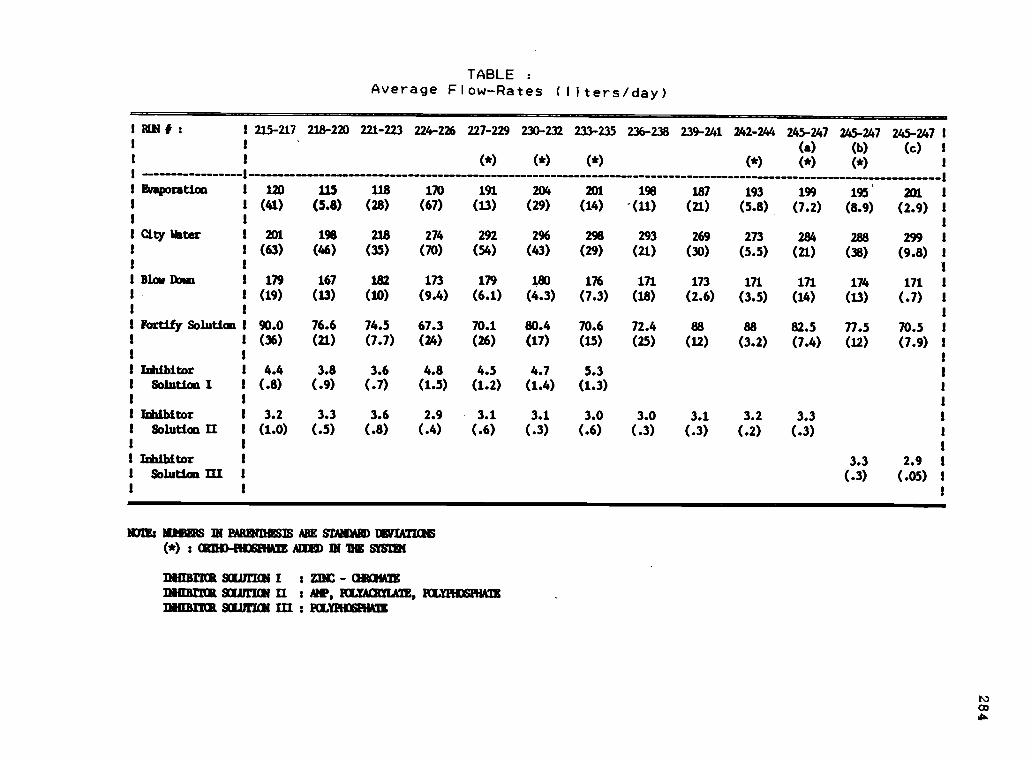
TABLE :
Average Flow-Rates (liters/day)
1 RUN # : 1
1 1
215-217 218-220 221-223 224-226 227-229 230-232 233-235 236-238 239-241 242-244 245-247
(a)
245-247
(b)
245-247 1
(c) i
1 1 (*) (*) (*) (*) (*) (*) 1
1 1 -11 Evaporation 1 120 115 118 170 191 204 201 198 187 193 199 195 201 1
1 1 (41) (5.8) (28) (67) (13) (29) (14) -(11) (21) (5.8) (7.2) (8.9) (2.9) 1
1 11
1 City *ter 1 201 198 218 274 292 296 298 293 269 273 284 288 299 1
1 1 (63) (46) (35) (70) (54) (43) (29) (21) (30) (5.5) (21) (38) (9.8) I
I I i1 Blow Down 1 179 167 182 173 179 180 176 171 173 171 171 174 171 1
1 1 (19) (13) (10) (9.4) (6.1) (4.3) (7.3) (18) (2.6) (3.5) (14) (13) (.7) 1
1 11
1 Fortify Solution 1 90.0 76.6 74.5 67.3 70.1 80.4 70.6 72.4 88 88 82.5 77.5 70.5 1
1 1 (36) (21) (7.7) (24) (26) (17) (15) (25) (12) (3.2) (7.4) (12) (7.9) 1
1 1 1
1 Inhibitor 1 4.4 3.8 3.6 4.8 4.5 4.7 5.3 1
1 Solution I 1 (.8) (.9) (.7) (1.5) (1.2) (1.4) (1.3) 1
I 1 I
1 Inhibitor 1 3.2 3.3 3.6 2.9 3.1 3.1 3.0 3.0 3.1 3.2 3.3 :
t Solution II 1 (1.0) (.5) (.8) (.4) (.6) (.3) (.6) (.3) (.3) (.2) (.3) 1
1 1 1
1 Inhibitor 1 3.3 2.9 1
1 Solution III 1 (.3) (.05) 1
1 1 1
awe: NUMBERS DI PARINI:HMS ARE STAMM Eig/IATIMIS
(*) CRI/114112SPHA3E =ED 111 I SYSTEM
manta scurriau : ZJIC - CHROMATE
DUMB* sowrum II : me, KLYAMIATE, BIYEIDSPHATEMTh= SOLUITCH III : POLYPHOSPHATE
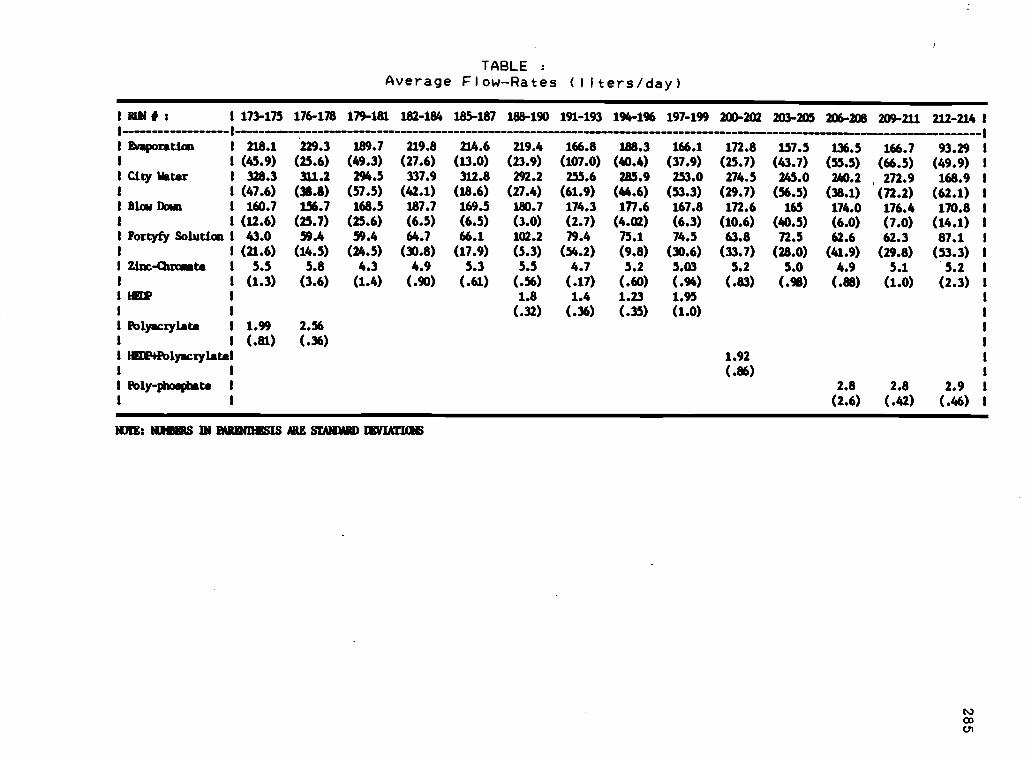
TABLE :
Average Flow-Rates (liters/day)
1 RUN # : 1 173-175 176-178 179-181 182-184 185-187 188-190 191-193 194-196 197-199 200-202 203-205 206-208 209-211 212-214 1
1 -1 1
1 Evaporation 1 218.1 229.3 189.7 219.8 214.6 219.4 166.8 188.3 166.1 172.8 157.5 136.5 166.7 93.29 1
1 1 (45.9) (25.6) (49.3) (27.6) (13.0) (23.9) (107.0) (40.4) (37.9) (25.7) (43.7) (55.5) (66.5) (49.9) 1
1 City Water 1 328.3 311.2 294.5 337.9 312.8 292.2 255.6 285.9 253.0 274.5 245.0 240.2 272.9 168.9 1
1 1 (47.6) (38.8) (57.5) (42.1) (18.6) (27.4) (61.9) (44.6) (53.3) (29.7) (56.5) (38.1) (72.2) (62.1) 1
1 Blow Down 1 160.7 156.7 168.5 187.7 169.5 180.7 174.3 177.6 167.8 172.6 165 174.0 176.4 170.8 1
1 1 (12.6) (25.7) (25.6) (6.5) (6.5) (3.0) (2.7) (4.02) (6.3) (10.6) (40.5) (6.0) (7.0) (14.1) 1
1 Fortyfy Solution 1 43.0 59.4 59.4 64.7 66.1 102.2 79.4 75.1 74.5 63.8 72.5 62.6 62.3 87.1 1
1 1 (21.6) (14.5) (24.5) (30.8) (17.9) (5.3) (54.2) (9.8) (30.6) (33.7) (28.0) (41.9) (29.8) (53.3) 1
1 Zinc-Chromate 1 5.5 5.8 4.3 4.9 5.3 5.5 4.7 5.2 5.03 5.2 5.0 4.9 5.1 5.2 1
1 1 (1.3) (3.6) (1.4) (.90) (.61) (.56) (.17) (.60) (.94) (.83) (.98) (.88) (1.0) (2.3) 1
HIEP 1.8 1.4 1.23 1.95 1
1 1 (.32) (.36) (.35) (1.0) 1
1 Polyacrylate 1 1.99 2.56
I (.81) (.36)
1 HEDE4Polyacrylatel 1.92
1 (.86)
1 Foly-phosphate 1 2.8 2.8 2.9 1
1 1 (2.6) (.42) (.46) 1
NNE: RISERS IN Beirmans ARE SWORD EIVIATIGIS

286
APPENDIX L
SUMMARY OF RUN STATISTICS
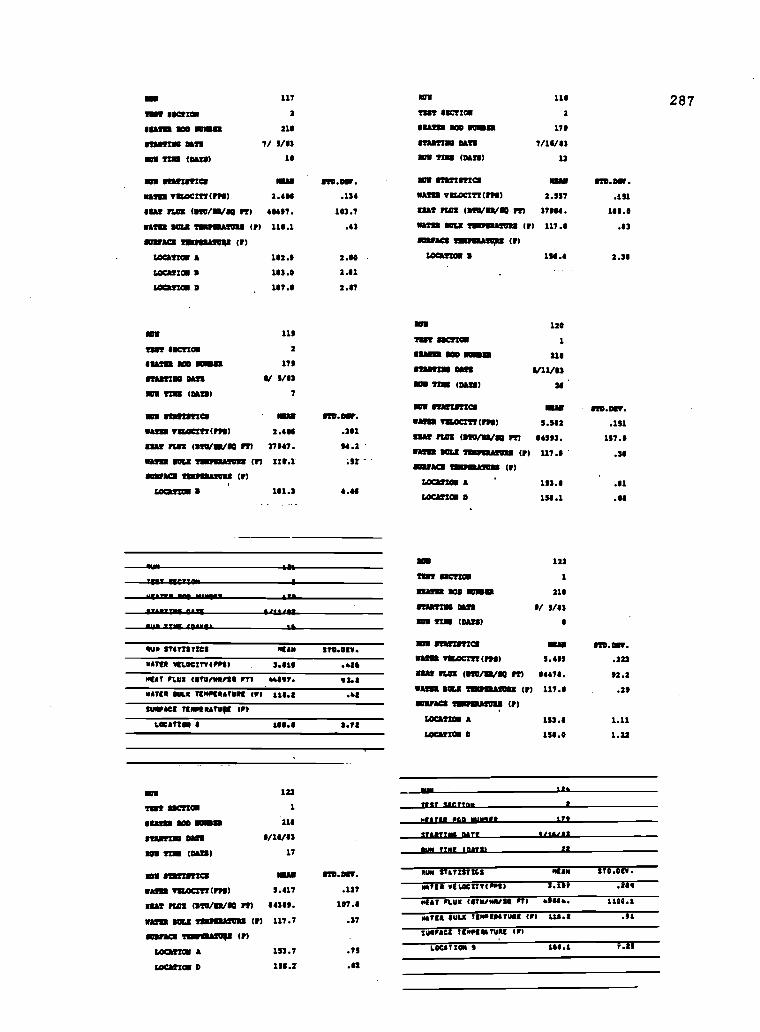
NNE
TOT SUCTION
RATR 800 OMR
117
2
214
STUTINS DAR 7/ 5/43
ION TIN, 01118) 10
NIT VITRUSIC8 MAN 810.0,f.
MARI TOLOCITT(PPS) 2.416 .134
ISAT ULM (810/0/10 rT) 44447. 103.7
MAST SOLE TINIPOATIIII (V) 114.1 .43
813111140mnamoin(T)
LOCATION A 142.4 2.68
LOCATION 8 143.0 1.61
LOCATION 0 147.4 2.87
114
TINT RCM= 2
1811111 DOD MOM= 179
STARING OATS 4/ 5/43
SOU TINS (DAIS) 7
SOO STATISTICS NOIN surarrr.
WARM TULOCITT(111) 2.444 .261
11841 rum 011U/W4/40 391 27447. 114.2
NATO SOLE 111112410111 (T) 111.1
802140 IMPERATUNS (r)
LOCATIONS 141.3 4.44
Mt' 41^.10
usAvirm sq. .mwar. Aga
ot.eg 4'31'71
MAY TIOIL swim's
TAP STATISTIZI 0040 Mont.rATIR 911.0CZTY419111 3.811 .016RUT PLUS IIITV/14/10 F71 4481T. 934
0061 TINOTRATIOR 114.2 .41
1101ACI TINPRATUR DTI
LOCATION 5 08.8 1.71
123
MT IMMO 1
MAU WO NORM 214
RAM= DM 0/18/83
ON TINE (DAIS) 17
ION !CIRRI= NRAN 810.0111.
NAM vsLocrrrtr,6) 3.417 .137
RAT 11,02 (PTO /WO RI 44344. 107.6
NATO SOLIE TIONNATOR4 (1) 117.7 .37
RATA= TINTININITIR (r)
LOCATION A 113.7 .75
LOCATION 0 136.1 .82
SON 114
TUT SIMI= 2
RATON NOD NOONAN 179
11211I/0 OATS 7/14/43
NON TINS (DAIS) 13
ON STATISTICS MOAN ST0.011.
RIR TILOCITT(R8) 2.557 ./11
RAT ROI (810/11/10 /T) 37004. 141.0
TAM PULL roussiumas MI 117.8 .63
00111910 TRIPUILARINS
LOCATION 8 158.4 2.34
Nil
MST SOCRON
181210 SOD NORIO
120
1
214
STASI= OATS $111/83
ION TINS (DAIS) u'
80011124111171C11 MAN STILOW.
TAM VOLOCI11(111) 5.542 .131
RAT ROI (010/111/103 IT) 44543. 117.1
WARS 80L1 ISMORATONS (PI 117.4 .34
OMAR IIMPINASONS (t)
LOCATION A 133.4 .11
LOCATION 0 134.4 .88
NON 122
1241 ACTIONS 1
NIASOR NOD MOM 211
nue= OATS 9/ 5/43
ON TINS (OATS) 4
ON STATUTICS NUN 419.240.
NAIR vuocierom) 5.445 .223
RAT RAI (810/118/80 IV) 44474. 92.2
MASS POLL INNONDATOOS (In 117.1 .24
=M 1111111111A7011 (V)
LOCATION A 153.4 1.11
LOCATION 0 154.4 1.22
BUM it&
110? 2222TOM
MITATTE AGO MU0122
AAAAA TMS OAT,
MIN TIM 'tarsi
its
2/116/112
22
Rum 92ATIITIG1 NIAN
uOTtA 9110CI77(11111) 3.19?
MOAT FLUX (liTU/NM10 Fr) 41444.
oaten lull TENRCRATORC 138.1
suovAog 7(401447u411 (F)
LOCATION 9 114.1 7.24
287
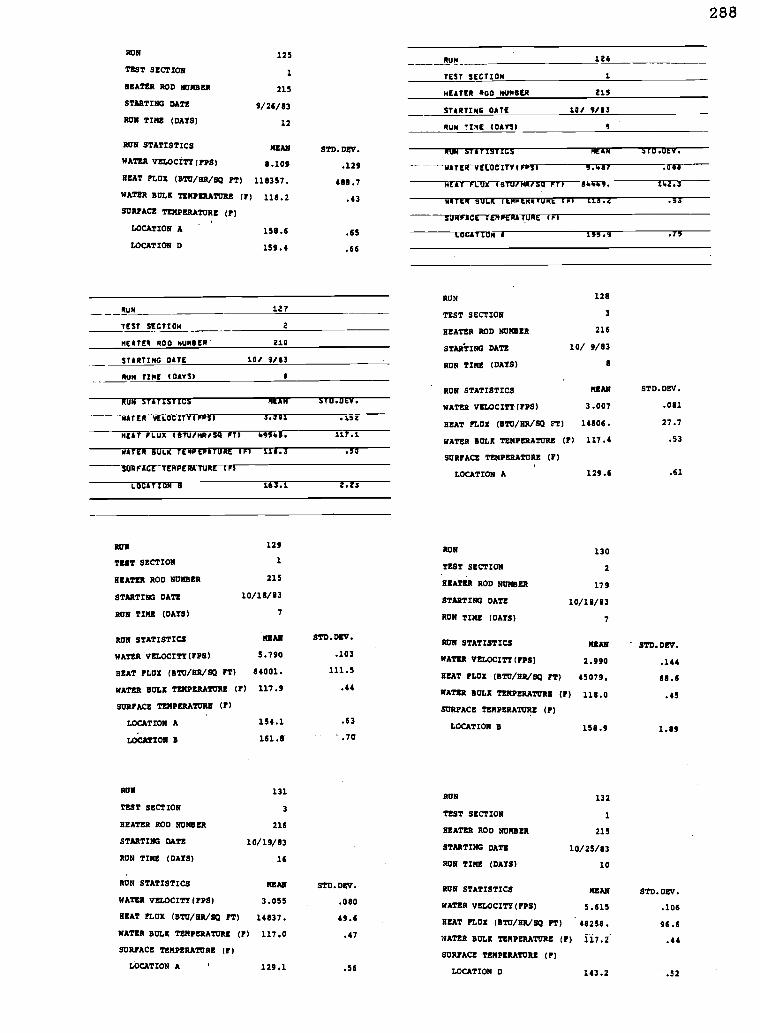
RUN 125LRum 126
TEST SECTION 1 TEST SECTION 1
BEATER ROD NUMBER 215 HEATER 300 NUMBER 215
STARTING DATE 9/26/83STARTING DATE 10/ 9/83
RUN TIME (DAYS) 12 RUN TINE (OATS)
RUN STATISTICS MEAN STD.DEV. Rum STATISTICS MEAN 5ToOEllWATER VELOCITY(FPS) 8.109 .129 ------WArERWETOCITY(Fry) 5.487 .arr-----
BEAT FLUX (BTU/RR/so FT) 118357. 488.7 MEAT-FIWIRTUTHR/sfa FT) 54449. 142.3
WATER BULK TEMPERATURE (F) 118.2 .43 WAY . R SULK ItRPARATuRA (F) 115.
SURFACE TEMPERATURE (r)suRFACE-TERFERATuRE (71
LOCATION A 150.6 .65 LOCATION A 1555 .7S
LOCATION D 159.4 .66
RUN 127
TEST SECTION 2
NEATER ROD NURSER' 2111
STARTING GATE 10/ 9/83
RUN TIME (OATS)
RUN STATISTICS MEAN ..TIOOEV
itfr6-5E1-0CrITUFM3) 5-.5111 .152
HEAT FLUX (eTu/NR/Scl FT) 49545. 117.1
WATER BULK TEN EmATU E 118.3 .5)
SURFACE-THRPEAKTURE (F)
LOCATION El 163.1 2.23
RUN 129
TEST SECTION 1
HEATER ROD NUMBER 215
STARTING DATE 10/18/83
RUN TIME (DAYS) 7
RUN STATISTICS
WATER VELOCITY(PPS)
BEAT FLUX (BTU/RR/SO PT)
WATER BULK TEMPERATURE (F)
SURFACE TEMPERATURE (F)
LOCATION A
LOCATIONS
MEAN STD.DEV.
5.790 .103
84001. 111.5
117.9 .44
154.1
161.8
RON 131
TEST SECTION 3
HEATER ROD NUMBER 216
STARTING DATE 10/19/83
RUN TINE (DAYS) 16
.63
.70
RUN STATISTICS NEAR STD.DEV.
WATER VELOCITY(PPS) 3.055 .080
HEAT FLUX (STU/SR/SG PT) 14837. 49.6
WATER BULK TEMPERATURE (F) 117.0 .47
SURFACE TEMPERATURE (P)
LOCATION A ' 129.1 .56
RUN
TEST SECTION
HEATER ROD NUMBER
STARTING DATE
RUN TIRE (DAYS)
128
3
216
10/ 9/83
8
RUN STATISTICS
WATER VELOCITY(PPS)
BEAT FLUX (320/83/93 FT)
WATER BULK TEMPERATURE (F)
SURFACE TEMPERATURE (F)
LOCATION A
MEAN STD.DEV.
3.007 .081
14806. 27.7
117.4 .53
129.6 .61
RUN 130
TEST SECTION 2
BEATER ROD NUMBER 179
STARTING DATE 10/18/83
RUN TINE (DAYS) 7
RUN STATISTICS MIAS STD.DEV.
WATER VELOCITY(FPS) 2.990 .144
HEAT FLUX (BTU/ER/92 FT) 45079. 68.6
WATER BOLE TEMPERATURE (F) 118.0 .45
SURFACE TEMPERATURE (F)
LOCATION B 158.9 1.89
RUN 132
TEST SECTION 1
HEATER ROD NUMBER 215
STARTING DATE 10/25/83
RUN TIME (DAYS) 10
RUN STATISTICS MEAN STD.DEV.
WATER VELOCITY(PPS) 5.615 .106
HEAT FLUX (BTU /HA/so PT) 48258. 96.6
WATER BULK TEMPERATURE (F) 117.2 .44
SURFACE TEMPERATURE (F)
LOCATION D 143.2 .52
288
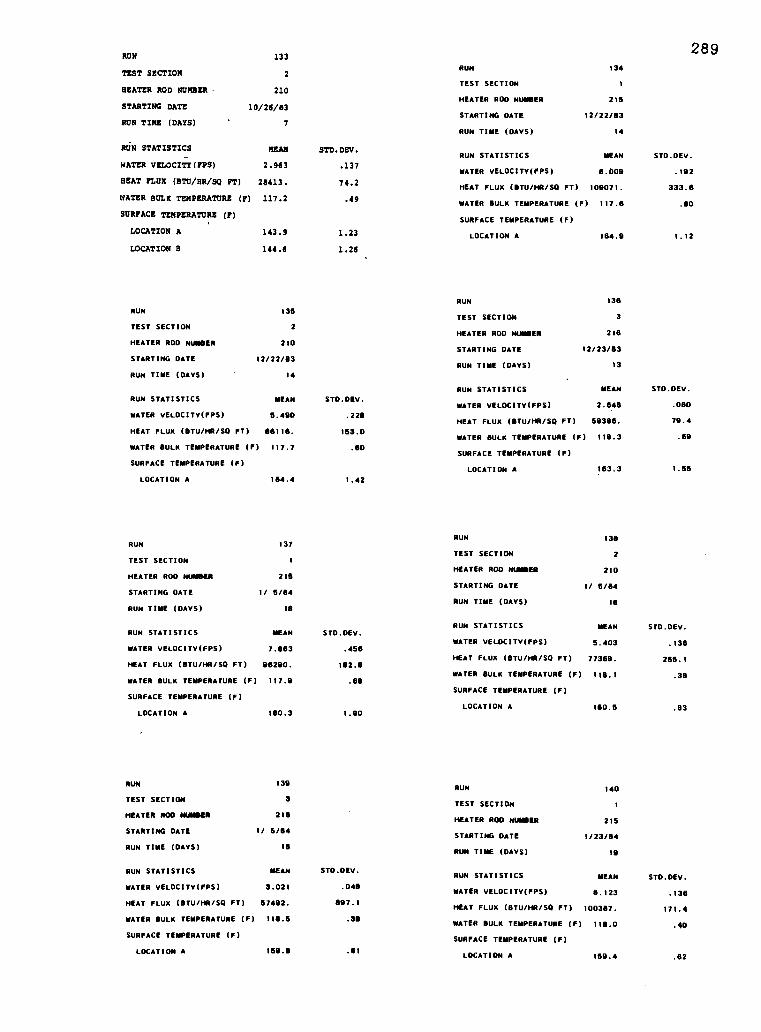
RUN 133
TEST SECTION 2
HEATER ROD NUMBER 210
STARTING DATE 10/26/83
RUN TIME (DAYS) 7
RON STATISTICS MEAN STD.DEV.
WATER VELOCITY(FPS) 2.963 .137
HEAT FLUX (BTU /HR /SQ PT) 28413. 74.2
WATER BULK TEMPERATURE (F) 117.2 .49
SURFACE TEMPERATURE (F)
LOCATION A 143.9 1.23
LOCATION 13 144.6 1.26
289RUN 134
TEST SECTION
HEATER ROD NUMBER 215
STARTING DATE 12/22/83
RUN TIME (DAYS) 14
RUN STATISTICS MEAN STO.DEV.
WATER VELOCITV(FPS) 8.009 .192
HEAT FLUX (ETU/HO/SO FT) 109071. 333.6
WATER BULK TEMPERATURE (F) 117.8 .80
SURFACE TEMPERATURE (F)
LOCATION A 164.9 1.12
RUN 138RUN 135
TEST SECTION 3
TEST SECTION 2HEATER ROO HUNGER 216
HEATER ROD NUMBER 210STARTING DATE 12/23/83
STARTING DATE 12/22/83RUN TIME (DAYS) 13
RUN TIME (DAYS) 14
RUN STATISTICS MEAN STD.DEV.RUN STATISTICS MEAN STD.DEV.
WATER VELOCITY(FPS) 2.648 .080
WATER VELOCITY(FPS) 5.490 .228HEAT FLUX (BTU/HR/S0 FT) 59388. 79.4
HEAT FLUX (BTU/HR/S0 FT) 66116. 153.0WATER BULK TEMPERATURE (f) 118.3 .89
WATER BULK TEMPERATURE (F) 117.7 .80SURFACE TEMPERATURE (F)
SURFACE TEMPERATURE (F)LOCATION A 163.3 1.55
LOCATION A 164.4 1.42
RUN 138RUN 137
TEST SECTION 2TEST SECTION 1
HEATER ROD NUMBER 210HEATER ROO NUMBER 215
STARTING DATE I/ 5/84STARTING DATE 1/ 5/84
RUN TIME (DAYS) 16RUN TIME (DAYS) 18
RUN STATISTICS MEAN STD.DEV.RUN STATISTICS MEAN STD.DEV.
WATER VELOCITY(FPS) 5.403 .138MATER VELOCITV(FPS) 7.883 .456
HEAT FLUX (BTU/HR/S0 FT) 77389. 255.1HEAT FLUX (BTU/HR/S0 FT) 96290. 182.8
WATER BULK TEMPERATURE (F) 118.1 .38WATER BULK TEMPERATURE (F) 117.9 .88
SURFACE TEMPERATURE (F)SURFACE TEMPERATURE (F)
LOCATION A 160.5 .83LOCATION A 180.3 1.90
RUN 139RUN 140
TEST SECTION 3TEST SECTION 1
HEATER ROD NUMBER 216HEATER ROO NUMBER 215
STARTING DATE 1/ 5/84STARTING DATE 1/23/84
RUN TIME (DAYS) 16RUN TIME (DAYS) 19
RUN STATISTICS MEAN STD.DEV.RUN STATISTICS MEAN STD.DEV.
WATER VELOCITV(FPS) 3.021 .048WATER VELOCITV(PPS) 8.123 .138
HEAT FLUX (OTU/HR/SQ FT) 57492. 897.1HEAT FLUX (BTU/HR/S0 FT) 100387. 171.4
WATER BULK TEMPERATURE (F) 118.5 .38WATER BULK TEMPERATURE (F) 116.0 .40
SURFACE TEMPERATURE (F) SURFACE TEMPERATURE (F)
LOCATION A 189.8 .81LOCATION A 159.4 .82
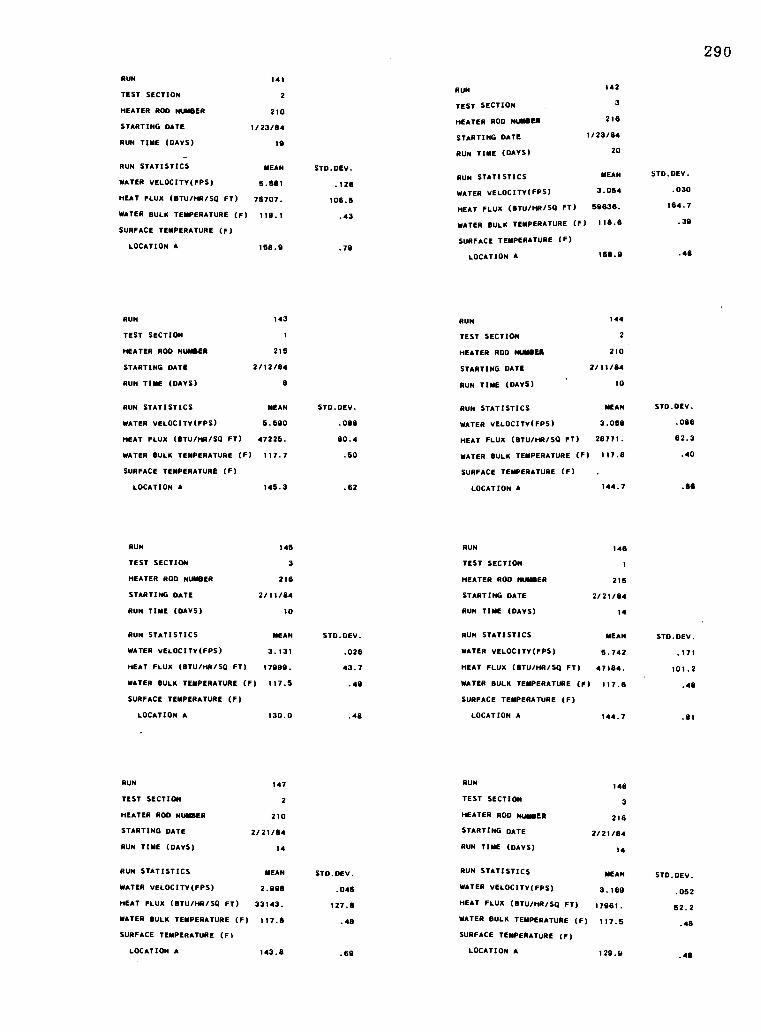
290RUN 141
RUN 142TEST SECTION 2
TEST SECTION 3HEATER ROD NUMBER 210
STARTING DATE 1/23/84HEATER ROD NUMBER 216
STARTING DATE 1/23/84RUN TIME (DAYS) 19
RUN TIME (DAYS) 20
RUN STATISTICS MEAN STD.DEV.RUN STATISTICS MEAN STD.DEV.
WATER VELOCITY(FPS) 5.581 .128WATER VELOCITV(FPS) 3.064 .030
HEAT FLUX (8TU/HR/SQ FT) 75707. 108.6HEAT FLUX (BTU /HR /SO FT) 59636. 184.7
WATER BULK TEMPERATURE (F) 118.1 .43WATER BULK TEMPERATURE (F) 118.6 .39
SURFACE TEMPERATURE (F)
LOCATION A 158.9 .79SURFACE TEMPERATURE (F)
LOCATION A 158.9 .411
RUN 143 RUN 144
TEST SECTION 1 TEST SECTION 2
HEATER ROO NUMBER 215 HEATER ROD NUMBER 210
STARTING DATE 2/12/84 STARTING DATE 2/11/64
RUN TIME (DAYS) 8 RUN TIME (DAYS) 10
RUN STATISTICS MEAN STD.DEV. RUN STATISTICS MEAN STD.DEV.
WATER VELOCITV(FPS) 5.590 .088 WATER VELOCITV(FPS) 3.058 .086
HEAT FLUX (BTU/HR/S0 FT) 47225. 80.4 HEAT FLUX (11TU/HR/SQ FT) 28771. 82.3
WATER BULK TEMPERATURE (F) 117.7 .50 WATER BULK TEMPERATURE (F) 117.8 .40
SURFACE TEMPERATURE (F) SURFACE TEMPERATURE (F)
LOCATION A 145.3 .62 LOCATION A 144.7 .86
RUN 145 RUN 148
TEST SECTION 3 TEST SECTION 1
HEATER ROD NUMBER 218 HEATER ROD NUMBER 215
STARTING DATE 2/11/84 STARTING DATE 2/21/84
RUN TIME (DAYS) 10 RUN TIME (DAYS) 14
RUN STATISTICS MEAN STD.DEV. RUN STATISTICS MEAN STD.DEV.
WATER VELOCITV(FPS) 3.131 .028 WATER VELOCITY(FPS) 5.742 .171
HEAT FLUX (8TU/HR/SQ FT) 17999. 43.7 HEAT FLUX (8TU/HR/SQ FT) 47184. 101.2
WATER BULK TEMPERATURE (F) 117.5 .49 WATER BULK TEMPERATURE (F) 117.6 .48
SURFACE TEMPERATURE (F) SURFACE TEMPERATURE (F)
LOCATION A 130.0 .48 LOCATION A 144.7 .81
RUN 147 RUN 148
TEST SECTION 2 TEST SECTION 3
HEATER ROD NUMBER 210 HEATER ROD NUMBER 218
STARTING DATE 2/21/84 STARTING DATE 2/21/84
RUN TIME (DAYS) 14 RUN TIME (DAYS) 14
RUN STATISTICS MEAN STD.DEV. RUN STATISTICS MEAN STO.DEV.
WATER VELOCITY(PPS) 2.998 .046 WATER VELOCITV(FPS) 3.189 .052
HEAT FLUX (6TU/HR/SQ FT) 33143. 127.8 HEAT FLUX (BTU/MR/SG FT) 17961. 62.2
WATER BULK TEMPERATURE (F) 117.8 .48 WATER BULK TEMPERATURE (F) 117.5 .48
SURFACE TEMPERATURE (F) SURFACE TEMPERATURE (F)
LOCATION A 143.8 .69 LOCATION A 129.9 .48
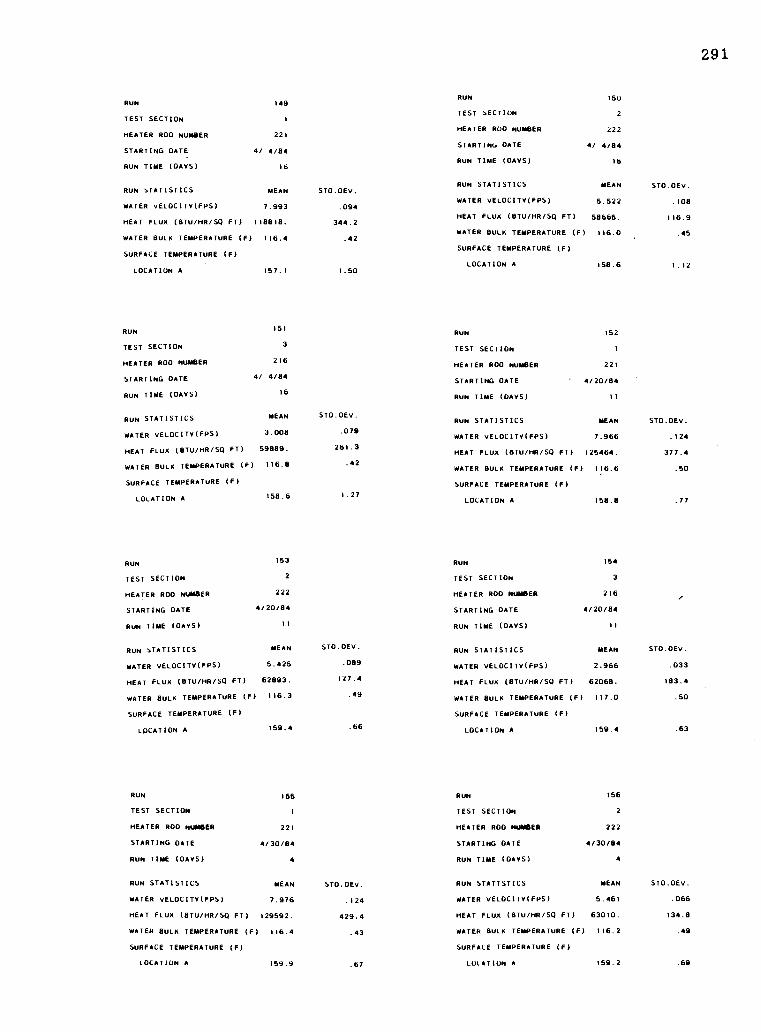
291
RUN 149
TEST SECTION
HEATER ROD NUMBER 221
STARTING DATE 4/ 4/84
RUN TIME (DAYS) lb
RUN STATISTICS MEAN STD.DEV.
WATER vELOCITV(EPS) 7.993 .094
HEAT FLUX (BTU /HR /SO FT) 118818. 344.2
WATER BULK TEMPERATURE (F) 116.4 .42
SURFACE TEMPERATURE (F)
LOCATION A 157.1 1.50
RUN
TEST SECTION
HEATER ROD NUMBER
STARTING DATE
RUN TIME (DAYS)
RUN STATISTICS
WATER VELOCITV(FPS)
HEAT FLUX (BTU/FIR/Sp FT)
WATER BULK TEMPERATURE (F)
SURFACE TEMPERATURE (F)
LOCATION A
RUN
TEST SECTION
HEATER ROD NUMBER
STARTING DATE
RUN TIME (DAYS)
151
3
216
4/ 4/84
16
MEAN STD.DEV.
3.008 .079
59889. 261.3
116.8 .42
158.6
153
2
222
4/20/84
11
1.27
RUN STATISTICS MEAN STD.DEV.
WATER VELOCITV(FPS) 5.425 .089
HEAT FLUX (BTU/MR/SO FT) 62893. 127.4
WATER BULK TEMPERATURE (F) 116.3 .49
SURFACE TEMPERATURE (F)
LOCATION A 159.4 .66
RUN 150
TEST SECTION 2
HEATER ROD NUMBER 222
STARTING DATE 4/ 4/84
RUN TIME (DAYS) 16
RUN STATISTICS MEAN STD.DEV.
WATER VELOCITV(FPS) 5.522 .108
HEAT FLUX (BTU /HR /SO FT) 58665. 116.9
WATER BULK TEMPERATURE (F) 116.0 .45
SURFACE TEMPERATURE (F)
LOCATION A 158.6 1.12
RUN 152
TEST SECTION 1
HEATER ROD NUMBER 221
STARTING DATE 4/20/84
RUN TIME (DAYS) 11
RUN STATISTICS MEAN STD.DEV.
WATER VELOCITY(FPS) 7.966 .124
HEAT FLUX (87))/HR/SO FT) 125464. 377.4
WATER BULK TEMPERATURE (F) 116.6 .50
SURFACE TEMPERATURE (F)
LOCATION A 158.8 .77
RUN 154
TEST SECTION 3
HEATER ROD NUMBER 216
STARTING DATE 4/20/64
RUN TIME (DAYS)
RUN STATISTICS MEAN STD.DEV.
WATER VELOCITV(FPS) 2.966 .033
HEAT FLUx (8TU/HR/SO FT) 62068. 183.4
WATER BULK TEMPERATURE (F) 117.0 .50
SURFACE TEMPERATURE (F)
LOCATION A 159.4 .63
RUN 155 RUN 156
TEST SECTION TEST SECTION 2
HEATER ROD NUMBER 221 HEATER ROD NUMBER 222
STARTING DATE 4/30/84 STARTING DATE 4/30/84
RUN TIME (DAYS) 4 RUN TIME (DAYS) 4
RUN STATISTICS MEAN STD.DEV. RUN STATISTICS MEAN STO.DEv.
WATER VELOCITY(FPS) 7.976 .124 WATER VELOCITV(FPS) 5.461 .066
HEAT FLUX (BTU /HR /SO FT) 129592. 429.4 HEAT FLUX (BTU /HR /SO FT) 63010. 134.8
WATER BULK TEMPERATURE (F) 116.4 .43 WATER BULK TEMPERATURE (F) 116.2 .49
SURFACE TEMPERATURE (F) SURFACE TEMPERATURE (F)
LOCATION A 159.9 .67 LOCATION A 159.2 .69
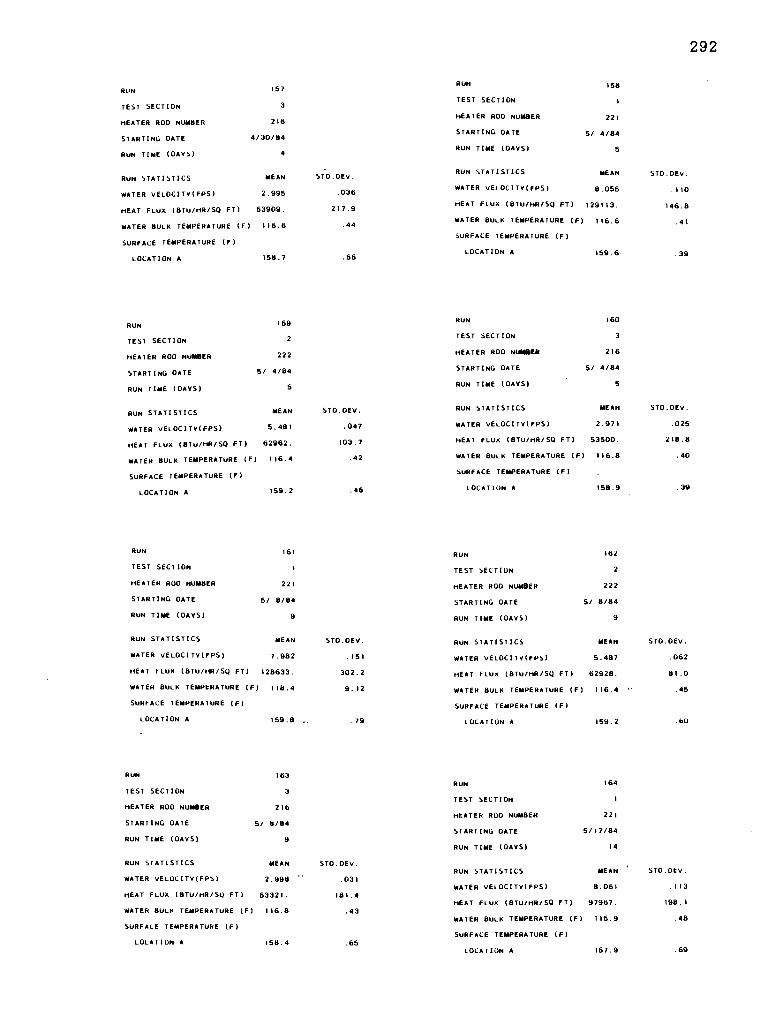
RUN
TEST SECTION
157
3
RUN 158
TEST SECTION
HEATER ROD NUMBER 216HEATER ROD NUMBER 221
STARTING DATE 4/30/84STARTING DATE 5/ 4/84
RUN TIME (DAYS) 4RUN TIME (DAYS) 5
RUN STATISTICS MEAN STD.DEV.RUN STATISTICS MEAN STD.DEV.
WATER VELOCITV(FPS) 2.995 .036WATER VELOCITY(FPS) 8.055 .110
HEAT FLUX (BTU/HR/SCI FT) 53909. 217.9HEAT FLUX (BTU/FIR/SO FT) 129113. 146.8
WATER BULK TEMPERATURE (F) 116.6 .44WATER BULK TEMPERATURE (F) 116.6 .41
SURFACE TEMPERATURE (F)SURFACE TEMPERATURE (F)
LOCATION A 158.7 .55LOCATION A 159.6 .39
RUN 159 RUN 160
TEST SECTION 2 TEST SECTION 3
HEATER ROD NUMBER 222 HEATER ROD MAIM& 216
STARTING DATE 5/ 4/84 STARTING DATE 5/ 4/84
RUN TIME (DAYS) 5 RUN TIME (DAYS) 5
RUN STATISTICS MEAN STD.DEV. RUN STATISTICS MEAN STD.DEV.
WATER vELOCITV(FPS) 5.481 .047 WATER VELOCITV(FPS) 2.971 .025
HEAT FLUX (BTU/HR/SCI FT) 62982. 103.7 HEAT FLUX (BTU /HR/S0 FT) 53500. 218.8
WATER BULK TEMPERATURE (F) 116.4 .42 WATER BULK TEMPERATURE (F) 116.8 .40
SURFACE TEMPERATURE (F)SURFACE TEMPERATURE (F)
LOCATION A 159.2 .48 LOCATION A 158.9 .39
RUN 16) RUN 162
TEST SECTION TEST SECTION 2
HEATER ROD NUMBER 22) HEATER ROD NUMBER 222
STARTING DATE 5/ 8/84 STARTING DATE 5/ 8/84
RUN TIME (DAYS) 9 RUN TIME (DAYS) 9
RUN STATISTICS MEAN STD.DEV. RUN STATISTICS MEAN STD.DEV.
WATER VELOCITY(FPS) 7.982 .151 WATER VELOCITY(FPS) 5.487 .062
HEAT FLUX (BTU /HR /SQ FT) 128633. 302.2 HEAT FLUX (BTU/MR/SO FT) 62928. 81.0
MATER BULK TEMPERATURE (F) 118.4 9.12 WATER BULK TEMPERATURE (F) 116.4 .45
SURFACE TEMPERATURE (F) SURFACE TEMPERATURE (F)
LOCATION A 159.8 ,. .79 LOCATION A 159.2 .80
RUN 163
TEST SECTION 3
HEATER ROD NUMBER 216
STARTING DATE 5/ 8/84
RUN TIME (DAYS)
RUN STATISTICS MEAN STD.DEV.
WATER VELOCITV(FPS) 2.998 .031
HEAT FLUX (87u/HR/S0 FT) 53321. 181.4
WATER BULK TEMPERATURE (F) 116.8 .43
SURFACE TEMPERATURE (F)
LOCATION A 158.4 .65
RUN 164
TEST SECTION
HEATER ROD NUMBER 221
STARTING DATE 5/17/84
RUN TIME (DAYS) 14
RUN STATISTICS MEAN STD.DEV.
WATER vELOCITV(FPS) 8.061 .113
HEAT FLUX (BTU/HR/SQ FT) 97967. 198.1
WATER BULK TEMPERATURE (F) 115.9 .48
SURFACE TEMPERATURE (F)
LOCATION A 157.9 .69
292
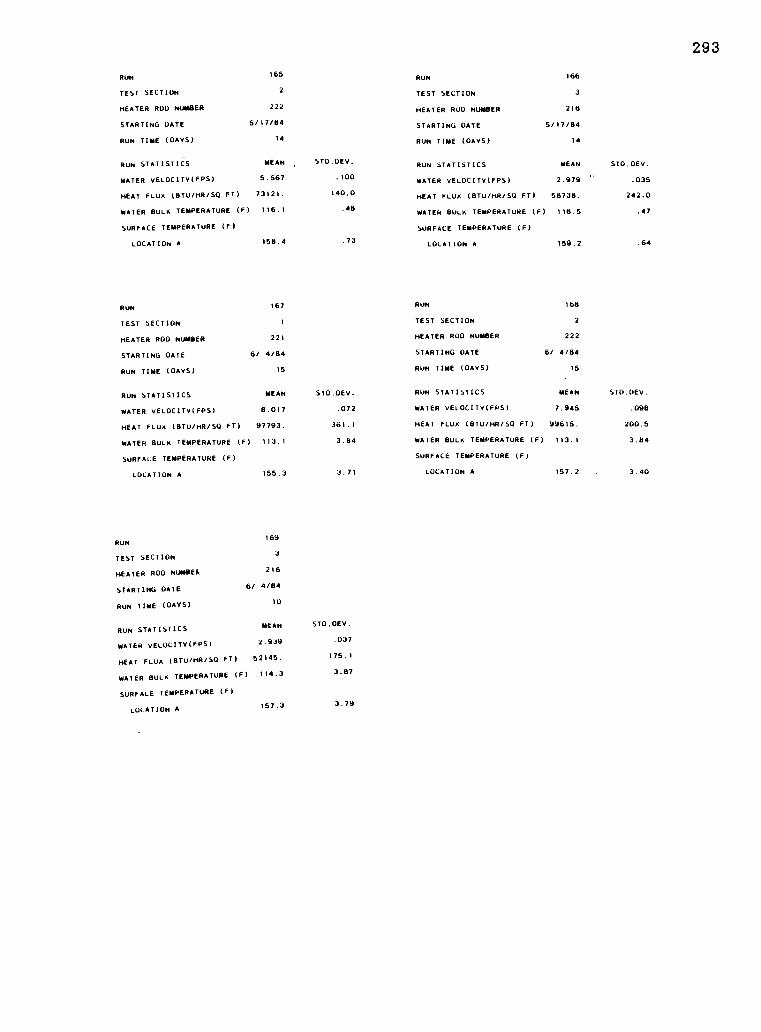
RUN 165
TEST SECTION 2
HEATER ROD NUMBER 222
STARTING DATE 5/17/84
RUN TIME (DAYS) 14
RUN STATISTICS MEAN
WATER VELOCITY(FPS) 5.567
HEAT FLUX (BTU/HR/SO FT) 73121.
WATER BULK TEMPERATURE (F) 116.1
SURFACE TEMPERATURE (F)
LOCATION A 158.4
RUN 167
TEST SECTION 1
HEATER ROD NUMBER 221
STARTING DATE 6/ 4/84
RUN TIME (DAYS) 15
RUN STATISTICS MEAN
STD.DEV.
.100
140.0
.48
.73
STD.DEV.
RUN 166
TEST SECTION 3
HEATER ROO NUMBER 216
STARTING DATE 5/17/84
RUN TIME (DAYS) 14
RUN STATISTICS MEAN
WATER VELOCITY(FPS) 2.979
HEAT FLUX (8TU /HR /SQ FT) 56738.
WATER BULK TEMPERATURE (F) 116.5
SURFACE TEMPERATURE (F)
LOCATION A 159.2
RUN 168
TEST SECTION 2
HEATER ROO NUMBER 222
STARTING DATE 6/ 4/84
RUN TIME (DAYS) 15
RUN STATISTICS MEAN
STO.DEv.
.035
242.0
.47
.64
STO.DEV.
WATER VELOCITY(FPS) 8.017 .072 WATER VELOCITY(FPS) 7.945 .098
HEAT FLux (8Tu/HR/S13 FT) 97793. 361.1 HEAT FLUX (BTU /HR/S0 FT) 99615. 200.5
WATER BULK TEMPERATURE (F) 113.1 3.84 WATER BULK TEMPERATURE (F) 113.1 3.84
SURFACE TEMPERATURE (F) SURFACE TEMPERATURE (F)
LOCATION A 155.3 3.71 LOCATION A 157.2 3.40
RUN
TEST SECTION
HEATER ROD NUMBER
STARTING DATE
RUN TIME (DAYS)
169
3
216
6/ 4/84
10
RUN STATISTICS MEAN
WATER VELOCITY(FPS) 2.939
HEAT FLUX (BTU /HR/S0 FT) 52145.
WATER BULK TEMPERATURE (F) 114.3
SURFACE TEMPERATURE (F)
LOCATION A 157.3
STO.DEV.
.037
175.1
3.87
3.79
293
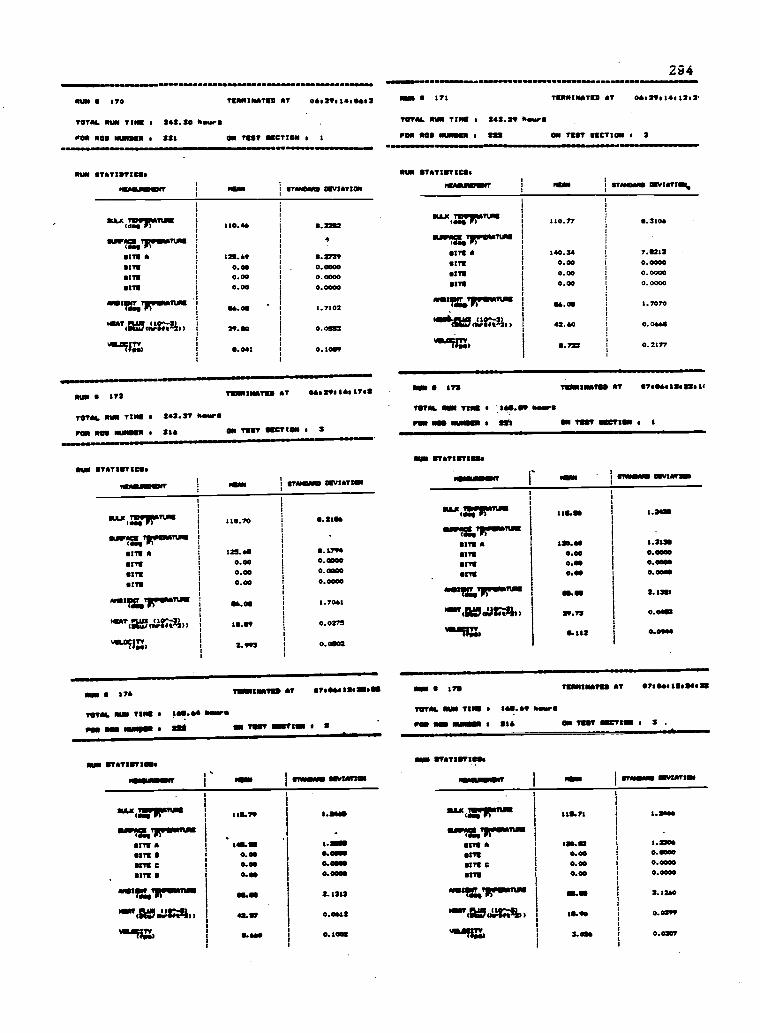
:7.
II°
It
II
I
Iill!
;r:4.38
11111
1P
:4,a:
II
till
!1
I4444
0!
!loosa
14
[L.1:::
011'1I
r
gi
IF I
aI
"MM
IIII.:44,3
N4
asass
sr
giaa
da
11"riIM
a F"cg
ifI/
,!Ill
i1
:446
44
I0
288804i4O
s2
N
rtiiiw
0 51I
1I
a
II
2
I
!
IIgg
Ig
didai
4
'1111
g1.2
4Z444
44
aSala
d I
11444
0
li[5
is : 0 a gc
:I
I1
II
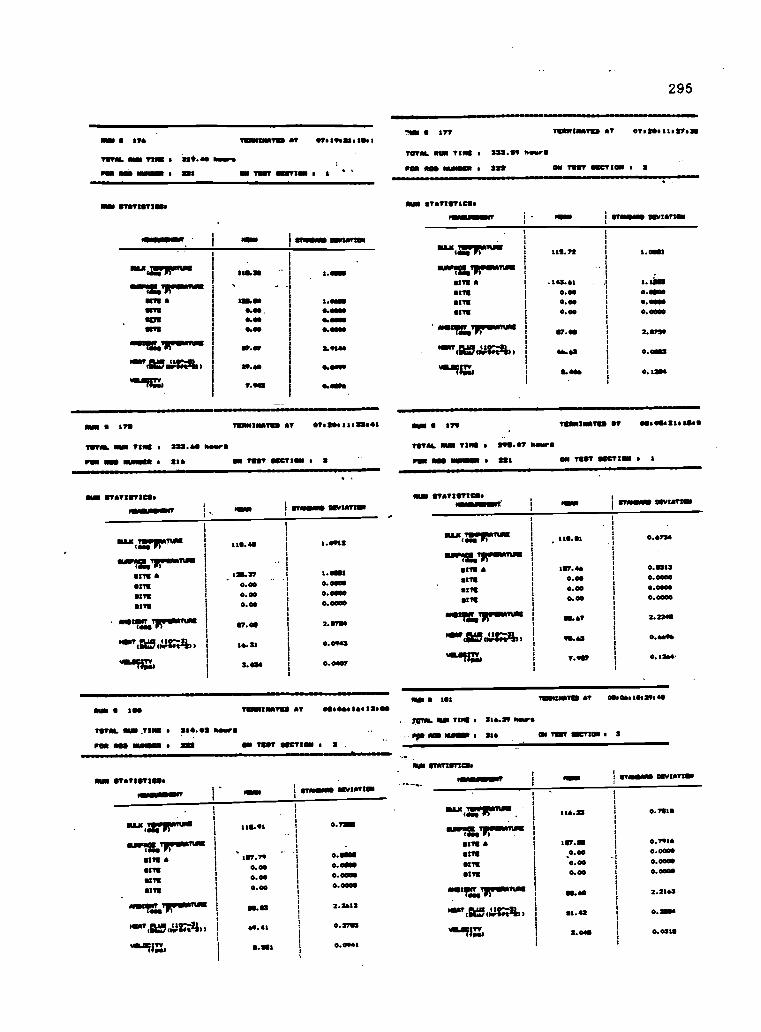
Et
I
11111 1
1!
:ass
as
gaaa
ii
a
11
1111
11
4444el
44
Nlite1444 g
gI
t1111
11
!
4OJOS
AS
sass
a
d
!CP
C.aR
4
18888
8a
daaa
Ci
A
I1 1111:1
4t
n
IaV
I!
d
1
;MI 1
1;
0000
A4
1888
2V
I
Cd.44
d4
crept!H
a
I
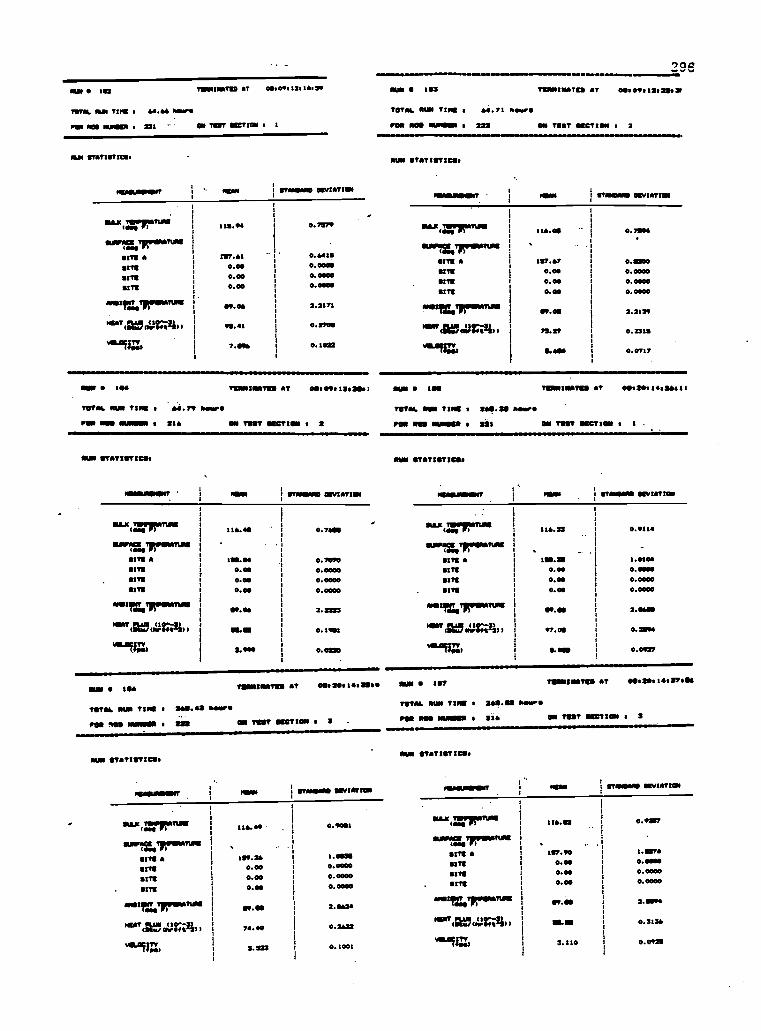
aa
1
MI 5
iJOSO
4
IA
:888
I
4044 i
ed
iaaa
5/
I4
4444
44
I
Izsss
s
rg
[.0
MV
raw;; r O
NI
aa
1I
'1111
I.Sec;
4d
8888
I8
idiz
if
; 4
1,errs
Urag::
MI
00 444
44
4
-----
8888
sI
i
d4
II
5IA
II
d
I
aa
.!
44444
44
4
I
8888 .8
8
I[1"I
I,
:5..:k
I OH
!! VN 0
i:
ai
III!
Z444
4
I
asss
Is
iaii
ti
4
d4
irreri120 i i i w
Ii
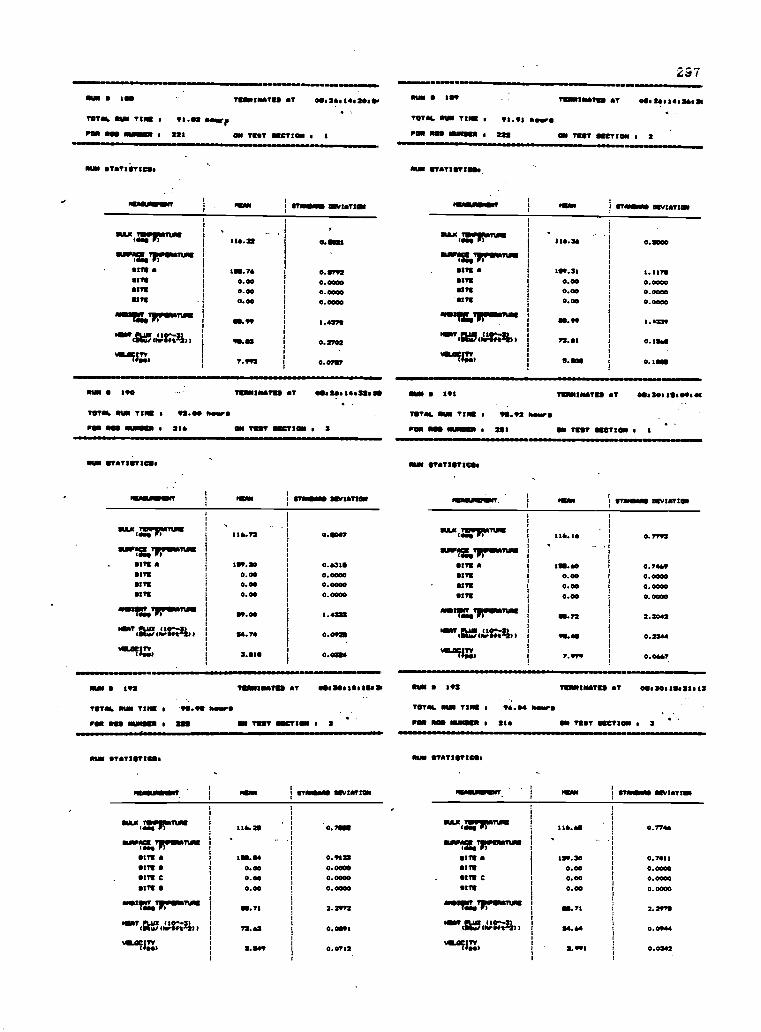
CV
I
1!III
I!
!.:444
j4
6
=kik
k=
re.
g
If
prey
Br as;f
r
MI 1 11
4664
j4
4
otos
t
0444
d
loscs:rI d
If
t!
I
a1I
c.
N
di
E1111
Ii
44444
44
I
3888
r3
E
A.4444
dd
ins
R
N
g
tS.
i
1;III
1 U 1
46664
j4
4
1(!li
8r
4$
a
11.
Ze
EI
I4
4444
44
4
I
1888
;2
I
!:e44
dx
4
I
1PIII
E'
4404
m4
1888
;:
si
0444
de
IL....
rus:
NI
t
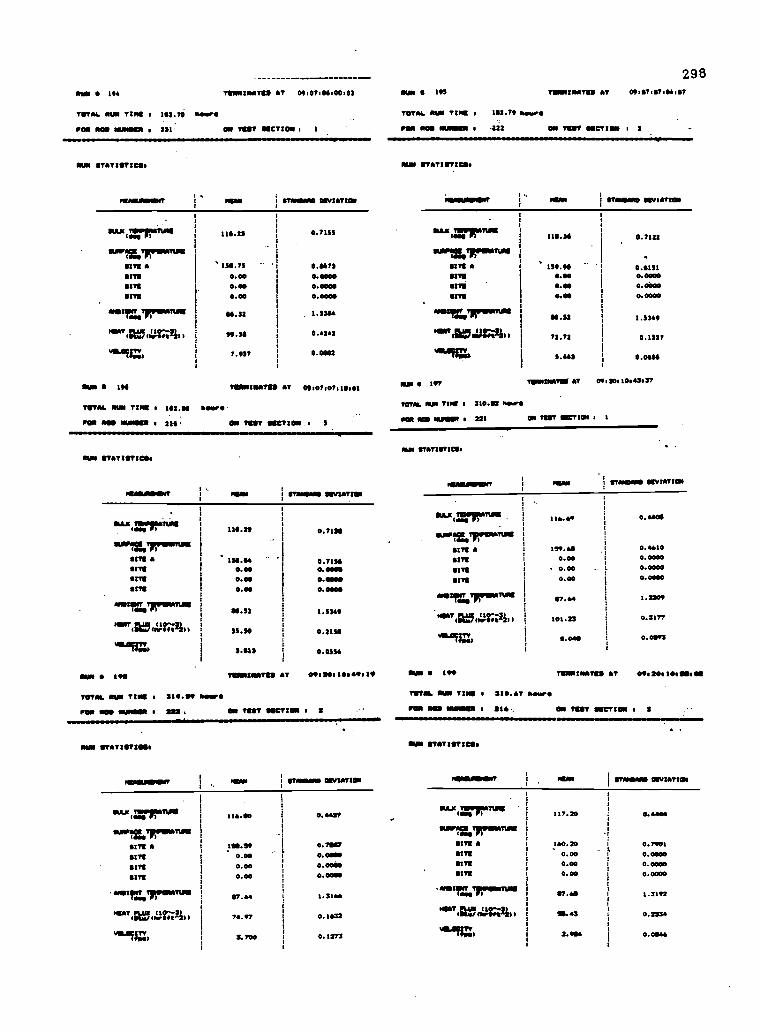
O WN 124
TOTAL NUN TIME s 162.70 Am/
TIIROINATIES AT 04107$06100102
POO NOS NURSER o 211, ON TEST UNCTION 1
O WN STATISTICS.
mINAWIEN MDR rrammas OBVIATION
FAX (101/711 WINI 116.13 0.7113
1411112.7rIPATUSI
SITE A 11.73 0.4673
SITS 0.00 0.0000SITS 0.00 0.0000
SIR 0.00 0.0000
14.32 1.3304
99.34 0.4262
7.927 0.0402
1001 146 Tommummalt. AT 09,07.07110.01
TOTAL OWN TINS s 192.44 homes
P OO ROO MANOR s 220, ON TEST SIMON 3
N MI STATISTICS.
MAIN STONIOND 011VUITION
I!" tr114:nve 116.24 0.7124
OM A 134.46 0.71240.00 0.0040
111111 0.00 0.4400
slit
amercormanws0.00 0.0000
01.11 1.3349
"'",1;W (0, 4t 33.30 0.213
1.13 0.0334
N UN 1911 TONNINATED AT 091 tOs les 49.19
TOT/A. OWN TINS . 310.19 Mare
/ ON WOO MINNOW s ISE, ON TEST SUCTION I 2.....NMI STATISTICS.
STMIDOND OEVUSTIOIS
'WC=rim,*111.01MTRIMINOTIAIS
116.00 0.6627
SITE A 1SS. 29 0.7041
SITS 0.00 0.0600
SITE 0.00 0.0000
0.00 0.0000
orezirr.orpuous117.6. 1.3166
"." cragf;iii» 76.97 0.1632
vajligt 2.700 0.1273
298N UN 1113 TIONINATIS AT 00:07147.06147
TOTAL OWN T2NE s 102.74 More
POO ROO WOW I 412 ON TEST SECTION011111100100.
N UN STATISTICS.
MINI gramme VIVIATTO
BSI :111111rITIOU
1
2.419=11119411A11.1111 1
116.34 0.7122
SITS A 1
.
139.90 0.9131
11111f
0.00 *Akeum 0.00 0.0000
4/711 I 0.0 0.0000
4.1141111WIMAR111 I
01.31 1.3119
41.1411501Mli11 72.72 0.1327
941.114q,
I
0.6611 0.0656
SAN 197 MOINAN0110 AT 09.20.10,63,37
70714. Mum TAU 310.112 hours
/OA NOS NUMMI I 221 OM TEST S1CTION 1 1
*51 STATISTICS.
142/112011171IN7 FRAN STI01/10 ISVtATIO.
1111/117609911,0111,11 116.69 i 0.66011
111011.1411KPIPIATUIVI
SITS 139.60 0.4610SITS 0.00 0.0000
SITS 0.00 0.0000
SITE 0.00 0. 0040
57.64 1.3209
"1" 447;, 101.23 0.3177
S.091 0.0093
RUN 199 TIONINATES AT 008201110.1111.02
TOTAL NUN TINE I 310.67 Mors
POO ASS NUMMI s 210., ON MST SECTION 3
OWN STATISTICS.
STAMAIND OBVIATION
1111LIC.Terrn" 117.20 0.6406
SUIPAlgeTZPSNATIMS
SITS A 160.20 0.790)
SITS 0.00 0.0000
5171 0.00 0.00000:71 0.00 0.0000
.411111:41proSNATUNI57.45 1.3192
14671St./ 14Z;1/ / 10.63 0.2236
2.9116 0.0546
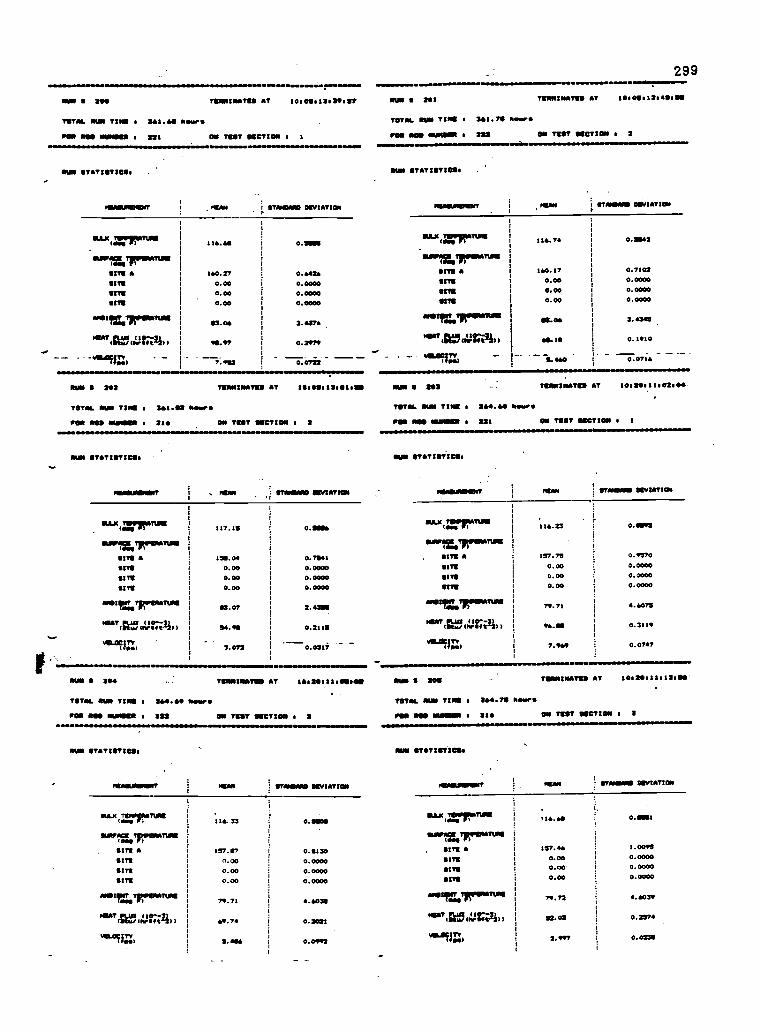
rnrnC3
N II
4 4444 4 4 r
1 4888 8 c P1404 d d ri
A
! 0_111 1iir 8 : IdII
A
A
8
illlrs
4464 4 4 4
88884SO t
I cm 4 mot II f
fill4 4444
I
2;o e
ages s r I0i44 d d
[Niakrtrr
A
I
A
8
A
N
I I
4
8
4
A
A
8
I
A
I
MI i.:4O4 4 4
sags F4 gzza g
gi
L us r.0
i Ili
I :lull0 0000 . 4 0
P 6888 g A ig444 4
I
Imo 4 0.iir
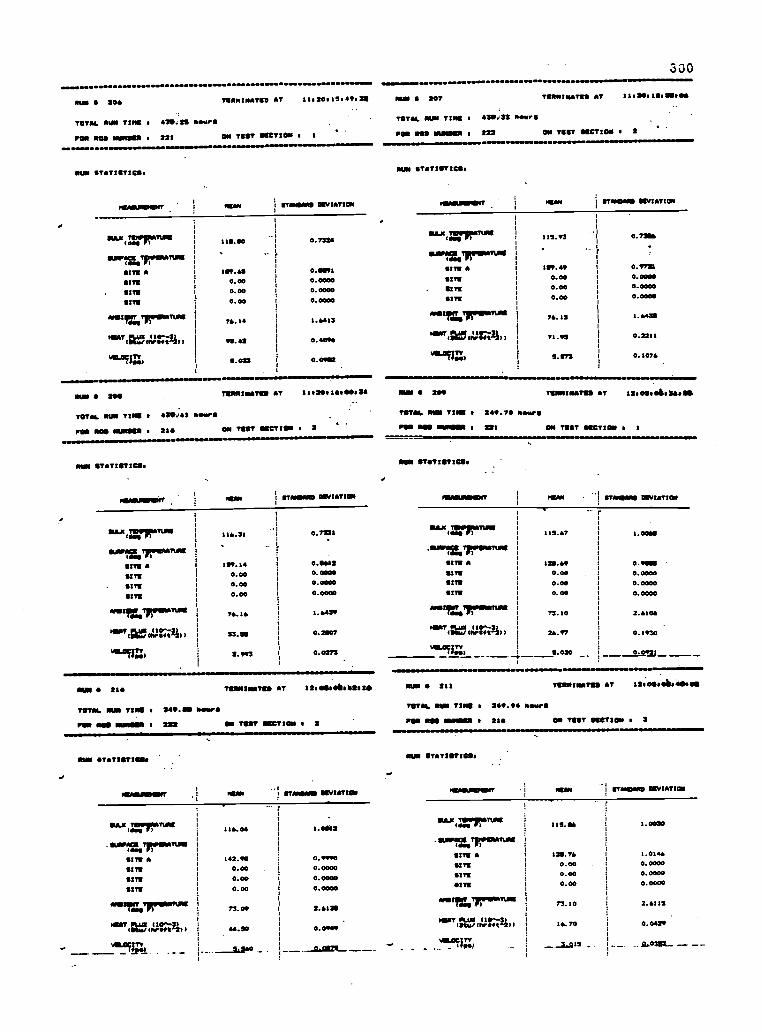
0
till
i4
4444
oo
1
11
Pill!
iI
44404
4
s1SSS
s=
goo.
gI
11
2
iekkeotc
c=I
s1
!
I1
k'lll rfk
Odic;
44
!
Eoeo
gg
ft
to
I
.21
-000
2'1.2.2
13.00
c
8r888
88
,!4;44
e
[iviii
EX
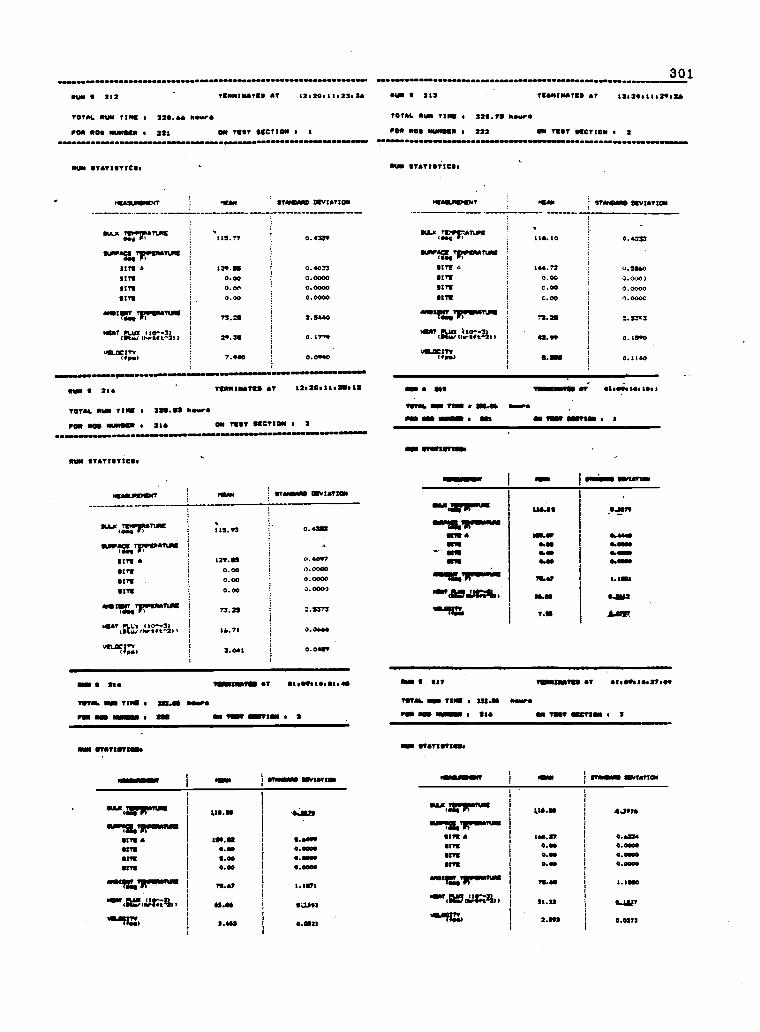
J 4
3133
11
rF
0 P:
i88
80$
rPP
P!t.
511
i1
ill
II
0 k
HMI
1
0.P
oig
ICII
111
I
?PPP
1111
a
1
I 4 I : EI I
4; a
t 13n0 33330 4
II 1
t!'4
0P?
?..i
d8
8 8
8
Agh
i..J4
rl.1
1
I I
F81
81a
I
-P
I{
7A
.
4r
AgA30 H
11
;
4
???
!.;
Uea
se4
I
!4
k033310
r"?i
IN
888:
1;
O?
P
I I
4 S
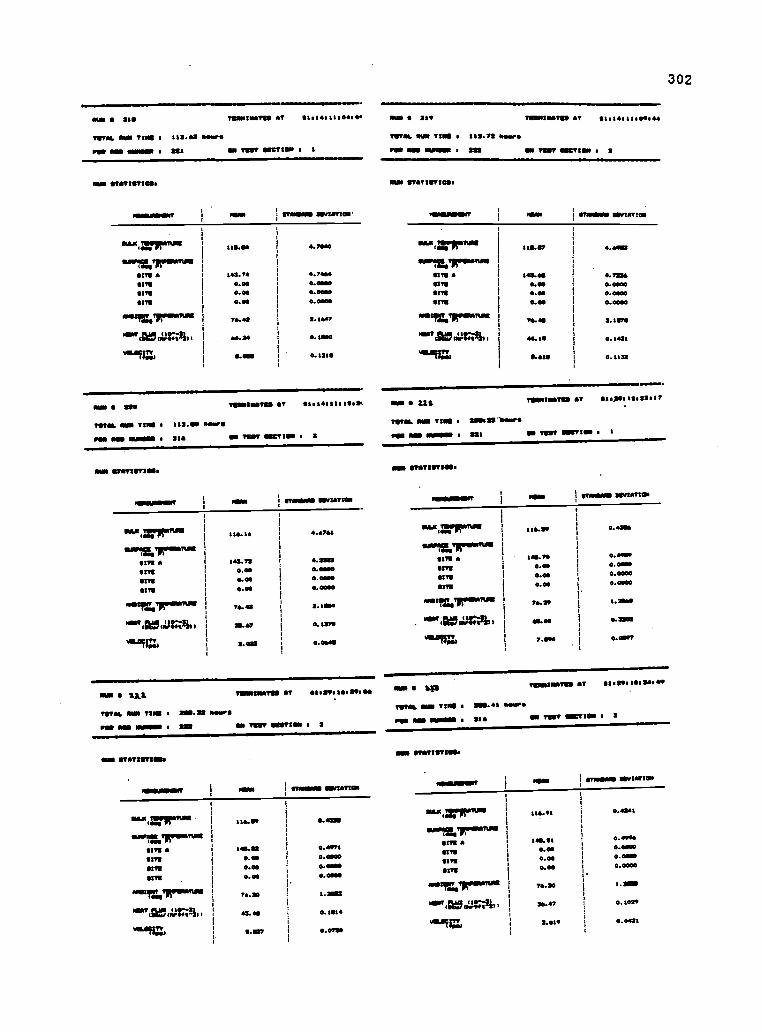
E
2
I
Pill
i!
44444
44
4
VIVI V
t
1444 0
Ii
1Eg;,
dfug" r
r
11111
11
44444
44
4
aA888
aa
daaa
ia
I[ri
rsimf
a
aI
IIa
a
id
a
ai
8888
8
h4
4
1E!
1111
11
14
4444
44
4
rags
aa
g
i4644
0p
4
I!
I
i!III I
!!
1,1
i6110
11
It
Ii
44444
44
ssass
aa
6
diid
0d
4
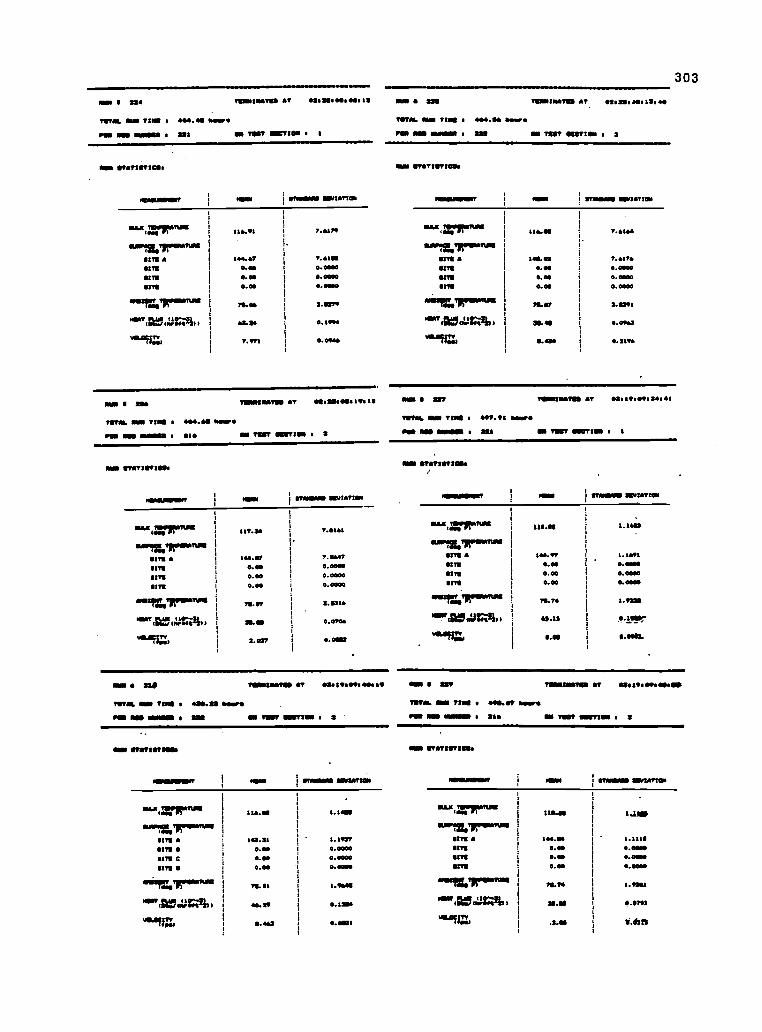
6
g!
4444
44
0
seas
ts
I
tiii
d
1Mg
g4
4444
44
4
I
alias
aa
f444
0d
le:i
.1,rrEa
ti
aI
Ea..
F.
-g-f111
P1JJJ
V J.
a
t888
R
14ia
0a
ig
4w444
44
0
atags
ts
f444
0d1
ssusII
ird
aa
a
6:
i1:
!!
2Z444
sal
alas
tM
8
044
a4
PIring4
II I
!till
!ziza
J4
4
sasss
aa
1
fiee
04
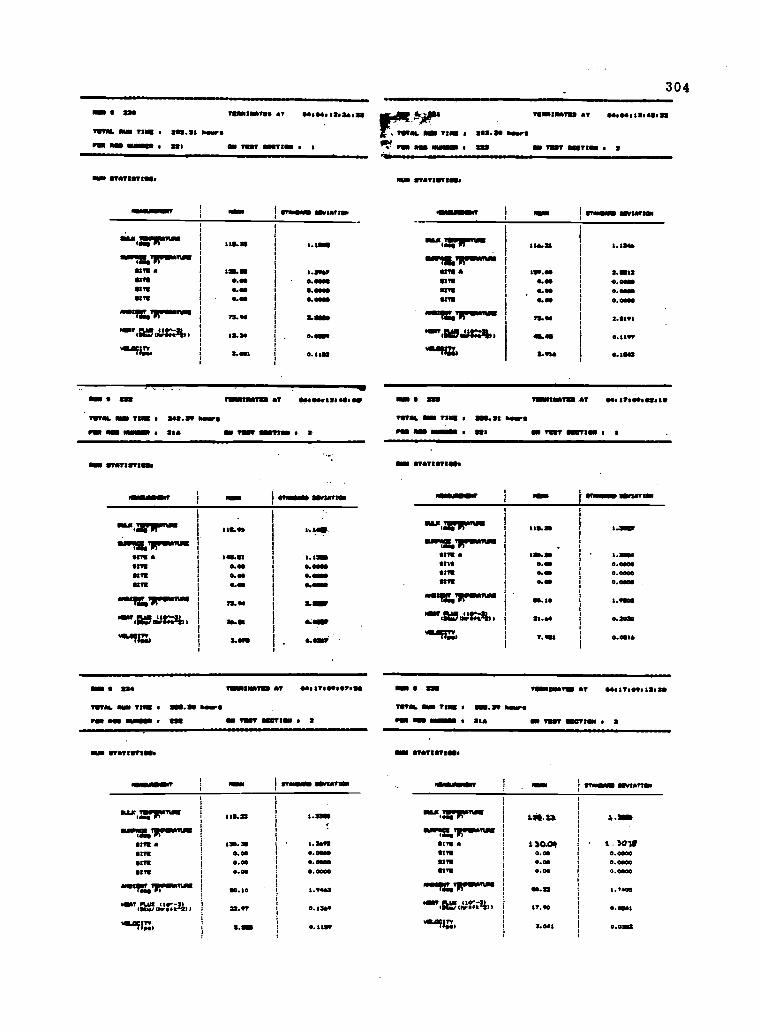
Ifs0
I2I
1
I;« N
1
aaI
;ill;
-AiAA
A
asass
0 v1444 0
4
aI
MI
_did
.1
S
it
vs::
88
i
d044
d4
_tryf
ic.asrf
a1:1P!
Ia
8N..
dI
1a
IaaW
I II
Ilaai
4
.2
sots
s
d0444
,4
4
----------
1i
;
1
I2..
I
a
I
Rill
5888
8t
A 444
3t
4
t _rear"
f
I'I
o
pass
t
4d
4
rrretw,
11 aI
f
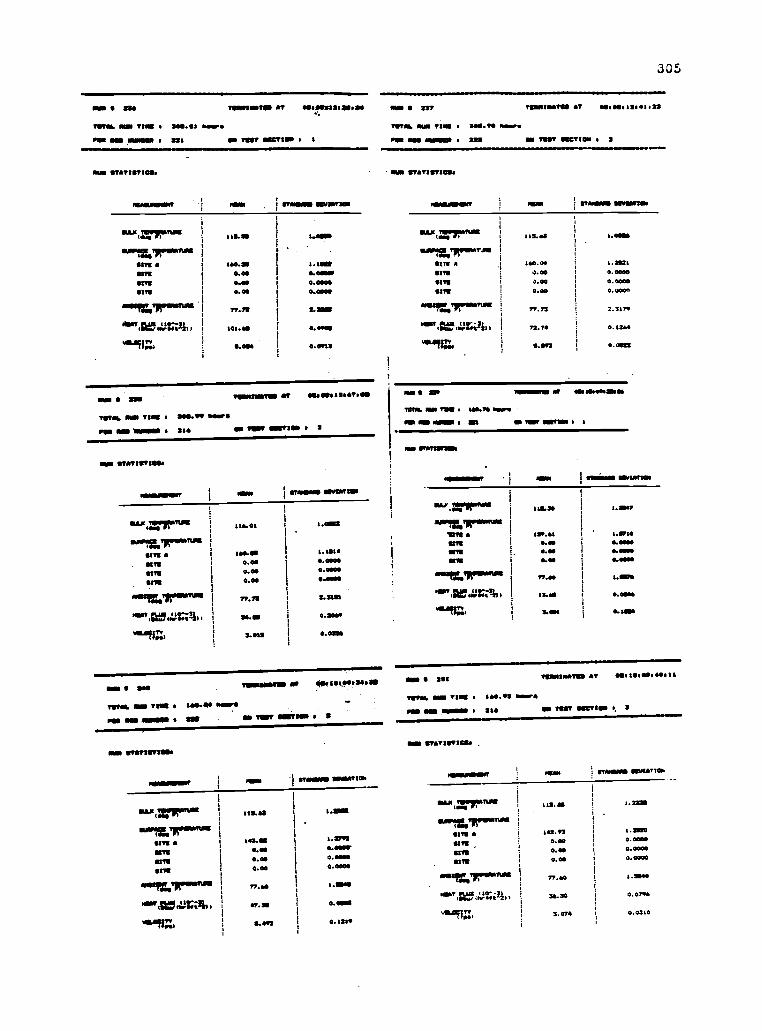
pagpI
I a
I
0111
51
1-
-4Se
4J
4
!!1F
jI... '0
I
t01111
11 dI
5
enags
afdAd
t
I-
a
I
I
Iill' i
AAA
Ji
i
asass
sI
i
dd
a
sass
8g
ei
A
-ss III1:r
I
Ia
.1!
2I'
II
a
aII
111111( 11
:die
-e
4
Rvats
sa
i
!le00
tA
"
by
WU
.
1111 11 ti
pails
sn
fd
1144a
ai
niggt
r-fi
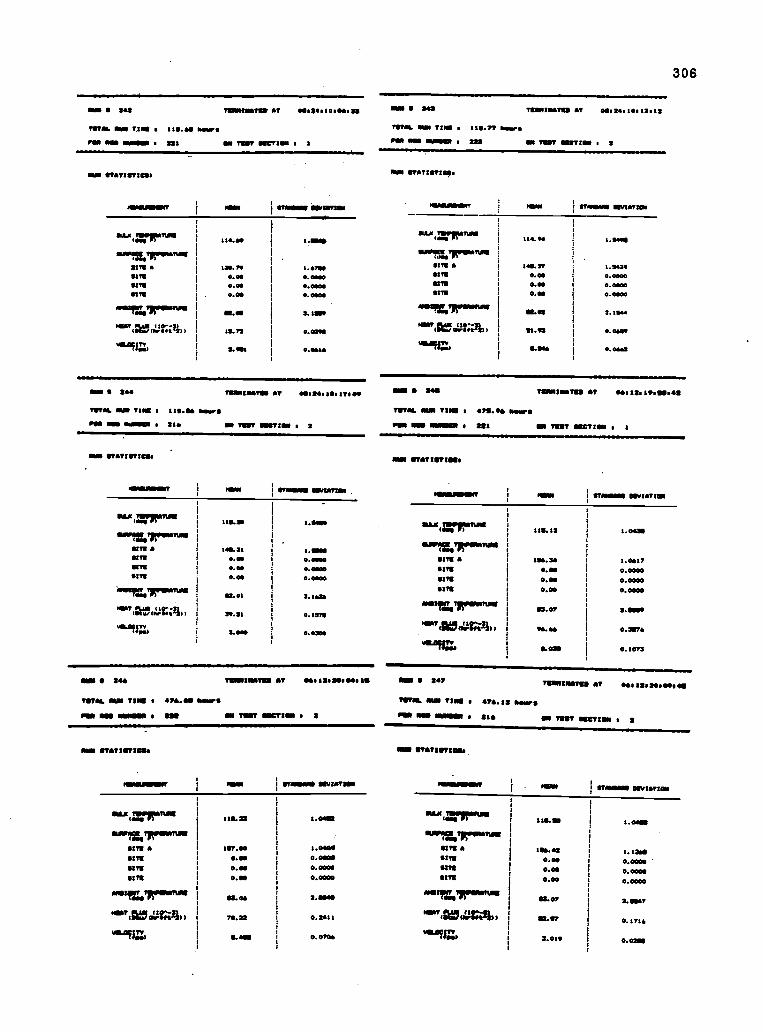
Co
a
I
a;aaII
a
a1
1/III
11
e
s
1444tate
it
1I
------
toss
sc
§gjaa
de
"
at:
I5i.tr
r IIia
C68
It
II
Eat
II
aiI
MI 1
g-444
A4
4
1XSSS
S1
404" a
ia
1
11111
11
4a"
;assa
;daaa
aa
$t!
a
1111
1g
IZ444
A4
4
1I
sVIII
1444a
-------
le
5
4 Oil::
gL
It
I
IIIII
Ii
!did
A0
d
'less
sn
I
,:eeea
R4
I4
rue
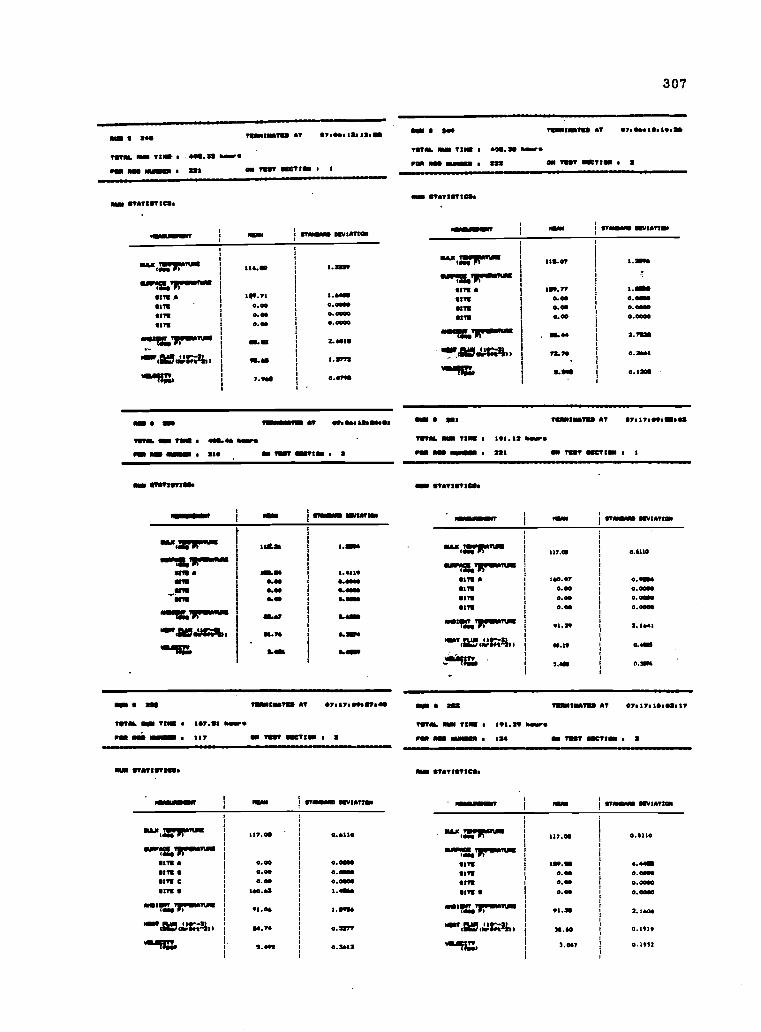
11
1
3000
3
SI1"
1to
nal
iPPP
gtoss
I
PP
rrPPP
P
E1
i11
11
i;. 1
-11
r I
I
PPP:i
Y8
m8881
??
PPPP!
:I V
8
4
%
Pill
3'04
111
Prr
rII
a11
222
----
----
--
I
w2
ocoo
ii
8882
?p
4PPPP
Illf
I I 4
p I
iJI
i
I
4 ii I
I11
1
ft. Hi:-
t'A PP
PPPli
/i
I82
212
3333
11II
ri1
rP
PPP).
.13 I
8224
2I
g
1
i
i4 yV
4
co a 4
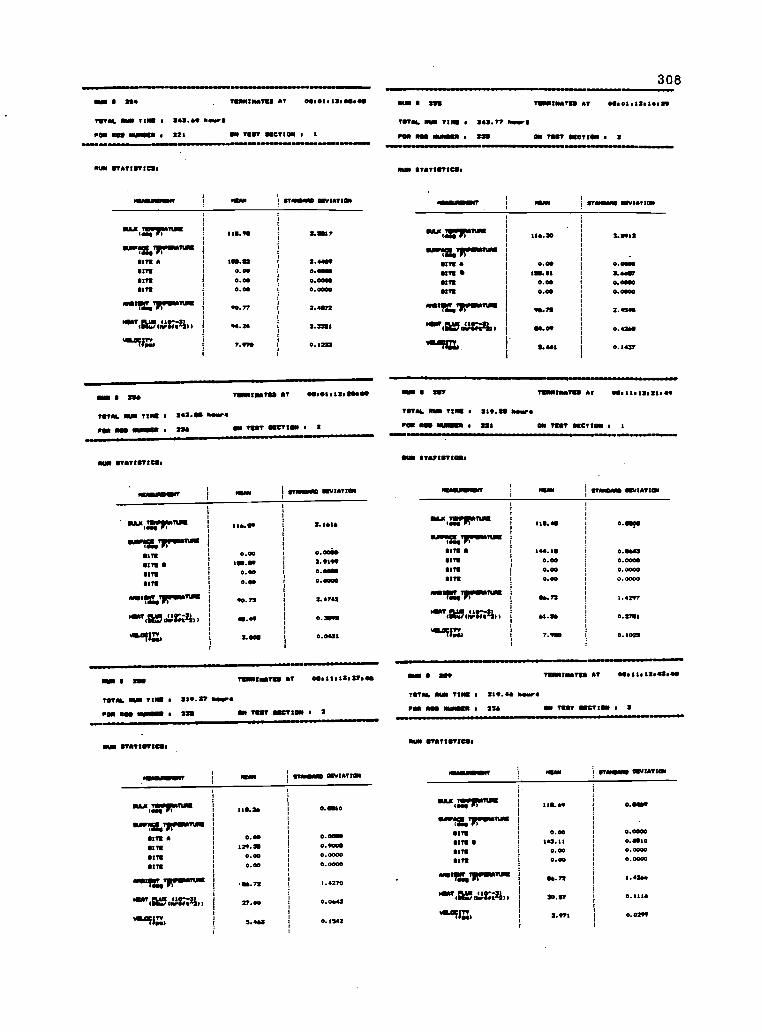
1.1
p g
if
to
ryf PPP
88818
V
5 MI
!
Iti
1E
p g
33330 h
11 I
Pi
I
I
I
rf
8opt?
91
88:8
i
I 8
II
I
4 N
My
MN
N
ri
Prrir
I3
8818
1
1_11
CE
p g 031510 h
t1
11
I
Ff
PPPi
ft
1888;
I I
INt
Ag
3333
i.10
1IP
Prr
rii18881
giii
I I
rP
PPPiP
38818
P?
P?PPP
P
i
3
Yy
Ca
co
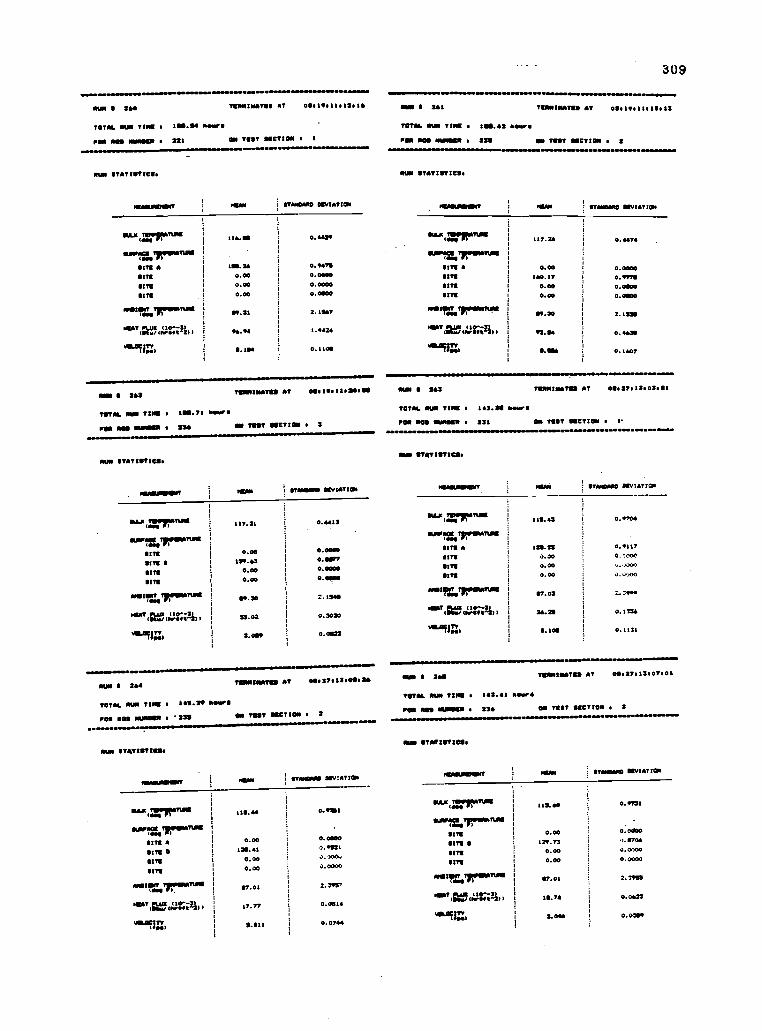
0)0
aI
1aria
!8
8868
41=:!1!
a
..]or esii
1ciii
i1
!4
i4O4
4-
8
Iass:
:
g64.4
11IV
Nlir
II
ss!
II
a11
a
Igl
aa
I
I0
a,6 6
887:4
0
7!11ee.
R
a
Vlilt.
10000
44
14IA
I OM: 0 51 d
iiill-
aa
IIV
3aF.
Na!!FlF.
aaa
aa
II
aI
1111
11
00,00
00
.4:
1ere s1 4
Pi cut
Na
lirks
I844o
48
e
84.8
elpo
6t
o
1.bt
0::::0
51 d
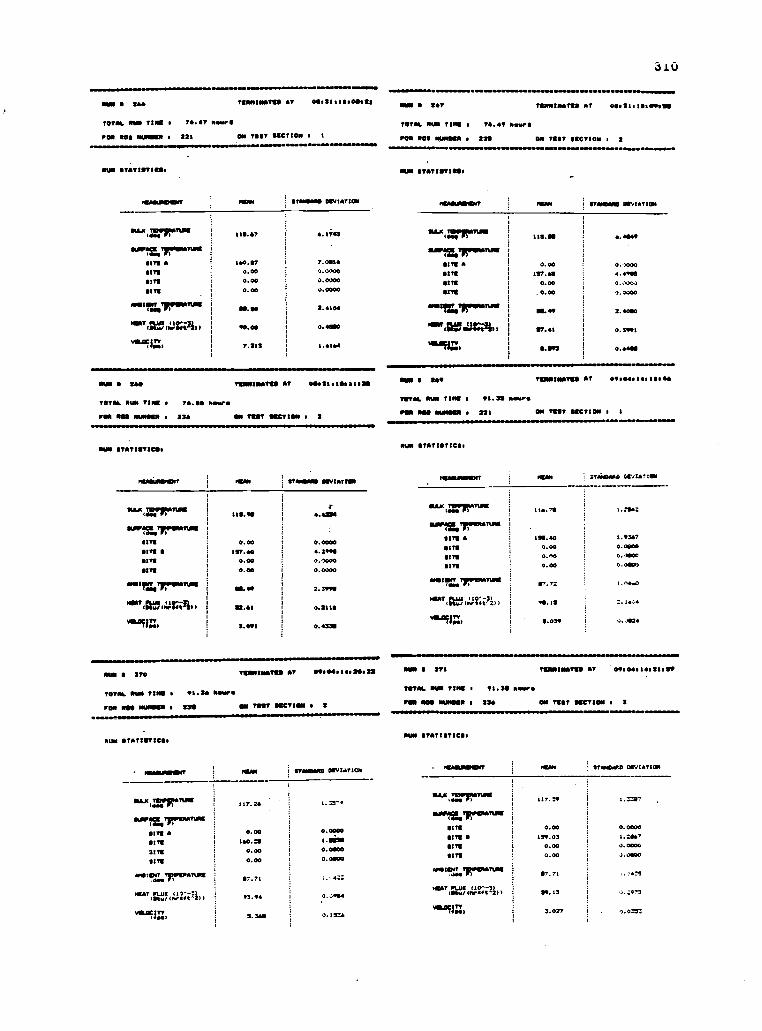
Fa
IiFi
Al
-1;°:VI
.A
l
1I1I
MI
ovo,,
44
!
ssIss
6::44
d4
i=
[4:1111;1
1
i
I
I
AAAl
11
W444
44
4
..... . - -- _
-------------
sass
1!
1..0
orm: !
4ti
iiV
I 1-
1
A
I1
A
MI
o.00
44
4
8188
dd
-
0:::S
frit
Ari
AI
hc
is
A8;88
n
4...144;
4
[111
!O.:44
4
28188
r.
0700
:3
g
tticotm0
.;
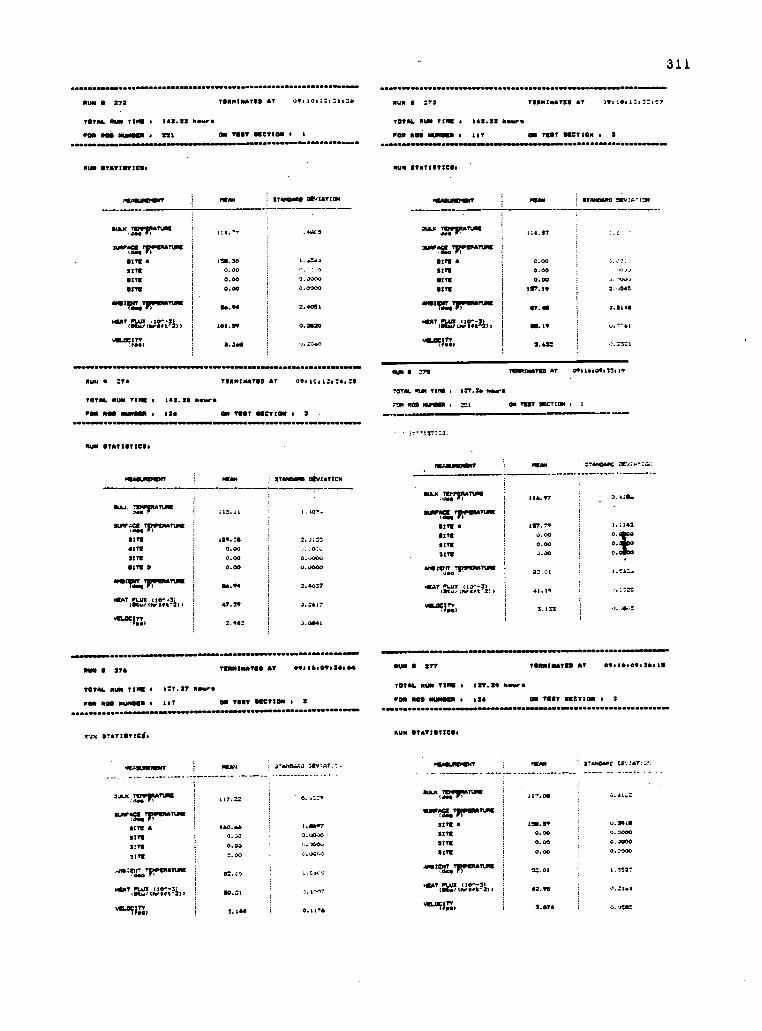
Run 272 TMAINATED AT u....0.15.51.7.
TOTAL NUN TIM 142.22 RAN,Il
PM OM NUMMI 221 ON TOOT SECTION
.00OamemOUOmmom..0.1wamme..DOMOIMMONONON
RUN STATISTICS.
ACASURIMENT KAN STANDARD DIVIATIGN
DULX21ATuRE0
3uNFILIRWIRATMS
11..77 .1002
SITS A 130.30 1.4242
SITE 0.00
SITE 0.00 0.0000
SITE 0.00 0.0000
41611147WMATIMI06.44 2.4081
MIATAlignii;j1/. 101.24 0.3500
( 3.26 0.50.0
mOmmisOmeme.00momownwmwom 44
RUN :74 TiamrmATOO AT 0211111 :,54.21
TOTAL RUN TIME 142.311 hours
SUN :73
4464.011 1140000140110100.00000,000
TOTAL AuM TIME I. 142.22 homes
rum: AAAAA AT 0711081:122.27
ROA PSI aunts I 117 ON TROT SECTION 2
mmolibmemamedlaaa.maa.m.O.DONNOOma. WOOmme
AUN STATISTICS.
MAN ! STANDARD prvrArr2N
MILK 7121170./.12 114.31
71.0022.17021.011221
WTI A 0.00
SITE 0.00
SITE 0.00 NJo.)
SITS 117.11 2.0542
ANO111:4110OIMI1AM07.40 2.51./11
WIATaVutit474). 110.1.0
4.49:7.) 2.452
RIM 071
707M.. RUM TIME I 127.34 AMA
POR ROO WJIMI I 221
TERN:/ATE) AT 04116104111,17
ON TOY WICK , 1
VOA ROO 1111/12112 124 ON TEST SECTION ....o
melybersaallia0001 011101Masime
RUN STATISTIC,.
mIASIAIMOITT NOM i 270/0)012 2211111:11
U.1. ;11:11.44A71.as. a. 40..
121117401 71.1141.12
SITE 1$9.: 2.1.::
SITS 0.00
SITE 0.00
SITE O 0.00 0.0000
ARDISILTPORATURD
MCAT (143.-3)aftsalhp1142.211
VILOCITT'4010
01.54
67.2,
2..4:
ONOMOMMim limplbea.mmeaOmmaamOOOMIUMMOmeina
RINI 276
2.5027
2.2417
0.01141
SNAR11411,DIATLINI
SITE A
SITE
SITE
SITE
/MICA REAPMATURE
KAT RUN (12' -31(1141.01h,(11'21/
YEAC117.OW
177.770.000.000.20
22.01
41.14
3.1:3
realMaininimMIMIlaIDOIDOIDOIDIMIumANINND
TOMAIIIATIO AT 09.14.0.1134.44
1.1142
1.720.4
1:02
0. :4110,2
04110010.11.0010
RUM 277 ramming AT 09,141,05.341.111
TOTAL RUN TIME s 127.27 hours TOTAL RUN TIME 127.2. 600,11
PM NOS AMOCO 117 ON TINT SECTION It 2
.11.........0000111101.00000000m400.0a0
.211 STATIST22i,
712111.111211707 MEAfl 1'4,4.40 011WAT:7.
3:4X: 21112.121712111it00
suRFACE TrEMATURS
0. 1:
SITE 140.66 1.0607
SITE 2.0000
SITE 0.02 140.
3511 0.00 .1.0402
Ans:Trr Troaruir112.20 /.0100
"1",:et4a44), 30.31 0.1007
3.144 0.1176
Pon NM NUMMI 124 OW TEST SECTtOw 3so....SUM 17471
1741111.011011747
.11.011
Man
zerania 11T.0
21.110114.71r111117711112
SITS A /2.27SITE 0.00SITE 0.00SITS 0.00
...npzpoimuur32.01
141",M14:701)yp Tr
42.,11
3.074
372,100111 00,10771,4:
0.4112
0.4010.00000.0000
0.0000
1..1237
O.:144
311
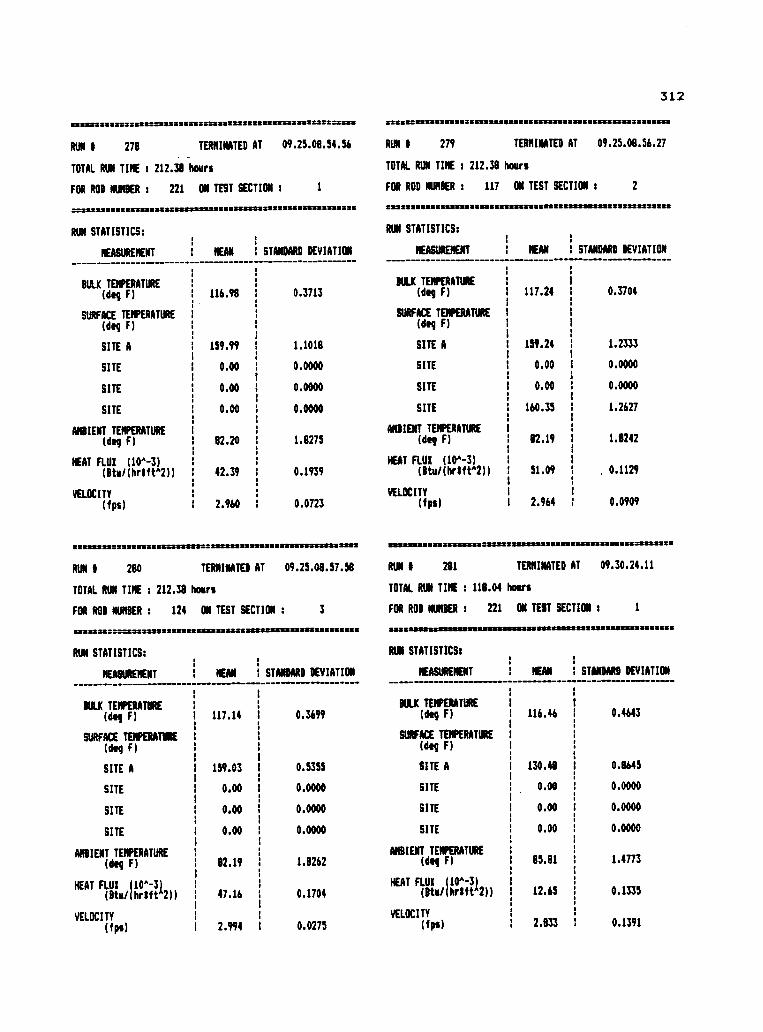
312
22222222222222222XX222222222222222222222222.2222222222222X2 22222:22222222222222222222222222222222=2222222222 22222 X22
RUN 1 278 TERMINATED AT 09.25.08.54.56 RUN 1 279 TERMINATED AT 09.25.08.56.27
TOTAL RUN TINE 212.38 hours TOTAL RUN TIME : 212.38 hours
FOR ROD NUMBER : 221 ON TEST SECTION : 1 FOR ROD NUMBER : 117 ON TEST SECTION : 2
2....22222
RUN STATISTICS:
MEASUREMENT
2.22222122222222822 22222222..2..22..2 822222224222222222222 22222 222222222242221112
MEAN 1 STANDARD DEVIATION
BULK TEMPERATURE(deg F)
SURFACE TEMPERATURE
(deg F)
SITE A
SITE
SITE
SITE
AMBIENT TEMPERATURE
(deg F)
HEAT FLUX (10A-3)
(Btu/(hr1ftA2))
VELOCITY(fps)
116.98 0.3713
159.99 1.1018
0.00 0.0000
0.00 0.0000
0.00 0.0000
82.20 1.8275
42.39 0.1939
2.960 0.0723
RUN STATISTICS:
MEASUREMENT
BULK TE MPER ATURE
MEAN 1 STANDARD DEVIATION
(deg F) 117.24 i 0.3704
SURFACE TEMPERATURE
(deg F)
SITE A 159.24 1 1.2333
SITE 0.00 1 0.0000
SITE 0.00 1 0.0000
SITE 160.35 1 1.2627
AMBIENT TEMPERATURE(deg F) 82.19 1 1.8242
HEAT FLUX (10A-3)
(litu/(hrlftA2)) 51.09 1 0.1129
VELOCITY(fps) 2.964 1 0.0909
2222.22222222222282222222.282222222222222222122222=12222222 22122222222222222222222222222112122222722222222222222.2222222
RUN 1 280 TERMINATED AT 09.25.08.57.58 RUN 0 281 TERMINATED AT 09.30.24.11
TOTAL RUN TIME : 212.38 hours TOTAL RUN TIME : 118.04 hours
FOR ROD NUMBER : 124 ON TEST SECTION : 3 FOR ROD NUMBER : 221 ON TEST SECTION : 1
ZISSZlillr.:ZZSZSVIZZSIZSZZ31111ZZS2317311111111LIMIZZZZSZBILILIZZIMSS ZiSSASAIIZZIIIIIBUSSIMIZIMMISIORMSSZSZUSIMUSSZZIISMS
RUN STATISTICS:
MEASUREMENT
BULK TEMPERATURE
1
1
MEAN 1 STANDARD DEVIATION
(deg F) 1 117.14 0.3699
SURFACE TEMPERATURE(deg F)
1
SITE A 1 159.03 0.5355
SITE i 0.00 0.0000
SITE 1 0.00 0.0000
SITE 1 0.00 0.0000
AMBIENT TEMPERATURE 1
(deg F) 82.19 1.8262
HEAT FLUX (10 " -3) 1
(Dtu/(hrtftA2)) 1 47.16 0.1704
VELOCITY 1
(fps) 1 2.994 0.0275
RUN STATISTICS:
MEASUREMENT
BULK TEMPERATURE(deg F)
SURFACE TEMPERATURE
(deg F)
SITE A
SITE
SITE
SITE
AMBIENT TEMPERATURE(deg F)
HEAT FLUX (10" -3)
(Btu/(hrlft42))
VELOCITY
(fps)
1 MEAN
116.46
130.48
0.00
0.00
0.00
85.81
12.65
2.833
1 STANDARD DEVIATION
1 0.4643
0.8645
0.0000
0.0000
0.0000
1.4773
1 0.1335
1 0.1391
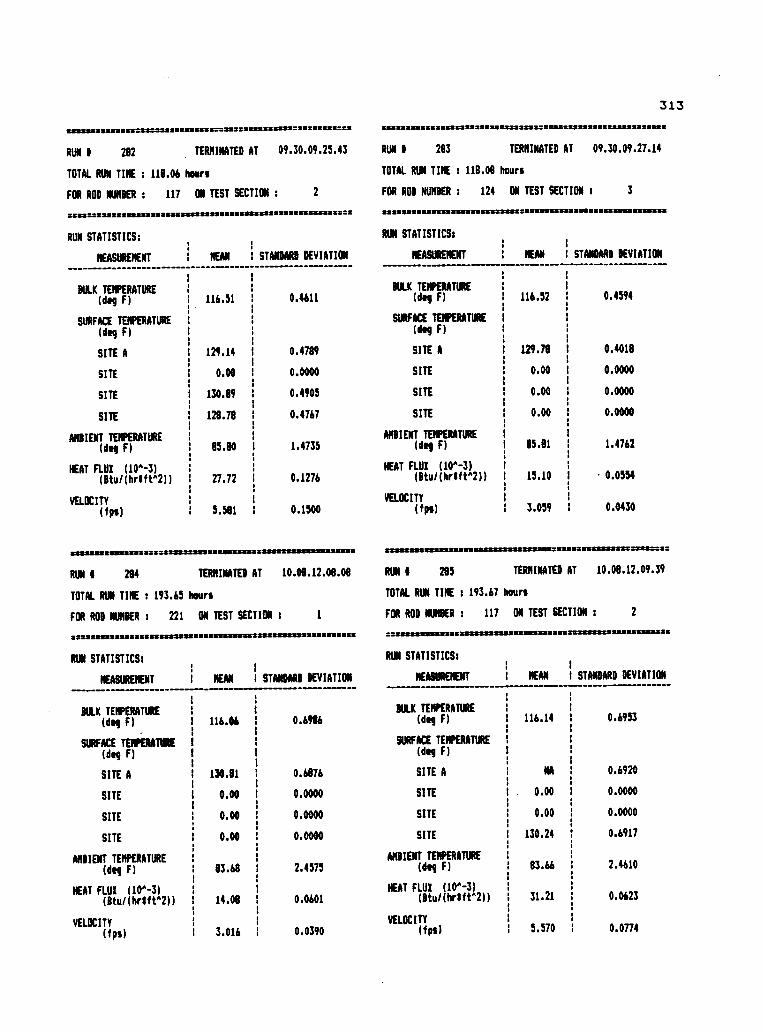
SSISIZZIMMISIM1.223:22SZZ2811222====22118======= 22222 :as
313iftx:=222 2222222 =2711.11zzitaX2i2Zia-ZICUS ZassiX=Ziaa
RUN 1 282 TERMINATED AT 09.30.09.25.43 RUN 1 283 TERMINATED AT 09.30.09.27.14
TOTAL RUN TIME : 118.06 hours TOTAL RUN TIME : 118.08 hours
FOR ROD NUMBER : 117 ON TEST SECTION : 2 FOR ROD NUMBER : 124 ON TEST SECTION s 3
Szzi=7.222ZZSMUS SMUSX*2XXSZSU MaZ2Z31332 XXX9112XSUIMMIXVIZZXIMUU222SUUSIMUSIES:211ZUS ZZZZZZ SinaSSUass
RUN STATISTICS: RUN STATISTICS:
MEASUREMENT 1 MEAN STANDARD DEVIATION
BULK TEMPERATURE(deg F)
SURFACE TEMPERATURE
(deg F)
SITE A
SITE
SITE
SITE
AMBIENT TEMPERATURE(deg F)
NEAT FLUX (10"-3)
(Btu/(hr1ft"2))
VELOCITY
(fps)
116.51 0.4611
129.14 I 0.4789
0.00 0.0000
130.89 0.4905
128.78 0.4767
85.80 I 1.4735
27.72 1 0.1276
5.581 0.1500
MEASUREMENT
BULK
(deg FMPIERN)
TEIURE
BEAN
116.52
I STANDARD DEVIATION
1 0.4594
SURFACE TEMPERATURE
(deg F)
SITE A 129.78 I 0.4018
SITE 0.00 0.0000
SITE 0.00 I 0.0000
SITE 0.00 0.0000
AMBIENT TEMPERATURE(deg F) 15.81 1.4762
NEAT FLUX (10 " -3)
(Btu/(hrIft"2)) 15.10 I 0.0554
VELOCITY(fps) 3.059 I 0.0430
ISMIIIISIM*1122ZSZSWASZSZIIIMMISWIZSMILTW a a ms aasmss sss ssmsszs saasssass:z:zssassmszssssss -sss
RUN 0 284 TERMINATED AT 10.08.12.08.08 RUN 1 285 TERMINATED AT 10.08.12.09.39
TOTAL RUN TIME : 193.65 hours TOTAL RUN TIME : 193.67 hours
FOR ROD NUMBER : 221 ON TEST SECTION s 1 FOR ROD NUMBER : 117 ON TEST SECTION : 2
;SISSZIRSZZSISSMSSMINIZIWZRIBMIliii22112Z1M11121.2233.11122 ..7.2221111111:111ZIMISMBILIMMI.1=ZSITSZIZSZICAISSXXIMILSZSIMISZ
RUN STATISTICS: RUN STATISTICS:
IMMURENENT I MEAN I STANDARD DEVIATION
BULK TEMPERATURE
(deg F)
SURFACE TEMPERATURE
(deg F)
SITE A
SITE
SITE
SITE
AMBIENT TEMPERATURE(deg F)
HEAT FLUX (10" -3)
(8tu/(hrlft"2))
VELOCITY(fps)
116.06 I 0.6986
130.81 1 0.6876
0.00 I 0.0000
0.00 0.0000
I0.00 1 0.0000
83.68 2.4575
14.08 1 0.0601
3.016 0.0390
MEASUREMENT I MEAN I STANDARD DEVIATION
BULK TEMPERATURE(do, F) 116.14 I 0.6953
SURFACE TEMPERATURE(deg F)
SITE A NA 0.6920
SITE 0.00 0.0000
SITE 0.00 0.0000I
SITE 130.24 0.6917
AMBIENT TEMPERATURE(deg F) 83.66 2.4610
NEAT FLUX (10 " -3)
(Itu/(hr1ft"2)) 31.21 I 0.0623
VELOCITY(fps) 5.570 I 0.0774
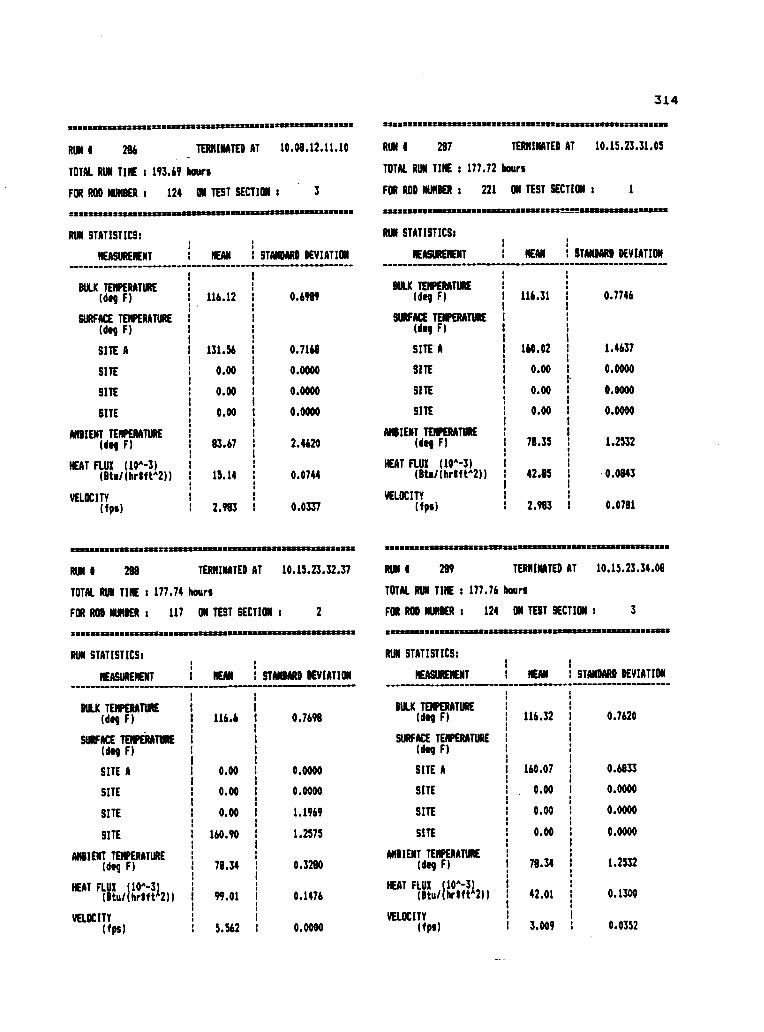
IZMIZZIMUZ*S2222112X22U2STXX2SX28=2:2=271Z*ViTASSAMS222222 Zielit ZS
314
RUN i 286 TERMINATED AT 10.08.12.11.10 RUN I 287 TERMINATED AT 10.15.23.31.05
TOTAL RUN TINE : 193.69 hours TOTAL RUN TIME : 177.72 hours
FOR ROD NUMBER : 124 ON TEST SECTION 3 FOR ROD NUMBER : 221 ON TEST SECTION : 1
= 222222 8112X8SMZSMIMMMUKSBUSUSS8==========.213228M iSiZZE,SZ8Sitir=2:282112USSIMISSWASsiZZ2SIMMOUSIMBURiaaRt
RUN STATISTICS:
MEASUREMENT I MEAN I STANDARD DEVIATION
BULK TEMPERATURE(deg F) 116.12 0.6989
SURFACE TEMPERATURE
(deg F)
SITE A 131.56 0.7168
SITE 0.00 0.0000
SITE 0.00 0.0000
SITE 0.00 0.0000
AMBIENT TEMPERATURE(deg F) 83.67 2.4620
HEAT FLUX (10" -3)
(Btu/(hreftA2)) 15.14 0.0744
VELOCITY(fps) 2.983 0.0337
RUN STATISTICS:
MEASUREMENT I MEAN I STANDARD DEVIATION
116.31 i 0.7746BULK TEMPERATURE
(deg F)
SURFACE TEMPERATURE(deg F)
SITE A
SITE
SITE
SITE
AMBIENT TEMPERATURE(deg F)
HEAT FLUX (10" -3)
(Btu/(hrtftA2))
VELOCITY(fps)
160.02
0.00
0.00
0.00
1.4637
0.0000
0.0000
0.0000
78.351
1.2532
42.85 I 0.0843
2.983 R 0.0781
INISRS2=222822=8122221WMASSIMMWMCWZMWESSUMWASSZ822.1 SiZ7181131=====.222ZZUVZSZSBSSMOSSZSXSOUZZLIMMBIZZ2XXX
RUN 0 288 TERMINATED AT 10.15.23.32.37 RUN A 289 TERMINATED AT 10.15.23.34.08
TOTAL RUN TIME : 177.74 hours TOTAL RUN TIME : 177.76 hours
FOR ROD NUMBER : 117 ON TEST SECTION : 2 FOR ROD NUMBER : 124 ON TEST SECTION : 3
SIZZ3Z22111111ZaZZaIlitIZSZSZ582881111111WW1111-SZWISISSIWZZ aitZMALSZainiftaSZTAIIIIIISZEILZSWILMMIBItailtaliSSIIISZSZZIMBZ
RUN STATISTICS: RUN STATISTICS:I I
MEASUREMENT MEAN I STANDARD DEVIATION_....--------_-----------....-----_-_-------_____----_____
MEASUREMENT
I I
i MEAN I STANDARD DEVIATION
BULK TEMPERATURE(deg F)
I
116.6 0.7698
SURFACE TEMPERATURE(dog F)
SITE A I 0.00 0.0000
SITE 0 0.00 0.0000
SITE 0.00 1.1969
SITE I 160.90 1.2575
AMBIENT TEMPERATURE(deg F) 78.34 0.3280
(EAT FLUI99.01 0.1476
VELOCITY
(fps) I 5.562 0.0000
BULK TEMPERATURE(deg F) 116.32 0.7620
SURFACE TEMPERATURE
(deg F)
SITE A 160.07 0.6833
SITE 0.00 0.0000
SITE 0.00 0.0000
SITE 0.00 0.0000
AMBIENT TEMPERATURE(deg F) 78.34 1.2532
HEAT 111u/((11;;112))42.01 0.1300
VELOCITY(fps) 3.009 0.0352
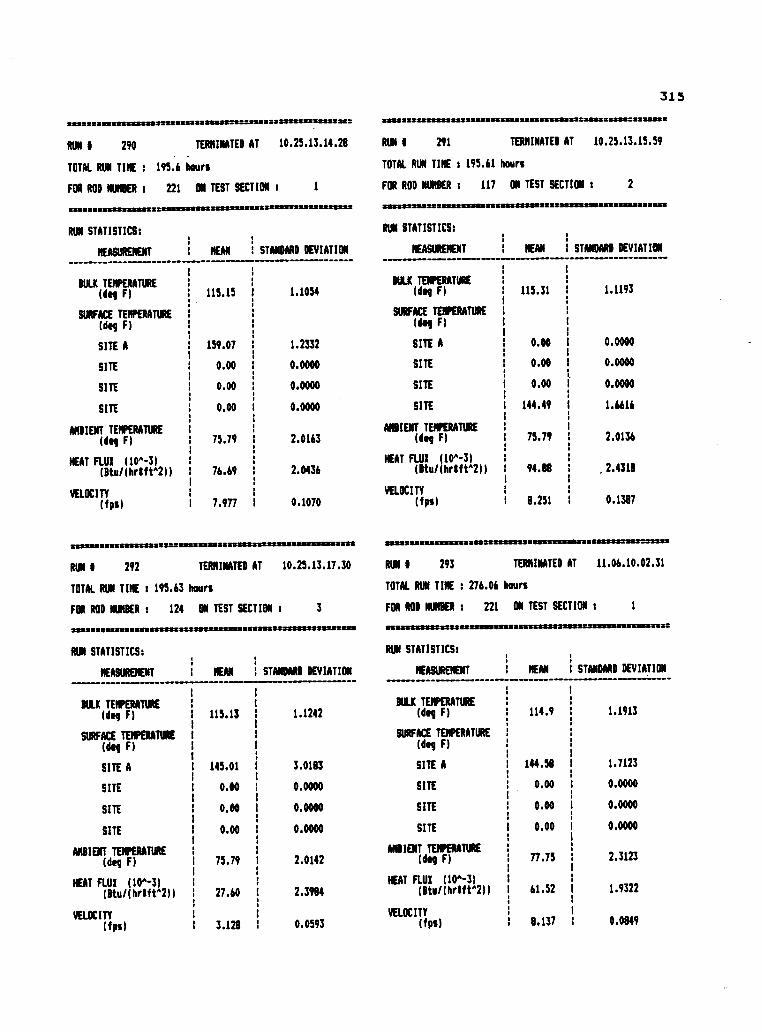
313
X22:=228Z211=======i2ZIMUMV=SZ22**2.12i2g2==igiiiag ZSUSSZ2iii22222212SZEZZMigiSSUSMSZVISOSSLAISSIaiSSOiiiiiii
RUN D 290 TERMINATED AT 10.25.13.14.28 RUN 1 291 TERMINATED AT 10.25.13.15.59
TOTAL RUN TIME : 195.6 hours TOTAL RUN TINE 195.61 hours
FOR ROD NUMBER : 221 ON TEST SECTION s 1 FOR ROD NUMBER s 117 ON TEST SECTION : 2
azzszleszsmsmataszzmuespnmesszsitssancessamszzawszamumsmas: iSSZWZMIZIMMIIIMINSESSWAMM2SOSISSMSSIZSMIMISZSMISSIMUSS
RUN STATISTICS: RUN STATISTICS:
MEASUREMENT
BULK TEMPERATURE
I
I MEAN
I
I STANDARD DEVIATION
(deg F) 115.15 1.1054
SURFACE TEMPERATURE
(deg F) I
SITE A 159.07 1.2332
SITE 0.00 I 0.0000
SITE 0.00 I 0.0000
SITE 0.00 i 0.0000
AMBIENT TEMPERATURE I
(deg F) 75.791
2.0163
HEAT FLUX (10A-3) I
(Btu/(hrIftA2)1 76.69 I 2.0436
VELOCITY I
(fps) 7.977 i 0.1070
MEASUREMENT____----___-_-____----_______-_------____
BULK TEMPERATURE
I
I MEAN
I
I STANDARD DEVIATION_______ ----__
(deg Fl 115.31 1.1193
SURFACE TEMPERATURE
(deg F)
SITE A i 0.00 0.0000
SITE I 0.00 0.0000
SITE 0.00 0.0000
SITE 3 144.49 1.6616
AMBIENT TEMPERATURE
(deg F) I 75.79 2.0136
NEAT FLUX (10A-3)
(Itu/(hrlftA2)1 I 94.88 2.4318
VELOCITY
(fps) . 8.251 0.1387
211====.22.81122211121192SZIMSZUZZ282 SOSSMitiltiii2222 Siii2SUUMS222222Z2SUSZZIMISISSWESSSESZZigniiii=111====
RUN 1 292 TERMINATED AT 10.25.13.17.30 RUN I 293 TERMINATED AT 11.06.10.02.31
TOTAL RUN TINE : 195.63 hours TOTAL RUN TINE : 276.06 hours
FOR ROD NUMBER : 124 ON TEST SECTION : 3 FOR ROD NUMBER 1 221 ON TEST SECTION : 1
SZZEMIIIIIIISSZIMBICSIMMUSSZUSISZMIMMLUSZRZSZSIMSS suss ssassasss:ss sssos sssassssass sssssasssssaa:nsasszsss
RUN STATISTICS: RUN STATISTICS:
MEASUREMENT I MEAN I STANDARD DEVIATION
BILK TEMPERATURE
(deg F)
SURFACE TEMPERATURE
(deg F)
SITE A
SITE
SITE
SITE
AMBIENT TEMPERATURE(deg F)
HEAT FLUX (104-3)
(8tu/(hrIftA21)
VELOCITY
(fps)
115.13
145.01
0.10
0.00
0.00
75.79
27.60
3.128
1.1242
3.0183
0.0000
0.0000
0.0000
2.0142
2.3984
0.0593
MEASUREMENT MEAN I STANDARD DEVIATION
BULK TEMPERATURE(deg F) 114.9 1.1913
SURFACE TEMPERATURE
(deg F)
SITE A 144.58 1.7123
SITE 0.00 0.0000
SITE 0.00 0.0000
SITE 0.00 0.0000
AMBIENT TEMPERATURE(del F) 77.75 2.3123
HEAT FLUX (10A-3)
(Ito/(hrIftA2)) 61.52 1.9322
VELOCITY(fps) 8.137 0.0849
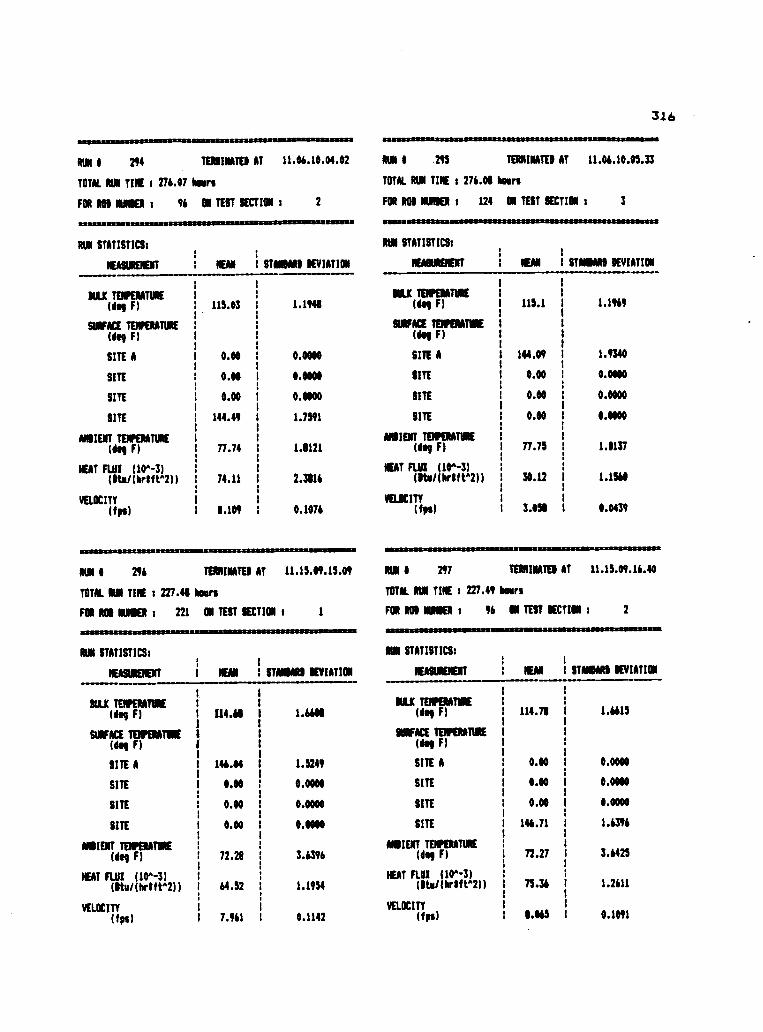
316
RUN I 294 TERMINATES AT 11.06.10.04.02 RUN I 295 TERNINATED AT 11.06.10.05.33
TOTAL RIM TINE t 276.08 bars
FOR ROO PUNIER ; 124 ON TEST SECTION : 3
TOTAL RUN TINE t 276.07 Moors
FOR 101 MIER o 96 ON TEST SECTION 2
82118112121112332111811=8,21181110/ZSBISIBIZilitfl,
RUN STATISTICS:
KASSIENBIT SEAN STANDARD IEVIATION
MLII TEMPERATURE(ds, F) 1 115.03 1.1948
SURFACE TEMPERATURE 1
Wes F) 1
SITE A1
0.00 0.0010
SITE I 0.00 0.0000
SITE 0.00 0.0000
SITE 1 144.49 1.7591
ANSIENT TEMPERATURE(deg F) 77.74 1.8121
NEAT FLUX (10A-3)
(lts/IhrtftA2)) 74.11 2.3116
VELOCITY
Ups) 1 1.109 0.1076
11311111111111111111122811112111,41IMUSIOCIPIMMIL
UMW
RUN STATISTICS:
NEASUREMBff NEAN I STANIAR. IEVIATION
IRK TENPERATURE(ds, F)
SURFACE TEMPERATURE
(IN F)
SITE A
SITE
SITE
SITE
AISIENT TEMPERATURE
TIN F)
NEAT FLOM (10A-3)
ISts/(kriftA2))
VELOCITYIf,A) 1
115.1 I 1.1969
144.09 : 1.9340
0.00 1 0.0000
0.00 I 0.0000
0.00 t 0.0100
77.75 I 1.1137
30.12 1 1.1560
3.151 i 0.0439
RIM t 296 TERMINATES AT 11.15.09.15.09 RUN I 297 TERMINATES AT 11.15.09.16.40
TOTAL RUN TIME : 227.49 heirs
FOR ROS NUNIER s 221 ON TEST OECTION 1 1 FOR ROI NUNIER t 96 ON TEST SECTION t 2
TOTAL RUN TINE : 227.48 hours
RUN STATISTICS:
NEASUPBEIIT I
i.
IULK TESPERATURE I
(deg F)1
SURFACEdeg
TF)
EMPERATVIE I
(
SITE A I
SITE I
SITE1
SITE I
AMBIENT TEMPERATURE
(deg F)
NEAT FLUX (10A-3)
(Itu/(hrtftA2))
VELOCITY(fps) 1
DEAN STANIAR, DEVIATION
114.61 1.6601
146.44 1.5249
0.00 0.0000
0.00 0.0000
0.00 0.0000
72.28 3.6396
64.52 1.1954
7.961 0.1142
ABS
RUN STATISTICS:
MEASUREMENT I SEAN 1 STANDARD IEVIATION
ILK TEMPERATURE(des FI 114.71 1 1.6615
SURFACE
deg
TEWERATIME
( F)
SITE A 0.00 I 0.0000
SITE 0.00 I 0.0000
I I
SITE 0.00 1 0.0000
SITE 146.71 1 1.6396
AMBIENT TEMPERATURE(del F) 72.27 3.6425
NEAT FLUX (10A-3)
(Its/(hrtftA2)) 75.36 1 1.2611
VELOCITY(fps) 8.065 I 0.1091
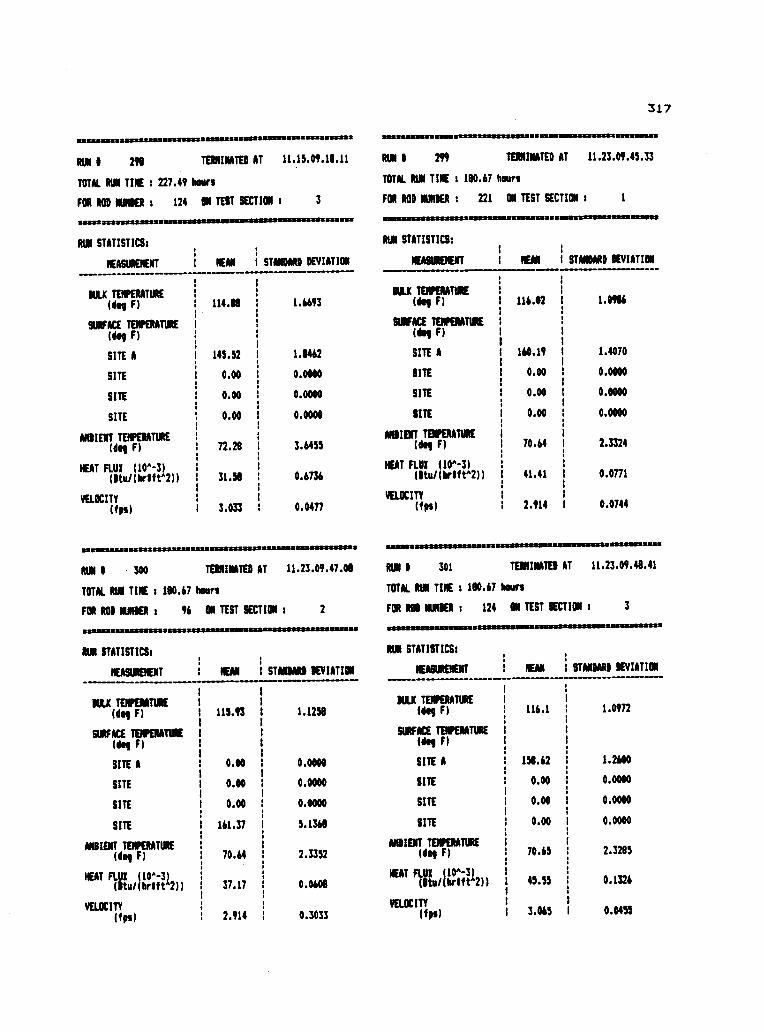
317
IlaWISZUZIOSSIASISIWZMUSSIIMSZSCSIMICRIMISILIMIZOLIMISZS
RUN I 298 TERMINATED AT 11.15.09.10.11 RUN I 299 TERMINATED AT 11.23.09.45.33
TOTAL RUN TINE : 227.49 hours TOTAL RUN TIME 1 180.67 hours
FOR ROD MONIER : 124 ON TEST SECTION 3 FOR ROD NOSIER : 221 ON TEST SECTION : 1
samsasasasas satam SISSIIMMSWIttailIMMSZMISMISMIWAIRMICZWIll*S7111111
RIM STATISTICS: RIM STATISTICS:
MEASUREMENT I MEAN f STANDARD DEVIATION
SW TEMPERATURE(dog F)
SURFACE TEMPERATURE(dog F)
SITE A
SITE
SITE
SITE
AMBIENT TEMPERATURE(deg F)
HEAT FLUX (10 " -3)
(Itu/(hrIft42))
VELOCITY(fps)
114.88
145.52
0.00
0.00
0.00
n.2e
31.58
3.033
1.6693
1.8462
0.0000
0.0000
0.0000
3.6455
0.6736
0.0477
NEASURENENT SEAN STANDARD DEVIATION
MILK TEMPERATURE(dog F) 116.02 I 1.0986
SURFACE TEMPERATURE(do, F)
SITE A 160.19 f 1.4070
SITE 0.00 I 0.0000
SITE 0.00 0.0000
SITE 0.00 I 0.0000
AMBIENT TEMPERATURE(dog F) 70.64 2.3324
NEAT FLUX (10 " -3)
(Itu/(hrlft"2)) 41.41 N 0.0771
T YVELOCI
(fps) 2.914 I 0.0744
massaszesszisassassassamssassansassasssasaassassassasmaassss
RUN I 300 TERMINATED AT 11.23.09.47.08
TOTAL MM TINE : 180.67 hours
FOR ROD DRIER s 96 ON TEST SECTION o 2
RUN STATISTICS:
MEASUREMENT MEAN STANDARD DEVIATION
MLR TEMPERATURE(dog F) 115.93 1.1258
SURFACE TEMPERATURE(dog F)
SITE A 0.00 0.0000
SITE 0.00 0.0000
SITE 0.00 0.0000
SITE 161.37 5.1341
AMBIENT TEMPERATURE
(deg F) 70.64 2.3352
HEAT FLUX (`10 " -3)
(Itu/(hrtft"2)) 37.17 0.0600
VELOCITY(fps) 2.914 0.3033
RUN I 301 TERMINATES AT 11.23.09.48.41
TOTAL RUN TIME 1 180.67 hours
FOR ROD NURSER : 124 ON TEST SECTION : 3
MIMMR*OUSUMBOUSIMZUM ........ .a
RUN STATISTICS:
MEASIIRENBIT I MEAN I STANDARD DEVIATION
SULK TEMPERATURE(dog F) 116.1 1.0972
SURFACE TEMPERATURE(deg F)
SITE A 158.62 1.2600
SITE 0.00 I 0.0000
SITE 0.00 I 0.0000
SITE 0.00 0.0000
AMBIENT TEMPERATURE(deg F) 70.65 2.3285
MEAT
FLUX (10"-3145.55 0.1326
VELOCITYIfos) 3.065 I 0.0455
318
APPENDIX M
PLOTS OF CORRELATIONAL CURVES
Figs.M-1(a-h) Correlational of -1n0d vs Velocity at a
constant surface temperature for 8 sets of different
water qualities.
Figs.M-2(a-q) Correlation of ln(ed /Fv) vs [1/(Ts+460)][10]
for the 17 different water qualities observed in Table
VI-2.
Figs.M-3(a-q) Curves of Constant Velocity on Grid of Time
Constant vs Surface Temperature for the 17 different
water qualities observed in Table VI-2.
Figs.M-4(a-q) Curves of Constant Velocity on Grid of (Time
constant x Shear Stress) vs Surface Temperature for the
17 different water qualities observed in Table VI-2.
319
PLOTS OF CORRELATIONAL CURVES
Figs.M-1(a-h) Correlational of -InOd vs Velocity at a
constant surface temperature for B sets of different
water qualities.
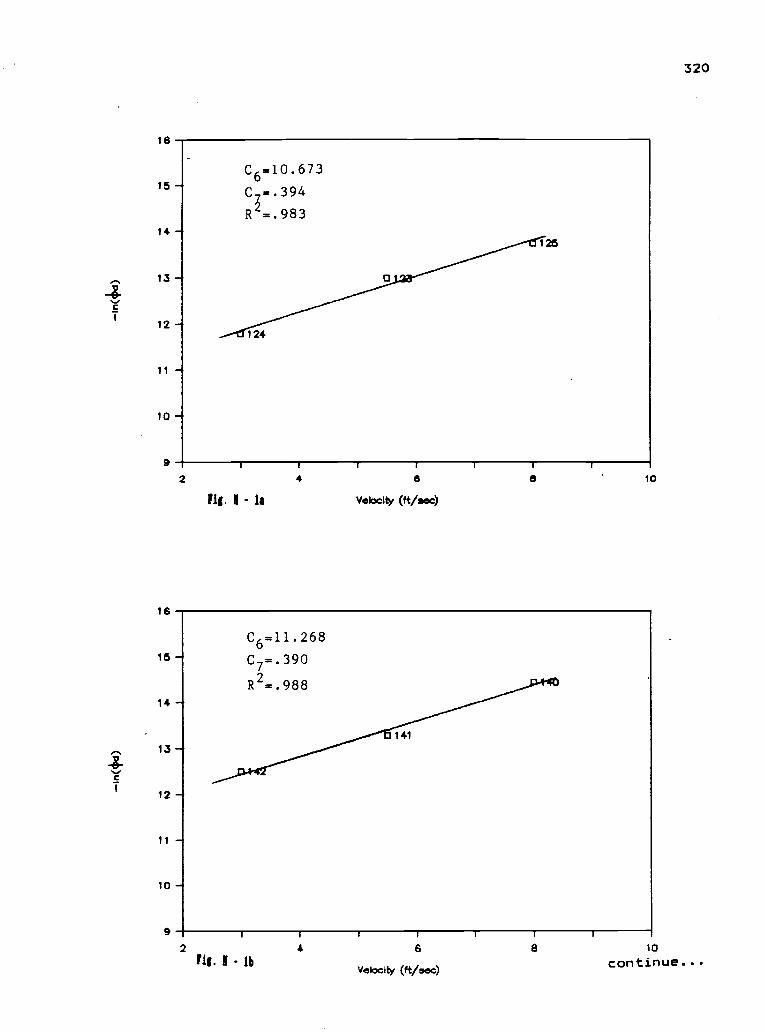
If
16
15
14-
13
12 -
11
10
9
C6=10.673
Cr.394
R2 =.983
I I I
2 4 6
Ili. 11- la Velocity (ft/sec)
16
16 -
14
13
12 --,
11
10
1
6 10
C6=11 268
C7= 390
R2=.988
9 i
2N. i lb
1
41
6
Velocity (ft/eec)
i
320
I I
8 10
continue...
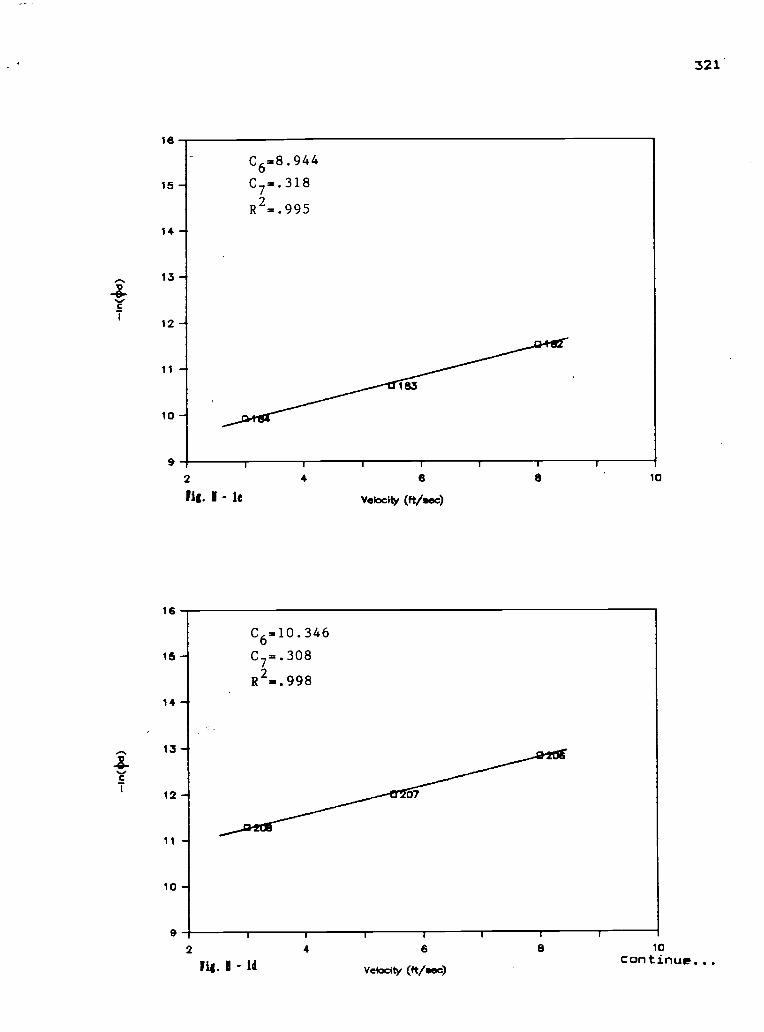
16
15
14 -
13
12 -4
10 -
C6=10.346
C7..308
R2=.998
9
2
- I d
4 6
Velocity (ftteec)
321
8 10continue...
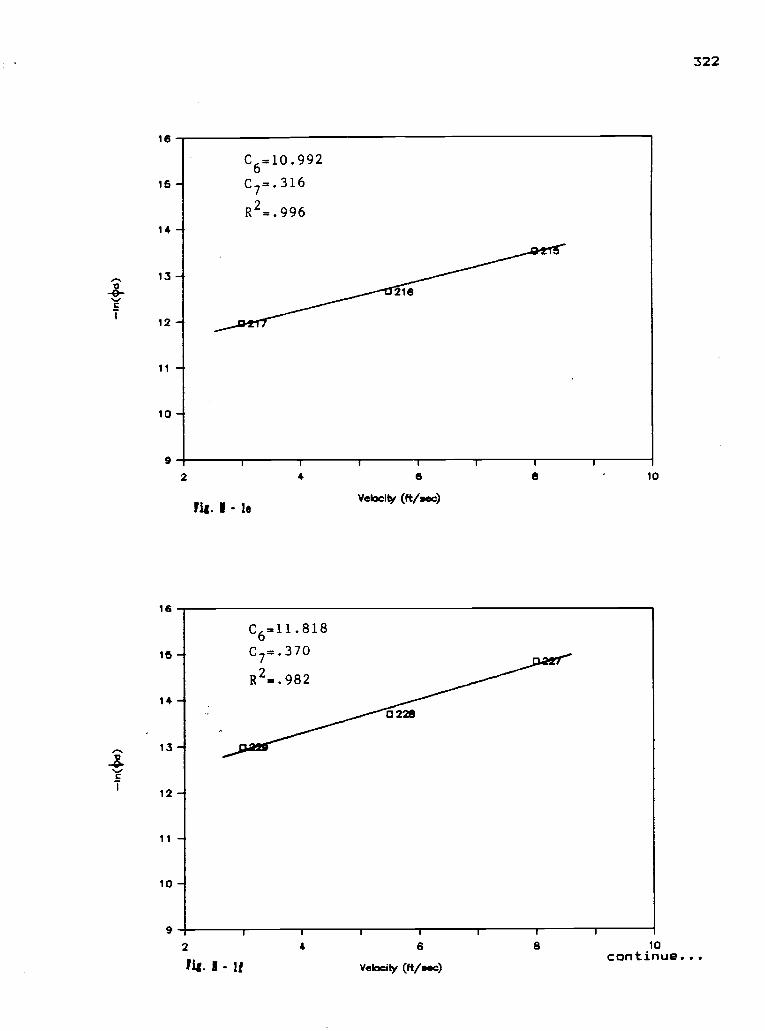
16
15 -
14
13
12-
11 -
10 -4
C6.10.992
C7=.316
R2..996
216
21
fig. I - le
I I I
4 6
Velocity (ft /sec)
1 1
8 10
9 r
2
11g. I - If
C6=11.818
C7= 370
R2..982
0 228
r
41 r
6
Velocity (ft /see)
1
322
I I
8 10continue...
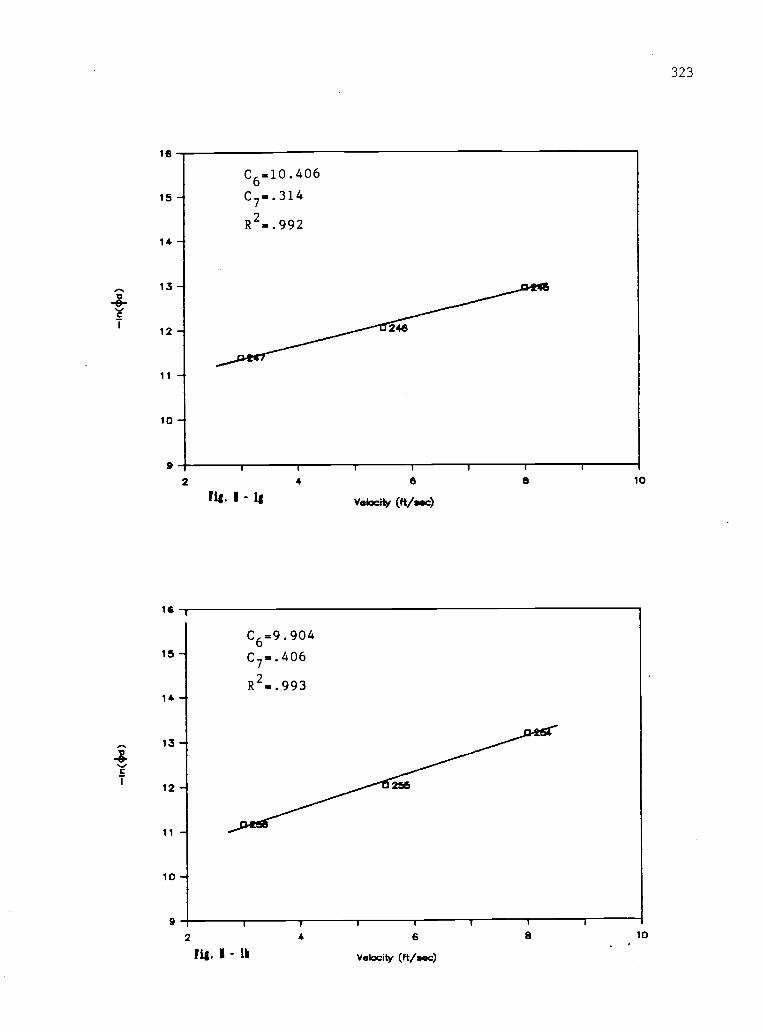
16
15 -
14 -..
13 -
12 -
10 -
C6=9.904
C7=.406
R2=.993
9
2
Fig. II-11
4
T
6
Velocity (ft/sec)
8 10
323
324
PLOTS OF CORRELATIONAL CURVES
Figs.M-2(a-q) Correlation of ln(ed /Fv) vs [1/(Ts+460)](10]
for the 17 different water qualities observed in Table
VI-2.
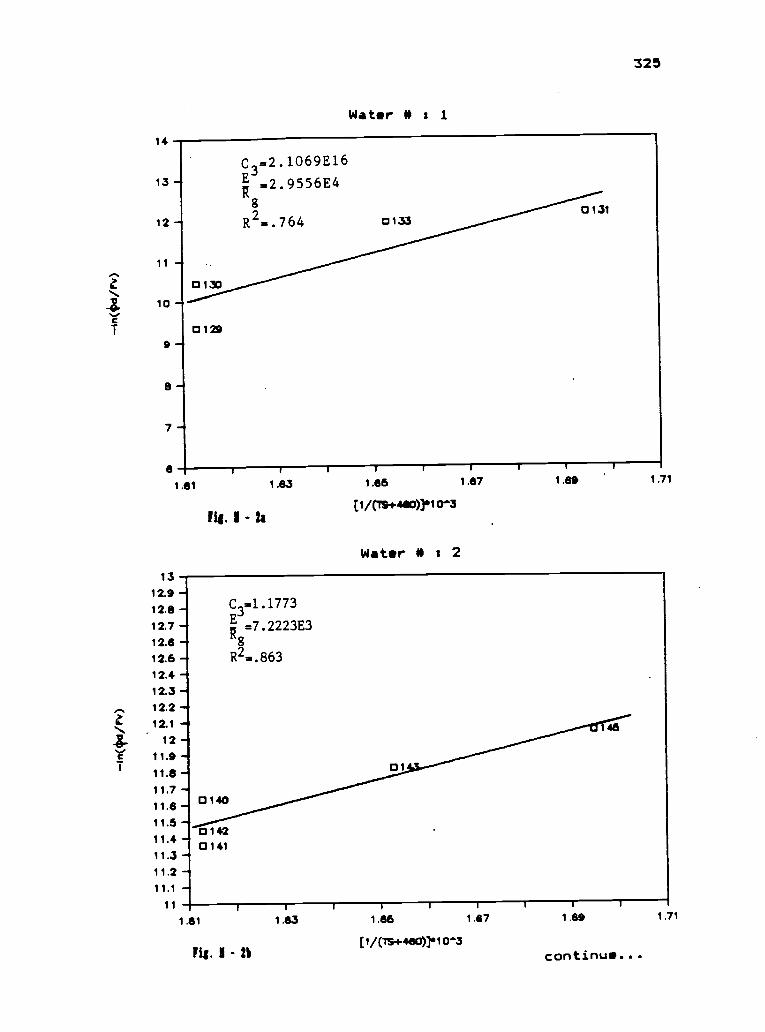
14
325
Water 40 : 1
13-.
12 -
11 -
2
10-
9 -
8 -
7-
8
13
1.61 1.83
lig. I - 21
1.65
(1/(79+410))S10^3
Water 41 : 2
1.67 1.71
12.9 -t2.8 - C =1 1773
12.7 E3
ir =7 2223E3
12.8 -12.5 R2=.863
12.4 -12.3
12.2 -12.1 -4
12 -0t 11.911.8 - 01
11.711.6 -0 0 140
11.50 142
11.40 141
11.3 -11.2 -11.1 --
11
1.61 1.63 1.86 1.87
fig. 1 - 2b
[1/(15+480)]010"3
I I
1.89 1.71
continue...
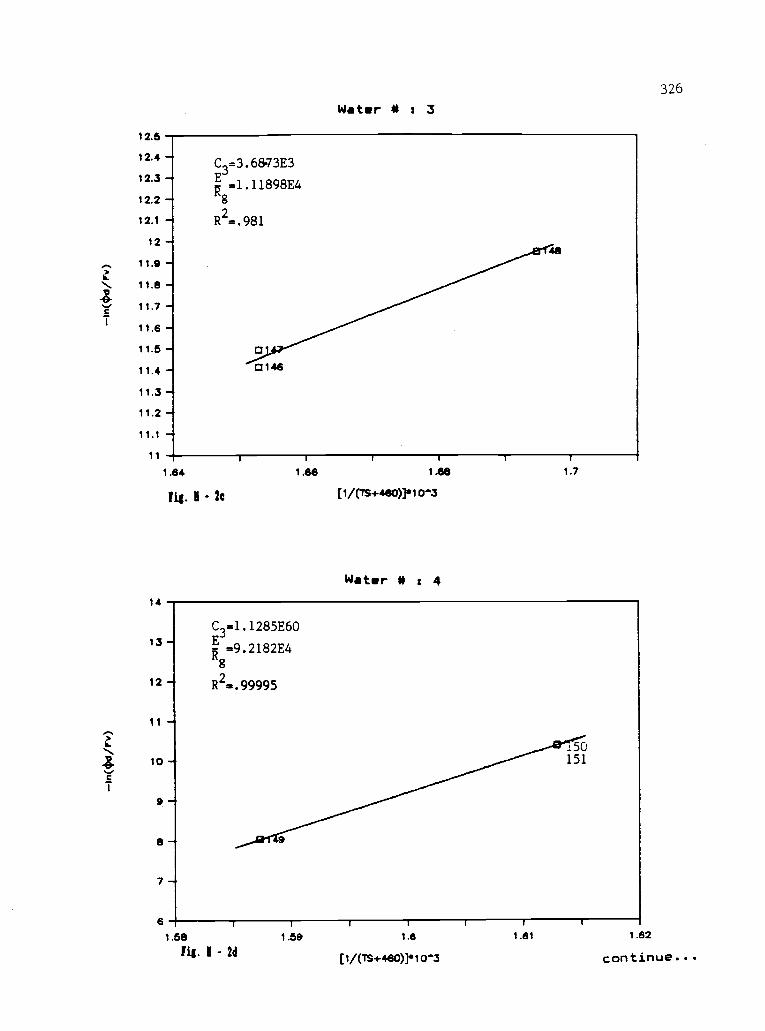
12.5
Water 46 : 3
12.4 -C.1=3.68W3E3
12.3 - E'g .1.11898E412.2 - ng
12.1 - R2=.981
12-11.9 -
11
14
13-
12 -4
11 --
10-
i9
7
0146
1.64 1.86 1.88
lit. I - lc [1/(7S+480)]*10'"3
Water M : 4
1.7
C3
=1 1285E60
Rg=9.2182E4
R =.99995
6
1.58fit I - 2d
150151
9
1.59 1.6
[1/(TS+460)?1Cr3
326
1.62
continue...
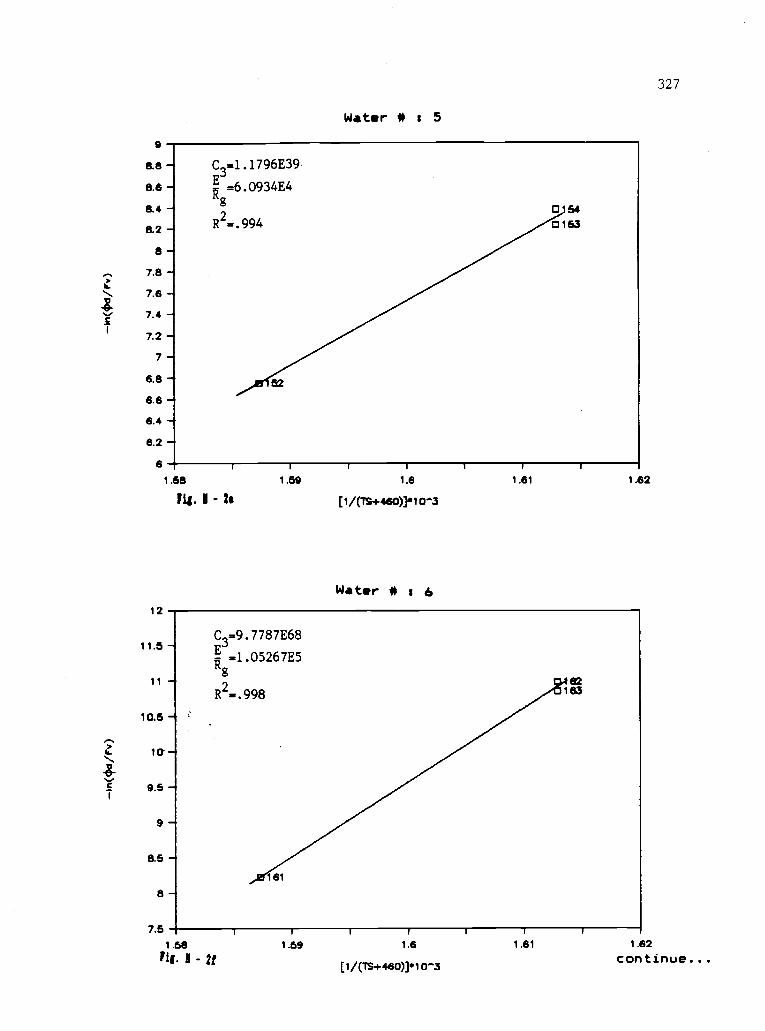
9
Water a : 5
8.8 - C3=1 1796E39
8.6 - u =6.0934E4Ag
8.4 -
8 2 - R2 =.994.
a-7.8
7.6 -
7.4 -
7.2 -
7 -
6.8
6.6 -
6.4 -*
6.2 -*
6
1.58 1.59 1.8
fig. I - 2. [1/(1s+440].10'3
12
11.5 -
11 -
10.5
1t1
l-c 9.5 -0
Water a t 6
1.81 1.62
C3=9.7787E68
RE -1.05267E5
R2-.998
7.5
1.58HU. I - 2f
1.59 1.6
[1/(75+460]010-3
327
1 .62
continue...
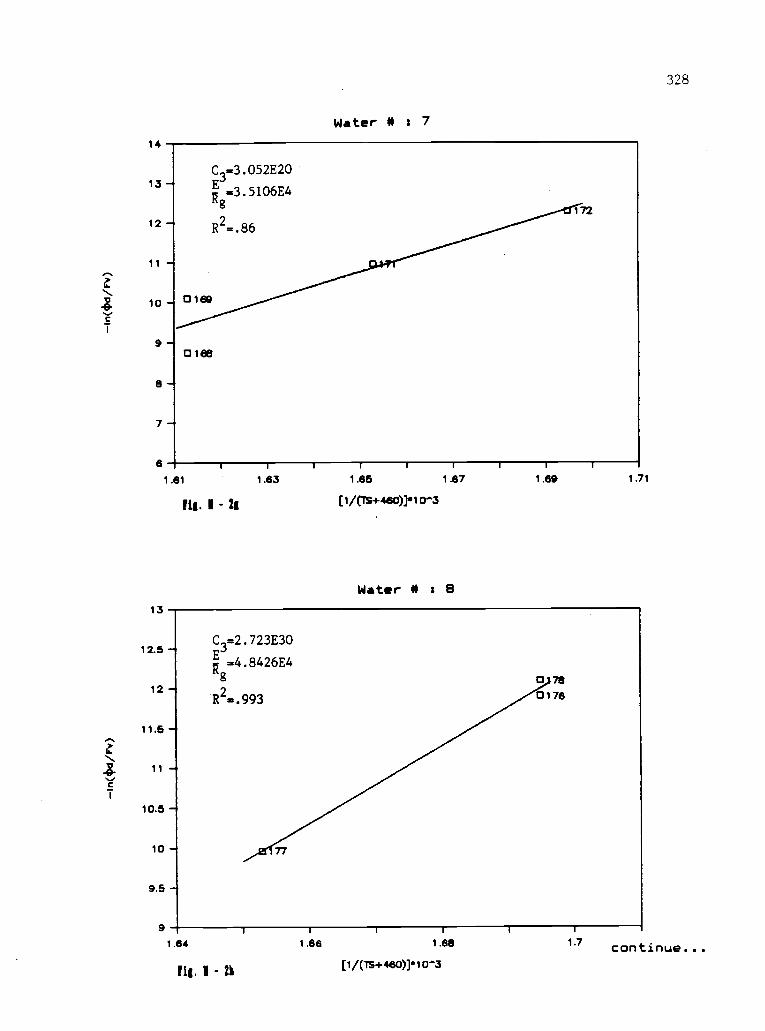
anuT4uo3
8Z
r-oi.[(oet+si)/i]
gal eat
-
*9'
9L ID 9L 0
6
r- S'6
01
TO
9'11
£66"c H Z - 8
739Z78'7= E a
sti 0E3EZCZ= 0
1C t
El = * J,941pm
r-oi4(cr9p+si.)/t]
69't Lat gal 1
n -
l 19'1
991 0
9
L 9
6
6910 -
It
98*-- Z
H - LI
ZLI 8
4 7390ICE= £3 - £1 OZUSWE= D
L t # Ja4Wm
Irt
z
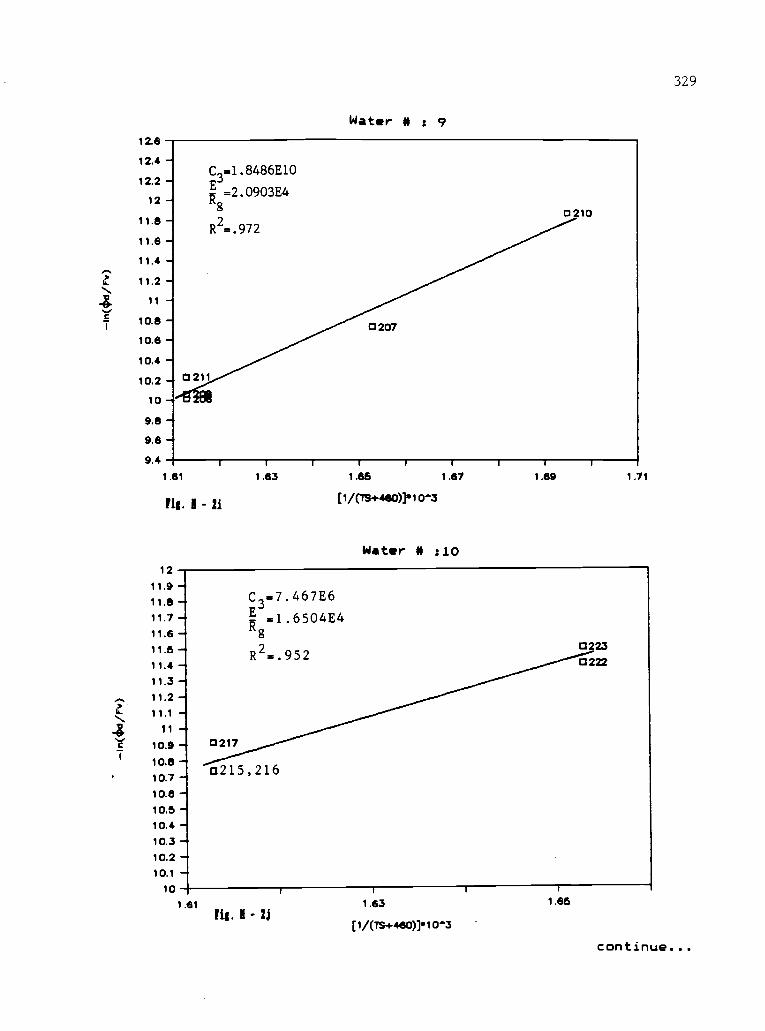
12.6
12.4 -
12.2-12
11.8 -
11.6 -I
11.4 -
11.2 -
11 -
10.8-10.6 -
10.4 -
10.2 -10-9.8 -9.6 -9.4
Water a 9
C3=1 8486E10
R= 2.0903E4
8
R2=.972
0 210
a 207
fig. I - 21
12
1.83 1.65
[1/(TS+4430)?10's3
1.87
Water a :10
1.69 1.71
11.9-11.8 C
3=7.467E6
11.7 - =1 6504E4R11.6 8
11.6 - a 223R2=.952
11.4 a222
11.3
11.2
11.1 -611
104 _ 13217
10.8 -10.7 13215,216
10.6 -10.510.4 -10.3 -10.2 -*10.1 -
10
1.81fig. I -
1
1.63 1.66
[1/(TS+460)?10-3
329
continue...
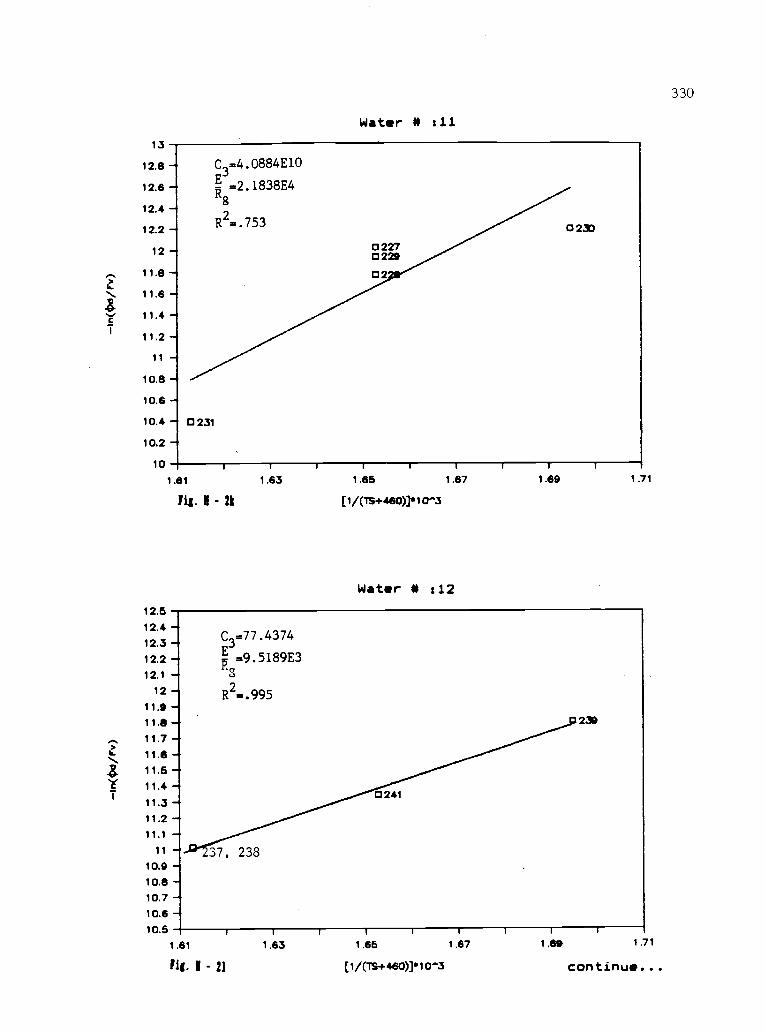
13
12.8 -
12.6 -
12.4 -
12.2 -
12
11.8 -
\ 11.6 -43.
11.4
11.2 -
11 -
10.8 -
10.6 -
10.4 - 0 231
10.2 *
10
Water * :11
C3=4 0884E10
=2.1838E48
R2=.753
0 2270229
02
0 230
1.81
/11. 1 - 21
12.512.4 -12.3 -12.212.1
12
11.9 -11.8 -411.7
a). 11.6
4 11.5c 11.4 *
11.3 -11.2
11.1
11 37, 23810.9 -10.8-10.7
1.63 1.85
[1/(7S+460)].10-3
1.67
Water * :12
1.69 1.71
C3 =77.4374
=9 5189E3Ro
R2 =.995
10,6 -10.5
0 241
239
1 .61
lit. d - 21
1 r r r 1 1
1.63 1.66 1.67
[1/(75+480)]*10-3
1 .69 1 .71
continue...
330
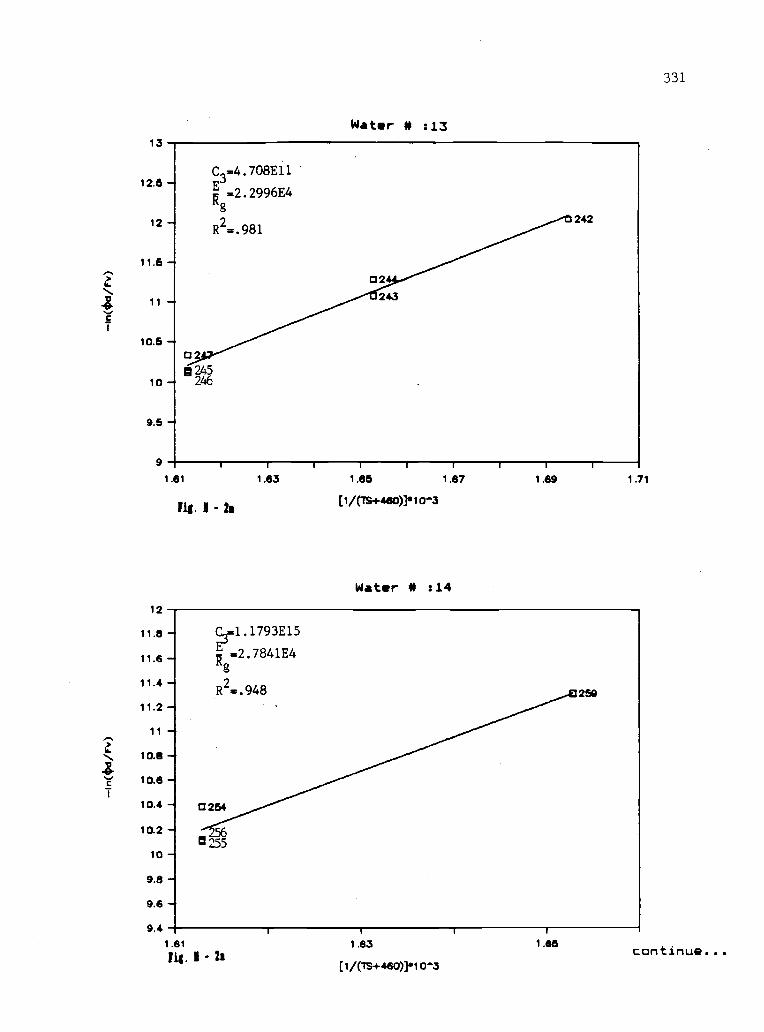
13
Water * :13
C =4.708E1112.6 - 0.2.2996E4
12 -4R2=.981
11.6 -
9.5 -
9
1.61
12
11.a -
11.6 -
11.4 -
11.2 -
11-A
10.8 -
10.6-
10.4 -
10.2 -
10-
9.8 -
9.6 -
242
fig. 1 - 22
1.83 1.85 1.87
(1/(TS+460)14,10"1
Water * :14
1.89 1.71
=1.1793E15
R =2.7841E4g
R2=.948
CI254
9.41.81
fig. 1 - 2i
259
1.83
[1/(15+460)1010-3
1.65
331
continue...
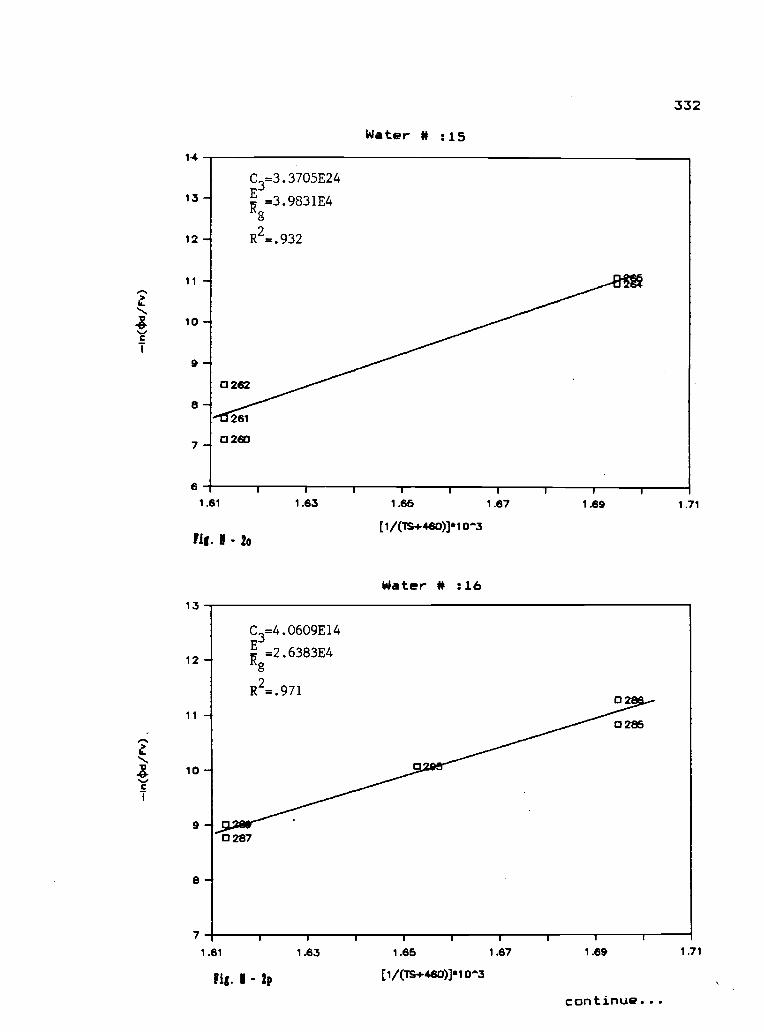
,it
4c
7
14
332
Water it :15
R
C3=3.3705E24
E13 - =3.9831E4Q
12 -
11 -'
10-t
9 -.
0 282
8-r
R2=.932
261
7 0 260-t
I I I I I I I I
1.63 1 .65 1.67
[1/(75+460]1'10"Z
Water # :16
1 .69 1.71
1.61 1.83 1 .65 1 .87
Iip. I - tp[1/(T5 +460)]10"3
continue...
1 .71
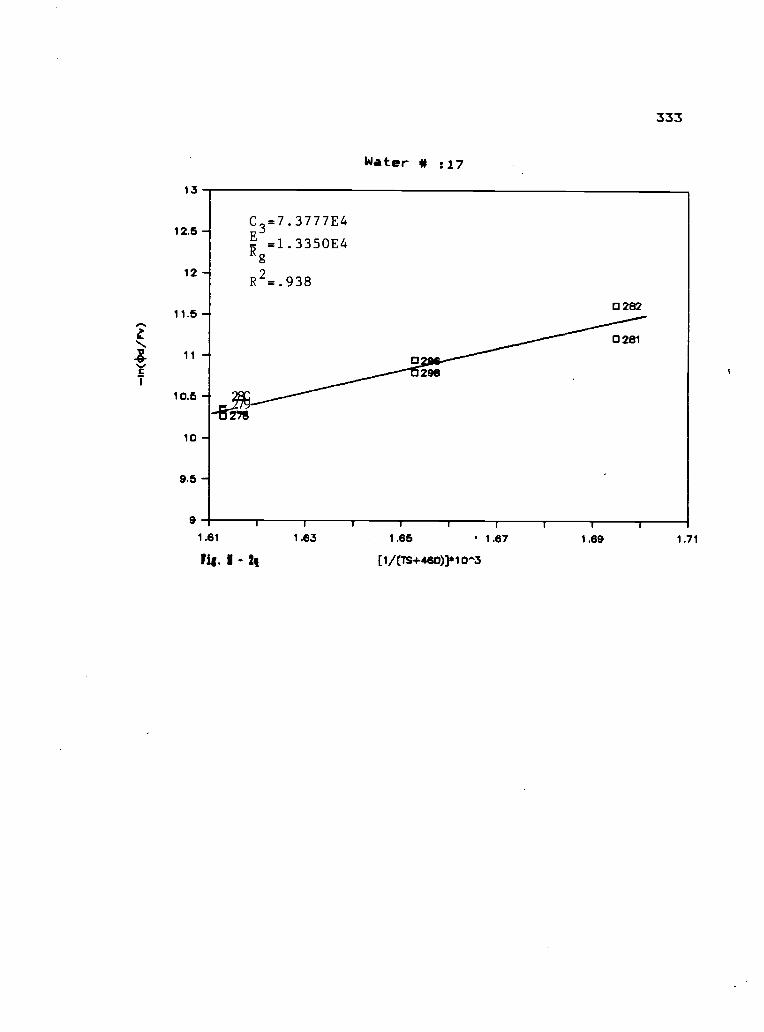
1
13
12.5 -
12 -
11.5 -
11 -*
10.5 -
10-
9.5 --
333
Water 40 :17
9 I I r r
1.81 1.63 1.e5 1.67
fig. I - 2q [1/os+40:01 o-.3
1.691
1.71
334
PLOTS OF CORRELATIONAL CURVES
Figs.M-3(a-q) Curves of Constant Velocity on Grid of Time
Constant vs Surface Temperature for the 17 different
water qualities observed in Table VI-2.
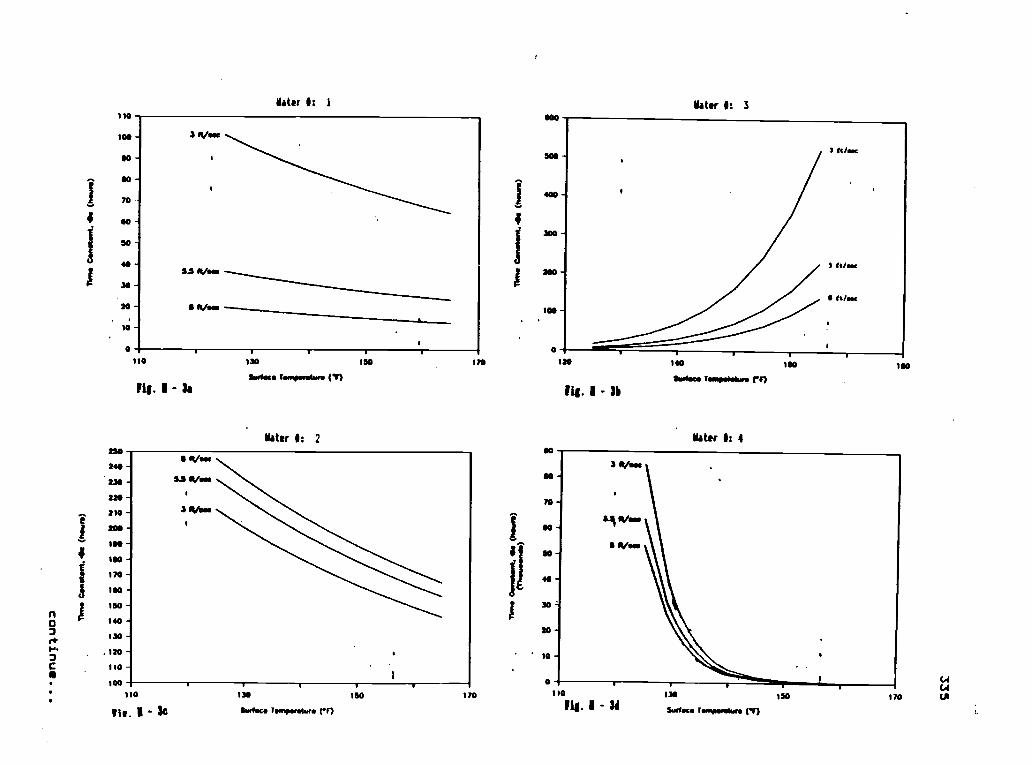
110
100 -
00 -
e0-
70
050 -
40 -
30 -
20 -
10
0
250
240 -
230-220 -
310 -e
200 -
190 -
1110
11110 -
n150 -
140 -3 130
1 120 -3C 110 -
loono
Water I: 1
5.5 Rise
110 130
rig. U - Ulisefor.a Tompemilmrs ()
Mater I: 2
150
Vie. - 3c Sur/.c. homponsture
170
170
I
00Water 1: 3
500 -
400 -
300 -
100
0
120
rig. I - 3b
140 1110 IMO
%Asp Temp-Mr. en
Water I: 4
Won
10-
110
lig. I - 34130 150
Unlace Forosnekore en
170
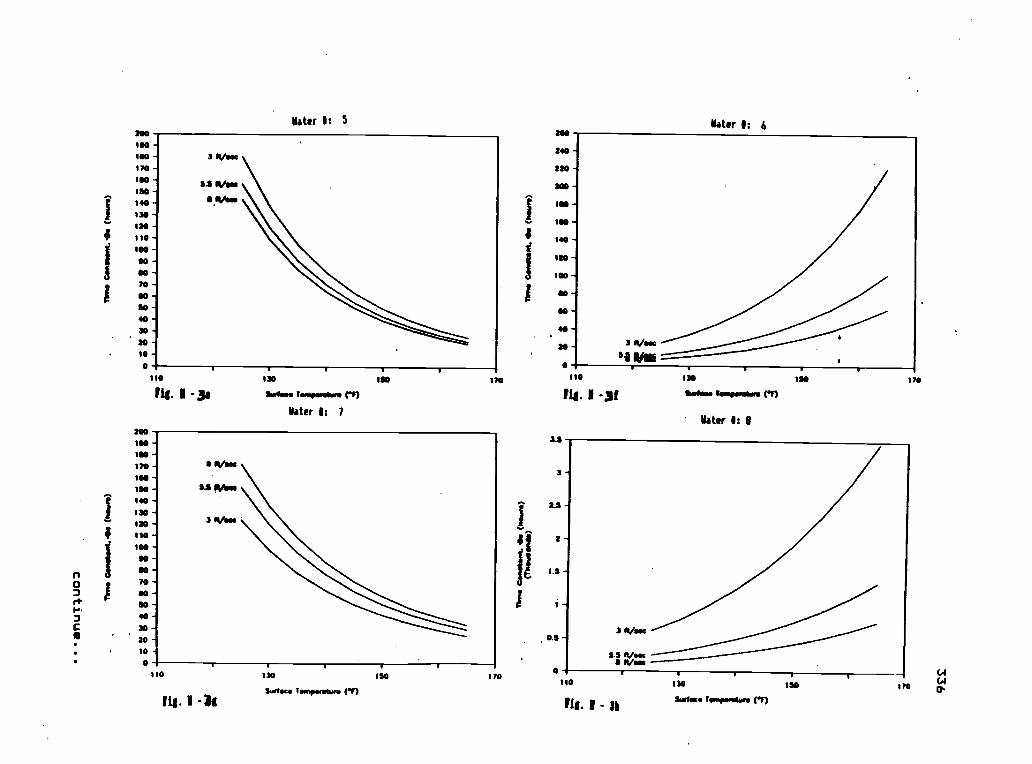
200150-ISO-110
-ISO
-ISOISO-ISO-140-130-120110 -100 -00-00 -70 -GO -50 -4030 -20 -10 -0
110
fig. -3
Mater 1: 5
200100ISO -170 -100 -ISO
-170 -120 -110-100
-nO 70 -
so -r 50-rC 30 -
20-100
110
130
5hso44.4 14/144444404 rnMater 1: 7
150 170
Pig. I -3g
130 150
Suttees Ionyedstore
170
200
240 -
220 -
200200-
ISO-
ISO-
140 -
NO -
I 100 -
1 SO -
00
40 -
20-
3.5
Mater 1: 6
Infig. I -3f Sreasse Tomoonobro CF)
Water 1:
ISO 170
7-
0
3.3 11/44411 West
110
lit. I - 31
130 150
suttee. Iimperobins170
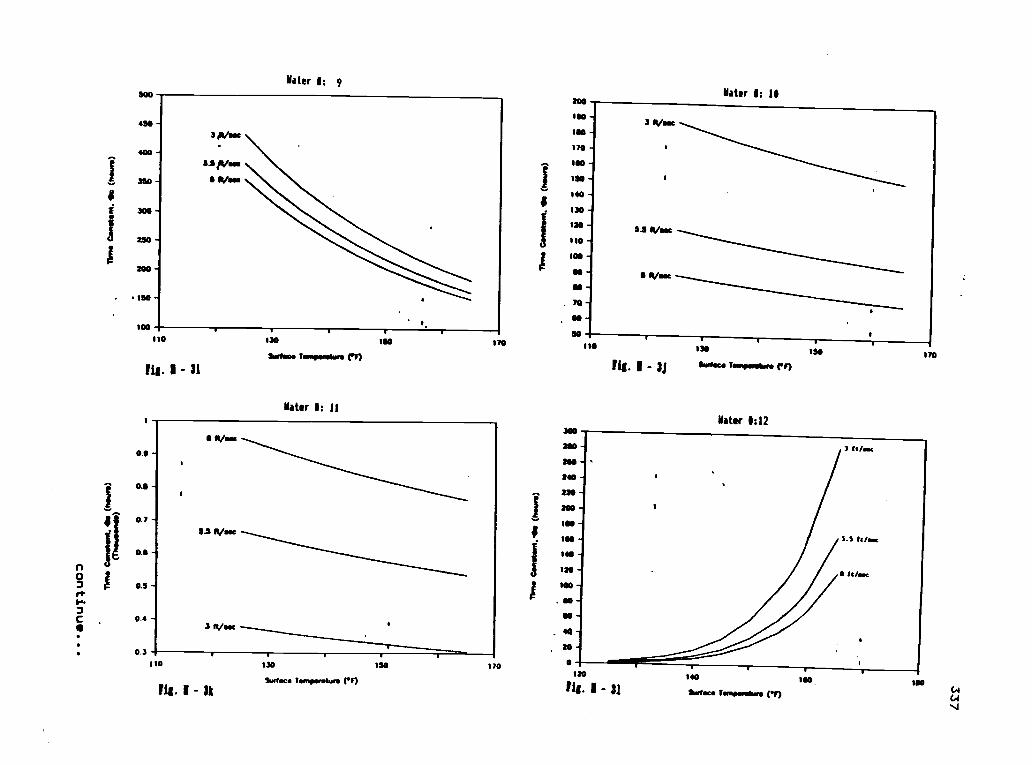
eater I: 9
rig. I - 31Sofia Tagroorolvto rn
Water 1: 11
0.11 -
0.11
0.7
0.0 -
0 13 F 0.5,rpba3CA
11 Ruse
11.3 11/ssc
'10
tic. I St
130
!aloes Tompowetwoo rn
ISO 170
Ii
II
Iir
I;
300
WO -
SOO -
240 -
220 -
200 -
100 -
ISO -
10 -120 -
100 ,
SO -
. 40 -
20 -
III. I - SJ Surface Impesoluto en
Water 1:12
-,--,rig. r - 31 Susloca Tonipeolaws tfl
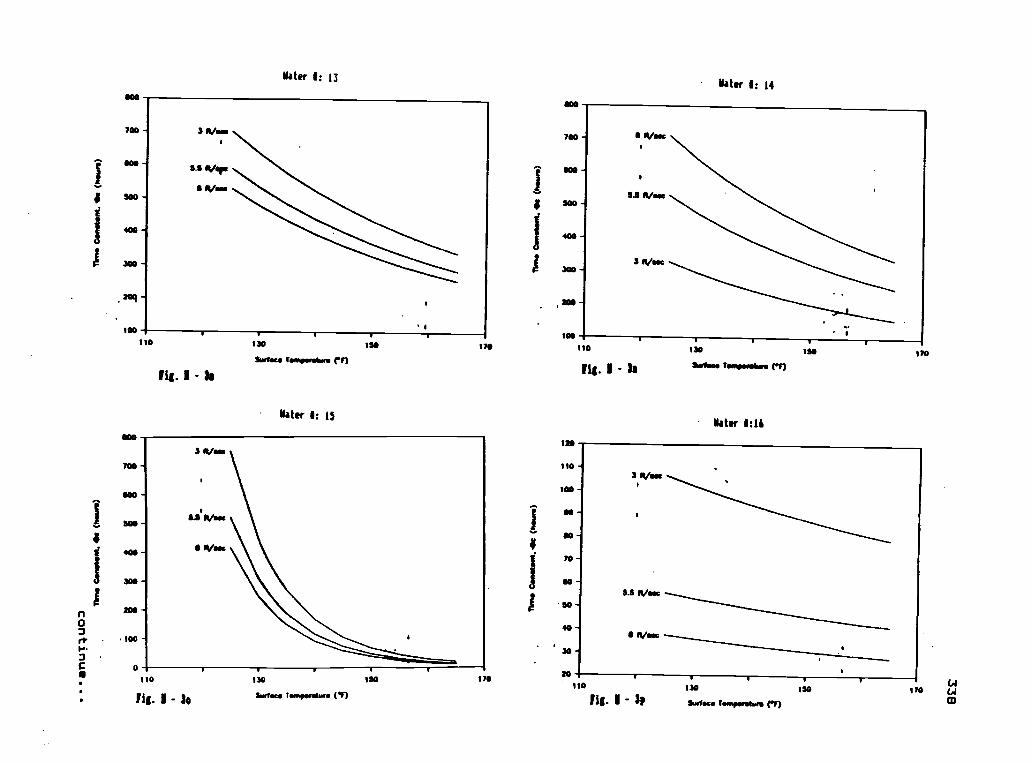
Water 1: 14
110
120
110
tic h130
Sur4464 T0.0.00. en
later 1:11
100 -
110 -
SO -
70 -
SO -
00 -
40 -
170
1
100
700
000
500
400
300
100
aaq
Mater 1: 13
130
Swims rn
Water 1: 15
fit. I $o
130
&MIKA lemperuf (.1)
I
4
tic 1130 150
w
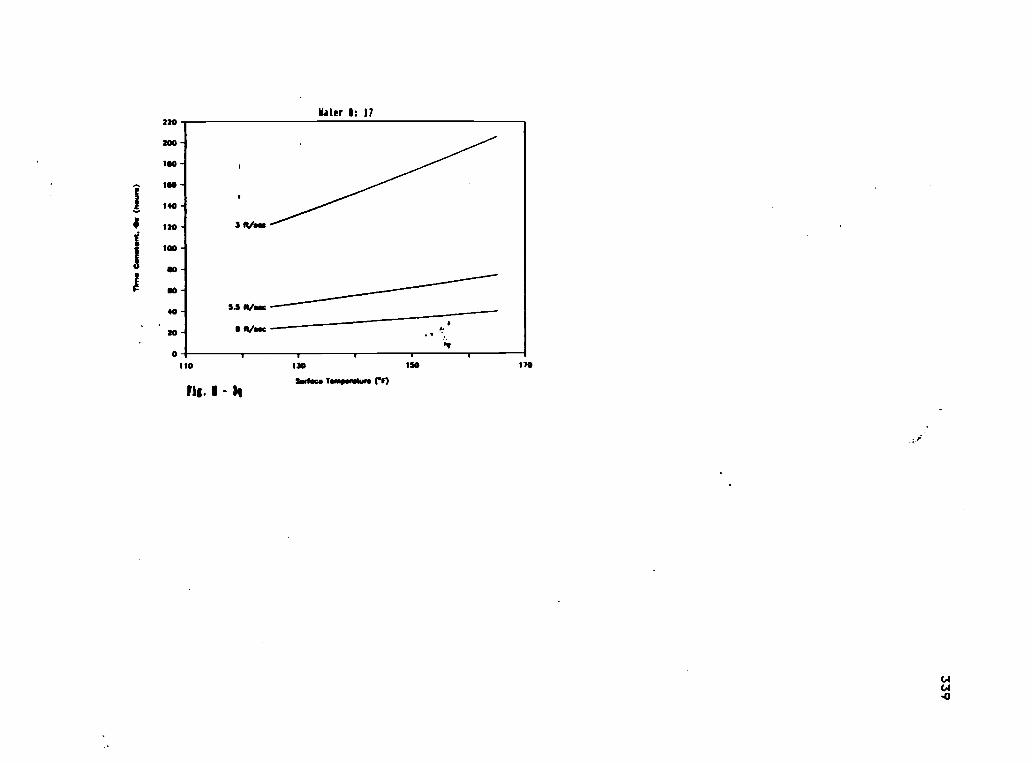
no
200 -
ISO -
NO -
140 -
ISO -
100 -
S O -
S O -
Water 1: 17
130
balms TompsrsIurs en
170
340
PLOTS OF CORRELATIONAL CURVES
Figs.M-4(a-q) Curves of Constant Velocity on Grid of (Time
constant x Shear Stress) vs Surface Temperature for the
17 different water qualities observed in Table VI-2.
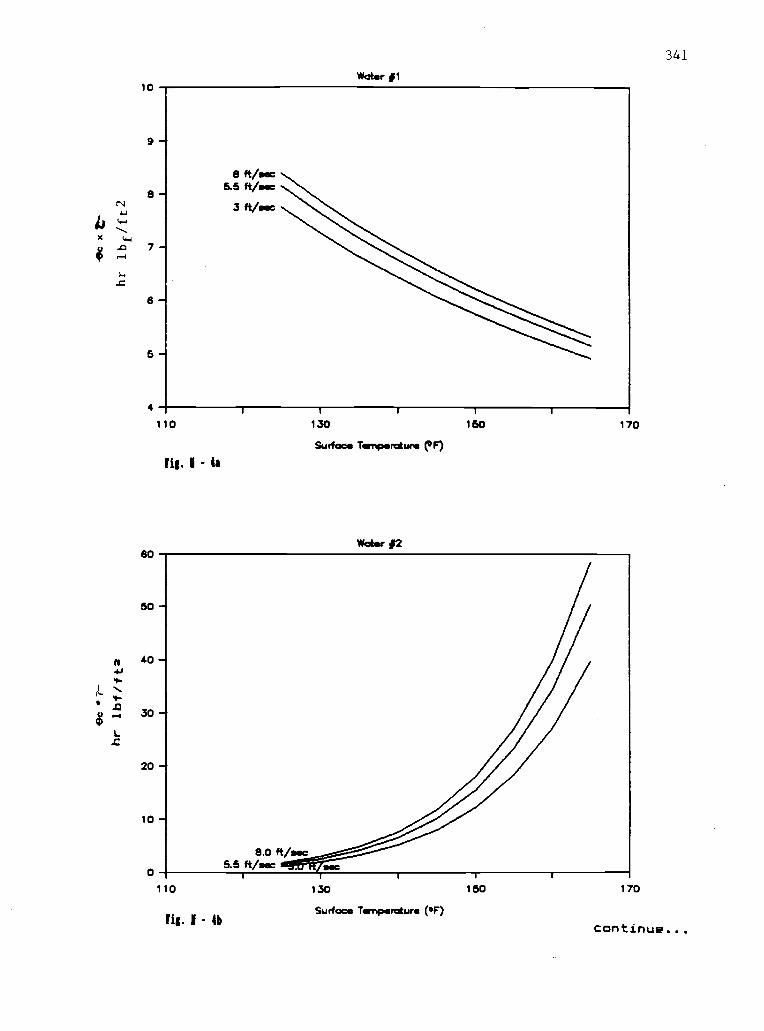
Water 01
341
60
Fib. I - 44
Surface Temperature (0F)
Water la
50 --.
40
30 -,
20
10-
o
110
Fig. I - 4bSurface Temperature (OF)
170
continue...
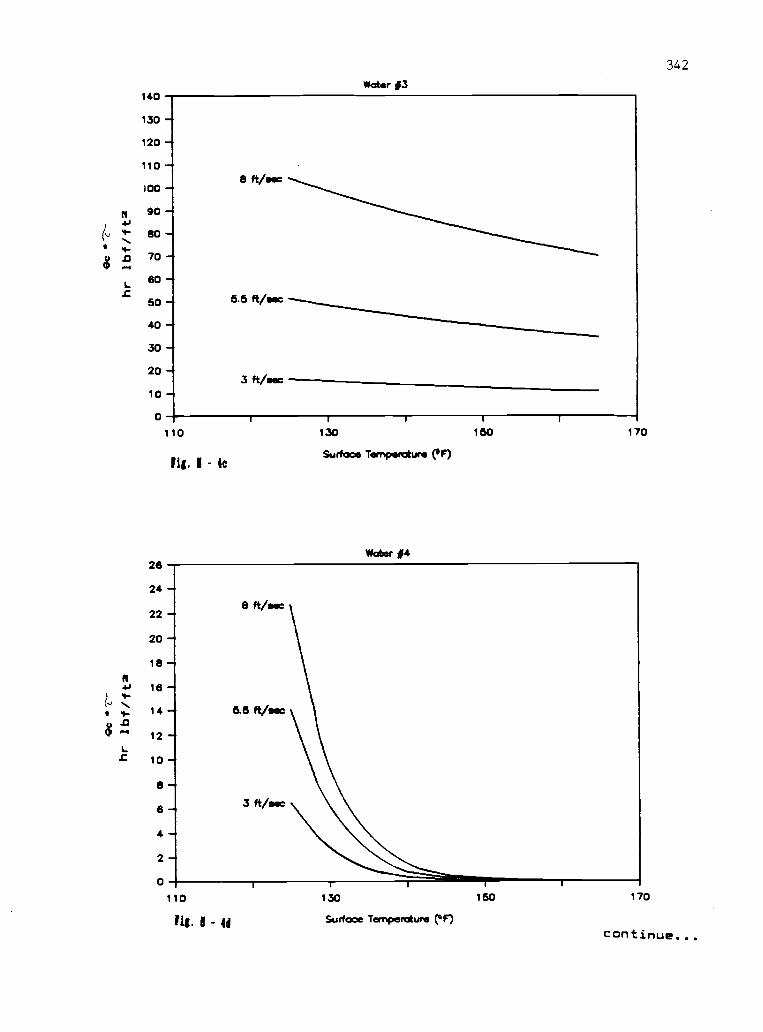
l,
$
140
130 -,
120 -
110 -
I00 -
90 -*
so
Water #3
342
70-,
60 -
50 -
40 -
30 -
20 -
10 '',
0
8 ft /sec
5.5 ft /sec
3 ft /sec
110
fig. I 4c
26
24 -
22 -,
20 -,
18 -n+I 16-
1 .&-II .1. 14 -
u.0
CP '" 12 -*L.0 10 -
8-6 -I
4 -
2-0
110
fig. I - 4d
1 t
130I
Surface Temperature (°F)
Water 04
150I
170
8 ft /sec
5.5 ft/sec
3 ft/sec
r130
Surface Temperature (°F)
150 170
continue...
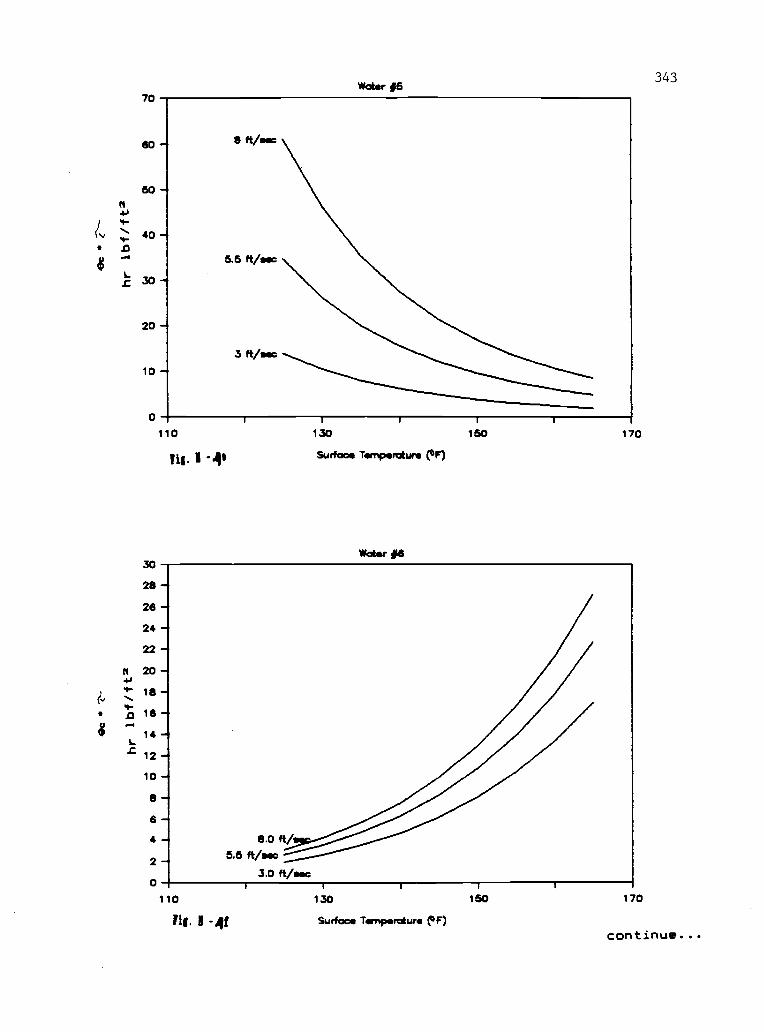
4,
$
Water #6343
111. I -4,
30
28
28
24 -4
22 -
N 20 -4J
I .4
jj--.
6+i 0
,-* 18 -4
S...4
1 4 *Lt 12
10
Surface Temperature (IF)
Water #8
8
8-,4
2-0
110
fig. I -4f
I
130
Surface Temperature (F)
1
150 170
continue...
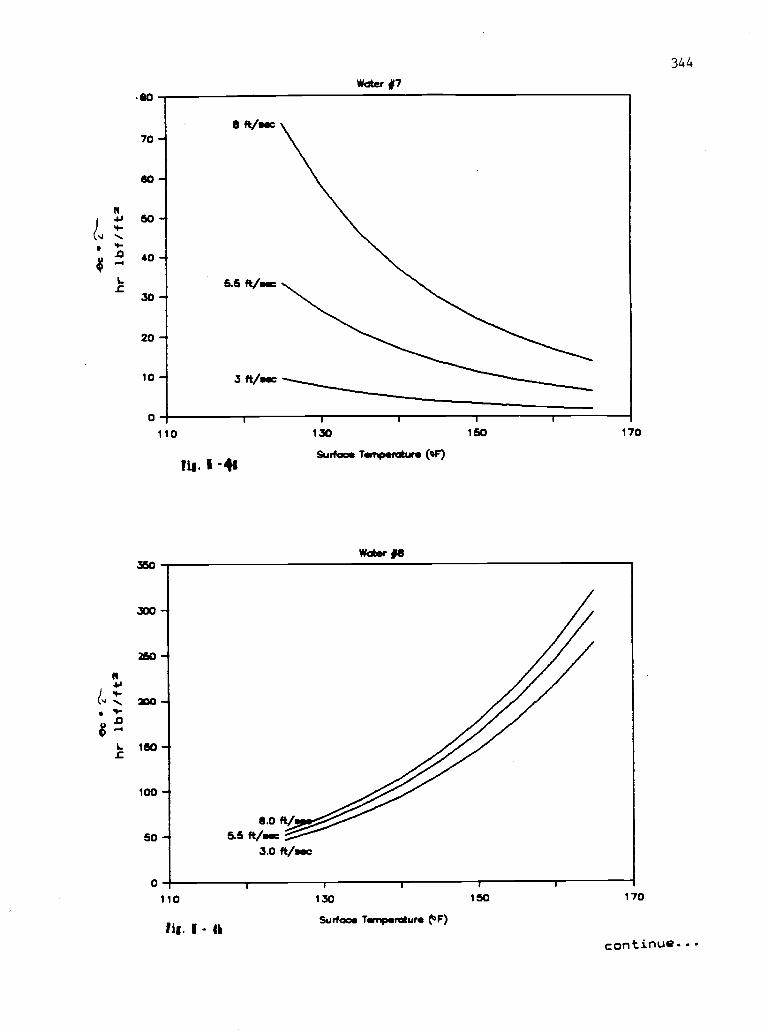
.80Water 07
70 -4
80-1
50
40
30
20 -6
10 -
0
8 ft/eec
5.5 ft /Mc
3 ft /see
110
Iii. I -41
130
Surface Temperature (oF)
Water 08
150 170
Hu I - lbSurface Temperature F)
344
continue...
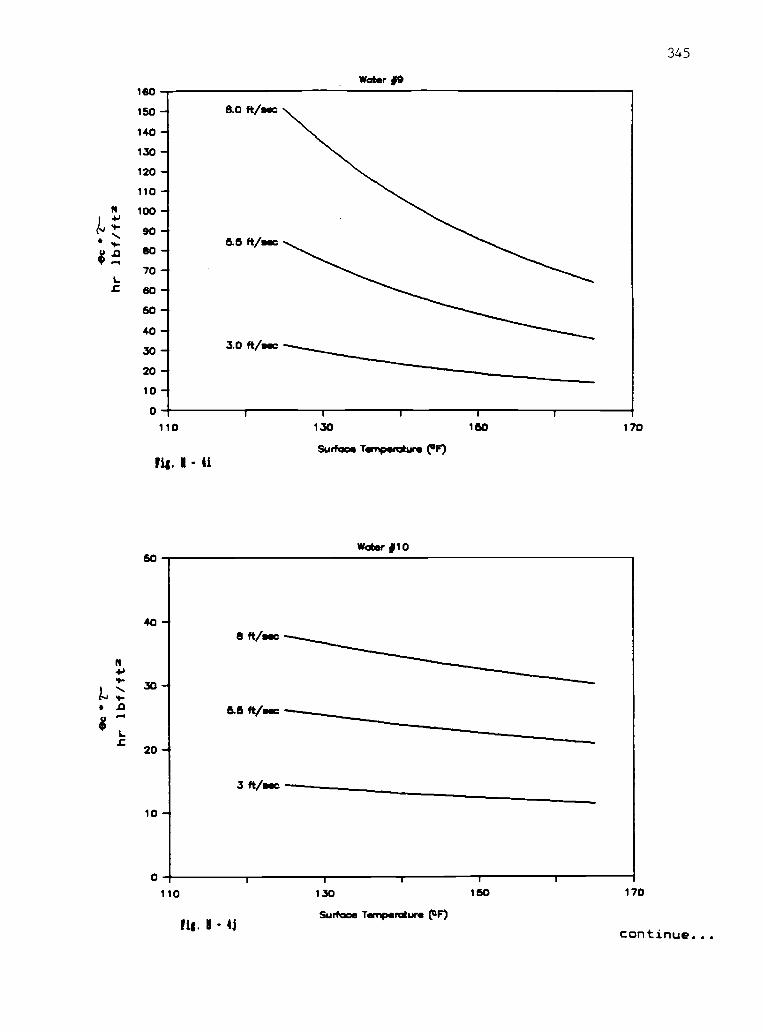
N
1"
N
180
150 -
140 -
130 -
120 -
110
100 -
90
80
70
80
60
40 -30 -20 -10
0
Water #9
8.0 ft/sac
5.5 ft/sec
3.0 ft/sec
110
fig. I - 41
130
Surface Temperature (°F)
Water #10
160 170
fig. I 4iSurface Temperature (0F)
345
continue...
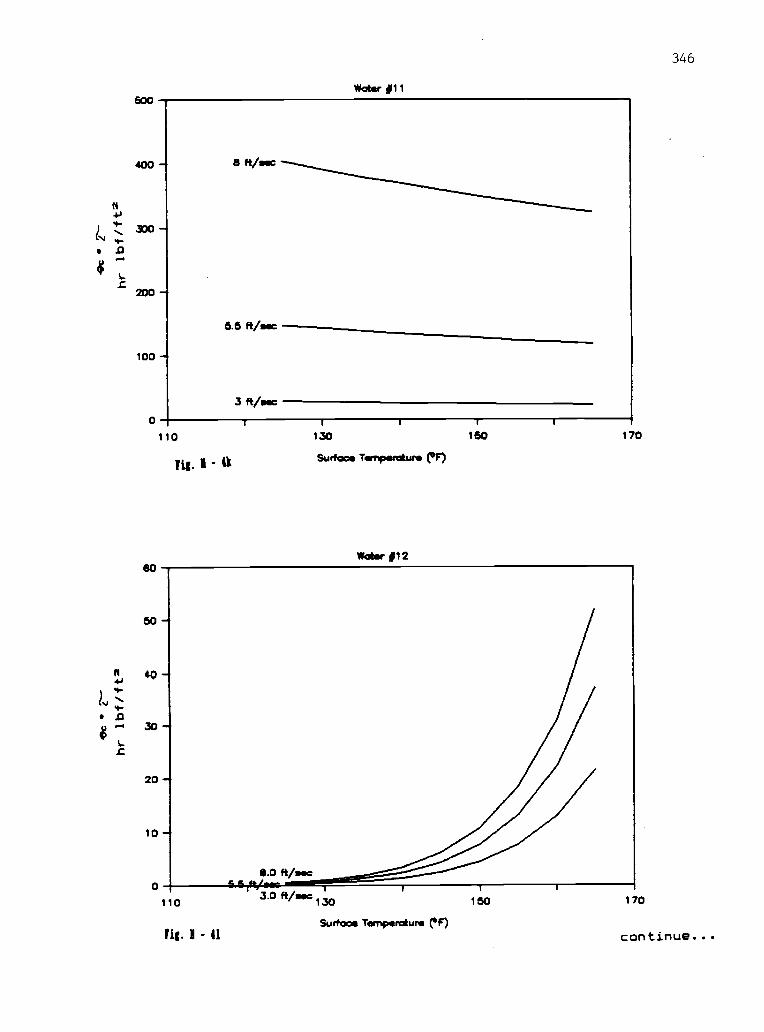
GOO
Water #11
346
400 '
200
100 -"4
0
80
8 ft/eec
5.6 ft /eac
3 ft /oec
110
rig. Il 6
i
1301
Surface Temperature (°F)
Water #12
r150
t
170
50
20
10
0-110
rig. I - 41
8.0 ft/esc
3.0 ft ime130
Surface Temperature (F)
150 170
continue...
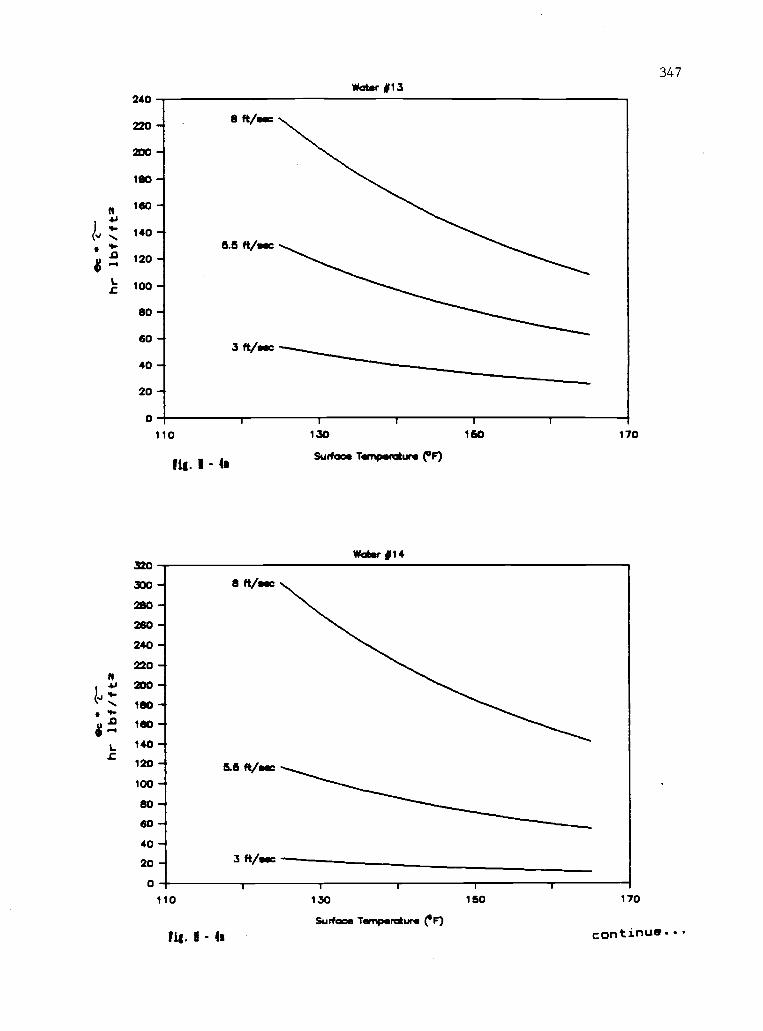
L.c
240
220
200
ISO
180
140 -4
120 -
100
80 -
80
40
20 '4
0
Water #13347
8 Vow
5.5 ft /sec
3 ft /Me
1
110
320
300 -
280 -
280 -4
240
220
fig. I 48
1
130
Surface Temperature (°F)
Water #14
I
160I
170
N.4 200
J 4-\ 180 -*"4"
$ .".0 180
L 140.0
120
100 -
80 -4
60-'40 -4
20
0
8 ft/eec
6.6 ft/sec
3 ft /ese
110
fig. I - 4s
I
130
Surface Temperature ('F)
1
150 170
continue.
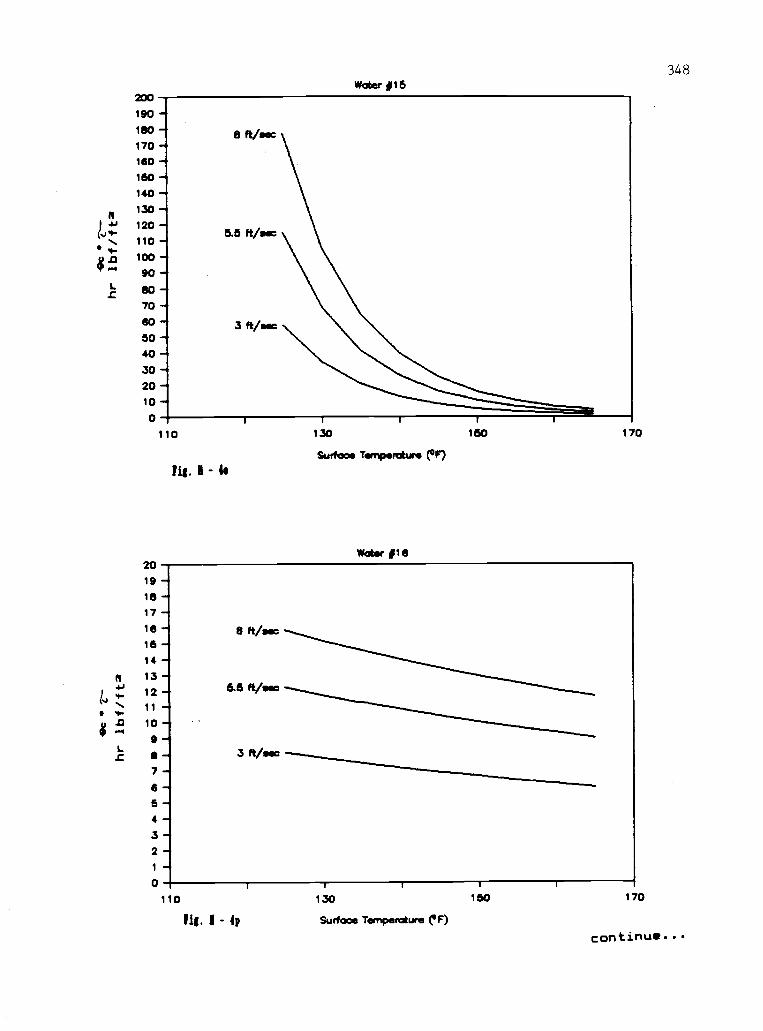
200190 -180 -170 -4160 -160 1140 -4
a130 -4
I -4' 120-110-i
,,,.XI 100 -
90 -L 80C
70 -60 -450 -440 -430 -,20 -410 -0-
110
2019 -18 -17 -16-16-14 -13 -12 -44
11 -10 -10 -/II -47 -6 -6 -4 -43 -2-1 -40
Water #16348
Iii. I - 44
130 160
Surface Temperature (IF)
Water #16
170
8 ft/sec
6.5 ft/eso
3 ft/sec
110
Fig. 1 - 4p
r130
Surface Temperature (F)
160 170
continue...
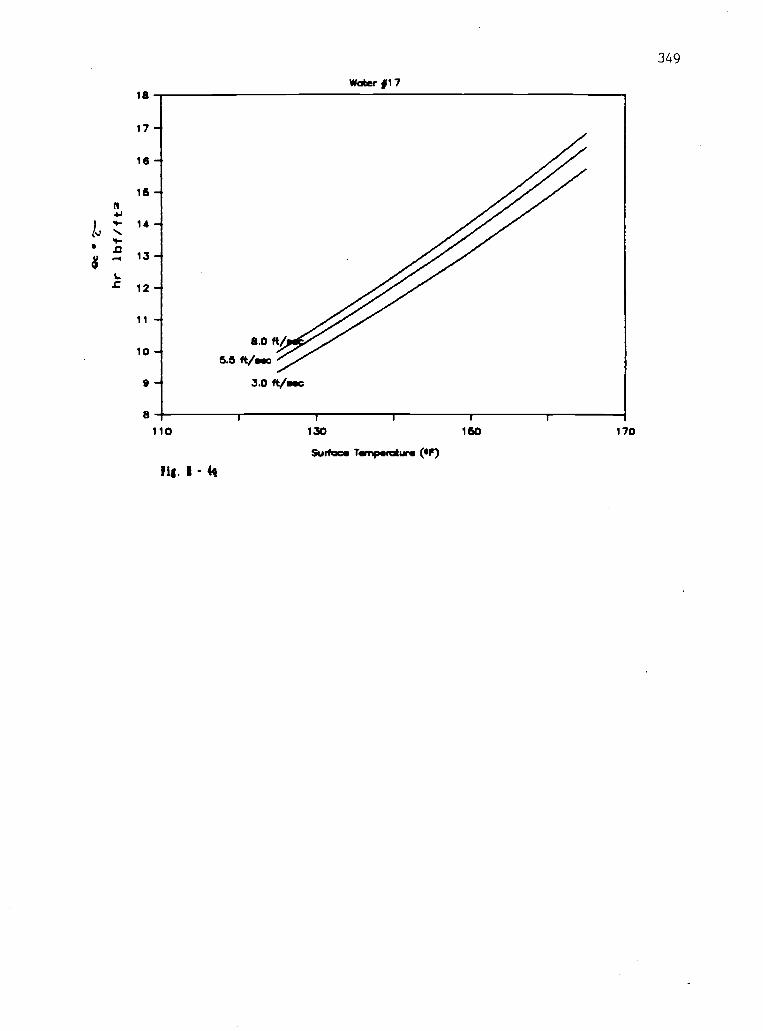
1.
$
18
17 -
US -
lb -n4J4- 1414-.0.-4 13 -
S.t 12
It -
10 -
9 -4
8
Water #17
110
fig. I 49
1
1301
Surface Temperature (OF)
1
1601
170
349