Critical flux concept for microfiltration fouling
14
ELSEVIER Journal of Membrane Science 100 ( 1995) 259-272 journal of MEMBRANE SCIENCE Critical flux concept for microfiltration fouling R.W. Field a,., D. WU a, J.A. Howell a, B.B. Gupta b a School of Chemical Engineering, University of Bath, Bath BA2 7AY, UK URA CNRS 858, University of Compi~gne, Compi~gne, France Received 29 October 1993; accepted in revised form 14 October 1994 Abstract Several constant-flux filtration experiments for yeast cell suspensions, yeast cell debris, and dodecane-water emulsion were performed at various operating conditions in both fiat-sheet and tubular-membrane systems. The aim of the paper is two-fold. Firstly the relationship between constant-flux behaviour and membrane fouling is discussed. In some cases constant-flux filtration was realized at a constant transmembrane pressure which was below a critical value. In general constant-flux filtration was obtained with moderately increasing transmembrane pressure, and this approach is shown to have some advantages over normal constant-pressure filtration because it clearly provides for the possibility of avoiding over-fouling and so reduces the severity of fouling. Secondly, the concept of critical flux is introduced. Whilst it has long been recognised that low-pressure microfiltration is much more effective than high-pressure microfiltration, the emphasis in this work is upon the possible existence of a critical flux and the desirability of starting filtration operations at a low flux. The critical-flux hypothesis is that on start-up there exists a flux below which a decline of flux with time does not occur. Equations which may enable identification of the appropriate flux level are included. Keywords: Critical flux; Fouling; Membrane filtration;Dodecane-water emulsion; Yeast suspensions 1. Introduction One of the major problems in pressure-driven membrane processes is the reduction of the flux to far below the theoretical capacity of the membrane. The typical variation of the flux with time is that of an initial rapid decrease followed by a long and gradual flux decline. It is well known that membrane fouling is one of the main phenomena responsible for this. The occur- rence of fouling affects the performance of the membrane either by deposition of a layer onto the membrane surface or by blockage or partial blockage of the pores. This changes the effective pore size dis- tribution. * Corresponding author. 0376-7388/95/$09.50 © 1995 Elsevier Science B.V. All rights reserved SSD10376-7388(94)00265-7 The following equation can be used to describe the overall characteristics of flux reduction as determined during a filtration experiment [ 1 ] : TMP TMP J /z(Rm+Rf) tz(Rm+Rir+Rr) (1) where J is the permeation flux, TMP is transmembrane pressure,/x is viscosity and R m is the clean membrane hydraulic resistance. Rf accounts for both polarisation and fouling effects on the flux and could be written as the sum of an irreversible fouling Rir (which is not reduced to zero when the pressure is released) and Rr which includes reversible fouling and the polarisation effect. The avoidance of fouling or reduction of its severity has been pursued for decades. However, up to now one
Transcript of Critical flux concept for microfiltration fouling

E L S E V I E R Journal of Membrane Science 100 ( 1995 ) 259-272
journal of MEMBRANE
SCIENCE
Critical flux concept for microfiltration fouling
R.W. Field a,., D. WU a, J.A. Howell a, B.B. Gupta b a School of Chemical Engineering, University of Bath, Bath BA2 7AY, UK
URA CNRS 858, University of Compi~gne, Compi~gne, France
Received 29 October 1993; accepted in revised form 14 October 1994
Abstract
Several constant-flux filtration experiments for yeast cell suspensions, yeast cell debris, and dodecane-water emulsion were performed at various operating conditions in both fiat-sheet and tubular-membrane systems. The aim of the paper is two-fold. Firstly the relationship between constant-flux behaviour and membrane fouling is discussed. In some cases constant-flux filtration was realized at a constant transmembrane pressure which was below a critical value. In general constant-flux filtration was obtained with moderately increasing transmembrane pressure, and this approach is shown to have some advantages over normal constant-pressure filtration because it clearly provides for the possibility of avoiding over-fouling and so reduces the severity of fouling. Secondly, the concept of critical flux is introduced. Whilst it has long been recognised that low-pressure microfiltration is much more effective than high-pressure microfiltration, the emphasis in this work is upon the possible existence of a critical flux and the desirability of starting filtration operations at a low flux. The critical-flux hypothesis is that on start-up there exists a flux below which a decline of flux with time does not occur. Equations which may enable identification of the appropriate flux level are included.
Keywords: Critical flux; Fouling; Membrane filtration; Dodecane-water emulsion; Yeast suspensions
1. I n t r o d u c t i o n
One of the major problems in pressure-driven membrane processes is the reduction of the flux to far below the theoretical capacity of the membrane. The typical variation of the flux with time is that of an initial rapid decrease followed by a long and gradual flux decline. It is well known that membrane fouling is one of the main phenomena responsible for this. The occur- rence of fouling affects the performance of the membrane either by deposit ion of a layer onto the membrane surface or by blockage or partial blockage of the pores. This changes the effective pore size dis- tribution.
* Corresponding author.
0376-7388/95/$09.50 © 1995 Elsevier Science B.V. All rights reserved SSD10376-7388(94)00265-7
The following equation can be used to describe the overall characteristics of flux reduction as determined during a filtration experiment [ 1 ] :
TMP TMP
J /z(Rm+Rf) t z ( R m + R i r + R r ) (1)
where J is the permeation flux, TMP is transmembrane pressure, /x is viscosity and R m is the clean membrane hydraulic resistance. Rf accounts for both polarisation and fouling effects on the flux and could be written as the sum of an irreversible fouling Rir (which is not reduced to zero when the pressure is released) and Rr which includes reversible fouling and the polarisation effect.
The avoidance of fouling or reduction of its severity has been pursued for decades. However, up to now one

260 R. W. Field et al. /Journal o f Membrane Science 100 (1995) 259-272
must match measures to a specific membrane process due to the complexities of fouling phenomena. Three major approaches can be identified [2] : hydrodynamic (changing flow regime across the membrane surface), surface modification (changing the surface/foulants affinity) and regular cleaning. Now the usual way of characterising the filtration behaviour is to perform constant TMP filtration experiments and to study the variation of flux with time for various operating con- ditions. However, as pointed out by Aimar and Howell [ 1 ], the interpretation of the data from constant-pres- sure experiments often causes problems since the flux variation produces changing conditions (of concentra- tion, rheology, solubilities, etc.) in the boundary layer throughout any experiment. Turker and Hubble [3] designed a experimental set-up operating at constant permeation flux to investigate the fouling of an ultra- filtration membrane. Aimar and Howell [ 1 ] proposed to maintain the flux constant during a run, the TMP then becoming a dependent variable. In such a way one can expect the flow of material to be better controlled since the convective flow of solute towards the membrane is then constant throughout a run. In addi- tion, for some chemical and biochemical processes involving a membrane reactor, a constant flux filtration is definitely demanded. Therefore, more studies on con- stant flux filtration are useful both to elucidate fouling mechanisms and to develop processes combining reac- tions and separations.
In the present work, results of various constant-flux microfiltration (MF) experiments are reported. Their relationship to membrane fouling is then discussed. In particular the authors introduce the concept of critical flux together with equations which may enable identi- fication of the appropriate flux level to minimize foul- ing and so improve the filtration performance of MF membrane processes.
2. Experimental
2.1. Terminology
The terminology used to describe the various oper- ating modes is defined in Table i.
Two Reynolds numbers were defined. Re is the Reynolds number of the net forward flow in the BP mode or cross-flow Reynolds number in the B and ET
modes. Rep is the peak Reynolds number of the super- imposed oscillatory flow. X and f are respectively amplitude (in mm) and frequency (in Hz). (Rep = p. Vp. D./ . t - 1, where p is the density of the feed suspension, D is the I.D. of membrane tube or the equivalent diameter of a channel,/z is the viscosity of the suspension and Vp = 21r.f.X is the peak velocity of oscillatory flow.)
A summary of the experiments is given in Table 2, and the details can be found in the related description below.
2.2. Materials
Dodecane-water emulsion Dodecane (Fluka, Switzerland, >98% GC) was
added to distilled water and was mixed at high shear in a blender (Waring, USA) for 6 min. The emulsion of 0.1 wt.-% was stable during experiments.
2.3. Yeast cell suspension
Fresh bakers yeast (Saccharomyces cerevisiae) was obtained from British Fermentation Products as com- pressed cake. The yeast was diluted down for use with a solution of l0 mM phosphate buffer (pH 8.8) and 1 g l - 1 bacteriological peptone. Further details are given elsewhere [4].
Table 1 Terminology to describe the various operating modes
Abbreviation Description
ET
B BP
ETP
Conventional usage of tubular or flat-sheet membrane Baffled tube or flat sheet, no pulsing Baffled tube or flat sheet with pulsations being produced by the dual-beaded pump Unbaffled system with pulsed flow
Table 2 Summary of experimental set-up
Process fluid Flat-sheet system Tubular system
Yeast cell suspension ET, ETP, B and BP modes ET and B modes Yeast cell debris BP mode Dodecane-water ET and B modes emulsion

R.W. Field et al. / Journal of Membrane Science 100 (1995) 259-272 261
m i D . -
transducers as described in Ref. [4]. Net forward flow or steady flow was measured by a calibrated rotameter. A temperature of 30°C was used for all runs except those with the dodecane-water emulsion. In this case 25°C was chosen. Temperature control was maintained by a coil situated in the feed tank.
Fig. 1. Helical baffle used for mode B runs with the Carbosep
membrane.
2.4. Yeast cell debris (YCD) suspension
Fresh bakers' yeast (S. cerevisiae) was slurried in 4 mM potassium phosphate and 150 mM sodium chloride solution (40% wet weight suspension, i.e. 12% dry weight) and then disrupted. Also some YCD (3% dry weight) suspension was incubated at 29-3 I°C for 3.5 h whilst it was agitated by a magnetic stirrer (this suspension is denoted incubated YCD). Further details are given elsewhere [5].
2.5. Filtration systems
Two filtration systems were employed in this work. The main system consisted of a tubular membrane (Carbosep 0.14/zm, Life Science Laboratories). For some experiments a newly developed baffle subject to patent protection was employed. The shape of this baf- fle is shown in Fig. 1. This system was only operated under steady flow (i.e. in ET and B modes).
Reference is also made to a previously used flat-sheet MF unit where a flat-sheet membrane was mounted in a stainless-steel module with a perspex insert providing ten parallel channels each 8 mm wide, 1 mm high and 84 mm long. Rectangular baffles 0.4-0.6 mm in height were embedded in the insert and the spacing between two baffles was 4 mm. A Ceramesh flat-sheet membrane (Ceramesh, UK; nominal pore size 0.2/xm) was used in this system. The membrane was a zirconia- coated metal alloy mesh. When desired pulsatile flow was produced by a dual-head metripump. Details can be found elsewhere [4].
For all systems, permeate flow was measured by weighing with an electronic balance interfaced to a computer and periodically returned to the feed vessel so that the system may be assumed to have been oper- ated under constant-volume conditions. The inlet and outlet pressures were measured using absolute pressure
3. Results and discussion
3.1. Flat-sheet system
Fig. 2 shows some conventional flux-time data obtained for the yeast cell suspension. There is signif- icant flux decline with the baffled flat-sheet system, albeit towards higher steady-state values than those obtained in the absence of baffles. This work is covered in detail elsewhere [4]. In retrospect the TMPs were too high giving too higher a convective flux towards the membrane. Subsequent work (some of which is reported later) showed that fouling was reduced sig- nificantly at low values of TMP.
The characteristics of YCD and incubated YCD, together with their corresponding filtration behaviour, were described by the authors in a previous paper [ 5 ]. A limited amount of data is shown in Fig. 3. The veloc- ity V of 0.038 m s - ~ corresponds to a net flow Re of 48. The Vp values of 0.735 and 0.38 m s - 1 correspond to Rep = 1077 and 482, respectively. The reason for highlighting this earlier work is the existence of con- stant-flux filtration at a constant TMP. For incubated YCD the flux is invariant with respect to time provided the TMP (and hence the corresponding flux) is suffi- ciently small. The steady-state fluxes for the low values of TMP are of reasonable magnitude for YCD because the degree of fouling is so low. The plateau of 25 1 m -2 h - ~ in the flux versus time curve for the incubated YCD at a TMP of 0.09 bar and a Vp of 0.74 m s-~ was obtained almost immediately upon start-up; d (TMP) / dt = 0 for all times greater than 1 min. This means that the flux very quickly reached a steady-state value. (The clean water flux at the operating TMP was 70 1 m-2 h - l ). This special filtration behaviour continued, at a lower level of flux, when TMP fell to 0.07l bar. How- ever, after TMP was increased to 0.2 bar there was neither a proportionate increase in flux nor was the new value of 46 1 m - 2 h - ~ maintained.

262 R. W. Field et al. / Journal of Membrane Science 100 (1995) 259-272
6°LI ,o
o ~ tb t~ ab 2~ 3b a~ ~ 4~ 50
Fig. 2. Comparison of flux versus time behaviour for flow in a baffled system (BP), pulsed flow in an unbaffled system (ETP) and normal flow in an unbaffled system (ET) as given in Ref. 14]. Flat-sheet system at C=5% dry weight yeast; TMP= 1.05 bar.
50-
45-
40-
35-
BP moOe, V = 0.038 m/e
j = , [ Vp=,0,38 fft/S 0.20 bat, Vp=0.74 rrt~
• ' 10 .07 bar, Vp,,,,0.38 m/s 15-
10-
5- Y1CD I I Incui~tKI YCD
0 o 2o ~ eo ~ loo 12o
TInm (mlnuhm)
Fig. 3. Comparison of filtration performance for 3% dry weight yeast cell debris and incubated yeast cell debris at various TMPs with a V of 0.038 m s- ~ and Vp of 0.38 or 0.74 m s- 1. The baffled/pulsed mode of the fiat-sheet system was used with a Ceramesh 0.2-/xm membrane. Details in Ref. [5].
The filtration results for the non-incubated YCD at low TMP (i.e. low initial flux) indicate a relatively small degree of fouling. The reasons for the existence of the constant flux with the incubated YCD are open to conjecture. Among the several elements responsible for it, such as the characteristics of the feed, operating mode and TMP, a low initial flux (i.e. very low TMP)
is definitely essential.
3.2. Tubu la r sys t em
The filtration results for the 1000-ppm dodecane emulsion are shown in Figs. 4, 5, 6, 7. Three sets of the constant flux data and their corresponding TMP versus
time profiles are shown in Figs. 4 and 5, respectively. The three experiments were performed in the B mode with V at 0.84 m s - 1. TMP was gradually increased from a low level to a higher level in order to maintain

R.W. Field et al. / Journal of Membrane Science 100 (1995) 259-272 263
250
200-
~(15o;
~J too; U.
50
1000 ppm Oo(W~, B mocle, V - 0.84 m/s
Run 1 _ _ _ m
~- Run2
Run 3
OI o m ~ 6b eo loo 1 ~ laO 1~o 18o
Time (minutee)
Fig. 4. Three sets of flux data of three constant-flux filtrations for a 1000-ppm dodecane-water emulsion and with a Carbosep 0.14-/zm tubular membrane. The data for the three runs were acquired at a V of 0.84 m s- ~ and in the baffled mode.
the flux constant for all three runs. This means that gradual fouling occurred. From the authors' experience
of this mode of operation the chosen flux is of crucial importance in order to obtain the best compromise
between flux and TMP. If the starting flux was too low as shown by run 3, the flux was easy to be maintained but at a low level. If too high, over-fouling would occur
and it would be impossible to increase TMP sufficiently
in order to maintain the flux constant. Fig. 6 compares a constant-flux profile with two flux profiles for con-
stant TMPs of 0.44 and 0.70 bar. The individual data points for the constant TMP runs were obtained at the same frequency as for the constant flux run but are not
shown. (This comment also applies to Figs. 7 and 8.)
All three profiles were obtained in the B mode with a V of 0.84 m s - t. When the experiment was performed
at a constant TMP of 0.70 bar, the flux decreased sharply and rapidly to a much lower steady value of about 70 1 m - 2 h - i. Presenting a striking contrast to
the this result, the flux for the constant-flux operating mode was always maintained to about 140 1 m -2 h - l
by gradually increasing TMP from 0.44 to 0.58 bar. It
is interesting to note that when a constant TMP of 0.44
bar was set the flux was maintained at about 135 1 m -2 h - ~ for about 15 min, then declined steadily to a steady
value of about 85 ! m - 2 h
0.8
0.7-
0.6-
0.5"
" o.4:
0.3-
0.2-
0.1-
0 0
Run 1
,ooo pp~,= ,=~ , s , , ~ . v = o 8, r,V,
2b ~ ~ 80 100 1 ~ 140 180 180 2O0 Time (minutee)
Fig. 5. Profiles of TMP-time corresponding to the three sets of data in Fig. 4.
264 R. W. Field et al. /Journal of Membrane Science 100 (1995) 259-272
250-
200-
i - - 1 0 0 -
5 0 -
-0.6
D=,,-
0.5
0.4 ,~.
0.3
OA.4 I~ I-- 0.2
0.1 lo00ppmdocleQme Bmode V os4m/s
0 r
20 40 60 80 100 120 140 160 180 200 1'1rile (minute)
0
Fig. 6. Comparison of the performance between a constant-flux filtration and two constant-pressure filtrations for a 1000-ppm dodecane-water emulsion. All data were acquired at a V of 0.84 m s- l with a Carbosep 0.14-p,m tubular membrane in the baffled mode. For the two constant- pressure runs TMPs were 0.44 and 0.70 bar.
A reasonable explanation for the results in Fig. 6 is that at a high TMP such as 0.70 bar the membrane
would over-foul (for example, dodecane may be forced to enter membrane pores) and cause a irreversible foul-
ing resistance within a short time. Indeed the very rapid
decline of flux during the first 10 rain suggests this. On the contrary, a lower starting TMP and a gentle increase
of TMP leads to a low rate of fouling and reduces the degree of irreversible fouling. A further confirmation
of the above results is presented in Fig. 7. The data
shown in Fig. 7 were obtained in the B mode and a
larger cross-flow velocity of 1.01 m s - ]. The constant- flux experiment lasted for 7 h with TMP increasing from a starting value of 0.32 bar to a terminal value of
0.73 bar. The flux value was between 140 and 150 1 m - 2 h - 1. The fluxes for constant TMPs of 0.52 and 0.80 bar dropped rapidly and the steady value for TMP of 0.52 bar was about 100 1 m -2 h - ] . Therefore the
results shown in Figs. 6 and 7 suggest an operating tactic for the commencement of filtration. It has long
150- <
lil 0.~? I~"
0.8
looo ~ = = , ~ , B , , ~ , v = 1 ol . ~
o ~b 16o I~O 26o ~,o 36o ~ 4oo
"0.7
"0.6
-0.5 "1~
- 0 . 4 0 .
-0.3 ~
-0.2
-0.1
0 45O
Fig. 7. Comparison of the performance between constant-flux filtration and constant-pressure filtration for a 1000-ppm dodecane-water emulsion with a Carbosep 0.14-Fm tubular membrane. All data were acquired at a V of 1.01 m s- ] in the baffled mode. For the constant-pressure filtration the TMP was varied from 0.52 to 0.80 bar.

R. W. Field et al. / Journal of Membrane Science 100 (1995) 259-272 265
250-
A
(
loo i 1
50
1000 pprn Oodec.a/~, E'f mode, V = 0.11 m/~
! * ~ ~ t . - ~ - t - ~ 1 + " . ~ - - ~ / ~
0,32_ bar - " 0.3.2 bar
0.45 i
i
i 0.:35 i
i 0.3
io25 rl
0.2 • I--
0.15
0.1
0.05
, - - J-O 0 ~ ) 4() I~) 130 100 120 140 160
T i m e ( m i n u t e e )
Fig. 8. Comparison of the performance between constant-flux filtration and constant-pressure filtration for a 1000-ppm dodecane-water emulsion
and with a Carbosep 0.14-/xm tubular membrane. All data were obtained at a V of 0.71 m s t and in the conventional mode. For the constant-
pressure filtration, the TMP was varied between 0.32 and 0.80 bar.
been recognised that low-pressure MF is much more effective than high-pressure MF but the emphasis here is the desirability of starting filtration operations at a moderate flux and then maintaining it by gradually increasing the pressure.
Since the data in Figs. 4, 5, 6 and 7 were obtained in the B mode, one may ask whether the tactics work without the baffle. All the data in Fig, 8 were obtained in the ET mode and with a V of 0.71 m s - 1. For the constant-flux experiment TMP was increased from a starting value of 0.25 bar to a terminal value of 0.4 bar. For the constant-pressure experiment, the fluxes were separately measured at TMPs of 0.32, 0.55 and 0.80 bar. For constant TMP of 0.32 bar the flux remained constant for the first 15 min and then declined to about 80 1 m - 2 h - 1. However, for the constant-flux run, the flux was increased slowly over the first 5 min and then maintained at about 95 ! m - 2 h - i with TMP increasing slowly to 0.32 bar. Although the fluxes are lower than what would be obtained with the new baffle the con- stant-flux tactic still has an advantage over the conven- tional constant-pressure approach. Towards the end of the constant-pressure run the TMP was increased beyond that necessary to maintain a flux of 95 1 m - 2 h - ' but the new and slightly higher value of flux was not maintained. It seems that the flux value of 95 1 m 2 h - ~ was critical.
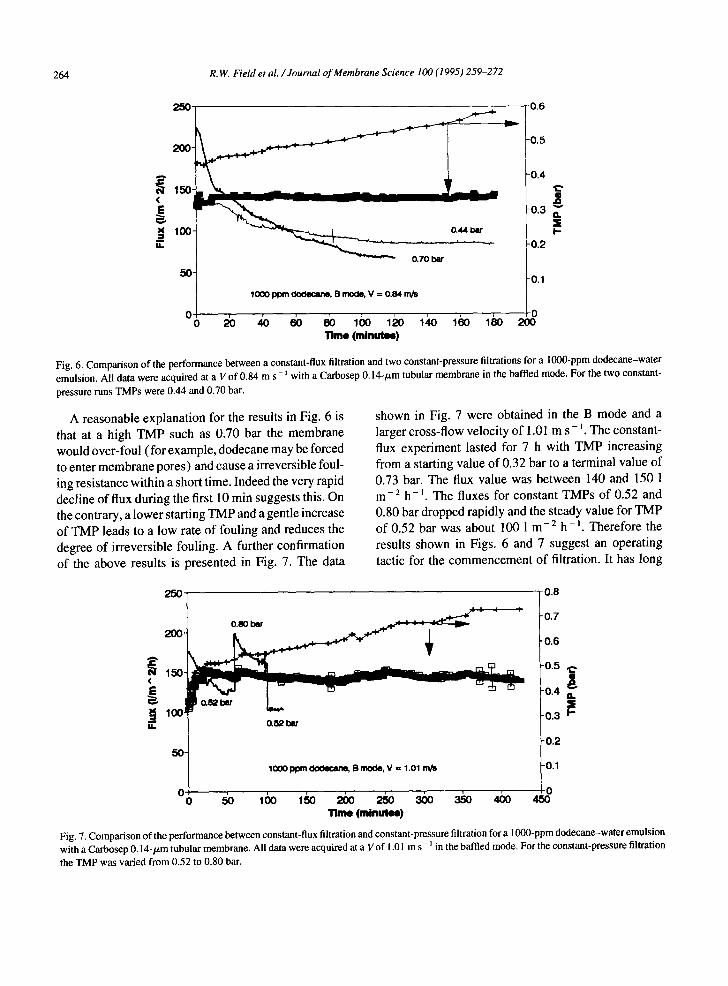
The final experiments in this work were conducted with yeast cell suspension (5% dry weight) using the
B mode. Two sets of constant-flux data were obtained at Vof 0.84 and 0.76 m s - '. (For reasons of clarity the individual data points are not shown in Fig. 9 for the latter experiment but the frequency of data sampling was the same as for the other experiment.) For the case of V of 0.76 m s - ', the constant-flux behaviour was maintained at about 40 1 m -2 h-~, which was about 80% of the clean water flux corresponding to a TMP of 0.10 bar. The corresponding TMP was always at the level of about 0.10 bar except for the first 4 min when TMP was at 0.075 bar. When an initial TMP of 0.16 bar was used in the B mode together with a higher cross-flow velocity of 0.84 m s - ' it was only possible to maintain constant flux by gradually increasing TMP to over 0.60 bar. Thus the earlier flux of 40 1 m - 2 h ' (corresponding to the TMP of about 0.10 bar) is crit- ical. The constant-flux filtration rate for the 0.16--0.6 bar run had a modestly higher value of about 57 1 m 2 h - ~ but the final overall resistance is over four times greater.
It might be thought that at the moderate flux of 40 1 m - 2 h - ' and with the enhanced mass transfer being generated by the new baffle, there might be only a "flowing cake" layer and a very small (or nil) "stag- nant cake" layer on the membrane surface [6]. The difference between the process flux and the correspond- ing clean water flux might then be attributed to this flowing cake layer which only forms a reversible
266 R. 14/, Field et al. /Journal of Membrane Science 100 (1995) 259-272
<
r.
140-
120-
100-
a % o'w yearn., B mode
I V = 0.84 rt~
V = 0.7e nVs
OJ 0 20 40 60 80 100 120 140
Time (minutee)
"0.7
-0.6
-0.5
-0.4 ~. Is
-0.3 • I -
-0.2
-0.1
0 160
Fig. 9. Comparison of two constant-flux filtrations for 5% dry weight yeast cell suspension and a Carbosep 0.14-/zm tubular membrane. The two sets of data were obtained at a V of 0.76 and 0.84 m s- t, respectively, using the baffled mode.
membrane resistance. However, the water flux obtained after rinsing the membrane at the end of the experiment indicated that none of the fouling material had been removed. The pre-experiment water flux was restored by cleaning. This indicates that the small increase in resistance during the 401 m - 2 h - l constant-flux exper-
iment was not due to a flowing cake. The water flux obtained after rinsing the membrane at the end of the 57 1 m -2 h - i constant-flux experiment, during which period the overall resistance increased four-fold, indi-
cated that the resistance was halved by the simple action of rinsing. Thus, in this case it is believed that a stagnant cake layer was formed. Fol lowing the recent work of Hodgson et al. [7] , the increase in resistance could be due to the nature of the extra-cellular material in the fouling layer and not to a layer of yeast cells alone. The critical flux would seem to correspond to the flux which just avoids cake deposition.
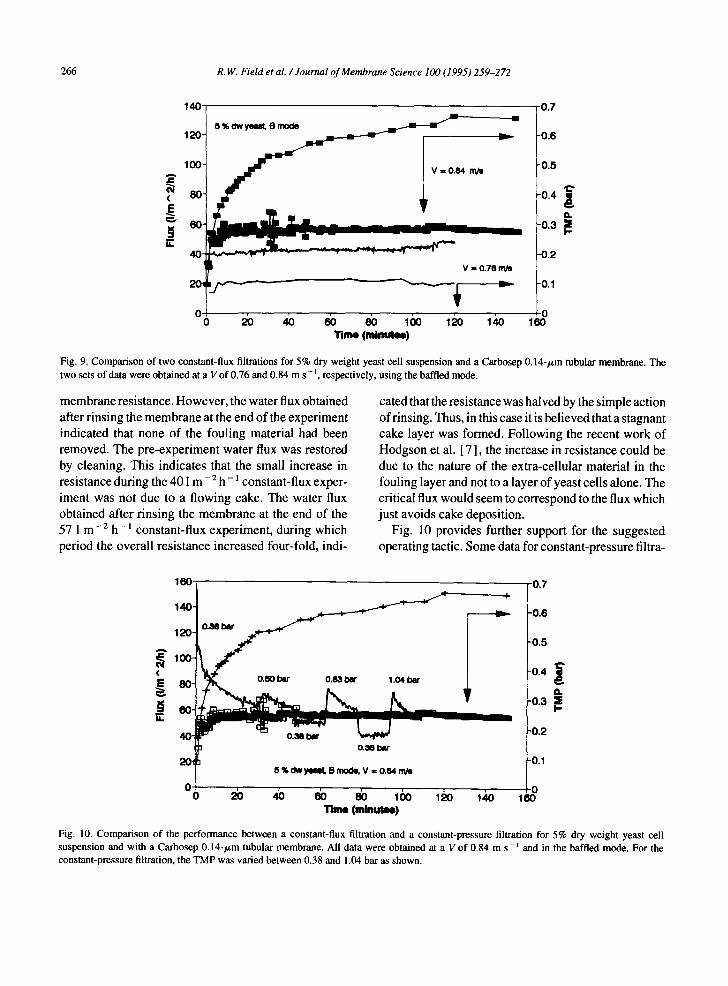
Fig. l0 provides further support for the suggested operating tactic. Some data for constant-pressure filtra-
160-
140.
120-
<~ 100-
6o-
4 0 -
201
0 - - - 0
0.38 ~
B % O'W ymM, B m~kl, V = o, e4 m~
20
-0.7
-0.6
-0.5
-0.4
-0.3 i I,-
-0.2
-0.1
40 80 8() 100 120 140 l d Time (mlnutee)
Fig. 10. Comparison of the performance between a constant-flux filtration and a constant-pressure filtration for 5% dry weight yeast cell suspension and with a Carbosep 0.14-~m tubular membrane. All data were obtained at a V of 0.84 m s- ~ and in the baffled mode. For the constant-pressure filtration, the TMP was varied between 0.38 and 1.04 bar as shown.

250 Meuured ~ Q-I~O mVmin, TMP-0.4 ~ and 30 C
~I0"
~ 150-
100-
50-
R. W. Field et al. / Journal o f Membrane Science 100 (1995) 259-272 267
0 2 4 6 8 1'0 1;~ 1'4 16 18 20 Number of exp~mente
Fig. l 1. Illustration of the membrane condition at the end of experiments involving yeast cell suspensions in the tubular system with and without baffles. No baffle was used for experiments numbered 1, 2, 7 and 8. The helical baffle as shown in Fig. 1 was u ~ d for experiments 3~5 and 11- 18. A simple symmetrically located rod insert was used for experiments 9 and 10.
tion were obtained in the B mode at a Vof 0.84 m s - i . Several TMP levels, namely 0.38, 0.50, 0.83 and 1.04 bar, were used. Compared with constant-flux filtration, the flux declined rapidly and no improvement in the flux was observed by increasing TMP to 1.04 bar. Actu- ally the flux at highest TMP was even lower than the corresponding flux of the constant-flux filtration ter- minating at 0.6 bar since the high starting TMP and the following higher TMPs caused over-fouling. The mag- nitude of the fouling resistances (i.e. the size of the Rf
values) increase with initial TMP; Rr was lowest for the 40 1 m -2 h -1 constant-flux experiment, signifi- cantly higher ( and increasing) during the 571 m - 2 h - l constant-flux run and even higher during the constant- pressure runs which started at a flux of 1101 m - 2 h - 1. The final overall resistances were in the ratio of 1:4:7.
Finally, it should be pointed out that the avoidance of over-fouling resulted in another advantage; besides improving the filtration rates, the membrane was more easily cleaned. Fig. 11 gives some data on the water fluxes achieved after rinsing and after cleaning for a set period of time. The eighteen experiments were for the yeast cell suspension. The fluxes achieved are obvi- ously dependent upon the various conditions used dur- ing each experiment but clearly there is a significant difference when the spiral baffle is used. Experiments 16-18 correspond to the three runs discussed in the previous paragraph.
4. Critical flux concept and implications
4.1. Concept of critical flux
From the experiments that show that one can operate MF at a constant flux with no increase in TMP so long as that pressure is low we deduce that under these circumstances fouling is slight or negligible. On the other hand as soon as TMP is increased fouling is observed and the flux declines towards its previous value or even below it. Certainly once the lower TMP is restored the flux is lower because of the additional fouling layer on the membrane surface.
The constancy of the plateau values for conditions of low and moderate flux in, for example, Figs. 3 and 9 suggests that there was a critical flux for these partic- ular conditions. For the incubated YCD in the fiat-sheet system the value was 25 I m -2 h-1 whilst for the 5% dry weight yeast in the tubular system the value was 40 1 m-2 h ~ for the conditions used. A hypothesis is now proposed.
The critical flux hypothesis for MF is that on start-up there exists a flux below which a decline of flux with time does not occur; above it fouling is observed. This flux is the critical flux and its value depends on the hydrodynamics and probably other variables.
The strong form of the hypothesis is that a flux exists which is equivalent to the corresponding clean water
268 R. W. Field et al. / Journal o f Membrane Science 100 (1995) 259-272
flux at the same TMP. The weak form is that on start- up a constant flux is rapidly established and maintained. The determination of critical flux is difficult to deter- mine a priori because surface interactions of the species involved can vary significantly from system to system. Nevertheless it is suggested that the concept may be of value, as a guide, when optimising a system. Theoret- ical calculations for idealised particles have been made [ 8 ]. For small particles of the order of 0.1/~m Stoke- Einstein diffusion away from the surface will be impor- tant and calculations suggest a critical flux of 1-10/zm s-1 depending on the significance of charge effects. For particles of the order of 1/zm charge is less impor- tant and shear-induced diffusion alone, for non-inter- acting particles, should give a critical flux of the order of 10/zm s - 1 (equates to 36 1 m - 2 h - ~ ). This is close to the values of 25 and 401 m -2 h - ~ determined exper- imentally for incubated YCD and 5% dry weight yeast.
The critical flux should not be confused with the limiting flux found in ultrafiltration which occurs inde- pendently of fouling and is due to concentration polar- isation. This phenomenon induces both osmotic effects and reduced mass transfer (due to increases in the vis- cosity at the membrane surface). The physical phenom- ena governing the critical flux may be in doubt but evidence for the existence of critical-flux effects is now quite extensive. Two experimental observations will be mentioned. Firstly, Benkahla et al. [9] have observed that as TMP is increased the flux increases linearly and provided a critical value of flux is not exceeded the behaviour is reversible, i.e. pressure can be reduced and the same fluxes are again observed. However, if the critical flux value is exceeded then reducing TMP does not restore the original flux but a lower one. The cycling of pressure then leads to a hysteresis effect. The value of the critical flux below which no hysteresis is observed can be increased by increasing the cross-flow velocity. Secondly, the work of Hodgson et al. [ 10] is also relevant; non-intrusive observation of the surface of a 0.02- and a 0.2-/zm Anopore membrane filtering 0.1 wt.-% yeast indicated that at low flux cells were not observed to approach the surface.
Now the rate of convection of material towards a membrane surface under low TMPs is much lower than that which occurs during the initial period of conven- tional operation. The rate of back-diffusion (or tangen- tial removal) of rejected material will depend upon its concentration, material properties and the fluid
mechanics. It is conceivable that this could match the convection rate of rejected material towards the membrane surface. For example, the results presented in Fig. 9 provide convincing evidence that for the yeast cell suspension and operating, used a flux of 57 1 m - 2 h - ~ is excessive whilst one of 40 1 m - 2 h - 1 is not.
Now for a single given fouling mechanism a rela- tionship can be written relating flux, rate of flux decline and back-diffusion. Relevant equations have been derived. They are a development of those of Hermia's work [ 11 ] and are given in the Appendix. A unifying equation for cross-flow MF is presented. This demon- strates that mathematically one can anticipate that there are fluxes below which no decline of flux with time Occurs .
4.2. Consequences of the concept of critical flux
Consider an experiment in which the initial flux is greater than the critical flux for all components of a suspension, i.e. the mode of operation that can be con- sidered to be the normal mode of start-up. All particles, irrespective of size, in the vicinity of the membrane will experience a net force towards the membrane. Now back-flux mechanisms are generally considered to be a function of particle size and for most proposed mech- anisms [ 13] the back-flux increases with particle size. Thus, if the critical flux is higher for larger particles, then, as flux declined, one would observe that (a) ini- tially deposition would not favour any particular size of particle, but (b) as the critical flux of each size of particle was progressively passed the percentage of larger particles would decline (because the critical flux would no longer be exceeded) and the nature of the cake would become finer and finer. Such changes in cake size distributions have been observed but not fully explained (see for example Ref. [ 14] which cites five other references). A shear classification mechanism has been one explanation offered [15]. These obser- vations may also be interpreted in the light of the crit- ical-flux hypothesis. This not only suggests why in general it has been observed that the mean size of par- ticles found in the cake layer is less than that of the feed particles, but indicates that operation below the critical flux of all particles should lead to a cake with a different structure or possibly no cake at all. Measure- ment of the critical flux for a range of particle properties is highly desirable.

R. W. Field et al. /Journal of Membrane Science 100 (1995) 259-272 269
Finally the concept of critical flux immediately sug- gests that there may be advantages in operating below it so as to minimise cleaning. In fact this has been exploited by Kubota. Ishida et al. [ 16] reported on their membrane-activated sludge process in which mem- branes are submerged in the aeration tank and operated at constant flux. Under normal conditions flux is main- tained at 0.5 m 3 m - 2 per day with a steady pressure of about 30 kPa. Means to cope with storm overloads is important and tests at 70 kPa showed that the flux would initially increase to 1.05 m 3 m -2 per day but decline gradually to 0.94 m 3 m - 2 per day due to fouling. Thus, the new increased flux can be said to have been greater than the critical flux for this system. On returning to the original flux, which was below the critical flux, the pressure required was one third higher than that origi- nally required but the extent of fouling gradually dimin- ished and after 4 h the pressure was about 35 kPa. The advantages of operating in such a simple mode over extended periods in unmanned systems is clear. Lastly a second Japanese paper presented at ICOM '93 will be mentioned. Whilst Yamamura et al. [ 17] attribute the performance of the Toray "superfiltration membrane" to low absorption of fouling materials and the pore size range of 0.01-0.03/.tm, the operation at moderate fluxes is also considered, by us, to be highly relevant. The corresponding TMP was around 50 kPa.
5. Conclusions
For three different systems constant-flux filtration was realized by gradually increasing TMP from an appropriate starting value. Under certain circumstances a constant flux can be achieved at a constant TMP as shown in the filtration of yeast cell debris and 5% dry weight yeast suspension. The critical and generally low value of TMP below which constant-flux filtration can be realized depends upon the hydrodynamics. Below this critical TMP, there will be little or even no irre- versible surface fouling.
Fundamentally the process is best understood in terms of a critical flux; the value of TMP is not of physical significance per se but is crucial in that for a given membrane resistance it is related to flux and is often the controlled parameter. By correctly selecting the initial TMP the rate of fouling is greatly reduced because a critical flux is not exceeded. Thus ideally a
constant-flux, rather than a constant-pressure, operat- ing mode is to be preferred.
A mathematical analysis of the classic constant pres- sure blocking filtration laws, with due allowance for a cross-flow removal mechanism, has been completed. This demonstrates that provided certain terms take finite values fluxes should exist at which there is no decline of flux with time.
Appendix
I. Incorporation of cross-flow removal mechanisms into classic constant-pressure blocking filtration laws
Hermia [ 11 ] presented a physical model to derive the so-called "intermediate blocking" law, which had previously been considered totally empirical. Also he determined a characteristic form of the blocking filtra- tion laws for constant-pressure filtration. He presented the result in the form
d2t k( dt ~n t791 (A1)
where V is volume of filtrate collected in time t, and k and n are constants depending upon the mechanism involved.
As analyses of membrane filtration are normally per- formed in terms of flux it is noted that Eq. A1 can be presented in an alternative form. As dV/dt=AJ it fol- lows that
dZt d( l /AJ) d V 2 = dV
1 dJ 1 d J d t 1 dJ
AJ 2 dV AJ 2 dt dV A2J 3 dt
Thus Eq. A2 can be rewritten in a physically more meaningful form as
1 dJ k (A2) A2J 3 dt
For dead-end filtration and a complete blocking mechanism n = 2, thus Eq. A2 is immediately seen to reduce to - dJ/dt = kJ. This and the other three mech- anisms explored by Hermia will be re-examined, in turn, with a cross-flow mechanism being added where appropriate.

270 R. W. Field et al. / Journal of Membrane Science 100 (1995) 259-272
"Comple te" blocking filtration law Normally with this mechanism it is assumed that
each particle reaching the membrane participates in blocking by means of pore sealing. A term representing a removal rate of particles from the pore mouths will be added in. The velocity through the unblocked pores is unaffected, thus the fractional reduction in flux is equal to the fractional reduction in open area, i.e.
dJ. da. - ~ l J o = - ~ l a o (A3)
The area at time t is, in the absence of a removal term, given by
a = a o - c r V (A4)
Combining Eqs. A3 and A4, remembering that d V / d t = A J and that ao = eoA, one obtains
dJ - - = - ( crAJ / ao) Jo = - ( cr Jo/ eo ) J (A5) dt
If the cross-flow leads to a constant rate of particle removal from the mouths of the pores, the equation for the decrease in open area is modified
da - ~ = erA J - Bao (A6)
dt
where B is a constant related to the membrane porosity and rate of removal of particles per unit area. Hence
dJ - - = - ( trJo/ eo)J + BJo (A7) dt
The implication of Eq. A7 is that when J is equal or less than Beo/cr, there will be no flux decline. Writing Beo/tr asj~, integration of Eq. A7 yields
J = (Jo- j¢)exp( - (O'Joi~) t ) +Jc (A8)
A simple form of this equation has been used by others for principally empirical reasons (e.g. Ref. [ 12] ). However, its use is not recommended unless the fouling mechanism is described by the above equa- tions. In the context of this paperjc can be viewed as a critical flux; i f J is less than j¢ there is no flux decline.
Cake filtration law The mechanism which differs most greatly from the
complete blocking mechanism is the one of cake filtra- tion. In this case the overall resistance is composed of
a filter resistance, which is assumed to remain unchan- ged, and a cake resistance. For dead-end filtration of incompressible particles the cake thickness is propor- tional to the volume filtered and the overall resistance is
R = Ro + am = Ro + ak¢ V/A (A9)
where a = specific resistance of cake (m kg- 1), m --- mass of cake per unit area, and kc = cake filtration constant relating m to V (it is a function of certain physical properties) (kg m - 3)
In classic filtration the equations are solved to show that this mechanism yields a linear relationship between V and t/V. An equivalent analysis yields an equation which might be of greater interest for the analysis of membrane performance
ak ' 1 l=~ofJdt (A10) J Jo
0
Eq. A10 is for dead-end filtration. A term allowing for cake erosion can be added to Eq. A9 and a cross- flow microfiltration (CFMF) cake filtration equation can be obtained analytically. For a time t, Eq. A9 can be written as
( A l l )
t
R = Ro + a(k~V/A - f S d t )
0
where S is the rate of erosion of cake per unit area in kg m-2 s -I"
Assuming S to be invariant with t, it can rapidly be shown that
(A12)
t
J Jo Jd t -JoRo 0
Thus
l dJ a k J aS (A13)
j2 dt JoRo JoRo
Writing G = ak¢/(JoRo) andjs = S/k¢ one obtains
l d J - - ~ d t = G ( J - j s ) (A14)
This can be solved to give

R. W. Field et al. / Journal of Membrane Science 100 (1995) 259-272 271
1 [ l n ( J Jo-Js~ (1 1~] G t = ~ -- (A15) j s k kJo
Whilst Eq. A15 is useful in the analysis of flux decline curves, the main point to note in the context of this paper is that Js can be considered to be a critical flux; from Eq. A14 it is seen that dJ/dt = 0 when J =Js.
Intermediate blocking filtration law Each particle does not necessarily block a pore; the
probability of landing upon particles already on the surface is taken into account. The physical model leads to
1 1 . . . . trt (A16) J Jo
For dead-end filtration the rate of flux decline is given by the following equation which is obtained from Eq. Al6:
l d J . . . . trJ (A17)
J dt
The addition of a back flux factor B' gives
l d J . . . . o -J -B ' (A18)
J dt
Writingji = o-B' and solving one obtains an implicit equation for J
~rt = 1 [lnJj-~ ji j J j i ] (A19) Ji
This equation (and also Eq. A8) should prove useful in the analysis of the initial phase of flux decline. The main point to note in the context of this paper is thatji can be considered to be a critical flux. The previous value Js is the limiting value if cake laydown is to be avoided, whilst j~ is the limiting value if intermediate blocking is to be avoided.
Standard blocking filtration law In deriving this law it is assumed that the pore vol-
ume decreases due to particle deposits within the pores. In classic filtration the equations are solved to show that fouling of this type yields a linear relationship between t and t/V. An equivalent analysis in terms of flux generates
1/jo.5 = 1/jo.5 + (Ks,/2)A°'St (A20)
The term Ks' is defined by Hermia [ 11 ] and is the value taken by k in Eq. A2 when n = 3/2, this being the characteristic value for this form of fouling. This form of fouling will not be mediated by back-diffusion from the membrane surface and will not be considered fur- ther.
2. Summary
The appendix started by giving Hermia's unifying equation for dead-end filtration. It is now appropriate to generate a unifying equation for CFMF. Eqs. A7, A14 and A18 were all of the form
- ~ t J ~ - Z = k ( J - J • ) (A21)
For cake filtration n = 0, for complete blocking n = 2, whilst for the intermediate mechanism n = 1. Thus Eq. A21 is characteristic of CFMF with the constant k and index n taking different values depending upon the fouling mechanism.
In each case the term J* can be considered to be a critical flux which should not be exceeded if fouling is to be avoided. This analysis therefore suggests that, provided the terms B, B' and S take finite values, fluxes should exist at which there is no decline of flux with time.
3. Symbols used in appendix
Symbols in main text defined at point of use. A membrane surface area (m 2) a open area (m 2) B constant in Eq. A6 ( s - ~) B' constant in Eq. A18 ( s - t ) G parameter defined in ( s m - 2)
text J volumetric flux (m s- l ) Jr critical flux in modified (m s- 1)
complete blocking law Ji critical flux in modified (m s - ~ )
intermediate blocking law
Js critical flux in modified (m s - l ) cake filtration law
Ks' Hermia's parameter for standard blocking filtration

272 R.W. Field et al. /Journal of Membrane Science 100 (1995) 259-272
k defined by Eq. A 1 (units depend on mechanism)
k¢ cake filtration constant (kg m-3) m mass of cake per unit (kg m-2)
area n index defined by Eq. (units depend on
A1 mechanism) R hydraulic resistance (m - t ) S rate of cake erosion per ( k g m - 2 s -1)
unit area V filtrate volume (m 3) a specific resistance of (m kg- 1)
cake
• m e m b r a n e sur face
porosity tr blocked area per unit (m- ~ )
volume of filtrate Subscript 0 condition of time t = 0
Acknowledgement
One of us (RWF) is grateful to the Royal Academy of Engineering and Shell Research for financial support and the award of a Senior Research Fellowship.
References
[ 1 ] P. Aimar and J.A. Howell, Effects of concentration boundary layer development on the flux limitations in ultrafiltration, Chem. Eng. Res. Des., 67 (1989) 255-261.
[2] J.A. Howell, Fouling and process design, Plenary Lecture, in P. Aimar and P. Aptel (Eds.), Euromembrane 92, Pads, 1992 (Recents Progres en Genie des Procedes, Voi. 6, No. 22), Groupe Francais de Genie des Procedes, Nancy, 1992, pp. 195- 207.
[ 3 ] M. Turker and J. Hubble, Membrane fouling in a constant flux ultraliltration ceil, J. Membrane Sci., 34 (1987) 267-281.
[4] J.A. Howell, R.W. Field and D. Wu, Yeast cell microfiltration: flux enhancement in baffled and pulsatile flow systems, J. Membrane Sci., 80 (1993) 59-71.
[5l D. Wu, J.A. Howell and R.W. Field, Pulsatile flow filtration of yeast cell debris: influence of pre-incubation on performance, Biotechnol. Bioeng., 41 (1993) 998-1002.
[6] C.A. Romero and R.H. Davis, Global model of crossflow microfiltration based on hydrodynamic particle diffusion, J. Membrane Sci., 39(1988) 157-185.
[7] P H. Hodgson, G.L. Leslie, R.P. Schneider, A.G. Fane, C.J.D. Fell and K.C. Marshall, Cake resistance and solute rejection in bacterial microfiitration: the role of the extracellular matrix, J. Membrane Sci., 79 (1993) 35-53.
[8] P. Bacchin, P. Aimar and V. Sanchez, A model for colloidal fouling of membranes, AIChE J., in press.
[9] Y.K. Beakahla, A. Ould-Dfis, M.Y. Jaffrin, Hydrodynamic anti-fouling mechanism in crossflow microfiltration, Poster Presentation at ICOM '93, Aug. 30-Sept. 3, 1993, Heidelberg.
[ 10] P.H. Hodgson, V.L. Pillay and A.G. Fane, Visual studies of crossfow microfiltration with inorganic membranes: resistance of biomass and particulate cakes, 6th World Filtration Congress, Nagoya, 1993, pp. 607--610.
[11] J. Hermia, Constant pressure blocking filtration laws. Application to power-law non-newtonian fuids, Trans. Ind. Chem. Eng., 60 (1982) 183-187.
[ 12] A. Koltuniewicz, Predicting permeate flux in ultrafiltration on the basis of the surface renewal concept, J. Membrane Sci., 68 (1992) 107-118.
[13] M.H. Lojkine, R.W. Field and J.A. Howell, Crossflow microfiltration of cell suspensions: a review of models with emphasis on particle size effects, Trans. Ind. Chem. Eng., 70C (1992).
[ 14] E.S. Tarleton and R.J. Wakerman, Understanding flux decline in crossflow microfiltration. Part 1. Effects of particle and pore size, Trans. Ind. Chem.Eng., 71A (1993).
[ 15] R.J. Baker, A.G. Fane, C.J.D. Fell and B.H. Yoo, Factors affecting flux in crossflow filtration, Desalination, 53 (1985) 81.
[ 16] H. lshida, Y. Yamada, M. Tsuboi and S. Matsumura, Kubota submerged membrane activated sludge process. Its application into activated sludge process with high concentrations of MLSS, Presentation at ICOM'93, Aug. 30~Sept. 3, 1993, Heidelberg.
[ 17] H. Yamamura, Y. Fujii and T. Uemura, Advanced feed outside hollow fibre superfiltration membrane with excellent characteristics to remove the fouling components, Presentation at ICOM'93, Aug. 30-Sept. 3, 1993, Heidelberg.