HAMMER IMPACT TEST APPLIED FOR FOULING ... - SciELO
11
HAMMER IMPACT TEST APPLIED FOR FOULING DETECTION IN PIPELINES Jaidilson J´ o da Silva * [email protected] Antonio Marcus Nogueira Lima * [email protected] Franz Helmut Neff * [email protected] Jos´ e S´ ergio da Rocha Neto * [email protected] * Universidade Federal de Campina Grande Departamento de Engenharia El´ etrica Av. Aprigio Veloso 882 - CEP 58429-900, Campina Grande, Para´ ıba, Brazil RESUMO Teste de Impacto do Martelo aplicado na Detec- ¸ c˜ ao de Incrusta¸ c˜ ao em Tubula¸ c˜ oes A detec¸ c˜ ao da incrusta¸ c˜ ao em sistemas de dutos ´ e um problema persistente e requer uma demanda pertinente para as ind´ ustrias qu´ ımicas, petrol´ ıferas, aliment´ ıcias e farmacˆ euticas. A incrusta¸ c˜ ao ´ e um processo de deposi- ¸ c˜ ao de materiais s´ olidos dissolvidos orgˆ anicos e outros materiais pesados nos fluidos transportados ou em sus- pens˜ ao sobre as superf´ ıcies das paredes internas em sis- temas de transporte de fluidos. Este trabalho apresenta resultados da pesquisa de excita¸ c˜ ao do teste do martelo para an´ alise de vibra¸ c˜ oes utilizando testes n˜ ao-invasivos para detec¸ c˜ ao de incrusta¸ c˜ ao em tubula¸ c˜ oes. Dados da vibra¸ c˜ ao foram analizados na presen¸ ca de uma camada de incrusta¸ c˜ ao no interior dos tubos usando um acele- rometro e um microfone para detec¸ c˜ ao. Com a an´ a- lise dos resultados obtidos ´ e poss´ ıvel detectar o processo de incrusta¸ c˜ ao, nas tubula¸ c˜ oes monitoradas, com e sem condi¸ c˜ oes de carga, utilizando um microfone e um ace- lerˆ ometro como sensores. PALAVRAS-CHAVE: An´ alise de vibra¸ c˜ oes, Teste do im- pacto do martelo e Detec¸ c˜ ao da incrusta¸ c˜ ao. Artigo submetido em 10/03/2011 (Id.: 01295) Revisado em 06/07/2011, 09/08/2011, 29/09/2011 Aceito sob recomenda¸ c˜ ao do Editor Associado Prof. Carlos Roberto Minussi ABSTRACT The fouling detection in duct systems is a persistent problem and remains a relevant demand for the chem- ical, oil, food and pharmaceutical industries. The foul- ing is a deposition process of heavy organic and other dissolved solid materials in the transported fluids or sus- pensions onto inner wall surfaces in fluid transport sys- tems. This work presents research results of hammer test for vibration analysis using non-invasive tests to fouling detection in pipelines. Data were taken from the vibration in presence of an inner pipe fouling layer us- ing an accelerometer and a microphone for detection. With the analysis of the obtained results is possible to detect the fouling process, in the monitored pipelines, with and without load conditions, using a microphone and an accelerometer as sensors. KEYWORDS: Vibrations analysis, Hammer impact test and Fouling detection. 1 INTRODUCTION A problem related to transporting fluid material through pipelines is the accumulation of organic or inorganic substances in their internal surfaces with time. Such accumulation of unwanted material is denoted foul- ing and it has been studied mainly in the chemical, petroleum, food and pharmaceutical industries, due to 620 Revista Controle & Automa¸ c˜ ao/Vol.22 no.6/Novembro e Dezembro 2011
-
Upload
khangminh22 -
Category
Documents
-
view
1 -
download
0
Transcript of HAMMER IMPACT TEST APPLIED FOR FOULING ... - SciELO
HAMMER IMPACT TEST APPLIED FOR FOULING DETECTION INPIPELINES
Jaidilson Jo da Silva∗
Antonio Marcus Nogueira Lima∗
Franz Helmut Neff∗
Jose Sergio da Rocha Neto∗
∗Universidade Federal de Campina GrandeDepartamento de Engenharia Eletrica
Av. Aprigio Veloso 882 - CEP 58429-900, Campina Grande, Paraıba, Brazil
RESUMO
Teste de Impacto do Martelo aplicado na Detec-
cao de Incrustacao em Tubulacoes
A deteccao da incrustacao em sistemas de dutos e umproblema persistente e requer uma demanda pertinentepara as industrias quımicas, petrolıferas, alimentıcias efarmaceuticas. A incrustacao e um processo de deposi-cao de materiais solidos dissolvidos organicos e outrosmateriais pesados nos fluidos transportados ou em sus-pensao sobre as superfıcies das paredes internas em sis-temas de transporte de fluidos. Este trabalho apresentaresultados da pesquisa de excitacao do teste do martelopara analise de vibracoes utilizando testes nao-invasivospara deteccao de incrustacao em tubulacoes. Dados davibracao foram analizados na presenca de uma camadade incrustacao no interior dos tubos usando um acele-rometro e um microfone para deteccao. Com a ana-lise dos resultados obtidos e possıvel detectar o processode incrustacao, nas tubulacoes monitoradas, com e semcondicoes de carga, utilizando um microfone e um ace-lerometro como sensores.
PALAVRAS-CHAVE: Analise de vibracoes, Teste do im-pacto do martelo e Deteccao da incrustacao.
Artigo submetido em 10/03/2011 (Id.: 01295)
Revisado em 06/07/2011, 09/08/2011, 29/09/2011
Aceito sob recomendacao do Editor Associado Prof. Carlos Roberto Minussi
ABSTRACT
The fouling detection in duct systems is a persistentproblem and remains a relevant demand for the chem-ical, oil, food and pharmaceutical industries. The foul-ing is a deposition process of heavy organic and otherdissolved solid materials in the transported fluids or sus-pensions onto inner wall surfaces in fluid transport sys-tems. This work presents research results of hammertest for vibration analysis using non-invasive tests tofouling detection in pipelines. Data were taken from thevibration in presence of an inner pipe fouling layer us-ing an accelerometer and a microphone for detection.With the analysis of the obtained results is possible todetect the fouling process, in the monitored pipelines,with and without load conditions, using a microphoneand an accelerometer as sensors.
KEYWORDS: Vibrations analysis, Hammer impact testand Fouling detection.
1 INTRODUCTION
A problem related to transporting fluid material throughpipelines is the accumulation of organic or inorganicsubstances in their internal surfaces with time. Suchaccumulation of unwanted material is denoted foul-ing and it has been studied mainly in the chemical,petroleum, food and pharmaceutical industries, due to
620 Revista Controle & Automacao/Vol.22 no.6/Novembro e Dezembro 2011

technical difficulties which may appear in these pro-cesses (Rose, 1995), (Branco et al., 2001) and (Camet al., 2002). Fouling in ducts causes several severeproblems such as: the reduction of the internal diam-eter of the pipeline; the required increase of the ap-plied pressure to maintain through-put can cause crackformation and possibly catastrophic breakup, the asso-ciated increase of the energy consumption also comesalong with higher operation and maintenance costs(Mansoori, 1997) and (Escobeto et al., 1997).
Large industrial crude oil refining/processing plants aredesigned as complex tubing structures, with up to sev-eral kilometers of interconnected tubes. It therefore isquite difficult and work intensive to quickly and safelyidentify, exactly localize, clean or replace critical tubesections, to avoid or reduce plant shut down times(Mansoori, 2001).
Several methods have been proposed for fouling de-tection, based on mass flow reduction, electric resis-tance sensors and ultrasonic techniques (Krisher, 2003),(Panchal, 1997), (Hay and Rose, 2002), (Gatts et al.,2004), (Barshinger and Rose, 2002) and (Lohr andRose, 2002). Tests with hammer impact have been usedbefore in numerous engineering areas to analyze fre-quency response functions (FRF), due to convenienceand simplicity of the experiments, as well as the valid-ity of the analysis procedures (Castelline et al., 2004),(Roy and Ganesan, 1995), (Nahvi and Jabbari, 2005),(Shen and Pierre, 1994), (Carino, 2001) and (Silvaet al., 2010a).
In (Silva et al., 2009a) are presented initial results withthe hammer impact test, just using a microphone foracoustic analysis of the signals, for fouling detection. In(Silva et al., 2009b) are presented the result analysis ofdifferent layers of fouling, inside the tube, using acousticand vibrations analysis for tests without load conditions,in other words, without liquid inside the tubes. In (Silvaet al., 2010b) are presented results of tests with vibrationanalysis for fouling detection, emphasizing the use offinite elements and verification of the results for testswithout load conditions.
In this work, we presented the results of the acousticanalysis, using a microphone as sensor, and vibrationanalysis using an accelerometer as sensor. These testsare performed under load conditions, in other words,with liquid inside the tubes, emphasizing the differencesin the tests. Also, were performed the tests in a realpipe, used in the petroleum transport, for fouling detec-tion with acoustic and vibration analysis.
2 PROPOSED METHOD
The physical principle is simple: when the tube is me-chanically excited by hammer impact, a relatively local-ized area of the tube section begins to vibrate at acousticfrequencies for a certain period of time at one or moreresonance frequencies. The vibration propagates as avery fast acoustic wave within the duct wall, and as asurface wave. The latter couples to the environmentalair and is detected by a closely mounted microphoneand accelerometer. Due to internal damping, the ham-mer excited vibration attenuates rapidly. The temporaldevelopment and decay of the free vibration dependson the physical characteristics of the system/pipe ge-ometry, especially of the damping coefficient (Ahn andJeong, 2005), which is determined by the wall thickness.
During the impact phase, the system is represented as ajoining between the hammer and the structure. At theend of the impact, the hammer looses the contact withthe structure, which now vibrates freely in agreementwith their natural resonance frequencies (Champouxet al., 2003).
Based on ideas presented earlier, the acoustic hammerimpact has been evaluated in this work towards sim-plified fouling detection in ducts and pipelines, used forcrude oil transport. Here, we analyze variations in vibra-tion amplitude and frequency using accelerometer andmicrophone output signals in the presence of inner tubefouling layers.
A fouling detector has been exploited, using the hammertest to provoke mechanical vibrations in the pipe sectionunder investigation. An excitation system is used togenerate vibrations in the pipe section under test. Adetection system for signal conditioning is used to recordthe vibration parameters. The signals are analyzed intime and frequency domain using an oscilloscope and aspectrum analyzer.
Figure 1 represents a sketch of the experimental set-upusing a microphone and an accelerometer as sensors.
Revista Controle & Automacao/Vol.22 no.6/Novembro e Dezembro 2011 621

Figure 1: Sketch of the experimental set-up with microphoneand accelerometer.
The electromagnetic displacement system is formed by aDC power supply and for a pulse generator, that excitesa coil and it activate the hammer, making the hammerto hit the pipe. The hammer excitation signal frequencyis controlled for the pulse generator. The sample rate ofthe data acquisition is 200 MHz and the force impacthas a repeatability of 2 Hz, this frequency is used tocontrol the repeatability of the hammer impact onto thetube. The applied force onto surface of the test tube was0.4 N , as determined by a digital dynamometer, wellmaintaining the impact load magnitude.
The test tube comprises a wall thickness of 2.5 mm, adiameter of 10 cm, a length of 60 cm (l2), made fromgalvanized iron.
In all tests the same pipes are used. Initially the testsare performed with the microphone and later with theaccelerometer to avoid errors. The tests are performedwith metal tubes, because the objective is the foulingdetection in the petroleum transport.
The variation in temperature influences in the foulingprocess, but the microphone and accelerometer, whichare used as sensors, can still detect the modificationsin the acoustic and vibration signals. If the temper-ature decreases, the fouling process increases, becausethe present substances in the liquid will crystallize ina faster way. If the temperature increases, the foul-ing process decreases, because the thermal agitationof the molecules increases (Escobeto et al., 1997),(Mansoori, 1997), (Mansoori, 2001).
The methodology relies on observing the parameters:amplitude, decay time and frequency, in the monitoredsignals.
2.1 Tests with the accelerometer
A sketch of the accelerometer output signal is presentedin Figure 2, according to (Silva, 2008).
We can define the following expression for the maximumamplitude of the signal Va(t):
Ai = max(Va(t)), i = 1, 2, ..., N (1)
where: ei is the fouling thickness (e2 > e1), Va(t) isthe output signal of the detection system using the ac-celerometer and Ai is the maximum amplitude of thesignal Va(t). T is the repetition rate in the tests.
The mean value (A) for the maximum amplitude of thesignal Va(t) is:
A(e) =1
N
N∑
i=1
Ai(e) (2)
where: N is the number of tests used in each experiment.
The increase in the fouling thickness (e) provokes a re-duction in the amplitude maximum value in the outputsignal (Ai).
Figure 2: Representation of the signal in the accelerometer out-put.
2.2 Tests with the microphone in time do-main
A sketch of the attenuated microphone output signal inthe time domain is presented in Figure 3, according to(Silva, 2008).
We can define the following expression for the envelopeof the signal Vmt(t):
P (t) = P0(1 − e−
t
di(e) ) (3)
622 Revista Controle & Automacao/Vol.22 no.6/Novembro e Dezembro 2011

where: ei is the fouling thickness (e2 > e1), Vmt(t) isthe output signal of the detection system using the mi-crophone, in time domain, P (t) is the envelope signaland di is the decay time of the signal Vmt(t), in otherwords, the necessary time to reduce the maximum am-plitude (P0) of the signal Vmt(t) for 37% of its value((1 − e−1)P0).
The mean value (D) for the decay time of the signalVmt(t) is:
D(e) =1
N
N∑
i=1
di(e) (4)
where: N is the number of tests used in each experiment.
The increase in the fouling thickness (e) provokes a re-duction in the value of the decay time (di) of the signalVmt(t).
Figure 3: Representation of the signal in the microphone output,in time domain.
2.3 Tests with the microphone in frequencydomain
A sketch of the attenuated microphone output signal inthe frequency domain is presented in Figure 4, accordingto (Silva, 2008).
We can define the following expression for the resonancefrequency of the signal Vmf (f):
fresi = argmax(Vmf (f)), f ∈ [f0, f1] (5)
where: ei is the fouling thickness (e2 > e1), Vmf (f)is the output signal of the detection system using themicrophone, in frequency domain, and fresi is the res-onance frequency of the signal Vmf (f), in other words,
the frequency (f) where occur the maximum value (Vi)of the signal Vmf (f).
The mean value (F ) for the resonance frequency of thesignal Vmf (f) is:
F (e) =1
N
N∑
i=1
fresi(e) (6)
where: N is the number of tests used in each experiment.
The increase in the fouling thickness (e) provokes a re-duction in the value of the resonance frequency (fresi)of the signal Vmf (f).
Figure 4: Representation of the signal in the microphone output,in frequency domain.
3 EXPERIMENTAL RESULTS
A calibration step to define the original acoustic tubesignature is initially carried out in absence of a foulinglayer. The received signal is monitored, and the acousticfeatures (amplitude, frequency) stored as reference.
The originally present asphaltic fouling layer has beenreplaced by a paraffin (resin) film with varying thicknessup to 10 mm, carefully deposited within the test tubes.
A commercial MEMS accelerometer sensor from Ana-log Devices ADXL 202 and a high quality microphonefrom Sennheiser Cardioid GM 580 (Bandwidth: 50 Hz
to 13 kHz) have been employed for the investigations.The MEMS detector has been glued onto the tube cir-cumference at a distance of 2 cm (l1) from the hammerimpact point. The microphone has been mounted at thesame distance.
Revista Controle & Automacao/Vol.22 no.6/Novembro e Dezembro 2011 623
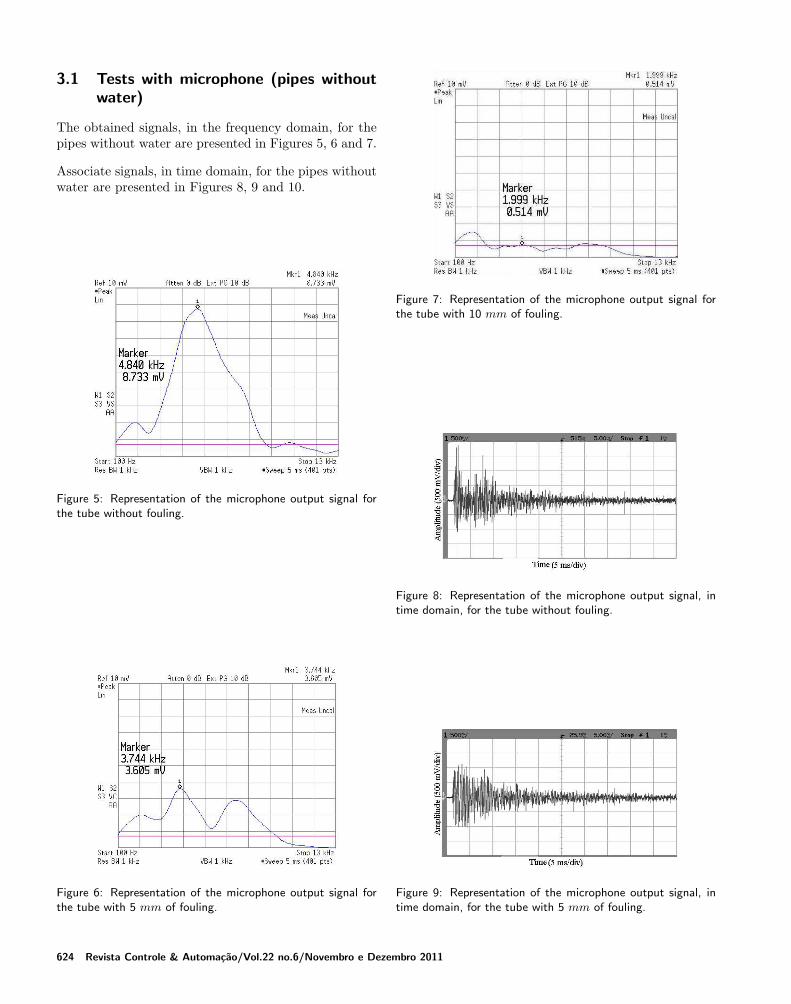
3.1 Tests with microphone (pipes withoutwater)
The obtained signals, in the frequency domain, for thepipes without water are presented in Figures 5, 6 and 7.
Associate signals, in time domain, for the pipes withoutwater are presented in Figures 8, 9 and 10.
Figure 5: Representation of the microphone output signal forthe tube without fouling.
Figure 6: Representation of the microphone output signal forthe tube with 5 mm of fouling.
Figure 7: Representation of the microphone output signal forthe tube with 10 mm of fouling.
Figure 8: Representation of the microphone output signal, intime domain, for the tube without fouling.
Figure 9: Representation of the microphone output signal, intime domain, for the tube with 5 mm of fouling.
624 Revista Controle & Automacao/Vol.22 no.6/Novembro e Dezembro 2011

Figure 10: Representation of the microphone output signal, intime domain, for the tube with 10 mm of fouling.
The decay time for the tube without fouling is 14 ms,for 5 mm of fouling is 10 ms and for 10 mm of foulingis 5 ms.
Analysing the results, we can observe that the reductionin frequency and decay time, in relation to clean tube,are the indicative of presence and increase of fouling inthe monitored pipelines.
The microphone records the acoustic tube signature, dueto excitation and propagation of a longitudinal wave, asknown from the ringing bell.
3.2 Tests with accelerometer (pipes with-out water)
The monitored and stored accelerometer output signals,for the pipes without water, are illustrated in the uppertraces of Figures 11, 12 and 13 in absence of fouling,for fouling layer thickness of 5 mm and for fouling layerthickness of 10 mm, respectively.
Figure 11: Accelerometer output signals in absence of fouling.
Figure 12: Accelerometer output signals with 5 mm of fouling.
Figure 13: Accelerometer output signals with 10 mm of fouling.
With increasing film thickness the signal magnitude aredecreasing. Persistent low magnitude ringing, observ-able in all time signals, most likely originates from aresonance in the MEMS accelerometer itself, where itsspring type cantilever design supports the oscillating (vi-bration) response characteristic.
We attribute the origin of the signature recorded bythe accelerometer to the transversal deformation wave,which propagates along the tube surface, similar tospreading of a surface water wave. This explanation issupported by our simulation, where the hammer impactcauses spatially distributed surface deformations.
3.3 Tests with microphone (pipes with wa-ter)
Tests under loading conditions, in presence of water, inthe tubes were also carried out with microphone. Fig-ures 14 and 15 present the results, in frequency domain,for the tubes without fouling and with 5 mm of fouling.
Revista Controle & Automacao/Vol.22 no.6/Novembro e Dezembro 2011 625

Figure 14: Representation of the microphone output signal forthe tube without fouling (pipe with water).
Figure 15: Representation of the microphone output signal forthe tube with 5 mm of fouling (pipe with water).
Figures 16 and 17 present the results (pipes with water),in time domain, for the tubes without fouling and with5 mm of fouling.
Figure 16: Representation of the microphone output signal, intime domain, for the tube without fouling (pipe with water).
Figure 17: Representation of the microphone output signal, intime domain, for the tube with 5 mm of fouling (pipe withwater).
The reduction of the resonance frequencies and decaytimes still allows fouling detection.
3.4 Tests with accelerometer (pipes withwater)
Tests under loading conditions, in presence of water, inthe tubes were also carried out with accelerometer. Fig-ures 18 and 19 present the results, for the tubes withoutfouling and with 5 mm of fouling.
Figure 18: Accelerometer output signals in absence of fouling(pipe with water).
Figure 19: Accelerometer output signals with 5 mm of fouling(pipe with water).
626 Revista Controle & Automacao/Vol.22 no.6/Novembro e Dezembro 2011

The reduction of the amplitudes still indicates foulingcondition.
3.5 Comparisons between the results withand without load conditions
In Tables 1, 2 and 3 are presented the obtained resultsin the tests with and without liquid (water) inside thetubes. Tables 1 and 2 present the obtained results withmicrophone, in frequency domain and time domain, re-spectively. Table 3 presents the obtained results withaccelerometer.
Table 1: Obtained results with microphone, in frequency do-main.
Fouling layer Tests with Tests without
water water
0 mm 4.84 kHz 3.97 kHz5 mm 3.74 kHz 2.62 kHz
Table 2: Obtained results with microphone, in time domain.
Fouling layer Tests with Tests without
water water
0 mm 14.0 ms 9.0 ms5 mm 10.0 ms 4.0 ms
Table 3: Obtained results with accelerometer.
Fouling layer Tests with Tests without
water water
0 mm 900 mV 170 mV5 mm 600 mV 100 mV
In load conditions (with water inside the tubes), themass of the system is increased and the impact of thehammer provokes vibrations with smaller amplitudesand smaller acoustic levels which are detected by theaccelerometer and microphone, respectively.
The hammer impact force should be determined accord-ing to the pipe dimension variations and the type oftransported liquid, so that the levels of the monitoredsignals can indicate the fouling layers inside the tubes.Therefore, it is important to determine the pipe signa-ture to perform the tests.
The properties of the transported liquid, as density, in-fluence in the tests, because the force of the impactshould be determined to guarantee the measurement ofthe parameters and their variations with the increase ofthe fouling.
3.6 Tests with different layer of fouling
In this case, tests were performed using the accelerom-eter and microphone, with signals in frequency domain,because the analysis of the results can be made directlystarting from the observed signals.
Figure 20 presents a transverse view of the tube withthree layer of fouling (0 mm, 5 mm and 10 mm).
Measurements were performed with distances, betweenthe hammer impact and the accelerometer and micro-phone, of 3 cm along the tube. The obtained resultswith the accelerometer are presented in Figure 21.
The obtained results with the microphone are presentedin Figure 22.
Figure 20: Transverse view of the tube with three layer of foulingwith: 0 mm, 5 mm and 10 mm of resin.
Figure 21: Obtained results with the accelerometer in a tubewith multi-layer fouling.
Revista Controle & Automacao/Vol.22 no.6/Novembro e Dezembro 2011 627
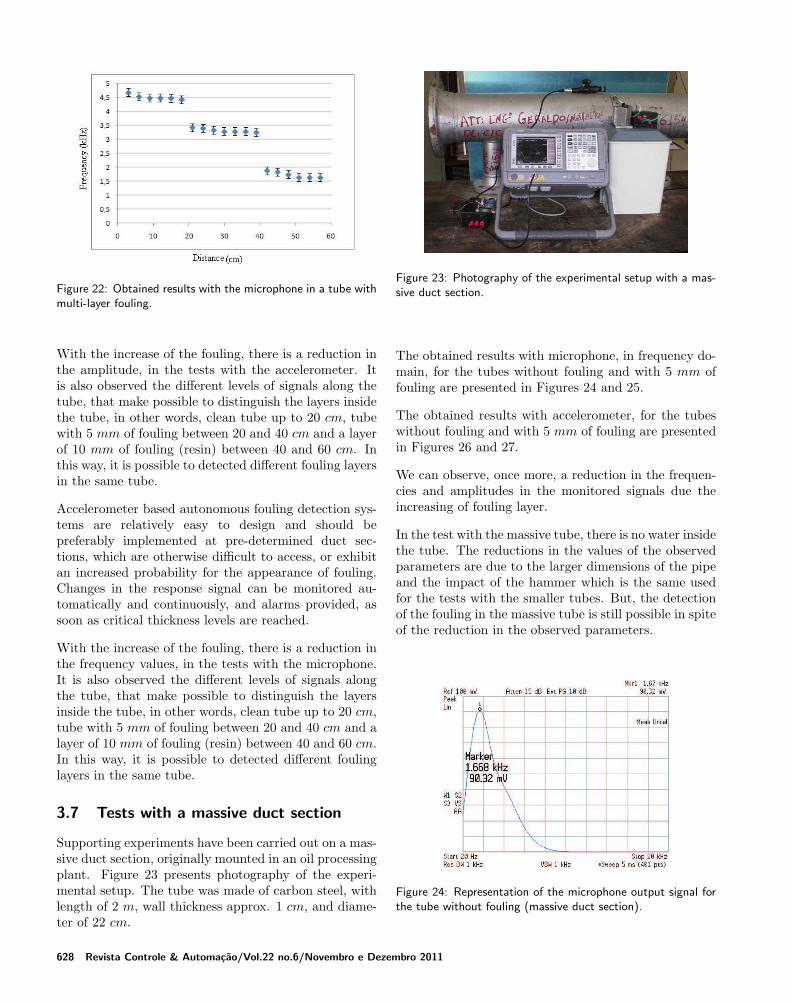
Figure 22: Obtained results with the microphone in a tube withmulti-layer fouling.
With the increase of the fouling, there is a reduction inthe amplitude, in the tests with the accelerometer. Itis also observed the different levels of signals along thetube, that make possible to distinguish the layers insidethe tube, in other words, clean tube up to 20 cm, tubewith 5 mm of fouling between 20 and 40 cm and a layerof 10 mm of fouling (resin) between 40 and 60 cm. Inthis way, it is possible to detected different fouling layersin the same tube.
Accelerometer based autonomous fouling detection sys-tems are relatively easy to design and should bepreferably implemented at pre-determined duct sec-tions, which are otherwise difficult to access, or exhibitan increased probability for the appearance of fouling.Changes in the response signal can be monitored au-tomatically and continuously, and alarms provided, assoon as critical thickness levels are reached.
With the increase of the fouling, there is a reduction inthe frequency values, in the tests with the microphone.It is also observed the different levels of signals alongthe tube, that make possible to distinguish the layersinside the tube, in other words, clean tube up to 20 cm,tube with 5 mm of fouling between 20 and 40 cm and alayer of 10 mm of fouling (resin) between 40 and 60 cm.In this way, it is possible to detected different foulinglayers in the same tube.
3.7 Tests with a massive duct section
Supporting experiments have been carried out on a mas-sive duct section, originally mounted in an oil processingplant. Figure 23 presents photography of the experi-mental setup. The tube was made of carbon steel, withlength of 2 m, wall thickness approx. 1 cm, and diame-ter of 22 cm.
Figure 23: Photography of the experimental setup with a mas-sive duct section.
The obtained results with microphone, in frequency do-main, for the tubes without fouling and with 5 mm offouling are presented in Figures 24 and 25.
The obtained results with accelerometer, for the tubeswithout fouling and with 5 mm of fouling are presentedin Figures 26 and 27.
We can observe, once more, a reduction in the frequen-cies and amplitudes in the monitored signals due theincreasing of fouling layer.
In the test with the massive tube, there is no water insidethe tube. The reductions in the values of the observedparameters are due to the larger dimensions of the pipeand the impact of the hammer which is the same usedfor the tests with the smaller tubes. But, the detectionof the fouling in the massive tube is still possible in spiteof the reduction in the observed parameters.
Figure 24: Representation of the microphone output signal forthe tube without fouling (massive duct section).
628 Revista Controle & Automacao/Vol.22 no.6/Novembro e Dezembro 2011

Figure 25: Representation of the microphone output signal forthe tube with 5 mm of fouling (massive duct section).
Figure 26: Accelerometer output signals in absence of fouling(massive duct section).
Figure 27: Accelerometer output signals with 5 mm of fouling(massive duct section).
The amount of fouling can be inferred from the changein frequency/amplitude in an unknown/real tube withfouling, if it is possible to determine the tube signature(tube without fouling). The method also works withjoints in pipeline, in this case, once more is necessaryto determine the signature in the joints and verify themodifications in the observed signals, as reduction inamplitude and frequency.
4 CONCLUSIONS
In this work, a hammer impact test has been employedfor fouling detection via vibration tube signatures. Thismethod relies on vibration amplitude and frequency de-termination using an accelerometer and a microphone.
Variations of amplitude and frequency signatures, re-sulting from the presence of inner tube fouling layersare easily observed. Absolute values of the output sig-nal can be compared and modifications, as reduction,are clear indications for presence of fouling. Thus, thevibration amplitude and frequency reduction providesimportant information on the amount of tube fouling.
The hammer impact points in each test have been main-tained to assure the same test conditions. The mainadvantage of the method is the simplicity of the mea-surements and determination of the parameters; a moresophisticated parameter estimation method was not re-quired, once the values have been determined.
Supporting experiments with a massive duct section ofa crude oil plant confirm the practical application of thesensing method.
With the developed techniques, we can evaluate differ-ent points of the pipes and identify the places with largeror smaller fouling thickness, by analyzing the modifica-tions in the parameters (amplitude, frequency and decaytime) in each test. As result, the costs with maintenanceare reduced, and the monitoring processes in the pipesystems are improved.
ACKNOWLEDGMENTS
The authors would like to thanks CNPq and CAPES forfinancial support in this project.
REFERENCES
Ahn, S. J. and Jeong, W. B. (2005). Improvement of im-pulse response spectrum and its application, Jour-
nal of Sound and Vibration. 288(5): 1223–1239.
Barshinger, J. and Rose, J. L. (2002). Guided waveressonance tuning for pipe inspection, Journal of
Pressure Vessel Technology 124(3): 303–310.
Branco, V. A. M., Mansoori, G. A., Xavier, L. C. A.,Park, S. J. and Manafi, H. (2001). Asphaltene floc-ulation and collapse from petroleum fluids, Journal
of Petroleum Science and Engineering 32(4): 217–230.
Revista Controle & Automacao/Vol.22 no.6/Novembro e Dezembro 2011 629

Cam, E., Lei, M., Kocaarslan, I. and Taplamacioglu, C.(2002). Defect detection in a cantilever beam fromvibration data, Technical report, Kirikkale Univer-sity, Faculty of Engineering, Department of Elec-trical and Electronics, Kirikkale.
Carino, N. J. (2001). The impact-echo method: Anoverview, Proceedings of the Structures Congress
and Exposition, Washington, USA.
Castelline, P., Revel, G. M. and Scalise, L. (2004).Measurement of vibrational modal parameters us-ing laser pulse excitation techniques, Measurement
35(2): 163–179.
Champoux, Y., Cotoni, V., Paillard, B. and Beslin., O.(2003). Moment excitation of structures using twosynchronized impact hammers, Journal of Sound
and Vibration 263(3): 515–533.
Escobeto, J., Mansoori, G. A., Balderas-Joers, C.,Carranza-Becerra, L. J. and Mendes-Garcia, M. A.(1997). Heavy organic deposition during oil pro-duction from a hot deep reservoir: A field expe-rience, Proceedings of the 5th Latin American and
Caribbean Petroleum Engineering Conference and
Exhibits, Rio de Janeiro, Brazil.
Gatts, C. E. N., Siqueira, M. H. S., da Silva, R. R. andRebello, J. M. A. (2004). The use of ultrasonicguided waves and wavelets analysis in pipe inspec-tion, Ultrasonics 41(10): 785–797.
Hay, T. R. and Rose, J. L. (2002). Fouling detectionin the food industry using ultrasonic guided waves,Journal of Food Control 14(7): 481–488.
Krisher, A. S. (2003). Technical information regardingcoupon testing, Technical report, ASK Associates,St. Louis, Missouri.
Lohr, K. R. and Rose, J. L. (2002). Ultrasonic guidedwave and acoustic impact methods for pipe foul-ing detection, Journal of food engineering, Elsevier
Science 56(4): 315–324.
Mansoori, G. A. (1997). Modeling of asphalteneand other heavy organics depositions, Journal of
Petroleum Science and Engineering 17: 101–111.
Mansoori, G. A. (2001). Deposition and fouling of heavyorganic oils and other compounds, 9th Interna-
tional Conference on Properties and Phase Equi-
libria for Product and Process Design, Okayama,JAPAN.
Nahvi, H. and Jabbari, M. (2005). Crack detection inbeams using experimental modal data and finite el-ement model, International Journal of Mechanical
Sciences 47(10): 1477–1497.
Panchal, C. B. (1997). Fouling mitigation of industrialheat exchange equipment, Technical report, BengellHouse, New York.
Rose, J. L. (1995). Recent advances in guided wavende, Proceedings on IEEE Ultrasonic Symposium
1: 761–770.
Roy, P. K. and Ganesan, N. (1995). Transient responseof a cantilever beam subject to on impulse load,Journal of Sound and Vibration 183(5): 873–880.
Shen, M. H. H. and Pierre, C. (1994). Free vibrations ofbeams with a single-edge crack, Journal of Sound
and Vibration 170(2): 237–259.
Silva, J. J. (2008). Development of Foulinng Detection
Techniques Using Non-invasive Methods, PhD the-sis, (In portuguese), Federal University of CampinaGrande, Campina Grande, Brazil.
Silva, J. J., Lima, A. M. N., Neff, F. H. and Neto, J.S. R. (2009a). Non-invasive fast detection of inter-nal fouling layers in tubes and ducts by acousticvibration analysis, IEEE Transactions on Instru-
mentation and Measurement 58(1): 108–114.
Silva, J. J., Lima, A. M. N., Neff, F. H. and Neto, J.S. R. (2009b). Vibration analysis based on hammerimpact test for multilayer fouling detection, XIX
IMEKO World Congress Fundamental and Applied
Metrology, OLisbon, Portugal.
Silva, J. J., Lima, A. M. N., Neff, F. H. and Neto, J. S. R.(2010a). Aplicacao do teste de impacto do martelopara deteccao de incrustacao em tubulacoes, XVIII
Congresso Brasileiro de Automatica, Mato Grosso,Brasil.
Silva, J. J., Lima, A. M. N., Neff, F. H. and Neto, J.S. R. (2010b). Vibration analysis based on hammerimpact for fouling detection using microphone andaccelerometer as sensors, Sensors and Transducers
Journal 112(1): 10–23.
630 Revista Controle & Automacao/Vol.22 no.6/Novembro e Dezembro 2011