Biophysical characterisation of biopharmaceuticals under ...
Upload
independentCategory
view
1download
0
Co
Ya
b
a
ARRAA
KFMPHV
1
pvgmMToocawttfttn
0d
Journal of Membrane Science 341 (2009) 163–171
Contents lists available at ScienceDirect
Journal of Membrane Science
journa l homepage: www.e lsev ier .com/ locate /memsci
haracterisation of membrane fouling deposition and removal by directbservation technique
ulita Marselina a, Lifia a, Pierre Le-Clech a, Richard M. Stuetz b, Vicki Chen a,∗
UNESCO Centre for Membrane Science and Technology, School of Chemical Sciences and Engineering, University of New South Wales, Sydney, Sydney 2052, Australia1
UNSW Water Research Centre, School of Civil and Environmental Engineering University of New South Wales, Sydney, 2052, Australia
r t i c l e i n f o
rticle history:eceived 10 March 2009eceived in revised form 1 June 2009ccepted 3 June 2009vailable online 11 June 2009
eywords:
a b s t r a c t
The understanding of fouling mechanisms in membrane processes is commonly inferred via flux andrejection performances. Using direct observation (DO) allows the non-invasive, in situ, visualisation andquantification of fouling deposition and the removal from hollow fiber membranes in real time. Whilethe advantages of the DO technique have been described previously, in this work, the effects of cross-flow velocities and backwashing on particle deposition and removal are quantified under constant fluxconditions. The foulant resistances are monitored along with the cake height during membrane filtra-
oulingicrofiltration
article depositionollow fiberisualisation
tion and cleaning. By measuring the cake height non-invasively, the DO technique reduces some of theassumptions required to estimate the specific cake resistance. The velocity profiles of particles near themembrane surface during filtration were observed during the formation of stagnant and fluidised foulinglayers. During backwashing, the fouling layer was removed with a combination of cake expansion andgradual erosion mechanisms at low crossflow velocities and direct erosion of cake height at higher cross-flow velocities. These results provide further insights into fouling dynamics in systems such as submergedhollow fiber modules.
. Introduction
Fouling is one of the major drawbacks of membrane filtrationrocesses. It occurs gradually with filtration time and can takearious forms, such as adsorption, pore blockage, deposition orel formation [1]. Fouling propensity is commonly assessed byonitoring permeate flux (J) and transmembrane pressure (TMP).embranes processes are generally either operated under constant
MP or constant permeate flux and decrease in permeate flow rater increase of TMP is respectively observed, once the fouling formsn the membrane. The hydraulic resistance of the filtration systeman be quantified by correlating the TMP and permeate flux duringclean water test. This correlation is described as Darcy’s law, inhich J (m s−1) is expressed as a function of TMP (Pa), total resis-
ance Rt (m−1) and permeate viscosity (� in Pa s) [2]. Rt consists ofhe intrinsic membrane (Rm in m−1) and cake resistance (Rc in m−1),
eaturing both reversible (Rrev in m−1) and irreversible fouling resis-ance (Rirrev in m−1). Generally, the irreversible fouling is defined ashe amount of fouling that remains after physical cleaning mecha-isms, such as crossflow shear or backwashing. This irreversible∗ Corresponding author. Tel.: +61 293854813; fax: +61 293855966.E-mail address: [email protected] (V. Chen).
1 www.membrane.unsw.edu.au.
376-7388/$ – see front matter © 2009 Elsevier B.V. All rights reserved.oi:10.1016/j.memsci.2009.06.001
© 2009 Elsevier B.V. All rights reserved.
fouling resistance generally results from adsorption and/or poreblockage within the membrane [3].
Improvements in the understanding of membrane fouling can beobtained using non-invasive techniques, which are able to visualisethe fouling deposition and removal in real time (i.e. without theneed for removing the membrane from its filtration module) [4].For example, the deposition of biofilm on tubular membranes wasdirectly visualised with the projector technique [5]. The image of atubular membrane is projected onto a screen with an attached scaleand the image projection is recorded. The cake height can then bequantified from the image projection with resolution of 10 �m.
The direct observation through membrane (DOTM) techniquehas been used to visualise the fouling on flat-sheet membranes incrossflow modules [6]. This setup allows the visualisation of parti-cles larger than 1 �m and consists of a microscope, a camera anda membrane module. The microscope objective lens is focussed onthe permeate side of a transparent membrane. DOTM has been suc-cessfully applied to directly visualise the deposition of yeast, latexparticles or submicron bacteria on Anopore membrane [6,7]. Yeastfouling deposition and removal via backwashing was observed with
the direct visual observation (DVO) technique, which is similar toDOTM but the microscope objective lens is focussed on the feed side[8]. These direct observations techniques have so far been mainlyused to visualise the deposition on surfaces while quantification ofcake thickness has been difficult to determine.
164 Y. Marselina et al. / Journal of Membrane Science 341 (2009) 163–171
Table 1Advantages and limitations of non-invasive techniques for fouling monitoring during membrane filtration.
Non-invasive techniques Advantages Limitations Refs.
Projector technique Measurement of fouling thickness oftubular membrane with resolution of1 mm
Unable to detect the individualbacterial cell interactions
[5]
Direct observation through membrane (DOTM) Measurement of cake coverage andvisual observation of particlesmovements on the flat-sheetmembrane with resolution of 1 �m
Unable to measure the thickness ofcake height
[6–8]
Laser beam Measurement of fouling thickness oftubular membrane
No direct visualisation during thefouling experiments
[9–11]
Laser excitation (near infrared) Measurement of fouling thickness ofapabir a lasidingmages
Maximum cake height of 45 �m [12]
betsNirqfnTfatiodefa
lcfiatKhoct(aim(
M
˛
˛
hb
side, and the pressure signal was collected by using Labview dataacquisition software.
The DO apparatus consisted of a modified crossflow module,a microscope and a video camera (Fig. 1). The crossflow mem-brane filtration module has been modified to accommodate a single
flat-sheet membrane, cfluorescent labelling foinfrared region by provhigh-resolution of 3D i
Fouling thickness quantification on tubular membranes haseen investigated with optical techniques involving laser (He–Ne)xcitation into the membrane during filtration [9]. A fraction ofhe laser light is absorbed by the bentonite fouling layer and theignal reduction is monitored to translate the deposited thickness.on-invasive fouling on hollow fiber membranes can also be mon-
tored by using a laser sheet, which a camera records the laser lighteflected by the membrane [10,11]. The deposit thickness is thenuantified according to the recorded image intensity. More detailedouling characterisation can also be obtained with laser excitationear infrared, which is known as 3D femtosecond imaging [12].his laser is installed in series with the microscope to observe theouling layer on flat-sheet membranes in crossflow modules. Thedvantages and limitations of those techniques for fouling charac-erisation are summarised in Table 1. Detailed visualisations of foul-ng with non-invasive techniques have been successfully describedn flat-sheet membranes but there has been little research on theynamics of particle deposition on hollow fiber membrane. Sev-ral invasive and non-invasive techniques were recently reviewedor their potential to monitor the fouling in membrane bioreactorpplications [13].
The specific cake resistance (˛) value has been previously calcu-ated at constant flux [14] and constant TMP [15] under dead-endonfigurations. For crossflow systems, the cake height obtainedrom non-invasive techniques can be very useful to estimate foul-ng characteristics, such as mass deposited (Mc, in kg), porosity (ε)nd specific cake resistance [9]. Porosity can be calculated withhe Carman–Kozeny equation (Eq. (1)), which is a function of theozeny constant (Hk), Sauter diameter (Dg, in m), stagnant foulingeight (Hc, in m), and cake resistance Rc (m−1) [9,16]. In the casef bentonite, the Hk can be estimated as 5 �m [9] and Dg was cal-ulated as 2.5 �m. Deposited mass in Eq. (2) can be described byaking into account the Hc, membrane radius (R, in m), cake density�c, in kg m−3), length of membrane (L, in m) and ε. The ˛ (m kg−1)s shown in Eq. (3) is a function of Rc, membrane surface area (Am,n m2) and Mc value. Cake compressibility (n) is commonly esti-
ated by assuming ˛ increases with TMP as a power law functionEq. (4)):
Hc
Rc= 1
36Hk
D2gε3
(1 − ε)2(1)
c = �HcL(Hc + 2R)(1 − ε)�c (2)
= RcAm
Mc(3)
∞TMPn (4)
Other methods in the literature involved calculating Hc by usingydrodynamic relationships [17] or by manual cake extraction viaackwash [18]. Using direct observation eliminates some of the
lity to useer range in
assumptions required to calculate ˛ by using the Hc value obtaineddirectly in situ. The specific resistance provides insights into thestructure of the fouling during different phases of filtration andoperating conditions.
Previous work has shown the opportunities of the DO techniqueto visualise particle deposition and removal mechanisms in situ onhollow fiber membranes [19]. The use of hollow fibers allows directassessment of cake height by imaging the edge of the fiber. In thispaper, constant flux operation is used to determine the detailedmechanisms and for quantification of the effects of crossflow veloci-ties (CFVs) and backwashing on particle transport, cake height, cakecompressibility and specific resistance to give better understand-ing of the dynamics of fouling and removal in a model particulatesystem.
2. Materials and methods
2.1. DO apparatus
The feed solution was stirred to provide homogeneity and wascirculated with a gear pump through the crossflow membrane mod-ule. A peristaltic pump was used to regulate the permeate flow,which was returned to the feed reservoir to maintain constant feedconcentration. A pressure transducer was placed in the permeate-
Fig. 1. Picture of the DO experimental setup [19].

embrane Science 341 (2009) 163–171 165
hcmuommwtwtfttcmd
2
disbatwTsfe
2
(afmtur(w
2
fawpuaw
Talcaoict
of 110) was applied in this experiment in order to limit significantmovement of the fiber during the visualisation at high magnifica-tion near the membrane surface. Low bentonite concentration wasfiltered because of the poor visibility at high feed concentrations
Y. Marselina et al. / Journal of M
ollow fiber membrane for fouling experiments. The top part ofrossflow module has a glass window (65 mm × 20 mm), which wasounted as a viewing port. The channel height of membrane mod-
le was 4 mm and the distance measured between the viewing portf the upper part of the module and the centre of hollow fiberembrane was 1.3 mm. The membrane module was horizontallyounted onto the optical bright-field microscope (Axiolab, Zeiss)ith a 10-times magnification objective lens. The membrane filtra-
ion module used shell side feed (i.e. out-to-in), and the membraneas sealed on one side allowing the permeate withdrawal from
he open lumen. It was therefore possible to observe the foulingormed on the external surface of hollow fiber membrane. Duringhe visualisation with the DO technique through a viewing port,he hollow fiber membrane was seen as dark/black colour, and theamera could be easily focussed on the edge of the hollow fiberembrane. The DO apparatus has been previously described in
etail [19].
.2. Image analysis
The recorded video footage was processed using ‘Pinnacle Stu-io’ software allowing the still-images to be viewed with 0.04 s
ntervals. During the early stage of fouling deposition (or lattertage of fouling removal), the Hc was characterised easily as theoundary between the membrane and cake layer was distinguish-ble. When dense fouling layer occurred on the membrane surface,he image analysis (Image J with background subtraction function)as required to differentiate the edge of membrane and cake layer.
he foulant movements were then studied closely by tracking aeries of particles with Image J (MTrackJ plugin). The time requiredor the foulant to travel for a given distance was then calculated tostimate the apparent particle velocity.
.3. Membrane
A polyvinylidene fluoride (PVDF) hollow fiber membraneSiemens Water Technology) with a nominal pore size of 0.1 �m,n outside diameter of 0.65 mm and a length L of 155 mm was usedor the experimental studies. The liquid crossflow could cause fiber
ovements, thus it was necessary to tightly mount the membraneo limit any significant vibration during the observation. Prior tose, the membrane was wetted with 98% ethanol solution, theninsed by filtering Milli-Q water. A new membrane with an Rm of 4.3±0.47) × 1011 m−1 (average ± standard error of the mean values)as used for each individual experiment.
.4. Feed solution
Particulate model solutions of bentonite (Sigma–Aldrich) for DOouling characterisation, the feed solution was prepared daily inn ultrasonic bath for 15 min to disperse the bentonite particles inater (Fig. 2). Mastersizer/E (Malvern) was used to measure thearticle size, which was quantified as volume distribution (i.e. vol-me percentage of particles at a given size). The mean particle sizes volume average was observed at 50% at volume accumulationith the bentonite average size of 2.5 �m.
Density of dry bentonite was estimated at 2260 kg m−3 [20].he amount of adsorbed water of the bentonite bulk samples wasssumed as 0.115 kg per kg of dry bentonite, which was calcu-ated during bentonite mechanical compactions at atmosphericonditions (room temperature and atmospheric pressure) [21]. As
result, the �c of bentonite was calculated as 2966 kg m−3 to formn the membrane surface. In this study, due to low pressure appliedn the membrane system (<50 kPa), it was assumed that the �c wasonstant within the length of the filtration period. This assump-ion will be verified with the calculated n value; if the value is
Fig. 2. Bentonite particle size distribution profile.
close to zero (non-compressible or slightly compressible), then theassumption is valid.
3. Results and discussions
Fouling during the filtration of an alginate and bentonite mixturehas previously been observed using the DO technique [22,23]. How-ever, the detailed characterisations of foulant cakes from bentonitesuspension are investigated in this study to understand the foulingdeposition and removal mechanisms. The DO technique enabledthe visualisation of the particle deposition during filtration and theparticle removal during cleaning. In order to assess the reliabilityof the DO technique, the same filtration and cleaning experimentswere repeated five times to determine the reproducibility of thetechnique. The effects of CFVs on fouling deposition and foulingremoval were investigated with detailed characterisations in termsof TMP, J, hydraulic resistances, Hc, particle velocity, ˛ and n. Thequantifications of these parameters were used to demonstrate thepotential application of the DO technique as a tool to analyse mem-brane fouling behaviour.
3.1. Fouling deposition
3.1.1. Hydraulic and physical characteristics of foulingFouling was monitored by the temporal changes in TMP during
the 135 min of filtration with 200 mg l−1 bentonite and constantflux of 75 l m−2 h−1. Such low CFV of 15 mm s−1 (Reynolds number
Fig. 3. TMP profiles during 200 mg l−1 bentonite filtration at CFV of 15 mm s−1 forfive repeated experiments (21% average error bar).

166 Y. Marselina et al. / Journal of Membrane Science 341 (2009) 163–171
F CFV ofd
(pto(of
tmtapTttt
attfttqbw5flwSa
dsoba
Fpb
responsible for to the increase in Hc and fouling propensity. Priorfiltration, the particle velocity at distance 800 �m from the surface
ig. 4. Temporal changes in fouling deposition for 200 mg l−1 bentonite filtration (ark area below the white line.
>800 mg l−1 bentonite) on the membrane surface. Moreover, highermeate flux was applied during filtration in order to observehe fouling formation during short-term experiments. At the endf filtration, the average TMP value was obtained as 40 ± 3 kPaFig. 3). The average TMP profile showed that a rapid fouling ratef 0.8 kPa min−1 occurred for the first 15 min, which was thenollowed by a slow fouling rate of 0.2 kPa min−1.
The following still-images (Fig. 4) were captured at filtrationime of 0, 15, 60 and 135 min for one of the experiments. The
ovement of bentonite particles near the membrane surface (upo 600 �m) was clearly visible under the microscope and char-cterised in terms of velocity. The phenomenon of concentrationolarisation featuring fluidised and stagnant layer was observed.he fluidised cake was defined as a layer of moving particles nearhe membrane surface and travelled at a much lower velocity thanhe particles in the bulk flow region. The particle movements nearhe membrane surface will be further discussed in Section 3.1.2.
A fraction of particles of the fluidised layer gradually depositednd formed part of the stagnant fouling layer throughout the filtra-ion period. The bottom part of the fouling layer became denserhan the upper part throughout the filtration period due to theouling deposition itself and the fouling image superimposed fromhe curve shape membrane surface. This effect made it difficulto determine the edge of hollow fiber membrane. Therefore, theuantification of Hc depended on the membrane position at theeginning of filtration and/or image analysis. The average Hc values,hich were obtained from five repeated experiments, measured at
, 60, and 135 min were 14, 78, and 160 �m, respectively (Fig. 5). Theuidised cake height (Hfc) measured at the beginning of filtrationas 5–10 �m and stabilised at 30–50 �m after 90 min of filtration.
tandard mean of error values at the end of filtration for stagnantnd fluidised cakes were 14 and 26 �m, respectively.
This variation of values could be due to errors during theetermination of each layer (i.e. membrane-cake boundary and
tagnant-fluidised cake layers). The standard deviation valuebtained with the DO technique was higher than the value obtainedy using the projector technique (±10 �m) [5] and laser beamnd camera technique (8% or ±2.5 �m) [10]. The standard meanig. 5. Hc and Hfc profiles during filtration of 200 mg l−1 bentonite, CFV of 15 mm s−1,ermeate flux of 75 l m−2 h−1 (average values of five experiments), the average errorars values for stagnant and fluidised cake are 21 and 28%, respectively.
15 mm s−1, flux of 75 l m−2 h−1). A part of hollow fiber membrane is visible as the
of error value of the DO technique was due to the difficulty indistinguishing layers between stagnant and fluidised cakes, whichwere not observed during Hc quantification by other techniques[5,10].
It was found that Rc increased linearly with Hc and the average Rc
value at the end of filtration was obtained as 1.6 (±1.3) × 1012 m−1
(Fig. 6). From the estimated hydraulic resistances, the Rm wasfour times lower than Rc value, thus the resistances was mainlycontrolled by cake properties, such as cake thickness and cake per-meability. It was observed previously that the first layer of thebentonite fouling was thin and incompressible while a more openand compressible structure formed on top during dead-end filtra-tion [10,11].
Most of the observations made during these DO experimentsare consistent with transient modelling studies used to predict thepresence of stagnant and concentrated flows for crossflow microfil-tration [24–26]. The first direct experimental evidence for a flowinglayer of colloidal silica suspensions in a single tubular membranewas observed with nuclear magnetic resonance (NMR), as a non-invasive technique [27].
3.1.2. Particles movement on the membrane surfaceFig. 7 shows the particle velocity distributions measured prior
to filtration (i.e. no filtration) and at different filtration times (15, 60and 135 min) for a given distance from the membrane surface. Theparticle velocity distributions depended on the crossflow channeland also the presence of suction pressure during the filtration.The particle velocities, ranging from 2500 to 6000 �m s−1 at800 �m from the membrane surface, decreased to almost zero asit approached the membrane. In addition, the particle velocitiesdecreased with filtration time at a given distance from the mem-brane surface due to the particle velocity hindrance, which was
was estimated at 6000 �m s−1; this value was much lower than thevolumetric CFV of 15,000 �m s−1. This observation indicated theheterogeneous distribution of fluid velocity within the channel;
Fig. 6. Hc as a function of Rc during 200 mg l−1 bentonite filtration at CFV 15 mm s−1
(average values of five experiments), the average values for Xerror and Yerror bars are22 and 21%, respectively.

Y. Marselina et al. / Journal of Membrane Science 341 (2009) 163–171 167
Fts
tv
e
Table 2Average and standard deviation for the repeatability testa.
Parameters Average Standard error of the mean
TMP (kPa) 40 3.29Hc (�m) 160 14ε 0.14 0.01Mc (kg m−2) 0.92 0.08
ig. 7. Apparent particle velocity profiles during the filtration of 200 mg l−1 (ben-onite concentration, 15 mm s−1 CFV). Distance is measured from the membraneurface.
he velocity at a given region could be higher or lower than theelocity average.
Particle movements near the membrane were observed to gen-rally follow this sequence of motions:
(i) Particles convection towards to the membrane surface.Particles travelling at distance higher than 400 �m from the
membrane/cake layer were observed predominantly to flowparallel to the membrane surface (i.e. bulk flow region). Parti-cles from this region gradually migrated toward the surfacedue to the presence of suction pressure. The movement ofthe particles migration was slightly descended toward the sur-face, having a deviation angle less than 3◦ from the horizontalline.
(ii) Particle migration via rolling along the membrane surface.
The migrated particles reached the membrane surface/cakelayer, creating fluidised cake layer. The range of particles veloc-ity in this layer was 1000–2000 �m s−1. A fraction of particlestravelling in the fluidised layer were observed to roll or movein contact with the membrane surface/cake layer.
Fig. 8. Temporal cake changes during fouling removal (backwash a
˛ (×1012 m kg−1) 1.8 0.34n 0.01 0.01
a All parameters were calculated at the end of filtration, except n.
(iii) Particle capture.The particles rolled on the surface and eventually stopped to
create the stagnant fouling layer.
The DOTM technique has also observed similar phenomena ofparticles rolling to deposit on the surface of flat-sheet membraneand momentary deposition (i.e. a cluster of deposited particlesredispersing back into the bulk) during the filtration [6]. In contrastto the DO technique, the migration of particles with descendingtrajectories could not be observed by using DOTM technique due tothe top-down visualisation onto the flat-sheet membrane.
3.1.3. Specific cake resistanceAt the end of filtration, the average ε value was calcu-
lated as 0.14 ± 0.01. Based on the assumptions of �c value andhomogenous crossflow shear along the membrane, the averageMc and ˛ values were calculated as 0.92 ± 0.08 kg m−2 and 1.8(± 0.34) × 1012 m kg−1, respectively (Table 2). The average n was0.01 ± 0.01, which indicated slightly compressible fouling, validat-ing the assumption used for �c. Therefore, the dominant foulingmechanism was not due to cake compaction during filtration, butwas mainly caused by the increasing of the fouling thickness.
The cake properties values obtained with the DO technique wascompared with the results obtained with the laser beam technique[9]. The Hc obtained in this paper and in the study by Hamachiand Mietton-Peuchot [9] showed comparable values, despite the
differences in operating conditions. The ε values obtained by the DOtechnique were five times higher than the values predicted underCFV of 55 mm s−1, concentration of 250 mg l−1 and constant TMP at110–210 kPa (ε = 0.1) [9]. The calculated ˛ values in this paper werealso higher compared to the values ((1.0–11) × 106 m kg−1) achievednd CFV 15 mm s−1) at cleaning times of 1, 4, 6, 7, 8 and 9 min.

168 Y. Marselina et al. / Journal of Membrane Science 341 (2009) 163–171
FC
dc
3
1iotwfa
otoai6tpTctaetebc
ofLtntp
trdmfwfi
ig. 9. Expanded and fluidised cake profiles during cleaning (200 mg l−1 bentonite,FV of 15 mm s−1 and backwashing).
uring the bentonite ultrafiltration at CFVs of 8–150 mm s−1 andonstant TMPs at 50–150 kPa [18].
.2. Fouling removal
At the end of filtration that led to the fouling formation of80 �m, the fouled membrane was cleaned by applying backwash-ng at the same flux (75 l m−2 h−1) while maintaining the same CFVf 15 mm s−1. In order to characterise the particle movement andhe fouling thickness during cleaning, the changes in cake natureere observed continuously. Fig. 8 shows the temporal changes of
ouling layer morphology during the cleaning periods of 1, 4, 6, 7, 8nd 9 min for one particular experiment.
Fig. 9 shows the fouling thickness profiles during cleaning; it wasbserved that 10 �m of the expanded cake was fluidised throughhe action of the crossflow shear after 2 min of cleaning. The effectf backwashing and crossflow on fouling removal was significantfter 3 min of cleaning, resulting in Hec of 200 �m. Hec graduallyncreased with cleaning time; its values at cleaning time of 4, 5 andmin were 230, 300 and 320 �m, respectively. As the Hec increased,
he fouling structure was observed to become weaker and moreorous compared to the fouling layer at the beginning of cleaning.he upper cake layer of the expanded cake was gradually eroded,reating a fluidised cake. The Hfc was also increased with cleaningime; the Hfc at cleaning times of 2, 4, 5 and 6 min were 10, 30, 40nd 100 �m, respectively. Finally, the porous fouling layer criticallyxpanded to become totally fluidised at 7 min with its height abovehe observation limit (>800 �m). As a result, most of the fouling wasasily removed after 8 min of cleaning through the crossflow andackwashing. The bentonite fouling was easily removed due to lowake compressibility value, which was obtained in Section 3.1.3.
In this study, the backwashed time was extended in order tobserve the total fouling removal. It was observed in Fig. 9 that theouling expansion did not occur during the first 3 min of cleaning.ong periods of backwashing (i.e. longer than 1 min) during filtra-ion are not generally applied during filtration in MBR [28]. Despiteo fouling expansion was observed within short period of time inhis study, frequent backwashing is reported to limit the foulingropensity for long term filtration performances [29].
The DO observations showed that fouling layer was removed andhe reversible fouling fraction was calculated as 81 ± 6% during fiveepeated experiments. This demonstrated that the visible fouling
eposition was categorised as reversible fouling in these experi-ents. The remaining 19% of fouling fraction might consist of aew remaining external deposits and internal fouling/pore blocking,hich could not be visually observed with the microscope. Duringve repeated experiments, the average cleaning time required to
Fig. 10. Mechanisms of fouling removal (→, particle movements and , flowmovements).
remove most of the reversible fouling (Tc) was determined to be10 ± 1 min.
The changes to the fouling layer during cleaning can be charac-terised into two different structures, expanded and fluidised layers(Fig. 10). The cake expansion was characterised when the particlesin the deposited layer moved non-uniformly in an upward motion.The definition of the fluidised layer has been explained previouslyin Section 3.1. Due to the constant crossflow shear, the particlesthat deposited in the upper part of the fouling layer were weaklyattached to the rest of the cake layer during the filtration. When thebackwashing and crossflow shears were applied during cleaning ofthe fouled membrane, the particles in the upper cake layer gradu-ally eroded to form a fluidised layer. The particle–particle bondinginteractions in the expanded layer weakened and the fouling struc-ture appeared to become more porous than the fouling layer at thebeginning of cleaning. At this stage, the expanded cake was erodedto follow the bulk direction. The erosion during fouling removal wasdefined as the continuous removal of individual or small group ofdeposited particles in the presence of crossflow shear.
Fouling removal as aggregate groups has previously beenobserved when a crossflow shear was applied onto the fouledmembrane, which was used to filter yeast suspensions [8]. Yeastcells affected the fouling mechanisms by creating strong interac-tions between foulant–foulant and foulant–membrane. The foulingremoval as aggregate groups was not observed during the cleaningof bentonite fouling layer due to the nature of the feed compo-sitions, possibly because the bentonite particles possess weakerinteractions than microorganisms (i.e. yeast cells).
3.3. Effect of CFV on fouling deposition
The effect of CFV ranging from 4 to 200 mm s−1 (Reynolds num-ber 30-1480) on fouling deposition was studied for its foulingpropensity. In this series of experiments, the membrane was fouledfor 135 min with 200 mg l−1 bentonite and constant permeate fluxof 75 l m−2 h−1. When the CFV was increased from 4 to 100 mm s−1,TMPs at the end of filtration decreased from 59 to 24 kPa (Fig. 11)and the Hc values also reduced from 190 to 60 �m. No visible foul-ing deposition was observed at CFV of 200 mm s−1 but the TMPvalue at the end of filtration reached 15 kPa, indicating the Hc dis-tribution along the fiber (i.e. outside the observation limit) or thepresence of internal fouling. At high CFV (i.e. turbulent region), theDO technique was limited in characterising the fouling thicknessdue to significant membrane movement caused by high crossflow
shear.As expected, TMP and Hc values decreased with the increasingof CFV, indicating less fouling propensity on the membrane sur-face (Fig. 12) [9,18]. TMP and Hc did not reach equilibrium valuesfor CFVs of 4–50 mm s−1. In contrast, the steady-state values for
Y. Marselina et al. / Journal of Membrane Science 341 (2009) 163–171 169
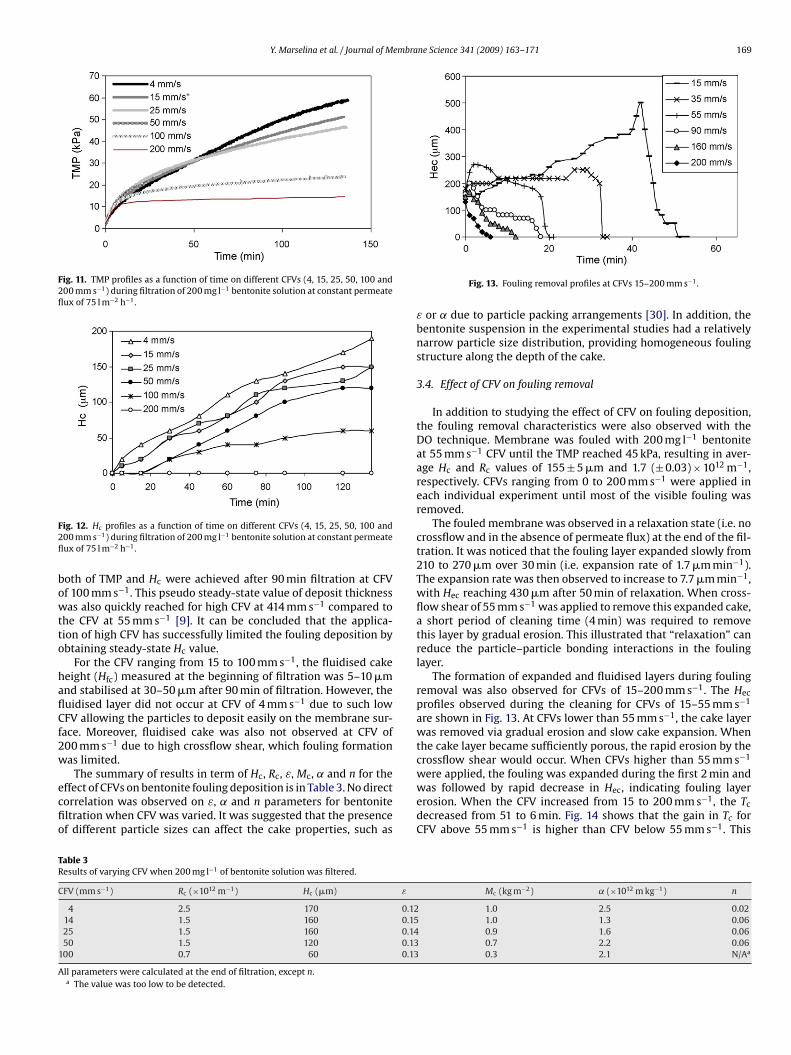
Fig. 11. TMP profiles as a function of time on different CFVs (4, 15, 25, 50, 100 and200 mm s−1) during filtration of 200 mg l−1 bentonite solution at constant permeateflux of 75 l m−2 h−1.
F2fl
bowtto
haflCf2w
ecfio
TR
C
1
A
ig. 12. Hc profiles as a function of time on different CFVs (4, 15, 25, 50, 100 and00 mm s−1) during filtration of 200 mg l−1 bentonite solution at constant permeateux of 75 l m−2 h−1.
oth of TMP and Hc were achieved after 90 min filtration at CFVf 100 mm s−1. This pseudo steady-state value of deposit thicknessas also quickly reached for high CFV at 414 mm s−1 compared to
he CFV at 55 mm s−1 [9]. It can be concluded that the applica-ion of high CFV has successfully limited the fouling deposition bybtaining steady-state Hc value.
For the CFV ranging from 15 to 100 mm s−1, the fluidised cakeeight (Hfc) measured at the beginning of filtration was 5–10 �mnd stabilised at 30–50 �m after 90 min of filtration. However, theuidised layer did not occur at CFV of 4 mm s−1 due to such lowFV allowing the particles to deposit easily on the membrane sur-
ace. Moreover, fluidised cake was also not observed at CFV of00 mm s−1 due to high crossflow shear, which fouling formationas limited.
The summary of results in term of Hc, Rc, ε, Mc, ˛ and n for theffect of CFVs on bentonite fouling deposition is in Table 3. No directorrelation was observed on ε, ˛ and n parameters for bentoniteltration when CFV was varied. It was suggested that the presencef different particle sizes can affect the cake properties, such as
able 3esults of varying CFV when 200 mg l−1 of bentonite solution was filtered.
FV (mm s−1) Rc (×1012 m−1) Hc (�m) ε
4 2.5 170 0.1214 1.5 160 0.1525 1.5 160 0.1450 1.5 120 0.1300 0.7 60 0.13
ll parameters were calculated at the end of filtration, except n.a The value was too low to be detected.
Fig. 13. Fouling removal profiles at CFVs 15–200 mm s−1.
ε or ˛ due to particle packing arrangements [30]. In addition, thebentonite suspension in the experimental studies had a relativelynarrow particle size distribution, providing homogeneous foulingstructure along the depth of the cake.
3.4. Effect of CFV on fouling removal
In addition to studying the effect of CFV on fouling deposition,the fouling removal characteristics were also observed with theDO technique. Membrane was fouled with 200 mg l−1 bentoniteat 55 mm s−1 CFV until the TMP reached 45 kPa, resulting in aver-age Hc and Rc values of 155 ± 5 �m and 1.7 (± 0.03) × 1012 m−1,respectively. CFVs ranging from 0 to 200 mm s−1 were applied ineach individual experiment until most of the visible fouling wasremoved.
The fouled membrane was observed in a relaxation state (i.e. nocrossflow and in the absence of permeate flux) at the end of the fil-tration. It was noticed that the fouling layer expanded slowly from210 to 270 �m over 30 min (i.e. expansion rate of 1.7 �m min−1).The expansion rate was then observed to increase to 7.7 �m min−1,with Hec reaching 430 �m after 50 min of relaxation. When cross-flow shear of 55 mm s−1 was applied to remove this expanded cake,a short period of cleaning time (4 min) was required to removethis layer by gradual erosion. This illustrated that “relaxation” canreduce the particle–particle bonding interactions in the foulinglayer.
The formation of expanded and fluidised layers during foulingremoval was also observed for CFVs of 15–200 mm s−1. The Hec
profiles observed during the cleaning for CFVs of 15–55 mm s−1
are shown in Fig. 13. At CFVs lower than 55 mm s−1, the cake layerwas removed via gradual erosion and slow cake expansion. Whenthe cake layer became sufficiently porous, the rapid erosion by thecrossflow shear would occur. When CFVs higher than 55 mm s−1
were applied, the fouling was expanded during the first 2 min andwas followed by rapid decrease in Hec, indicating fouling layererosion. When the CFV increased from 15 to 200 mm s−1, the Tc
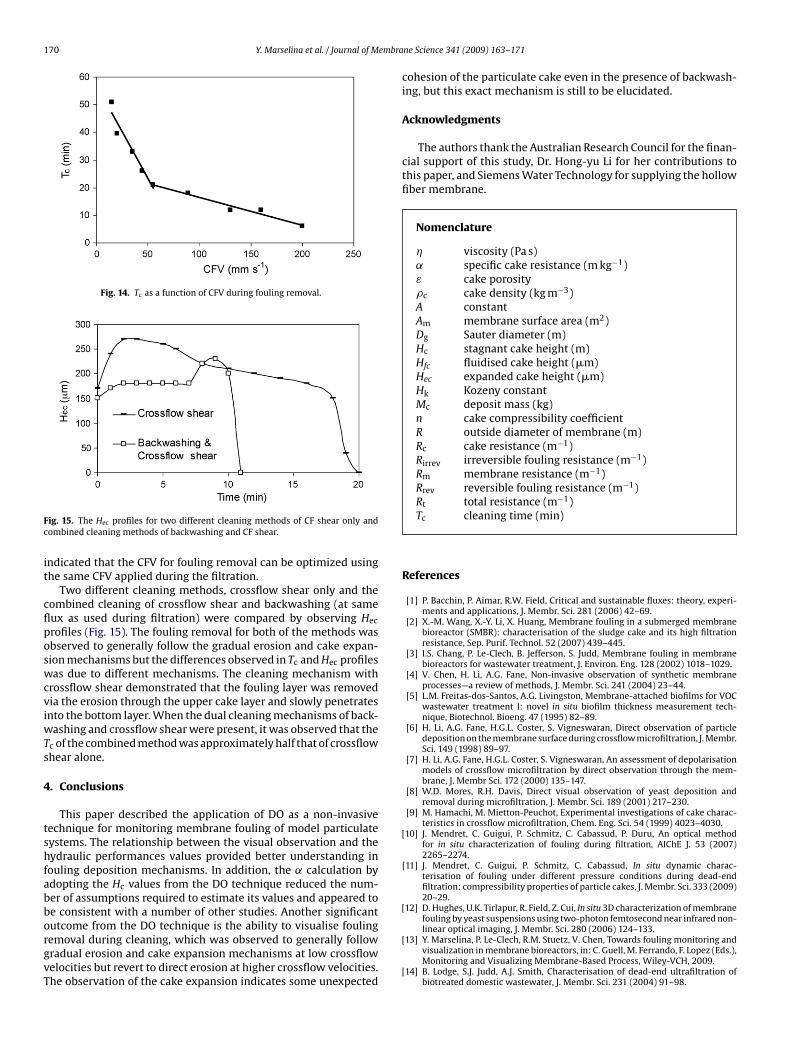
decreased from 51 to 6 min. Fig. 14 shows that the gain in Tc forCFV above 55 mm s−1 is higher than CFV below 55 mm s−1. This
Mc (kg m−2) ˛ (×1012 m kg−1) n
1.0 2.5 0.021.0 1.3 0.060.9 1.6 0.060.7 2.2 0.060.3 2.1 N/Aa
170 Y. Marselina et al. / Journal of Membra
Fig. 14. Tc as a function of CFV during fouling removal.
Fc
it
cflposwcviwTs
4
tshfabborgvT
[
ig. 15. The Hec profiles for two different cleaning methods of CF shear only andombined cleaning methods of backwashing and CF shear.
ndicated that the CFV for fouling removal can be optimized usinghe same CFV applied during the filtration.
Two different cleaning methods, crossflow shear only and theombined cleaning of crossflow shear and backwashing (at sameux as used during filtration) were compared by observing Hec
rofiles (Fig. 15). The fouling removal for both of the methods wasbserved to generally follow the gradual erosion and cake expan-ion mechanisms but the differences observed in Tc and Hec profilesas due to different mechanisms. The cleaning mechanism with
rossflow shear demonstrated that the fouling layer was removedia the erosion through the upper cake layer and slowly penetratesnto the bottom layer. When the dual cleaning mechanisms of back-
ashing and crossflow shear were present, it was observed that thec of the combined method was approximately half that of crossflowhear alone.
. Conclusions
This paper described the application of DO as a non-invasiveechnique for monitoring membrane fouling of model particulateystems. The relationship between the visual observation and theydraulic performances values provided better understanding inouling deposition mechanisms. In addition, the ˛ calculation bydopting the Hc values from the DO technique reduced the num-er of assumptions required to estimate its values and appeared toe consistent with a number of other studies. Another significant
utcome from the DO technique is the ability to visualise foulingemoval during cleaning, which was observed to generally followradual erosion and cake expansion mechanisms at low crossflowelocities but revert to direct erosion at higher crossflow velocities.he observation of the cake expansion indicates some unexpectedne Science 341 (2009) 163–171
cohesion of the particulate cake even in the presence of backwash-ing, but this exact mechanism is still to be elucidated.
Acknowledgments
The authors thank the Australian Research Council for the finan-cial support of this study, Dr. Hong-yu Li for her contributions tothis paper, and Siemens Water Technology for supplying the hollowfiber membrane.
Nomenclature
� viscosity (Pa s)˛ specific cake resistance (m kg−1)ε cake porosity�c cake density (kg m−3)A constantAm membrane surface area (m2)Dg Sauter diameter (m)Hc stagnant cake height (m)Hfc fluidised cake height (�m)Hec expanded cake height (�m)Hk Kozeny constantMc deposit mass (kg)n cake compressibility coefficientR outside diameter of membrane (m)Rc cake resistance (m−1)Rirrev irreversible fouling resistance (m−1)Rm membrane resistance (m−1)Rrev reversible fouling resistance (m−1)Rt total resistance (m−1)Tc cleaning time (min)
References
[1] P. Bacchin, P. Aimar, R.W. Field, Critical and sustainable fluxes: theory, experi-ments and applications, J. Membr. Sci. 281 (2006) 42–69.
[2] X.-M. Wang, X.-Y. Li, X. Huang, Membrane fouling in a submerged membranebioreactor (SMBR): characterisation of the sludge cake and its high filtrationresistance, Sep. Purif. Technol. 52 (2007) 439–445.
[3] I.S. Chang, P. Le-Clech, B. Jefferson, S. Judd, Membrane fouling in membranebioreactors for wastewater treatment, J. Environ. Eng. 128 (2002) 1018–1029.
[4] V. Chen, H. Li, A.G. Fane, Non-invasive observation of synthetic membraneprocesses—a review of methods, J. Membr. Sci. 241 (2004) 23–44.
[5] L.M. Freitas-dos-Santos, A.G. Livingston, Membrane-attached biofilms for VOCwastewater treatment I: novel in situ biofilm thickness measurement tech-nique, Biotechnol. Bioeng. 47 (1995) 82–89.
[6] H. Li, A.G. Fane, H.G.L. Coster, S. Vigneswaran, Direct observation of particledeposition on the membrane surface during crossflow microfiltration, J. Membr.Sci. 149 (1998) 89–97.
[7] H. Li, A.G. Fane, H.G.L. Coster, S. Vigneswaran, An assessment of depolarisationmodels of crossflow microfiltration by direct observation through the mem-brane, J. Membr Sci. 172 (2000) 135–147.
[8] W.D. Mores, R.H. Davis, Direct visual observation of yeast deposition andremoval during microfiltration, J. Membr. Sci. 189 (2001) 217–230.
[9] M. Hamachi, M. Mietton-Peuchot, Experimental investigations of cake charac-teristics in crossflow microfiltration, Chem. Eng. Sci. 54 (1999) 4023–4030.
[10] J. Mendret, C. Guigui, P. Schmitz, C. Cabassud, P. Duru, An optical methodfor in situ characterization of fouling during filtration, AIChE J. 53 (2007)2265–2274.
[11] J. Mendret, C. Guigui, P. Schmitz, C. Cabassud, In situ dynamic charac-terisation of fouling under different pressure conditions during dead-endfiltration: compressibility properties of particle cakes, J. Membr. Sci. 333 (2009)20–29.
12] D. Hughes, U.K. Tirlapur, R. Field, Z. Cui, In situ 3D characterization of membranefouling by yeast suspensions using two-photon femtosecond near infrared non-
linear optical imaging, J. Membr. Sci. 280 (2006) 124–133.[13] Y. Marselina, P. Le-Clech, R.M. Stuetz, V. Chen, Towards fouling monitoring andvisualization in membrane bioreactors, in: C. Guell, M. Ferrando, F. Lopez (Eds.),Monitoring and Visualizing Membrane-Based Process, Wiley-VCH, 2009.
[14] B. Lodge, S.J. Judd, A.J. Smith, Characterisation of dead-end ultrafiltration ofbiotreated domestic wastewater, J. Membr. Sci. 231 (2004) 91–98.

embra
[
[
[
[
[
[
[
[
[
[
[
[
[
[
Y. Marselina et al. / Journal of M
15] Y. Ye, P. Le-Clech, V. Chen, A.G. Fane, B. Jefferson, Fouling mechanisms of alginatesolutions as model extracellular polymeric substances, Desalination 175 (2005)7–20.
16] G. Foley, A review of factors affecting filter cake properties in dead-end micro-filtration of microbial suspensions, J. Membr. Sci. 274 (2006) 38–46.
17] D. Jiao, M.M. Sharma, Mechanism of cake buildup in crossflow filtration ofcolloidal suspensions, J. Colloid Interf. Sci. 162 (1994) 454–462.
18] C. Gourgues, P. Aimar, V. Sanchez, Ultrafiltration of bentonite suspensions withhollow fiber membranes, J. Membr. Sci. 74 (1992) 51–69.
19] Y. Marselina, P. Le-Clech, R. Stuetz, V. Chen, Detailed characterisation of foul-ing deposition and removal on a hollow fibre membrane by direct observationtechnique, Desalination 231 (2008) 3–11.
20] T. Murase, T. Ohn, K. Kimata, Filtrate flux in crossflow microfiltration of dilutesuspension forming a highly compressible fouling cake-layer, J. Membr. Sci. 108
(1995) 121–128.21] G. Montes-H, Y. Geraud, J. Duplay, T. Reuschle, ESEM observations of com-pacted bentonite submitted to hydration/dehydration conditions, Colloids Surf.A: Physicochem. Eng. Aspects 262 (2005) 14–22.
22] P. Le-Clech, Y. Marselina, R. Stuetz, V. Chen, Fouling visualisation of solublemicrobial product models in MBRs, Desalination 199 (2006) 477–479.
[
[
ne Science 341 (2009) 163–171 171
23] P. Le-Clech, Y. Marselina, Y. Ye, R.M. Stuetz, V. Chen, Visualisation of polysac-charide fouling on microporous membrane using different characterisationtechniques, J. Membr. Sci. 290 (2007) 36–45.
24] C.A. Romero, R.H. Davis, Global model of crossflow microfiltration based onhydrodynamic particle diffusion, J. Membr. Sci. 39 (1988) 157–185.
25] C.A. Romero, R.H. Davis, Transient model of crossflow microfiltration, Chem.Eng. Sci. 45 (1990) 13–25.
26] V. Chen, A.G. Fane, S. Madaeni, I.G. Wenten, Particle deposition during mem-brane filtration of colloids: transition between concentration polarization andcake formation, J. Membr. Sci. 125 (1997) 109–122.
27] D. Airey, S. Yao, J. Wu, V. Chen, A.G. Fane, J.M. Pope, An investigation of con-centration polarization phenomena in membrane filtration of colloidal silicasuspensions by NMR micro-imaging, J. Membr. Sci. 145 (1998) 145–158.
28] P. Le-Clech, V. Chen, T.A.G. Fane, Fouling in membrane bioreactors used in
wastewater treatment, J. Membr. Sci. 284 (2006) 17–53.29] J. Wu, P. Le-Clech, R.M. Stuetz, A.G. Fane, V. Chen, Effects of relaxation andbackwashing conditions on fouling in membrane bioreactor, J. Membr. Sci. 324(2008) 26–32.
30] M.R. Mackley, N.E. Sherman, Cross-flow cake filtration mechanisms and kinet-ics, Chem. Eng. Sci. 47 (1992) 3067–3084.
Copyright © 2022 FDOKUMEN