Modeling of Fouling and Fouling Attachments as a Function of the Zeta Potential of Heterogeneous...
12
Modeling of Fouling and Fouling Attachments as a Function of the Zeta Potential of Heterogeneous Membrane Surfaces in Ultrafiltration of Latex Solution Amira Abdelrasoul,* Huu Doan, Ali Lohi, and Chil-Hung Cheng Department of Chemical Engineering, Ryerson University, 350 Victoria Street, Toronto, Ontario M5B 2K3, Canada * S Supporting Information ABSTRACT: The aim of the present study was to develop a fouling attachment model applicable for both hydrophilic and hydrophobic nonuniform pore size membranes. The predictive models found in the present study allow for an accurate estimation of the depositional and coagulation attachments, at a given operating condition and membrane surface charges. The effect of the zeta potential of the membrane surface on the fouling attachments, the total mass of fouling, the permeate flux, and the specific power consumption in ultrafiltration of a latex solution was also investigated. Polysulfone flat membrane with a MWCO of 60 000 at different surface charges was used under a constant flow rate and cross-flow mode in ultrafiltration of the latex paint solution. Response Surface Methodology (RSM) was implemented throughout the experimental design. Furthermore, hydrophilic ultrafilic and cellulose acetate membranes at different zeta potentials, as well as hydrophobic PVDF membranes, were used to test the reliability and accuracy of the predictive models. The fouling model and the correlations found in the present study form a comprehensive set of predictive models that allow for the estimation of the mass of fouling and the increase in transmembrane pressure, applied to both hydrophilic and hydrophobic membranes of a variety of materials with different molecular weight cutoff (MWCO) values. 1. INTRODUCTION Pointing at the source of foulant attachment to the membrane’s surface is critical when it comes to the research of membrane fouling and its potential practical implementation. There exist two major forces contributing to foulant attachment, specifically: the dispersion interaction force and the polar interaction force. 1 Previous research suggests that foulants that stay attached to the membrane surfaces are most likely caused by the balance of the van der Waals attraction force and the electrostatic repulsion force between particles and the membrane’s surface, due to the surface charge. A model hypothesized by Van Oss introduced the concepts of apolar and polar interactions so as to categorize and predict the possible interactions in the aqueous medium. Van Oss based his proposal of apolar and polar interactions in aqueous medium on the Derjaguin, Landau, Verwey, and Overbeek (DLVO) theory. 2 These interactions elucidate the advantage of hydro- philizing the membrane’s surface as an effective fouling remediation technique and allowing for a lesser membrane fouling propensity. In order to increase the antifouling properties of the hydrophobic membranes, several methods have been implemented, such as surface coating or surface grafting to increase the membrane hydrophilicity and modification of the membrane surface charge. 3−5 Moreover, the ionic strength of the feed solution was found to significantly alter the surface properties and interactions of the colloidal foulants, which, as a consequence, affected the fouling potential. 6−10 The experimental observation of filtration processes, however, may not be sufficient for a comprehensive understanding of the fouling potential of the latex solution. The relationship between the solution’s ionic strength and the zeta potential of the membrane’s surface is necessary for the elucidation of the underlying factors affecting membrane fouling and fouling attachments through the particle-to-particle and particle-to-membrane attachments. As part of this area of research, a variety of empirical and semiempirical models were developed and reported, with two models standing out as the most popular ones: the resistance- in-series model and the concentration polarization model. 11−13 In addition, the permeate flux decline models for the cross-flow ultrafiltration of nonrecycled and recycled systems have also been developed. 14 However, these models are system-specific and are generally inadequate to provide a complete assessment of the effects of the membrane’s physical properties on membrane fouling. As a consequence, these models are insufficient in terms of providing accurate process general- ization and scale-up. Furthermore, in these models the effects of fouling attachments necessary for a thorough grasp on the mechanisms involved in this phenomenon have not been considered. In most of the studies which applied these models, the monodispersed suspensions were used for the validation purposes. Arguably, this imposes a practical limitation on the extent to which the research results can be applied to real-life cases involving wastewaters and, specifically, wastewaters where the suspended solids have a wide range of particle size distribution. In the previously conducted study a mathematical model was developed using a homogeneous membrane with a uniform pore size 15 for the ultrafiltration of latex paint solution with a Received: March 26, 2014 Revised: May 20, 2014 Accepted: May 22, 2014 Published: June 3, 2014 Article pubs.acs.org/IECR © 2014 American Chemical Society 9897 dx.doi.org/10.1021/ie501239h | Ind. Eng. Chem. Res. 2014, 53, 9897−9908
Transcript of Modeling of Fouling and Fouling Attachments as a Function of the Zeta Potential of Heterogeneous...

Modeling of Fouling and Fouling Attachments as a Function of theZeta Potential of Heterogeneous Membrane Surfaces inUltrafiltration of Latex SolutionAmira Abdelrasoul,* Huu Doan, Ali Lohi, and Chil-Hung Cheng
Department of Chemical Engineering, Ryerson University, 350 Victoria Street, Toronto, Ontario M5B 2K3, Canada
*S Supporting Information
ABSTRACT: The aim of the present study was to develop a fouling attachment model applicable for both hydrophilic andhydrophobic nonuniform pore size membranes. The predictive models found in the present study allow for an accurateestimation of the depositional and coagulation attachments, at a given operating condition and membrane surface charges. Theeffect of the zeta potential of the membrane surface on the fouling attachments, the total mass of fouling, the permeate flux, andthe specific power consumption in ultrafiltration of a latex solution was also investigated. Polysulfone flat membrane with aMWCO of 60 000 at different surface charges was used under a constant flow rate and cross-flow mode in ultrafiltration of thelatex paint solution. Response Surface Methodology (RSM) was implemented throughout the experimental design. Furthermore,hydrophilic ultrafilic and cellulose acetate membranes at different zeta potentials, as well as hydrophobic PVDF membranes, wereused to test the reliability and accuracy of the predictive models. The fouling model and the correlations found in the presentstudy form a comprehensive set of predictive models that allow for the estimation of the mass of fouling and the increase intransmembrane pressure, applied to both hydrophilic and hydrophobic membranes of a variety of materials with differentmolecular weight cutoff (MWCO) values.
1. INTRODUCTIONPointing at the source of foulant attachment to the membrane’ssurface is critical when it comes to the research of membranefouling and its potential practical implementation. There existtwo major forces contributing to foulant attachment,specifically: the dispersion interaction force and the polarinteraction force.1 Previous research suggests that foulants thatstay attached to the membrane surfaces are most likely causedby the balance of the van der Waals attraction force and theelectrostatic repulsion force between particles and themembrane’s surface, due to the surface charge. A modelhypothesized by Van Oss introduced the concepts of apolar andpolar interactions so as to categorize and predict the possibleinteractions in the aqueous medium. Van Oss based hisproposal of apolar and polar interactions in aqueous mediumon the Derjaguin, Landau, Verwey, and Overbeek (DLVO)theory.2 These interactions elucidate the advantage of hydro-philizing the membrane’s surface as an effective foulingremediation technique and allowing for a lesser membranefouling propensity. In order to increase the antifoulingproperties of the hydrophobic membranes, several methodshave been implemented, such as surface coating or surfacegrafting to increase the membrane hydrophilicity andmodification of the membrane surface charge.3−5 Moreover,the ionic strength of the feed solution was found to significantlyalter the surface properties and interactions of the colloidalfoulants, which, as a consequence, affected the foulingpotential.6−10 The experimental observation of filtrationprocesses, however, may not be sufficient for a comprehensiveunderstanding of the fouling potential of the latex solution. Therelationship between the solution’s ionic strength and the zetapotential of the membrane’s surface is necessary for the
elucidation of the underlying factors affecting membranefouling and fouling attachments through the particle-to-particleand particle-to-membrane attachments.As part of this area of research, a variety of empirical and
semiempirical models were developed and reported, with twomodels standing out as the most popular ones: the resistance-in-series model and the concentration polarization model.11−13
In addition, the permeate flux decline models for the cross-flowultrafiltration of nonrecycled and recycled systems have alsobeen developed.14 However, these models are system-specificand are generally inadequate to provide a complete assessmentof the effects of the membrane’s physical properties onmembrane fouling. As a consequence, these models areinsufficient in terms of providing accurate process general-ization and scale-up. Furthermore, in these models the effects offouling attachments necessary for a thorough grasp on themechanisms involved in this phenomenon have not beenconsidered. In most of the studies which applied these models,the monodispersed suspensions were used for the validationpurposes. Arguably, this imposes a practical limitation on theextent to which the research results can be applied to real-lifecases involving wastewaters and, specifically, wastewaters wherethe suspended solids have a wide range of particle sizedistribution.In the previously conducted study a mathematical model was
developed using a homogeneous membrane with a uniformpore size15 for the ultrafiltration of latex paint solution with a
Received: March 26, 2014Revised: May 20, 2014Accepted: May 22, 2014Published: June 3, 2014
Article
pubs.acs.org/IECR
© 2014 American Chemical Society 9897 dx.doi.org/10.1021/ie501239h | Ind. Eng. Chem. Res. 2014, 53, 9897−9908

wide range of particle size distribution. This mathematicalmodel accounts for the existing chemical attachments in themembrane fouling and incorporates the coupled effects of thechemical and physical factors in membrane fouling, allowing fora comprehensive understanding of the fouling phenomenonand its potential functions. The mathematical model wascapable of accurately predicting the increase in the trans-membrane pressure and the mass of the fouling retained by themembrane. As was demonstrated in our recent study,16,17 thefouling attachment probabilities are dependent on the proper-ties of foulants and membranes, operating conditions, andsolution chemistry. In addition, a mathematical model thatcould be applied to heterogeneous membranes with nonuni-form pore size was also developed.18 Predictive models for anaccurate estimation of fouling attachments at a given operatingcondition were recently developed and validated using differenttypes of heterogeneous membranes, with a variety of MWCOvalues, as illustrated in our previous publication.19 Nevertheless,a higher level of uncertainty was observed between the mass offouling and the increase in the transmembrane pressurepredicted using the estimated fouling attachment and theexperimental values in the case of PVDF hydrophobicmembranes. The errors were attributed to the depositionalattachment model, which was obtained based on theexperimental data of hydrophilic polysulfone membrane witha fixed value of zeta potential of −42.40 mV. Thus, according tothis model, the estimated depositional attachment values canonly be used for hydrophilic membranes with high negativecharges. This indicates that the zeta potential of the membranesurface must be considered to be the predominant factor inultrafiltation membrane fouling. As a result, it was crucial tointroduce the surface charge as zeta potential (ζ) of themembrane surface into our predictive model so as to begeneralized for both hydrophilic and hydrophobic membranes.Owing to this, fouling remediation techniques can be developedand applied by manipulating these attachments to reduce themembrane fouling and power consumption.The objectives of this study are to obtain predictive models
that would allow for accurate estimation of the foulingattachments, at a given operating condition, as well as at aspecified surface charge of the membrane surface. The foulingattachment models, generalized for hydrophobic and hydro-philic membranes, will be used in turn in the mechanisticfouling model applicable for nonuniform pore size membranes,in order to estimate the mass of the fouling and the increase intransmembrane pressure for the model validations. The effectsof the zeta potential of membrane surface on foulingattachments, the total mass of fouling, permeate flux, andspecific power consumption in ultrafiltration of the latexsolution are also investigated. For the purposes of this study,hydrophilic and hydrophobic membranes of different materialsand various MWCO will be used to test the reliability andaccuracy of the correlations for applications with nonuniformpore size membranes.
2. ATTACHMENT MATHEMATICAL MODELAs noted above, a mechanistic model was developed for thedeposition of the nonuniform latex particles on heterogeneous,nonuniform pore size membranes.18 In this model the foulingwas considered primarily with respect to the attachmentsamong foulant entities (coagulation attachment) and withrespect to the attachments between foulant and the membranesurface (depositional attachment). This mechanistic model was
based on the fouling potential mechanisms of different particlesizes getting attached to membrane with nonuniform pore sizes.The primary factors in determining the occurrence ofmembrane fouling (cake layer formation or pore blocking)and adsorptive internal plugging (pore constriction) weredifferent sizes of latex particles and membrane pores. Aheterogeneous membrane had the pore size distribution of (N)nonuniform pore sizes. The range of all potential attachmentsfor every particle size was accordingly applied with the aid ofthe mathematical model for every available pore size of (i).Eventually, the average percentage (xi) of each pore size (i),estimated by ImageJ software, was used in the model’scalculations. In order to examine the validity and reliability ofthe model, the monodisperse particles with sizes of 50 and 100nm and the simulated latex effluent were used. According tothese mathematical expressions the mass of the particlescontributing to pore blocking can be calculated using eq 1,while the mass of the particles accountable for the cake layercan be estimated using eq 2. Notably, these equations arefunctions of the membrane’s physical properties, feedconcentration, particle’s projected area, attachment foulingprobabilities, and cumulative filtration volume per unit area.The sum of mp and mc stands for the total mass of foulingretained by the membrane (mt).
∑
∑
∑
α εσ
σ
σ α
π α
τ
π α
τσ α
α εσ
σ
= − −
+
− + −
+ − −
αα
=
=
=
⎪
⎪
⎪
⎪
⎪
⎪
⎪
⎪
⎧⎨⎩⎫⎬⎭
⎧⎨⎩
⎧⎨⎩
⎡⎣⎢⎢
⎛⎝⎜
⎞⎠⎟⎤⎦⎥⎥⎫⎬⎭
⎫⎬⎭
⎧⎨⎩⎫⎬⎭
m x C V
xN
B
D L B
D L B B
NC V
x C V
4[1 exp( 4 )]
ln 1 exp
[1 exp( )]
i
N
i
i
N
ii
i
i i
i
N
i f S
p1
pm s
LL f S
1
m
XS pm
m m pm
m m pm XS pm
mf S
1
pm S
SS
i
i
pppp
(1)
∑
∑
∑
αα ε
σσ
σ α
π α
τ
π α
τσ α
α εσ
σ
= − − −
+
− + −
+ − −
αα
=
=
=
⎪⎪
⎪⎪
⎪
⎪
⎪
⎪
⎪
⎪
⎪
⎪
⎧⎨⎩
⎧⎨⎩⎫⎬⎭
⎧⎨⎩
⎧⎨⎩
⎡⎣⎢⎢
⎛⎝⎜
⎞⎠⎟⎤⎦⎥⎥⎫⎬⎭
⎫⎬⎭
⎧⎨⎩⎫⎬⎭
⎫⎬⎭
m C V x C V
xN
B
D L B
D L B B
NC V
x C V
4[1 exp( 4 )]
ln 1 exp s
[1 exp( )]
i
N
i
i
N
ii
i
i i
i
N
i
c pp f s1
pm s
LL f s
1
m
xs pm
m m pm
m m pm xs pm
mf
1
pm s
ss f s
i
i
pppp
(2)
where mp [kg/m2] is the total mass of particles attached tomembrane pores per unit membrane surface area, mc [kg/m
2] isthe total mass of particles in the cake layer per unit membranesurface area, xi is the average percentage of the pore of size i, Nis the number of the nonuniform pore sizes determined in thepore size distribution of the heterogeneous membranes, αpp[dimensionless] is the coagulation attachment probabilitywhich represents the particle-to-particle attachment, αpm[dimensionless] is the depositional attachment which repre-sents the particle-to-membrane attachment, εs [dimensionless]
Industrial & Engineering Chemistry Research Article
dx.doi.org/10.1021/ie501239h | Ind. Eng. Chem. Res. 2014, 53, 9897−99089898
is the membrane surface porosity, a [m] is the particle radius,Dmi
[m] is the membrane pore diameter of size i, Bi [m−2] is the
mass transfer coefficient, σL[m2/kg] is the projected area of a
unit mass of the large particles on membrane surface, σs [m2/
kg] is the projected area of a unit mass of the small particles onthe membrane surface, and σxs [m
2/kg] is the projected area ofa unit mass of the very small particles on the membrane surface.Further details about the classification of the particle sizes weredescribed in Section 2 in our previous study.18 Nm is thenumber density of membrane pores per unit membrane surfacearea, Lm [m] is the length of a membrane pore, τ is tortuosity ofthe membrane porous structure,18 Cf [kg/m3] is the massconcentration of particles in the feed, and Vs [m
3/m2] is thecumulative volume of the permeate normalized to membranesurface area. The mean average of particle size was used for theprojected area calculations for each size range. In addition, theincrease in the transmembrane membrane pressure during afiltration process normalized to that of clean membrane can becalculated using eq 3 below:
∑ ∑ ∑
σ σ
α
′ = +− ∑
+− ∑
+−
+̂
− − −
ρ
= =
∑
= = =
=⎛⎝⎜
⎞⎠⎟
Px m x m
RR
C V
x m x m x m
11
11
1
1
1
[
( )]
iN
i iN
i
x m
L
i
N
ii
N
ii
N
i
L 1 pL S 1 pS
2c
mpp f s
1pL
1pS
1w
i i
iN
i i
i i i
1 w
m
(3)
where mpLi [kg/m2] is the mass of the particles larger than the
pore of size i contributing to the pore blocking, mwi[kg/m2] is
the mass of particles attached to the pore wall of size i, and mpSi
[kg/m2] is the mass of the small particles contributing to theblocking of the pores of size i. Lastly, Rm [m−1] is themembrane’s resistance while R̂c [m/kg] is the resistance due tothe cake layer. As outlined in the previous study,15 eqs 1 and 2are solved for αpp and αpm using mp and mc values measuredexperimentally. The fouling attachment model to predict thetotal mass of fouling and the increase of transmembrane is validfor any period of ultrafiltration time. The experimental designused in the present study provided sufficient data to obtain therequired correlations for an accurate prediction of theattachment fouling probabilities using heterogeneous mem-branes at a given operating condition and is discussed explicitlyin Sections 4.3 and 5.3. The mathematical model and thesecorrelations form an entire set of predictive models for thenonuniform pore size membranes.
3. SPECIFIC POWER CONSUMPTION
During the filtration process, the resistance to the permeateflow can be increased due to the pore blockage and the cakelayer formation, resulting in the membrane fouling. Hence, thepermeate flux noticeably declines with filtration time. A higherpermeate flux can be attained by augmenting the trans-membrane pressure, which in turn causes a higher energyconsumption. The specific power consumption per unit volumeof filtrate is defined as
= × ×−
⎡⎣⎢
⎤⎦⎥
QV
Specific power consumptionkWhm
1.916 10TMP
3
6 AVG
s (4)
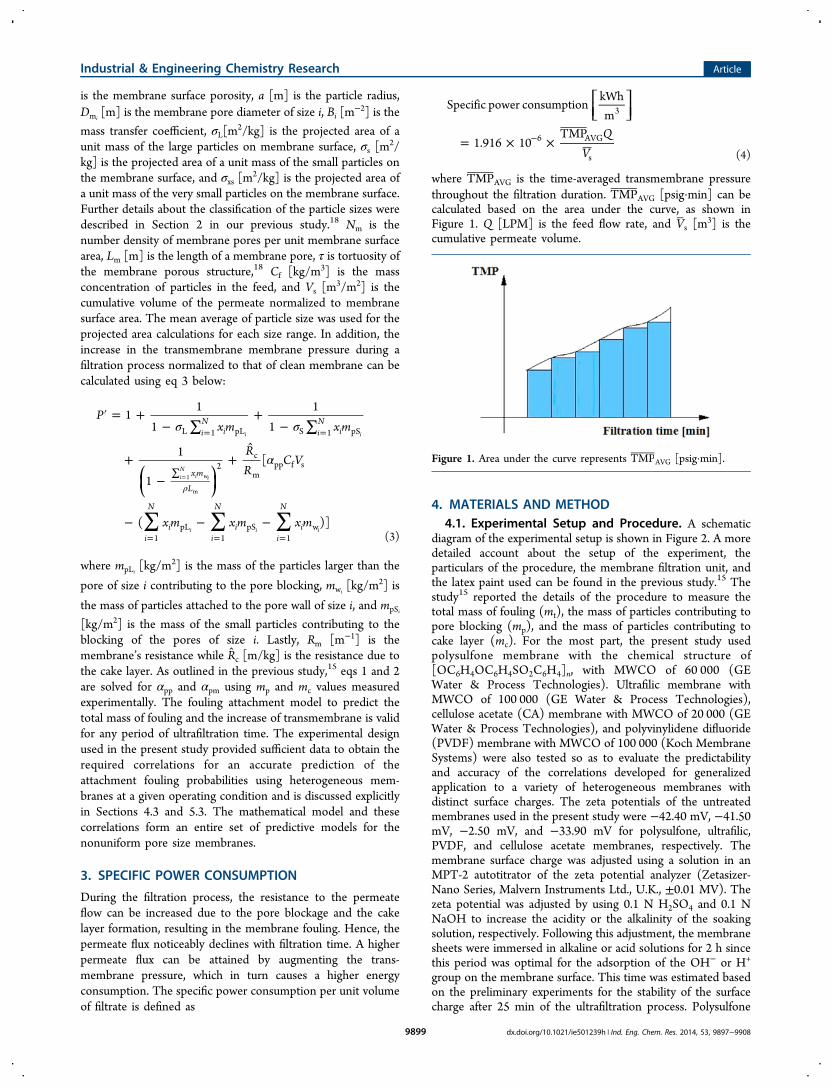
where TMPAVG is the time-averaged transmembrane pressurethroughout the filtration duration. TMPAVG [psig·min] can becalculated based on the area under the curve, as shown inFigure 1. Q [LPM] is the feed flow rate, and V̅s [m
3] is thecumulative permeate volume.
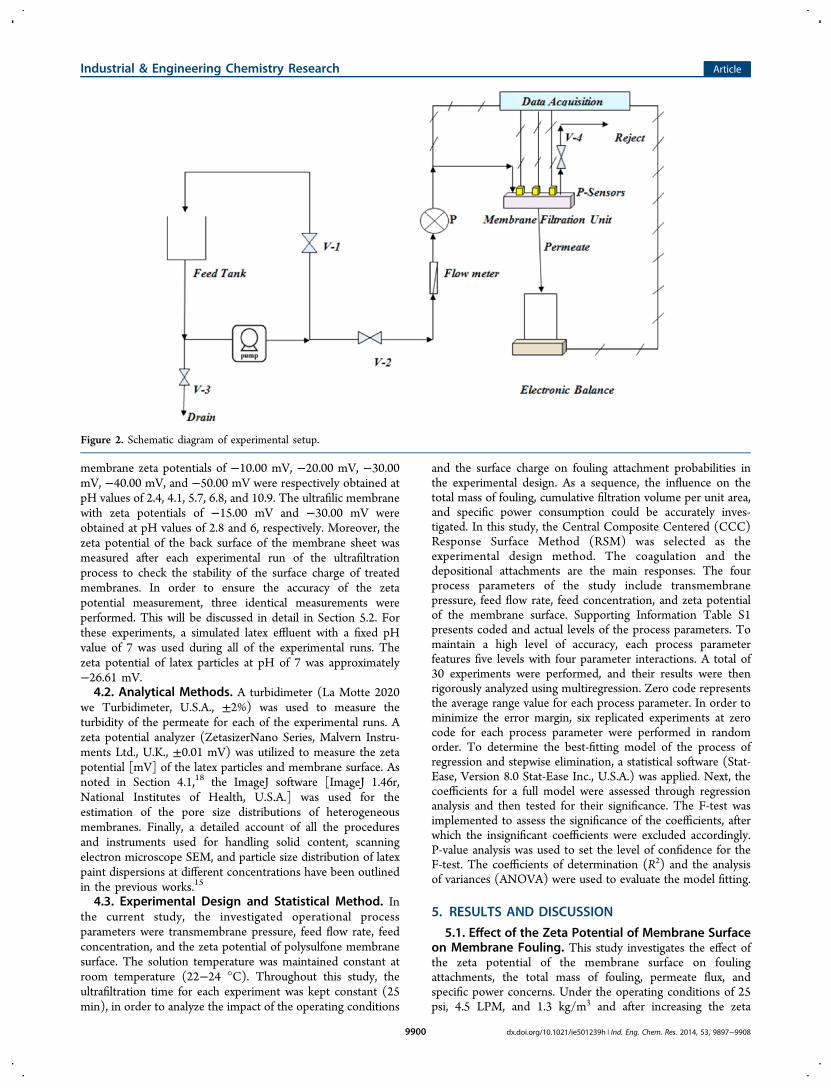
4. MATERIALS AND METHOD4.1. Experimental Setup and Procedure. A schematic
diagram of the experimental setup is shown in Figure 2. A moredetailed account about the setup of the experiment, theparticulars of the procedure, the membrane filtration unit, andthe latex paint used can be found in the previous study.15 Thestudy15 reported the details of the procedure to measure thetotal mass of fouling (mt), the mass of particles contributing topore blocking (mp), and the mass of particles contributing tocake layer (mc). For the most part, the present study usedpolysulfone membrane with the chemical structure of[OC6H4OC6H4SO2C6H4]n, with MWCO of 60 000 (GEWater & Process Technologies). Ultrafilic membrane withMWCO of 100 000 (GE Water & Process Technologies),cellulose acetate (CA) membrane with MWCO of 20 000 (GEWater & Process Technologies), and polyvinylidene difluoride(PVDF) membrane with MWCO of 100 000 (Koch MembraneSystems) were also tested so as to evaluate the predictabilityand accuracy of the correlations developed for generalizedapplication to a variety of heterogeneous membranes withdistinct surface charges. The zeta potentials of the untreatedmembranes used in the present study were −42.40 mV, −41.50mV, −2.50 mV, and −33.90 mV for polysulfone, ultrafilic,PVDF, and cellulose acetate membranes, respectively. Themembrane surface charge was adjusted using a solution in anMPT-2 autotitrator of the zeta potential analyzer (Zetasizer-Nano Series, Malvern Instruments Ltd., U.K., ±0.01 MV). Thezeta potential was adjusted by using 0.1 N H2SO4 and 0.1 NNaOH to increase the acidity or the alkalinity of the soakingsolution, respectively. Following this adjustment, the membranesheets were immersed in alkaline or acid solutions for 2 h sincethis period was optimal for the adsorption of the OH− or H+
group on the membrane surface. This time was estimated basedon the preliminary experiments for the stability of the surfacecharge after 25 min of the ultrafiltration process. Polysulfone
Figure 1. Area under the curve represents TMPAVG [psig·min].
Industrial & Engineering Chemistry Research Article
dx.doi.org/10.1021/ie501239h | Ind. Eng. Chem. Res. 2014, 53, 9897−99089899
membrane zeta potentials of −10.00 mV, −20.00 mV, −30.00mV, −40.00 mV, and −50.00 mV were respectively obtained atpH values of 2.4, 4.1, 5.7, 6.8, and 10.9. The ultrafilic membranewith zeta potentials of −15.00 mV and −30.00 mV wereobtained at pH values of 2.8 and 6, respectively. Moreover, thezeta potential of the back surface of the membrane sheet wasmeasured after each experimental run of the ultrafiltrationprocess to check the stability of the surface charge of treatedmembranes. In order to ensure the accuracy of the zetapotential measurement, three identical measurements wereperformed. This will be discussed in detail in Section 5.2. Forthese experiments, a simulated latex effluent with a fixed pHvalue of 7 was used during all of the experimental runs. Thezeta potential of latex particles at pH of 7 was approximately−26.61 mV.4.2. Analytical Methods. A turbidimeter (La Motte 2020
we Turbidimeter, U.S.A., ±2%) was used to measure theturbidity of the permeate for each of the experimental runs. Azeta potential analyzer (ZetasizerNano Series, Malvern Instru-ments Ltd., U.K., ±0.01 mV) was utilized to measure the zetapotential [mV] of the latex particles and membrane surface. Asnoted in Section 4.1,18 the ImageJ software [ImageJ 1.46r,National Institutes of Health, U.S.A.] was used for theestimation of the pore size distributions of heterogeneousmembranes. Finally, a detailed account of all the proceduresand instruments used for handling solid content, scanningelectron microscope SEM, and particle size distribution of latexpaint dispersions at different concentrations have been outlinedin the previous works.15
4.3. Experimental Design and Statistical Method. Inthe current study, the investigated operational processparameters were transmembrane pressure, feed flow rate, feedconcentration, and the zeta potential of polysulfone membranesurface. The solution temperature was maintained constant atroom temperature (22−24 °C). Throughout this study, theultrafiltration time for each experiment was kept constant (25min), in order to analyze the impact of the operating conditions
and the surface charge on fouling attachment probabilities inthe experimental design. As a sequence, the influence on thetotal mass of fouling, cumulative filtration volume per unit area,and specific power consumption could be accurately inves-tigated. In this study, the Central Composite Centered (CCC)Response Surface Method (RSM) was selected as theexperimental design method. The coagulation and thedepositional attachments are the main responses. The fourprocess parameters of the study include transmembranepressure, feed flow rate, feed concentration, and zeta potentialof the membrane surface. Supporting Information Table S1presents coded and actual levels of the process parameters. Tomaintain a high level of accuracy, each process parameterfeatures five levels with four parameter interactions. A total of30 experiments were performed, and their results were thenrigorously analyzed using multiregression. Zero code representsthe average range value for each process parameter. In order tominimize the error margin, six replicated experiments at zerocode for each process parameter were performed in randomorder. To determine the best-fitting model of the process ofregression and stepwise elimination, a statistical software (Stat-Ease, Version 8.0 Stat-Ease Inc., U.S.A.) was applied. Next, thecoefficients for a full model were assessed through regressionanalysis and then tested for their significance. The F-test wasimplemented to assess the significance of the coefficients, afterwhich the insignificant coefficients were excluded accordingly.P-value analysis was used to set the level of confidence for theF-test. The coefficients of determination (R2) and the analysisof variances (ANOVA) were used to evaluate the model fitting.
5. RESULTS AND DISCUSSION
5.1. Effect of the Zeta Potential of Membrane Surfaceon Membrane Fouling. This study investigates the effect ofthe zeta potential of the membrane surface on foulingattachments, the total mass of fouling, permeate flux, andspecific power concerns. Under the operating conditions of 25psi, 4.5 LPM, and 1.3 kg/m3 and after increasing the zeta
Figure 2. Schematic diagram of experimental setup.
Industrial & Engineering Chemistry Research Article
dx.doi.org/10.1021/ie501239h | Ind. Eng. Chem. Res. 2014, 53, 9897−99089900

potential of the membrane surface, the surface charge becameincreasingly negative, from −10.00 to −50.00 mV (5 times),resulted in reduction of depositional attachment (αpm) by 65%,from 0.99 to 0.35, as shown in Figure 3a. This could beattributed to the increased hydrophilicity of the membrane,which was created upon introducing more negative charges onthe membrane surface; hence, the electrostatic attraction forcebetween the latex particles and the membrane surface was
significantly decreased. The zeta potential of latex particles atpH of 7 is approximately −26.61 mV. The particle-to-membrane attachment was thus significantly reduced becausethe repulsion forces between latex particles and the highernegativity membrane surface increased. On the other hand,increasing the zeta potential negativity of the membrane surface5 times resulted in an insignificant decrease of the coagulationattachment (αpp) by 5.3% from 0.75 to 0.71, as shown in Figure
Figure 3. Effect of the zeta potential of polysulfone membrane surface at 25 psi, Q = 4.5 LPM, and Cf = 1.3 kg/m3 on (a) fouling attachmentprobabilities (αpp, αpm). (b) Cumulative filtration volume per unit area (Vs) [m
3/m2]. (c) Total mass of fouling (mt) [kg/m2] and (d) specific power
consumption [kW·h/m3].
Figure 4. SEM images of polysulfone membranes after ultrafiltration at 25 psi, Q = 4.5 LPM, and Cf = 1.3 kg/m3. (a) The zeta potential ofpolysulfone membrane surface −50.00 mV. (b) The zeta potential of polysulfone membrane surface −10.00 mV.
Industrial & Engineering Chemistry Research Article
dx.doi.org/10.1021/ie501239h | Ind. Eng. Chem. Res. 2014, 53, 9897−99089901
3a. The decrease in the depositional attachment (αpm) caused asignificant increase in the cumulative filtration volume per unitarea from 0.015 to 0.123 m3/m2, an augmentation of about10times, as shown in Figure 3b. This could be attributed to thesignificant reduction in the depositional attachment thatresulted in less particle attachment to the membrane pores,i.e., less pore blockage to the filtrate passage through themembrane. Moreover, as a consequence of the depositionalattachment reduction, the total mass of fouling diminished by61%, from 0.018 to 0.007 kg/m2, as illustrated in Figure 3c.Decreasing the total mass of fouling resulted in a lower rate ofthe transmembrane pressure increase during the filtrationprocess. Accordingly, the specific power consumption wasnoticeably decreased by 92.5%, from 24.83 to 1.86 kW·h/m3, aspresented in Figure 3d. From these observations a conclusioncan be drawn that the depositional attachment is thepredominant factor in membrane fouling. In addition, alteringthe particle-to-membrane attachment (αpm) by manipulatingthe zeta potential of the membrane surface could be an essentialprocess in fouling remediation.Figure 4a presents the SEM image of polysulfone membrane
with the zeta potential of −50.00 mV after ultrafiltration at atransmembrane pressure of 25 psi, a feed flow rate of 4.5 LPM,and a feed concentration of 1.3 kg/m3. Alternatively, Figure 4bpresents an SEM image of polysulfone membrane with the zetapotential of −10.00 mV after ultrafiltration at the same
operating conditions. In SEM images, the white latex particlesblocked the membrane pores and deposited betweenmembrane fiber. As shown in Figure 4a, the lower depositionalattachment caused a decrease in the total mass of fouling, dueto the reduced chances for particles to participate in particle-to-membrane attachment.It was likewise critical to investigate the effects of increasing
the membrane hydrophilicity of different heterogeneousmembranes other than polysulfone. For this reason, the effectof the zeta potential of the ultrafilic membrane surface onmembrane fouling was investigated at a transmembranepressure of 25 psi, a feed flow rate of 4 LPM, and a feedconcentration of 1.3 kg/m3, as presented in SupportingInformation Table S2. Reducing the negativity of the surfacecharge of the ultrafilic membrane from the original zetapotential value of −41.50 mV to −30.00 mV resulted in adecreased repulsion force between the membrane surface andlatex particles, which in turn caused the depositional attach-ment (αpm) to increase from 0.70 to 0.85. Higher αpm led tomore particle attachment to the membrane surface, resulting ina higher pore blockage, a decrease in the cumulative filtrationvolume per unit area from 0.123 to 0.115 m3/m2, an increase inthe mass of fouling from 0.025 to 0.03 kg/m2, and the powerconsumption escalation from 1.82 to 1.93 kW·h/m3. Furtherdecrease in the surface negativity from −30.00 mV to −15.00mV caused a further increase in the depositional attachment
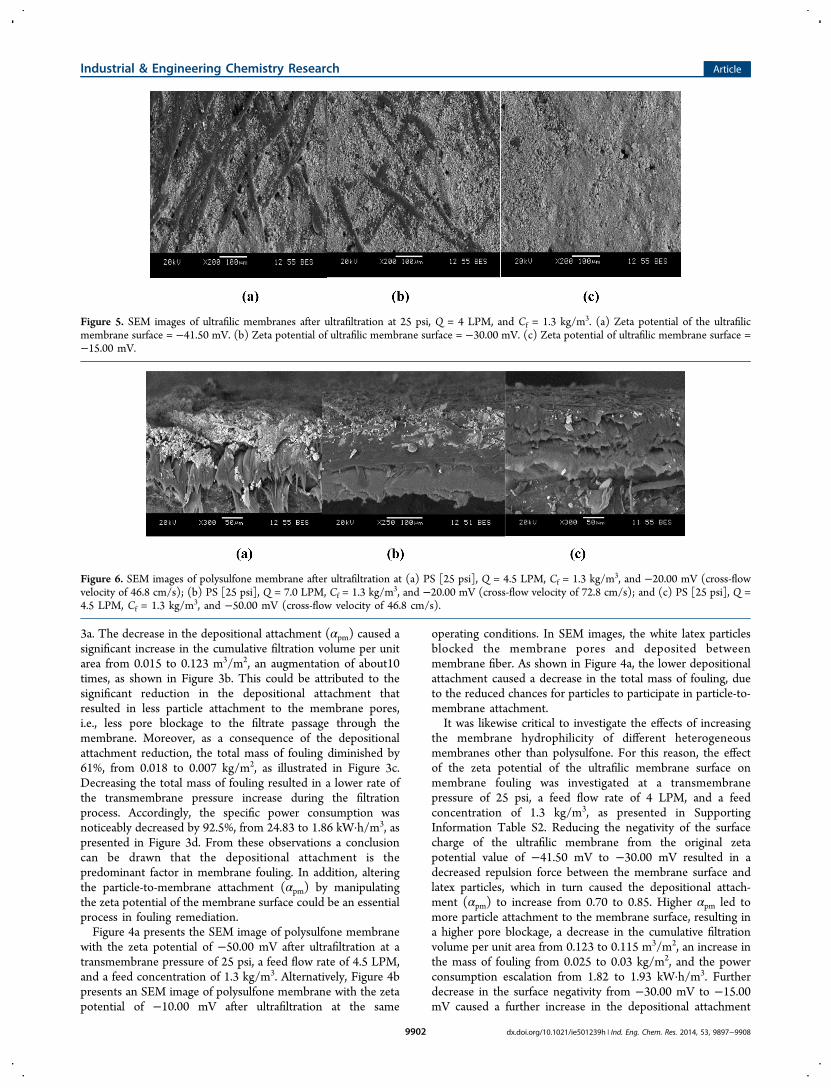
Figure 5. SEM images of ultrafilic membranes after ultrafiltration at 25 psi, Q = 4 LPM, and Cf = 1.3 kg/m3. (a) Zeta potential of the ultrafilicmembrane surface = −41.50 mV. (b) Zeta potential of ultrafilic membrane surface = −30.00 mV. (c) Zeta potential of ultrafilic membrane surface =−15.00 mV.
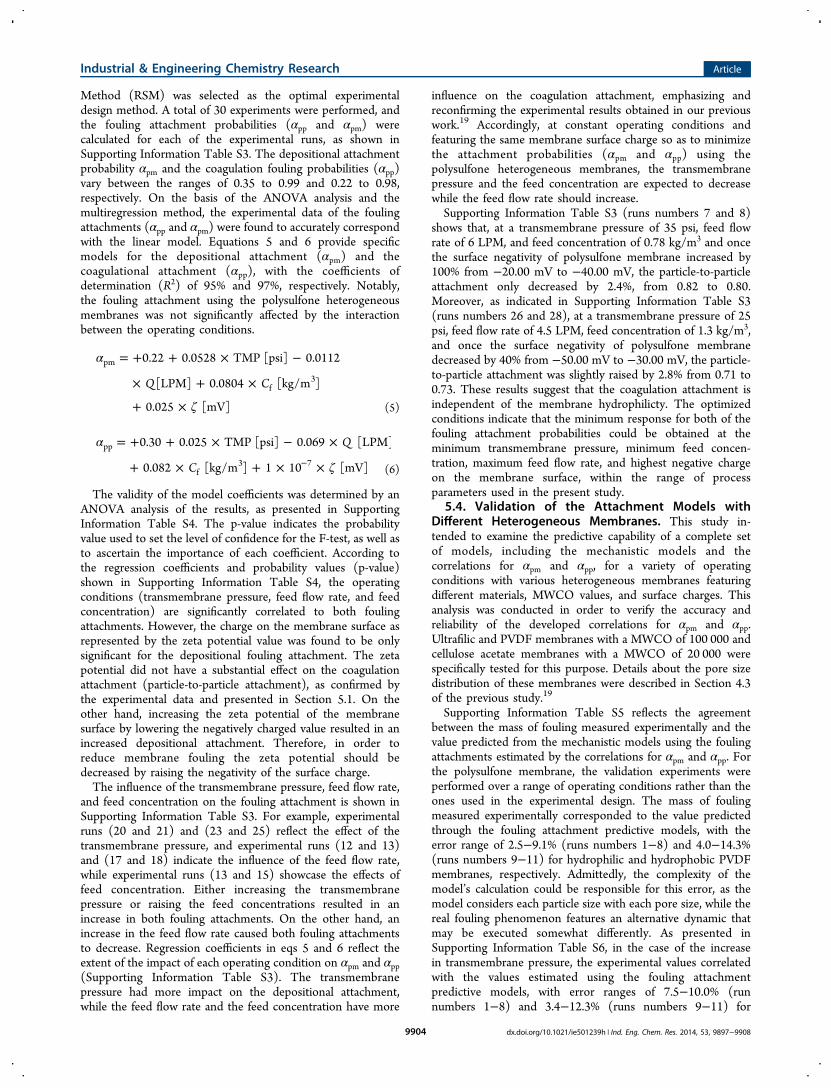
Figure 6. SEM images of polysulfone membrane after ultrafiltration at (a) PS [25 psi], Q = 4.5 LPM, Cf = 1.3 kg/m3, and −20.00 mV (cross-flowvelocity of 46.8 cm/s); (b) PS [25 psi], Q = 7.0 LPM, Cf = 1.3 kg/m3, and −20.00 mV (cross-flow velocity of 72.8 cm/s); and (c) PS [25 psi], Q =4.5 LPM, Cf = 1.3 kg/m3, and −50.00 mV (cross-flow velocity of 46.8 cm/s).
Industrial & Engineering Chemistry Research Article
dx.doi.org/10.1021/ie501239h | Ind. Eng. Chem. Res. 2014, 53, 9897−99089902

from 0.85 to 0.96. Consequently, the cumulative filtrationvolume per unit area decreased from 0.115 to 0.03 m3/m2,while the mass of fouling increased from 0.03 to 0.05 kg/m2.Raising the total mass of fouling caused the increase in thetransmembrane pressure to raise at a higher rate through thefiltration process, and this allowed the power consumption toincrease from 1.93 to 7.5 kW·h/m3. It should be noted that thecoagulation attachment (αpp) was 0.76, 0.76, and 0.77 usingultrafilic membrane with the zeta potentials of −41.50 mV,−30.00 mV, and −15.00 mV, respectively. Figure 5a−cshowcases the SEM images for the ultrafilic membrane afterultrafiltration at a transmembrane pressure of 25 psi, a feed flowrate of 4 LPM, and a feed concentration of 1.3 kg/m3, at thezeta potentials of −41.50 mV, −30.00 mV, and −15.00 mV,respectively. Figure 5b illustrates that decreasing the negativityof the surface charge of ultrafilic membrane resulted in a smallernumber of clean pores, greater number of particle attachmentsto the membrane surface, and higher chance of particle-to-particle collisions and attachments, if compared to Figure 5a. Afurther decrease in the surface negativity caused extensiveparticle deposition on the membrane surface and thus an evenhigher chance for the particles to contribute to the coagulationattachment and cake formation, as shown in Figure 5c.For the polysulfone membrane, the difference between the
effect of raising the feed flow rate and the effect of increasingthe zeta potential of the membrane surface on membranefouling was also investigated. At a transmembrane pressure of25 psi, a feed concentration of 1.3 kg/m3, and a zeta potentialof −20.00 mV, increasing the feed flow rate from 4.5 LPM to 7LPM resulted in a reduced coagulation attachment from 0.75 to0.55. At the higher flow rate, the cross-flow of the feed can beconsidered as a continuous washing of the cake layer, causing adecrease in particle-to-particle attachment (αpp). Figure 6bindicates a lower cake height at a cross-flow velocity of 72.8cm/s (7 LPM), if compared to Figure 6a at a cross-flow velocityof 46.8 cm/s (4.5 LPM). It is worth noting that in the case ofthe polysulfone membranes it is difficult to measure the cakeheight accurately due to its heterogeneous multilayered surface.Increasing the feed flow rate resulted in a 41.2% reduction inthe total mass of fouling from 0.017 kg/m2 to 0.01 kg/m2,owing only to the diminishing of the cake layer. Thedepositional attachment (αpm) only decreased from 0.94 to0.89, due to the accumulation of particles trapped inside themembrane tissue, which contributed to the multiple cake layersinside the matrix of the membrane. Moreover, increasing thefeed flow rate caused an increase in the cumulative filtrationvolume per unit area from 0.02 to 0.025 m3/m2 (25%). Despitethe fact that the total mass of fouling was decreased by 41.2%,thus reduction in transmembrane pressure through theultrafiltration process from 6.5 to 4 psi, the power consumptionper unit volume still increased by 21.7% from 12.5 kW·h/m3 to15.2 kW·h/m3. An analysis of these relationships suggests thatthere is an alignment with the specific power consumption as itis directly proportional to the feed flow rate from eq 4. Thisproportional correlation entails that the remediation of thefouling is necessary for the reduction of the total mass offouling in lower flow rates, increase of the cumulative filtrationvolume per unit area, and a reduction of the powerconsumption per unit volume of filtrate.On the other hand, at the transmembrane pressure of 25 psi,
feed concentration of 1.3 kg/m3, and feed flow rate of 4.5 LPM,increasing the surface zeta potential from −20.00 mV to −50.00mV resulted in a lesser attraction force between the particles
and the membrane surface. This caused the depositionalattachment (αpm) to noticeably decrease by 62.76%, from 0.94to 0.35, leading to a smaller number of particles trapped insidethe matrix, as presented in Figure 6c. The cumulative filtrationvolume per unit area escalated more than 5 times from 0.02m3/m2 to 0.123 m3/m2, and the total mass of fouling decreasedby 58.8%, from 0.017 kg/m2 to 0.007 kg/m2. Decreasing thetotal mass of fouling resulted in a lower increment in thetransmembrane pressure through the ultrafiltration processfrom 6.5 to 1.5 psi. Accordingly, the specific powerconsumption was significantly reduced by 85.1%, from 12.5kW·h/m3 to 1.8 kW·h/m3. The coagulation attachmentprobability had only slightly lessened from 0.75 to 0.72. Dueto a smaller number of particles attached to the membranesurface, chances of collision and attachment of particles on themembrane surface with other particles would be lower, asshown in Figure 6c.
5.2. Stability of the Membrane’s Zeta Potential afterthe Ultrafiltration Process. Polysulfone membrane has anoriginal zeta potential of −42.40 mV. In this study, the 30experimental runs of CCC experimental design were performedat different zeta potential values of the membrane surface. Itwas necessary to check the zeta potential of the treatedmembrane after the ultrafiltration process in order to ensure thestability of the surface charge throughout the filtration process,as depicted in Figure 7.
Polysulfone membrane zeta potentials of −10.00 mV, −20.00mV, −30.00 mV, −40.00 mV, and −50.00 mV were respectivelychanged to the average zeta potentials of −13.20 mV, −22.50mV, −32.40 mV, −41.50 mV, and −47.60 mV after theultrafiltration process. The simulated latex effluent had a pH of7, which would affect the membrane surface charge duringfiltration. The zeta potential of polysulfone membrane was−42.40 mV at pH of 7. It was observed that in the case of thetreated polysulfone membrane with a lower negativity,whenever the latex solution was allowed to go through themembrane for 25 min, the negativity of the zeta potential of themembrane surface increased by 2.00 to 3.00 mV. On the otherhand, for the treated polysulfone membranes with a negativitycharge higher than the original zeta potential value, ultra-filtration of latex solution caused a reduction of the negativecharge on the membrane surface from −50 mV to −47.6 mV.This can be attributed to the influence of the ionic strength ofsimulated latex effluent at pH of 7 on the zeta potential of thetreated membrane surfaces at higher pH values. Similarly,ultrafilic membrane with zeta potentials of −15.00 mV and−30.00 mV were also changed to −16.50 mV and −31.20 mV,respectively, after 25 min of ultrafiltration with latex solution.
5.3. Statistical Data Analysis. In the current study theCentral Composite Centered (CCC) Response Surface
Figure 7. Zeta potential of polysulfone membrane surface before andafter ultrafiltration process.
Industrial & Engineering Chemistry Research Article
dx.doi.org/10.1021/ie501239h | Ind. Eng. Chem. Res. 2014, 53, 9897−99089903
Method (RSM) was selected as the optimal experimentaldesign method. A total of 30 experiments were performed, andthe fouling attachment probabilities (αpp and αpm) werecalculated for each of the experimental runs, as shown inSupporting Information Table S3. The depositional attachmentprobability αpm and the coagulation fouling probabilities (αpp)vary between the ranges of 0.35 to 0.99 and 0.22 to 0.98,respectively. On the basis of the ANOVA analysis and themultiregression method, the experimental data of the foulingattachments (αpp and αpm) were found to accurately correspondwith the linear model. Equations 5 and 6 provide specificmodels for the depositional attachment (αpm) and thecoagulational attachment (αpp), with the coefficients ofdetermination (R2) of 95% and 97%, respectively. Notably,the fouling attachment using the polysulfone heterogeneousmembranes was not significantly affected by the interactionbetween the operating conditions.
α
ζ
= + + × −
× + ×
+ ×
Q C
0.22 0.0528 TMP [psi] 0.0112
[LPM] 0.0804 [kg/m ]
0.025 [mV]
pm
f3
(5)
α
ζ
= + + × − ×
+ × + × ×−
Q
C
0.30 0.025 TMP [psi] 0.069 [LPM]
0.082 [kg/m ] 1 10 [mV]
pp
f3 7
(6)
The validity of the model coefficients was determined by anANOVA analysis of the results, as presented in SupportingInformation Table S4. The p-value indicates the probabilityvalue used to set the level of confidence for the F-test, as well asto ascertain the importance of each coefficient. According tothe regression coefficients and probability values (p-value)shown in Supporting Information Table S4, the operatingconditions (transmembrane pressure, feed flow rate, and feedconcentration) are significantly correlated to both foulingattachments. However, the charge on the membrane surface asrepresented by the zeta potential value was found to be onlysignificant for the depositional fouling attachment. The zetapotential did not have a substantial effect on the coagulationattachment (particle-to-particle attachment), as confirmed bythe experimental data and presented in Section 5.1. On theother hand, increasing the zeta potential of the membranesurface by lowering the negatively charged value resulted in anincreased depositional attachment. Therefore, in order toreduce membrane fouling the zeta potential should bedecreased by raising the negativity of the surface charge.The influence of the transmembrane pressure, feed flow rate,
and feed concentration on the fouling attachment is shown inSupporting Information Table S3. For example, experimentalruns (20 and 21) and (23 and 25) reflect the effect of thetransmembrane pressure, and experimental runs (12 and 13)and (17 and 18) indicate the influence of the feed flow rate,while experimental runs (13 and 15) showcase the effects offeed concentration. Either increasing the transmembranepressure or raising the feed concentrations resulted in anincrease in both fouling attachments. On the other hand, anincrease in the feed flow rate caused both fouling attachmentsto decrease. Regression coefficients in eqs 5 and 6 reflect theextent of the impact of each operating condition on αpm and αpp(Supporting Information Table S3). The transmembranepressure had more impact on the depositional attachment,while the feed flow rate and the feed concentration have more
influence on the coagulation attachment, emphasizing andreconfirming the experimental results obtained in our previouswork.19 Accordingly, at constant operating conditions andfeaturing the same membrane surface charge so as to minimizethe attachment probabilities (αpm and αpp) using thepolysulfone heterogeneous membranes, the transmembranepressure and the feed concentration are expected to decreasewhile the feed flow rate should increase.Supporting Information Table S3 (runs numbers 7 and 8)
shows that, at a transmembrane pressure of 35 psi, feed flowrate of 6 LPM, and feed concentration of 0.78 kg/m3 and oncethe surface negativity of polysulfone membrane increased by100% from −20.00 mV to −40.00 mV, the particle-to-particleattachment only decreased by 2.4%, from 0.82 to 0.80.Moreover, as indicated in Supporting Information Table S3(runs numbers 26 and 28), at a transmembrane pressure of 25psi, feed flow rate of 4.5 LPM, feed concentration of 1.3 kg/m3,and once the surface negativity of polysulfone membranedecreased by 40% from −50.00 mV to −30.00 mV, the particle-to-particle attachment was slightly raised by 2.8% from 0.71 to0.73. These results suggest that the coagulation attachment isindependent of the membrane hydrophilicty. The optimizedconditions indicate that the minimum response for both of thefouling attachment probabilities could be obtained at theminimum transmembrane pressure, minimum feed concen-tration, maximum feed flow rate, and highest negative chargeon the membrane surface, within the range of processparameters used in the present study.
5.4. Validation of the Attachment Models withDifferent Heterogeneous Membranes. This study in-tended to examine the predictive capability of a complete setof models, including the mechanistic models and thecorrelations for αpm and αpp, for a variety of operatingconditions with various heterogeneous membranes featuringdifferent materials, MWCO values, and surface charges. Thisanalysis was conducted in order to verify the accuracy andreliability of the developed correlations for αpm and αpp.Ultrafilic and PVDF membranes with a MWCO of 100 000 andcellulose acetate membranes with a MWCO of 20 000 werespecifically tested for this purpose. Details about the pore sizedistribution of these membranes were described in Section 4.3of the previous study.19
Supporting Information Table S5 reflects the agreementbetween the mass of fouling measured experimentally and thevalue predicted from the mechanistic models using the foulingattachments estimated by the correlations for αpm and αpp. Forthe polysulfone membrane, the validation experiments wereperformed over a range of operating conditions rather than theones used in the experimental design. The mass of foulingmeasured experimentally corresponded to the value predictedthrough the fouling attachment predictive models, with theerror range of 2.5−9.1% (runs numbers 1−8) and 4.0−14.3%(runs numbers 9−11) for hydrophilic and hydrophobic PVDFmembranes, respectively. Admittedly, the complexity of themodel’s calculation could be responsible for this error, as themodel considers each particle size with each pore size, while thereal fouling phenomenon features an alternative dynamic thatmay be executed somewhat differently. As presented inSupporting Information Table S6, in the case of the increasein transmembrane pressure, the experimental values correlatedwith the values estimated using the fouling attachmentpredictive models, with error ranges of 7.5−10.0% (runnumbers 1−8) and 3.4−12.3% (runs numbers 9−11) for
Industrial & Engineering Chemistry Research Article
dx.doi.org/10.1021/ie501239h | Ind. Eng. Chem. Res. 2014, 53, 9897−99089904

hydrophilic and hydrophobic membranes, respectively. Hence,the model prediction of the mass of fouling and the increase intransmembrane pressure agreed quite well with the exper-imental values for both hydrophilic and hydrophobicmembranes.Equations 5 and 6 illustrate that based on the regression
coefficient the transmembrane pressure had more impact onfouling attachment than the hydrophilicity of the membrane.However, the results obtained at the validation runs numbers 3and 9, in Supporting Information Tables S5 and S6, suggestthat the hydrophobic PVDF membrane with the zeta potentialof −2.50 mV demonstrated a higher fouling capability at alower transmembrane pressure than the hydrophilic poly-sulfone membrane with the zeta potential of −42.40 mV. At thefeed flow rate of 4 LPM and the feed concentration of 0.78 kg/m3, the total masses of fouling were 0.011 kg/m2 and 0.0125kg/m2 after the ultrafiltration process was performed usinghydrophilic polysulfone and hydrophobic PVDF membranes at25 psi and 15 psi, respectively, as shown in Figure 8. Thespecific power consumption was 14.5 kW·h/m3 for thepolysulfone membrane and 15.4 kW·h/m3 for PVDFmembranes. This could be attributed to the pore sizedistribution which had a significant effect on the mass offouling retained by the membrane and caused the increase intransmembrane pressure, as shown in Supporting InformationTables S5 and S6. Increasing the pore size in the case of PVDFmembranes with MWCO of 100 000 resulted in greater flowthrough the membrane pores, if compared to polysulfone
membrane of MWCO of 60 000. As a result, the chances forparticle-to-particle and particle-to-membrane collisions andattachment increased. Following the growing particle attach-ment, the total mass of fouling increased at a lowertransmembrane pressure, as reflected by the SEM images inFigure 8b,d, as compared to Figure 8a,c. Moreover, the highernegative charge of the polysulfone membrane generated ahigher level of repulsion between the particles and themembrane surface and brought about lower depositionalattachment (αpm) of 0.34, as compared to 0.97 for the PVDFhydrophobic membrane. On the other hand, the coagulationattachment (αpp) had a higher value in the case of polysulfonemembrane due to the impact of the higher transmembranepressure on particle-to-particle attachment. From this aconclusion can be drawn that the pore size enhances theinfluence of membrane hydrophilicity more than the impact ofthe applied transmembrane pressure at same feed flow rate andunder the same feed concentration.Equation 5 presented that the zeta potential would have a
stronger effect on the depositional attachment (αpm) than thefeed flow rate, while the feed flow rate could be considered thepredominant factor in the coagulation attachment (αpp) change,as presented in eq 6. Both equations generated from data withpolysulfone membrane and indeed the case for otherheterogeneous membranes used in the present study. Attransmembrane pressure of 15 psi and a feed concentration of1.3 kg/m3, the depositional attachment using polysulfonemembrane at feed flow rate of 4 LPM was 0.82, compared to
Figure 8. SEM images of membranes after ultrafiltration at Q = 4 LPM and Cf = 0.78 kg/m3: (a) side view of the cake height of the polysulfonemembrane at TMP of 25 psi and zeta potential of −42.40 mV; (b) side view of the cake height of the PVDF membrane at TMP of 15 psi and zetapotential of −2.50 mV; (c) membrane surface of the polysulfone membrane at TMP of 25 psi and zeta potential of −42.40 mV; and (d) membranesurface of PVDF membrane at TMP of 15 psi and zeta potential of −2.50 mV.
Industrial & Engineering Chemistry Research Article
dx.doi.org/10.1021/ie501239h | Ind. Eng. Chem. Res. 2014, 53, 9897−99089905
0.98 for PVDF membrane at 7 LPM, as shown in SupportingInformation Table S5 (Runs 2 and 10). This can be attributedto the ultrafiltration process which is performed using a treatedpolysulfone membrane with the zeta potential of −10.00 mV,and as a result, causing less of an attraction force between latexparticles and the membrane surface, especially if compared toPVDF membrane with the original zeta potential of −2.50 mV.This indicates that at a higher feed flow rate the depositionalattachment does not decrease as expected due to the influenceof the membrane surface charge. Correlations such as thisfurther confirm that the zeta potential has a greater impact onthe depostitioanl attachment than the feed flow rate. On theother hand, the coagulation attachment (αpp) was found to be0.51 and 0.3 using hydrophilic polysulfone membrane at 4 LPMand hydrophobic PVDF membrane at 7 LPM, respectively.This indicates the fact that the feed flow rate had a significanteffect on the particle-to-particle attachment, while thecoagulation membrane was functioning independently of themembrane surface charge. PVDF with MWCO of 100 000allows greater flow through the membrane pores, if comparedto the polysulfone membrane of MWCO of 60 000, whichresulted in higher chances for particle collisions and attach-ment. Furthermore, PVDF has a hydrophobic nature with zetapotential −2.5 mV, which increases the chances for greaterdeposition and higher particle-to-membrane attachment, ifcompared to polysulfone membrane with zeta potential of −10MV, as shown in Supporting Information Table S5. However,the total mass of fouling was higher in the case of polysulfonemembrane than PVDF, as presented in Supporting InformationTable S5. This can be attributed to the influence of feed flowrate which reduced the particle-to-particle attachment and thecake layer.The effect of hydrophilicty of different membrane materials
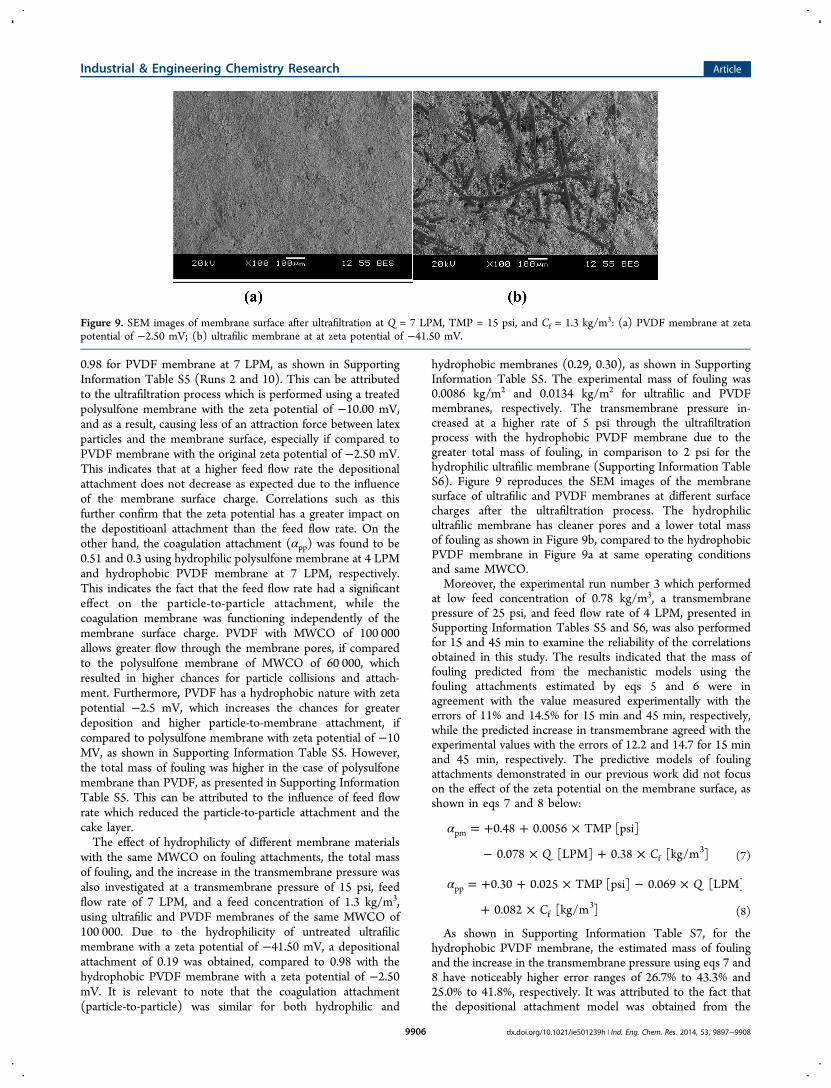
with the same MWCO on fouling attachments, the total massof fouling, and the increase in the transmembrane pressure wasalso investigated at a transmembrane pressure of 15 psi, feedflow rate of 7 LPM, and a feed concentration of 1.3 kg/m3,using ultrafilic and PVDF membranes of the same MWCO of100 000. Due to the hydrophilicity of untreated ultrafilicmembrane with a zeta potential of −41.50 mV, a depositionalattachment of 0.19 was obtained, compared to 0.98 with thehydrophobic PVDF membrane with a zeta potential of −2.50mV. It is relevant to note that the coagulation attachment(particle-to-particle) was similar for both hydrophilic and
hydrophobic membranes (0.29, 0.30), as shown in SupportingInformation Table S5. The experimental mass of fouling was0.0086 kg/m2 and 0.0134 kg/m2 for ultrafilic and PVDFmembranes, respectively. The transmembrane pressure in-creased at a higher rate of 5 psi through the ultrafiltrationprocess with the hydrophobic PVDF membrane due to thegreater total mass of fouling, in comparison to 2 psi for thehydrophilic ultrafilic membrane (Supporting Information TableS6). Figure 9 reproduces the SEM images of the membranesurface of ultrafilic and PVDF membranes at different surfacecharges after the ultrafiltration process. The hydrophilicultrafilic membrane has cleaner pores and a lower total massof fouling as shown in Figure 9b, compared to the hydrophobicPVDF membrane in Figure 9a at same operating conditionsand same MWCO.Moreover, the experimental run number 3 which performed
at low feed concentration of 0.78 kg/m3, a transmembranepressure of 25 psi, and feed flow rate of 4 LPM, presented inSupporting Information Tables S5 and S6, was also performedfor 15 and 45 min to examine the reliability of the correlationsobtained in this study. The results indicated that the mass offouling predicted from the mechanistic models using thefouling attachments estimated by eqs 5 and 6 were inagreement with the value measured experimentally with theerrors of 11% and 14.5% for 15 min and 45 min, respectively,while the predicted increase in transmembrane agreed with theexperimental values with the errors of 12.2 and 14.7 for 15 minand 45 min, respectively. The predictive models of foulingattachments demonstrated in our previous work did not focuson the effect of the zeta potential on the membrane surface, asshown in eqs 7 and 8 below:
α = + + ×
− × + ×Q C
0.48 0.0056 TMP [psi]
0.078 [LPM] 0.38 [kg/m ]
pm
f3
(7)
α = + + × − ×
+ ×
Q
C
0.30 0.025 TMP [psi] 0.069 [LPM]
0.082 [kg/m ]
pp
f3
(8)
As shown in Supporting Information Table S7, for thehydrophobic PVDF membrane, the estimated mass of foulingand the increase in the transmembrane pressure using eqs 7 and8 have noticeably higher error ranges of 26.7% to 43.3% and25.0% to 41.8%, respectively. It was attributed to the fact thatthe depositional attachment model was obtained from the
Figure 9. SEM images of membrane surface after ultrafiltration at Q = 7 LPM, TMP = 15 psi, and Cf = 1.3 kg/m3: (a) PVDF membrane at zetapotential of −2.50 mV; (b) ultrafilic membrane at at zeta potential of −41.50 mV.
Industrial & Engineering Chemistry Research Article
dx.doi.org/10.1021/ie501239h | Ind. Eng. Chem. Res. 2014, 53, 9897−99089906

experimental data using hydrophilic polysulfone membranewith zeta potential of −42.40 mV. However, the PVDFmembrane is a hydrophobic membrane with a zeta potential of−2.50 mV, which would have a relatively higher attraction forcewith the latex particles with a zeta potential of −26.61 mV, ascompared with other hydrophilic membranes carrying morenegative charges, and mentioned in detail in Section 4.3 of theprevious study.19 Therefore, the depositional attachment(particle-to-membrane) estimated from eq 7 can only beimplemented for hydrophilic membranes with high negativecharges.The predictive models presented in the present study
provide a number of key correlations for the mass of foulingand the increase in the transmembrane pressure applicable to avariety of heterogeneous membranes with different membranesurface zeta potentials, as demonstrated in SupportingInformation Tables S5 and S6. Moreover, the models yieldedgood agreement between predicted values and experimentaldata even for the PVDF hydrophobic membranes asdemonstrated in Supporting Information Table S7. The massof fouling predicted by the models developed in the presentstudy had a significantly lower error range of 7.8−14.3%, ascompared to the range of 26.7−43.3% using eqs 7 and 8 that donot include the effect of the zeta potential of the membranesurface on fouling. Likewise, the increase in the transmembranepressure error was found within the range of 8.9−12.3%, ascompared to 25−41.8%. Hence, the depositional correlationformulated in the present study is applicable for bothhydrophilic and hydrophobic membranes.
6. CONCLUSIONThe zeta potential of the membrane surface has a predominanteffect on the fouling attachment model. The total mass offouling and the power consumption could be reduced bymanipulating the depositional attachment between latexparticles and the membrane surface. At the transmembranepressure of 25 psi and feed concentration of 1.3 kg/m3, theraising of the polysulfone membrane hydrophilicity from−20.00 mV to −50.00 mV at a lower feed flow rate of 4.5LPM causes a 58.8% decrease in the total mass of fouling, a 5times increase in the cumulative filtration volume per unit area,and a 85.1% reduction in the specific power consumption. Onthe other hand, at the transmembrane pressure of 25 psi, feedconcentration of 1.3 kg/m3, and zeta potential of −20.00 mV,increasing the feed flow rate from 4.5 LPM to 7 LPM bringsabout the reduction in the coagulation attachment from 0.75 to0.55, while the depositional attachment lowers only marginallyfrom 0.94 to 0.89. Although the total mass of fouling wasdecreased by 41.2%, in turn limiting the increase in trans-membrane pressure through the ultrafiltration process from 6.5to 4, the power consumption per unit volume actually increasedby 21.7% from 12.5 kW·h/m3 to 15.2 kW·h/m3. This indicatesthat the specific power consumption is directly proportional tothe feed flow rate.The fouling model and the fouling attachment correlations
taking into account the effect of the zeta potential on foulingfound in the present study form a comprehensive set ofpredictive models, applicable to both hydrophilic and hydro-phobic membranes in a variety of materials with differentmolecular weight cut off (MWCO) values. The mass of foulingexperimentally measured agreed with the predicted value usingthe fouling attachment models, with the error range of 2.5−9.1% and 4.0−14.3% for hydrophilic and hydrophobic
membranes, respectively. For the increase in the trans-membrane pressure, the experimental values agreed with thepredicted values, with error ranges of 7.5−10.0 and 3.4−12.3%for hydrophilic and hydrophobic membranes, respectively. Thehydrophilicity of the membrane did not have a noticeable effecton the particle-to-particle attachment. The effect of zetapotential on depositional fouling attachment was found to besignificant, especially for hydrophobic membranes such asPVDF. For PVDF membrane, the predicted mass of foulingcalculated using the correlations incorporating the zetapotential effect had a much lower error of 7.8 to 14.3%, ascompared to the error of 26.7 to 43.3% using the correlationswithout the effect of the zeta potential of the membranesurface. Likewise, for the increase in the transmembranepressure, the error range was 8.9 to 12.3%, as compared to 25to 41.8% using the models without the effect of the zetapotential. Hence, the depositional correlation found in thisstudy directly agrees with hydrophilic and hydrophobicmembranes. The correlations and fouling model proposed inthis study form an essential set of predictive models necessaryfor the estimation of the mass of fouling and the increase intransmembrane pressure, generalized for the applications ofhydrophilic and hydrophobic membranes in a variety ofmaterials with varying molecular weight cut off (MWCO)values.
■ ASSOCIATED CONTENT*S Supporting InformationTabulated data of the process parameters, experimental design,statistical analysis, and model agreements. This material isavailable free of charge via the Internet at http://pubs.acs.org.
■ AUTHOR INFORMATIONCorresponding Author*Tel: +1 647 929 3491. Fax: +1 416 979 5083. E-mail: [email protected] authors declare no competing financial interest.
■ ACKNOWLEDGMENTSThe authors are grateful for the financial support from theNatural Science and Engineering Research Council of Canada(NSERC). The assistance and facilities provided by theDepartment of Chemical Engineering, Ryerson University,have made this research possible and are also highlyappreciated.
■ NOMENCLATUREa Particle radius [m]Bi Mass transfer coefficient through the pore size i
[m−2]Cf Concentration of foulants in the feedwater [kg/m3]D Diffusion coefficient of colloidal particles [m2/s]Dmi
Membrane pore diameter of size i [m]Lm Length of membrane pores [m]mp Mass of particles attaching to membrane pores in a
unit membrane surface area [kg/m2]mpLi Mass of the particles larger than the pore of size i
contributing to pore blocking [kg/m2]mpSi Mass of small particles attaching to membrane pores
of size i in a unit membrane surface area [kg/m2](Dmi
/6 < particle size < Dmi/2)
Industrial & Engineering Chemistry Research Article
dx.doi.org/10.1021/ie501239h | Ind. Eng. Chem. Res. 2014, 53, 9897−99089907

mc Total mass of particles in the cake layer per unitmembrane surface area [kg/m2]
mt Total mass of particles retained per unit membranesurface area [kg/m2]
mwiMass of the particles attaching to the pore walls ofsize i normalized to unit membrane surface area [kg/m2] (particle size < Dmi
/6)N Total number of the nonuniform pore sizes
determined in the pore size distribution of theheterogeneous membranes
Nm Number density of membrane pores per a unitmembrane surface area
TMP Initial transmembrane pressure [psi]TMPAVG Time-averaged transmembrane pressure throughout
the filtration duration [psig·min]P′ The increase in transmembrane pressure during
filtration normalized to that of clean membranes[dimensionless]
Q Feed flow rate [L/min]Rm Resistance due to the membrane [m−1]R̂c Resistance due to the cake [m/kg]Vs The cumulative volume of the permeate normalized
to membrane surface area [m3/m2]V̅S Cumulative permeate volume [m3]xi Number-average percentage of the pore of size iσ Projected area of a unit mass of the particles on
membrane surface [m2/kg]σL Projected area of a unit mass of the large particles
(particle diameter ≥ pore diameter) on membranesurface [m2/kg]
σS Projected area of a unit mass of the small particles onthe membrane surface [m2/kg] (pore diameter/6 <particle radius < pore diameter/2)
σXS Projected area of a unit mass of the very smallparticles on membrane surface [m2/kg] (particleradius < pore diameter/6)
εs Membrane surface porosity [dimensionless]αpm Attachment probabilities between a particle and the
membrane [dimensionless]αpp Attachment probabilities between two particles
[dimensionless]τ Tortuosity of the membrane [dimensionless]
■ REFERENCES(1) Israelachvili, J. Intermolecular & Surface Forces, 2nd ed.; AcademicPress Inc.: San Diego, CA, U.S.A., 1992; p 450.(2) Gregory, J. Particles in Water: Properties and Processes; Taylor &Francis Group, CRC Press, 2005; Interaction forces, pp 63−70.(3) Sui, Y.; Wang, Z.; Gao, C.; Wan, Q.; Zhu, L. An investigation onthe antifouling ability of PVDF membranes by polyDOPA coating.Desalin. Water Treat. 2012, 50, 22−33.(4) Nikkola, J.; Sievan̈en, J.; Raulio, M.; Wei, J.; Vuorinen, J.; Tang,C. Surface modification ofthin film compositepolyamidemembraneusing atomiclayerdepositionmethod. J. Membr. Sci. 2014, 450, 174−180.(5) Zuo, G.; Wan, R. Novelmembranesurfacemodification toenhan-ceanti-oilfouling propertyformembranedistillationapplication. J.Membr. Sci. 2013, 447, 26−35.(6) Singh, G.; Song, L. Quantifying the effect of ionic strength oncolloidal fouling potential in membrane filtration. J. Colloid InterfaceSci. 2005, 284, 630−638.(7) Faibish, R.; Elimelech, M.; Cohen, Y. Effect of interparticleelectrostatic double layer interactiosn on permeate flux decline in cross
flow membrane filtration of colloidal suspension. J. Colloid Interface Sci.1998, 204, 77−86.(8) Childress, A. E.; Elimelech, M. Effect of solution chemistry on thesurface charge of polymeric reverse osmosis and nanofiltrationmembranes. J. Membr. Sci. 1996, 119, 253−268.(9) Mika, M.; Arto, P.; Marianne, N. Effect of pH on hydrophilicityand charge and their effect on the filtration efficiency of NFmembranes at different pH. J. Membr. Sci. 2006, 280, 311−320.(10) Jones, K. L.; O’Melia, C. R. Protein and humic acid adsorptiononto hydrophilic membrane surfaces: effects of pH and ionic strength.J. Membr. Sci. 2000, 165, 31−46.(11) Viadero, R. C.; Vaughan, R. L.; Reed, B. E. Study of seriesresistances in high-shear rotary ultrafiltration. J. Membr. Sci. 1999, 162,199−211.(12) Bruijn, J. P. F.; Salazar, F. N.; Borquez, R. Membrane blockingin ultrafiltration, a new approach to fouling. Food Bioprod. Process.2005, 83, 211−219.(13) Ho, C. C.; Zydney, A. L. Transmembrane pressure profilesduring constant flux microfiltration of bovine serum albumin. J.Membr. Sci. 2002, 209 (2), 363−377.(14) Huanga, J.; Guoa, S.; Zenga, G.; Xionga, Y.; Zhanga, D.; Tanga,X.; Xiea, G. Prediction of fouling resistance and permeate flux in cross-flowmicellar-enhanced ultrafiltration (MEUF). Colloids Surf., A 2012,401, 81−89.(15) Abdelrasoul, A.; Doan, H.; Lohi, A. A mechanistic model forultrafiltration membrane fouling by latex. J. Membr. Sci. 2013, 433, 88−99.(16) Abdelrasoul, A.; Doan, H.; Lohi, A. Impact of operatingconditions on fouling probability and cake height in ultrafiltration oflatex solution. J. Membr. Sep. Technol. 2013, 2, 134−147.(17) Abdelrasoul, A.; Doan, H.; Lohi, A. Effect of pH on foulingattachments and power consumption in ultrafiltration of latex solution.Can. J. Chem. Eng. 2014, 9999, 1−13.(18) Abdelrasoul, A.; Doan, H.; Lohi, A.; Cheng, C.-H. Modelingdevelopment for ultrafiltratio membrane fouling of heterogeneousmembranes with non-uniform pore size, accepted in. Can. J. Chem.Eng. 2014, accepted for publication, manuscript number CJCE-13-0744.(19) Abdelrasoul, A.; Doan, H.; Lohi, A.; Cheng, C.-H. Modeling offouling and foulant attachments on heterogeneous membranes inultrafiltration of latex solution, under review in. Sep. Purif. Technol.2014, submitted for publication, manuscript number SEPPUR-D-14-00271.
Industrial & Engineering Chemistry Research Article
dx.doi.org/10.1021/ie501239h | Ind. Eng. Chem. Res. 2014, 53, 9897−99089908