Loop breaking in heat exchanger networks by mathematical programming
Upload
independentCategory
view
0download
0
2nd Mercosur Congress on Chemical Engineering
4th Mercosur Congress on Process Systems Engineering
_______________________________________ * To whom all correspondence should be addressed Address: PETROBRAS / CENPES / AOT - Cidade Universitária - Q.7 - Ilha do Fundão, 21949-900 Rio de Janeiro - Brazil E-mail: [email protected]
1
FOULING MODELS FOR REAL TIME HEAT EXCHANGER FOULING
DETECTION C.D.S.Silva1, F.S.Liporace1*, E.M.Queiroz2
1Petrobras/Cenpes/EB/AOT 2Escola de Química – Universidade Federal do Rio de Janeiro
Abstract. Energy consumption is one of the major concerns of the petroleum refining industry. The preheat train of crude distillation units is the most critical system within the refinery to be evaluated when energy is to be reduced. Its efficiency is strongly related to the fouling in the heat exchangers. The aim of this work is to evaluate dynamic fouling models based on real data acquired from an on-line heat exchanger performance and fouling detection system. The system uses rigorous steady state process simulation of the preheat train along with rigorous equipment design in order to predict both the operational and clean overall heat transfer coefficients. A comparison between these values indicates the real time performance of the heat exchanger, which can be measured by the effective fouling thermal resistance, and of the preheat train as well. These models will be used later on the heat exchanger cleaning planning and scheduling optimization. The use of a rigorous process simulation together with a rigorous clean global heat transfer coefficient prediction allows one to consider aspects normally not taken into account in this type of study as heat exchanger geometry, crude vaporization after the desalters, variation of crude and products composition with CDU run and so forth. The system is running at the major Petrobras refinery, in a 25 heat exchanger preheat train.
Keywords: Dynamic Fouling Models, Real Time Simulations, Heat Exchanger Efficiency 1. Introduction
As it is well known, energy consumption is one of the major concerns of the petroleum refining industry. The
preheat train of crude distillation units (CDU) is the most critical system in the refinery and plays an important
role in reducing the energy consumption, due to the process streams heat integration. So its operation and
performance must be tracked as precisely as possible in order to detect loss of heat transfer efficiency and avoid
an increase on furnace duty, on water refrigeration consumption, on head loss of the system, or even a decrease
on the unit throughput. All of these consequences bring an economic penalty to the unit.
Fouling is one of the major causes to the decrease on the preheat train performance. Several works (Zubair et
al., 2000; Polley et al., 2002; Yeap et al., 2003; Bories et al., 2004) present fouling models. Fouling in heat
exchangers can be caused by many factors, such as temperature, velocities, oil compatibility etc (Wiehe et al.,
2000; Yeap et al., 2002; Wilson et al., 2002; Pugh, 2002; Srinivasan et al., 2004) and its economics aspects are
also object of some works (Sheik et al., 2000; Zubair et al., 2000).
This paper aims to evaluate dynamic fouling models based on real data acquired from an on-line heat
exchanger performance and fouling detection system. A computational tool has been developed that infers, on a
real time basis, the thermal efficiency of each heat exchanger (measured by the effective fouling thermal
resistance) as well as of the whole preheat train. This tool can be used to measure both the operational and the
clean overall heat transfer coefficient (U), and then the total fouling resistance (Rf), to estimate the appropriate
moment to remove a heat exchanger for cleaning (Smaïli et al., 2001; O'Donnell et al., 2001). It can also help the
crude unit operator to make decisions regarding the preheat operation so he can maximize the heat recovery from
it. Also, the actual fouling factors being estimated can be used by CENPES (PETROBRAS R&D Center, in Rio
de Janeiro, Brazil) heat exchanger design team in order to improve their design. Usually, those factors are taken
2nd Mercosur Congress on Chemical Engineering
4th Mercosur Congress on Process Systems Engineering
2
from tables presented by TEMA and do not always represent the reality regarding time dependency, crude and
process stream composition and so forth
This tool, named as FoulingTR, is connected to the refinery plant data information, the PI System, and
acquires real time data (flowrates, pressures and temperatures) from the process streams and sends them to the
PETROBRAS rigorous process simulator (Petrox). As all the temperature and flowrate information needed to
evaluate the whole preheat train performance are not available, a particular simulation strategy was developed,
that, at the same time, performs a data reconciliation and gives all the missing operational information, closing
mass and energy balances. After this simulation, the real time operational global heat transfer coefficient (Uop)
can be inferred, as well as any other variable that a rigorous process simulator can provide.
CENPES also developed a communication between Petrox and Xist, a program from Heat Transfer Research
Institute (HTRI) used to design heat exchangers on a rigorous way. So, a real time clean global heat transfer
coefficient (Ucl) can be inferred, as it was done for Uop, using the same operational inlet data for each heat
exchanger and some geometric data. When comparing Uop and Ucl, an indication of the effective fouling thermal
resistance (Eq.1) can be obtained. This rigorous simulation of the heat exchanger network can also provides the
performance of each clean heat exchanger, i.e., its maximum heat load, the maximum cold outlet and minimum
hot outlet temperatures. As the performance of the equipment is known, it can be derived, again using Petrox,
what would be the benefit regarding the inlet Preflash tower temperature, if a specific exchanger was cleaned
and what would be its maximum value if the whole preheat train was cleaned.
clopf UU
R 11−= (1)
The major advantage of this tool is that, in using a rigorous process simulation, crude composition can be
much better characterized by many pseudocomponents as required, it can be updated as the crude changes,
temperature dependency of the properties as thermal conductivity, density, viscosity and specific heat can be
taken into account as well as the influence of the crude vaporization that occurs after the desalters. These aspects
are not always considered in the literature (Jerónimo et al., 1997; Torin and Negrão, 2003, Rodera et al., 2003).
Also, due to the use of Xist and its well-tested film coefficient correlations for shell and tube heat exchangers,
the Ucl is much better inferred.
This tool is being tested in one of the two CDUs at the biggest PETROBRAS refinery, located in São Paulo
State, Brazil southeast. This refinery processes 360000 bpd of Marlim crude (API 19.6 and high Asphaltenes
content (2.9% w)) from Campos’s basis in Rio de Janeiro State, Brazil southeast. The crude preheat train has 25
heat exchangers.
2. Simulation Strategy
In this section, the simulation strategy used in FoulingTR will be briefly described. Figure 1 shows the preheat
train scheme. The crude enters the CDU and is splitted into three branches (1, 2 and 3). After going through
those heat exchangers, salt, sediments and water are removed in the two desalters.
2nd Mercosur Congress on Chemical Engineering
4th Mercosur Congress on Process Systems Engineering
3
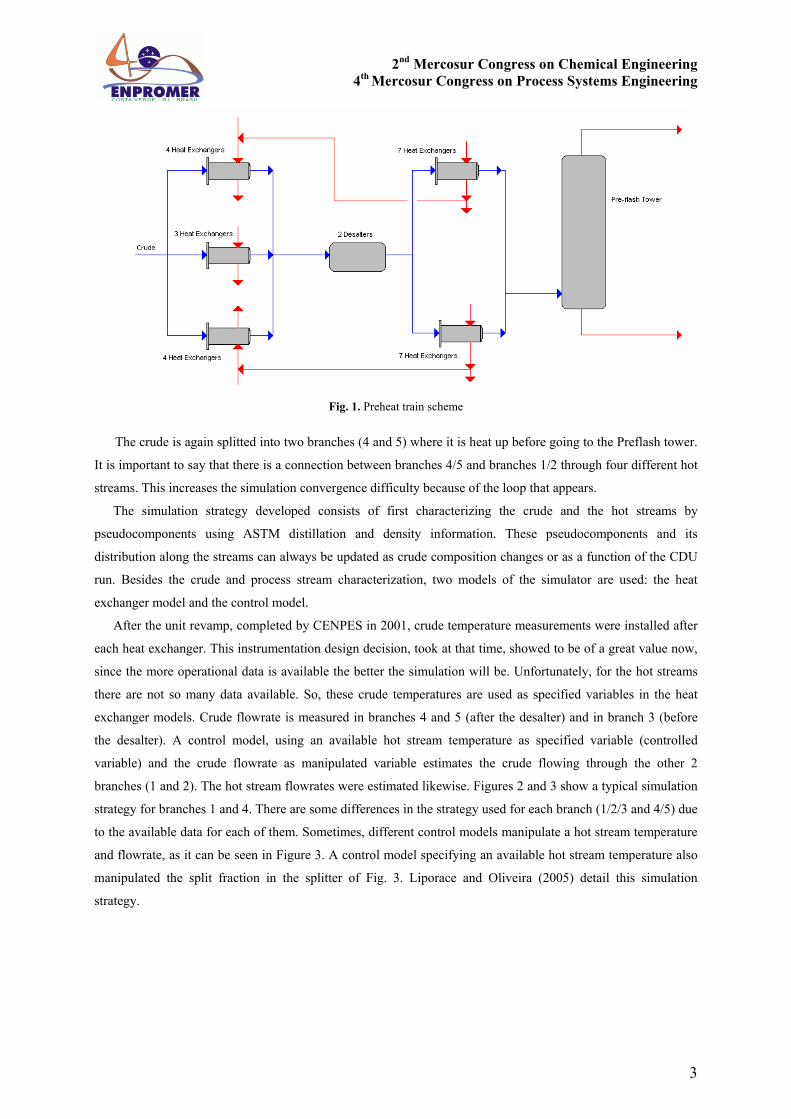
Fig. 1. Preheat train scheme
The crude is again splitted into two branches (4 and 5) where it is heat up before going to the Preflash tower.
It is important to say that there is a connection between branches 4/5 and branches 1/2 through four different hot
streams. This increases the simulation convergence difficulty because of the loop that appears.
The simulation strategy developed consists of first characterizing the crude and the hot streams by
pseudocomponents using ASTM distillation and density information. These pseudocomponents and its
distribution along the streams can always be updated as crude composition changes or as a function of the CDU
run. Besides the crude and process stream characterization, two models of the simulator are used: the heat
exchanger model and the control model.
After the unit revamp, completed by CENPES in 2001, crude temperature measurements were installed after
each heat exchanger. This instrumentation design decision, took at that time, showed to be of a great value now,
since the more operational data is available the better the simulation will be. Unfortunately, for the hot streams
there are not so many data available. So, these crude temperatures are used as specified variables in the heat
exchanger models. Crude flowrate is measured in branches 4 and 5 (after the desalter) and in branch 3 (before
the desalter). A control model, using an available hot stream temperature as specified variable (controlled
variable) and the crude flowrate as manipulated variable estimates the crude flowing through the other 2
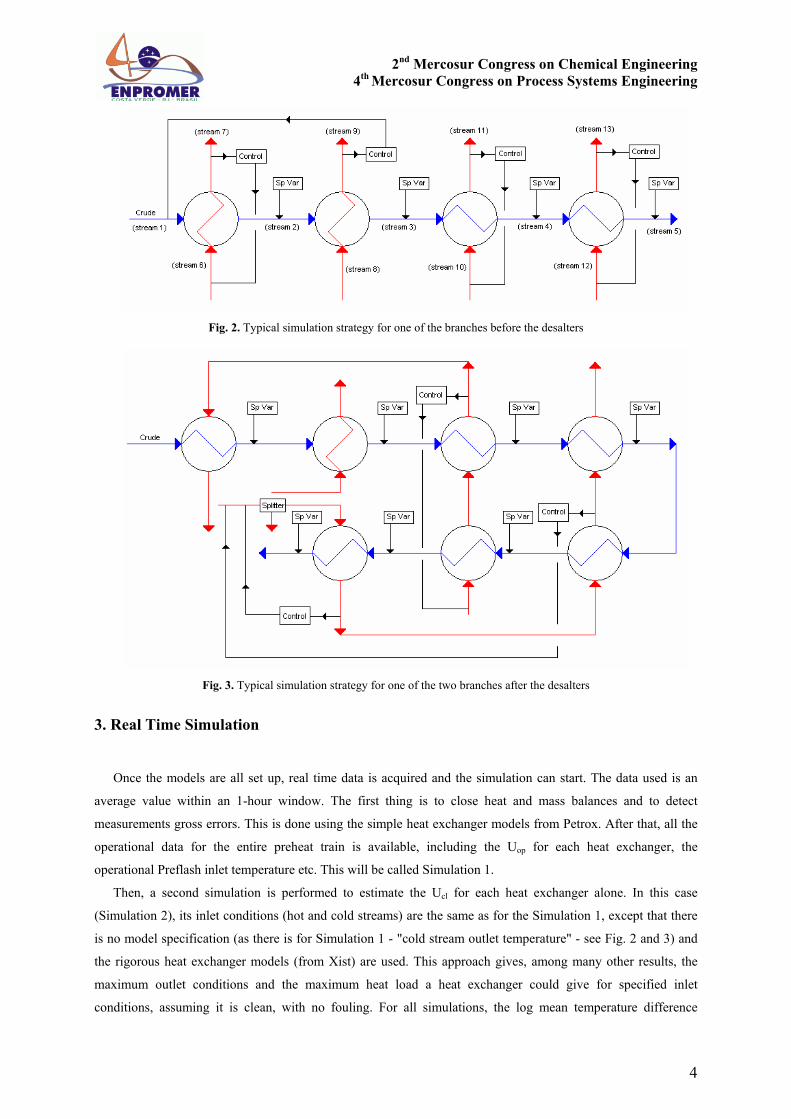
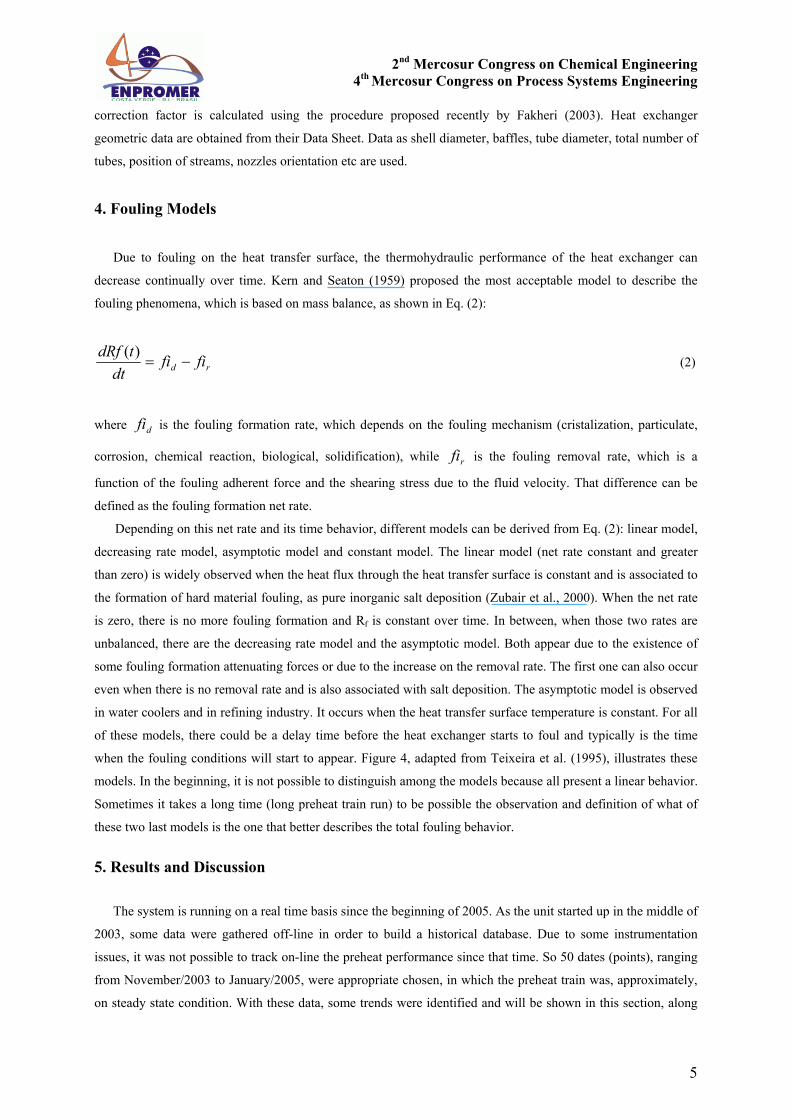
branches (1 and 2). The hot stream flowrates were estimated likewise. Figures 2 and 3 show a typical simulation
strategy for branches 1 and 4. There are some differences in the strategy used for each branch (1/2/3 and 4/5) due
to the available data for each of them. Sometimes, different control models manipulate a hot stream temperature
and flowrate, as it can be seen in Figure 3. A control model specifying an available hot stream temperature also
manipulated the split fraction in the splitter of Fig. 3. Liporace and Oliveira (2005) detail this simulation
strategy.
2nd Mercosur Congress on Chemical Engineering
4th Mercosur Congress on Process Systems Engineering
4
Fig. 2. Typical simulation strategy for one of the branches before the desalters
Fig. 3. Typical simulation strategy for one of the two branches after the desalters
3. Real Time Simulation
Once the models are all set up, real time data is acquired and the simulation can start. The data used is an
average value within an 1-hour window. The first thing is to close heat and mass balances and to detect
measurements gross errors. This is done using the simple heat exchanger models from Petrox. After that, all the
operational data for the entire preheat train is available, including the Uop for each heat exchanger, the
operational Preflash inlet temperature etc. This will be called Simulation 1.
Then, a second simulation is performed to estimate the Ucl for each heat exchanger alone. In this case
(Simulation 2), its inlet conditions (hot and cold streams) are the same as for the Simulation 1, except that there
is no model specification (as there is for Simulation 1 - "cold stream outlet temperature" - see Fig. 2 and 3) and
the rigorous heat exchanger models (from Xist) are used. This approach gives, among many other results, the
maximum outlet conditions and the maximum heat load a heat exchanger could give for specified inlet
conditions, assuming it is clean, with no fouling. For all simulations, the log mean temperature difference
2nd Mercosur Congress on Chemical Engineering
4th Mercosur Congress on Process Systems Engineering
5
correction factor is calculated using the procedure proposed recently by Fakheri (2003). Heat exchanger
geometric data are obtained from their Data Sheet. Data as shell diameter, baffles, tube diameter, total number of
tubes, position of streams, nozzles orientation etc are used.
4. Fouling Models
Due to fouling on the heat transfer surface, the thermohydraulic performance of the heat exchanger can
decrease continually over time. Kern and Seaton (1959) proposed the most acceptable model to describe the
fouling phenomena, which is based on mass balance, as shown in Eq. (2):
rd fifidt
tdRf−=
)( (2)
where dfi is the fouling formation rate, which depends on the fouling mechanism (cristalization, particulate,
corrosion, chemical reaction, biological, solidification), while rfi is the fouling removal rate, which is a
function of the fouling adherent force and the shearing stress due to the fluid velocity. That difference can be
defined as the fouling formation net rate.
Depending on this net rate and its time behavior, different models can be derived from Eq. (2): linear model,
decreasing rate model, asymptotic model and constant model. The linear model (net rate constant and greater
than zero) is widely observed when the heat flux through the heat transfer surface is constant and is associated to
the formation of hard material fouling, as pure inorganic salt deposition (Zubair et al., 2000). When the net rate
is zero, there is no more fouling formation and Rf is constant over time. In between, when those two rates are
unbalanced, there are the decreasing rate model and the asymptotic model. Both appear due to the existence of
some fouling formation attenuating forces or due to the increase on the removal rate. The first one can also occur
even when there is no removal rate and is also associated with salt deposition. The asymptotic model is observed
in water coolers and in refining industry. It occurs when the heat transfer surface temperature is constant. For all
of these models, there could be a delay time before the heat exchanger starts to foul and typically is the time
when the fouling conditions will start to appear. Figure 4, adapted from Teixeira et al. (1995), illustrates these
models. In the beginning, it is not possible to distinguish among the models because all present a linear behavior.
Sometimes it takes a long time (long preheat train run) to be possible the observation and definition of what of
these two last models is the one that better describes the total fouling behavior.
5. Results and Discussion
The system is running on a real time basis since the beginning of 2005. As the unit started up in the middle of
2003, some data were gathered off-line in order to build a historical database. Due to some instrumentation
issues, it was not possible to track on-line the preheat performance since that time. So 50 dates (points), ranging
from November/2003 to January/2005, were appropriate chosen, in which the preheat train was, approximately,
on steady state condition. With these data, some trends were identified and will be shown in this section, along

2nd Mercosur Congress on Chemical Engineering
4th Mercosur Congress on Process Systems Engineering
6
Fig. 4. Fouling models
with the respective fouling models. For the purpose of this work, it was considered that the preheat train was in a
reference stage in November/2003, meaning that all Rf measured from that date on are deltas (differences), using
the Rf of November/2003 as a reference value (Rfo).
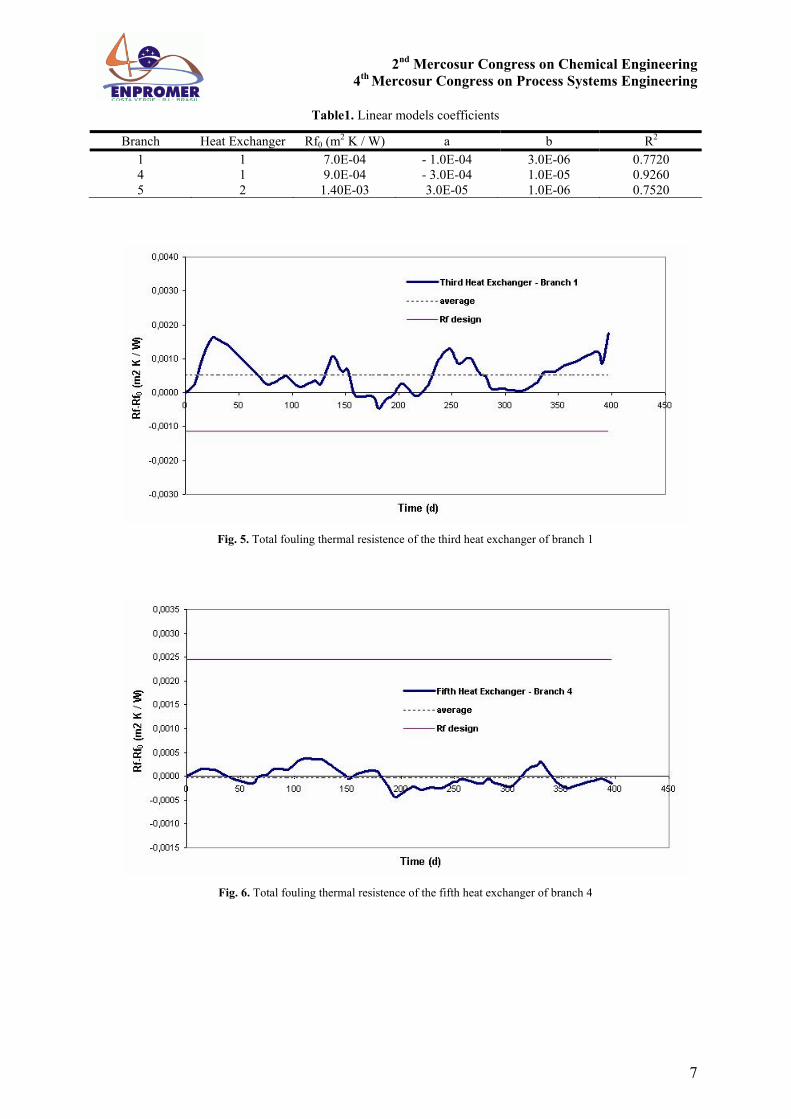
For a group of heat exchangers, it is observed that Rf has been constant, as shown in Figures 5 and 6, for two
examples. It can be noted that Rf varies around an average value. For the heat exchanger shown in Figure 6, it
can be assumed that the value of Rf is around Rfo and much lower than the assumed design Rf. The opposite
happens for the heat exchanger presented in Figure 5.
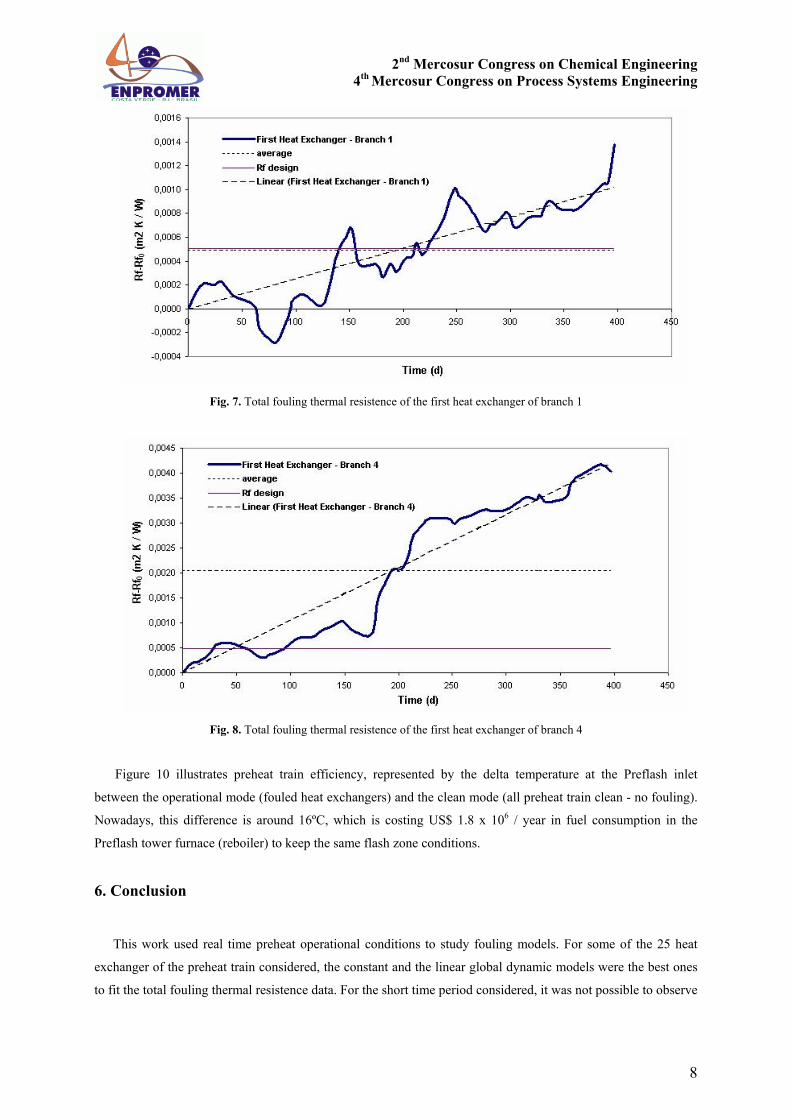
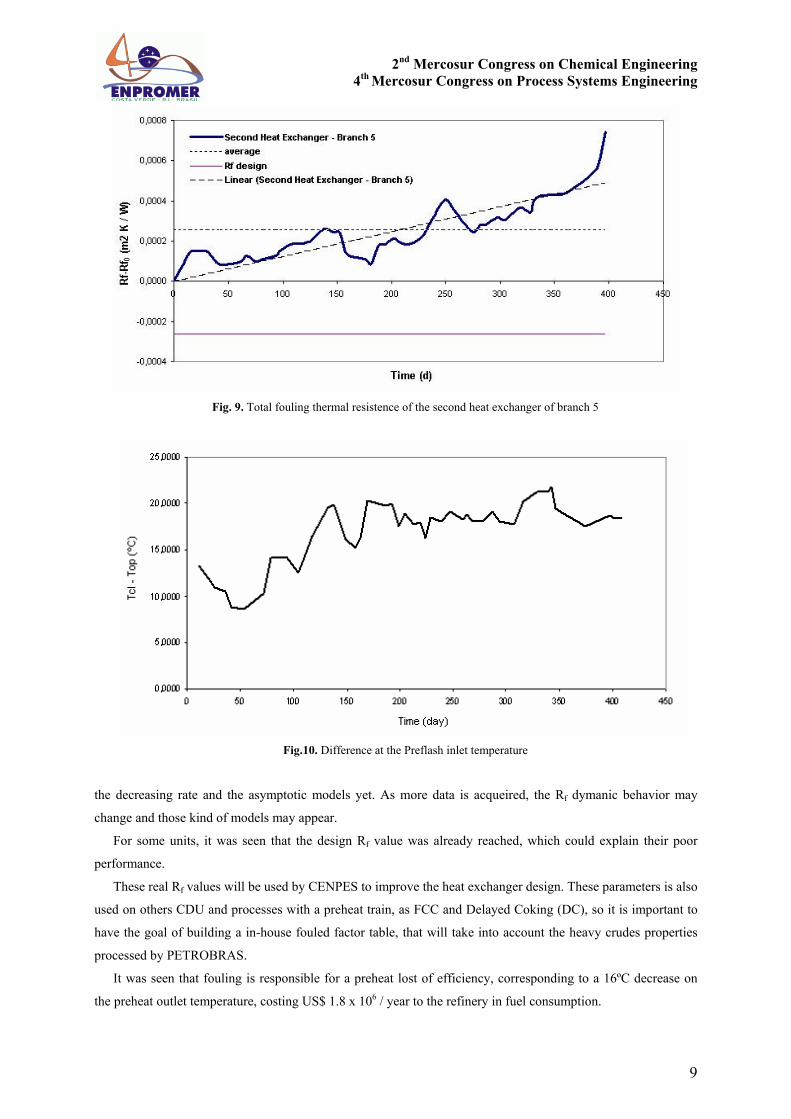
For some other heat exchangers, it was clearly observed a continuous increase on the fouling thermal
resistence. Figures 7, 8 and 9 show some examples. For all of them, the linear model was the best fit, although
Figure 7 shows a delay time (in the first three months) and Figure 9 appears to be better represented by an
exponential curve, which does not have a phenomenological background.
It is worthy to compare the real Rf with the one assumed in the heat exchanger design, which is a constant
value, taken from tables presented by TEMA, and does not always represent the PETROBRAS reality when
crude composition is to be considered. When designing a heat exchanger, it is supposed that the fouling dynamic
follows the asymptotic model and that the design Rf is the asymptotic value.
In the two examples with constant Rf, it is clear that the third heat exchanger of branch 1 is fouled and its
performance is poor. For the other three examples shown here, the asymptotic model was not observed, at least
for the time period considered (15 months), which unvalidate the usual design assumption of asymptotic
behavior when defining the Rf value to be used. Besides that, for all of them, the design Rf value was reached in
a short time, no longer than 8 months, and, for the second heat exchanger of branch 5 (Figure 9), it was reached
even before November/2003, a few months after the unit start up. All of this are indications that those units are
fouled, some heavily fouled, operating badly (low efficiency), their heat transfer surface was under estimated
and, as a consequence, are contributing for the preheat train lost of efficiency. All of these models will be
updated, since the continuous monitoring of the thermal resistence of the units will continue.
Table 1 presents the linear model coefficients for the three linear models presented here.
2nd Mercosur Congress on Chemical Engineering
4th Mercosur Congress on Process Systems Engineering
7
Table1. Linear models coefficients
Branch Heat Exchanger Rf0 (m2 K / W) a b R2 1 1 7.0E-04 - 1.0E-04 3.0E-06 0.7720 4 1 9.0E-04 - 3.0E-04 1.0E-05 0.9260 5 2 1.40E-03 3.0E-05 1.0E-06 0.7520
Fig. 5. Total fouling thermal resistence of the third heat exchanger of branch 1
Fig. 6. Total fouling thermal resistence of the fifth heat exchanger of branch 4
2nd Mercosur Congress on Chemical Engineering
4th Mercosur Congress on Process Systems Engineering
8
Fig. 7. Total fouling thermal resistence of the first heat exchanger of branch 1
Fig. 8. Total fouling thermal resistence of the first heat exchanger of branch 4
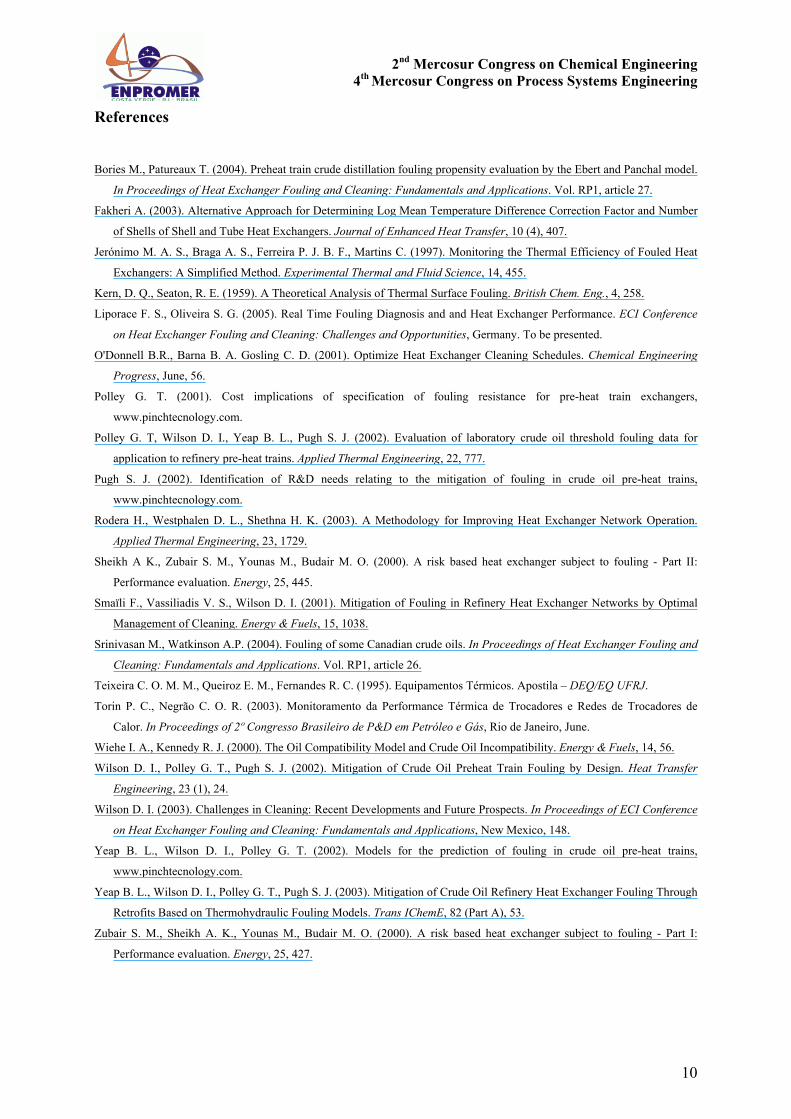
Figure 10 illustrates preheat train efficiency, represented by the delta temperature at the Preflash inlet
between the operational mode (fouled heat exchangers) and the clean mode (all preheat train clean - no fouling).
Nowadays, this difference is around 16ºC, which is costing US$ 1.8 x 10⁶ / year in fuel consumption in the
Preflash tower furnace (reboiler) to keep the same flash zone conditions.
6. Conclusion
This work used real time preheat operational conditions to study fouling models. For some of the 25 heat
exchanger of the preheat train considered, the constant and the linear global dynamic models were the best ones
to fit the total fouling thermal resistence data. For the short time period considered, it was not possible to observe
2nd Mercosur Congress on Chemical Engineering
4th Mercosur Congress on Process Systems Engineering
9
Fig. 9. Total fouling thermal resistence of the second heat exchanger of branch 5
Fig.10. Difference at the Preflash inlet temperature
the decreasing rate and the asymptotic models yet. As more data is acqueired, the Rf dymanic behavior may
change and those kind of models may appear.
For some units, it was seen that the design Rf value was already reached, which could explain their poor
performance.
These real Rf values will be used by CENPES to improve the heat exchanger design. These parameters is also
used on others CDU and processes with a preheat train, as FCC and Delayed Coking (DC), so it is important to
have the goal of building a in-house fouled factor table, that will take into account the heavy crudes properties
processed by PETROBRAS.
It was seen that fouling is responsible for a preheat lost of efficiency, corresponding to a 16ºC decrease on
the preheat outlet temperature, costing US$ 1.8 x 10⁶ / year to the refinery in fuel consumption.
2nd Mercosur Congress on Chemical Engineering
4th Mercosur Congress on Process Systems Engineering
10
References
Bories M., Patureaux T. (2004). Preheat train crude distillation fouling propensity evaluation by the Ebert and Panchal model.
In Proceedings of Heat Exchanger Fouling and Cleaning: Fundamentals and Applications. Vol. RP1, article 27.
Fakheri A. (2003). Alternative Approach for Determining Log Mean Temperature Difference Correction Factor and Number
of Shells of Shell and Tube Heat Exchangers. Journal of Enhanced Heat Transfer, 10 (4), 407.
Jerónimo M. A. S., Braga A. S., Ferreira P. J. B. F., Martins C. (1997). Monitoring the Thermal Efficiency of Fouled Heat
Exchangers: A Simplified Method. Experimental Thermal and Fluid Science, 14, 455.
Kern, D. Q., Seaton, R. E. (1959). A Theoretical Analysis of Thermal Surface Fouling. British Chem. Eng., 4, 258.
Liporace F. S., Oliveira S. G. (2005). Real Time Fouling Diagnosis and and Heat Exchanger Performance. ECI Conference
on Heat Exchanger Fouling and Cleaning: Challenges and Opportunities, Germany. To be presented.
O'Donnell B.R., Barna B. A. Gosling C. D. (2001). Optimize Heat Exchanger Cleaning Schedules. Chemical Engineering
Progress, June, 56.
Polley G. T. (2001). Cost implications of specification of fouling resistance for pre-heat train exchangers,
www.pinchtecnology.com.
Polley G. T, Wilson D. I., Yeap B. L., Pugh S. J. (2002). Evaluation of laboratory crude oil threshold fouling data for
application to refinery pre-heat trains. Applied Thermal Engineering, 22, 777.
Pugh S. J. (2002). Identification of R&D needs relating to the mitigation of fouling in crude oil pre-heat trains,
www.pinchtecnology.com.
Rodera H., Westphalen D. L., Shethna H. K. (2003). A Methodology for Improving Heat Exchanger Network Operation.
Applied Thermal Engineering, 23, 1729.
Sheikh A K., Zubair S. M., Younas M., Budair M. O. (2000). A risk based heat exchanger subject to fouling - Part II:
Performance evaluation. Energy, 25, 445.
Smaïli F., Vassiliadis V. S., Wilson D. I. (2001). Mitigation of Fouling in Refinery Heat Exchanger Networks by Optimal
Management of Cleaning. Energy & Fuels, 15, 1038.
Srinivasan M., Watkinson A.P. (2004). Fouling of some Canadian crude oils. In Proceedings of Heat Exchanger Fouling and
Cleaning: Fundamentals and Applications. Vol. RP1, article 26.
Teixeira C. O. M. M., Queiroz E. M., Fernandes R. C. (1995). Equipamentos Térmicos. Apostila – DEQ/EQ UFRJ.
Torin P. C., Negrão C. O. R. (2003). Monitoramento da Performance Térmica de Trocadores e Redes de Trocadores de
Calor. In Proceedings of 2º Congresso Brasileiro de P&D em Petróleo e Gás, Rio de Janeiro, June.
Wiehe I. A., Kennedy R. J. (2000). The Oil Compatibility Model and Crude Oil Incompatibility. Energy & Fuels, 14, 56.
Wilson D. I., Polley G. T., Pugh S. J. (2002). Mitigation of Crude Oil Preheat Train Fouling by Design. Heat Transfer
Engineering, 23 (1), 24.
Wilson D. I. (2003). Challenges in Cleaning: Recent Developments and Future Prospects. In Proceedings of ECI Conference
on Heat Exchanger Fouling and Cleaning: Fundamentals and Applications, New Mexico, 148.
Yeap B. L., Wilson D. I., Polley G. T. (2002). Models for the prediction of fouling in crude oil pre-heat trains,
www.pinchtecnology.com.
Yeap B. L., Wilson D. I., Polley G. T., Pugh S. J. (2003). Mitigation of Crude Oil Refinery Heat Exchanger Fouling Through
Retrofits Based on Thermohydraulic Fouling Models. Trans IChemE, 82 (Part A), 53.
Zubair S. M., Sheikh A. K., Younas M., Budair M. O. (2000). A risk based heat exchanger subject to fouling - Part I:
Performance evaluation. Energy, 25, 427.
Copyright © 2022 FDOKUMEN