Crossflow microfiltration of passion fruit juice after partial enzymatic liquefaction
Upload
independentCategory
view
1download
0
E L S E V I E R Journal of Membrane Science 101 (1995) 153-165
journal of MEMBRANE
SCIENCE
Steps of membrane blocking in flux decline during protein microfiltration
W.R. Bowen a, J.I. Calvo b, A. Hermindez b,. a Dept. of Chem. Eng., University of Wales, Swansea SA2 8PP, United Kingdom b Depto. Fisica Aplicada 11, Universidad de Valladolid, VaUadolid 47071, Spain
Received 6 June 1994; revised 8 November 1994; accepted 15 November 1994
Abstract
The flow decline is studied in typical experiments with dead-end microfiltration of BSA solutions ( 1 and 0.1 kg/m 3) through Cyclopore ~ track-etched polycarbonate membranes (pore sizes 0.1, 0.2, 0,4 and 1.0 p.m) at pH 5 and with a saline content of NaC1 0.01 M. Results are examined, within the frame of the common blocking mechanisms, interpreted here as successive or simultaneous steps of flow decline rather than as alternative possibilities of theoretical modelling for experimental data.
An average deposited volume per unit of permeate volume is defined for the central steps of the flux decline, whose behaviour against the shear stress is studied. Under the conditions studied, an increase in shear stress results in a decrease in deposition, probably due to a reduction in protein-surface interaction times. The initial and final steps are also analyzed in terms of an early blockage of the smallest pores and a formation of a cake up to a limiting height, subsequently followed by the establishment of a final non zero flow.
Keywords: Microfiltration; Flux decline; Membrane blocking; Protein deposition; Shear stress
1. Introduction
Micro filtration of protein solutions is an increasingly used technique in the biotechnological industries. From a technological point of view, the interaction of proteins with microfiltration membranes is a very significant phenomenon, since that could lead to significant changes in the membrane performance.
Most studies have been devoted to analyze this phe- nomenon in ultrafiltration membranes [1 -12 ] , with less work focused on microfiltration membranes [ 9 ,12-16] . In all of them, a substantial decrease in the hydraulic permeabil i ty of the membranes has been reported when a protein solution is filtered. This
* Corresponding author.
0376-7388/95/$09.50 © 1995 Elsevier Science B.V. All rights reserved S S D I 0 3 7 6 - 7 3 8 8 ( 9 4 ) 0 0 2 9 5 - 9
decrease has been mainly linked to the irreversible binding of protein to the membrane. Properly speaking this cannot be seen as a pure process of adsorption on the pore walls, given that it implies an equilibrium phenomenon with partitioning of solute between a solu- tion and a surface. Although this is certainly present in ultrafiltration and microfiltration processes, there may be the additional influence of convection-induced dep- osition. We will therefore adopt the term deposition to describe the combined effects of adsorption and irre- versible accumulation of solute onto the membrane wall.
The process of deposition has been supposed to fol- low several different patterns. Some studies focus on the adsorption process only, analyzing the adsorption kinetics or obtaining the adsorption isotherms giving

154 W.R. Bowen et al . /Journal of Membrane Science 101 (1995) 153-165
the final adsorbed mass as a function of the adsorbent concentration. Both these kinds of adsorption studies are frequently performed in pure diffusion experiments [ 17,18 ]. Others describe the decline of the volume flow in terms of protein deposition assumed to follow dif- ferent theoretical hypothesis, generally known as membrane blocking models [ 15,19-21]. This will be the approach followed here.
Blocking filtration mechanisms were first studied by Hermans and Bredre, [22]. Gonsalves, [23], made a critical study of the physical models used to derive these laws. Grace [ 24] made a through analysis of the blocking mechanisms in relation to the performance of the filter media to be used, with particular reference to the 'standard blocking' process. Hermia [25] studied the so called 'intermediate blocking' mechanism which had previously been considered totally empirical. Finally, after the works of Shirato and coworkers, [ 26], extending the blocking mechanisms to the case of power-law non-newtonian fluids, Hermia, [27], revised all blocking mechanisms including 'complete blocking' and 'filter cake' ones and reformulated the four mechanisms in a common frame of power-law non-newtonian fluids.
Attending to the physical causes of these blocking mechanisms, posterior practice has given them more descriptive names that can be used alternatively to the original ones: pore blocking (complete blocking), direct adsorption (standard blocking), long term adsorption (intermediate blocking) and boundary layer resistance (cake filtration).
Usually, only one of these blocking mechanisms is assumed in order to analyze experimental results, fre- quently the standard blocking or the cake filtration ones. Nevertheless it seems reasonable to expect that, in a complete filtration experiment, a complex process of volume flow decline should be present in such a way that all or some of these blocking processes can act successively.
In effect, according to Tanny, [28], when a dynam- ical membrane is formed, three kinds of possible proc- esses can be distinguished leading to membranes of type I, type II or type III. The first possibility corre- sponds to a solute size, rs, greater than the mean pore of the membrane solid matrix, r, in this case the dynam- ical membrane is nothing but the concentration-polar- ization layer corresponding to total retention which is almost instantaneously established. On the other hand,
type III dynamical membranes are obtained when sol- ute and mean pore sizes are comparable, leading to an exponential decrease of the volume flow which could be caused by complete blocking as will be shown below. When r>>rs and/or r<rs dynamical mem- branes of type II are obtained with two distinguishable steps of long term adsorption and cake forming filtra- tion respectively.
Therefore the flow decline depends on the previous pore and molecule size distributions [ 29], because the membrane blocking process to be used relays on the ratio of the molecular size of the solute over the pore diameter. Then, it seems useful to study the flow decline with very regular membranes.
The aim of the present work is to describe in terms of the blocking mechanisms the successive steps in the loss of membrane permeability during dead-end micro- filtration of dilute BSA solutions through track-etched membranes. As we work with relatively dilute solu- tions, we will assume a newtonian behaviour of the fluid.
2. Theory
In this section a summary description of the assump- tions included and conclusions reached by the usual, theoretical models for the flow decline is given.
2.1. Complete blocking
If it is assumed that each particle arriving to the membrane participates in blocking some pore or pores with no superposition of particles, we have the so called 'complete blocking' phenomenon. It leads to a time law for the volume flow which is given by:
Jr( t ) = Jr(O) e -At (1)
where A is
A = K a u o (2)
where KA is the membrane surface blocked per unit of total volume permeated through the membrane and Uo is the mean initial velocity of the filtrate
Jr(O) Uo = - - (3)
Ao

W.R. Bowen et al. / Journal of Membrane Science 101 (1995) 153-165 155
with Ao the porous surface of the membrane. The predicted time evolution of the total permeate
volume is:
J~(0) V(t) = ~ [ 1 - e -At] (4)
A
While there should exist a relation between the volume second and first derivatives of t, given by
= A " "(dt /2 ( 5 ) det dV 2 \dV]
this relation can be called the characteristic equation of the blocking process for the complete blocking phe- nomenon.
2.2. Standard blocking
pores or it can also directly block some membrane area, the resulting model corresponds to the so called 'inter- mediate blocking' phenomenon. In this case, the cor- responding volume flow versus time law is:
Jr(O) Jr(t) = - - (10)
(1 + At)
Whereas the estimated time evolution of the total permeate volume is:
Jv(O) V(t) = ~ l n (1 + At) (11)
A
Hence, the characteristic equation should be:
d V 2 Jr(O) (12)
It is possible that each particle arriving to the membrane was deposited onto the internal pore walls leading to a decrease in the pore volume. Moreover, if the membrane is supposed to consist in a set of equal cylindrical pores we have the so called 'standard block- ing' phenomenon. In this case, the time dependency of volume flow is given by:
Jv(O) Jr(t) = (1 + Bt) z (6)
where B is
B = KB Uo ( 7 )
where K8 is the decrease in the cross section area of the pores (due to adsorption on the pore walls) per unit of total permeate volume.
The predicted time evolution of the total permeate volume is:
Jr(O) t V(t) - - - (8)
l + B t
While the characteristic equation of the blocking proc- ess should be:
d2t 2B ( dt13/2 d V2 ~ k - ~ ] (9)
2.3. Intermediate blocking
By presuming that each particle can settle on other particle previously arrived and already blocking some
2.4. Cake filtration
Finally, it can be admitted that each particle locates on others already arrived and already blocking some pores and there is no room for directly obstructing some membrane area. In such a way, we have the so called 'cake filtration' phenomenon. In this case, the time law for the volume flow is given by:
Jv(0) Jr(t) (13)
~/1 + Ct
where C is
C = (2Rr) Kcu o (14)
being 1/Kc the total permeate volume per unit of membrane area (which coincides with the area of deposited cake) and Rr the hydraulic resistance of the cake divided by the resistance of the initial or clean membrane, (Rr = R¢/Ro).
The time evolution of the total permeate volume is given by:
2 Jr(O) V(t) = ~ [gel + Ct - 1 1 (15)
C
Now the characteristic equation of the blocking proc- ess is:
d2t C (d t t ° dV 2 2~v(O) \dVl (16)

156 W.R. Bowen et al. / Journal of Membrane Science 101 (1995) 153-165
llm (A) (c)
(B) (D)
Fig. 1. Schematic drawing of the fouling mechanisms assumed: (A) complete blocking, (B) standard blocking, (C) intermediate block- ing and (D) cake filtration.
2.5. General pattern of the characteristic equations
In Fig. 1 a schematic description of the membrane blocking mechanisms outlined is shown.
In the preceding paragraphs it has been seen that for all the customary blocking models there is a common shape for the characteristic equation, which is
dZt ( d t ] ~ (17) d g 2 = Ot kdV]
with values of a and/3 as given in Table 1. Note that /3 decreases from 2 to 0 while a is proportional to powers of Uo decreasing from 1 to - 1 and powers of Ao also decreasing from 0 to - 2.
Table 1 Parameters of the blocking filtration laws for constant applied pres- sure
Complete Kauo 2 Standard ( 2KB/A~/2 ) u~/2 3/2 Intermediate K a / Ao 1 Cake ( R~Kc/A 2o ) Uo i 0
In any case, see equations ( 1 ), (6), (10) and (13), it is assumed that a zero Jv.~ should be reached. If a finite volume flow for t = ~ is found, this term should be added to the right hand of flow vs. time equations [11].
3. Experimental
Cyclopore ® microfiltration membranes from What- man ® have been used. These filters consist in a thin sheet of polycarbonate crossed by almost cylindrical capillary and parallel pores obtained by sensibilization of the raw sheets immersed in a polarized beam of heavy ions, produced by an special radiofrequency source and accelerated by a high energy cyclotron. These high speed ions create tracks of molecular dam- age, along which the pores are opened by a precision- controlled ultraviolet exposure and chemical etching process.
Therefore, they are commonly regarded as very reg- ular capillary pore membranes. It makes them specially suitable for testing theoretical models. Four pore sizes will be considered, with nominal pore diameters: 0.1 /zm (C01), 0.2/~m (C02), 0.4/zm (C04) and 1.0/zm (C10). Some other nominal characteristics of these membranes are given in Table 2.
Bovine serum albumin was obtained from Sigma ® Chemical Co. (grade A7638). This was prepared from fraction V (A4503) of 96-99% purity, then crystal- lized and lyophilized. The final product contained less than 1% globulin as measured by agarose electropho- resis. All other chemicals were analytical grade from Fisons ~.
Concentrations of BSA of 1 kg /m 3 and 0.1 kg /m 3 were used. All measurements were made in 0.01M NaC1 solutions at pH 5.0 _ 0.1 regulated by addition of small amounts of NaOH and/or HC1. Protein concen- trations were measured using the BCA assay (Bicin- chonionic acid, Pierce ®) that, after 24 h, has a typical sensitivity of a 0.02 AU (adsorbance units)//zg.
Permeation measurements were carried out using a 10 ml batch dead-end filtration cell (Amicon ® Co., model 8081) connected to a solution reservoir (maxi- mum capacity 1.01). The effective membrane area was 3.8 cm 2. The system was pressurized with nitrogen and pressure was controlled with a pressure valve and meas- ured by a pressure transductor with an accuracy of
W.R. Bowen et al. / Journal of Membrane Science 101 (1995) 153-165
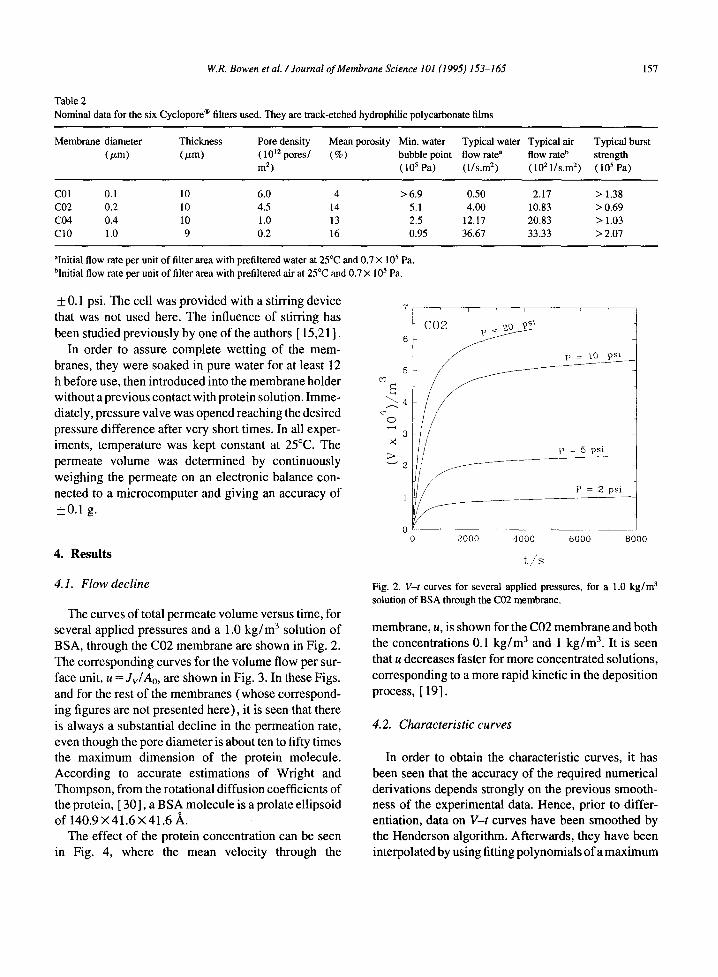
Table 2 Nominal data for the six Cyclopore ® filters used. They are track-etched hydrophilic polycarbonate films
157
Membrane diameter Thickness Pore density Mean porosity Min. water (/xm) ( ~ m ) ( 1012 pores/ (%) bubble point
m 2) ( 105 Pa)
Typical water Typical air flow rate a flow rate b ( l / s .m 2) ( 102 l / s .m 2)
Typical burst strength ( 105 Pa)
C01 0.1 10 6.0 4 >6 .9 C02 0.2 10 4.5 14 5.1 C04 0.4 10 1.0 13 2.5 C10 1.0 9 0.2 16 0.95
0.50 2.17 > 1.38 4.00 10.83 > 0.69
12.17 20.83 > 1.03 36.67 33.33 > 2.07
aInitial flow rate per unit of filter area with prefiltered water at 25°C and 0.7 X 10⁵ Pa. blnitial flow rate per unit of filter area with prefiltered air at 25°C and 0.7 × 10⁵ Pa.
+ 0.1 psi. The cell was provided with a stirring device that was not used here. The influence of stirring has been studied previously by one of the authors [ 15,21 ].
In order to assure complete wetting of the mem- branes, they were soaked in pure water for at least 12 h before use, then introduced into the membrane holder without a previous contact with protein solution. Imme- diately, pressure valve was opened reaching the desired pressure difference after very short times. In all exper- iments, temperature was kept constant at 25°C. The permeate volume was determined by continuously weighing the permeate on an electronic balance con- nected to a microcomputer and giving an accuracy of _0.1 g.
4. Results
4.1. Flow decline
The curves of total permeate volume versus time, for several applied pressures and a 1.0 kg /m 3 solution of BSA, through the C02 membrane are shown in Fig. 2. The corresponding curves for the volume flow per sur- face unit, u = Jv/Ao, are shown in Fig. 3. In these Figs. and for the rest of the membranes (whose correspond- ing figures are not presented here), it is seen that there is always a substantial decline in the permeation rate, even though the pore diameter is about ten to fifty times the maximum dimension of the protein molecule. According to accurate estimations of Wright and Thompson, from the rotational diffusion coefficients of the protein, [ 30], a BSA molecule is a prolate ellipsoid of 140.9 X41.6 × 41.6 ,~.
The effect of the protein concentration can be seen in Fig. 4, where the mean velocity through the
5 Ce~
~ 4
0 ,,---t
3 x > ~ 2
I ' CO2 ~ zo ps~
6 v ~
p = i0 psi
p = 5 psi
/ f P = 2 psi
1
0 - - i i i 0 2000 4000 6000 8000
t , / s
Fig. 2. V-t curves for several applied pressures, for a 1.0 k g / m 3 solution of BSA through the C02 membrane.
membrane, u, is shown for the C02 membrane and both the concentrations 0.1 kg /m 3 and 1 kg /m 3. It is seen that u decreases faster for more concentrated solutions, corresponding to a more rapid kinetic in the deposition process, [ 19].
4.2. Characteristic curves
In order to obtain the characteristic curves, it has been seen that the accuracy of the required numerical derivations depends strongly on the previous smooth- ness of the experimental data. Hence, prior to differ- entiation, data on V- t curves have been smoothed by the Henderson algorithm. Afterwards, they have been interpolated by using fitting polynomials of a maximum
158 W.R. Bowen et al./Journal of Membrane Science 101 (1995) 153-165
5O
I ~30
0
N 20
10
0 0
i
C02
o P - 20 psi
v P - 10 psi [] P - 5 psi
zx p = 2 psi
k.__ 1000 2000 3000 4000
t /s
Fig. 3. Mean velocity of filtration vs. time for several applied pres-
sures, for a 1.0 k g / m 3 solution of BSA through the C02 membrane.
6
E
O 4
. 2
-- i i i
C02 P = 2 p s i
~ l o C(BSA)= 0.1 k g / m a] C(BSA) 1.0 k g / m a
% %
\ 0
2000 4000 6000 ,000
t /s
Fig. 4. Mean velocity o f filtration vs. time for an applied pressure of 2 psi, for BSA solutions of concentrations 1.0 k g / m ~ and a 0.1 kg /
m 3 through the C02 membrane.
degree of ten. These interpolations have been made, when necessary, by zones in order to assure an accurate fitting to the original data. Finally, the resulting smoothed and interpolated data have been numerically differentiated twice by using forward, backward and central finite differences with values taken at 7 points
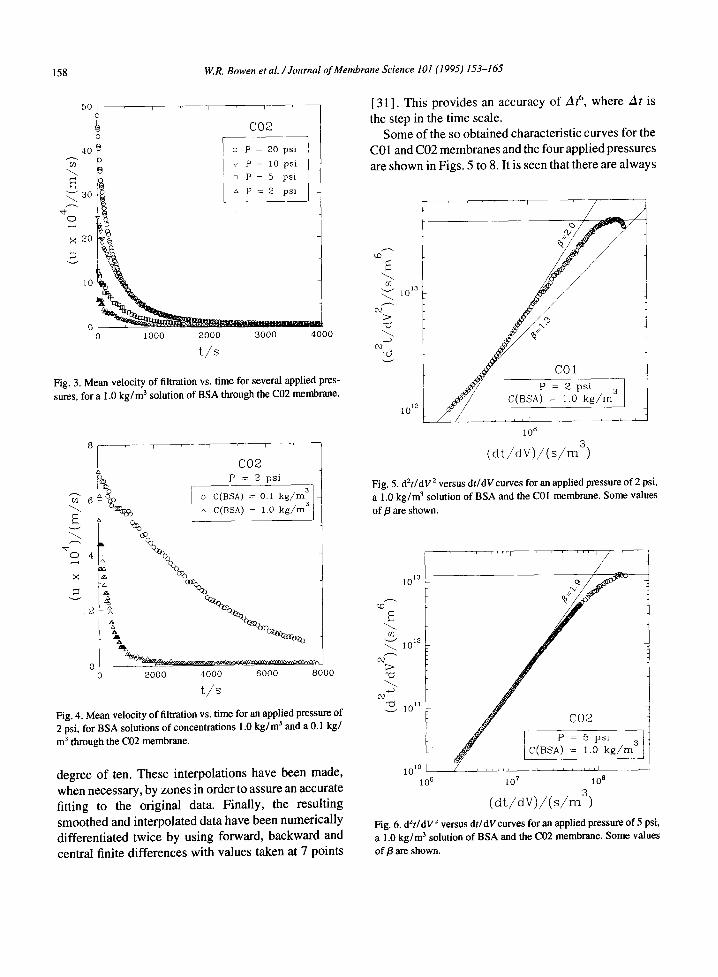
[3 l ] . This provides an accuracy of At 6, where At is the step in the time scale.
Some of the so obtained characteristic curves for the C01 and C02 membranes and the four applied pressures are shown in Figs. 5 to 8. It is seen that there are always
10 la
;>
p,l
1012
CO1 .. I P - Z p s i ~
10 8
( d t / d V ) / ( s / r n 3)
Fig. 5. d2t/dV 2 versus dt/dVcurves for an applied pressure o f 2 psi, a 1.0 k g / m 3 solution of BSA and the C01 membrane. Some values
of/3 are shown.
' ' . . . . . . i ' ' . . . . " ~ ' '
/ 1013 ~
1012
;> ~J
(N~ -*-a ~,~ 1011
~ ' C02
[c(Bs,) = ,.~ ~ / m 101° , / L J~ ,,I , , , , , , ~ , 1 *
10 6 10 7 tO 8
( d t / d V ) / ( s / r n 3)
Fig. 6. d~t/dV ~ versus dtldVcurves for an applied pressure o f 5 psi, a 1.0 k g / m 3 solution of BSA and the C02 membrane. Some values
of/3 are shown.

W.R. Bowen et al. /Journal of Membrane Science 101 (1995) 153-165 159
Fig. 7. d*l/dV* versus dtldV curves for an applied pressure of 10 psi, a 1.0 kg/m3 solution of BSA and the CO1 membrane. Some values of p are shown.
successive steps in membrane blocking with different values of LY and p. Usually values of p close to 2 are obtained for the initial steps. This value decreases more or less monotonously until /I = 0. These consecutive steps in the process should correspond to the following phases: (i) In the initial moments of the blocking proc- ess, the smallest pores are blocked by all particles arriv- ing to he membrane; that, attending to the distributions of pore sizes for the Cyclopore membranes and of BSA molecular radii, should be possibly aggregates formed due to shear stress in the pore entrances and to liquid- air interfaces; (ii) Then the inner surfaces of bigger pores start to be covered; (iii) Afterwards, some par- ticles cover other pre-existing already arrived particles while others directly block some of the pores; (iv) Finally a cake starts to be built.
Curves 5 to 8 show that the four phases are not clearly separated in different time scales, possibly because the pore size distributions are wide enough to have always some BSA molecules blocking part of the pores while others are covering the inner surfaces of bigger pores, or being deposited on molecules already blocking smaller pores.
We have some cases where a complete blocking mechanism is followed by an standard process and again a complete mechanisms appears, see for example
Figs. 7 and 8. Actually for most of the cases, these phenomena appear very difficult to separate from the complex mixture of all the phenomena, except for the cake filtration that appears only transiently for very long experiments (around 30 min for CO1 and 1 h 30 min for CO2 with an applied pressure of 20 psi and smaller durations for decreasing applied pressures) and without a significative plateau in the characteristic curves.
In any case, p = 312, can be a good approximation, if wide distributions of pore sizes are present. In effect, due to the relative wideness of the pore size distribu- tions, during most of the central time raxges, there should be many pores having their inner surfaces cov- ered. Therefore, in order to describe quantitatively the whole process, the standard mechanism can be used.
4.3. Shear stress and deposited volumes
As already mentioned, the decrease of permeation rate with time can be explained in terms of an adsorp- tion and deposition of protein molecules on the pore walls. For this purpose an average deposition level that could be correlated with operation parameters is defined.
Within the frame of the standard blocking model, we can define:
I ““” / /,/’ ”
Ii Fig. 8. d*tldV’ versus dt/dV curves for an applied pressure of 20 psi, a 1.0 kg/m3 solution of BSA and the CO2 membrane. Some values of /3 are shown.

160 W.R. Bowen et al. /Journal of Membrane Science 101 (1995) 153-165
W = K~L (18)
where L is the membrane thickness. Therefore, accord- ing to the previous definition of KB, Eq. (18) means that Wis the adsorbed volume per unit of total permeate volume.
W can be obtained from Fig. 3, by fitting data to Eq. (6), where Wis related withB by Eqs. (7) and (18):
B L W = - - (19)
U0
that allows to write Eq. (6) as:
( ~ f / 2 = 1 + WU°tL (20)
Similarly the inverse of the total permeate volume is linearly related with the inverse of time, i.e., according to Eqs. (3), (8) and (19):
Ao W 1 - - - + ( 2 1 ) V( t) L Uot
Both the Eqs. (20) and (21) can be used in order to obtain W. Eq. (21) is plotted for the C02 membrane in Fig. 9. It is seen that accordance is not perfect as already noted in Figs. 5 to 8. In any case, Eqs. (20) and (21) define a certain average value of W. The lack of accor- dance is due to the inadequacy of assuming that the
if3 I
E
14
12
10
C02
o P - 20 ps i v P - 10 ps i D P - 5 ps i a P - 2 ps i
/ /
" ~ 4 v
2
0 0.0 0.1 0.2 0.3 0.4
1 ( 1 / t ) / s
Fig . 9. 1/V versus 1/t for severa l appl ied pressures, wi th a B S A
so lu t ion o f 1,0 k g / m 3 and the C02 membrane .
10 -5
~J
~:1o 6
% \
i r . r
C02
C(BSA) 0.1 K g / m a
I I , ,I I , J
0 5 10 15 20 25
P / p s i
Fig. 10. The deposited volume per unit of permeate volume as a function of the applied pressure for the C02 membrane. The fitted curves are: log W = -4.77 - 9.79× 10 -2 P + 2.11 × 10 -3 p2for a BSA concentration of 1 kg/m 3, and log W = -5.92 - 1.12× 10 -2 P for a BSA concentration of 0.1 kg/m 3.
process of deposition is ruled by the standard blocking mechanism during all the time range.
The mean values of W, obtained following the out- lined method, decrease when P increases, for a constant pore radius (see Fig. 10). Likewise, for a constant pressure, they are inversely proportional to the pore radius (see Fig. 11). In effect, in Figs. 10 and 11, W is plotted against the applied pressure (for the C02 membrane and BSA concentrations of 0.1 and 1 kg/ m 3) and versus the pore radius (at a constant pressure of 20 psi for a concentration of 1 kg/m3). It is seen that the behaviour of W against P is more difficult to describe for the diluted solution than for the concen- trated one; W seems to be almost constant but the error bars are so big that nothing can be concluded from the representation in Fig. 10. In any case, W is smaller for a concentration 0.1 than for 1.0 k g / m 3, as foreseeable if it is taken into account that there are less BSA mol- ecules to form aggregates that could be deposited.
The observed dependencies suggest to check how W changes with the shear stress at the pore wall, that depends on both the pore radii and the applied pressures through:
Pr %, = - - ( 2 2 )
2L

W.R. Bowen et al. / Journal of Membrane Science 101 (1995) 153-165 161
10 -6
~3
10 -7
i i i
p =
\
J
20 psi
\ \ \ \
0 4 I I I
0 , 0 0 .1 0 . 2 0 . 3 0 . 5
r//~m
Fig. 11. The deposi ted vo lume per unit o f permeate volume as a
function o f the pore radii for an appl ied pressure o f 20 psi and a
concentra t ion o f 1.0 k g / m 3. Here, the fitted curve is: log W = -
5.72 - 3.56 r.
where r is the pore radius and P is the applied pressure. To obtain %, the central values of the simple pore distributions of r were used (as measured by computer analysis of SEM images, [32] ). The thickness of the membranes were measured by an interferometric method. These values of r and L are presented in Table 3. Finally, a plot of W against To, for a BSA concentra- tion of 1 kg /m 3 is shown in Fig. 12, showing a clear decrease of W with %.
4.4. Complete blocking and cake formation steps
The transition between different blocking models, is gradual and complex in the central steps. However, it can be approximated by an standard blocking process as mentioned above. Furthermore, it is possible to iden- tify the initial and final stages of the flux decline cor- responding to the complete blocking of the smallest pores and to the beginning of cake building, respec- tively.
Firstly, we can consider the initial steps of the filtra- tion process. As we already mentioned, this initial data should correspond to a complete blocking pattern. Then, in some of the Figs. 5 to 8 the asymptotical slope for t going to zero has been evaluated giving values of /3 close to 2 (see Eq. (17) ). These initial steps corre-
Table 3 Experimental pore radii and membrane thickness
Membrane C01 C02 C04 C10
r (p,m) 0.073 + 0 .084 -I- 0 .176 + 0.44 + 0.03
0.015 0.011 0.015
L (p,m) 10.48 J: 11.61 + 11.09 ± 10.93 +
0.13 0.15 0.12 0.08
spond to times less than 200 s; so short times are dif- ficult to isolate from the perturbations due to the manual opening of the valve to start each experiment (see for example Fig. 5). When it has been possible, the cor- responding values of a or A (see Eq. (5)) have been used to obtain KA according to Eq. (2).
In a similar way, we can obtain C if it exists a zone with zero slope in the corresponding characteristic curve. However, a cake is not totally built in any of the experiments, as there is not a plateau in the character- istic curves. On the contrary a maximum is reached for the longest experiments (see Figs. 5 and 7) followed by a fast decrease of the second derivatives, dZt/dV 2. This decrease should reveal the existence of a non zero limit flow, as discussed below. When it is possible to reach this maximum in the characteristic curves, RrK c can be obtained, according to Eq. (14).
, . . . . . i . . . . . . . . i ' '
10 _° i
10_6
1 0 7
i 10 e 10 a
T / P a
Fig. 12. The deposited volume per unit o f permeate volume as a
funct ion o f the shear stress on the wall for C01, C02, C04 and C10 with a concentrat ion o f 1.0 k g / m 3. The experimental points have
been fitted to: log W = - 5 . 3 0 + 0.99 log % - 0.45 ( log %.) 2
solid line and log W = - 2.59 - 1.28 log %, dashed line.

162 W.R. B o w e n et al. / Journa l o f M e m b r a n e Sc ience 101 (1995) 1 5 3 - 1 6 5
Table 4
Experimental values of KA and RrKc
Membrane P ( psi ) KA ( m - i ) RrKc ( m - 1 )
C01 2 9.35 640.95 5 7.27 652.76
10 - 171.40
20 3.17
C02 2 10.61 2286.74 5 3.84 2848.54
10 2.73 1779.03
20 2.11 1162.21 C04 20 0.07 -
The values of KA and RrKc are shown in Table 4. It is observed that KA decreases when P or r increases, while RrKc seems to decrease when P increases and to increase very steeply when r increases.
5. Discussion
Blocking filtration mechanisms for newtonian fluids have been analyzed. It has been shown that/3 decreases from 2 to 0. These consecutive steps in the whole proc- ess of membrane blocking can be explained in terms of the successive or simultaneous presence of the follow- ing stages: (i) The smallest pores are blocked by all particles
arriving to the membrane. (ii) The inner surfaces of bigger pores are covered. (iii) Some particles arriving to the membrane cover
other already arrived particles while others directly block some of the pores.
(iv) Finally a cake starts to be built. In practice, the four phases are superimposed,
because there is a more or less wide pore size distri- bution. If there was only a single pore size and the pore was greater than the molecule to be deposited, blocking should start with a standard process followed by a com- plete blocking, an intermediate and a cake filtration. While, if the molecule was much greater than the pore, it should start with a complete blocking followed by an intermediate and a cake filtration process. In our case, the size of the pores and the BSA molecules and/or their aggregates are wide enough to include significant numbers of pores smaller than some BSA particles, which leads to the appearance of complete blocking in the initial steps.
For the C02 membrane, a complete blocking process is followed in the initial steps. For C01 membrane and high pressures, the initial steps seem to consist in a mixture of standard and intermediate mechanisms. The inexistence of a clear complete blocking step is prob- ably due to the presence of a very low fraction of pores narrower than the mean one that should correspond to a very small fraction of the total flow and/or to the, already mentioned, small imprecisions due to the man- ual opening of the valve. These inaccuracies should be more significant for slowly decreasing fluxes as these found for high pressures and small pore radii. While, for both membranes, two consecutive steps of almost complete blocking are seen only for high pressures. This should correspond to long small pore tails in pore size distributions only revealed by high pressures.
For C01 membrane, the highest pressures corre- spond to a so slow blocking process that no initial steps are detected. Note that for C02 membrane the process is always faster than for the C01 membrane. Neverthe- less the cake is reached earlier for C01 than for C02, as already mentioned, according to the highest retentions that should be expected for C01 if the cake was per- manent instead of dynamic as it seems to be. In any case, the cake filtration is more quickly established for low pressures and the C01 membrane in correspon- dence to the higher retentions that should be expected in these conditions.
Referring to the averaged W versus shear stress behaviour it is observed that the deposited volume per unit of permeate volume decreases with the shear stress at the wall. The shear stress can influence the deposition level in two main ways. It could be expected that higher values of shear stress would imply less mean interaction times of protein molecules with pore surfaces and, thus, a lower deposition on the walls.
On the other hand, this deposition could be enhanced by the shear occurring on flow through the micropores, as it could result in some change in the protein structure or conformation which should increase the formation of aggregates. This shear process is considered very relevant in colloids [33], but its influence on protein conformation has not been demonstrated until now.
In our experimental conditions, we have a weak elec- trostatic interaction between the membrane wall and the protein (pH value near to the isoelectric point of the protein and weakly charged membrane) and a low natural tendency to form aggregates (relatively high

W.R. Bowen et al. /Journal of Membrane Science 101 (1995) 153-165 163
ionic strength). Therefore, the reduction of interaction time could be expected to be the main effect of an increase in the shear stress. In effect, it seems that the balance between the reduction of the mean interaction time and the increase of the additional formation of aggregates due to the presence of shear stress is dis- placed here to the first factor. While the BSA molecules are prone to interact with the membrane material (pol- ycarbonate) mainly due to hydrophobic and Van der Waals forces which are relatively unaffected by shear stress, [ 34 ].
As far as/Ca is concerned it seems that it follows a similar tendency against the shear stress. This agrees with the meaning of this parameter that also refers to the mass of BSA deposited, in this case, on the external surfaces of the membrane.
Certainly, only when the BSA coat has reached its maximal packaging, a cake should start to be built. A real cake, should lead to a total or at least appreciable retention of BSA. Nevertheless, no rejection has been observed for any of the four membranes used. How- ever, with no cake being built, it seems that for the last steps of filtration a zero slope is approached and passed to reach negative slopes, which is clearly shown for the C01 membrane.
This experimental behaviour is not foreseen by any of the filtration models customarily used. In fact it could be explained if a pin hole appeared, given that this should certainly imply a final non zero flow. This could be possible as far as the burst pressures (see Table 2) are approached. Nevertheless a so easy explanation has been discarded, given that careful experiments have been performed repeatedly without substantial changes in this behaviour. Nevertheless, a simple explanation can be formulated, taking into account the definition of C.
Effectively, only if C was a constant, the character- istic curve should be given by Eq. (16). But, according to Eq. (14), C should be a constant, only ifRr increases with time like Kc decreases. Kc is
Ao Kc = - - (23)
V
while Rr=Rc/Ro, leading to
C = AoRc Uo (24) VRo
Therefore, since Ao and Uo are constants for a given experiment, what we have is that Rc should increase at the same rate as V. In any case, if a dynamical situation has to be reached with no retention, the compactation and thickness of the cake must reach a maximum. After this limit, C decreases as the permeate volume still increases with time with decreasing flows (dV/dt) . Therefore dZt/dV 2 should decrease with dt /dV as seen in Fig. 7. On the other hand, given that in this case the limit flow should be not zero, a zero d2t/dV 2 might be reached for a finite dt/dV (a linear dependence of Von time should occur, equivalently a plateau in flow curves).
In any case, when the cake starts to be created, V should increase very slowly and it should be almost independent of the pore size, given that the cake covers most of the porous area. On the other hand, Rc should be almost constant for all the membranes if, as assumed, the cake has a unique compactation and thickness cor- responding to their maximal dynamic values. Thus the value of RrKc should depend on r as 1/R o which increases with the pore size, and on P as 1/V which decreases with pressure. These tendencies are, effec- tively, observed in Table 4.
6. List o f s y m b o l s
6.1. Roman
A constant of the complete and intermediate blocking laws ( s - ~)
Ao area of the clean membrane and the cake when formed (m 2)
B constant of the standard blocking law (s - 1 ) C constant of the cake filtration law ( s - ~ ) Jv volume flow (m3/s) Jv.= volume flow at infinite times (m3/s) KA blocked surface area of the membrane per unit
of permeate volume (m - l ) KB decrease in the cross section area of the pores
per unit of permeate volume ( m - 1 ) Kc area of the cake per unit of permeate volume
(m -1)
L membrane thickness (m) P applied pressure (Pa) r mean pore radius (m) rs mean solute radius (m)

164 W.R. Bowen et al. / Journal of Membrane Science 101 (1995) 153-165
g o Rc Rr
t u
Uo
V
W
Greek OL
[3
At
Zw
resistance of a clean membrane (m- ~) resistance of the cake ( m - 1 ) ratio of the cake resistance over the clean membrane resistance (dimensionless) time (s) mean velocity of the fluid through the membrane (m/s) initial mean velocity of the fluid through the membrane (m/s) total volume permeated through the membrane ( m 3)
v o l u m e d e p o s i t e d p e r f i l t e red v o l u m e un i t
( d i m e n s i o n l e s s )
multiplicative constant in the characteristic laws (s I - / 3 / m 6 - 3/3)
exponent in the characteristic law (dimensionless) time step (s) shear stress on the pore wall (Pa)
Acknowledgements
The Spanish authors would like to thank the 'Junta de Castilla y Le6n' for the financial support of this work through the research project VA37/93.
References
[ 1 ] J.A. Howell and O. Velicangil, Protein ultrafiltration: theory of membrane fouling and its treatment with immobilised proteases, in A.R. Cooper (Ed.), Ultrafiltration Membranes and Applications, Plenum Press, New York, 1980, p. 217.
[2] K.C. Ingham, T.F. Busby, Y. Sahlestrom and F. Castino, Separation of macromolecules by ultrafiltration: Influence of protein adsorption, protein-protein interactions and concentration polarisation, in A.R. Cooper (Ed.), Ultrafiltration Membranes and Applications, Plenum Press, New York, 1980, p. 141.
[3] J.L. Nilsson, Protein fouling of UF membranes: Causes and consequences, J. Membrane Sci., 52 (1980) 121.
[4] A.G. Fane, C.J.D. Fell and A. Suki, The effect ofpH and ionic environment on the ultrafiltration of protein solutions with retentive membranes, J. Membrane Sci., 16 (1983) 195.
[5] A.G. Fane, C.J.D. Fell and A.G. Waters, Ultrafiltration of protein solutions through partially permeable membranes - The effect of adsorption and solution environment, J. Membrane Sci., 16 (1983) 211.
[6] M.W. Chudacek and A.G. Fane, The dynamics of polarisation in unstirred and stirred ultrafiltration, J. Membrane Sci., 21 (1984) 145.
[7] T.B. Choe, P. Masse, A. Verdier and M.J. Clifton, Flux decline in batch ultrafiltration: Concentration polarization and cake formation, J. Membrane Sci., 26 (1986) 1.
[8] A.G. Abilnaour, H.A. Talaat, M.H. Sorour and S.R. Tewfik, Parametric evaluation of flux decline during ultrafiltration of protein solutions, J. Membrane Sci., 68 (1988) 35.
[9] W.S. Opong and A.L. Zidney, Hydraulic permeability of protein layers deposited during ultrafiltration, J. Colloid Interf. Sci., 142 ( 1991 ) 41.
[10] K.J. Kim, A.G. Fane, C.J.D. Fell and D.C. Joy, Fouling mechanisms of membranes during protein ultrafiltration, J. Membrane Sci., 68 (1992) 79.
[ 11 ] A. Koltuniewicz, Predicting permeate flux in ultrafiltration on the basis of surface renewal concept, J. Membrane Sci., 68 (1992) 107.
[ 12] G. Jonsson, P. Johansen and W. Li, Influence of membrane fouling on ultrafiltration and microfiltration processes, Proc. Eng. Membrane Processes, 13-15 May 1992, Garmish- Partenkirchen, Germany.
[ 13] W.D. Munch, L.P. Zestar and J.L. Anderson, Rejection of polyelectrolytes from microporous membranes, J. Membrane Sci., 5 (1979) 77.
[ 14] A.C.M. Franken, J.T.M. Sluys, V. Chen, A.G. Fane and C.J.D. Fell, Role of protein conformation on membrane characteristics, Proc. of the Fifth World Filtration Congress, Nice, Vol. 1, 1990, p. 207.
[15] W.R. Bowen and Q. Gan, Properties of microfiltration membranes: Flux loss during constant pressure permeation of bovine serum albumin, Biotechnol. Bioeng., 38 ( 1991 ) 688.
[ 16] S.T. Kelly, W. Senyo Opong and A.L. Zidney, The influence of protein aggregates on the fouling of microfiltration membranes during stirred cell filtration, J. Membrane Sci., 80 (1993) 175.
[17] E. Matthiasson, The role of macromolecular adsorption in fouling of ultrafiltration membranes, J. Membrane Sci., 16 (1983) 23.
[ 18] P. Langer and R. Schnabel, Porous-glass UF membranes in biotechnology, Proc. of the First Intern. Conf. Inorganic Membranes, Montpelier, 1988, p. 147.
[ 19] A. Suki, A.G. Fane and C.J.D. Fell, Flux decline in protein ultrafiltration, J. Membrane Sci., 21 (1984) 269.
[ 20 ] M.Y. Jaffrin, R. Ben Amar and B.B. Gupta, Membrane fouling control in cross-flow filtration of wine with mineral membranes, Int. Tech. Conf. on Membrane Separation Processes, 24-26 May, 1989, Brighton, UK.
[21] W.R. Bowen and Q. Gan, Properties of microfiltration membranes: The effects of adsorption and shear on the recovery of an enzyme, Biotechnol. Bioeng., 40 (1992) 491.
[22] P.H. Hermans and H.L. Bred~e, Zur Kenntnis der Filtrationsgesetze, Rec. Trav. Chim. des Pays-Bas, 54 (1935) 680.
[ 23 ] V.E. Gonsalves, A critical investigation on the viscose filtration process, Rec. Trav. Chim. des Pays-Bas, 69 (1950) 873.

W.R. Bowen et al. /Journal of Membrane Science 101 (1995) 153-165 165
[24] H.P. Grace, Structure and performance of filter media, AIChE. J.,2 (1956) 307.
[25] J. Hermia, Rev. Univ. Mines., 2 (1966) 45. [26] M. Shirato, T. Aragaki and E. Iritani, Blocking filtration laws
for filtration of power law non-newtonian fluids, Chem. Eng. J. (Japan), 12 (1979) 162.
[27] J. Hermia, Constant pressure blocking filtration laws - Application to power-law non-newtonian fluids, Trans. I, Chem. E., 60 (1982) 183.
[28] G.B. Tanny, Dynamic membranes in ultrafiltration and reverse osmosis, Sep. Purif. Methods, 7(2) (1978) 183.
[29] M. Meireles, P. Aimar and V. Sgmchez, Effects of protein fouling on the apparent pore size distribution of sieving membranes, J. Membrane Sci., 56 (1991) 13.
[ 30] T. Peters, Serum albumin, Adv. Protein Chem., 37 ( 1985 ) 161. [31 ] A. Constantinides, Applied Numerical Methods with Personal
Computers, Chemical Engineering Series, McGraw-Hill, 1987, New York, USA.
[32] J.I. Calvo, A. Hernfindez, G. Caruana and L. Martinez, Pore
size distributions in microporous membranes. I. Surface study of track-etched filters by image analysis, J. Colloid and Interface Sci., (1994) in press.
[ 33 ] G.R. Zeichner and W.R. Schowalter, Use of trajectory analysis to study stability of colloidal dispersions in flow fields, AIChE. J., 23 (1977) 243.
[34] C.J. Van Oss, Interfacial Forces in Aqueous Media, Marcel Dekker, 1994, New York, USA.
Copyright © 2022 FDOKUMEN