
Roughness Based Crossflow Transition Control: A Computational Assessment

Original article
The quality of orange juice processed by coupling
crossflow microfiltration and osmotic evaporation
Mady Cisse1,2, Fabrice Vaillant1,3, Ana Perez3, Manuel Dornier1,2* & Max Reynes1
1 Centre de Cooperation Internationale en Recherche Agronomique pour le Developpement (CIRAD), Tropical Fruits Dept.
(FLHOR), av. Agropolis, TA 50/PS4, 34398 Montpellier Cedex 5, France
2 Ecole Nationale Superieure des Industries Alimentaires (ENSIA), Tropical Food Dept. (SIARC), 1101 av. Agropolis, CS
24501, 34093 Montpellier Cedex 5, France
3 Centro Nacional de Ciencia y Tecnologıa de Alimentos (CITA), Universidad de Costa Rica, Codigo Postal 2060, San Jose,
Costa Rica
(Received 28 November 2003; Accepted in revised form 15 June 2004)
Summary Crossflow microfiltration (CFM) and osmotic evaporation (OE) were implemented on a
semi-industrial pilot scale to obtain clarified orange juice concentrates at 450 and
620 g kg)1 of total soluble solids. The characteristics of the juice were then assessed and
compared with fresh juice and commercial concentrates. With CFM, most aroma
compounds and vitamin C remained in the permeate while the more apolar compounds
such as terpenic hydrocarbons and carotenoids were strongly retained by the membrane.
With OE, significant losses of vitamin C and aroma compounds occurred at first, with
losses progressively decreasing during treatment. Pre-conditioning the membrane and cold
regeneration of the brine reduced losses drastically, with the aroma composition tending
towards that of the initial juice. The quality of pulp, a blend of the CFM retentate and OE
concentrate, was high and much closer to that of the initial fresh juice than to the
commercial thermal concentrate.
Keywords Clarification, concentration, integrated membrane process, juice quality, stabilization.
Introduction
The ability to concentrate is a primary requisite for
the fruit juice industry, principally for economic
reasons such as reduced transport and storage costs.
Nowadays, multi-stage vacuum evaporation (VE)
is the classical technology used in the industry.
However, this process always reduces the quality of
the juice. Temperatures higher than 50 �C degrade
sensorial characteristics, leading to a partial loss of
the fresh juice flavour, even when the evaporator is
equipped with an aroma recovery system.
In order to limit thermal damage, other proces-
ses that concentrate juices at low temperatures,
such as freeze concentration and membrane pro-
cesses have been developed (Ramteke et al., 1993;
Jariel et al., 1996), including those involving
osmotic evaporation (OE). Also called osmotic
distillation, OE is creating considerable interest
(Hogan et al., 1998; Girard & Fukumoto, 2000) in
that it concentrates juices by as much as
650 g kg)1 of total soluble solids (TSS) at ambient
temperatures. Because of the high viscosity of
pulpy juices, removing pulp before concentration
often significantly improves performance. The
potential of OE, particularly when coupled with
crossflow microfiltration (CFM) is thus very
attractive and should permit the preparation of
better-quality concentrates, both clarified and
pulpy, than those obtained by classical methods.
This integrated membrane process has already
been suggested for treating different pulpy juices
(Shaw et al., 2001; Vaillant et al., 2001 a; Rodri-
gues et al., 2004). Nevertheless, the literature has
little information on the product’s overall quality*Correspondent: Fax +33/4-67614433;
e-mail: [email protected]
International Journal of Food Science and Technology 2005, 40, 105–116 105
doi:10.1111/j.1365-2621.2004.00914.x
� 2005 Institute of Food Science and Technology Trust Fund

during processing on a semi-industrial scale. This
study aimed to characterize the effect of a coupled
membrane process on the quality of orange juice,
including its chemical composition, vitamin C
content, aroma compounds, and on its sensorial
characteristics. The intermediate products obtained
in the pilot plant after clarification by CFM and
concentration by OEwere also analysed. The pulpy
juice obtained from the membrane concentrate was
compared with a standard single-strength juice and
a vacuum-evaporated concentrate.
Material and methods
Raw materials
Frozen, single-strength, pasteurized, orange juice
(F) and frozen, vacuum-evaporated (VE), orange-
juice concentrate (CVE650) were provided by Ticofrut
S.A. (San Carlos, Costa Rica). Both were obtained
from oranges of the Valencia variety. The CVE650 was
a typical commercial frozen orange juice (FCOJ)
that had been concentrated to 650 g kg)1 TSS on
an industrial scale by a TASTE evaporator (Gulf
Machinery Co., Winter Haven, FL, USA), which
featured seven effects (the temperature of the first
effect was 80 �C) and an aroma recovery unit.
Clarification by CFM
Single-strength orange juice (F) was clarified,
using a CFM unit that featured a ceramic mem-
brane Membralox IP19–40 (Pall-Exekia, Bazet,
France) with an average pore diameter of 0.2 lmand a filtration area of 0.22 m2. All filtration trials
were conducted with the juice without prior
enzymatic treatment.
A continuous �feed and bleed� microfiltration
method was followed, as described elsewhere
(Vaillant et al., 2001b). When the set volumetric
reduction ratio (VRR) reached 3.5, the retentate
was removed continuously at a specific flowrate
that allowed the VRR to remain constant, while
fresh juice F was fed into the unit and permeate
(P) was collected. Crossflow velocity, transmem-
brane pressure and temperature were 7 m s)1,
400 kPa and 20 ± 2 �C, respectively. The perme-
ate (P), i.e. the clarified juice, was then stored
(<1 day) at 0 �C until its process by OE.
Concentrating the clarified juice by OE
The OE unit (Fig. 1) and the concentration
procedure were similar to those described by
Vaillant et al. (2001a) except that a brine evapo-
rator was not used. The pilot plant featured a
hydrophobic polypropylene hollow fibres mem-
brane with a total area of 10.2 m2 and an average
pore diameter of 0.2 lm. The juice to be concen-
trated circulated inside the hollow fibres at
0.2 m s)1. The juice loop had a hold-up volume
of 7.5 L. It was continuously fed with the clarified
juice and the concentrate was also extracted
continuously once the set TSS was reached.
Clarified juice
F
PT
P
T
Brine
Concentrated juice
Valve
Juice pump Brine pump
Mem
bran
a m
odul
e
Flow metre
Pre-filter
Support
CaCl2
Figure 1 Schematic of the pilot plant of osmotic evaporation used for concentration of orange juice.
Improving orange juice quality M. Cisse et al.106
International Journal of Food Science and Technology 2005, 40, 105–116 � 2005 Institute of Food Science and Technology Trust Fund

Calcium chloride solution circulated concur-
rently on the other side of the membrane at about
0.02 m s)1. Juice conductivity was always monit-
ored during concentration to ensure membrane
integrity and hydrophobicity, and to detect poss-
ible salt leakage through the membrane. During
the trials, CaCl2 crystals were added to maintain
the brine solution near saturation (at
5.5 mol L)1). The brine temperature was main-
tained between 30 and 33 �C.Pressure and temperature values at the inlet and
outlet of the membrane were registered with
pressure (±2%) and temperature gauges
(±1 �C). The feed flowrate was recorded with a
Krohne electromagnetic flow meter (Krohne
Messtechnik GmbH, Duisburg, Germany) to give
the average evaporation flux (Jw). At the end of
the trials, the dilute brine was recovered and
concentrated by heating until the salts crystallized.
The crystals were kept for reuse in further trials.
As previously suggested, to improve perform-
ance (Vaillant et al., 2001a), the concentration of
the clarified orange juice was carried out in two
stages: from initial TSS to 450 g kg)1 TSS,
obtaining the concentrate COE450 and then to
620 g kg)1 TSS, obtaining the final concentrate
COE620. The concentration loop was continuously fed
with the clarified juice (P) during the first stage
and with COE450 during the second stage. The
temperature of this loop was maintained at
26 ± 2 �C by feeding the unit with juice or
concentrate (450 g kg)1 TSS) at 6 ± 1 �C. The
cleaning procedure described in Vaillant et al.
(2001a) was followed, except that, after the alka-
line cleaning, an acidic step was implemented,
using a citric acid solution at 10 g kg)1. The
general processing set-up used in this study is
presented in Fig. 2.
Evaluating juice quality
We used standard methods to measure TSS
content, titratable acidity and density (AOAC,
1990), and suspended insoluble solids (SIS)
Single strength
orange juice F
Permeate P
Osmotic evaporation (OE)
(First stage, 450 g TSS kg–1)
Concentrate C450OE
Concentrate C620OE
Osmotic evaporation (OE)
(Second stage, 620 g TSS kg–1)
Blending
Thermal
pasteurization
Retentate (R)Crossflow microfiltration (CFM)
R + C620OE
Figure 2 General processing flow chart.
Improving orange juice quality M. Cisse et al. 107
� 2005 Institute of Food Science and Technology Trust Fund International Journal of Food Science and Technology 2005, 40, 105–116

(Vaillant et al., 2001a). Carotenoids were deter-
mined by spectrophotometry at 453 nm after
solvent extraction according to Taungbodhitham
et al. (1998). High-performance liquid chromatog-
raphy (HPLC) was used to determine vitamin C
level by adopting the methodology developed by
Kacem et al. (1986) and Brause et al. (2003).
Sucrose, glucose and fructose were also analysed
by HPLC according to the method of Englyst &
Cummings (1984). Results were expressed accord-
ing to TSS to make comparisons easier between
juices. Colour was analysed using a HunterLab
DP 9000 colorimeter (Hunter Associates Labora-
tory Inc., Reston, VA, USA) and data were
expressed as luminosity (L�), Hue angle (H�) andcolor purity (C�) calculated from the tristimulus
parameter L*, a*, b* as L� ¼ L*, H� ¼ tan)1 (b*/
a*) and C� ¼ (a*2 + b*2)1/2, respectively.
Viscosity was measured with an Oswald glass
capillary viscosimeter, and water activity with an
Aw-Meter AquaLab CS-2 (Decagon Devices Inc.,
Pullman, WA, USA).
We used gas chromatography to analyse aroma
compounds after carrying out quantitative liquid–
liquid extraction with dichloromethane on an
aliquot of 50 mL of juice (v/v, replicated three
times). Before extraction, 200 lg of two internal
standards were added to the juice. The extract was
dried using anhydrous sodium sulphate and even-
tually concentrated by VE at 25 �C to a volume of
0.5 mL before injection (1 lL). We used a Hewlett
Packard 5890 chromatograph (Hewlett Packard
Co., Palo Alto, CA, USA), with an HP-5 (cross-
linked 5% phenyl methyl siloxane) fused-silica
capillary column (30 m · 0.25 mm ·0.25 lm) and a mass spectrometer as the detector.
Helium was the carrier gas, flowing at
1 mL min)1.
Injector and detector temperatures were 250 and
280 �C, respectively. The oven’s initial tempera-
ture was 40 �C. It was raised to 220 �C at
6 �C min)1, then to 250 �C at 15 �C min)1 and
was maintained at 250 �C for 4 min. Injection was
splitless. Aroma compounds were identified on the
basis of linear retention index, Chemical Abstracts
Service (CAS) index number, and mass spectra.
Hexanol and ethyl benzoate GC grade (Aldrich,
Saint Quentin Fallavier, France) were chosen as
internal standards for compounds with retention
times below and above 18 min, respectively.
Response factors were taken as 1.0 for all
compounds with respect to the internal standards.
Sensorial tests used the triangular test method
with a panel of 25 highly trained orange-juice
tasters from Ticofrut S.A. Four descriptors were
chosen: aroma, taste, acidity and colour. First,
to evaluate the effect of the OE process on
sensorial quality, the clarified juice obtained
after microfiltration (P) was compared with
COE620 concentrate after dilution with distilled
water to the same TSS (115 g kg)1). Secondly,
to evaluate the effect of the overall integrated
process (CFM + OE) on sensory quality, single-
strength orange juice (F) was compared with the
clarified juice concentrate (COE620) reconstituted
with water and the microfiltration retentate (R)
previously pasteurized at 72 �C for 30 min.
Finally, this last reconstituted juice (R + COE620)
was compared with CVE650. Both concentrates were
evaluated at the same pulp content (SIS ¼80 g kg)1) and TSS (118 g kg)1).
Results and discussion
Clarification by CFM
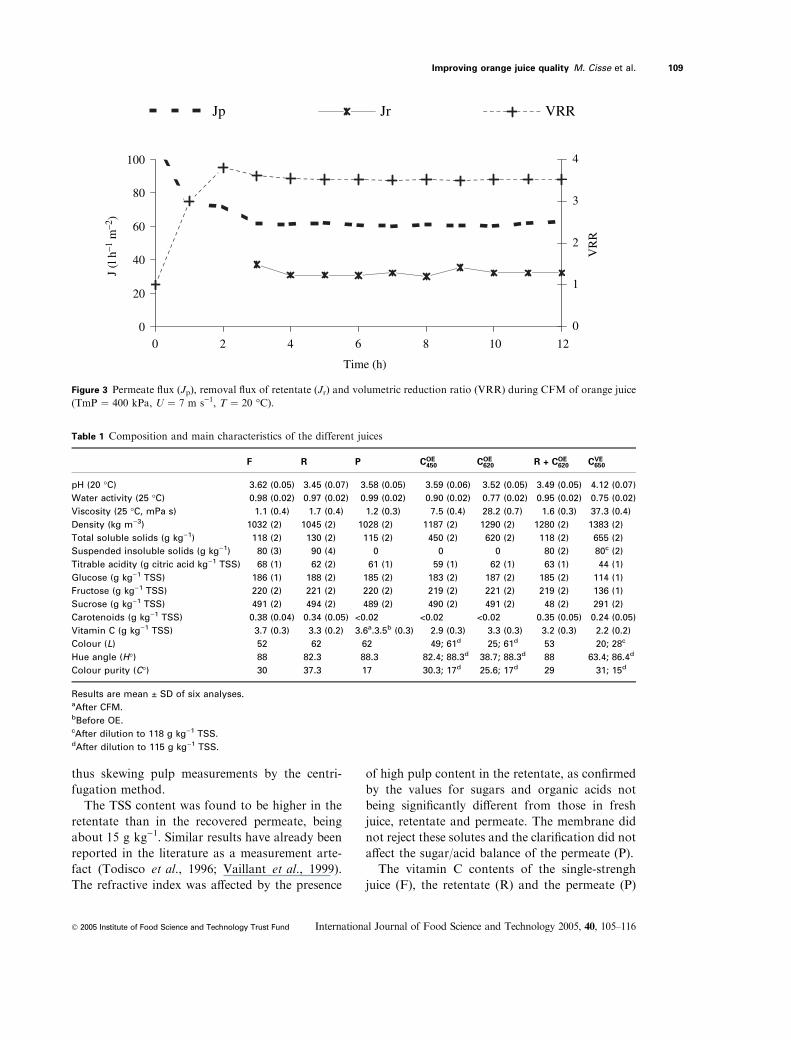
For the operating conditions chosen, the VRR, set
at 3.5, was reached after 2.5 h (Fig. 3). This VRR,
corresponding to a permeate production yield of
71.4% (w/w), was found to be the optimum for
orange juice because flux density decreased dras-
tically above this value. After reaching the set
VRR, permeate flux was maintained at about
62 L h)1 m)2 for more than 10 h by removing the
retentate to keep VRR constant. As previously
reported by Vaillant et al. (2001b), membrane
fouling appeared to reach an almost steady state
when the viscosity of the retentate was kept
constant.
The main physico-chemical and nutritional
properties of initial single-strength juice (F), per-
meate (P) and retentate (R) at a VRR of 3.5 are
reported in Table 1. The permeate was totally
clarified (SIS ¼ 0 g kg)1) and the retentate was
enriched with pulp (SIS ¼ 90 g kg)1). The latter
value remained surprisingly very close to that of
the initial juice. As previously stated by Vaillant
et al. (2001b), we assumed that the strong shear
stress being exerted on pulp fibres during constant
recirculation could affect their swelling capacity,
Improving orange juice quality M. Cisse et al.108
International Journal of Food Science and Technology 2005, 40, 105–116 � 2005 Institute of Food Science and Technology Trust Fund
thus skewing pulp measurements by the centri-
fugation method.
The TSS content was found to be higher in the
retentate than in the recovered permeate, being
about 15 g kg)1. Similar results have already been
reported in the literature as a measurement arte-
fact (Todisco et al., 1996; Vaillant et al., 1999).
The refractive index was affected by the presence
of high pulp content in the retentate, as confirmed
by the values for sugars and organic acids not
being significantly different from those in fresh
juice, retentate and permeate. The membrane did
not reject these solutes and the clarification did not
affect the sugar/acid balance of the permeate (P).
The vitamin C contents of the single-strengh
juice (F), the retentate (R) and the permeate (P)
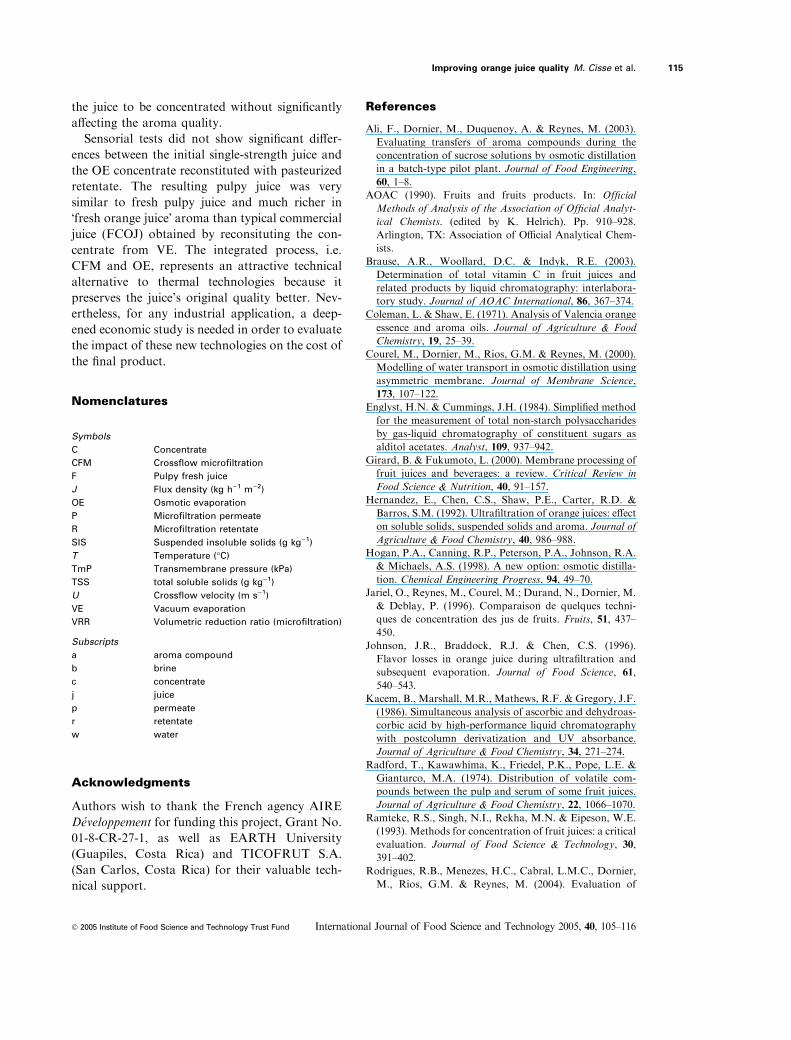
Table 1 Composition and main characteristics of the different juices
F R P COE450 COE
620 R + COE620 CVE
650
pH (20 �C) 3.62 (0.05) 3.45 (0.07) 3.58 (0.05) 3.59 (0.06) 3.52 (0.05) 3.49 (0.05) 4.12 (0.07)
Water activity (25 �C) 0.98 (0.02) 0.97 (0.02) 0.99 (0.02) 0.90 (0.02) 0.77 (0.02) 0.95 (0.02) 0.75 (0.02)
Viscosity (25 �C, mPa s) 1.1 (0.4) 1.7 (0.4) 1.2 (0.3) 7.5 (0.4) 28.2 (0.7) 1.6 (0.3) 37.3 (0.4)
Density (kg m)3) 1032 (2) 1045 (2) 1028 (2) 1187 (2) 1290 (2) 1280 (2) 1383 (2)
Total soluble solids (g kg)1) 118 (2) 130 (2) 115 (2) 450 (2) 620 (2) 118 (2) 655 (2)
Suspended insoluble solids (g kg)1) 80 (3) 90 (4) 0 0 0 80 (2) 80c (2)
Titrable acidity (g citric acid kg)1 TSS) 68 (1) 62 (2) 61 (1) 59 (1) 62 (1) 63 (1) 44 (1)
Glucose (g kg)1 TSS) 186 (1) 188 (2) 185 (2) 183 (2) 187 (2) 185 (2) 114 (1)
Fructose (g kg)1 TSS) 220 (2) 221 (2) 220 (2) 219 (2) 221 (2) 219 (2) 136 (1)
Sucrose (g kg)1 TSS) 491 (2) 494 (2) 489 (2) 490 (2) 491 (2) 48 (2) 291 (2)
Carotenoids (g kg)1 TSS) 0.38 (0.04) 0.34 (0.05) <0.02 <0.02 <0.02 0.35 (0.05) 0.24 (0.05)
Vitamin C (g kg)1 TSS) 3.7 (0.3) 3.3 (0.2) 3.6a.3.5b (0.3) 2.9 (0.3) 3.3 (0.3) 3.2 (0.3) 2.2 (0.2)
Colour (L) 52 62 62 49; 61d 25; 61d 53 20; 28c
Hue angle (H�) 88 82.3 88.3 82.4; 88.3d 38.7; 88.3d 88 63.4; 86.4d
Colour purity (C�) 30 37.3 17 30.3; 17d 25.6; 17d 29 31; 15d
Results are mean ± SD of six analyses.aAfter CFM.bBefore OE.cAfter dilution to 118 g kg)1 TSS.dAfter dilution to 115 g kg)1 TSS.
00 2 4 6 8 10 12
20
40
60
80
100
Time (h)
J (l
h–1
m–2
)
0
1
2
3
4
VR
R
Jp Jr VRR
Figure 3 Permeate flux (Jp), removal flux of retentate (Jr) and volumetric reduction ratio (VRR) during CFM of orange juice
(TmP ¼ 400 kPa, U ¼ 7 m s)1, T ¼ 20 �C).
Improving orange juice quality M. Cisse et al. 109
� 2005 Institute of Food Science and Technology Trust Fund International Journal of Food Science and Technology 2005, 40, 105–116

were not significantly different. Neither retention
by the membrane nor oxidative damage (because
of low temperature) affected this compound. No
carotenoids were noticed in the permeate. As these
compounds are insoluble in water and are mainly
associated with cell-wall fragments, they are
retained by the CFM membrane along with the
pulp. As a consequence, the clarified juice was
almost colourless (low colour purity C�), whereasthe retentate (R) was more intensely yellow than
the initial juice (F) (Table 1).
In the initial single-strength juice (F), the
identification of aroma compounds showed the
typical aromatic profile of Valencia orange juice
(Coleman & Shaw, 1971; Radford et al., 1974;
Johnson et al., 1996; Shaw et al., 2001), although
the product was particularly rich in a-pinene, c-terpinene, myrcene, decanal, octanal, hexanal and
poor in limonene (Table 2). The same orange
variety grown in humid tropical area may have a
different aromatic profile than oranges grown in
more Mediterranean climate.
The oxygenated compounds (alcohols, esters,
aldehydes and terpenols) were mainly found in the
permeate, whereas the terpenic hydrocarbons were
largely retained by the CFM membrane. More
than 60% of the ethanol, hexanal, decanal, benz-
aldehyde, linalool and terpineol from the fresh
juice were recovered in the permeate, whereas
more than 75% of the limonene, terpinolene and
valencene were found in the retentate. The selec-
tivity of the membrane according to aroma
compound is clearly demonstrated with these
results corroborating those of Hernandez et al.
(1992) and Johnson et al. (1996).
As terpenic hydrocarbons are highly apolar
compounds, an important portion of these com-
pounds could be adsorbed into the pulp, which
contains hydrophobic sites (Radford et al., 1974;
Hernandez et al., 1992) and subsequently rejected
Table 2 Concentration (in mg kg)1 TSS) of the principal aroma compounds in the different juices obtained
Compound of aromas F R P COE450* COE
620* R + COE620 COE
650
Ethanol 2356 (141) 377 (30) 2106 (147) 1558 (120) 1784 (125) 1885 (130) 1649 (115)
Octanol 29 (2) 15 (2) 20 (2) 12 (1) 13 (2) 46 (3) tr
Decanol 20 (2) 5 (1) 15 (1) 9 (1) 11 (1) 15 (2) tr
Total alcohols 2405 397 2141 1579 1808 1946 1649
a-Pinene 21 (2) 6 (1) 20 (2) 1 (1) 1 (1) 5 (1) tr
Myrcene 163 (12) 260 (25) 62 (5) 39 (4) 46 (3) 120 (20) 163 (15)
Limonene 2186 (196) 1708 (165) 1382 (134) 984 (101) 1155 (132) 1498 (155) 1432 (140)
c-Terpinene 15 (1) 9 (2) 12 (1) 6 (1) 6 (1) 8 (2) tr
Valencene 130 (11) 92 (8) 38 (2) 38 (6) 52 (6) 98 (9) 156 (12)
Terpinolene 336 (60) 501 (50) 108 (15) 108 (10) 116 (11) 378 (36) tr
Total terpenic hydrocarbons 2851 2576 1717 1176 1376 2107 1751
Decanal 15 (2) 7 (2) 12 (1) 8 (1) 9 (2) 12 (1) 13 (1)
Octanal 11 (1) 5 (1) 10 (1) 7 (1) 8 (1) 9 (1) 8 (1)
Hexanal 5 (1) 3 (1) 4 (1) 3 (1) 3 (1) 4 (1) 4 (1)
Benzaldehyde 81 (9) 28 (2) 76 (6) 53 (5) 61 (5) 68 (8) 21 (2)
Total aldehydes 112 43 102 71 81 93 46
Ethyl hexanoate 865 (80) 84 (10) 828 (78) 552 (48) 553 (50) 510 (52) tr
Butyl butyrate 625 (70) 62 (6) 665 (62) 402 (39) 452 (43) 470 (55) 338 (40)
Linalyl propanoate 320 (40) 145 (12) 302 (28) 182 (15) 211 (20) 383 (32) 206 (22)
Total esters 1810 291 1795 1136 1216 1363 544
Linalol 16 (2) 11 (1) 15 (1) 5 (1) 10 (1) 9 (1) 7 (1)
a-Terpineol 8 (1) 2 (1) 9 (2) 7 (1) 7 (1) 7 (1) tr
4-Terpineol 6 (1) 3 (1) 5 (1) 4 (1) 4 (1) 5 (1) tr
Geraniol 92 (12) 51 (4) 91 (8) 75 (6) 85 (7) 80 (12) 58 (7)
Carveol 44 (52) 85 (7) 15 (1) 11 (1) 13 (1) 36 (5) 37 (4)
Total terpenols 166 152 135 102 119 137 102
Results are mean ± SD of six analyses.
tr, traces; *Analysis on all OE concentrate recovered until collecting two hold-up volumes and obtained after pre-conditioning
the membrane.
Improving orange juice quality M. Cisse et al.110
International Journal of Food Science and Technology 2005, 40, 105–116 � 2005 Institute of Food Science and Technology Trust Fund

by the CFM membrane. The content of aroma
compounds in the juice (F) was significantly
modified by clarification. These changes should
alter the aroma characteristics of the product.
However, for orange juice, high terpenic hydro-
carbon content is not generally considered essen-
tial to orange flavour. Indeed, a high content of
terpenic hydrocarbons is often detrimental to the
stability of the juice during storage because these
unsaturated compounds are very susceptible to
oxidation.
Concentrating the clarified juice by OE
Figure 4 shows that, during OE, when TSS
increased, the evaporation flux (Jw) decreased
from 0.7 L h)1 m)2 at low TSS to
0.67 L h)1 m)2 when TSS reached 450 g kg)1,
and to 0.59 L h)1 m)2 when TSS reached
620 g kg)1. Nonetheless, the decrease in evapor-
ation flux was relatively low (only 17% difference
between initial TSS and 620 g kg)1) when com-
pared with other �cold� concentration processes.
Because evaporation flux was mainly correlated to
the TSS and did not depend on time, we can
assume that no significant membrane fouling
occurred during the long-term trial. The low
decrease of evaporation flux with respect to TSS,
and the absence of fouling, allowed working at
different concentration stages, following a con-
tinuous �feed and bleed� procedure. These results
confirmed those obtained with passionfruit juice
(Vaillant et al., 2001a).
Main characteristics of the concentrates
Table 1 gives the main physico-chemical charac-
teristics of both concentrates (COE450 and COE
620)
obtained by OE and the initial clarified juice (P)
(i.e. the microfiltration permeate).
For the main solutes, a direct comparison of
results expressed in gram per kilogram of TSS
showed that no significant differences existed in
sugar and organic acid content between clarified
juice (P) and OE concentrates (COE450 and COE
620).
The vitamin C content appeared to be lower in
the OE concentrates COE450 (by 17%) and COE
620 (by
6%) with regard to the initial clarified juice before
concentration (P). Vitamin C losses were mainly
observed during the first 3 h of concentration,
after which the vitamin C content (expressed in
gram per kilogram TSS) started to increase and
tended progressively to reach the levels of the
initial juice (Fig. 5). We assume that this pheno-
menon is mainly due to ascorbic acid oxidation by
the residual oxygen entrapped within the pores of
the membrane. This oxidation was most important
for the juice that penetrated into the concentration
loop at the beginning of the concentration. As
residual oxygen contained in the circuit is con-
sumed, vitamin C losses decrease during process-
ing and finally tend towards zero. For long-term
trials with continuous �feed and bleed� operations,the concentrate COE
620, obtained after recovering
two hold-up volumes of concentrate, showed no
significant differences with respect to the initial
juice (P) (differences below 5%).
Second stage OE
0
100
200
300
400
500
600
700
1086420 12 14 16 18
Time (h)
TSS
(g
kg–1
)
0.0
0.2
0.4
0.6
0.8
J (k
g h–1
m–2
)
First stage OE
0
100
200
300
400
500
600
700
0 2 4 6 8 10 12 14Time (h)
TSS
(g
kg–1
)
0.0
0.2
0.4
0.6
0.8
J (k
g h–1
m–2
)
TSS Jw Jc
Figure 4 Concentration in total soluble solids (TSS), water flux (Jw) and concentrate removal flux (Jc) during OE
(26 �C < Tc < 28 �C, 30 �C < Tb < 33 �C, Uc ¼ 0.2 m s)1).
Improving orange juice quality M. Cisse et al. 111
� 2005 Institute of Food Science and Technology Trust Fund International Journal of Food Science and Technology 2005, 40, 105–116

Even if the colour of the concentrate became
darker when the TSS increased because of pigment
concentration, after dilution to the same initial
TSS, no significant difference in colour was
noticed for either OE concentrate (COE450 or COE
620),
when compared with the initial clarified juice (P).
Table 1 shows that the low temperatures achieved
during OE (<28 �C) preserved the colour of the
juice when comparing L-value, Hue angle (H�)and colour purity (C�) of both concentrates with
respect to the initial juice P. Thus the Maillard
reactions in particular were avoided.
Aromatic qualities of the concentrates
On comparing the composition of the initial
clarified juice (P) with both concentrates collected
after 10 h of continuous extraction, loss of aroma
compounds was seen to occur during the two
concentration stages (Table 2). The losses evalu-
ated for all aroma compounds were higher in the
first stage ()31%) than in the second stage
()22%). This trend was confirmed for all aroma
compounds, whether considered individually or as
chemical class. The decrease in aroma concentra-
tion was always more prominent in the concen-
trate at 450 g kg)1 TSS (COE450) than in the
concentrate at 620 g kg)1 TSS (COE620).
Within each class of compounds, not all the
volatiles were affected at the same intensity. For
each compound the transfer flux was different.
During OE, mass transfer depends on (a) the
initial concentration of the compound in the juice,
(b) its relative volatility, (c) its diffusivity in liquid
phases and, finally, (d) its diffusivity in air
entrapped within the membrane pores (Courel
et al., 2000).
Nevertheless, using sensorial analysis, no signi-
ficant difference (at 95% confidence level) was
noticed between the initial clarified juice (P) and
the clarified concentrate at 620 g kg)1 TSS (COE620).
The effect of OE on the aromatic quality of the
juice was not significant, at least from the sensorial
viewpoint.
Nonetheless, to better characterize losses of the
volatiles, the transfer kinetics of the aroma com-
pounds were assessed during the OE process
(Fig. 6). The concentration of all groups of aroma
compounds decreased as TSS levels increased
during the first 3 h of concentration, and then
increased slightly for both concentration stages.
These results can be explained by both the
reduction of the driving force versus time and
the adsorption phenomena on the membrane.
During OE, water transfers were always accom-
panied by the weak transfer of some aroma
compounds through the membrane (Ali et al.,
2003). Because the brine was not regenerated by
evaporation but maintained saturated by adding
CaCl2 crystals, the concentration of the aroma
compounds in the brine progressively increased.
The driving force for the transfer of aroma
First OE stage (115 to 450 g TSS kg–1)
3
3.1
3.2
3.3
3.4
3.5
3.6
3.7
3.8
3.9
4
1050 15
Time (h)
Vit.
C (
g kg
–1 T
SS)
0
50
100
150
200
250
300
350
400
450
500
TSS
(g
kg–1
)
Vitamin C TSS
Figure 5 Evolution of the content
of vitamin C during the first stage
of OE concentration
(26 �C < Tc < 28 �C,30 �C < Tb < 33 �C,Uc ¼ 0.2 m s)1).
Improving orange juice quality M. Cisse et al.112
International Journal of Food Science and Technology 2005, 40, 105–116 � 2005 Institute of Food Science and Technology Trust Fund

compounds through the membrane thus de-
creased, continuously reducing the transmem-
brane flux. The large membrane area used
(10.2 m2) and the strong affinity that these com-
pounds have for hydrophobic polymers like poly-
propylene are also highly favourable for
adsorption phenomena to take place, as already
described by Ali et al. (2003). This adsorption may
also contribute to aroma compound losses at the
beginning of the processing.
Complementary trials were carried out to dis-
cover how to limit the loss of aroma compounds
to adsorption on the membrane during the initial
phase of OE. Clarified juice was first circulated
inside the membrane for 3 h, then discarded and a
new concentration trial was carried out immedi-
ately after draining without rinsing and using
brine that had been thermally regenerated before-
hand.
Table 3 shows that pre-conditioning the mem-
brane slows down the loss of aroma compounds.
Losses were strongly reduced for all aromatic
classes excepted for aldehydes. For concentrate
collected after 3 h of the second OE stage, losses
were reduced respectively for alcohols and esters,
from 35 to 13% and 55 to 25% (Table 3). As the
brine was not regenerated by evaporation during
the trial, membrane adsorption alone must have
been responsible for 63 and 54% of the losses of
alcohols and esters, respectively, during the first
3 h of OE concentration. Losses of aroma com-
pounds can thus be drastically reduced by imple-
menting a stage of pre-conditioning the membrane
to limit adsorption phenomena on the hydropho-
bic membrane. The other losses, caused by the
driving force for aroma transfers to the brine,
decrease with time during the trial as the brine is
not thermally regenerated. Analysis of concentra-
tion of aroma compounds done on the concentrate
COE620 collected at the end of the trial (after having
collected two hold-up volumes of the concentrate),
showed that the concentrate present insignificant
losses of the aroma compounds with respect to the
initial juice P (Table 3).
Second stage OE
60
80
100
120
0 2 4 6 8 10 12 14 16
Ca
(mg
kg–1
TSS
)
400
500
600
700
TSS
(g
kg–1
)
Aldehydes Terpenols TSS
First stage OE
0
500
1000
1500
2000
2500
0 2 4 6 8 10 12 14
Time (h) Time (h)
Ca
(mg
kg–1
TSS
)
0
100
200
300
400
500
TSS
(g
kg–1
)
Alcohols Esters TSS
Figure 6 Example of the concentration kinetic of some classes of aroma compounds (Ca) during OE concentration of orange
juice (26 �C < Tc < 28 �C, 30 �C < Tb < 33 �C, Uc ¼ 0.2 m s)1).
Table 3 Comparison of the aroma
concentration (mg kg)1 TSS) in
orange juice collected after 3 h (a)
or at the end of the trial (b) during
OE concentration with and
without pre-conditioning of the
membrane
P
(a) COE620 without
pre-conditioning
(%)
(a) COE620 with
pre-conditioning
(%)
(b) COE620 with
pre-conditioning
(%)*
Alcohols 2141 1379 1857 2097
Aldehydes 102 86 80.5 97
Esters 1795 824 1341 1556
Terpenics
hydrocarbons
1717 1047 1408 1579
Terpenols 135 96 103 112
*Samples collected after recovering two hold-up volumes of the concentrate.
Improving orange juice quality M. Cisse et al. 113
� 2005 Institute of Food Science and Technology Trust Fund International Journal of Food Science and Technology 2005, 40, 105–116

Comparing the processed pulpy juices
To evaluate the benefit of coupling CFM and OE,
OE concentrate (COE620) was collected at the end of
the trial (after collecting at least two hold-up
volumes of concentrate) and reconstituted with the
microfiltration retentate (R) previously pasteur-
ized to give a pulpy juice (R + COE620). The
chemical composition of the mix (R + COE620) was
compared with the single-strength juice (F) and
commercial concentrate FCOJ (CVE650) (Table 1).
The composition of R + COE620 was very close to
that of the single-strength juice (F). No significant
difference was found for carbohydrates and acid-
ity. Only 14% of vitamin C was lost. The colour of
R + COE620 was not significantly affected by the
processing as can be seen in Table 1. Thus the
integrated process minimizes heat-induced chem-
ical reactions, particularly the Maillard reactions.
We noticed important modifications in the
composition of the commercial concentrate
obtained by VE (CVE650). Significant differences with
respect to sugar content and acidity were found,
probably as a result of thermal damage. Indeed,
vitamin C content is 41% lower in the concentrate
(CVE650) than in fresh juice (F). The strong decrease
in colour purity (C�), and luminosity L (colour
measurement after dilution) indicated an import-
ant browning of the commercial FCOJ (CVE650). The
chemical composition and nutritional quality of
the fresh juice were thus clearly less affected by the
membrane processes than by thermal evaporation.
The contents of all classes of aroma compounds
in the pulpy juices CVE650 and R + COE
620 were lower
than those in fresh juice (Table 2). Nevertheless,
important differences were found between the two
processed products, with the losses of aroma
compounds being much higher in the vacuum-
evaporated juice. Depending on chemical class,
losses between 31 and 70% was recorded for CVE650,
whereas losses between 17 and 25% were obtained
for R + COE620. Furthermore, some volatiles (octa-
nol, decanol, terpinolene, c-terpinene, ethyl hex-anoate, a-terpineol and 4-terpineol) were totally
removed in CVE650.
Even if the aromatic profile of the raw juice was
slightly modified, the aroma quality of the integ-
rated-membrane-processed juice remained closer
to that of the fresh juice than that of the thermally
treated juice.
According to the sensorial tests, no significant
differences (at 95% confidence level) could be
noticed between single-strength orange juice (F)
and concentrated clarified juice previously recon-
stituted with pasteurized retentate and water
(R + COE620). The process used had no significant
effect on the sensorial quality of the juices. On the
contrary, the juice reconstituted from CVE650 and the
R + COE620 juice were significantly recognized as
different (twenty right answers out of twenty-five
panellists) according to aroma (40%), taste (30%),
acidity (20%) and colour (10%). All the tasters
agreed that the juice reconstituted from OE
concentrate presented a better �fresh orange juice�aroma profile.
Conclusions
Orange juice can be microfiltred reasonably easily
through a 0.2 lm ceramic membrane at an average
flow rate of about 62 L h)1 m)2 at a VRR of 3.5.
The permeate would contain solutes at a level very
close to that of fresh pulpy juice. The modifications
of chemical composition observed were not signi-
ficant, except for the carotenoids, which were
completely retained by the membrane, and some
aroma compounds, mainly terpenic hydrocarbons,
which were partially rejected by the membrane
because of their apolar properties and association
with the insoluble solids found in the retentate. The
clarified orange juice (permeate) could then be
concentrated at low temperatures byOE to asmuch
as 620 g kg)1 TSS in two stages, with an average
evaporation rate of about 0.6 L h)1 m)2.
The quality of the concentrate obtained was
very similar to the initial clarified juice. The OE
process did not modify sugar and acid contents.
Small losses of vitamin C were noticed at the
beginning of the concentration process, probably
because of oxidation phenomena. Nevertheless,
the vitamin C content of the concentrate progres-
sively increased towards the levels found in the
initial juice. The colour of the product was
unchanged.
Some losses of aroma compounds occurred
mainly during the initial hours of concentration.
These losses could be drastically limited by pre-
conditioning the membrane with the clarified juice
from CFM and by avoiding thermal regeneration
of brine during concentration. OE then allowed
Improving orange juice quality M. Cisse et al.114
International Journal of Food Science and Technology 2005, 40, 105–116 � 2005 Institute of Food Science and Technology Trust Fund
the juice to be concentrated without significantly
affecting the aroma quality.
Sensorial tests did not show significant differ-
ences between the initial single-strength juice and
the OE concentrate reconstituted with pasteurized
retentate. The resulting pulpy juice was very
similar to fresh pulpy juice and much richer in
�fresh orange juice� aroma than typical commercial
juice (FCOJ) obtained by reconsituting the con-
centrate from VE. The integrated process, i.e.
CFM and OE, represents an attractive technical
alternative to thermal technologies because it
preserves the juice’s original quality better. Nev-
ertheless, for any industrial application, a deep-
ened economic study is needed in order to evaluate
the impact of these new technologies on the cost of
the final product.
Nomenclatures
Symbols
C Concentrate
CFM Crossflow microfiltration
F Pulpy fresh juice
J Flux density (kg h)1 m)2)
OE Osmotic evaporation
P Microfiltration permeate
R Microfiltration retentate
SIS Suspended insoluble solids (g kg)1)
T Temperature (�C)TmP Transmembrane pressure (kPa)
TSS total soluble solids (g kg)1)
U Crossflow velocity (m s)1)
VE Vacuum evaporation
VRR Volumetric reduction ratio (microfiltration)
Subscripts
a aroma compound
b brine
c concentrate
j juice
p permeate
r retentate
w water
Acknowledgments
Authors wish to thank the French agency AIRE
Developpement for funding this project, Grant No.
01-8-CR-27-1, as well as EARTH University
(Guapiles, Costa Rica) and TICOFRUT S.A.
(San Carlos, Costa Rica) for their valuable tech-
nical support.
References
Ali, F., Dornier, M., Duquenoy, A. & Reynes, M. (2003).
Evaluating transfers of aroma compounds during the
concentration of sucrose solutions by osmotic distillation
in a batch-type pilot plant. Journal of Food Engineering,
60, 1–8.
AOAC (1990). Fruits and fruits products. In: Official
Methods of Analysis of the Association of Official Analyt-
ical Chemists. (edited by K. Helrich). Pp. 910–928.
Arlington, TX: Association of Official Analytical Chem-
ists.
Brause, A.R., Woollard, D.C. & Indyk, R.E. (2003).
Determination of total vitamin C in fruit juices and
related products by liquid chromatography: interlabora-
tory study. Journal of AOAC International, 86, 367–374.
Coleman, L. & Shaw, E. (1971). Analysis of Valencia orange
essence and aroma oils. Journal of Agriculture & Food
Chemistry, 19, 25–39.
Courel, M., Dornier, M., Rios, G.M. & Reynes, M. (2000).
Modelling of water transport in osmotic distillation using
asymmetric membrane. Journal of Membrane Science,
173, 107–122.
Englyst, H.N. & Cummings, J.H. (1984). Simplified method
for the measurement of total non-starch polysaccharides
by gas-liquid chromatography of constituent sugars as
alditol acetates. Analyst, 109, 937–942.
Girard, B. & Fukumoto, L. (2000). Membrane processing of
fruit juices and beverages: a review. Critical Review in
Food Science & Nutrition, 40, 91–157.
Hernandez, E., Chen, C.S., Shaw, P.E., Carter, R.D. &
Barros, S.M. (1992). Ultrafiltration of orange juices: effect
on soluble solids, suspended solids and aroma. Journal of
Agriculture & Food Chemistry, 40, 986–988.
Hogan, P.A., Canning, R.P., Peterson, P.A., Johnson, R.A.
& Michaels, A.S. (1998). A new option: osmotic distilla-
tion. Chemical Engineering Progress, 94, 49–70.
Jariel, O., Reynes, M., Courel, M.; Durand, N., Dornier, M.
& Deblay, P. (1996). Comparaison de quelques techni-
ques de concentration des jus de fruits. Fruits, 51, 437–
450.
Johnson, J.R., Braddock, R.J. & Chen, C.S. (1996).
Flavor losses in orange juice during ultrafiltration and
subsequent evaporation. Journal of Food Science, 61,
540–543.
Kacem, B., Marshall, M.R., Mathews, R.F. & Gregory, J.F.
(1986). Simultaneous analysis of ascorbic and dehydroas-
corbic acid by high-performance liquid chromatography
with postcolumn derivatization and UV absorbance.
Journal of Agriculture & Food Chemistry, 34, 271–274.
Radford, T., Kawawhima, K., Friedel, P.K., Pope, L.E. &
Gianturco, M.A. (1974). Distribution of volatile com-
pounds between the pulp and serum of some fruit juices.
Journal of Agriculture & Food Chemistry, 22, 1066–1070.
Ramteke, R.S., Singh, N.I., Rekha, M.N. & Eipeson, W.E.
(1993). Methods for concentration of fruit juices: a critical
evaluation. Journal of Food Science & Technology, 30,
391–402.
Rodrigues, R.B., Menezes, H.C., Cabral, L.M.C., Dornier,
M., Rios, G.M. & Reynes, M. (2004). Evaluation of
Improving orange juice quality M. Cisse et al. 115
� 2005 Institute of Food Science and Technology Trust Fund International Journal of Food Science and Technology 2005, 40, 105–116

reverse osmosis and osmotic evaporation to concentrate
camu-camu juice (Myrciaria dubia). Journal of Food
Engineering, 63, 97–102.
Shaw, P.E., Lebrun, M., Dornier, M., Ducamp, M.N.,
Courel, M. & Reynes, M. (2001). Evaluation of concen-
trated orange and passion fruit juices prepared by
osmotic evaporation. Lebensmittel-Wissenschaft und
Technologie, 34, 60–65.
Taungbodhitham, A.K., Jones, G.P., Wahlqvist, M.L. &
Briggs, D.R. (1998). Evaluation of extraction method for
the analysis of carotenoids in fruits and vegetables. Food
Chemistry, 63, 577–584.
Todisco, S.P., Drioli, E. & Tallarico, P. (1996). Analysis of
the fouling mechanism in microfiltration of orange juice.
Journal of Food Processing & Preservation, 20, 453–466.
Vaillant, F., Millan, P., O’Brien, G., Dornier, M. &
Decloux, M. (1999). Crossflow microfiltration of passion
fruit juice after partial enzymatic liquefaction. Journal of
Food Engineering, 42, 215–224.
Vaillant, F., Jeanton, E., Dornier, M., O’Brien, G.M.,
Reynes, M. & Decloux, M. (2001a). Concentration of
passion fruit juice on an industrial pilot scale using
osmotic evaporation. Journal of Food Engineering, 47,
195–202.
Vaillant, F., Millan, A., Dornier, M., Decloux, M. &
Reynes, M. (2001b). Strategy for economical optimisation
of the clarification of pulpy fruit juices using crossflow
microfiltration. Journal of Food Engineering, 48, 83–90.
Improving orange juice quality M. Cisse et al.116
International Journal of Food Science and Technology 2005, 40, 105–116 � 2005 Institute of Food Science and Technology Trust Fund
Copyright © 2022 FDOKUMEN