FOREIGN TECHNOLOGY DIVISION - DTIC
426
FTD-MT-24-982-71 FOREIGN TECHNOLOGY DIVISION V.;~ MONOPULSE RADAR - L by " A. I. Leonov and K. I. Fominchev "• IN/ •JUtV S192 / D.C i4•Approved for public relase • Dis tribution mnlimited. )i i1~N ATIV14' C'(H NIClef -L INFORMATION Wt:VIC.E r• 2
-
Upload
khangminh22 -
Category
Documents
-
view
0 -
download
0
Transcript of FOREIGN TECHNOLOGY DIVISION - DTIC

FTD-MT-24-982-71
FOREIGN TECHNOLOGY DIVISION
V.;~
MONOPULSE RADAR
- L by
" A. I. Leonov and K. I. Fominchev
"• IN/ •JUtV S192 /D.C
i4•Approved for public relase• Dis tribution mnlimited.
)i i1~N ATIV14' C'(H NIClef
-L INFORMATION Wt:VIC.Er• 2

UNCLASS IFIED_uOCLItN CONTROL 04k 0,
1 ORIGMIATING ACTIVITY (CoG9MM X&P)so REPORT SECURITY CLASSIFICATIONForeign Technology Division UN!.SSx~A ir Force Systems Command 96 GROUP 'T~
U. R SOR Air Force
MONOPULSE RADAR
4. 0CSC RIP TWO NOTES (?1'. .@It apEd Mghw.# do#e&)
Translation11- AUTNORIAI (PIn~t MONe. Midei 11001. g**01Nil0)
Leonov, A. Is and Fomichev, K. Is
4. ROPOM CATO Me TOTAL NO. OF PAGSC 76. NO. or I PIS5
1970 NO. 13 17CONTRACT OR GRANT NO.RIGIN101ATORS IMPORT NU$NSERISj
j . MjCNO. 60501 FTD-K.P-24-982-71OTHOR REPORT NO12) (ANY 410f n4um.ber lheD owT be *sie
10 DAl.OUIO STA9M01
Approved frpublic release; distribution unlimited.
It.$rP6EMCNTARY NOT28 1a. SPONSORING MILITARY ACTIVITY
for Foreign Technology Division
LASSRACTWright-Patterson AFB, Ohio
The book deals with certain problems oftinonopulse radar.Analyzed are principles of design and basic functionalelements of monopulse direction finding *systems, problemsof accuracy and resolutioný.N\ The book wa,ý written for eogineer-4ing technical personne anbenior college students specializ-ing in the field of radar e gineering. CAM1OO2'{19)
DD I JV4 73UNCLASSIFIEDSecurity Elsasuification-

UNCLASSIFIED
- ~LrSK A LNS LINK C
WTL ' W It -'LE WT_ OLK WT
MonographRadar EngineeringRadar Design ParameterMonopulse RadarDirection Findi.ng EquipmentRadar ResolutionRadar AccuracyRadar AntennaAngle Measuring InstrumentRadar SensitivityMathematic Model
I i
SUWCLMSSItDeknso•curity C14,,1ifcetion
FTD-MT24-982-71
EDITED MACHINE TRANSLATION
MONOPULSE RADARBy: A. I. Leonov and K. I. Fomichev
English pages: 414i
Source: Monolmpul.'snaya Radiolokatsiya,Izd Vo Sovetskoye Radio, Moscow,1970, pp. 1-392.
This document is a Systran machine aidedtranslation, post-edited for techn:,calaccuracy by: L. Heenan
Approved for public release;I-0 distribution unlimited.
THIS TRANSLATION IS A RENDITION OP THE 01R0.HAL FOREIGN TEXT WITHOUT ANY ANALYTICAL OREDITORIAL COMMENT. STATEMENTS OR THEORIES PIKPARED iYoADVOCATED OR IMPLIE ARE THOSE OF THE SOURCIFAIVCO NOT NECESSARILY R1E.LICT THE POSITION TRANSLATION DIV, IOMOR OPINION O" THE FPRI T L IGN TTECHNWLOGY DIVItI4NVISION. - WP.AFl, OHIO.
FTD-MT-24-982-71 DO 21 Jan.•19 72
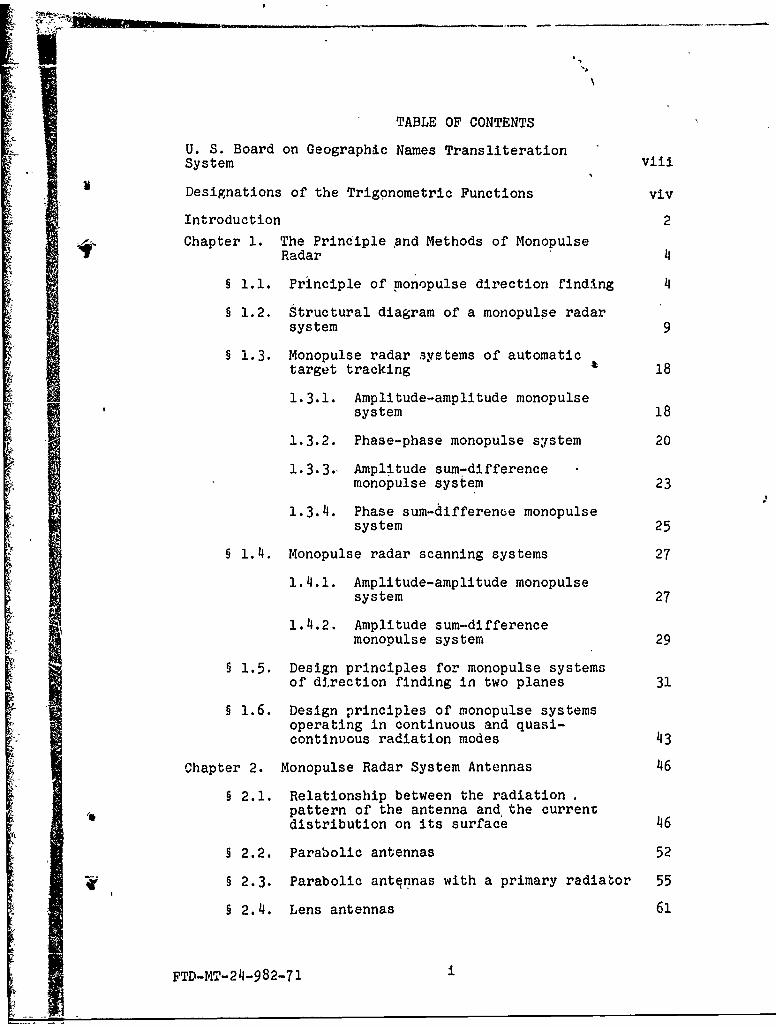
TABLE OF CONTENTS
U. S. Board on Geographic Names Transliteration
System viii
Designations of the Trigonometric Functions viv
Introduction 2
Chapter 1. The Principle and Methods of MonopulseRadar 4
§ 1.1. Principle of monopulse direction finding 4
§ 1.2. Structural diagram of a monopulse radarsystem 9
§ 1.3. Monopulse radar systems of automatictarget tracking 18
1.3.1. Amplitude-amplitude monopulsesystem 18
1.3.2. Phase-phase monopulse system 20
1.3.3. Amplitude sum-differencemonopulse system 23
1.3.4. Phase sum-difference monopulsesystem 25
§ 1.4. Monopulse radar scanning systems 27
1.4.1. Amplitude-amplitude monopulsesystem 27
1.4.2. Amplitude sum-differencemonopulse system 29
§ 1.5. Design principles for monopulse systemsof direction finding in two planes 31
§ 1.6. Design principles of monopulse systemsoperating in continuous and quasi-continuous radiation modes 43
Chapter 2. Monopulse Radar System Antennas 46
§ 2.1. Relationship between the radiationpattern of the antenna andthe currentdistribution on its surface 46
§ 2.2. Parabolic antennas 52
§ 2.3. Parabolic antqnnas with a primary radiator 55
§ 2.4. Lens antennas 61
FTD-MT-24-982-71 i
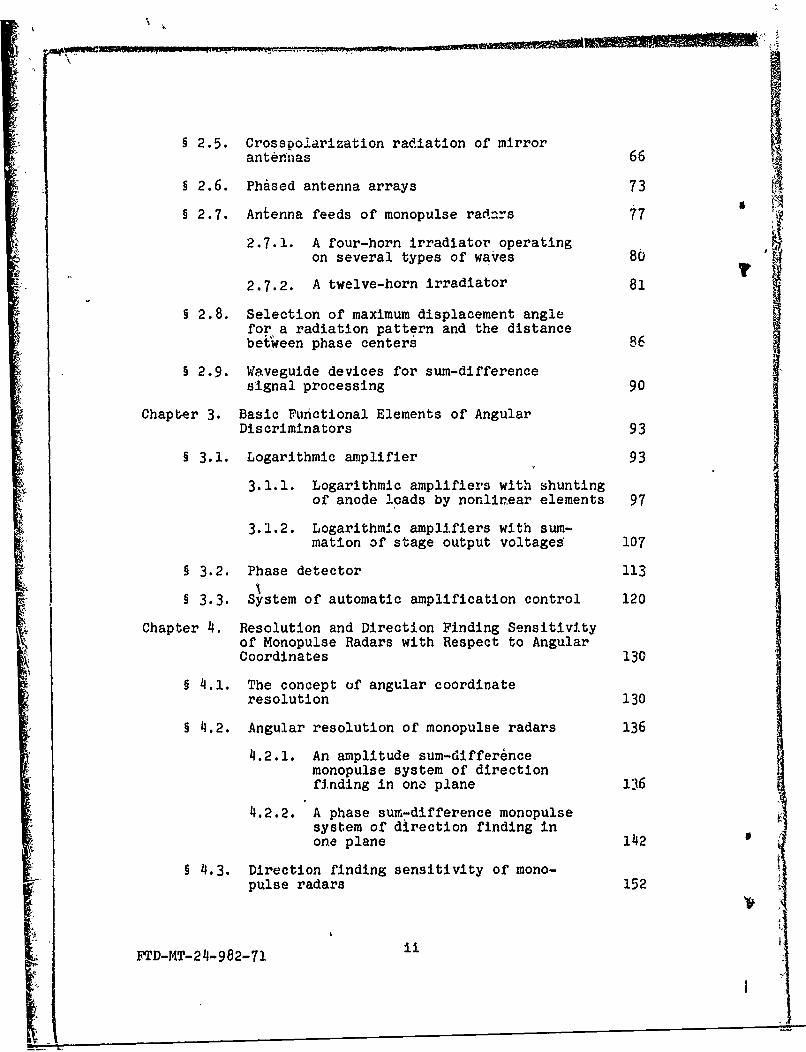
2.5. Crosspoiarization radiation of mirror
antennas 66
§ 2.6. Phased antenna arrays 73
§ 2.7. Antenna feeds of monopulse radars 77
2.7.1. A four-horn irradiator operating 8on several types of waves 80
2.7.2. A twelve-horn irradiator 81
§ 2.8. Selection of maximum displacement anglefor a radiation pattern and the distancebetween phase centers 86
§ 2.9. Waveguide devices for sum-differencesignal processing 90
Chaptber 3. Basic Functional Elements of AngularDiscriminators 93
§ 3.1. Logarithmic amplifier 93
3.1.1. Logarithmic amplifiers with shuntingof anode loads by nonlinear elements 97
3.1.2. Logarithmic amplifiers with sum-mation of stage output voltages 107
§ 3.2. Phase detector 113
§ 3.3. System of automatic amplification control 120
Chapter 4. Resolution and Direction Finding Sensitivityof Monopulse Radars with Respect to AngularCoordinates 130
§ 4.1. The concept of angular coordinateresolution 130
§ 4.2. Angular resolution of monopulse radars 136
4.2.1. An amplitude sum-differencemonopulse system of directionfinding in ona plane 136
4.2.2. A phase sum-difference monopulsesystem of direction finding inone plane 142
§ 4.3. Direction finding sensitivity of mono-V pulse radars 152
FTD-MT-24-982-71 i

§ 4.4. Methods of improving angular resolution inmanopulse radars 155
4.4.1. Methods for increasing resolution,based on angle gating 156
I4.1 .2. A method of increasing resolution,based on functional processingof signals 165
Chapter 5. Accuracy Problems in Angular Measurement bythe Monopulse Method 171
§ 5.1. The effect of radio wave propagationconditions on direction finding accuracy 171
5.1.1. The effect of the earth ondirection finding accuracy 172
5.1.2. The effect pf refraction anddiffraction on direction findingaccuracy 175
§ 5.2. The effect of amplitude and angular'fluctuations in reflected signals ondirection finding accuracy 177
5.2.1. The effect of amplitude fluctua-tions on direction findingaccuracy 177
5.2.2. The effect of angular fluctuationsin reflected signals on directionfinding accuracy 179
5.2.3. Errors and the direction finding oftargets of complex form 188
5.2.4. Measurement methodology and targetnoise analysis 192
§ 5.3. The effect of internal receiver noiseson direction finding accuracy 196
§ 5.4. Errors caused by receiver noises in mdho-pulse radars with phased antenna array 206
S§ 5.5. Sum error in direction finding caused bythe effect of target and receiver noises 211
i 5.6. Effect of automaticgain control ondirection tinding accuracy 213
FTD-MT-211-982-71
- _ _ I

"§ 5.7. The effect of the depolarization ofreflected signals on direction findingaccuracy, 222
5.7. . Reasons for the:depolarization ofreflected signals 223
54.2. The character-of the effect ofreflicted signal depolarizationon cti'e&tion, finding ..ccuracy 225
5.7.3. 'Methods of lessening the effectof antenna crosspolarization ondirection findoing accuracy 235
Chapter 6. The Effect of Imperfections in Elements ofthe Rece~ving Circuit on the Accuracy ofMeasuring Angular Coordinates by theMonopulse Method 237
§ 6.1. Main sources of equipment errors 237§ 6.2. The eff'ct of imperfect formation of antenna
radiation patterns of monopulse systems ondirection finding accuracy 238
6.2.1. The effect of errors in fielddistribution along the apertureof an antenna array on directiozlfinding accuracy 239
§ 6.3. The effect of nonidentity of amplitude-phase charafteristics for receivingchannels of monopulse systems on directionfinding accuracy 250
6.3.1. The effect of nonidentity ofamplitude-phase characterl-tics inan amplitude-amplitude monopulsesystem on direction finding accuracy 251
6.3.2. The effect of nonidentity ofamplitude-phase characteristicsfor receiving channels of an amplitudesum-difference monopulse system ondirection finding accuracy 255
6.3.3. The effect of nonidentity in amplitudephase characteristics of receivingchannels for a phase-phase monopulsesystem on direction finding accuracy 269
FTD-MT-24-982-71 iv
____________________
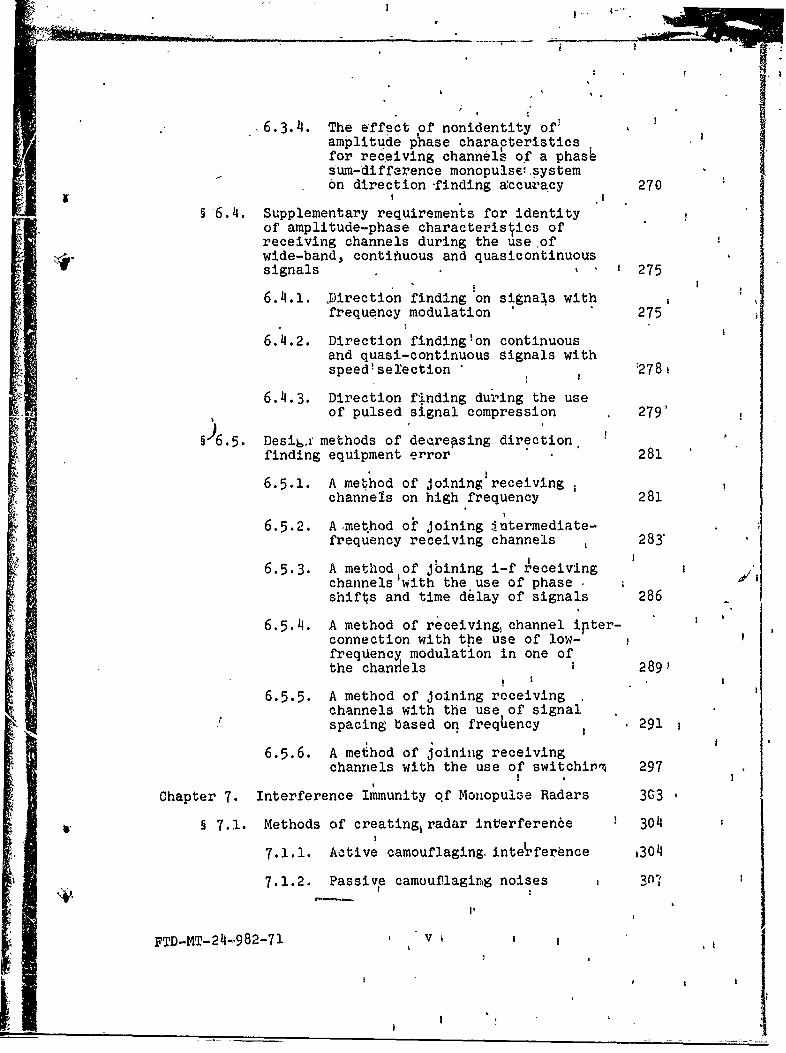
-6.3.4. The effect of nonidentity of'amplitude phase characteristicsfor receiving channels of a phasesum-difference monopulse:,systemon direction -finding accuracy 270
§ 6.4. Supplementary requirements for identityof amplitude-phase characterisics ofreceiving channels during the use ofwide-band, contiftuous and quasicontinuoussignals 275
6.4.1. ,Direction finding on signaJs withfrequency modulation S 275
6.4.2. Direction finding'on continuousand quasi-continuous signals withspeed selection 27 8 i
6.4.3. Direction finding during the useof pulsed signal compression 279'
)
§'6.5. Desi,6 methods of decreasing direction.finding equipment error 281
6.5.1. A mebhod of Joining receivingchannels on high frequency 281
6.5.2. A~method ok joining jutermediate- 283frequency receiving channels
6.5.3. A method of Jbining i-f receivingchannels 'with the use of phaseshifts and time d~lay of signals 286
6.5.4. A method of receiving, channel ipter-connection with the use of low-'freqUency modulation in one ofthe channels i 289'
6.5.5. A method of Joining receivingchannels with the use of signalspacing based on freqhency 291
6.5.6. A meihod of joining receivingchannels with the use of switchip"* 297
Chapter 7. Interference Immunity qf Monopulse Radars 303
§ 7.1. Methods of creating1 radar interference 304
7.1.1. Active camouflaging inte'rference 30o4
7.1.2. Passive camouflaging noises 2 307
I'
FTD-MT-241-,9 82-71 v•
-- _

7.1.3. Adtive' misinforming noises 309
A 7.1.4., Passive misinforming noises 311
• 1 l i5. Noise, 6rm atomic explosions 312
§ 17.2. 1Noises.by monopulse radar systems 314
7.2.1. Noises of a monorpalse radar onreceiving channel switchingfrequency 317
7.2,.2. Coherentt noises Created from twopqints in space 321
7.2.3. Flickefing noises created fromtwo points in space 330
7.2.4. Noises with frequency wobble createdfrom two or'more points 335
,7.2.5. Noises on crosspolarization 337
§ i.3. Methods of protecting monopulse radars'from certain types of radio noises 338
7.3.1. 'Methods of protection fromflickering noises created fromtwo or more points in space 339
7-3.2. iProtecition from noises on cross-polarization 34o
:Chapter 8. The Use of Modeling in a Study of CoordinateSIDetermination Errord for Monopulse Radars 342
§8.1." Common problems and trends in simulation 342
§1 8.2. •model of an aamplitude sum-differencemonopulse tracking radar 343
S83' Overall block diagram of a model of ascanning monopulse kadar with frequency-
modulatedi signals and amplitude directionfinding 357
.3.1. Representarion of signal andnoiee 358
8.3.2, Modeling the processing of a.signa. in the receiving channel 367
F
III

S8.4. Models of amplitude-amplitude and amplitudesum-difference scanning radars 377
Chapter 9. Areas ofr:Application at Certain Characteris-tics-of Foreign Monopulse Radars 383
§ 9.1. R41ars for tracking both ballistic and
space targets 383
§ 9.2. Radar, systems for remote tracking andScommunjcstion wfth satellites andSspace ships 388
§ 9.3. Radars of the antimissile defense system 397
§ 9.4. Radars for guiding antiaircraft rockets 403
i § 9.5. A radar for detecting ground targets onthe local background 406
v
FTD-MT-24-9 8 2-71 vii
IT
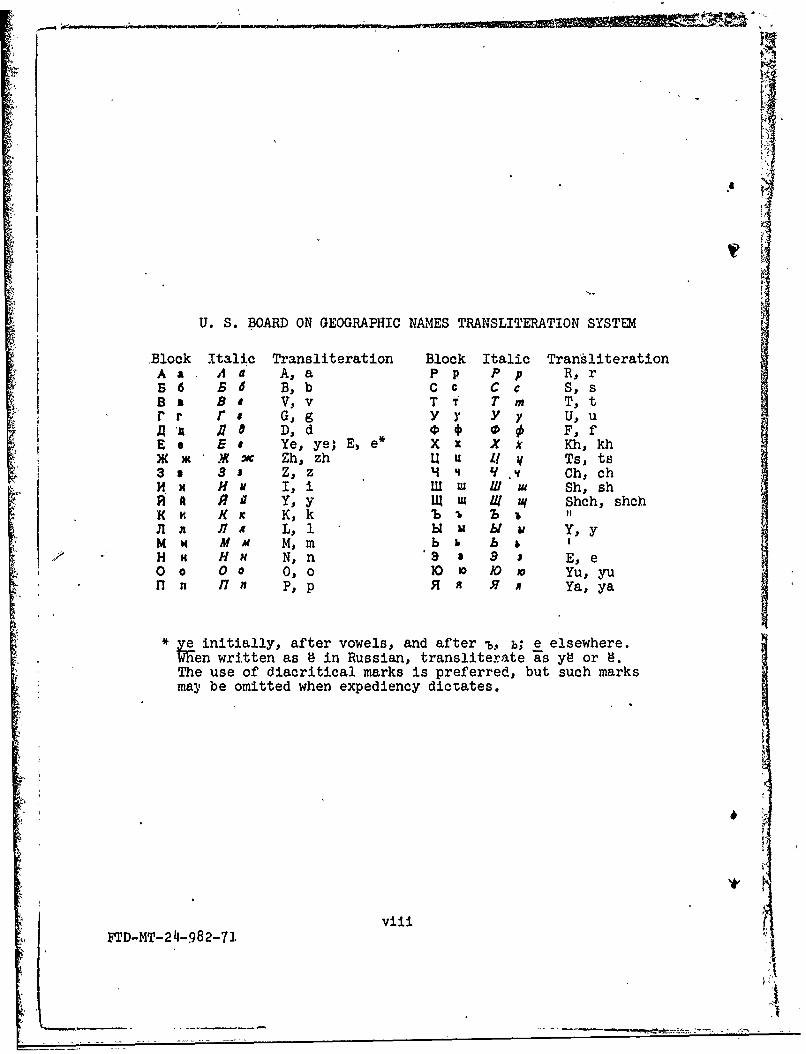
U. S. BOARD ON GEOGRAPHIC NAMES TRANSLITERATION SYSTEM
Block Italic Transliteration Block Italic TransliterationA a- A a A, a Pp P p R, rB 6 S 6 B,b C c C C S, sB a B e V, v T f Tm T, t"r r re G, g Y y Y y U, uA A 7 D, d 0 0 0 0 F, fE e E * Ye, ye; E) e* X x Xx Kh, kh)K X -.W Zh, zh LIU Ll s Ts, ts" 3 1 Z, z M 4 V , Ch, chMX H U I, i W W LUw Sh, sh
A R 37 Y, y Llu X W u Shch, shchK K x K, k 'b Z - 1.J1 A a L, 1 bi• b u Y, yM X MM Mm b hb '- H H U N, n 33 E, eO o 0 0 0, o )0 O ;0 Yu, yu
l n i7 n P, p 31 R fi Ya, ya
9 e initially, after vowels, and after b, B; e elsewhere.en written as t in Russian, transliterate is yt or L.
The use of diacritical marks is preferred, but such marksmay be omitted when expediency dictates.
viiiFTD-MT-24-982-71 _
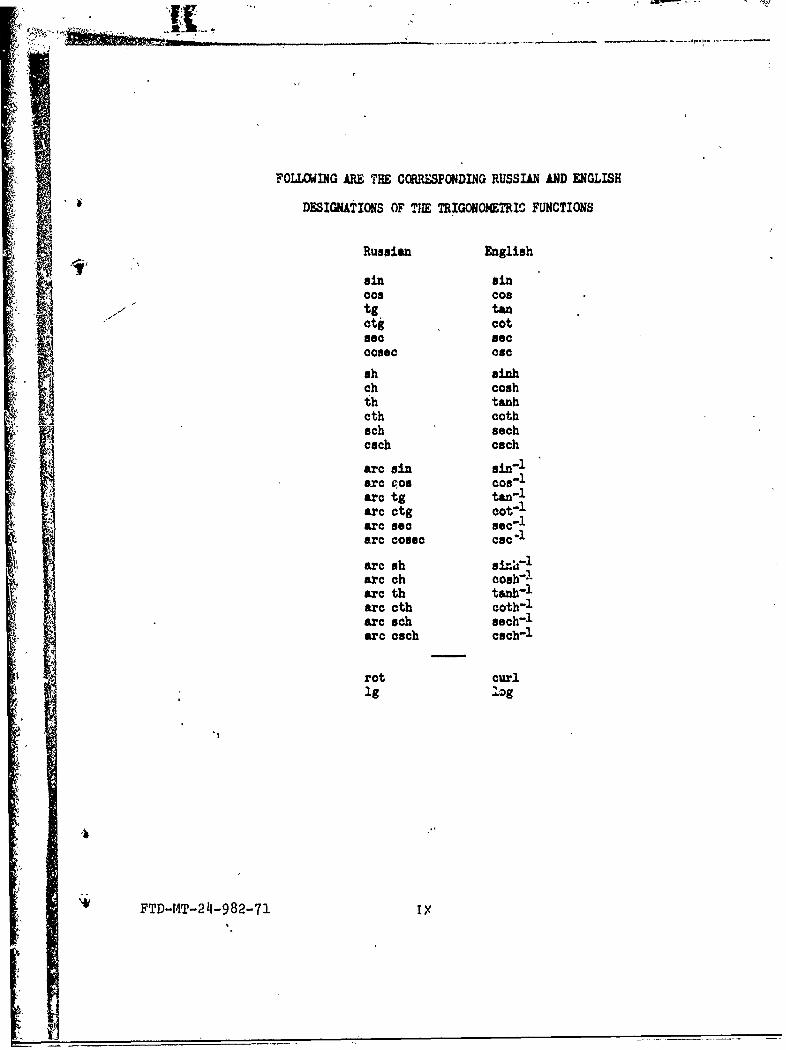
FOLLOWING ARE THE CONRESPONDING RUSSIAN AND ENGLISH
DESIGNATIONS OF THE TRIGONOMTRIC FUNCTIONS
Russian English
sin sinCos Cos
tg tan"otgcot
cosec CUC
sh sinhph coshth tanhcth cothsch seahcach cach
arc sin s1n1
arc Po0 c05-1
arc tg tan"Iarc ctg cot"1
arc sec ec"1
arc cosec csc-1
arc sh i•:,'arc ch cosh"1
arc th tanh"Iarc oth coth-1
arc wch sech-Iarc cach cach1
rot curlig 'Lg
V FTD-14T-24-982-71 IX
L .. .. . .. ..._ _ _ __'""" -. .. ... .. -
This book is concerned with problems of monopulse radar. In
it are 'examined the design principles and the fundamental functional
units of monopulse systems of direction finding; questions of accuracy
and resolution' are analyzed. Theoretical questions of the simulation
6f-nonopuise systems with the aid of electronic computers are dis-
cussed; an analysis is made of interference shielding of monopulse
position finders in the presence of various forms of interference.
Pields of application are described and the fundamental tactical-
technical characteristics are given for some foreign monopulse radars.
This book is designed for engineers, technicians, and students
of advanced courses at higher educational institutions which
specialize ia the field of radar technology.
This book contains 10 tables, 166, figures and 134 references.
FTD-MT-24-982-7J.
f . '1%
-iNTRODUJTION
Beca,:i, ofrthe substantial increase in the-speed Of aircraft,
the development of rocket and extraterrestrial technology, and also
ýthe improvement of jamming faci-lities, accuracy requlrements have
býecome strictdi, also the definition of angular coordi.nates,, the rate
of dataprocessing., and the requirements for interference shielding
of radars. These req2irements, to a certain extent,,have been satis-
fied by monopulse ratar systems which, in the last decade, have been
widely distributedabroad.
Initially, monopulse radar systems implied pulsed radars which
accomplished multichannel reception and were able, in principle, to
measure angular coordinates according to one pulse reflected from
the target. Subsequently, this concept was expanded and encompassed,
in addition to pulsed radar, radars with continuous and quasi-
continuous modes of emission. *Sometimes systems with instantaneous
comparison of signals are called monopulse systems.
Because of the intense development of monopulse radars, much data
concerning the indiviLdual problem of monopulse radar have been
published. This in''ormation is found mainly in articles and advertise-
ments, as well as 'various periodicals and patents. As of yet there
have been no books covering the subject of monopulse radar thoroughly.
Monographs by D. R. Rhodes [41 and E. F. Svirdov [45), dedicated to
the general theory and the comparative effectiveness of several types
of monopulse systems, do not cover the entire range of questions
which are of interest to persons specializing in the field of radar
and jamming. Hellgren's work [55) does not touch upon a number of
problems of practical importance in monopulse radar.
S:In this book we have attempted, as much as possible, to correctthis defici~ncy in literature and have arranged the chief problems
of monopul radar in a systematized form, making this available to
a wide cizi',~e of specialist3 in the field of radar.
FTD-MT-24-982-71 2

-We,:have used in this book open material from the foreign and
*domestic p0,'ess, as well as information from studies carried out by
the authors. Chapters 1 (except for § 1.5, 1.6), 2 (except for
§ 2.5), 3.9 and § 5.4, 6.2.1 were written by A. I. Leonov. Chapter
8 was written by A. I. Leonov with the aid of V. N. Vasenev and
F. V. Nagulinko. Chapters 4, 5 (except for § 5.4), 6 (except for
§ 6.2.1), 7 and § 1.5, 1.6, and 2.5 were written by K. I. Fomichev.
The authors express their sincere appreciation to S. I.
Krasnogorov and E. F. Sviridov for their valuable remarks during
the review of the manuspript. Particular thanks are expressed to
E. F. Sviridov for his aid and helpful criticism in preparing the
book for print.
FTD-MT-24-982-71 3
CHAPTER I
THE PRINCIPLE ANDMETHODS OF MONOPULSE RADAR
§ 1.. PRINCIPLE OF MONOPULSE DIRECTION FINDING
Determining the direction to a target is one of the basic tasks
of a radar.
Until recently, the most widely used methods of determining,accurately and automatically, the direction to a source of signals
were methods of conical, linear (planar) scanning and sequential
switching of radiation patterns, which were performed by single-
channel direction finders. Based on these methods, the direction
to a source was determined by a comparison of signals received
sequentially by antennas with various radiation patterns. Character-
istic of these methods is also the fact that angular information
about the target is shaped in the form of amplitude modulation of
signals received. The modulation index determines the value of
error in direction finding, while the phase is the direction of
antenna axis mismatch with respect to the direction to the targetbeing worked.
Since the modulation method of angular error signal shaping
requires the reception of sequentially reflected pulses, it is
sensitive to amplitude fluxuation in the signals received, generated
by random variations in the effective scattering cross section of
the target. This is one of the most substantial deficiencies of
single-channel methods of direction finding, using conical and linear
scanninS of a beam or the sequential switching of radiation patterns.
Recently achieving. wide use' has yn the monopulse method of
direction 'inding, with which the reflected pulse gives complete
information on the angular position of the target. This explainsthe origin of the term "monopulse"t (one-p'alseY direction finding..
Since -in.monopulse systems direction findingis accomplished with
one pulse, the amplitude fluctuations of the reflected iignal do not
have a noticeable effect on the measurement ac.curacy of angular
coordinates.
Multichannel reception can be used for monopulse direction
finding. Therefore, the principle of mon~pulse direction finding
lies in the reception of signals reflected from a'target simultaneously
along several independent receiving channels with the subsequent
comparison of their parameters. Usually', two independent receiving
channels are provided for each coordinate plane; two channels for
azimuth and two channels for elevation.
Originally the monopulse method was developed for precise
automatic target tracking. Today the monopulse method is also used
for monopulse surveillance radar systems. Under surveillance we
include monopulse systems which determine the angular coordinatesof all targets found within the radiation pattern and which can be
resolved with respect to range, for each position of the beam in
space. As a rule, electric beam control is used in monopulse surveil-
lance systems, and they are coupled with electronic computers which
perform programmed control of the beam position in space in accor-
dance with a selected surveillance method, determine the coordinates
of all targets located in the beam, and plot their trajectories.
There are two basic methods of monopulse direction finding,
depending upon the character of the extraction of the target's
angular information from the signals received: the amplitude method
and the phase method.
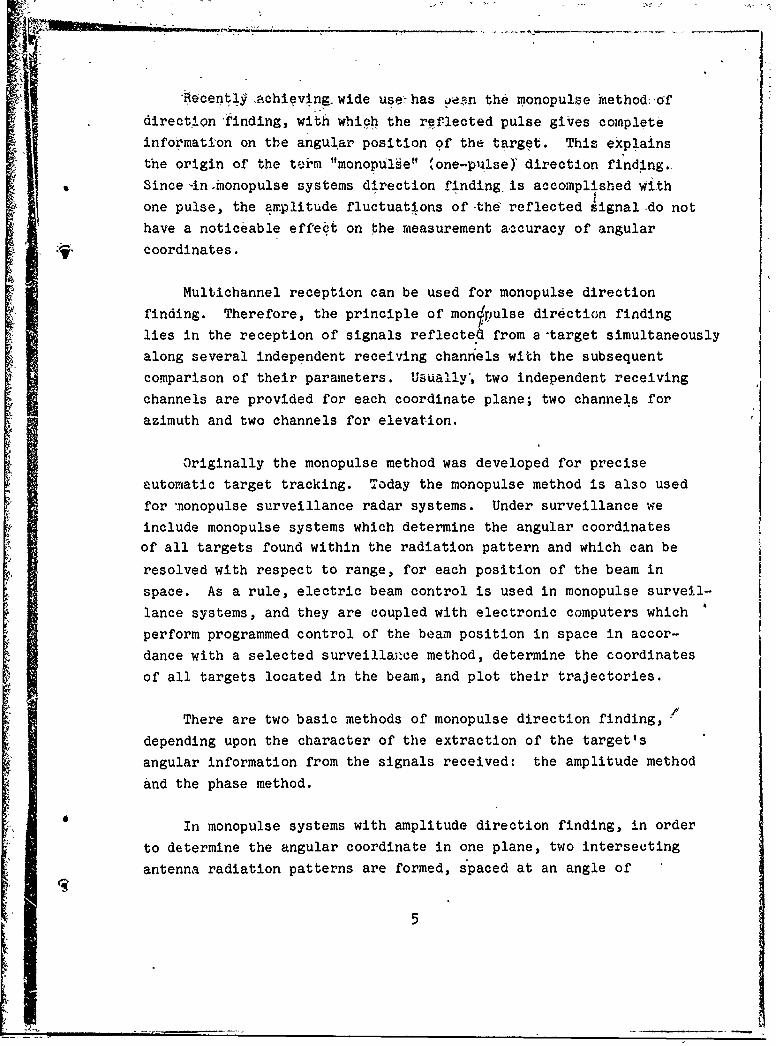
In monopulse systems with amplitude direction finding, in order
to determine the angular coordinate in one plane, two intersecting
antenna radiation patterns are formed, spaced at an angle of

S0•jfrom the equisignal, direction (Fig. 1.1). Figure 1.1 shows the
radiation patterns in the elevation plane. When the circuit deviates
by angle 6 from the equisignal direction (RSN) and the target is
found at point A, the; signal received along the lower pattern is
greater than the signal received along the up~per pattern. The differ-
\ence in amplitudes of the signals received indicates the amount of
target deviation from equisignal direction. 'lie sign of this differ-ence characterizes the direction of the displacement of equisignaldirection relative to the target. When equisignal directior? coincides
With the target,"the amplitudes of reflected signals received along
both patterns are equal, and their difference reverts to zero.
Target azimuth is determined similarly with the aid of the azimuth
channel of the receiver and the second pair of radiation patterns in
the azimuth plane.
PC"* U* •A
* "7
Fig. 1.1. Determining angular coordinates in monopulse systems withamplitude direction finding.
In monopulse systems with phase direction finding, the dii'ection
to target in one coordinate plane is determined by a comparison of
phases of signals received by two antennas. In the remote zone each
antenna irradiates the same volume of space, as a result of which
reflected signalts originating from a point target are virtually
identical in amplitude but differ in phase. Figure 1.2 shows two
antennas a distance of I from each other
6
_ _1

The line of sight. of the target forms angle e with the. axis
perpendicular* to, the line connecting both antennas, i.e., equisignal
direction. The distance between antenna 1 and the target Is
and the distance between antenna. 2 and the target is
R2, R 2- sin 0.
(1)
Fig. 1.2. Determining aingular co~ordinates and monopulse systemswith phase direction finding.KEY: (1). Target; (2) Antenna 1; (3) Antenna 2; (4l) ESD.
The difference in distances from target to antennas
AR- - R1 I sin 0
gives a phase differ'ence of
where X is wavelength.
7
I°
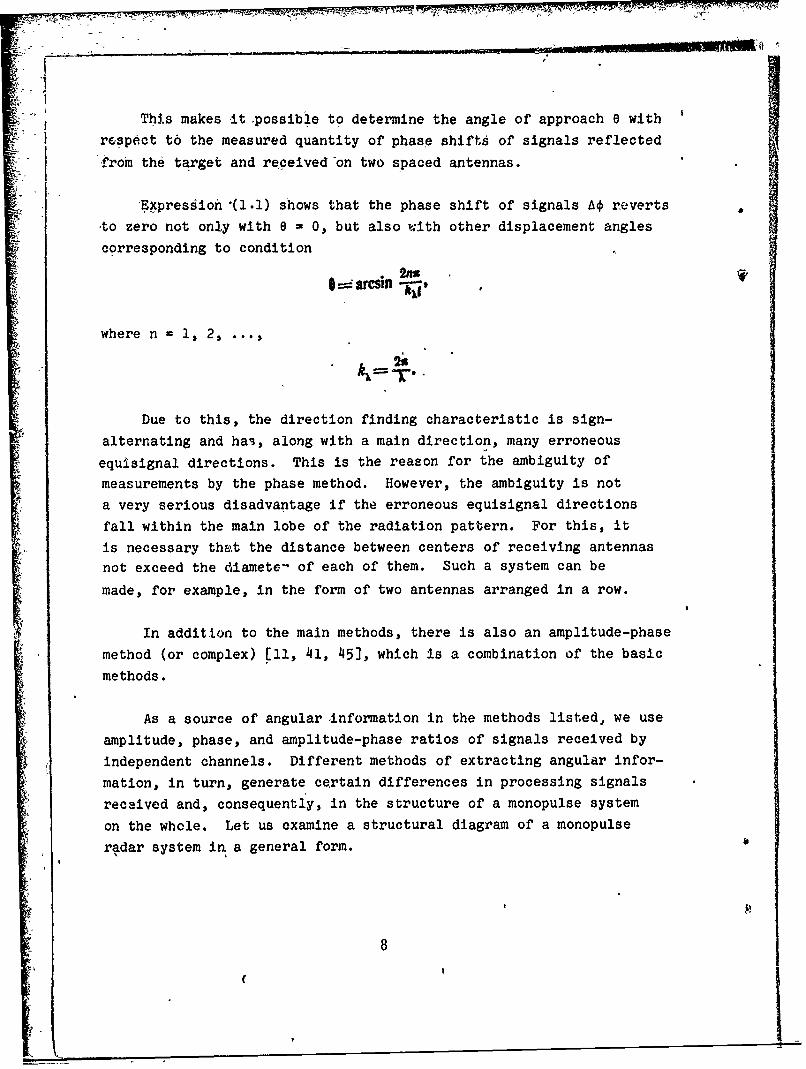
This makes it .possibie to determine the angle of approach 6 with
respect t6 the measured quantity of phase shifts of signals reflected
from the target and received'on two spaced antennas.
Expression (1.1) shows that the phase shift of signals AO reverts
-to zero not only with 6 = 0, but also with other displacement angles
corresponding to condition
i arcsin
where n =, 2,
2%
Due to this, the direction finding characteristic is sign-
alternating and ha3, along with a main direction, many erroneous
equisignal directions. This is the reason for the ambiguity of
measurements by the phase method. However, the ambiguity is not
a very serious disadvantage if the erroneous equisignal directions
fall within the main lobe of the radiation pattern. For this, it
is necessary that the distance between centers of receiving antennas
not exceed the diamete' of each of them. Such a system can be
made, for example, in the form of two antennas arranged in a row.
In addition to the main methods, there is also an amplitude-phase
method (or complex) [11, 41, 45], which is a combination of the basic
methods.
As a source of angular -information in the methods listed, we use
amplitude, phase, and amplitude-phase ratios of signals received by
independent channels. Different methods of extracting angular infor-
mation, in turn, generate certain differences in processing signals
received and, consequently, in the structure of a monopulse system
on the whole. Let us examine a structural diagram of a monopulse
radar system in, a general form.

1.2\0 STRUCTURAL DIAGRAM OF A MONOPULSERADAR'SYSTEM
Asmentioned above, in monopulse systems, the information
concerning the angular position of a target is obtained by comparing
oPairs of received signals. With such a comparison the voltage at
output of the mOnopulse angular measuring system does not depend
u.•pon the absolute value of the amplitudes of received signals, but
is determined only by the signal arrival angle. The direction
finding characteristic of a monopulse system must indicate the value
,and'sign of the arrival angle of the received signal, i.e., must be
an uneven actual function of the signal arrival angle. The initial
data concerning the arrival angle, contained in the signal pair, are
formed upon reception by the monopulse antenna, which is called the
angle-data transmitter.
In accordance with these assumptions, the signals received must
be handled so that there can be obtained a function, a rubstantial
part of which would satisfy requirements imposed on direction finding
characteristics (independence of signal intensity and oddness relative
to equisignal direction).
Let us examine analytically the possible solutions to the
problem posed [41, 45]. The field strength at the point of reception
in complex form can be written as a function of time t:
S ,exp i(t O t<T. (1.2)
where Em is amplitude;
w is frequency;
€0 is initial phase of field.
• The radiation patterns of the antenna system, which are complex
"functions of the angle, are expressed by relationships
S(0) = P, (0)exp i T,(1.3)
S (0) =- F(O) exp i% (0)(9.

,,, _________________________ -,-I - "---- -", I -!
where Fi(e) and F2 (e) are amplitude radiation patterns;
(e) and 02(O) are phase radiatibn patterns.
eahPhase, 'radlatilon patterns wfll be assumed mirror reflections of *
46edch, ot~her relative to equisignal direction, while ýmplitude radiatlon,
patterns are identical and their maxima displaced by angle +8eO rela-otive to equisignal direction, i.e., ,
•~ l l= (00 -6). ( 1.)4)o. o) 1
where 0(0) is the difference-phase radiation ,pattern of the antenna
system.
Reflected signals which are received by the spaced antennas can
-be written as:
.. d t, 0oE)= ( f,(0). ,. (1.5' ~(1.5) !
SI I I
Then the ratio of the two received signa&s can be writtern as
r) ,( TT " ' (1.6)
The ratio, which subsequently will be called multýplicative,under certain conditions, can be the basic ratio for forming adirection finding characteristic.
In order to form a direction finding characteristic, we can also
use the ratio of the difference signal to total signal
r. 11 =e•, t, ) - Its 0,1 ,0•-• )
10
10
I .1
I *

V 3{
'which is usually,'called the additive ratio of received signals. The
relationship between multiplicative and additive signal ,ratios is
esiabli'shed'with ,the aid of the followifig .expressions:
.32SI
I~ ~ +4 (0) 'p "A-h1+ --!,,(81) (1.8)
In addition to multipl-icative and additive- ratios, we can form other
ratios which sdtisfy. requireme'nts imposed on the direction finding
characteristics of a monopulse system, When we multiply multiplicative
and additive ratios by a complex constant.3I I •4
a,, aexpwe. obtain linearly transformed ratios C45]:
' ,1 7 (0) ai*,, (0). (1.9)
Devices whfoh form the sum and difference of received signals-or perform the operation of multiplying received sj~gnals by coeffi-
cient a are called convertdrs since~in them, generally, we canconvert information from amplitude ratios to phase ratios and back.
Thesb conversions are a~complished usually at high frequencies with
the use of passive elements because of their relative simplicity
and stability of characteristics.
The operation of calculating the ratio of two signals, converted
or unconverted, cannot be done without their preliminary amplifica-
tion. iThe device coptaining active elements, including amplifiers
and comparison circuit, which distinguishes multiplicative andadditive ratiosland forms-the direction finding characteristic, is
e called the angular discriminator.:
I-
!1
77 ,
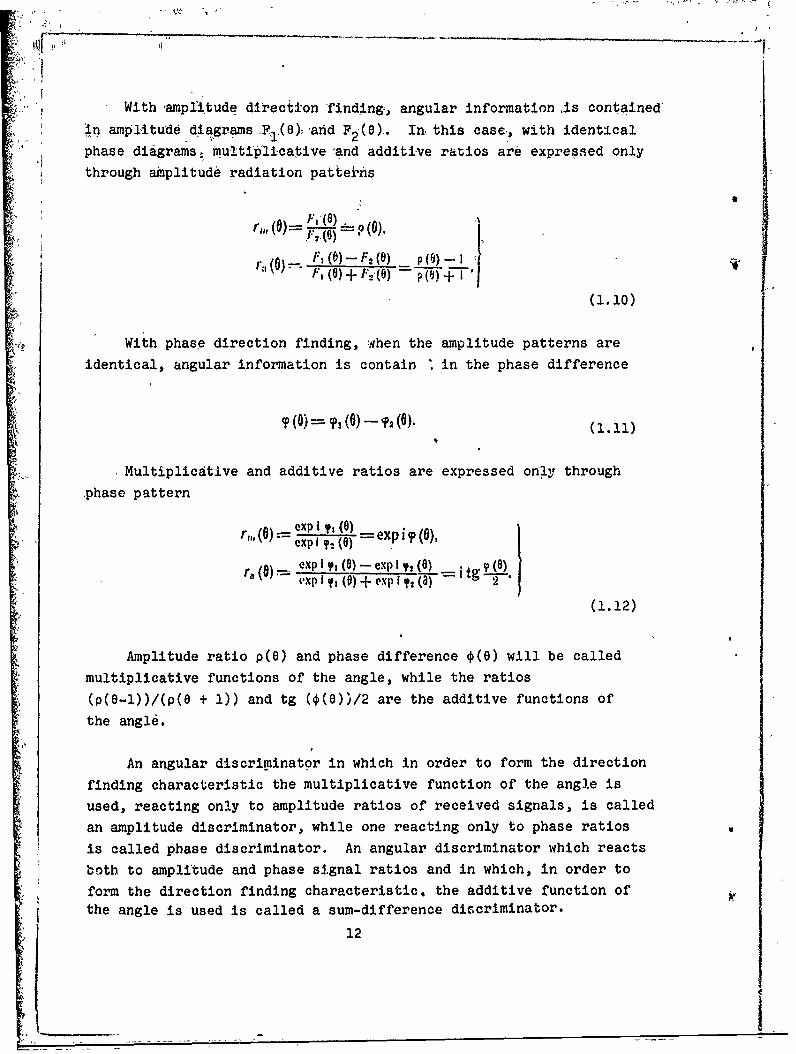
With ýamplitude direction Ifinding,, angular information ,is contained
in amplitutd6 diagrams F I(e); and F2(e).. In., this case,, with identical
4 phase diagrams, multiplicative 'and additive ratios are expressed only
through amplitude radiation patterns
r,, O8=.-- F, p(O), 1r ,. I.:,(8).....oF(0), pO-
() (6) - F2 (0) p (6) -j.
I.(JO)O TT
- -- t(1.10)With phase direction finding, when the amplitude patterns are
identical, angular information is contain in the phase difference
I-2
* Multiplicative and additive ratios are expressed only through
phase pattern
( exp I T2 (0) - eerxp, (0) -=x)p 12(6)
exp,, (6) - exp i ,() = i tg I( 'X) p i yT (0) + Cxp ! ?2 (.) 2"
(1.12)
Amplitude ratio p(O) and phase difference *(O) will be called
multiplicative functions of the angle, while the ratios
(p(O-l))/(p(O + 1)) and tg (0(0))/2 are the additive functions of
the angle.
An angular discriminator in which in order to form the direction
finding characteristic the multiplicative function of the angle is
used, reacting only to amplitude ratios of received signals, is called
an amplitude discriminator, while one reacting only to phase ratios
is called phase discriminator. An angular discriminator which reacts
beth to amplitude and phase signal ratios and in which, in order to
form the direction finding characteristic, the additive function of
the angle is used is called a sum-difference discriminator.
12
S'
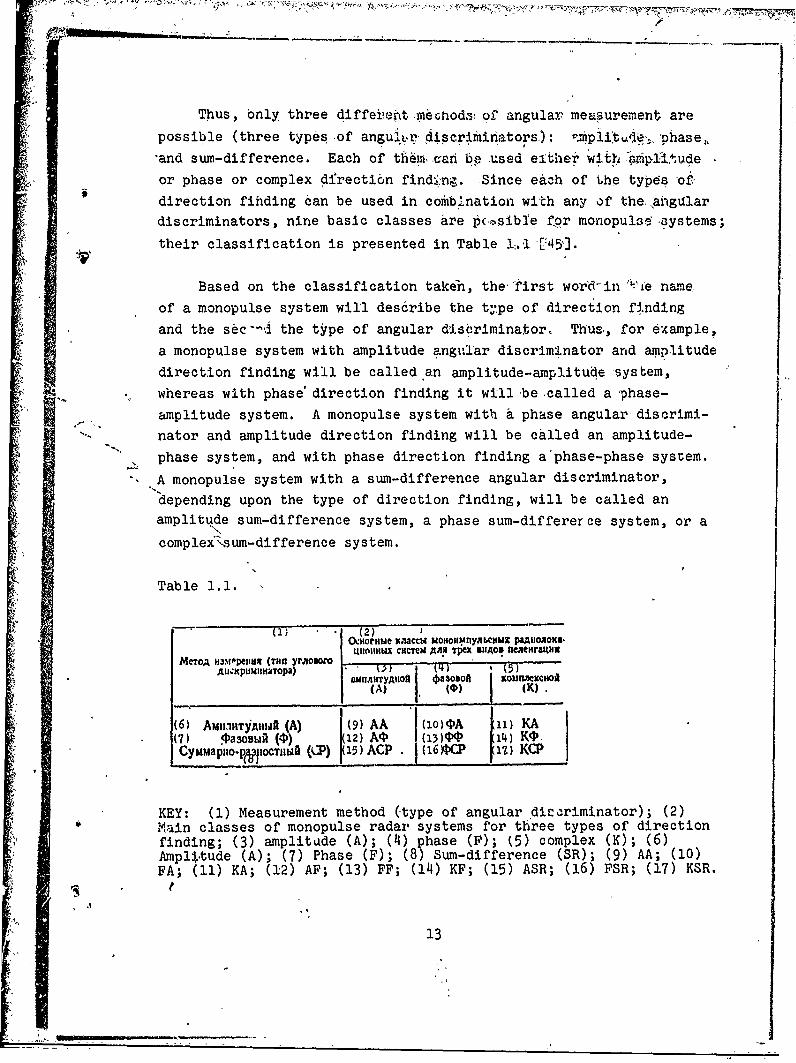
Thus, only three diffeireit ,mebnodsý of angular measurement are
possible (three types of angultr- discrlminators.): 'mpli~tado,, phase,,
-and sum-difference. Each of them man b! used eitiher w th -a 1itude
or phase or complex direction find•;ng. Since each of the types of-'
direction fihding can be used in combi1bnation with any of the ,aiigilar
discriminators, nine basic classes are p(c-sible for monopulseizystems;
their classification is presented in Table 1.1 [-45'].
Based on the classification taken, the 'irst word-in •,ie name,
of a monopulse system will describe the ty:pe of direction finding
' and the sec--'d the type of angular ds'I.riminator. Thus, for example,
a monopulse system with amplitude angular discriminator and amplitude
direction finding will be called an amplitude-amplitude system,
whereas with phase' direction finding it will be .called a phase-
amplitude system. A monopulse system with & phase angular discrimi-
"nator and amplitude direction finding will be called an amplitude-
phase system, and with phase direction finding a'phase-phase system.
".,A monopulse system with a sum-difference angular discriminator,
depending upon the type of direction finding, will be called an
amplitude sum-difference system, a phase sum-differerce system, or a
complex"-sum-difference system.
Table 1.1.
*)(2) -OHorHome KJUaccu MOHOIIMIly•!bCIHU paAHIOROKS•
WIoDwlX cHCTeU AAR IpeX BUAoD UCAeeragNSMCTOA H3M.% )IMJ (Vin yrJioO"
AII.KPUMM~TOPa) -1 ) (0. )(K• m"Airry"~of 030o5o0 Kounaexc~oO(A) . ()(K).
(6) AMt.1HTYAHuAR (A) 1(9) AA (io)4A iii) KA(7) 4Pasosug (4)) 12) A4• (3)44' 1') Kit',CyUMapno-P•pocTIluA (t_?) 15) ACP 1(16 CP 7)
KEY: (1) Measurement method (type of angular di-criminator); (2)Main classes of monopulse radar systems for three types of directionfinding; (3) amplitude (A); (4) phase (F); (5) complex (K); (6)Ampli.tude (A); (7) Phase (F); (8) Sum-difference (SR); (9) AA; (10)FA; (11) KA; (12) AF; (13) FF; (14) KF; (15) ASR; (16) FSR; (17) KSR.
13

Fig.la3. Block diagram,of a monopulse system.KEY: (1), Angle-data transmitte"; (2),Information donverter; (3)Angular disciiminat6r. °
Of !the nine possible classes of monopulse system, indicated in
Table 1.1, four systems are the most widely used: amplitude-amplitude
(AA), phase-phase (FF), amplitude sum-difference (ASR),, and phase
sum-diiference (FSR). These monopulse systems will be examined later.
Based on the sequence of operations performed by the monopulse
system, its structural diagram must contain the following basic
elements (Fig. 1.3):
- an angle-data transmitter which forms signals in whose parameter
ratios is contained information concepning the angular position of
the target;
- an information converter which converts the signals' parameter
ratios;
an angular discriminator which distinguishes the actual function
of the signal's parameter ratio uniquely connected with the arrival
angle.
The angle-data transmitter is the antenna of the monopulse system
and the most important element. It possesses certain peculiarities
which will be examined in detail in Chapter 2.
As a converter in monopulse systems is used, a 1/2 phase switcher
which pet-forms the operation of multiplidation by +_i, and a sum-
difference converter, for which an annular wavegulde bridge or double
wavegide T-Joint is used. (The ,sum-difference converter is also
discussed in Chapter 2.)
14
A21A
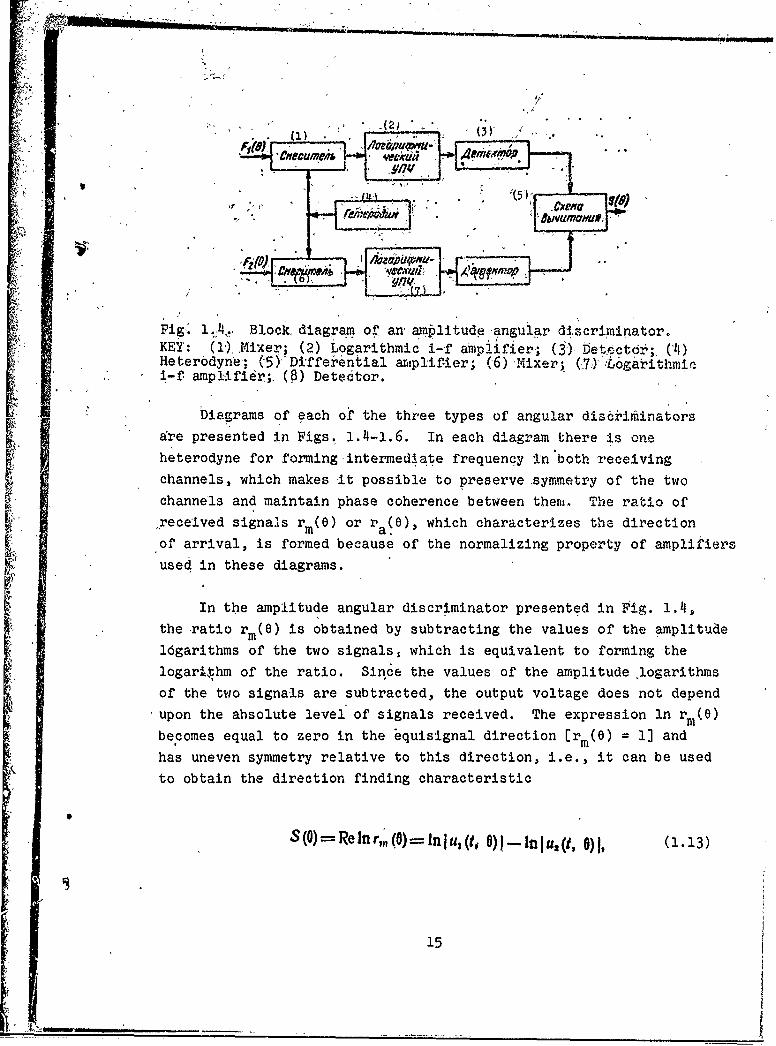
Pig.. 1,i4ý,. Block diagram or an amKlitude angular discriminator.KEY': (1), Mixer; (2) Logarithmic i-f amplifier; (3)Detector; (4)Heter6dyne; (5)' Diffe'ential amiplif'ier; (6) Mixer; (•7)}'Logarithminii-f amplifier;. (8) Detector.
Diagrams of each of the three types of angular disc.ýiiiinatorsare presented in Figs. 1.4-1.6. In each diagram there is oneheterodyne for forming intermediate frequency in both receivingchannels, which makes it possible to preserve symmetry of the twochannels and maintain phase coherence between thent. The ratio of°.received signals rm(e) or ra e), which characterizes the directionof arrival, is formed because of the normalizing property of amplifiers
used in these diagrams.
In the amplitude angular discriminator presented in Fig. 1.4,the ratio rm(0) is obtained by subtracting the values of the amplitude16garithms of the two signals, which is equivalent to forming thelogarthm of the ratio. Since the values of the amplitude logarithmsof the two signals are subtracted, the output voltage does not dependupon the absolute level of signals received. The expression In rm(e)becomes equal to zero in the *quisignal direction [rm () = 1] and
has uneven symmetry relative to this direction, i.e., it can be used
to obtain the direction finding characteristic
S (O)-Re In r, ()- In lu, (t -lnlu,(t, I)1, (1.13)
15

where [ki-(It; i ) and Ju2(t, e6)1 are signal amplitudes at output ofSre6e'iving-amplifying channels as a 'funCtionof time and angular error
"in direction finding..
Phase dirferenoei }between signals at ,amplifier ,nput does not,affect the ratioj/()' since dignals Are, detected before, the amplitude
S iog&rithms f ,these, signals are subtracted.'
" n• the phase angultr discriminator with normalization, it is
Wrcesarzy to eliminate amplitude modulation. For this either amplifiers
iwith l:imita~tion (Fig. 1.5a) are ,used, at whose output the amplitudes
do not 'depend" upon the Amplitude@ of' the signals received, or indepen-dent aiutokati-c regulation of amplification in bhoth channels is used(Fig. l,5b).. To form the direction finding characteristic' we can use
'function ,-±r (8), determined by equality (1.12), since its effective
'part
• -S (O) P e --i exp i 1 (0)] =sini 7 (0),
S(1.14)
does ,not take into account the amplitude ratios.
In a, sum-,difference angular, discriminator the ratio ra(B) i6aensured by the automatic adjustment of amplification in both channels
in order to form the voltages of which the 'total signal is used
(Fig. 1.6). As a result, there is a normalization of the amplitudesof the sum and difference' ignais with respect to the amplitude of
the sum signal.
W7In order to obtain the direction finding characteristic, the
additive function of ihe angle is used; then with identical receivingchannels', in the case of amplitude direction finding,
S = (O) T (a) FS ( F) , (1.15)
16
and ir. the case of phase direction finding,-
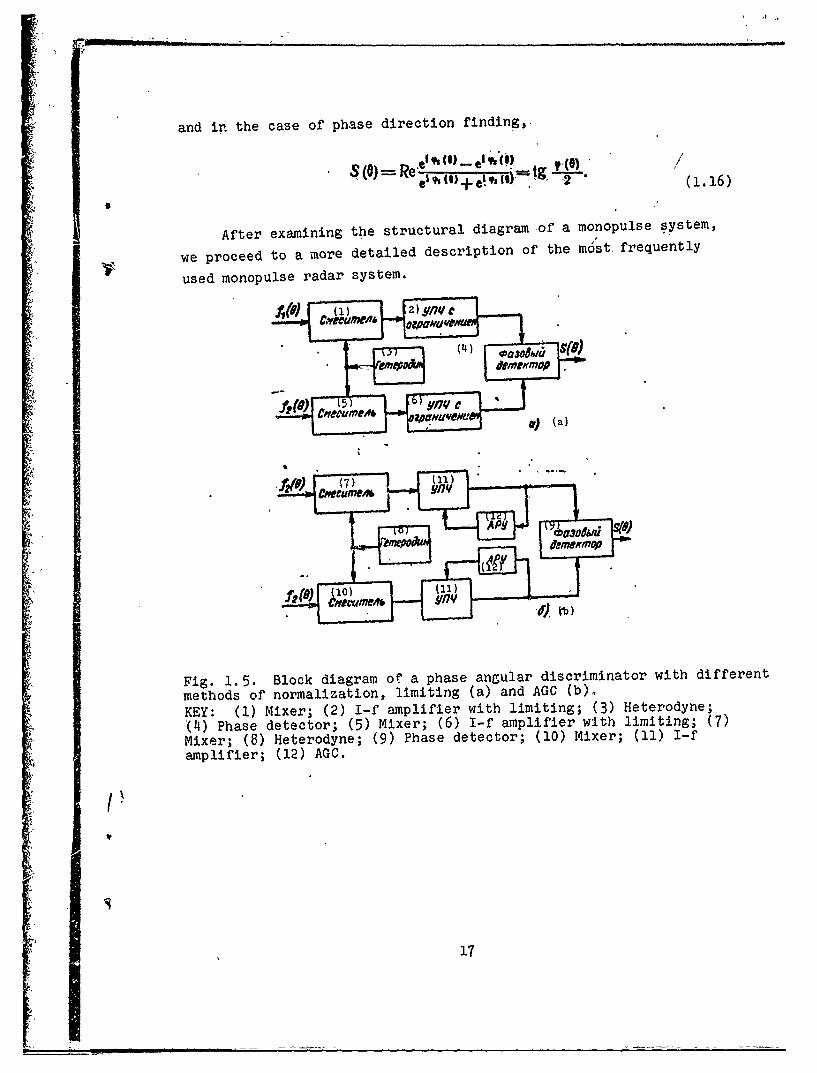
el•(o______ _e yl() %/S()=Rei•()÷!•€)-- tg -2,(i 1(1.16)
After examining the structural diagram of a monopulse system,
we proceed to a more detailed description of the most frequently
used monopulse radar system.
Fig. 1.5. Block diagram of a phase angular discriminator with differentmethods of normalization, limiting (a) and AGC (b).
4 KEY: (1) Mixer; (2) I-f amplifier with limiting; (3) Heterodyne;'(4) Phase detector; (5) Mixer; (6) I-f amplifier with limiting; (7)Mixer; (8) Heterodyne; (9) Phase detector; (10) Mixer; (11) I-famplifier; (12) AGO.
4. .•17
17Om/ro•

- Eig. 1.6. Block diagram of sum-difference angular discrimin.dtor.XE•: (1) Difference channel; (2) Mixer;• (3) Heterodyne; (J•) Pha.eC-•tector, (5) Mixer; (6) Sum channeJ.; (7) I-f amplifier; (8) AGO.
§ 1.3S. MONOPULSE RADAR SYSTEMS OF AUTOMATICTARGET TRACKING
1.3.1. Amplitude-amplitude monopuise system-. As discussed in
§ 1.1, in monopulse systems with amplitude direction finding, thereception of signals reflected from the target is carried out withI' the aid of the antenna system forming in each coordinate plane
two beams deflected from the equisignal direction by angle +_e0 (Fig,
1.i).i+
V.2(4)7
Fig. 1.7. Block diagram of amplitude-ampliuder mdnpiserisystemof.
KE: (1) Mixferecchnl; (2) Logarithmic iHeaplf er;o(3) netco; (P.i)
(7)Error sp() Mixer; (9) La h i-f amplifier; '•I.1.3-. Blc igrmo mplitude-amplitude monopulse system- AsdscsedI
1.1,dinecenve swich sysem wited.he amliud difrection fpindingth
receptionro signals refleted from Miher t9.oargethmiscarr piiedru;wt
(10) Detector; (l1) Antenna control system; (12) Transmitter.
18
FA

Tfii unbalance with respect to signal amplitude in the independent
receiving channel is more directly related with tracking error, thegreater this error is. In the absence of mismatch, signals receivedby independent channels are equal in amplitude. In accordance withthis, direction finding of targets is achieved by turning the antennasystem up tDo''the moment of amplitude equality for signals received.
Figure 1.7 presents a simplified block diagram of an amplitude-amplitude monopulse system for target direction finding in one plane,in which normalization is, accomplished with the aid of logarithmici-f amplifier.
if' nto the input of the antenna signal i(t) = Emeimt enters,
reflected,.from the target, when the target deviates from equisignaldirection by angle 0, at antenna output of the first and secondchannels the signals received will be determined by expression
/ E1 (t, 0) E-Fj (0) exp iW EjF (0. -- 0) exp ica,
S2 (t, 0) = EmF, (0) exp imt E.F (0 +06) exp i wt.
(1.17)
After frequency conversion, amplification on intermediatefrequency, and linear detection, signals at the input of the
differential amplifier are equal to
u, (0) = In KEmF (0. - 0),
u, (0) =in 1:EmF (0- + 0),(1.18)
where k1 and k2 are signal transmission coefficients in the channels.
At the. output of the differential amplifier we obtain
_(_)_I n. ( 1 . 1 9 )
19
S[I I I II il

• Ezror signal from output bf the differential amplifier is fed
,to the amplifier 'and then to the antenna control system.
From-equality (1.19) it is apparent that the direction findingcharacteristic in such a monopulse system depend`3 upon the radiation
patternsi the properties and ,identical nature o'.' the logarithmic
amplifiers., Therefore, instability and nonidentity of amplitude
characterfstics of the logarithmic amplifiers lead to a distortionin the ,direction finding characteristic and, consequently, error in
detevining direction to target.
/,/ With identical receiving channels (kI = k2 = k) and 'small
/angular errors, expression (1.19) can be written in the following
form:
where F(F 0 ) is the anOplification factor of the antenna in the (1.20
signal direction;
j iis the ~steepness of the working section of the antenna radia-tn,on pattern.
The need to maintain high identity in amplitude characteristicsof the amplifier is the main disadvantage of the system with an
amplitude angular discriminator.
1.3.2. Phase-phase monopulse system. A simplified block diagram
of a phase-phase monopulse system which ensures direction finding in
one plane is presented in Fig. 1.8. In this system signal reception
is performed by an antenna syr em which forms, in each coordinate
plane, two beams oriented in parallel.
20
-• -
/ r
II I nuei.7/•[I, e U/nU•M
~(8)
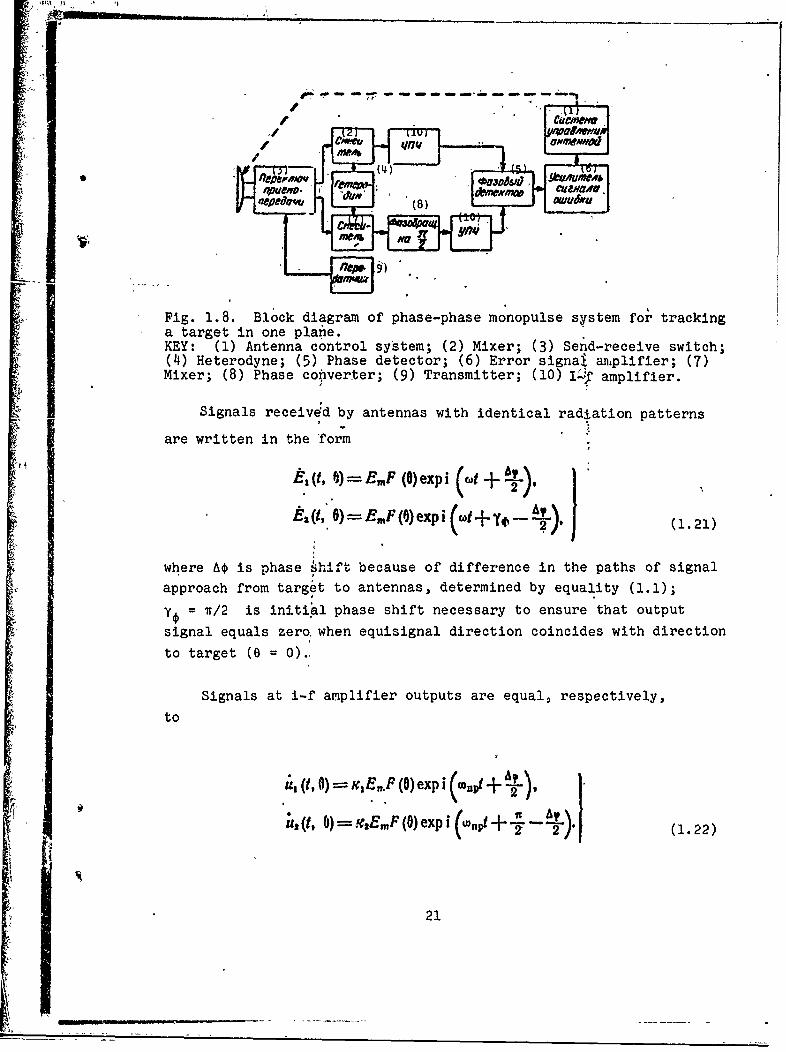
Fig. 1.8. Block diagram of phase-phase monopulse system for trackinga target in one plane.KEY: (1) Antenna control system; (2) Mixer; (3) Send-receive switch;(4) Heterodyne; (5) Phase detector; (6) Error signal anmplifier; (7)Mixer; (8) Phase cooverter; (9) Transmitter; (10) I-f amplifier.
Signals received by antennas with identical radiation patterns
are written in the 'form
EX E 1 , ,) EMF (O)expi A"
* ~ ~ ~ ~ o +2 t 2)m(~xi~$YA) (1.21)
where AO is phase 9Jft because of difference in the paths of signalapproach from target to antennas, determined by equality (1.1);
1= T/2 is initial phase shift necessary to ensure that output
signal equals zero, when equisignal direction coincides with direction
to target (0 = 0).,
Signals at i-f amplifier outputs are equal*, respectively,
to
.uK (t, 0)F 2E,.P (0) exp i +
U, (t, )"-aEmF (O) expi 2 (1.22)
21
"-Wheh limiting is,.used for 'standardiiation, s.'iýki1 -at input:
of -the phase detectd.6i can be represented 'in the, form of ,the followingpexpression
ia (t, i)--.or,,eXp . (;,, ! 1; T
Q~3 , 2).Morp2"(1.23)
where Uorp is the threshold of amplitude limitation.
If the amplitude detector and the phase detector are 6perating
in the square-law detection mode, i.e., the phase deteotQr performs
the multiplication and averaging of input signals, the signal at
output of the phase detector can be written in the form
S(0)-=,4_ Re [4',(t, 0) i&'s(t, 0)1, (1.24)
where k is the transmission factor of the phase detector.
Consequently,
s (p) == K$U'• si.n AT. (.•S(A)K grp 'n (1.25)
Substituting in place of Aý its value from (1.1), we obtain
S U2 Sit, w sine- (1.26)
The error signal from the phase detector is fed to the., error
signal amplifier and then to the antenna control system, which turns
the antenna to the necessary angle.
The main disadvantage of systems with a phase angular discriminator,
as will be shown in Chapter 6 in detail, is the considerable depen-
dence of direction finding accuracy on the identity of the phase
characteristics of the receiving channel and their stability.
22
1ji~~~- --- --- -- - --------.
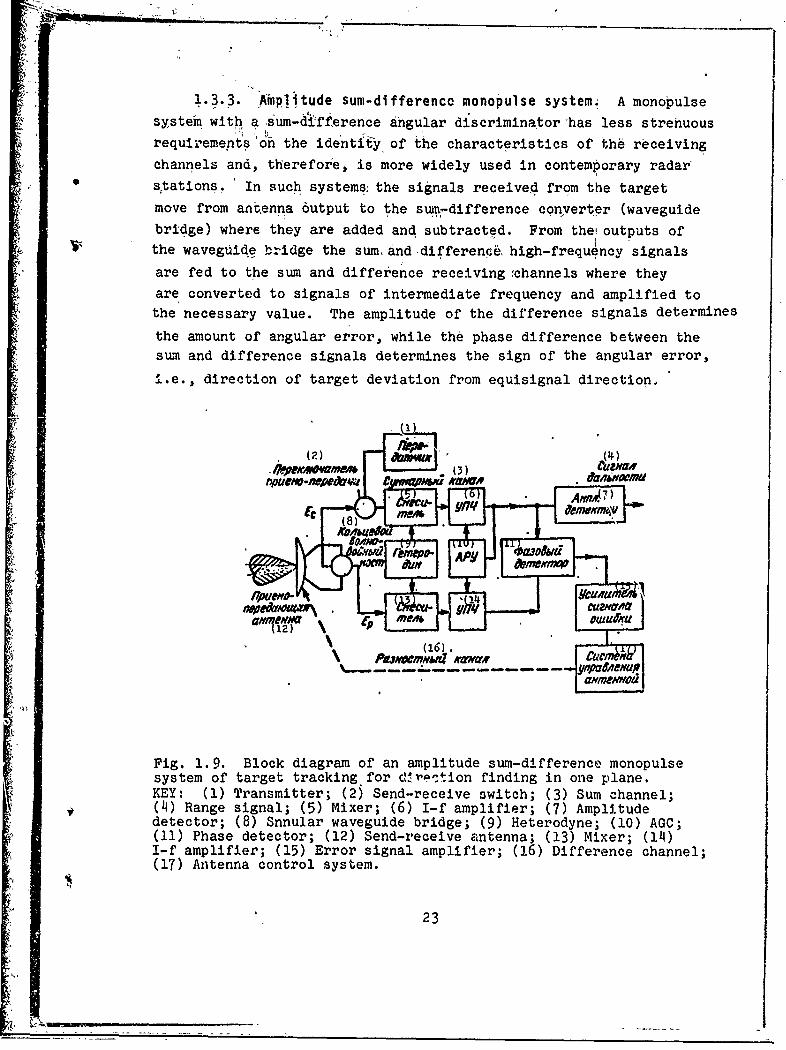
1.3.3. •Amplitude sum-difference monopulse system. A monopulsesystem with a sum-difference ahgular discriminator -has less strenuousrequirements on the identit:y of the characteristics of the receiving
channels and, therefore, is more widely used in contemporary radar's~tations. In such systems; the signals received from the target
move from anDenna 6utput to the sui.i-difference converter (waveguide
bridge) where they are added and subtracted. From the• outputs ofV the waveguide b~ridge the sum• and differenc., high-frequency signals
are fed to the sum and difference receiving :channels where they
are converted to signals of intermediate frequency and amplified tothe necessary value. The amplitude of the difference signals determines
the amount of angular error, while the phase difference between thesum and difference signals determines the sign of the angular error,
i.e., direction of target deviation from equisignal direction,
(•.) •(4)
Pa1 Yeamrn4 W
KE: 1 Tasmter;() edreev swth (3 um canel
a () (16).
Fig. 1. 9. Block diagram of an amplitude sum-difference monopulsesystem of target tracking for d,•-•'tio.n. finding in one plane.KEY: (1) Transmitter; (25 Send-receive switch; (3) Sum channel;(4) Range signal; (5) Mixer; (6) I-£ amplifier; (7) Amplitude
detector; (8) Snnular waveguide bridge; (9) Heterodyne; (10) AGC;(11) Phase detector; (12) Send-receive antenna; (13) Mixer; (14)I-f amplifier; (15) Error signal amplifier; (16) Difference channel;(17) Antenna control system.
23
,!

, - ,I ;
-1
A blok, diagram of an amplitude sum-.dgfferende monopulse system
for direction finding In one plane is presented•in Fig. 1.9. Signals
at antefina output of the first and-second channels with small target
deviations -from equisignai, directi'bn ard determined by, ekpressiohI I I I
,1!, 6)= E',.P,(O) exp'i wt E ..F (*.-- 0) exp i.,t-=EmF (00)(1,+ pO) expht I
(,. ()-,, IeipiW= Emf(O.+1)eip o (1.27)*EMF (0)( -Oexp ie...
The sum and difference signals at output of the waveguide bridge,
taking into account the power balance, assumne the form4 !
tl,0)-- JE': " ) '
V! E=F , (0o) ,Wexp i at.
The dependence of the error signal op amplitude of received
signals is eliminated ,by the AGC sys'tem.
After frequency conversion and amplification, taking into accoUnt
the work of the AGC system, at input of the phase detector thq sum
and difference signals can be represented by lexpression
* 4 I
C (fl, ()9exp)iup~~~t,& e)-.-p Oxp i(6.9fI+[-?)o•
Swhere *l and 2 are the phase shifts in the channels.I , I
w r 1
At phase detector output we obtain
II
24
II
• -• -• -• .. . | ' ' . -
i I , .
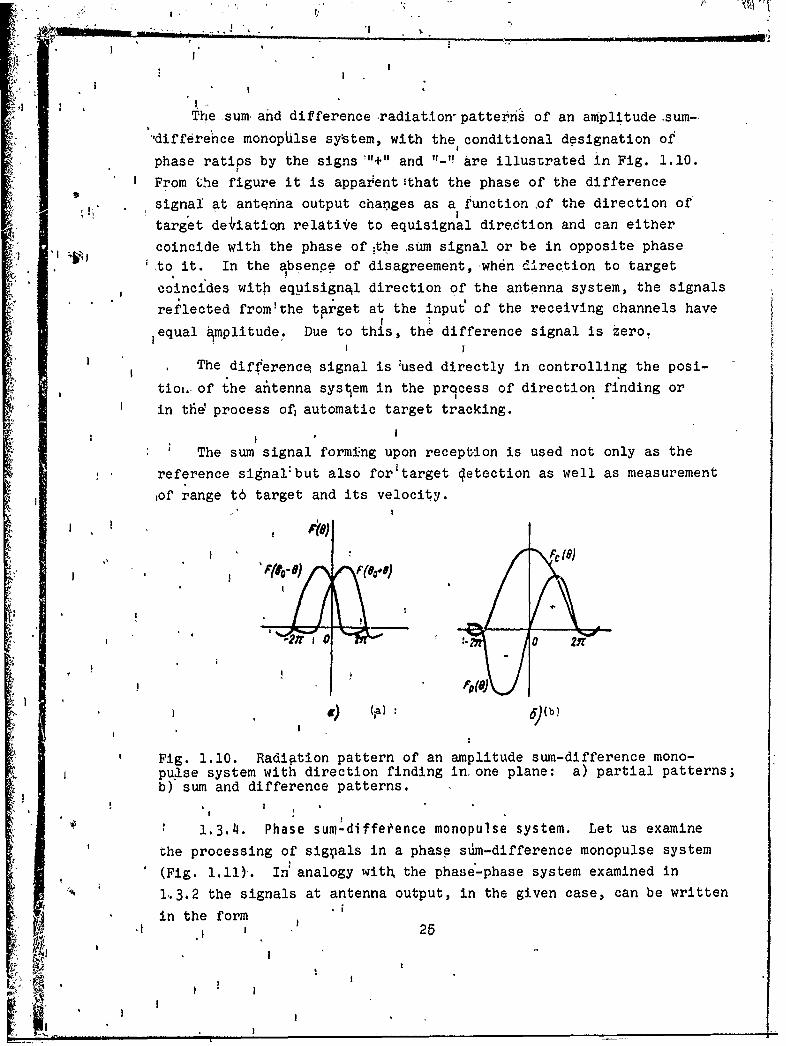
The sumahd difference radiatton-pattern' of an amplitude sum-
'difference monop~lse system, with the conditional designation of
phase ratips by the signs '"+" and " are illustrated in Fig. 1.10.
From the figure it is apparent Ithat the phase of the difference
* signal at antenna output chapges as a function of the direction of
target deiati-qo relati'e to equisignal direction and can either
coincide with the phase of ;the sum signal or be in opposite phase
* to it. In the absence of disagreement, when dIrection to target
coincides with eqpisignAl direction of the antenna system, the signals
reflected fromithe target at the input of the receiving channels have
1equal ýmplitude. Due to this, the difference signal is zero.
The difference signal is •used directly in controlling the posi-
tio,..of the altenna system in the process of direction finding or4 in tfid process of automatic target tracking.
: The sum signal forming upon reception is used not only as the
reference signal:but also foritarget jetection as well as measurement
,of range t6 target and its velocity.
•C(ba)-'I
Fig. 1.10. Radigtion pattern of an amplitude sum-difference mono-pulse system with direction finding in one plane: a) partial patterns;b) sum and difference patterns.
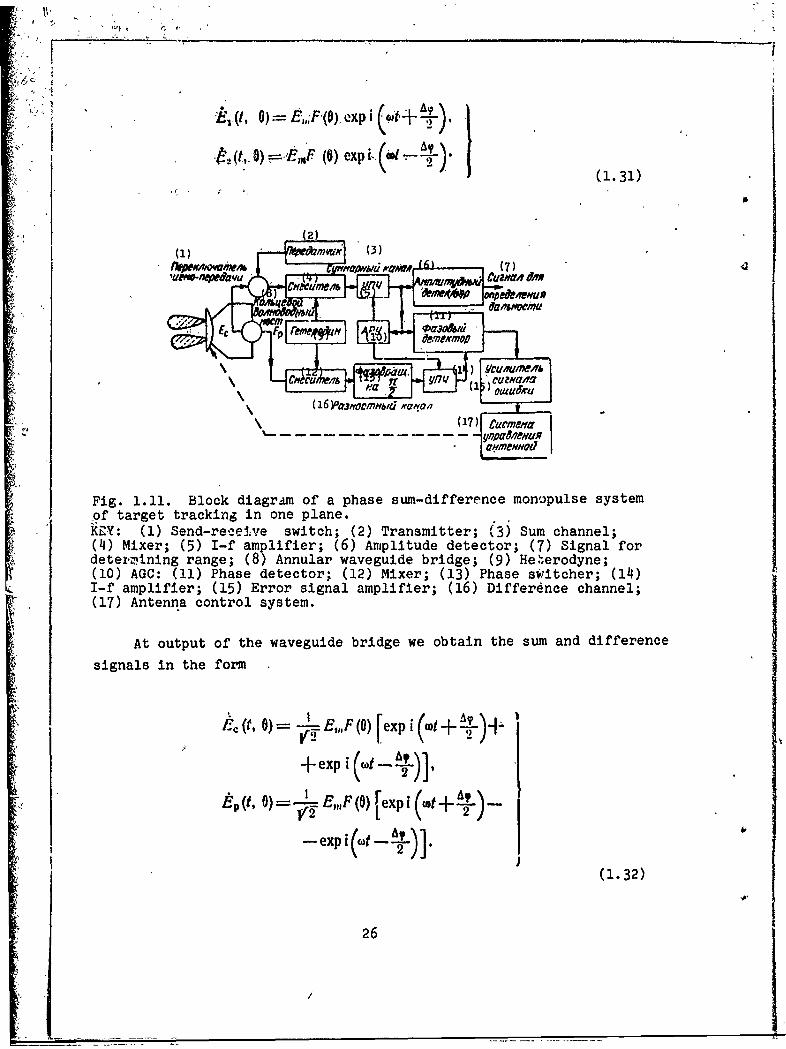
1.3.4. Phase sum-diffetence monopulse system. Let us examine
the processing of sigpals in a phase sdin-difference monopulse system
* (Fig. 1.11). In analogy with the phase-phase system examined in
1.3.2 the signals at antenna output, in the given case, can be written
in the formI 25
U'
w2
v )., =,O- EF (O) exp .(,•--2).
S() e) 1 (1.31)
••Y17V
\ ~~~(17) CenH, •_. _ Inpa54!neusR
Fig. 1.11. Block diagram of a phase sum-difference monopulse systemof target tracking in one plane.KRY: (1) Send-receive switch; (2) Transmitter; (3i Sum channel;(4) Mixer; (5) I-f amplifier; (6) Amplitude detector; (7) Signal fordeternitning range; (8) Annular waveguide bridge; (9) He%erodyne;(10) AGO: (11) Phase detector; (12) Mixer; (13) Phase swritcher; (14)I-f amplifier; (15) Error signal amplifier; (16) Difference channel;(17) Antenna control system.
At output of the waveguide bridge we obtain the sum and difference
signals in the form
±exp i
E1F()[exp i ( 2+t
(1.32)
26
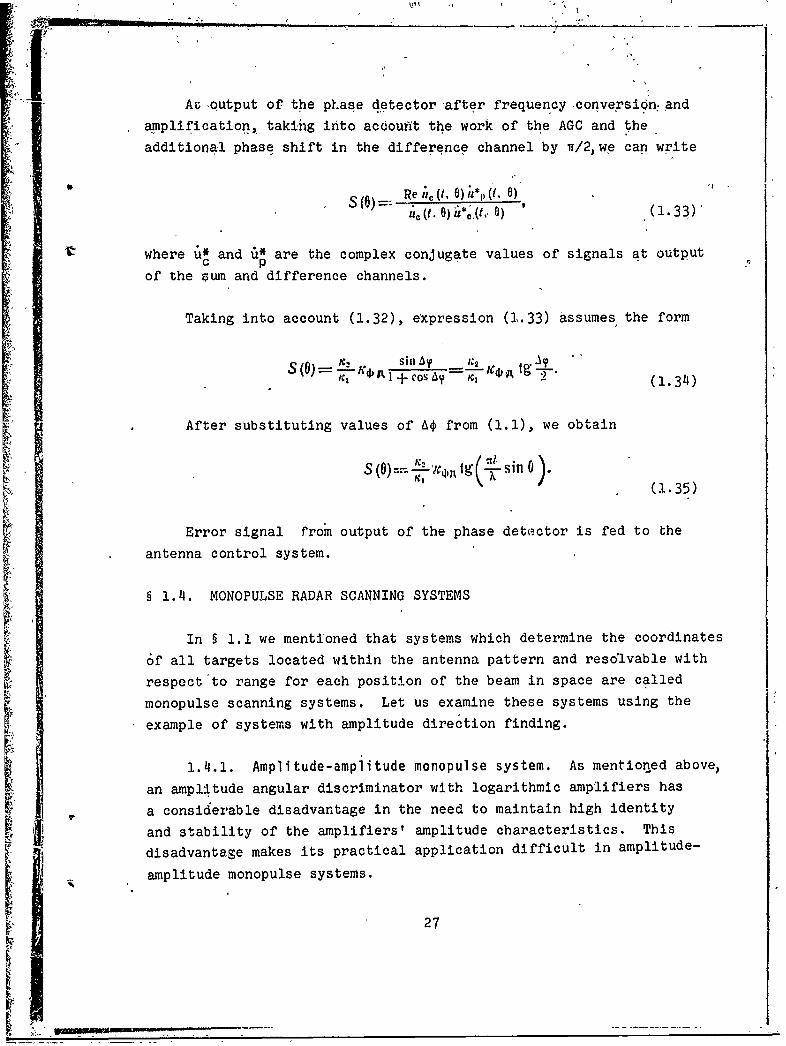
Ai; output of the phase detector after frequency conversion.-and
amplification, takihg into accouht the work of the AGC and the
additional phase shift in the difference channel by 7r/2,we can write
* S (0) -- Re ii (1,6) 6*,, (I. )
where u• and 0 are the complex conjugate values of signals at outputC P
of the sum and difference channels.
Taking into account (1.32), expression (1.33) assumes the form
S 0)- C. K)Sin A :2K,0 tg~S(FT CI o Ay-K (1.34)
After substituting values of Aý from (1.1), we obtain
(1.35)
Error signal from output of the phase detector is fed to the
antenna control system.
§ 1.4. MONOPULSE RADAR SCANNING SYSTEMS
In § 1.1 we mentioned that systems which determine the coordinates
6f all targets located within the antenna pattern and resolvable with
respect'to range for each position of the beam in space are called
monopulse scanning systems. Let us examine these systems using the
example of systems with amplitude direction finding.
1.4.1. Amplitude-amplitude monopulse system. As mentioned above,an amplitude angular discriminator with logarithmic amplifiers has
a considerable disadvantage in the need to maintain high identity
and stability of the amplifiers' amplitude characteristics. This
disadvantage makes its practical application difficult in amplitude-
amplitude monopulse systems.
27
I ! ' .. % , .. ... . ....
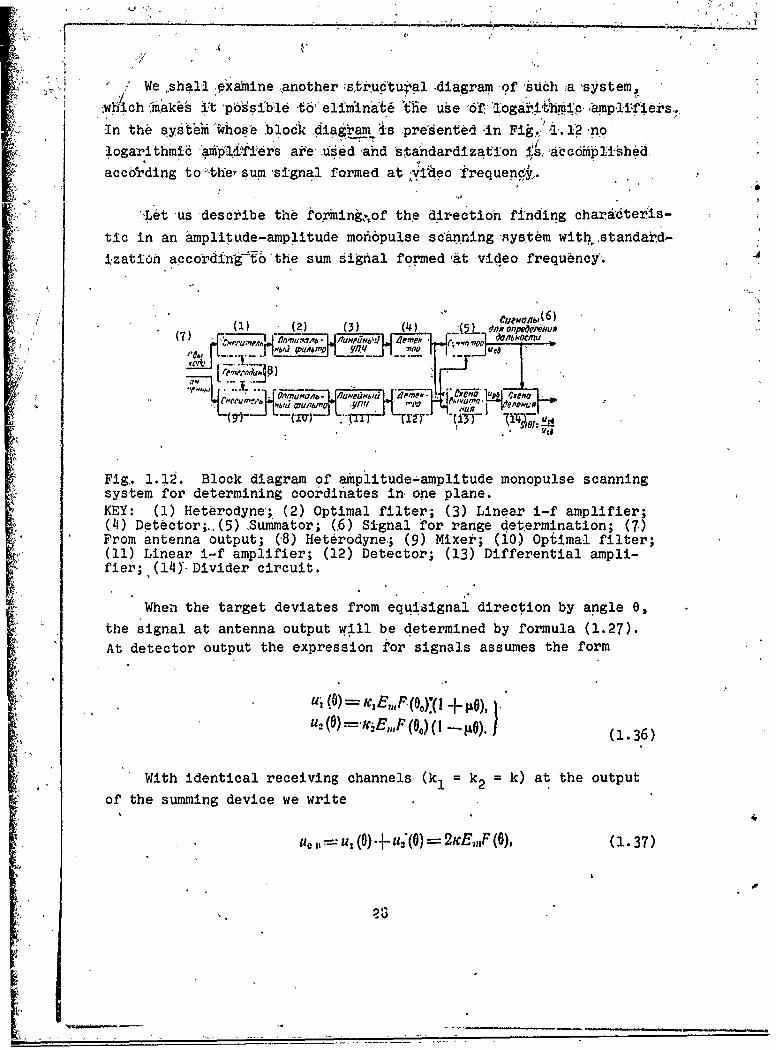
/ We .shall examine ,another structuial diagram -of 'such ýa 'system,wi•ch :makes i't 'podsi:b`le t' elim'ina:t ýfhe use odf logarita - 1 samplif.iers,,
In the qysbm'em 'hoqe block diag'ram is pre'sented 4in Figý.4 1.12 no
logarithmic iam'piie s are us ed -and 'stahdardization 0', acc6fipished,
acc0?ding to'-thei. sum 'signal formed at vildeo krequenqj,.
Let 'us describe the forming,•of the directioh finding charadteris-
tic in an amplitude-amplitude monopulse scanning -system with,standard-
-,zation according-T o the sum signal formed 'at video frequency'.
S.... Cue~aPm, o(6
) '. () . (2) (3,) (4) '(5 L Ins on p viu
,H±,,,, I 1..6._ ..I S••/f I . 711 I JU
L~ re m ,,~h~ 8)~ , Oxn p
Fig,. 1.12. Block diagram of amhplitude-amplitude monopulse scanningsystem for determining coordinates in one plane.KEY: (1) Heterodyne'; (2) Optimal filter,; (3) Linear i-f amplifier;
-*: (4) Detector;,.(5),Summator; (6) Signal for range determination; (7)From antenna output; (8) Heterodyne,; (9) Mixer; (10) Optimal filter;(11) Linear i-f amplifier; (12) Detector; (13) Differential ampli-fier;, (14)Y Divider circuit.
When the target deviates from equisigna1 direction by angle 8,the signal at antenna output will be determined by formula (1.27).At detector output the expression for signals assumes the form
u(0) '='1.E,,,F(o) ( -00) ). (1.36)
With identical receiving channels (k. = k 2 = k) at the outputof the summing device we write
•. ~~~U ,- 0---u,'0 - 2K¢E,,,F (0), (1.37)
r;.0
I
*and at the output of the'differential amplifier
up, = u (0) - U2,(0) =2i (0oY(1.38)
Then at output of the divider circuit We obtain
Up P 2Kr1,,,eF (6.) 1&0 lie.(1.39)
A compariion of equalities (1.20) and (1.39) shows that theycoincide with accuracy up to the constant coefficient, i.e , and in
the system with standardization according to the sum signal, atoutput there is received a signal proportional to the angular error
in direction finding and, therefore, it can be used as angular infor-
mation in determining angular coordinates of targets.
In practice, when building amplitude-amplitude monopulse radar
scanning systems with standardization according to the sum signal,
which must have a dynamic range of 80-100 dV, linear i-f amplifiers
cannot be used. In these cases, it is necessary to use logarithmic
i-f amplifiers in which, in order tD eliminate the need for main-
taining high identity of logarithmic amplitude characteristics of
amplifiers in various channels, it is necessary to perform standardiza-
tion with the aid of a periodic sequence of monitoring signals and
then construct the processing circuit as shown in Fig. 1.12.
1.4.2. Amplitude sum-difference monopulse system. A block
diagram of an amplitude sum-difference monopulse scanning system is
presented in Fig. 1.13. By comparing this block diagram and the
one presented in Fig. 1.9, it is apparent that in both systems
standardization is performed according to the sum signal. However,
in the scanning system standardization is performed not at intermediate
frequency with the aid of AGC, but at video frequency by dividing
the signdl from phase detector output by the sum signal. This is
explained by the impossibility of using an AGC system.in monopulse
29

6-acnniag sypstems6 because in these systems it is •necessary to determine
the cborrdinates of all targets located in the beam and resolvable
1Wit1 resject to range. An AGC system has a certain time lag aLid
"c€finot operate -with, severala 1o 6sel y located targets.S" ... (1) (i)'
10) .(11) (. 2) (13 (14)
Fig; 1.13. Block diagram 'of an amplitude sum-difference monopulsescanning system for determining coordinates in one plane.
.KE.: (1) Sum channel; '(2) Mixer; (3) Optimal filter; (4) I-famplifier; (5) Amplitude detector; (6) Signal for determining range;(7) Waveguide bridge; (8) From antenna output; (9.) Heterodyne; (10)MiXer; (11) Optimal filter; (12) I-f amplifier; (13) Phase detector;(14) Divider circuit; (15) Difference channel.
Let us examine the formation of the direction finding characteris-
tic in an amplitude sum-difference scanning system. The sum and
difference channels at the output of the waveguide bridge are deter-
mined by formula (1.28).
",,At phase detector input they can be written, respectively, as
uc (t. A1) Kj'2 cF (4)exii (ta,1 + fpj),
54 (t, 0) = V2 KE,.F(0o) pG expi (to,,.t ) , (1.40)
The sum signal at amplitude detector output, considering its
transmission factor equal to one, will be
=piK1 ,Em/(O, (1.41)
and voltage at output of the quadratic phase detector will be
U# A 2 4 K~2[EMF(6s))2P.0cM(71 -?2). (1.42)
30

When using a quadratic phase detector in the block diagram
presented in Fig. 1.13, it is necessary to provide a device'which
will square the sum signal at. amplitude detector output. Then at
divider circuit output we obtain•.z
(1.43)
A comparison of ,formulas (l.'43) and (1.'30) shows that they agree
i.e., standardization according to sum signal-at, video frequency
gives the same effect as standardization at intermediate frequency
with the aid of AGC.
The creation of a monopulse sum-difference scanning system which
has high res61ution with respect to range (on the order of 10-30 m)
can prove to be impossible because of the technical difficulty
involved in making a phase detector which will operate with pulse
width near 0.1 ps. In this case, we must turn to the development of
amplitude-amplitude monopulse scanning systems.
§ 1.5.. DESIGN PRINCIPLES FOR MONOPULSE SYSTEMSOF DIRECTION FINDING IN TWO PLANES
The monopulse. radar systems examined thus far have been designed
for finding targets in one plane. Direction finding systems for
two planes are considerably more complex.
Monopulse systems for tcrget finding in two planes with amplitude
and phase angular discriminators can be made by a simple combination
of two monopulse systems, one of which is designed to operate in
the azimuth plane and the second.in the elevation plane. From the
block diagram of the amplitude-amplitude system for direction finding
in two planes, presented in Fig. 1.14, it is apparent that such a
design requires the use of an antenna with four radiation patterns
and four amplification channels. However, in systems with the aboveindicated angular discriminators, in two-plane direction finding
there can be one amplification channel for both azimuth and elevation
31

planes. This simplifies antenna design and the direction finding
system ad a Whole;
' . .1) " (13) " " a
.-n'- C" i
Son1IpP it.,noiM ... " I4 .4 , 1
(. s (-1 .1 )-----.il~lll 1)• hium ll_8It
Fig. 1.14. Block diagram of amplitude-amplitude monopulse systemfor direction finding in two planes.
KEY: (-) Mixer; (2) Logarithmic i-f amplifier; (3) Detector; (4)Heterodyne; (5) Differential amplifier; (6) Send-receive switch;(7) Mixer4 (8) Logarithmic I-f amplifier; (9) Detector; (10)Mixer; (11); Logarithmic i-f amplifier; (12) Detector; (13) Differ-ential amplifier; (14) Transmitter; (15) Mixer; (16) Logarithmici-f amplifier; (17) Detector; (18) Elevation error signal; (19)Azimuth error signal.
As an examplej a simplified block diagram of one of the first
phase-phase monopulse radar system is presehted in Fig. 1.15 [41].
The antenna system of this radar consists of four rigidly connected
parabolic reflectors with feeds. One of the antennas is the trans-
mitting antenna and the others are receiving antennas; one of the
latter-is a common antenna for azimuth and elevation channels.
The main disadvantage of this system lies in the ineffective use
of antenna aperture since part of the antenna is used only for direction
finding with respect to azimuth, part for direction finding with
respect to elevation, and part for emission. With four 'receiving
radiation patterns this disadvantage is eliminated since for reception
and transmission the entire -antenna aperture can be used.
C32
(1))
4Do.. w &,?,c4 ... . '.."• oeuu6Ru
t... ?•u, •~ IynOurm
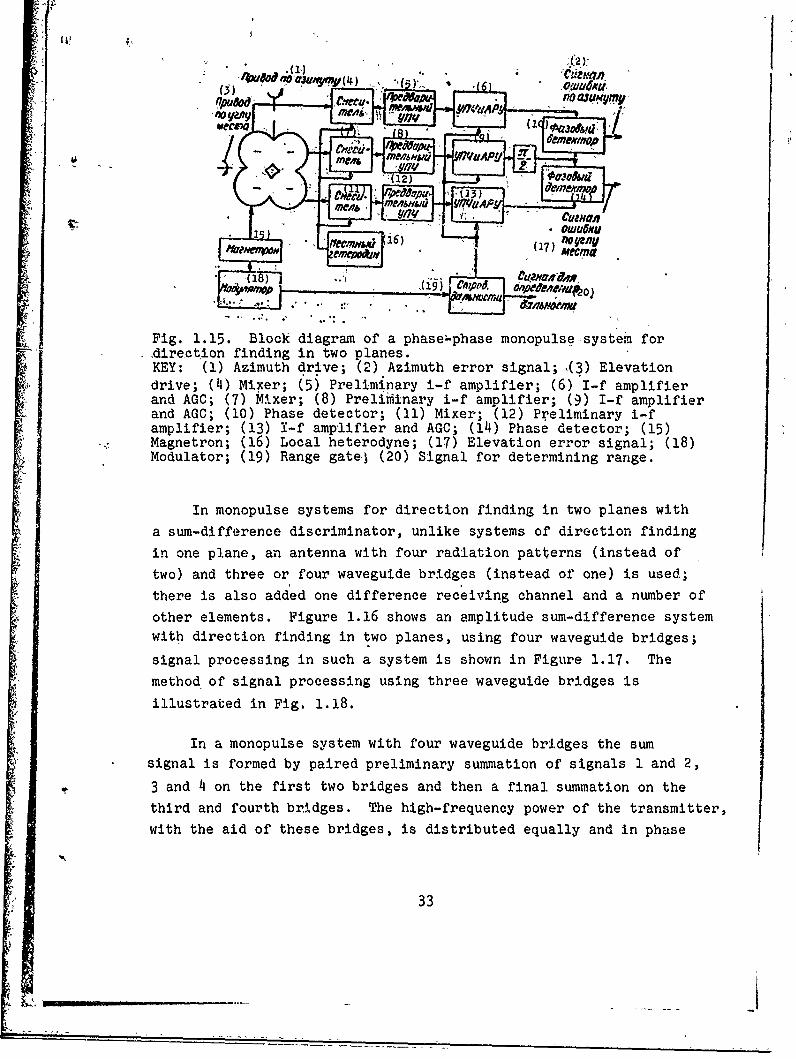
[ PFig. 1.15. Block• diagram of a phase•-phase monopulse system for
|W
'" _- Mdrection finding in two planes.4 KEY: (1) Azimuth dr.ive; (2) Azimuth error signal; ,(3) Elevation
drive; (4i) Mixer; (5) Preliminary i-f amplifier; (6) I-f amplifierand AGO; (7) Mixer; (8) Preliji-nary i-f amplifier; (9) I-f amplifierand AGO; (10) Phase detector; (11) Mixer; (12) P•.eliminary i-famplifier; (13) I-f amplifier and AGO; (l14) Phase detector; (15)
.,. Magnetron; (16) Local heterodyne; (1.7) Elevation error signal; (18)Modulator; (19) Range gate.4 (20) Signal for determining range.
In monopulse systems for direction finding in two planes witha sum-difference discriminator, unlike systems of direction findingin one plane, an antenna with four radiation patt~erns (instead oftwo) and three or four waveguide bridges (instead of one) is used;there is also added one difference receiving channel and a number of
other elements. Figure 1.16 shows an amplitude sum-difference systemwith direction finding in two planes, using four waveguide bridges;
signal processing in such a system is shown in Figure 1.17. Themethod of signal processing using three waveguide bridges isillustrated in Fig. 1.18.
In a monopulse system with four waveguide bridges the sumsignal is formed by paired preliminary summation of signals 1 and 2,
3 and 4~ on the first two bridges and then a final. summation on thethird and fourth bri~dges. The high-frequency power of the transmitter,with the aid of these bridges, is distributed equally and in phase
33
ine•.~~1
1,, ..

~betee~ allfou r~datO'5 ensurinlg-the formationl of a
suml radiation
pattwern inTp~ . 'he differe nce 8signal Of e2,a o is obahed
byter ~ rI~tesmothe signals oradiators1an5 gbraoifl tf' 1u Ian 2f the
by ubt aci ngna1'radiators 3 a d 4
sums Of signads3of
fi W, (91' (6))
80oV0,01oV019)
1i. .16. Block diagram of an ampltnes
sum~dfeec oous
"sgste for direction finding in two plns.4) otu o-f ide
-difference output of Tridefr.eeriin
ane
KEY. 1 Sum channfel; (2) Ta~itr
3 ltrdn 4 -
ampifier; (5) Amplitude detector;
(6) si.gnalfo trmli ane
(7) -ed receive switch -(8) , M i: xer ; r- A O (10) Di afer dence chann;
for azinmuth ,; 1;)
~ e 1) - mlfe (13) Anhuase d aettor
(3.4) ~ rrO Azimuth (15) M4ixer;(6Ifamlie;1)
hase deimtecoh (8 Elevation error signal;(9 nua ~e~d
Phasede5; c or ( 0 Di f r nce channels for elevatio n-'
bings' order tooban dfernc iga for azimuth in the fourth
bridge, the sum of the
1inl fraitr and 3.ssutace
from the sumi of the signals of radiators
1ad3
AnalYticallY, these signals
can be represented in the form Of
the following expressionst ftesmbac f h ihr rde
-sum, signal (at Output
o h u rnho h hr rde
.~1~P(D)1(1,44)
34

"-difference signal1 for elevation (at- output of the difference
branch of the'third bridge)
[W, (0) + (N)M%(1.45)
- difference signal for azimuth (at output of the sum' branch
of the fourth bridge)
E,.. (t, 6)=- E (t) {[Fl 0 + F& (0)] -
-- [F, (O)+FF (0)1).(1.46)
[1# 2.3. 41CrWA~OHV611 &&me&
X&ON
Fig. 1.17. Diagram for forming sum and difference signals with theuse of four waveguide bridges. Z - sum output of bridge; A - differenceoutput of bridge.KEY: (1) Sum channel; (2) Difference channel for elevation; (3)Difference channel for azimuth.
The output of the difference branch of the fourth bridge is
igusually not used and terminates in the dummy.
With the use in a monopulse system of three waveguide bridges
the sum signal is formed by the preliminary paired summatioh of
signals 2 and 3, 1 and 2 on two bridges, and then by the final
summation in the third bridge. The difference branch of the third
bridge is not used and terminates in the dummy. The difference signal
35
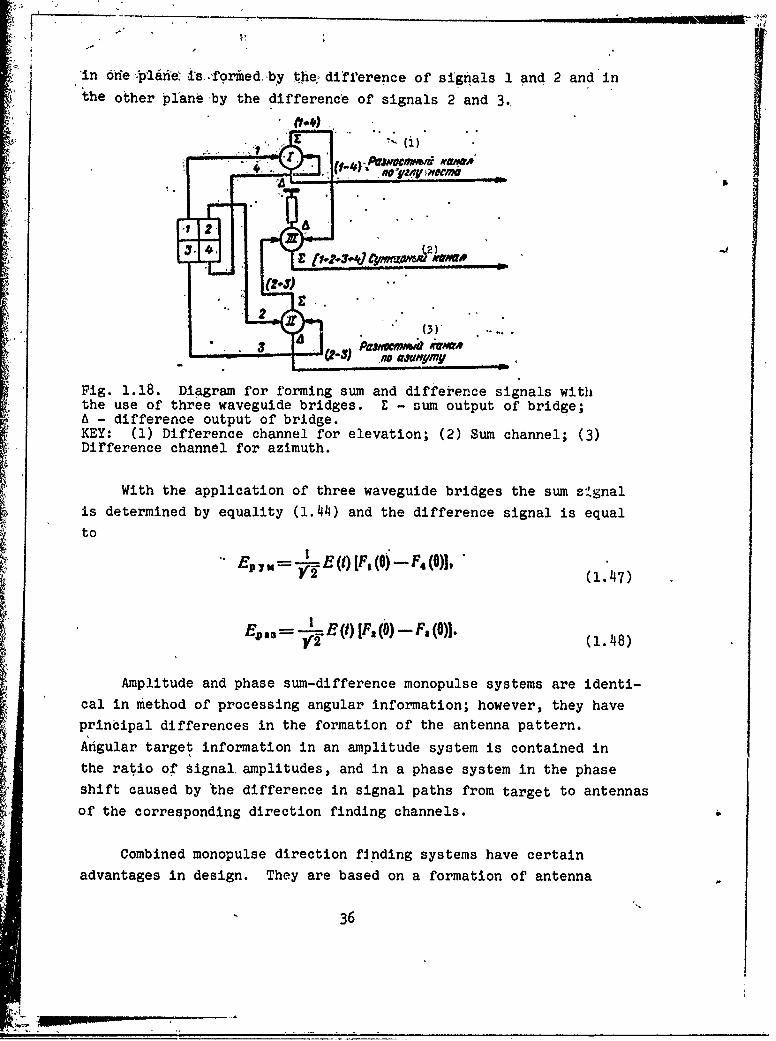
'in Onie •'lanie is ,formedoby the; difference of signals I and 2 and'in
the other plane by the difference of signals 2 and 3.,
• ( +' ..).~J O 4t iWM
2'1'IMV
(23 P:W,aa (A)A . ...
S~.no azue?&my
Fig. 1.18. Diagram for forming ,sum and difference signals withthe use of three waveguide bridges. Z - sum output of bridge;A - difference output of bridge.KEY: (1) Difference channel for elevation; (2) Sum channel; (3)Difference channel for azimuth.
With the application of three waveguide bridges the sum signalis determined by equality (1.44) and the difference signal is equal
to
. " a',,, = . --u E (t) IF', (0) ,- 4 (0)]. •..?RpYM-V=L~)1L1u~a4YJJ,(1.147)
S- MVE()[F2 (0) -F, (0)]. (1.148)
Amplitude and phase sum-difference monopulse systems are identi-cal in method of processing angular information; however, they haveprincipal differences in the formation of the antenna pattern.
Angular target information in an amplitude system is contained inthe ratio of Signal amplitudes, and in a phase system in the phaseshift caused by the difference in signal paths from target to antennas
of the corresponding direction finding channels.
Combined monopulse direction finding systems have certainadvantages in design. They are based on a formation of antenna
36

radiation pattern which ensures• the obtaining of independent target
information simultaneously with amplitude and phase relationships
of signals received. In this case, it can be avoided with direction
finding in two planes only by two interconnected channels with one
waveguide bridge at their input (Fig. 1.19).
VIu6,k8)
600MfIW0 b'
OWINUAAN
P&W~gM~sd AV&#a3A#VM()(16-
Fig. 1.19. Block diagram of a combined monopulse system fordirection finding in two planes.
KEY: (1) Signal for determining range; (2) Send-receive switch; (3)
Transmitter; (4) Sum channel; (5) Mixer; (6) I-f amplifier; (7) Phase
detector; (8) Elevation error signal; (9) Annular waveguide bridge;
(10)Hete odyne;oov (11 AGUCl,;_, (12 Mixer; (13 -mlfe;(4 hs
signal; (16) Difference channel.
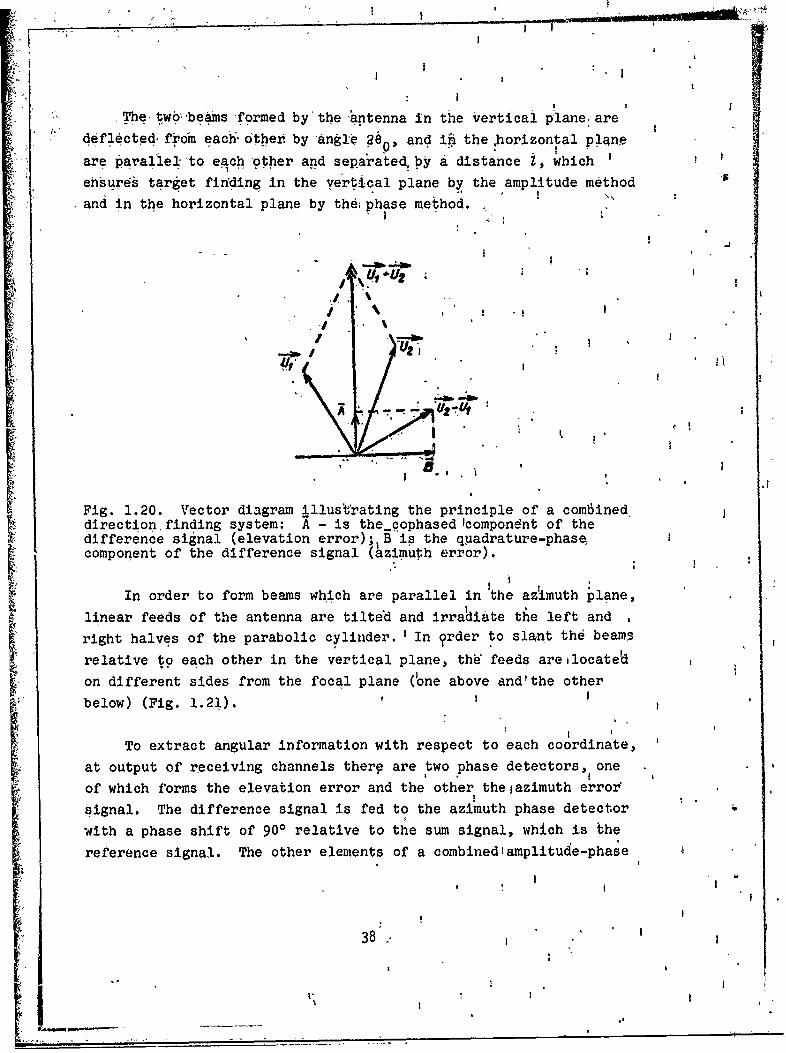
e inangular errors based on two coordinatesis i)Signat the sametermineng raby the vector pattern (Fig. 1.20).Deesiations 8) Evatnd tcorrespond to signals in the vector concept
for the first and second channeLs. Signals differ in amplitude andphase.
Difference signal as seen in the figure, can be representedin the form of two independent components, one of which is found inquadrature with the sum signal, which is characteristic for a phasedirection finding system, and the other component is in phase orin opposite phase with the sum signal, which is characteristic for anamplitude direction finding system. The first component, as willbe shown below, can be used as an azimuth error signal and the secondas an elevation error signal.
37
,. •• : - _ . . . . ..
I'I
The tw6obe~ms formed by the antenna in the Vertical plane: are
deflected, from each- other by angle 2e0, and ih thehorizontal planeare parallel-'to each other and separated by a distance 1, which
ensures target finding in the vertical plane by the amplitude method
and in the horizontal plane by the phase method..
IVI
Fig.~ ~ ~ 1.0 Veto diga ,lu~r n th.rnil o obnd
Inodrt ombaswihaeprle nth ftu lae
bo (
* 1/!
Fig. 1.20. Vector diagra i llusno rating the principle of a combined,adirecton finding system: A - is the..cophased'componhnt of thedifference signal (elevation error);.B is the quadrature-phase,
component of the difference signal (azimuth error).IIn order to form beams which are parallel in the azimuth P~lane,linear feeds of the antenna are tilted and irradiate the left and,
right halves of the parabolic cylinder. ' In ?drt ln h em
relative to each o thehe vertical plane, thw feeds areilocated
on different sides from the focal plane (one above and'the other
below)(ITo extract angular information with respect to each coordinate,
at output of receiving channels ther? are two phase detectors, one
of which forms the elevation error and the other the gazimuth erroz•
signal. The difference signal is fed to the azimuth phase detectorwith a phase shift of 900 relative to the sum signal, which is 'the
reference signal. The other elements of a combinedlaplitude-phase
I C.
ft C
38 ...

SI ' I1
system are similar to the elements of the amplitude and phase systems
discussed, above.
Let us ,examainf the formation of the, direction finding char-
acteristlc .in a combined amplitude-phase monopulse system. Let the!
obJedct of the&direction *fiiding' be dibplaced m fron equisigral. direction
1.n- iazimuth by angle Ose and in elevatiofn by angle Oy. Then the
! •signals at antenna ouput .will differ in phase in accordance with
Stxe azimuthal displacement of the angle and in amplitude in accordance
witf its elevation displacement and can be represented in the form
o f th'e following expressions:
&Y(, OY"=Emf (Oau) F(60o-Oyuexp i (cut :~ },F . I , j 1
I
H0 6t, 0=EmF (0,.)P(00 ±07 yae-Xpi (b~1.49)
%
0
I I
I *
1Fig. 1.21. The principle of forming radiation patterns and combined
monopulse systems.
KEY: (1) In the horizonta:l plane; (2) In the vertical plane.
'At output of the waveguide bridge the sum and difference
signals, with an accuracy up to'the constant coefficient, can be
;wripten In the form
39
i -
I I
o..
-F(O.+OM)expi (tA---)a
(1.50) ., Jwhere ,
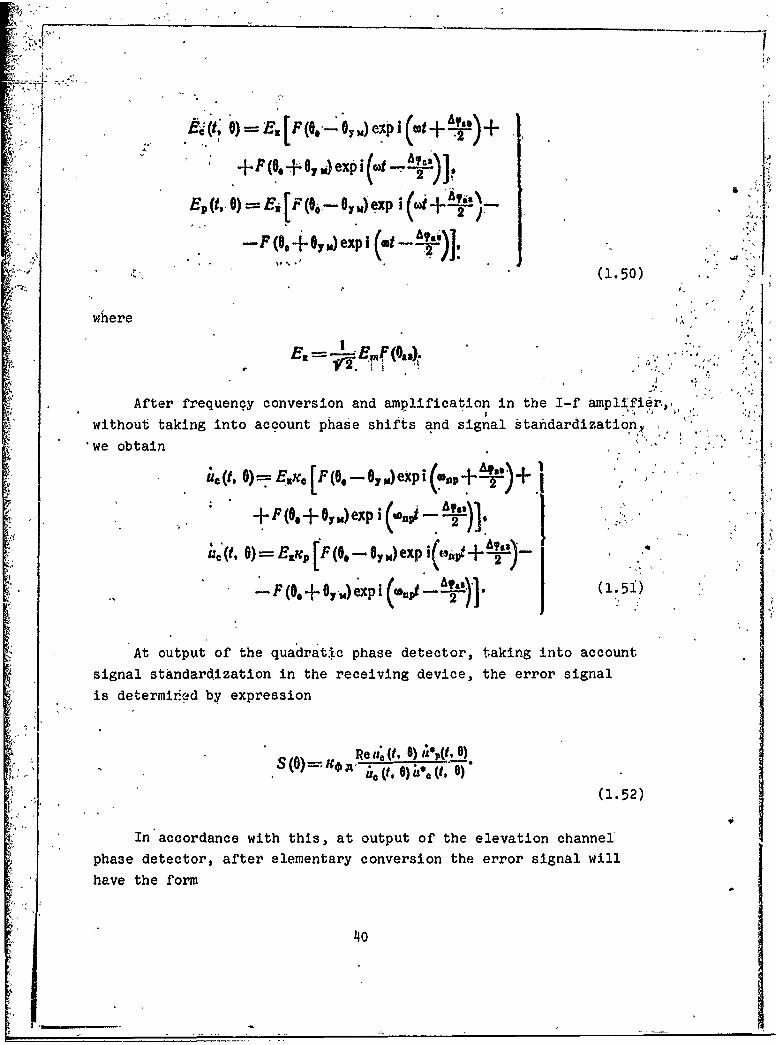
After frequency conversion and amplification in the I-f ampli'fier,,,,.
without taking into account phase shifts and signal standardization,,
'we obtain "
S(, o - .r , [F ( 0 .3 xpi (.a 9 S+
+ F1(O+O+ )exO ,) -e' )-. 2
UC (t, 0) =Ei [F( -- 0,. exp i (%,t + 2
J (15 +)
At output of the quadratic phase detector, taking into account
signal standardization in the receiving device, the error signal
is determined by expression
S (6)=,•• A- (,. )1ba (.. 6)%
(1.52)
In accordance with this, at output of the elevation channel'
phase detector, after elementary conversion the error signal will
have the form
40
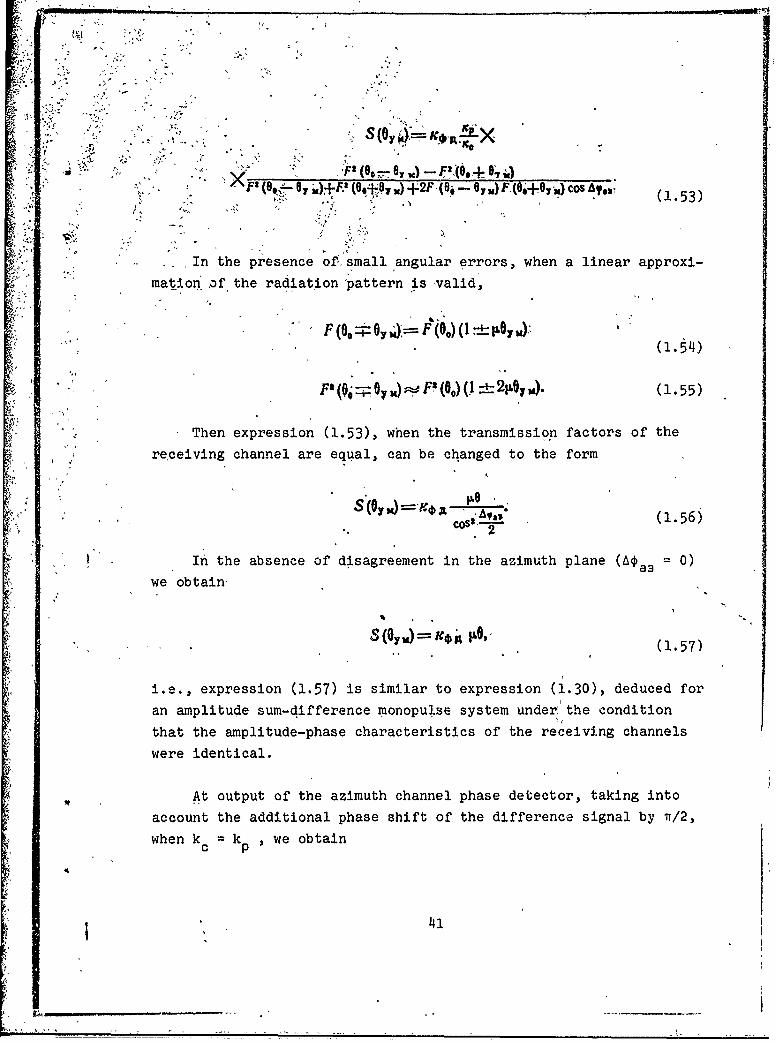
(a -e C(Y) K*P'00 +' '' ?" "• " F1 IO(0,- ,•) F'(0.+O,÷O.)
,... 7e ,+F- (o+.+, ) +2F (8o - 07,,) F.(o,+07 ,) cos Ay,, (153)
In the presence of, small angular errors, when a linear approxi-
"" mat.ion .of the radiation pattern is valid,
S.... •(l.54~)
q-. • (Oy P (00 : ) ( 2-+•oy) (1-.55 )
Then expression (1.53), when the transmission factors of the
receiving channel are equal, can be changed to the form
Cos", "(1.56
In the absence of disagreement in the azimuth plane (Ae 0)
we obtain,
• S(ON)=KR p•,. (1.57)
i.e., expression (1.57) is similar to expression (1.30), deduced for
an amplitude sum-difference monopu].se system under the condition1,
that the amplitude-phase characteristics of the receiving channels
were identical.
At output of the azimuth channel phase detector, taking into
account the additional phase shift of the difference signal by w/2,
when k k ,we obtain
41
• ± u lll u. o
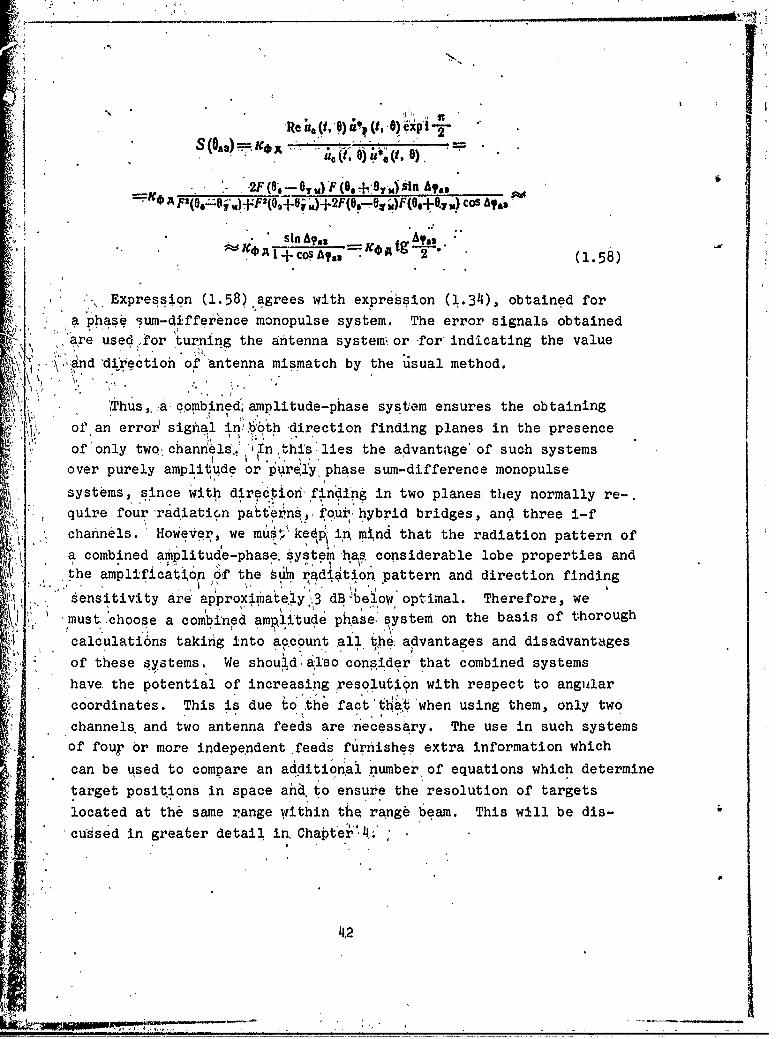
S( ) e A0' Oel ',(t, 0) -0.3 A
2F(Oa -6y,)F(B+9MsnA 8
". ' sinA .- "Affes; ,
2e lc t.• e g"-' (1.58)
Expression (1.58) agrees with expression (l.34), obtained fora 4Phase um-difference monopulse system. The error signals obtained
are used for turning the antenna system, or for, indicating the valueý.'•.ian. d. 'dfrectioh.,. of, Antenna mismatch, by the usual method.
Thus, _a combinedý amplitude-phase system ensures the obtaining
ofran error signial in, both direction finding planes in the presence
of ,only twoý channels'. In this lies the advantage"of such systems
over purely amplitude or purely, phase sum-difference monopulse
systems, since wito direction• ,inding in two planes they normally re-.quire four radiaticn patter,ns6, four hybrid bridges, and three i-fchannels Hwver, we mus4, kee Scha&Ins. Howeve, em•t e i,• nými~nd that the radiation pattern of
a combined amplitude-phase: ystemhas considerable lobe properties andthe amplification o1f the sum radiation pattern and direction finding
sensitivity are approx~mately.,3 dBýbelow optimal. Therefore, wemust,'choose a combined amplitude phase. system on the basis of thorough
calculations taking into account all ýte advantages and disadvantages
of these systems. We should aIlso'consider' that combined systemshave the potential of increasi~ng resolution with respect to angular
coordinates. This is due to^ the fact 'th ' when using them, only twochannels, and two antenna feeds are necessary. The use in such systemsof foup or more independent feeds furnishes extra information which
can be used to compare an additional number, of equations which determine
target positions in space ahd, to ensure the resolution of targets
located at the same range within the range beam. This will be dis-cussed in greater detail in. Chapter"4,; ;
4I2
Sinf cox~bized systems -have certain structu'ral advantages,,
they have 'found wide application in airborne radar technology where
the weight and size of the equipm&nL' is of prime importance.
One of the first monopulse radars oparating by the combined
method is the AN/APG-25 experimental aircraft radar in the 3-cm
range, designed as part of the fire control system in the tail of
a US Navy patrol -aircraft [94].
Along with combined gystems of the sum-difference type we can
use combined systems with postdetector sIgnal processing, similar
to simple amplitude 'and phase monopulse systems.
§ 1.6. DESIGN PRINCIPLES OF MONOPULSE SYSTEMSOPERATING IN CONTINUOUS AND QUASICONTINUOUSRADIATION MODES
Characteristic for monopulse systems operating in continuous
and quasicontinuous radiation modes is the use of target selection
with respect to speed, which makes a certain impression on their
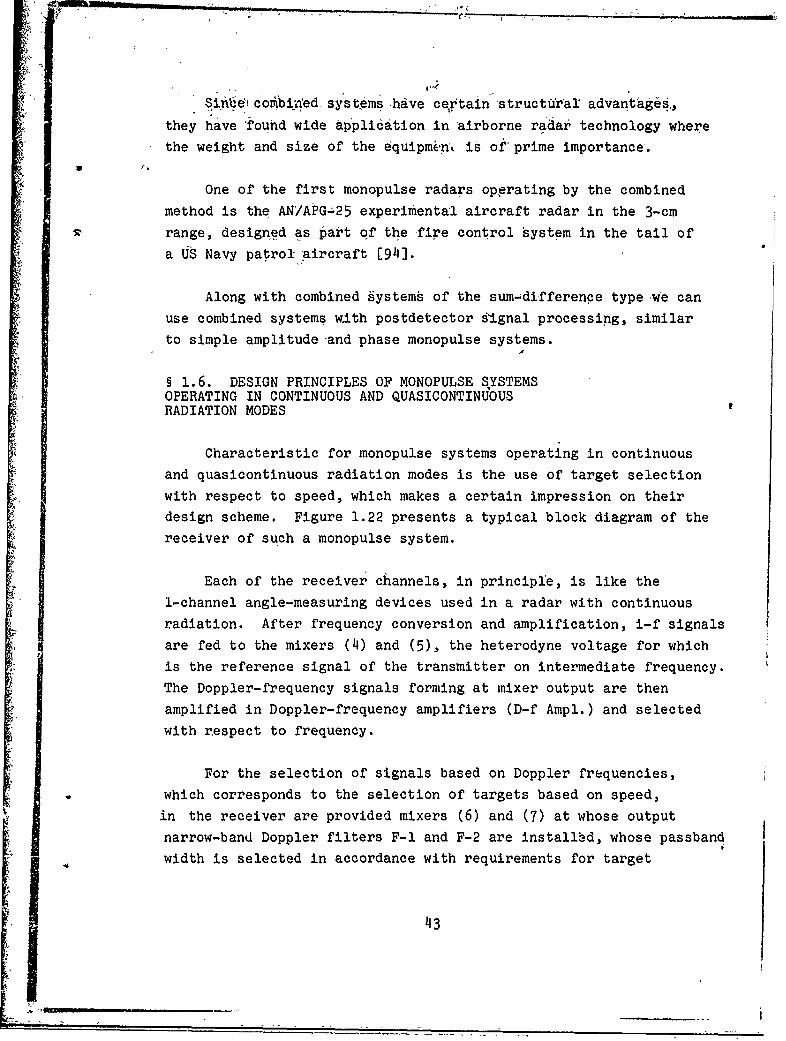
design scheme. Figure 1.22 presents a typical block diagram of the
receiver of such a monopulse system.
Each of the receiver channels, in principle, is like the
1-channel angle-measuring devices used in a radar with continuous
radiation. After frequency conversion and amplification, i-f signals
are fed to the mixers (4) and (5), the heterodyne voltage for which
is the reference signal of the transmitter on intermediate frequency.
The Doppler-frequency signals forming at mixer output are then
amplified in Doppler-frequency amplifiers (D-f Ampl.) and selected
with respect to frequency.
For the selection of signals based on Doppler frequencies,
which corresponds to the selection of targets based on speed,
in the receiver are provided mixers (6) and (7) at whose output
narrow-band Doppler filters F-1 and F-2 are installed, whose passband
width is selected in accordance with requirements for target
43
-7"
resolutIon .basedon s-d''d.- Frequency conversin- is accomplished with
h'~' •h oaidof' ignais fro*I the tracking heterodynp controlled by signalsof the frequency discrininator. *
(" 2 ) ' '( 3 ) , ( 4 ) . ( 5 ) , . -( 6 . . , •
''
selection based on speed.KEY: (1) Signal from antenna output; (2) Mixer -1; (2) I-f amplifier-. 1; (Ii) Mixer -&I; (5) Doppler frequency amplifier -1; (6) Mixer -6;
(7) F.-l; (8). Error signal; (9) Phase detector; (10) Mixer -2; (11)I-f amplifier-2; (12) Mixer -5; (13) Doppler frequency amplifier -2;(1J) Mixer -7; (15) F-?; (16) Reference signal; (17) Mixer -3; (18)i-f amplifier of reference signal; (19) Heaerodyne; (20) Tracking
heterodyne; (21) Frequency discriminator.
Signals from outputs of the Doppler filters, containing informa-
tion concerning the direction to a chosen target, are fed to rihe
phase detect6r where the error signal is formed which is used in a
direction finding system on the usual order.
Direction finding systems with selection based on speed are
rather narrow-band. This imposes additional requirements on thereceiving channels with respect to the identity of their amplitude-phase characteristics. Nonidentity of channels, particularly ofDoppler filters, will cause target finding error. Since the narrow-band filters have great steepness of phase-frequency characteristics,while target speed and Doppler frequency connected with it, i. the
4',4
tracking process based on speed, varies within considerable limits,
even a slight nonidentity of phase-frequency characteristics ot
-the Doppler filters will cause a large parasitic signal phase shift
entering the phase detector and bring about considerable error in
direction finding.
The quasicontinuous mode of radiation, which characterizes the
emission of pulses with a low duty cycle, also makes it possible
to select targets based on speed. Therefore, the design of the
receiver of a monopulse quasicontinuous radar is similar to that
discussed above. The only difference lies in the fact that when
using a quasicontinuous mode of radiation, there is introduced into
the receiver, a gating of the i-f range amplifiers. Requirements
for identity of receiving channels remain the same as they are with
a continuous signal.
"45
~CtPTER7f,'f
101NOPULE RADAR' SYSTEM ATBEINAS
§ 2'.l RELATIONSHIP BETWEEN THE RADIATIONPATTERN OF THE ANTENNA AND THE CURRENTDISTRIBUTION' ON0ITS SURFACE
The antenna is the inain element of a monopulse radar. It
connects the rpdiating source and -the angular discriminator. The
main characteristics of monopulse radars depend considerably upon
the design of the antenna system.
The shape of the radiation patte-irn in a monopulse radar has
a considerable effect on the direction finding characteristic. In
order to obtain a predetermined' shape of radiation pattern and,
consequently, a predetermined direction finding characteristic, we
must select the proper current distribution on the antenna surface
or the field distribution in the aperture.
To derive the relationship between antenna radiation pattern
and current distribution on the antenna surface, we should examine
a rectangular antenna (Fig. 2.1), whose width in the direction of
the y-axis is d. When d >> X, the expression for the electrical
field intensity in the remote zone has the form [44]
4
Sd 3i Vic (:jsin 01dy, 21
where d
46

jqr +Y)-A (72- expii+±v
"rs the complex function of Current distribution on the antenna
surface at distance y from the center of the aperture; dy is the
generalized coordinate of the antenna aperture; ny sin e is the
"generalized approach angle.
After change of the variables
d.c. 2UI=:•--sine;, v=-- Y (2.2)
equation '(2.1) can be written in the form
E (u)= . (v) exp i uv do, (2.3)
where
(P.)= A (p) xp i +(6). ,
Fig. 2.1. Radiating aperture of antenna.
Equation (2.3) in mathematical respects is similar to the inverse
Fourier transform. Consequently, the theory of Fourier transforms
can be applied to the calculation of the field intensity pattern
if we know the current distribution on the antenna surface.
47
II' ",7....
The Fourier ,transform ,of function f(t) is written in the-
following 'manner:
t(2.4)
and the inverse Fourier transform has the form
1(Q jFY- 1' (2.5)
In equation (2.3) the limits of integration can be extended to
an interval from - • to + - since current distribution '(v) is equal
to zero for lvi > 1. Then the function of current di.stribution on
the antenna surface is a Fourier transform, of the field intensity
diagram E(u):0
E () elavdO.-0(2.6)
Thus, based on equation (2.6), we can 'find current distribution
T(v), which ensures the obtaining of a given pattern E(u) and, based
on equation (2.3), we can calculate the antenna radiation pattern
with different current distributions for the antenna radiation pattern
field in its aperture.
For example, for a uniform field distribution in the aperture,
when the constant value of field amplitude is A0 , and phase dis-
tribution along the aperture constant, the antenna radiation pattern
calculated according to equation (2.3) has the form
As Senudo _Ao s(n2a.
This radiation pattern in coordinates "u" exists within limits
from - - to + - (Fig. 2.2). However, since the function of field
distribution in the aperture must revert to zero beyond the antenna
aperture, angle 0, measured from axis Z, cannot be greater than
+90' and - < sin e < 1.
48
mma
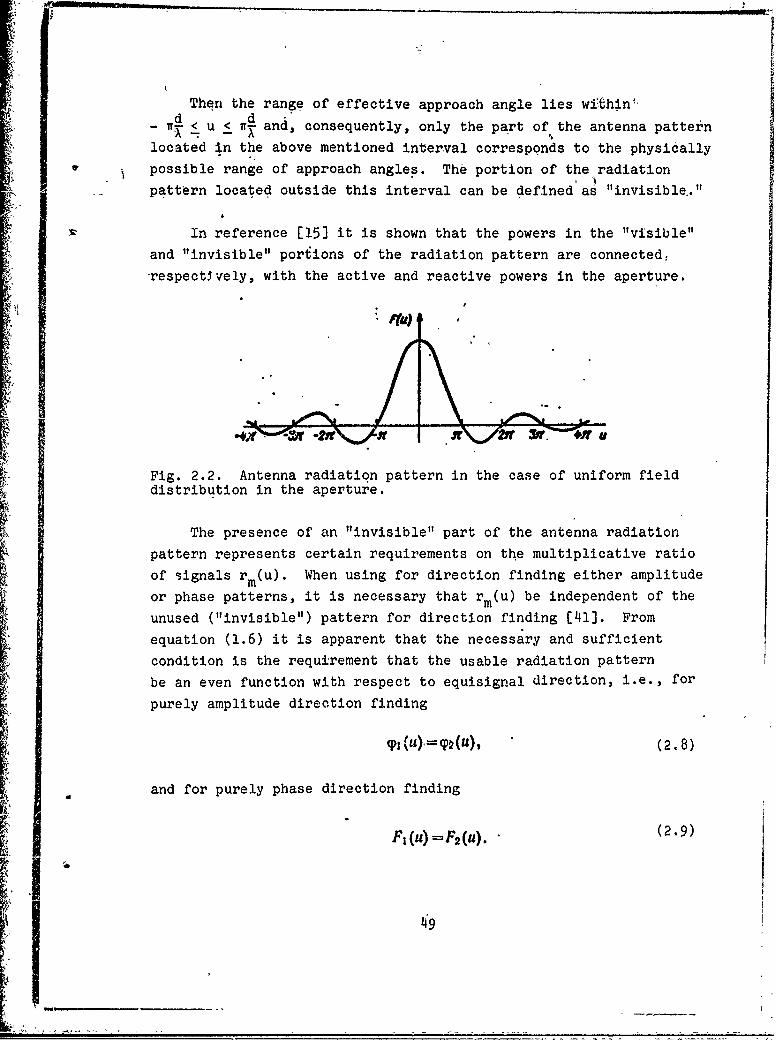
Then the range of effective approach angle lies within,
- 4 < u < 14 and, consequently, only the part of the antenna pattern
located In the above mentioned interval corresponds to the physically
possible range of approach angles. The portion of the radiation
pattern located outside this interval can be defined as "invisible.."
In reference [15] it is shown that the powers in the "visible"
and "invisible" portions of the radiation pattern are connected;
-respectlvely, with the active and reactive powers in the aperture.
4r
Fig. 2.2. Antenna radiation pattern in the case of uniform fielddistribution in the aperture.
The presence of an "invisible" part of the antenna radiation
pattern represents certain requirements on the multiplicative ratio
of signals rm(u). When using for direction finding either amplitude
or phase patterns, it is necessary that r (u) be independent of themunused ("invisible") pattern for direction finding (41]. From
equation (1.6) it is apparent that the necessary and sufficient
condition is the requirement that the usable radiation pattern
be an even function with respect to equisignal direction, i.e., for
purely amplitude direction finding
(PI (U), = (k (M, (2.8)
and for purely phase direction finding
P1 (u)=F 2 (u). " (2.9)
49

'The requirements, imposed by equalities (2.8) and (2.9), onthe unusableq radiation patterns are limited in a certain manner' tothe form 'of-current distribution on the'ant6nha surface. As indicatedin Ch&pter 1, in mono6pUse direction finding-systems it is usually
t8
accomplished by thJ& displacement of two amplitude patterns by asmall angle4 0 relatiye to equisignal direction or bythe displacement
of the phase centers of .the two patterns. Amplitude pAtterns at anangle to each other are formed by currents which have a linear phase
distribution function. A displacement of the phase centers 0'f the
two patterns can be obtained only if-the phase distribution function
is constant.
In reference [62) it is indicated that with, linear current phase
distribution the maximum possible antenna amplification is ensured.
Therefore, we shall assume that the phase distribution function is
linear for amplitude direction finding' and constant for phase direction
finding. With this assumption, amplitude distribution for amplitude
direction finding with linear phase distribution must be a symmetrical
function with respect to the center of aperture, while for phase
direction finding with constant phase distribution it can be any
arbitrary function [41].
Fig. ?.3. Antenna radiation patterns with displaced equisignaldirection.
The introduction not of the approach angle itself 0 but of
generalized u as an independent variable makes it possible to extend
the basic theoretical positions of the monopulse method, in the above
50
assumptionithat 'equisignal direction is perpendicular to-the plane
of the antenna aperture, to the case of an- arbitrary direction
for the equisignal line.
Figure 2.3 presents antenna radiation pattern of a monopulse
system for direction finding in one plane. If the initial pattern
F(u) is displaced along axis u to a generalized displacement angleý
of equisignal direction uCAB connected with the physical displacement
angle 6CAB by equation
(2.10)
the displaced complex lation pattern, in accordance with equation
(2.3), is written in the form
h (u - Uc) A (o) exp i[ (v)(uu v) d4 .C AV JIO(2.11)
The displacement of the radiation pattern is achieved physically
by a linear shift of the initial distribution in the aperture by
quantity u CBv. If the initial pattern was displaced with respect to
equisignal direction by angle
ed.1 (2.12)
the displaced pattern also will be shifted with respect to the
displaced equisignal direction UCAB by angle u0 .
The multiplicative ratio of signals received with displaced
equisignal direction will be determined by expression
51 (2.13)
51

t which; when.. s = 0-, rfduces to-,the usual detdrminationin accordance
with '(i. 6).
Thus, radiation patterns and nionopulse ratios are preserved
without' distortion in the presence of ý,bitrary displacement of ,
equisignal ,direction, ýwhen they are expressed in terms.of a generalized
coordinate of the radiation pattern.
5 2.2 PARABOLIC ANTENNAS
A diagram of a parabolic antenna, which consists of a metal
mirror in the form oo a paraboloid of rotation and a feed, is presented
in Fig. 2.4.
The main properties of the parabolic mirror are the following:
1) diverging beams, proceeding from a source, inqtalled in the
focus of the mirror, after reflection fiom its surface become
parallel;
2) the distance crossed by any beam from focus to mirror and
after reflection from a plane perpendicularlto the axis of the
paraboloid doesnot depend upon the angle at which the beam left
the focus. Because of this, a plane wave front with a uniform phase
is formed.
A paraboloid which has an aperture angle of Ra0,> ± is called
a short-focus, and a paraboloid which has 2a0 < n a long-focus.
For a short-focus paraboloid the ratio oP focal distance.to mirror
diameter is fn/dn < 0.25, and for a long-focus paraboloid it is I
fn/d > 0.25. Parabolic antennas for monopulse radar stations
usually have fn/dn ratios lying within 0.5'1, which makes it possible
to inters the radiation patterns at. the prescribed level.,
The most widely used type of feed for parabolic monopulse
!' antennas is the waveguide horn which can be installed by one of
the methods indicated in Fig. 2.5. In both cases, the w~veguide
feeding the horn passes through the reflector, which leads to a
shading of the aperture and the appearance of a reverse reaction
52 ,
I. ~ *
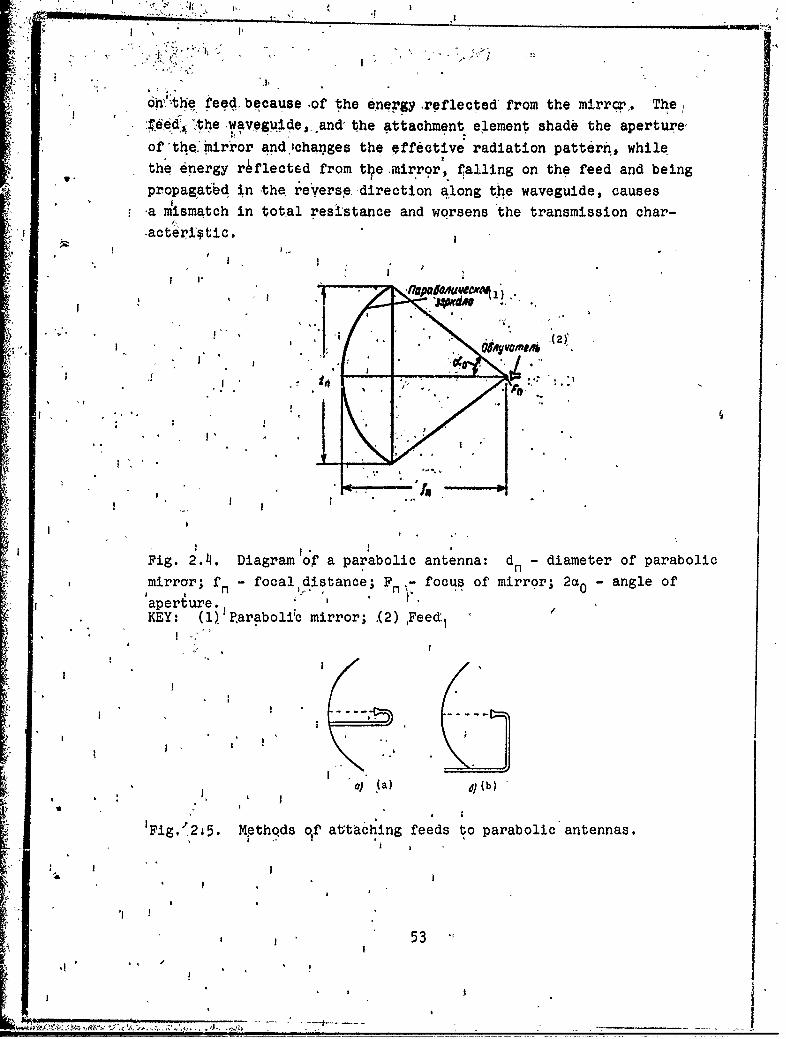
J,
orn'.the feed, because ,of the energy reflected from the mirrcr', 'The,:[e'ed• the waveguide,. and' the attachment element shade the aperture,
of th.e.mirror and,'chaniges the effective radiation pattern, whilethe energy rAflected from t1,e ,mirror, falling on the feed and beingpropagatbd in the revers~e direction along týhe waveguide, causes
ma ismatch in total resistance and worsens the transmission char-[a,-acterJ:*ic.
SI I ~
Fi. 2. D a of a pte : d d e o
a '_
a I.
Fig. 2.11. Diagram or a parabolic antenna: dn - diameter of parabolicnmirror; fn - focal,.distance; Fn - focus of mirror; 2t0 - angle of
aperture., '
KEY: (1):P.araboli'c mirror; .(2) Feed:1
a I'
I ) (a) (b)
'Fig. ,2;5. Methods of attaching feeds to parabolic antennas.
53

0",,
'4(4)
\ /axi.mrada,*e;(4)-.e o"-,' amtuxm d ow.,jeo (4)
Fig. 2.6. Change in direc•GUon of maximum radiation with displacementof feed.KEY,: i(1) Parabolic mi~rror', (2) Displeaced feed; (3) Main directionof maximum-radiation; (lf) Direction of maximum radiation with dis-
placed feed.
If the feed is displaced from the focus of the parabolic
antenna by angle aI along a circumference with a center located at
the apex of the paraboloid, the, direction of maximum radiation is
deflected from the axis of the mirror by angle a 2 , somewhat less
than angle a1 (Fig. 2.6). The direction of maximum radiation is
turned to the direction opposite the displacement of feed.
In monopulse systems with amplitude direction finding, a pair
of feeds displaced symmetrically from the focus gives symmetrically
overlapping amplitude radiation patterns for direction finding in
one plane (see Fig. 1.1).
Fig. 2.7. Antenna of a monopulsesystem with phase directionfinding.
54

LI-
Fig. ,2. 8!. .Parabholi c, -mirror.elth•/'•---
slanted feeds.KEY: (1) Parabolic'mirror; £(2) Feeds.
In monopulse systems with phase direction. finding, the antenna
system for direction finding in one plane consists of two separate
parabolic antennas spaced at a distance (base line') Z (see Fig. 1.2),
with the feed located in the focus. One of the antennas or both
of the antennas can be used for transmitting. An example of such
an antenna is the antenna (Fig. 2.7), used in the first monopulse
system, developed by General Electric (41]. In design the antenna
consists of four 16-inch parabolic mirrors, cut off and welded together
with separate feeds located in the corresponding focus. For reception,
three antennas were used, and since for elevation and azimuth
direction finding two reflectors each are used, one is common for
both planes. The use of a separate transmitting antenna eliminates
the necessity for switching the antenna system to transmission and
to reception.
The development of monopulse systems with phase direction findin&
led to the creation of single-mirror antennas with a four-horn feed
located in the focus of the mirror; however, each horr is slanted
with respect to its axis (Fig. 2.8). In this case, in each plane
two parallel beams are formed.
§ 2.3. PARABOLIC ANTENNAS WITH A PRIMARY RADIATOR
Parabolic antennas with a primary radiator (lassegrian) have
found wide application in monopulse systems because of a number of
55

41/
advantages which will be'disdcussed below. In such antennas, (Fig..2.9) the feed i located tt,'the •'p,-;x of the parabolic mirror, and
a lhypeirbolic primary radiaoo'r, Is,,loý.ted between the apex and thef•uof the, p blraboa. One of. the"- to foci of the hyperbola is
'A6 a actual focus of the antenna ,system F and is located in thie
*dehterc the feed; the other is the imaginary F' and is located in
-the focus: of the parabola. Pofns -F'h and F are conjugate foci
of the hyperbolic primary radiator. Waves from the reflector and
primary radiator are reflected according to laws of geometric
optics (Fig. 2.9b) and after reflection, the beams proceed in parallel
and the wave front is flat.
Parameters of a .parabolic antenna w{.th a primary radiator,
.indicated in Fig. 2.9a, are connected by the following equations
/[561:i/ (g M_=,g L "(2.14)
=4?A (2.15)
sin (2.16)
Usually parameters dn, "'n' fp and a p are determined based on
the necessary dimensions and characteristics of the antenna system,
and &ccording to them aO, dK and fo are calculated.
If we consider the primary radiator a hyperbolic mirror' creating
a mirror image of the feed at F'n , located in the focus of the
parabola, an antenna kith a primary radiator can be considered an
ordinary single-mirror parabolic antenna but with another feed
(Fig. 2.10). Then the solid angle 2ap, formed by the primary radiator
at point Fp, will differ from solid angle 2a 0 . The imaginary feed
has a effective aperture smaller, while the radiation pattern is
wider, than ac'tual, i.e., amplification occurs because of the use
of a hyperbolic primary radiator and is equal to
56

(2.17)
where-t P
is the eccentricity of the hyperbolic primary radiatpr.
/7aOa.o •/,-c~oe JIAem,-a, (2)
G€,U(3)"
A W-t_ -, t 0 •
a) (a)
Fig. 2.9. Diagram of parabolic antenna-with pyrimary radiator:a) geometry of antenna; b) principle of antenna action.KEY: (1) Actual focus; (2) Parabolic mirror; (3) Imaginary focus;(4) Hyperbolic primary radiator.
Amplification is also equal to the ratio of the difference
between the distances from primary reflector to real and imaginary
foci to the distance from primary reflector to imaginary focus
r -(2.18)
However, on the other hand, the use of a primary reflector in
such an antenna system leads to the shading of the aperture, whichcauses a dip in the amplitude field distribution, as a result of
which amplification decreases and the level of the side lobes increases.
57
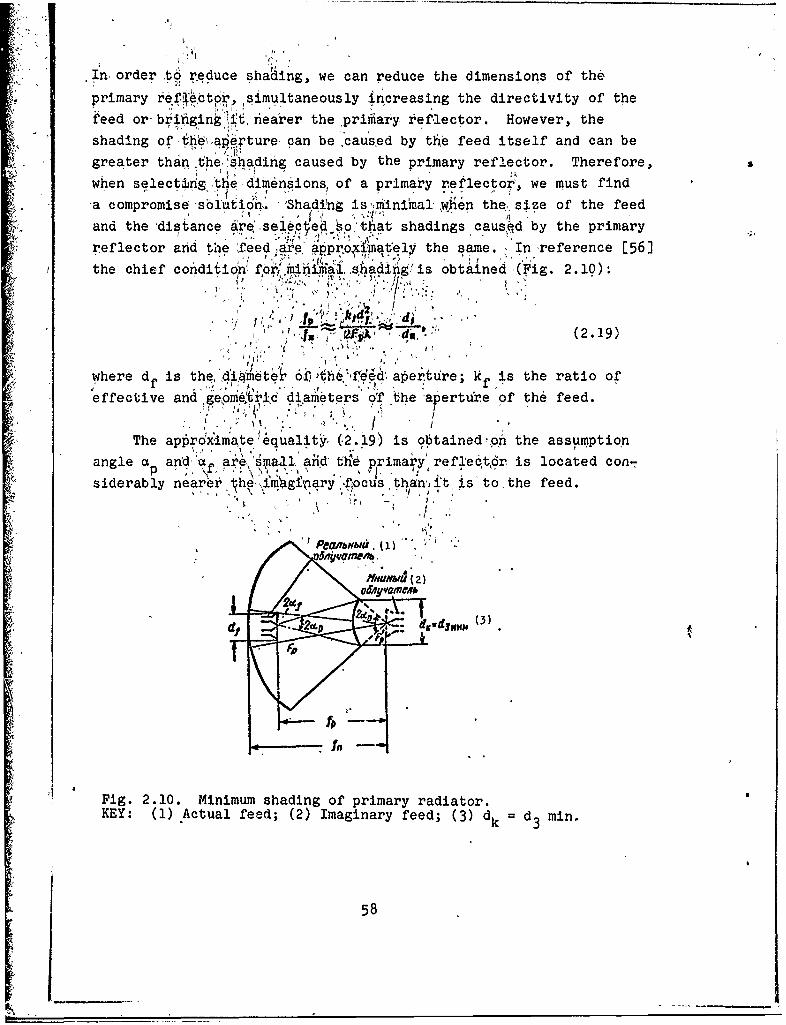
TIn order to rýeduce shading, we can reduce the dimensions of the
primary rof.ec6tpr, simultaneously increasing the directivity of the
feed or- brizbging~li't, iearer the prifihary. reflector. However, theshading of ,heoaRe'rture can be ,caused by tile feed itself and can be
greater thin ýthe 'shading caused by the primary reflector. Therefore,
when selecting ite-dimensions, of a primary reflector, we must find
a compromise ýsblution•. 'Shading is,,minimal 6hen the, size of the feed
and the 'distance aretselecte ýo'tthat shadings cause.d by the primary
reflector and the Xfeed.,aFe appr ox-nately the same. In ,reference [56]
the chief condition frt indal .shading is obtained (Fig. 2.10).
d (2.19)
where df is thedigmete' " , eed *ure; k is the ratio of
effective and peo 'ic d iatetPs 6f 'he ýaperture of the feed.
The d(equality,(2.19) is obtained,'pn the assumption
angle a anad, a are \'maal.,afi , .d tlke prima~y, ref lec',t,§r, is located con-,siderably nearer the,.:nmr'gfparyfýocus thni.t is' to the feed.
Fig. 2.10. Minimum shading of primary radiator.KEY: (1) Actual feed; (2) Imaginary feed; (3) dk = d 3 min.
58

,• ,' J45w • .Da •.u •D
t O"N. o .
Fig. 2.11. Antenna with turning of polarization plane to eliminateshading of the primary radiator. 1 - horizontal polarization;2 - vertical polarization.KEY: (1) Mirror which turns polarization plane.
The miminal diameter of shading is approximately [56]
daj." f'- t (2.20)
The relationshir. examined above for minimal shading are valid
for operation at any polarization. However, in case of operation
oLth only linear polarization, we can reduce shading by using methods
or turning polarization. In this case, the primary radiator (Fig.
2.1-1) is a horizontal grid which reflects a horizontally polarized
wave and transmits vertically polarized waves. Near the surface
of the main mirror is located a device which changes, during reflec-
tion, the polarization of a wave from horizontal to verftcal; the
wave then passes without hinderance through the primary radiator
with very small reflections, causing virtually no shading.
Since feeds can be made with small dimensions, the shading they
cause will be small and comparable with the shading in an ordinary
parabolic mirror. Consequently, in antenna systems with deflection
of polarization plane, it is expedient to use a large primary
radiator and a small feed.
59

The-formation 'of two radiation patterns for direction finding,inone plane in monopulse systems using parabolic antennas with aprimary radiator is carried'tout by the same methods asjin monopulsesystems with ordinary parabolic antennas.
The most important advantage of a-parabolic antenna -With a
primary radiator when using, it in a monopulse system is the possibi-ltt
of placing the feed behind the mirror, which makes it possible to
reduce the length of the feeder line which supplies the feed and,
consequently, to reduce error in angular coo.dinate measurement
because of the appearance of phase difference between segments of
feeder lines. In addition, in this case, it is possible to use in
the receiving device, low-noise amplifiers (quantum-mechanical or
parametric) since they can be placed directly beside the feeds. In
ordinary parabolic antennas, losses in the feeder line connecting the
feed with the low-noise amplifier located behind the mirror cause
significant reduction in sensitivity of the receiving device, while
the location of the low-noise amplifier near the focus of the para-
bol01d leads to afn increase in aperture shading.
Another important advantage of an antenna with a primary radiator
is the, possibility of obtaining an equivalent focal distance exceeding
the actual axial dimension of the antenna, i.e., the possibility of
obtaihing from a parabolic surface with a low f /d ratio the same
effect as in the case of using a parabolic surface with a high
fn/dn ratio. When locating the feeds at the apex of the parabolic
reflector or between the reflector and the primary radiator, the
effective f /d ratio can exceed the fr/d ratio for ordinary parabolic
antennas by no more than a factor of two. Thus, the total length of
an antenna with primary radiator can be cut in half as compared with
an ordinary parabolic antenna.
A third advantage of this antenna is the possibility of swinging
the beam by moving the primary radiator.
60
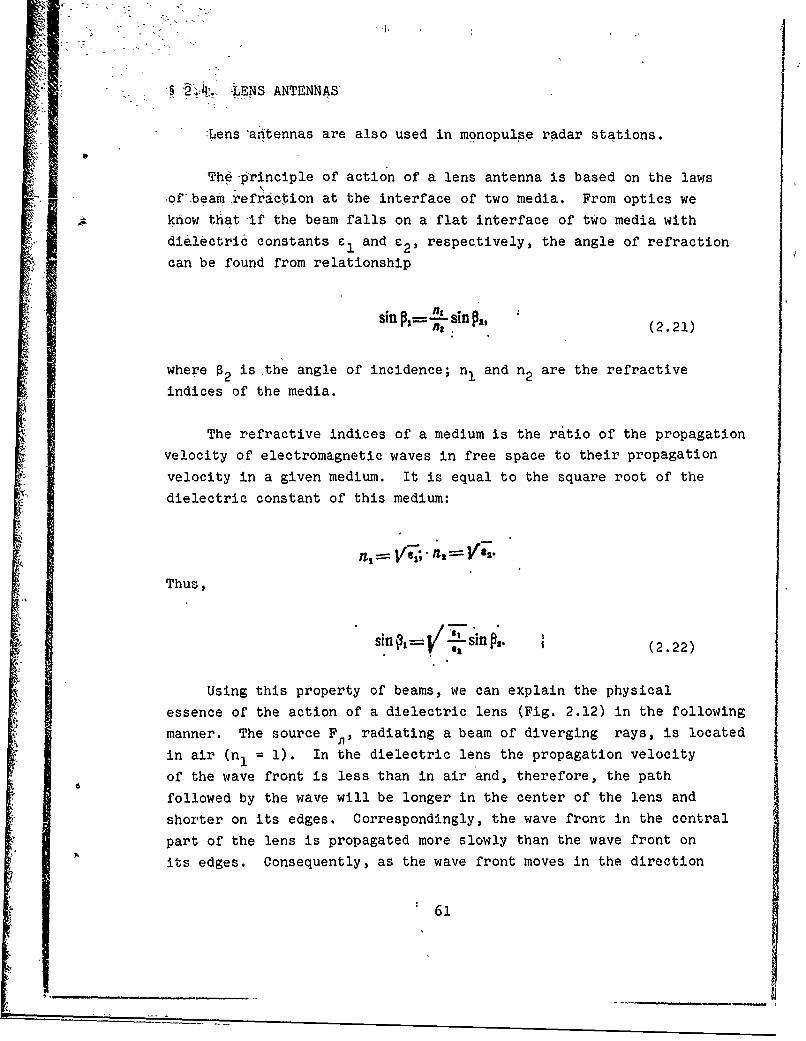
S 24. ••LENS ANTENNAS
:Lens -antennas are also used in monopulse radar stations.
The principle of action of a lens antenna is based on the laws
-of.beam refraetion at the interface of two media. From optics we
kknow that if the beam falls on a flat interface of two media with
die1ectric constants el and £2, respectively, the angle of refraction
can be found from relationship
Sm p.~L in ~(2.21)
where 02 is.the angle of incidence; nI and n 2 are the refractive
indices of the media.
The refractive indices of a medium is the ratio of the propagation
velocity of electromagnetic waves in free space to their propagation
velocity in a given medium. It is equal to the square root of the
dielectric constant of this medium:
Thus,
sin 3= " sinPz. (2.22)
Using this property of beams, we can explain the physical
essence of the action of a dielectric lens (Fig. 2.12) in the following
manner. The source F., radiating a beam of diverging rays, is located
in air (n. = 1). In the dielectric lens the propagation velocity
of the wave front is less than in air and, therefore, the path
followed by the wave will be longer in the center of the lens and
shorter on its edges. Correspondingly, the wave front in the central
part of the lens is propagated more slowly than the wave front on
its edges. Consequently, as the wave front moves in the direction
61
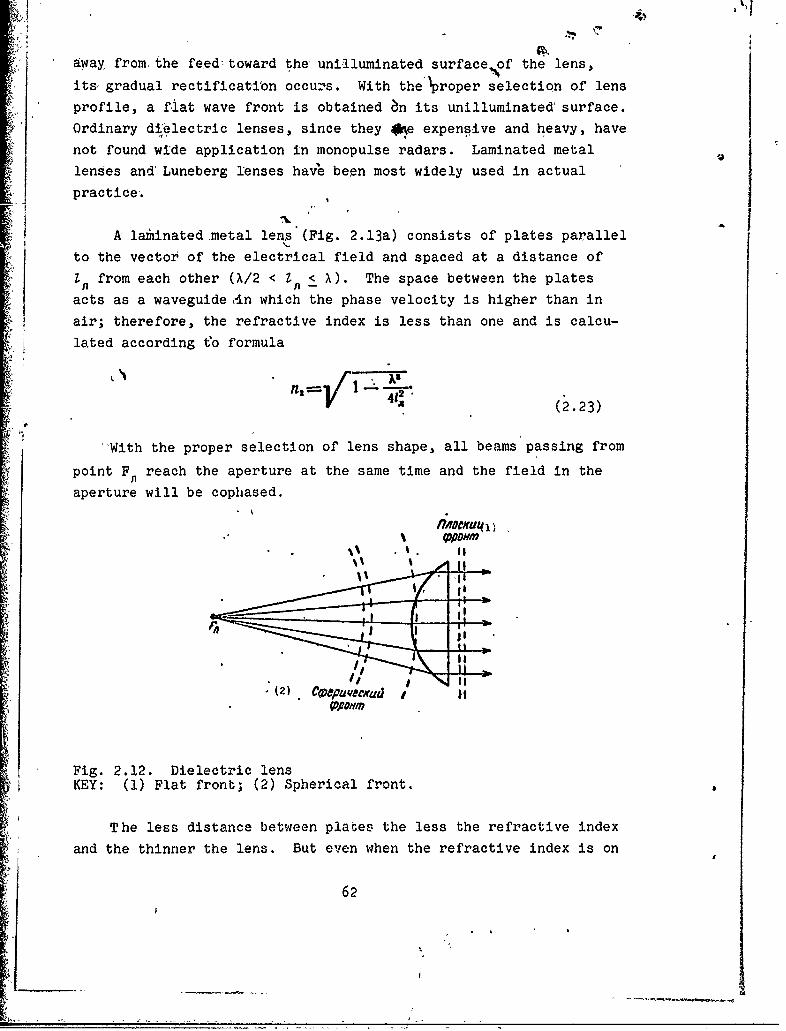
'79
away from the feed' toward the unilluminated surface of the lens,
its, gradual rectificati'on occurs. With the 'Proper selection of lensprofile, a fiat wave front is obtained •n its unilluminated' surface.
Ordinary dielectric lenses, since they *,e expensive and heavy, have
not found wide application in monopulse radars. Laminated metallenses and' Luneberg lenses have been most widely used in actual
.•. practice,.
A laminated metal lens (Fig. 2.13a) consists of plates parallel
to the vector of the electrical field and spaced at a distance of
In from each other (X/2 < Z < X). The space between the plates
acts as a waveguide tin which the phase velocity is higher than in
air; therefore, the refractive index is less than one and is calcu-
lated according t'o formula
V a (2.23)
'With the proper selection of lens shape, all beams passing from
point F reach the aperture at the same time and the field in the
aperture will be cophased.fn~oc/ruLq ,
I'op"
• I I
•(2) ¢euex I
Fig. 2.12. Dielectric lensKEY: (1) Flat front; (2) Spherical front.
The less distance between plates the less the refractive index
and the thinner the lens. But even when the refractive index is on
62
I: S
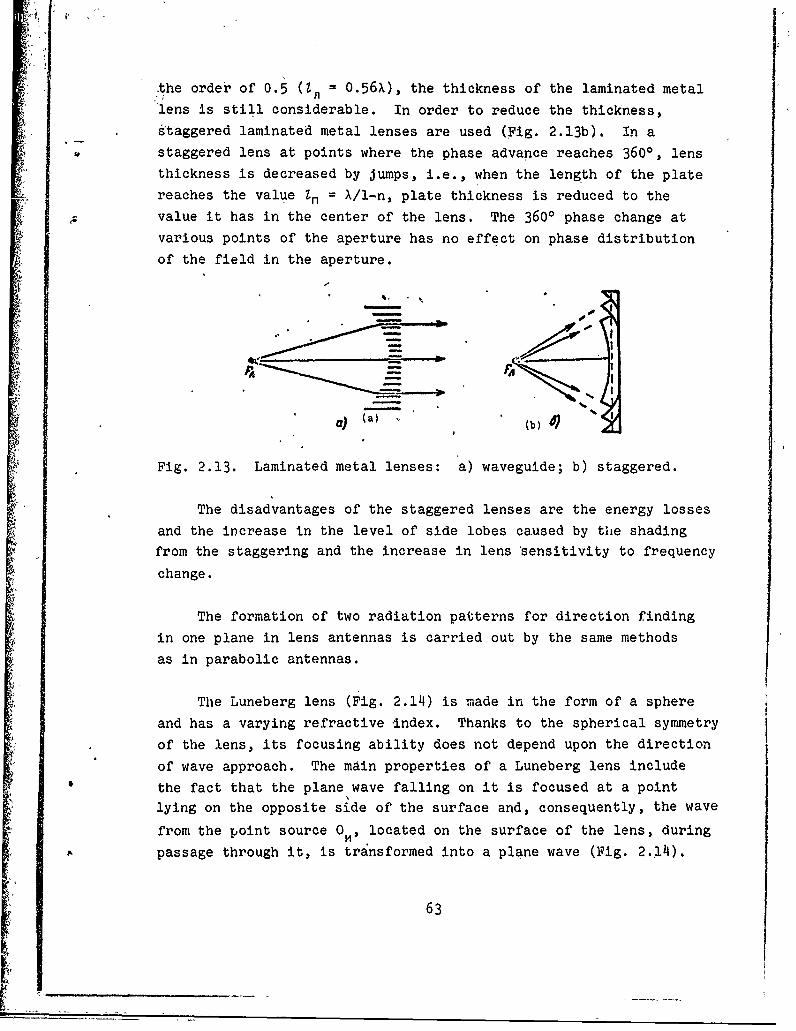
-the order of 0.5 (Z = 0.56X), the thickness of the laminated metal
lens is still considerable. In order to reduce the thickness,
ýtaggered laminated metal lenses are used (Fig. 2.13b). In a
staggered lens at points where the phase advance reaches 3600, lens
thickness is decreased by jumps, i.e., when the length of the plate
reaches the value In = X/1-n, plate thickness is reduced to the
A value it has in the center of the lens. The 3600 phase change at
various points of the aperture has no effect on phase distribution
of the field in the aperture.
) (a) ..(
Fig. 2.13. Laminated metal lenses: a) waveguide; b) staggered.
The disadvantages of the staggered lenses are the energy losses
and the increase in the level of side lobes caused by the shading
from the staggering and the increase in lens sensitivity to frequency
change.
The formation of two radiation patterns for direction finding
in one plane in lens antennas is carried out by the same methods
as in parabolic antennas.
The Luneberg lens (Fig. 2.14) is made in the form of a sphere
and has a varying refractive index. Thanks to the spherical symmetry
of the lens, its focusing ability does not depend upon the direction
of wave approach. The main properties of a Luneberg lens include
the fact that the plane wave falling on it is focused at a pointlying on the opposite side of the surface and, consequently, the wave
from the point source O., located on the surface of the lens, during
passage through it, is transformed into a plane wave (Fig. 2..14).
63

The teracdtion index in the Luneberg lens is changed in the
{f oli£dwing manner:
"V .'• . (2.24)
I where r. is• the radiusi£of the Luhebezxg lens;
r is the distance from the center of the lens to a point where
the refraction index is calculated.
(2)
UIrnOAHUPOU
Fig. 2.14. Spherical Luneberg lens.KEY: (1) Plane wave; (2) Point source.
As is apparent from formula (2.24), in the center of the lens
the refraction index has the highest value and is equal to V-;
on the surface of the lens it is equal to one.
Since ground and airborne radar sets usually ensure scanning
and tracking of targets only in the upper hemisphere, a Luneberg lens
in the form of a hemisphere is used (Fig. 2.15), in the base of which
a flat reflecting surface is installed which provides a mirror
reflection of the feed from point 0 H to point O0 .
In the Luneberg lens, shifting the source along its surface
causes a corresponding displacement of the beam in the opposite
64
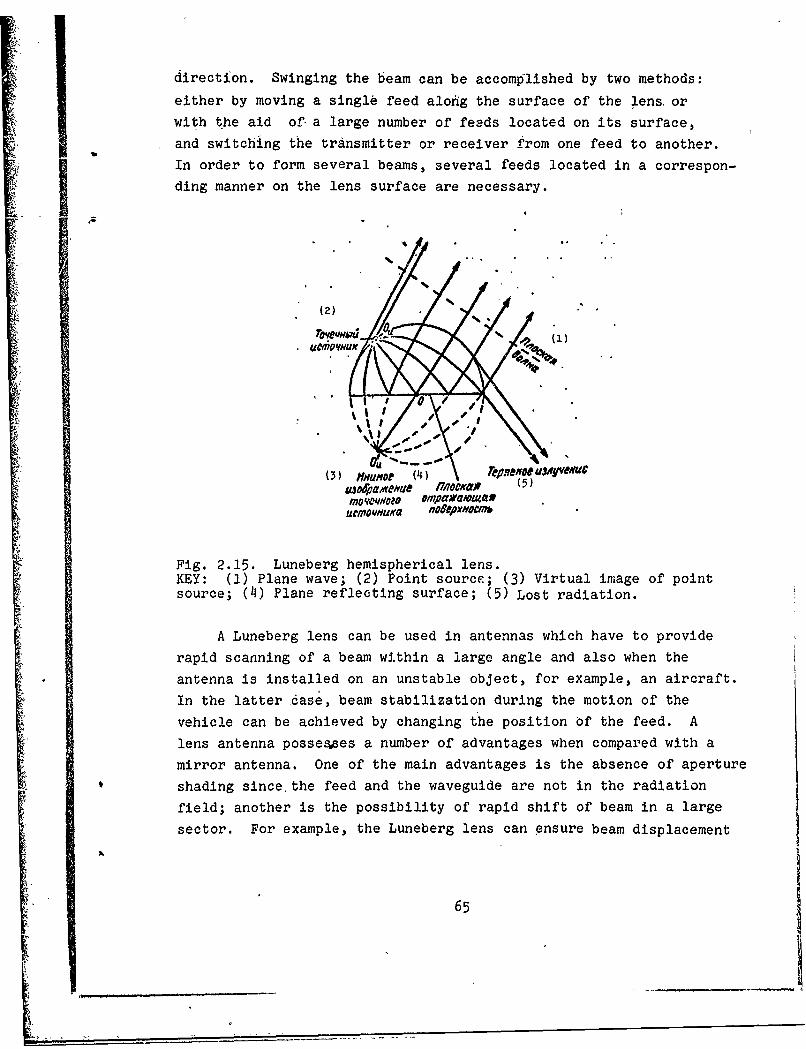
direction. Swinging the beam can be accomplished by two methods:
either by moving a single feed along the surface of the lens or
with the aid of a large number of feeds located on its surface,
and switching the transmitter or receiver from one feed to another.
In order to form several beams, several feeds located in a correspon-
ding manner on the lens surface are necessary.
'%:1% 0
(3 ) H~~e(4) eue•&jfý0,,W.uaJ MnOM&$ ( 5)
mo~Qdoao ompU~Wa•O4G
uelovnuHa noOMpxHoCn7
Fig. 2.15. Luneberg hemispherical lens.KEY: (1) Plane wave; (2) Point source; (3) Virtual image of pointsource; (4) Plane reflecting surface; (5) Lost radiation.
A Luneberg lens can be used in antennas which have to provide
rapid scanning of a beam within a large angle and also when the
antenna is installed on an unstable object, for example, an aircraft.
In the latter case, beam stabilization during the motion of the
vehicle can be achieved by changing the position of the feed. A
lens antenna posse.Ves a number of advantages when compared with a
mirror antenna. One of the main advantages is the absence of aperture
shading since, the feed and the waveguide are not in the radiation
field; another is the possibility of rapid shift of beam in a large
sector. For example, the Luneberg lens can ensure beam displacement
65

I 1
throughout the upper hemisphere. In addition, lens antennas require
less rigid mechanical and electrical tolerances and have a short
time lag. I "
Disadvantages of these antehnas include their low efficiency
ratio due to loss in materials, the considetable Volume occupied,
and the complexity of preparation.
§ 2.5. CROSSPOLARIZATION RADIATIONOF MIRROR-ANTENNAS
In mirror antennas because of the geometry of the antenna system
and also because of the imperfection of reflecting surfaces and feeds, I
the displacements of feeds from the focus of the reflector,, and
diffraction phenomena, depolarization (crosspolarization) occurs,
i.e., the radiation of a wave polarized in a different manner than
required [1, 16, 62, 63, 100, and 101]. , a
Taking into account the effecit of crosspolarization radiation
on the directivity factor of the antenna and the accuracy ot direqtion
finding, let us examine it with respect to parabolib antennas.
The appearance of crosspolarization radiation caused by thl
geometry of the antenna sirstem (curvature of -refldcting surface)
can be studied in the example of a paraboloid excited by a short
electrical dipole. In this case, the electrical field in the aperture
(Fig. 2.16) is determined by expression [63] :
-11IU exp I k). (f +z.) -*
-(1_cos ' cos2 1 sin2%(I Cos (2.25)"I awhere rn, gn and are the elements of a spherical system of
coordinates (Fig. 2.16);
Sn is the value of current on the surface of a mirror:
f n is the focal distance of the pailaboloid;
z 0 is the depth of the paraboloid;
66166
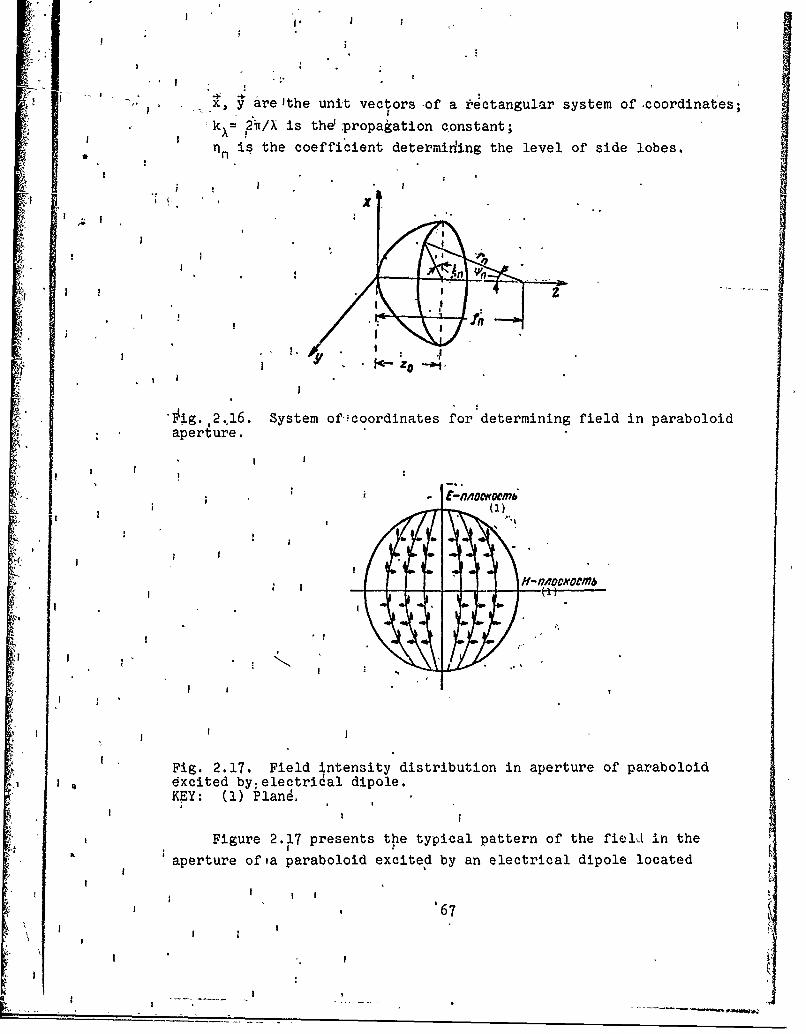
x ar teuitvcos-fai
x, y areethe unit vectors of a i'ctangular system of.coordinates;kX= ?2/X is thd propagation constant;
n is the coefficient determining the level of side lobes.
mX I
I~i. 2.6.System of icoordinates for determining field in paraboloid* aperture.
* .
KP
I I
"Fig. 2.•17 Field mntensity distribution in aperture of paraboloid
dxcited by~ electrical dipole.KEY: (1) Plan6.
Figure 2.1.7 presents the typical pattern of the field in theaperture of. a paraboloid excited by an electrical dipole located
6 7
4 I .
* I
! I
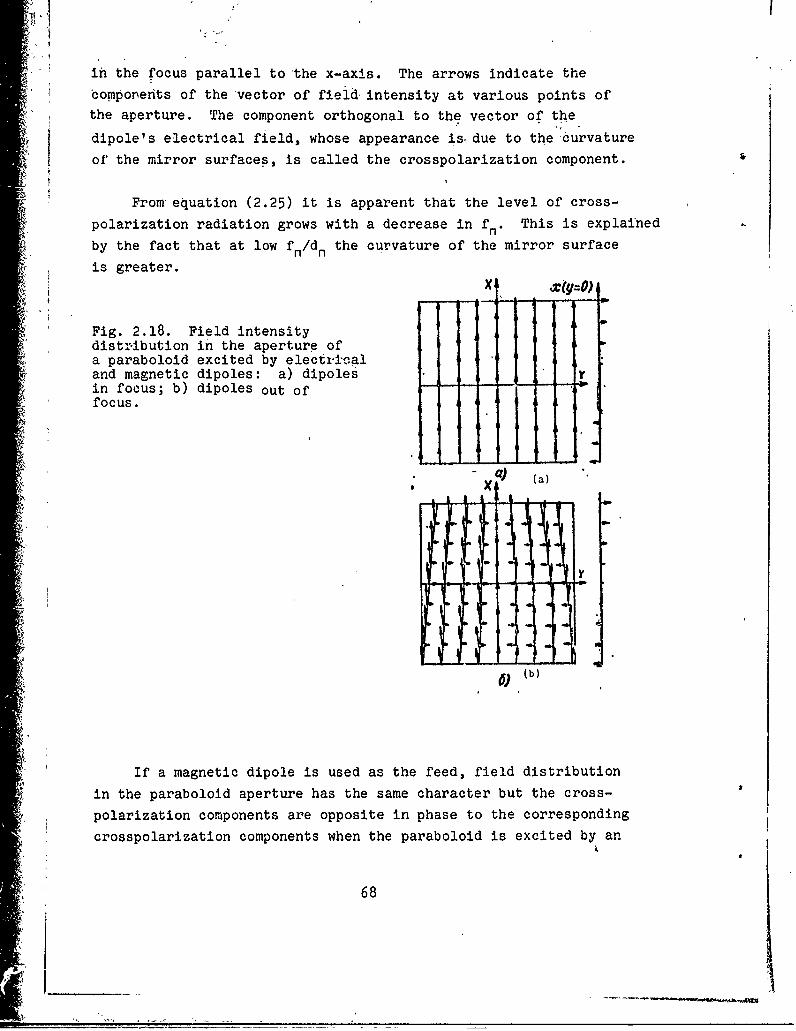
in the focus parallel to the x-axis. The arrows indicate thecomponents of the vector of field, intensity at various points ofthe aperture. The component orthogonal to the vector of the
dipole's electrical field, whose appearance is- due to the curvature
of the mirror surfaces, is called the crosspolarization component.
From equation (2.25) it is apparent that the level of cross-
polarization radiation grows with a decrease in f n. This is explained
by the fact that at low fn /dn the curvature of the mirror surface
is greater.
Fig. 2.18. Field intensitydistribution in the aperture ofa paraboloid excited by electri-caland magnetic dipoles: a) dipoles - T
in focus; b) dipoles out of
focus.
- ci) (a):gt
(b)
If a magnetic dipole is used as the feed, field distribution
in the paraboloid aperture has the same character but the cross-
polarization components are opposite in phase to the corresponding
crosspolarization components when the paraboloid is excited by an
68
electrical dipole. Consequently, if the paraboloid feed is7 a com-
bination of electrical and magnetic dipoles located at right.,anglesto each other, we can, to a certain extent, compensate for thecrosspolarization radiation of the antenna caused by the curvature
of its surface. A small rectangular horn can serve as such afeed with sufficient accuracy. However, as shown in reference [100],compensation is not complete.
Moving the feed from the focus, which iz virtually what occursin amplitude monopulse systems, causas amplitude asymmetry in currentdistribution on the paraboloid surface and, as a consequence anincrease in the level of the crosspolarization component in the
direction of feed displacement [16]. In this case, compensation of
crosspolarization radiation, if such occurred during the irradiation
of a mirror by a set of electrical and magnetic dipoles located
orthogonally in the focus of the mirror, is impaired. As seen from
Fig. 2.18a, with the arrangement of electrical and magnetic dipolesin the focus, the resulting currents flow along lines parallel tothe x-axis instead of the global lines as occurs during irradiation
by single dipoles. When the feed is removed from the focus '(Fig.2.18b), there is observed a constriction of current lines along thedirection toward one of the mirror's edge-. From the crosspolarization
components which then occur, only those wi~ich are located on differentsides from the x-axis are in opposite phase. This is the difference
from the case of mirror irradiation by a single dipole, when opposite
phase occurs for all crosspolarization components located in variousquadrants of the paraboloid surface. A similar distribution of fieldcomponents will also occur in the aperture of the paraboloid.
The radiation pattern of a parabolic mirror when it is excitedby a linearly polarized field is characterized by .,wo patterns; aradiation pattern with the main (operating) polarization and a
radiation pattern with crosspolarization. When mirror excitation is
symmetric, linear polarization occurs only in the direction of the
main planes: with deviation from them there occurs a distortion of
polarization which generally assines the form of elliptic polarization.
6969 •I
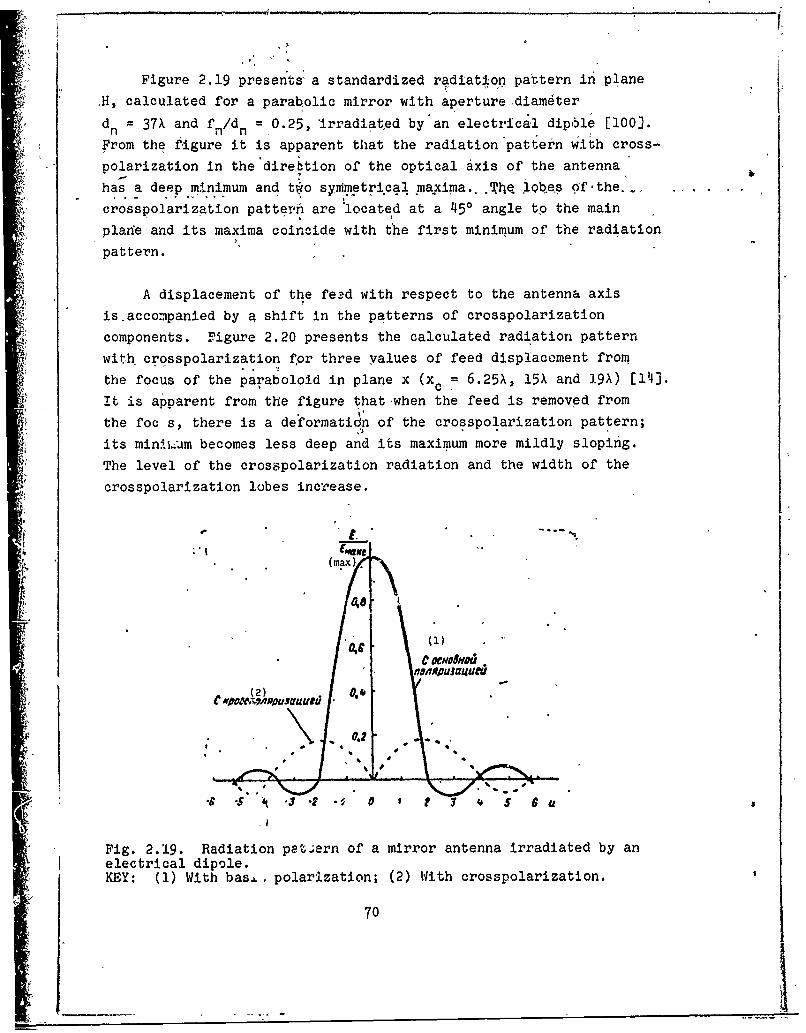
Figure 2.19 presents a standardized radiation pattern in plane
H, calculated for a parab.olic mirror with aperture diam~ter
d = 37X and fn/dn = 0.25, irradiated by an electrical dipble [100J.
From the figure it is apparent that the radiation pattern with cross-
polarization in the direbtion of the optical axis of the antenna
has a deep minimum and tio synImetrical maxima...The oQlje.s Of-the.
crosspolarization patterni are 'located at a 450 angle to the main
plane and its maxima coincide with the first minimum of the radiation
pattern.
A displacement of the feed with respect to the antenna axis
is.accompanied by a shift in the patterns of crosspolarization
components. Figure 2.20 presents the calculated radiation pattern
with crosspolarization for three values of feed displacoment from
the focus of the paraboloid in plane x (xc= 6.25X, 15X and 19X) [11i4.
It is apparent from the figure that-when the feed is removed from
the foc s, there is a deformation of the crosspolarization pattern;
its minli.um becomes less deep and its maximum more mildly sloping.
The level of the crosapolarization radiation and the width of the
crosspolarization lobes increase.
•t. . " '" 3
(max).
((1)
SFig. 2.19. Radiation pat,,.ern of a mirror antenna irradiated by an
electrical dipole..•, KEY: (1) With bas.L, polarization; (2) With crosspolarization.
70

IRA
o . .,
7.I$
•I
".20 -fee -120 -6 0"0 0 0 00 8 0 1n o AN•,
Fig. 2.20. Amplitude radiation patterns in ¢ planes for componentsE /E¢ fmaKC when xc = 19x.KEY: (1) min.
Crosspolarization radiation is also observed in the case of
excitation in a mirror antenna of a wave with circular polarization.
As we know, in order to excite a wave with circular polarization,
two orthogonally polarized waves with identical amplitudes and phase
shift of w/2 are required. Crosspolarization of an antenna leads
to distortion in amplitude and phase ratios for these components
of the excitation field. In this case, the presence of circular
polarization in the dirstb;on of maximum feed radiation does not
guarantee circular polarization in the direction of maximum mirrdr
radiation. In many cases, in order to obtain optical circular
polarization, it is necessary to resort to feeds with elliptical
polarization. However, even in this case, circular polarizationcan be obtained only in the direction of the mirror's optical axis.
In other directions the polarization of the radiation pattern is
elliptical and even linear.
76
* ~ , L-.,
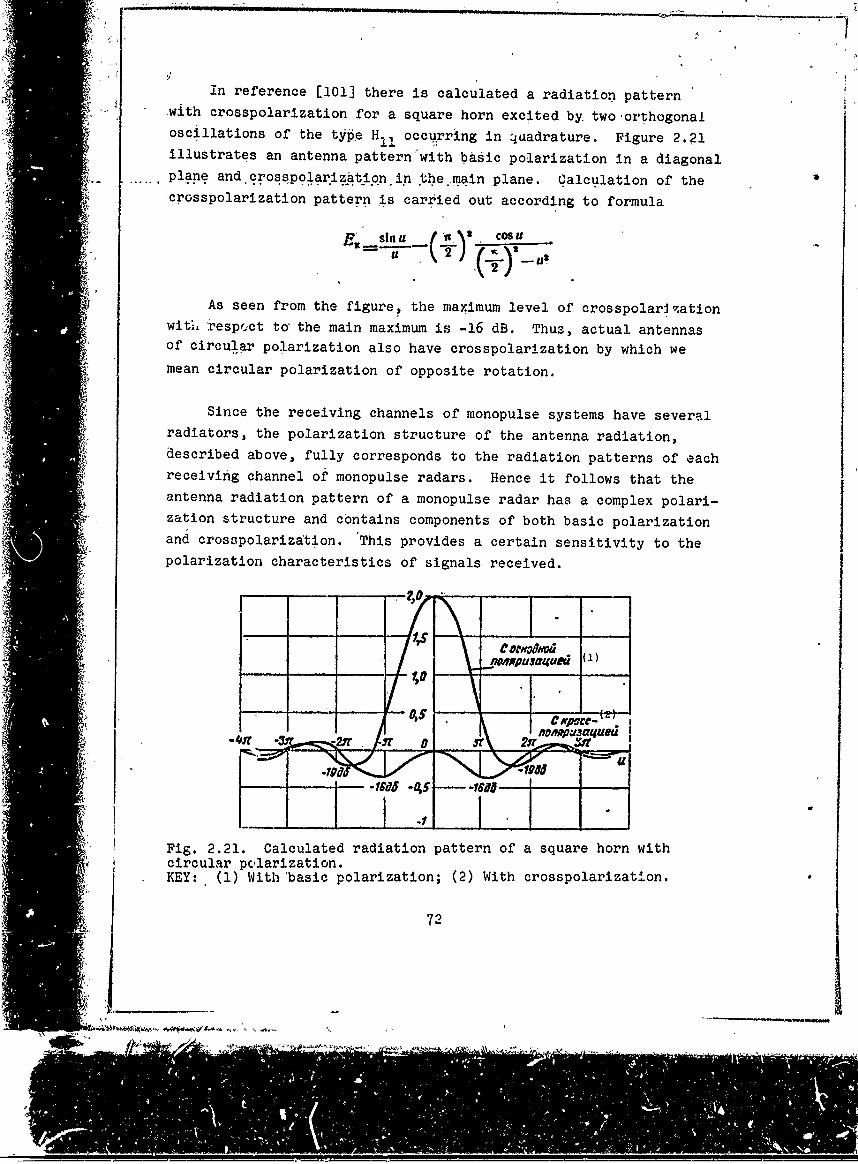
in reference [101] there is calculated a radiation pattern'with crosspolarization for a square horn excited by, two-orthogonaloscillations of the tye, H1 occurring in 4aadrature. Figure 2.21illustrates an antenna pattern'with basic polarization in a diagonalplane and crossplgarization in the.rnain plane. Calculation of the
A• crosspolarization pattern is carried out according to formula
At =in COSU'C_ .£
2_ 8
As seen from the figure, the maximum level of crosspolarigationwit-, i.espr.ct to' the main maximum is -16 dB. Thus, actual antennasof circular polarization also have crosspolarization by which wemean circular polarization of opposite rotation.
Since the receiving channels of monopulse systems have severalradiators, the polarization structure of the antenna radiation,described above, fully corresponds to the radiation patterns of eachreceiving channel of monopulse radars. Hence it follows that theantenna radiation pattern of a monopulse radar has a complex polari-
zation structure and contains components of both basic polarizationand crosspolariza~tion. 'This provides a certain sensitivity to the
polarization characteristics of signals received.
-f JT 0 Sr 2jr ce() MAW
- Fig. 2.21. Calculated radiation pattern of a square horn with
.. circular polarization. lnKEY:. (1) With'basic polarization; (2) With crosspolarization
m ~i•:-' li•: -- , _72
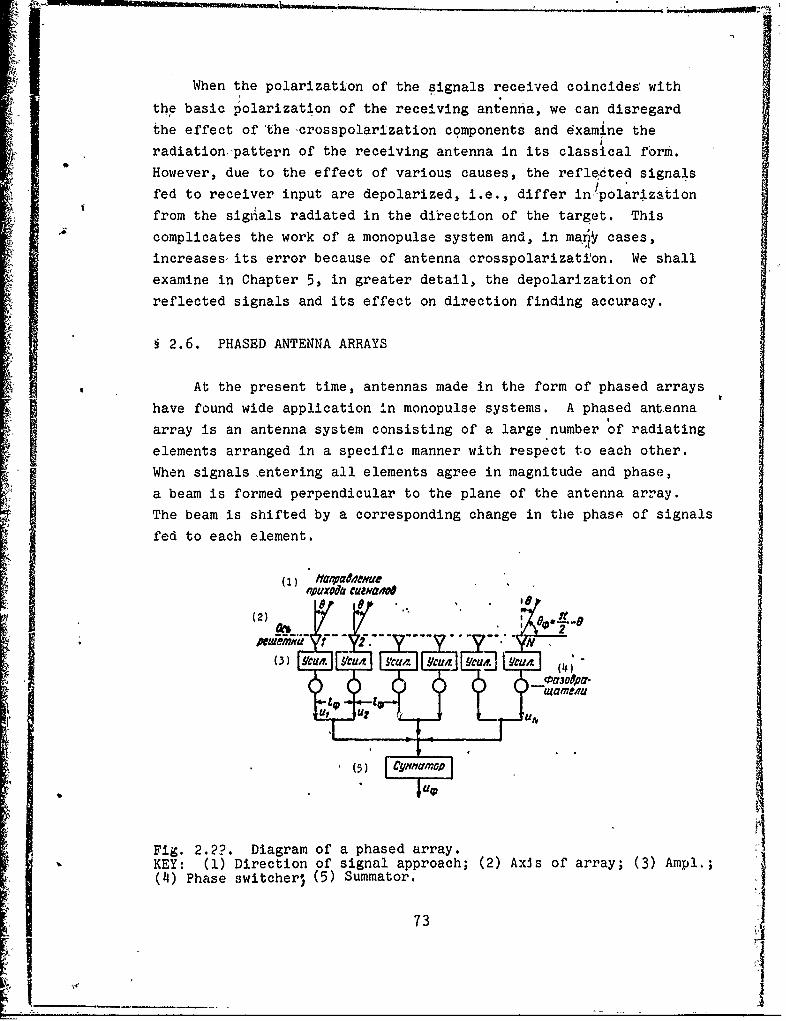
When the polarization of the signals received coincides with
the basic polarization of the receiving antenna, we can disregard
the effect of thecrosspolarization components and examine the
radiation. pattern of the receiving antenna in its classical form.
However, due to the effect of various causes, the reflected signals
fed to receiver input are depolarized, i.e., differ inpolarization
from the signlals radiated in the direction of the target. This
complicates the work of a monopulse system and, in ma Y" cases,
increases, its error because of antenna crosspolarization. We shall
examine in Chapter 5, in greater detail, the depolarization of
reflected signals and its effect on direction finding accuracy.
§ 2.6. PHASED ANTENNA ARRAYS
At the present time, antennas made in the form of phased arrays
have found wide application In monopulse systems. A phased antenna
array is an antenna system consisting of a large number of radiating
elements arranged in a specific manner with respect to each other.
When signals ,entering all elements agree in magnitude and phase,
a beam is formed perpendicular to the plane of the antenna array.
The beam is shifted by a corresponding change in the phase of signals
fed to each element.
(1) , Mfnp(4e4uea•uxoo't cueuva/vo
(2) w 5Sm o
7- -
Jiewf (- OMA,-
Fig.~ ~~ 2.?.Dagamomephsd rry
KEY: (1) Direction of signal approach; (2) Axis of array; (3) Ampl.,;
(14) Phase Lswitcher) (5) Summator.j
73
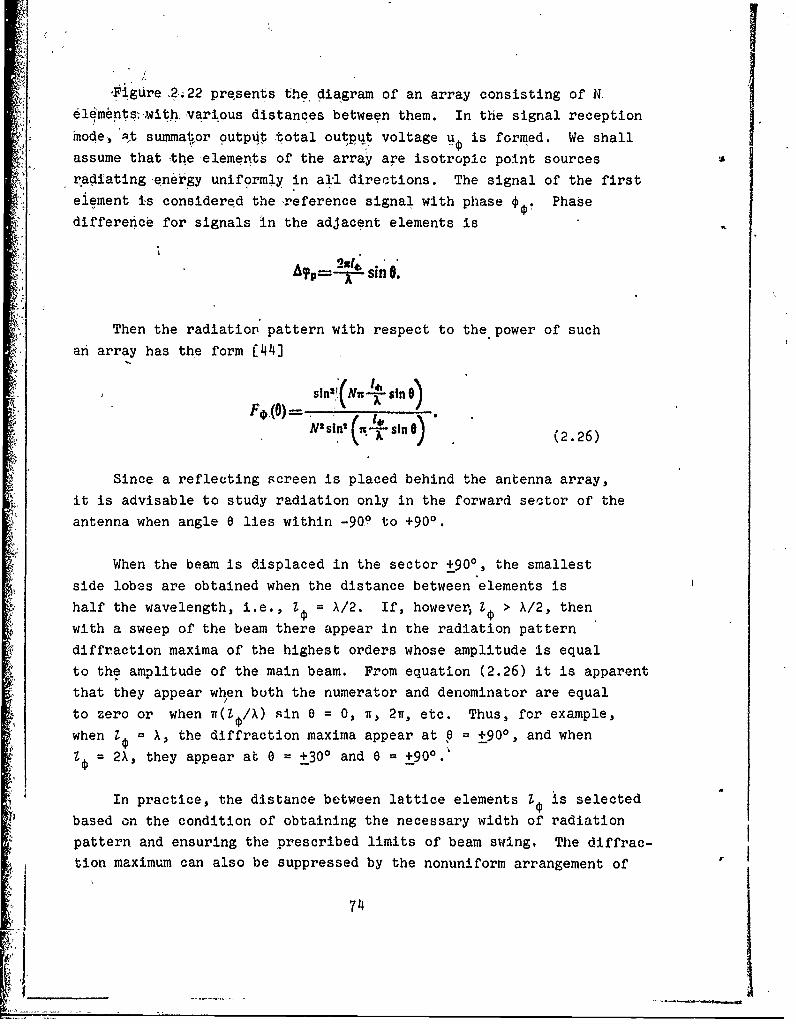
/Figure ,2i22 presents the diagram of an array consisting of N,elements-,,ith various distances between them. In the signal reception
mode, st summator output total output voltage u is formed. We shall
assume that the elements of the array are isotropic point sources
radiating energy uniformly in all, directions. The signal of the first
eiement is considered the reference signal with phase Phase
difference for signals in the adjacent elements is
1 ~sin 0.
Then the radiation" pattern with respect to the power of such
an array has the form [44]
N'sin 2N IV sine)NsinI' j• sing) (2.26)
Since a reflecting screen is placed behind the antenna array,
it is advisable to study radiation only in the forward sector of the
antenna when angle 0 lies within -90, to +900.
When the beam is displaced in the sector +900, the smallest
side lobes are obtained when the distance between elements is
half the wavelength, i.e., Z= /2. If, however, I > X/2, then
with a sweep of the beam there appear in the radiation pattern
diffraction maxima of the highest orders whose amplitude is equal
to the amplitude of the main beam. From equation (2.26) it is apparent
that they appear when both the numerator and denominator are equal
to zero or when w(l,$/X) sin e = 0, n, 27r, etc. Thus, for example,
when I¢ = X, the diffraction maxima appear at = +_900, and when
Z¢ = 2X, they appear at 0 = +301 and 0 = +900.
In practice, the distance between lattice elements Z¢ is selected
based on the condition of obtaining the necessary width of radiation
pattern and ensuring the prescribed limits of beam swing. The diffrac-
tion maximum can also be suppressed by the nonuniform arrangement of
74
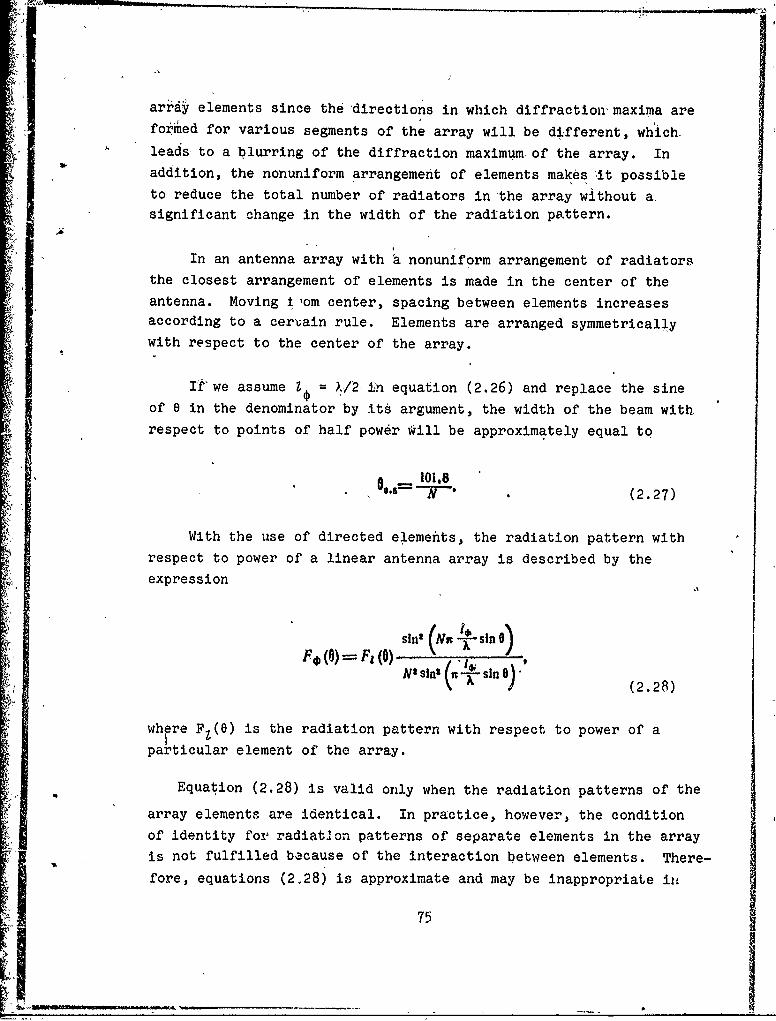
arraýy elements since the directions in which diffraction maxima areformiied for various segments of the array will be different, which.
leads to a blurring of the diffraction maximum of the array. Inaddition, the nonuniform arrangement of elements makes it possible
to reduce the total number of radiators in the array without a
significant change in the width of the radiation pattern.
In an antenna array with ba nonuniform arrangement of radiatorsthe closest arrangement of elements is made in the center of the
antenna. Moving ±,om center, spacing between elements increasesaccording to a ceruain rule. Elements are arranged symmetrically
with respect to the center of the array.
If'we assume I = X/2 in equation (2.26) and replace the sineof 0 in the denominator by its argument, the width of the beam with
respect to points of half power will be approximately equal to
, s- . (2.27)
With the use of directed elements, the radiation pattern with
respect to power of a linear antenna array is described by the
expression
sint (ArX --- sn)
F' (0)- F1 (0) -N' s10 sin 0). (2.28)
where Fz(e) is the radiation pattern with respect to power of a
particular element of the array.
Equation (2.28) is valid only when the radiation patterns of the
array elements are identical. In practice, however, the condition
of identity for radiat'gon patterns of separate elements in the arrayis not fulfilled because of the interaction between elements. There-
fore, equations (2,28) is approximate and may be inappropriate in
•,l 75ill-'

designing an. array. The' radiation pattern of an array can be deterinedd'4ccuiately, by. adding the radidtion. pattrns• •of al'I elements, tak-inginto acco~Tht -the coriesponding amplitud6s-and phases, The patternof each element must be removed in the presence of all other elements.
As radiators of an antenna array, -various weakly directional
antennas are usually used: vibrators, slits, horns, dielectricrods,, and spirals.
The radiation pattern of a two-dimensional rectangular flat
array can. be represented in the form of the product -of radiationkatterns in two planes containing the main axes of the -antenna,
'In antenna arrays when the beam is deflected from the, directionperpendicular to the antenna plane, the width of the beam increases
approximately in inverse proportion to cos 8.
.' 0Uxo"a'dua 'a' .l
(2) U.
I (3)(3£VYfG-___ __ __ __ __ _i ,,mop-
(4) 11 (4)t
Fig. 2.23. The formation o1' beams by an antenna array in a monopulseradar -with amplitude direction finding.KEY: (1) Direction of signal approach; (2) Ampl.; (3) Summator;K I (4) Beam; (5) ESD [6quisignal direction].
76

An array forming a single beam can be'transformed into a multi-
beam antenna by including additional phase switchers at the output
of each element. In order to form each beam, one additional phase
switcher is requit.ed..
In monpulse systems with amplitude direction finding,, the for-
imation of two- intersecting radiation patterns is carried out as
shown in Fig. 2.23. Signals from amplifier output of each element
are fed to two groups of phase switchers forming two beams. From
the outputs of the phase switchers signals aze fed to the summator.
In monopulse systems with phase direction finding, two radiation
:patterns are formed by the coherent summation of signals (at high
or intermediate frequency with the conservation of phases) separately
from each half of the array.
S2.ý7. ANTENNA FEEDS OF MONOPULSE RADARS
In monopulse radars with phase direction finding each of the
four feeds usually has its own reflector (Fig. 2.24). In monopulse
radar with amplitude direction finding in which an antenna is used
which consists of four horns irradiating the reflector (primary
radiator) or a lens, greatest propagation is obtained by the irradiator
arrangement shown in Fig. 2.25. With this arrangement, for both
types of direction finding in systems with four bridges, angular
information is extracted by a comparison of paired sums of signals;
when comparing the sum of signals (1 + 2) with the sum (3 + 4),
elevation is measured, and with a comparison of sum (1 + 3) with sum
(2 14) azimuth is mieasured. The horns are excited according to the
diagrain shown in Fig. 2.26. At each joint, indicated'on the diagram
by a point, a waveguide bridge is used. The sum signal (Z) is formed
by addition in bridge III of signals 1 and 3, 2 and 4, preliminarily
summed in pairs on the first two waveguide bridges. The difference
sigi-al (A). vwith respect to azimuth is obtained by subtracting in
bridge II from the sum of signals 1 + 3 the sum of signals 2 + 11.
The difference signal with respect to elevation is formned by
77

summation in bridge IV of the difference of signals 1 - 3 and 2 - 4,
obtained on the first two bridges. This gives the required result
because the system is linear and th .associative law is applicable
to it (1- 3) •+( - 4)= (1 + 2) -'(3 + 4).
Fig.2.24. Arrangement of feeds.(in the antenna system of a mono-pulse rx ,with phase directionfinding.
(3) OatUtfgfrf
Fig. 2.25. A four-horn Fig. 2.26. Excitation diagram ofirradiator. a four-horn irradiator.
KEY: (1) Azimuth error; (2) Sumsignal; (3) Elevation error.
In order to form the sum radiation pattern, the shaping circuit
of the irradiating system excites in phase all four-horns (Fig.
2.27). In order to obtain the most optimal radiation, horn dimensions
are selected so that in the formation of the sum beam the antenna
has maximum amplification with uniform irradiation of the mirror.
78
- A'
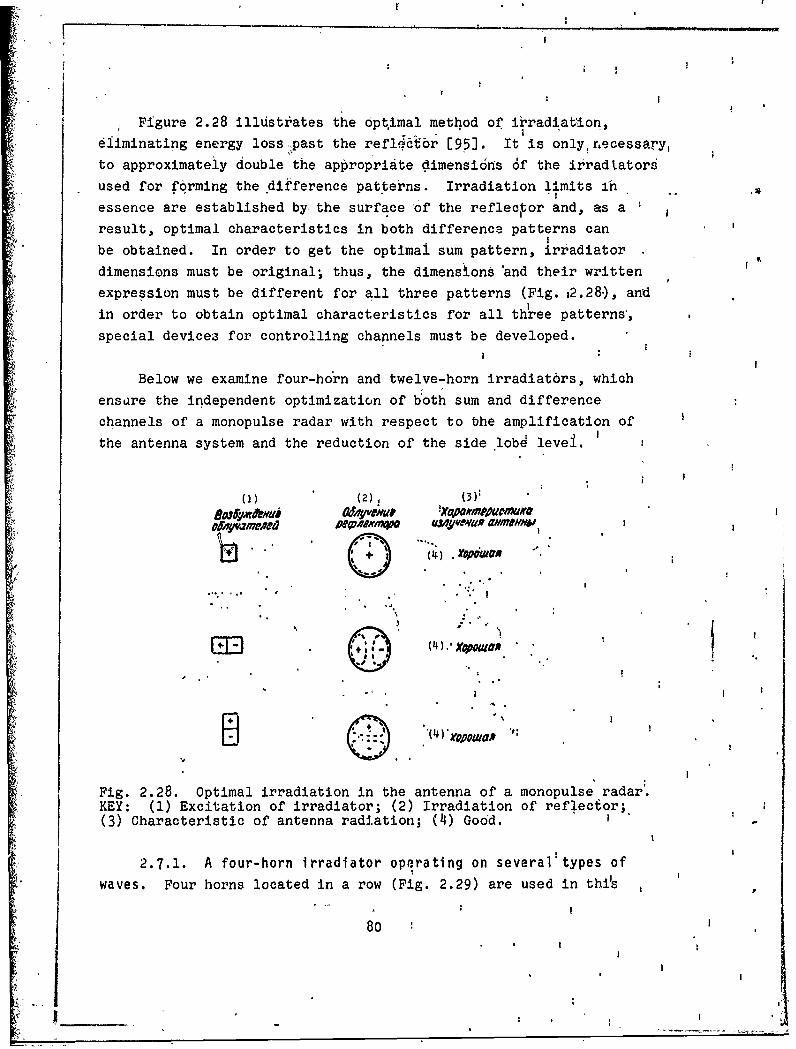
Figure 2.28 illustrates the optimal method of irradiation,
eliminating energy loss ,past the refldotbr [95]. It is only:recessary,
to approximately double the appropriate dimensildns 6f the irradtators
used for forming the .difference pat.terns. Irradiation limits in
essence are established by the surface of the reflector and, as a
result, optimal characteristics in both difference patterns can
be obtained. In order to get the optimal sum pattern, irradiator
dimensions must be original; thus, the dimensions 'and their written
expression must be different for all three patterns (Fig. ,2.28.), and
in order to obtain optimal characteristics for all three patterns',
special devices for controlling channels must be developed.
Below we examine four-hborn and twelve-horn irradiatdrs, which
ensare the independent optimization of b~oth sum and difference
channels of a monopulse radar with respect to the amplification of
the antenna system and the reduction of the side lobe level.
(1) (21) 1 1
KY (1Exiainoiraitr (2) .I,,adiat,,n of relco;
2[7-1. four-hor irg on .' r o
waes Fou hon loae.narw.Fg .9 reue nti
8 i
Fig. 2.28. Optimal irradiation in the antenna of a monopulse radar'.KEY: (i) Excitation of irradiator; (2) Irradiation of reflect~or;(3) Characteristic of antenna radiation; (4) Good. o
2.7.1. A four-horn irradiator operating on several types of
• ~waves. Four horns located in a row (Fig. 2.29) are used in thu~s'
807 8.
jul I
,1
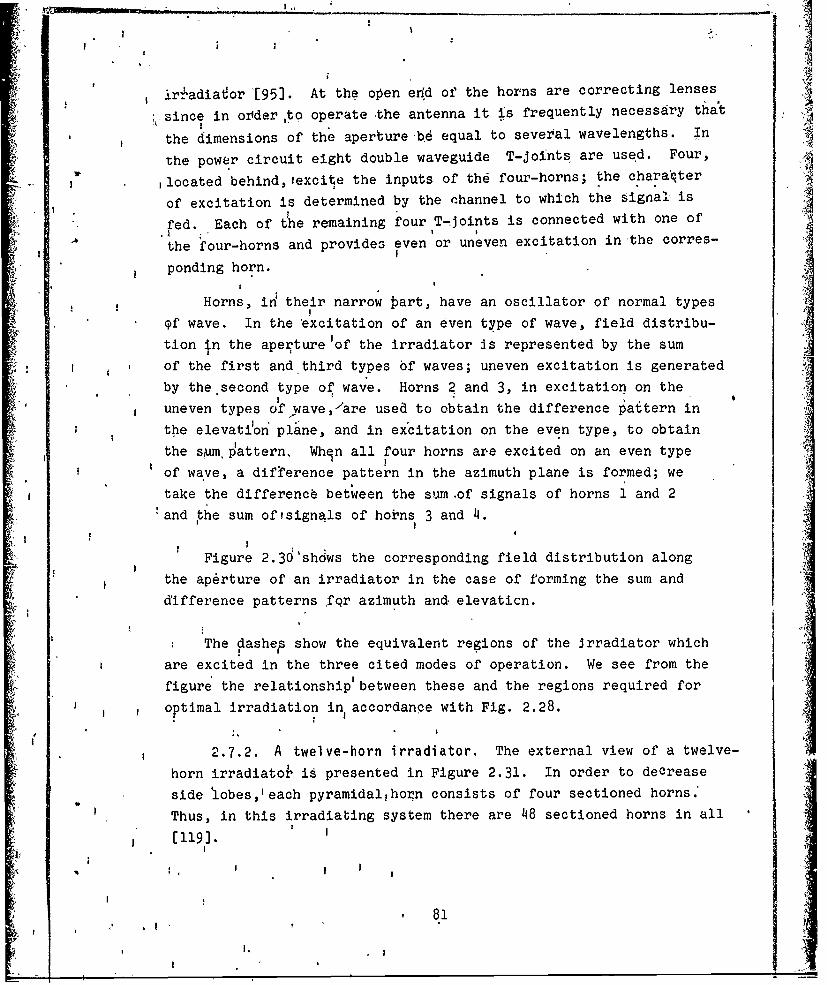
*,1?
irradiator [95]. At the open end of the horns are correcting lenses
;.,since in ozder ,to operate the antenna it is frequently necessary that
the dimensions of the aperture, 4equal to several wavelengths. In
the power circuit eight double waveguide T-Joints are used. Four,
,located behind, excite the inputs of the four-horns; the charaqter
of excitation is determined by the channel to which the Signal' is
"fed. Each of the remaining four T-joints is connected with one of
the four-horns and provides even or uneven excitation in'the corres-
ponding horn.
Horns, in their narrow bart, have an oscillator of normal types9f wave. In the *excitation of an even type of wave, field distribu-tion In the aperturelof the irradiator is represented by the sum
of the first and third types of waves; uneven excitation is generatedby the second type of wave. Horns 2 and 3, in excitation on theuneven types olfwave,,/are used to obtain the difference ýattern in
the elevatilon plane, and in excitation on the even type, to obtainthe sum.pattern. When all four horns are excited on an even type
of wave, a difCerence pattern in the azimuth plane is formed; we
take the differencL between the sum .of signals of horns 1 and 2!and the sum ofisignals of hoins 3 and 4.
Figure 2.3d'sh6ws the corresponding field distribution alongthe aperture of an irradiator in the case of forming the sum anddifference patterns lfQr azimuth and elevaticn.
The dashep show the equivalent regions of the irradiator which
are excited in the three cited modes of operation. We see from the
figure the relationship'between these and the regions required for
optimal irradiation in accordance with Fig. 2.28.
2.7.2. A twelve-horn irradiator. The external view of a twelve-
horn irradiatoi is presented in Figure 2.31. In order to decrease
side lobes,Veach pyramidalihorn consists of four sectioned horns.'
Thus, in this irradiating system there are 48 sectioned horns in all11191.
[119].8Ij I II
* 81
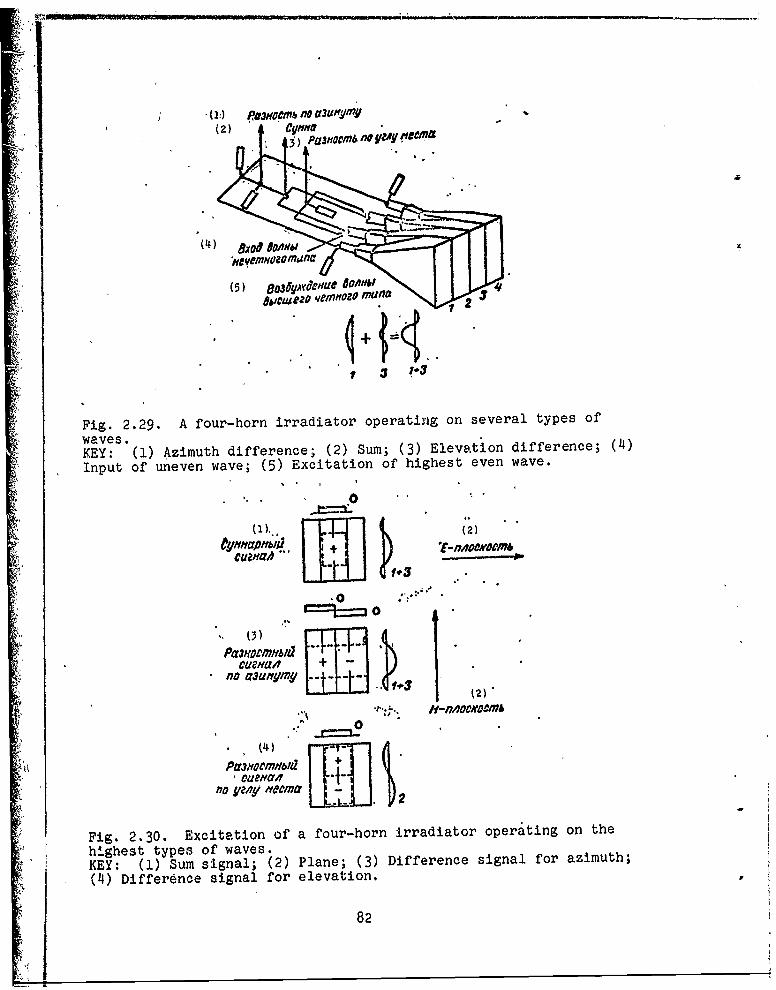
(V.) PaJ3H&cMt no O3UNIM9Y(~ ~ j 2 U3~ee
(5) 8oSu w§.qeX , &t _$bnuteZO velM~ozo MU," f 2
Fig. 2.29. A four-horn irradiator operating on several types ofwaves.KEY: (1) Azimuth difference; (2) Sum; (3) Elevation difference; (4)
Input of uneven wave; (5) Excitation of highest even wave.
.10
no ,A
Fig. 2.29. Axiaino four-horn irradiator operating on seerltye eowavhes. ye fwvsKEY: (1) Azimut diffeenc; (2) Sumn; (3) ElvtoDifference;sga o azi)uh(n4u oif ueven wigave (5) excitation.o ihs ee aen . $rau y8. (
PtarnoemH8Id(2)
no aau n~mg .-
Fig. 2.30. Excitation of a four-horn i.rradiator opera~ting on the
highest types of waves.KEY: (1) Sum signal; (2) Plane; (3) Difference signal for azimuth;
(~4) Difference signal for elevation.
82

Fig. 2.31. External view of a ' .:twelve-horn irradiator. 5 .14
The basic diagram of suc an irradiator is presented in Fig..
2.32. Information which cannot be used for forming radiation patterns
at the outputs of the waveguide bridge arms, is fed to the matched
load. The sum pattern is formed by exciting the four central horns
in the same manner as in the four-horn system. Two other groups
of four irradiators each are used for forming difference patterns in
the amplitude and elevation planes.
Since the difference patterns, in this case, are formed by asystem of irradiators with a larger aperture than in the system with
four irradiators, losses to envrgy overflow are reduced. Therefore,
the intensity of irradiation on the edges of the reflector is
approximately the same in the case of sum or difference signals.
2.7.3. A one-horn irradiator. An overall view of a one-horn
irradiator is shown in Fig. 2.33 [109). To study the operatingprinciple of this irradiator let us assume that it is used for the
reception of linearly polarized waves with polarization directed in
parallel to the narrow side of the neck of the irradiator.
When a signal arrives from ý point loca'ed in plane H (elevation
plane), in the neck there are excited waves TE1 0 and TE 2 0 whoserelative amplitude and phase values characterlze the at.gle of approach.
These waves excite a wave of type TEl 0 in' the two side arms. the
components of the wave in these arms are equal in amplitude but
83
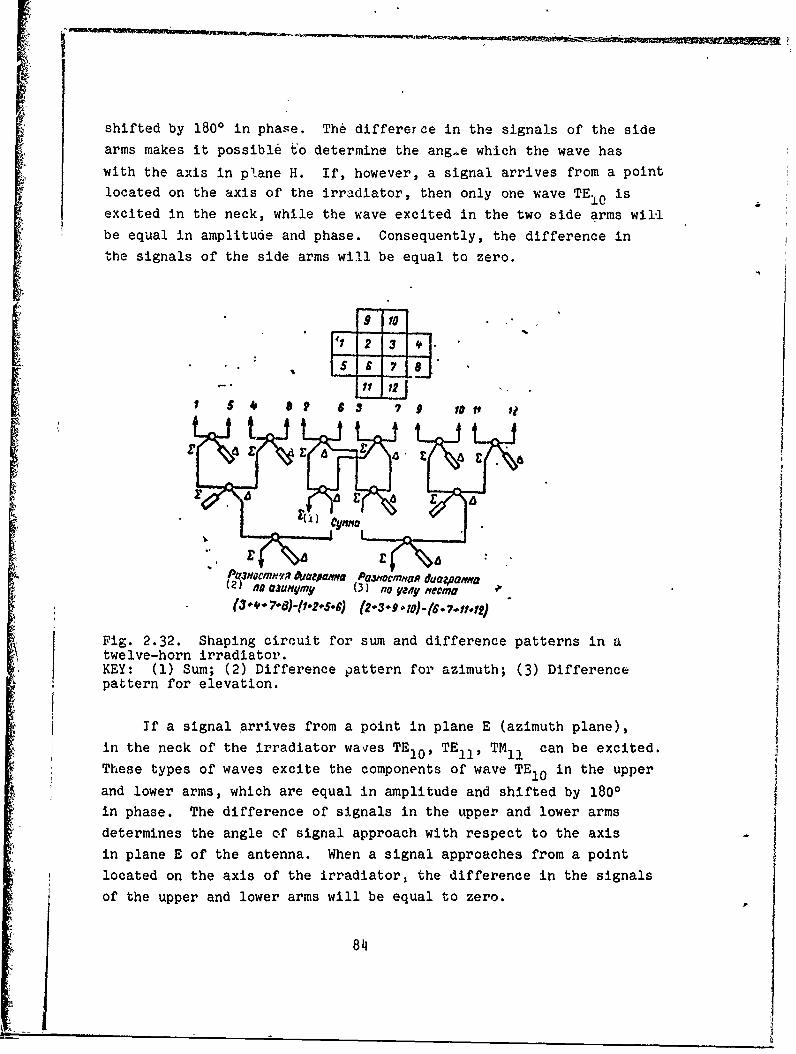
shifted by 1800 in phase. The differer ce in the signals of the side
arms makes it possible to determine the ang-.e which the wave has
with the axis in plane H. If, however, a signal arrives from a pointI located on the axis of the irradiator, then only one wave TE.0 is
excited in the neck, while the wave excited in the two side arms will
be equal in amplitude and phase. Consequently, the difference in
the signals of the side arms will be equal to zero.
1 * 63 7 R
Pta,•3om".'10 Ai•aWIea P930YocmMop udazpooaf(21 nO eJu /lrVm n (3) no y'eo• oee /om* ( 3 .t.. . - 2 -s -9) ( 2 -3 - -io ) -(t . 7 -1 . -I )
Fig. 2.32. Shaping circuit for sum and difference patterns in a
twelve-horn irradiator.KEY: (1) Sum; (2) Difference pattern for azimuth; (3) Differencepattern for elevation.
If a signal arrives from a point in plane E (azimuth plane),
in the neck of the irradiator waves TE 1 0 , TE1 1 , TM1 l can be excited.
These types of waves excite the components of wave TE1 0 in the upper
and lower arms, which are equal in amplitude and shifted by 1800
in phase. The difference of signals in the upper and lower armsdetermines the angle of signal approach with respect to the axis
in plane E of the antenna. When a signal approaches from a point
located on the axis of the irradiator, the difference in the signals
of the upper and lower arms will be equal to zero.
84

) (b)
()a)
Fig. 2.33. Overall view of a one-horn irradiator: a) top view;b) front view; c) vertical closs-section along the axis of symmetry;1 - left side arm; 2 - right side arm; 3 - upper arm; 4 - lowerarm.
A signal can approach from a point located neither in plane Hor in plane E. Then in the neck of the irradiator waves TE21,
and TM2 1 are excited. The amount of connection between these waves
and the four arms depends upon the signal approach angles withrespect to the axes of planes H and E, while the difference ofsignals in dorresponding pairs of arms determines the signal approachangle in the corresponding plane.
In designing irradiators there is an effort to make the neckbig enough that waves of types TE1 0 , TE 2 0 , TE11 , TM,,, TM1 2 can
be propagated. The dimensions 10 must be approximately 0.7X. Thedimension lI is not critical.
Table 2.1 presents formulas for critical wavelength Xc of adifferent type, which can be excited in the neck of the irradiator.All formulas pretain to a rectangular type of waveguide (a and b c
are waveguide dimensions).
85

[ Table 2. 1.
Th" ina~fA TESS I v TrT . TM, "Tal,, TM,,
a. ___ _____2a, a'2a, j -IfF+ (a/lb=)' + +(a./12.)
KEY: (1) Type of wave.
2.8. SELECTION OF MAXIMUM DISPLACEMENT ANGLEFOR A RADIATION PATTERN AND THE DISTANCE BETWEENPHASE CENTERS
An important antenna parameter for a monopulse radar is the
maximum displacement angle of the radiation pattern relative to
equisignal direction during amplitude direction finding and the
distance between phase centers of antennas during phase direction
finding. These parameters have a considerable effect on the accuracy
of direction finding and effective range. In determining optimal
value for these quantities, let us examine the example of a monopulse
system with a sum-difference angular discriminator.
Direction finding error is inversely proportional to the curvature
of the direction finding characteristic p and the signal-noise ratio
q:
I.Os EMF1(2.29)
Curvature i characterizes the direction finding sensitivity and
is
In an amplitude sum-difference monopulse system, near the equi-
signal direction the sum radiation pattelrn is virtually constant
86
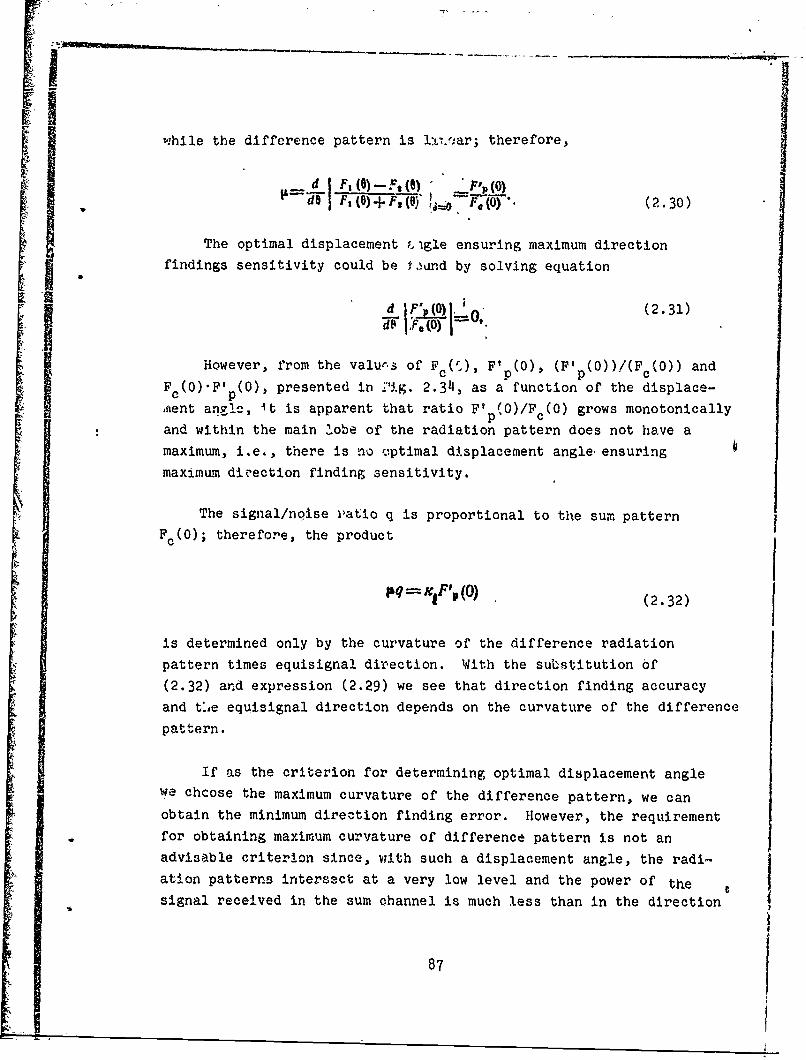
while the difference pattern is l:L•+•ar; therefore,
Sd j F, (6) - F () 'p(0)A Fs(+ V3 Fa (0 (2.30)
The optimal displacement ,gle ensuring maximum direction
findings sensitivity could be 1.fund by solving equation
d F'()I'(2.31)a(, I ý = 0
However, from the valurs of F (c), F'P (0), (F' p(0))/(Fc (0)) and
F c(0).F' (0), presented in 7ig. 2.34, as a function of the displace-
.fent anvlc, it is apparent that ratio F1 p(0)/F c(0) grows monotonicallyand within the main lobe of the radiation pattern does not have a
maximum, i.e., there is no viptimal displacement angle, ensuring
maximum divection finding sensitivity.
The signal/noise vatio q is proportional to the sum patternFc (0); therefore, the product
pq=K1 F',(O) (2.32)
is determined only by the curvature of the difference radiation
pattern times equisignal direction. With the suibtitution of
(2.32) and expression (2.29) we see that direction finding accuracy
and t!e equisignal direction depends on the curvature of the difference
pattern.
If as the criterion for determining optimal displacement anglewe chcose the maximum curvature of the difference pattern, we can
obtain the minimum direction finding error. However, the requirement
for obtaining maximum curvature of difference pattern is not an
advisable criterion since, vith such a displacement angle, the radi,-
ation patterns intersect at a very low level and the power of the
signal received in the sum channel is much less than in the direction
87

of maximum; this leads to a considerable reduction in target detection
range.
/2'.
Fig. 2.34. Dependence of relative Fig. 2.35. Relationship betweenralues on separation angle: 1) separation of irradiatrrs andFc(0)-. 2) F'p(0)/Fc(0); 3) F' (0); antenna aperture in a mionopulse
a cP radar with phase direction finding.4) Fc (0)Fp(0).
Consequently, as the optimal displacement angle, it is advisable
to take the angle corresponding to maximum product of sum patternand curvature of difference pattern, i.e., to chose the displacement
angle as a compromise between a loss in effective range and direction
finding accuracy. From the curves presented in Fig. 2.34 it is
apparent that the function F((0)0F).(0) has a maximum at 0 = 0.65e
With such a displacement angle two radiation patterns will inter-
seat below their maxima at a level near 3 dB, i.e., on a level of
half power. From this it follows that the optimal displacement engme
as approximately a half-width of the radiation pattern with respect
to the level of half power.
Optimal distance between phase centers of antennas (Fig. 2.35)
in a phase sum-difference monopulse system is also found based on
the condition of obtaining the maximum product of the sum pattern and
the curvature of the difference pattern, I.e., from the solution to
equation
88
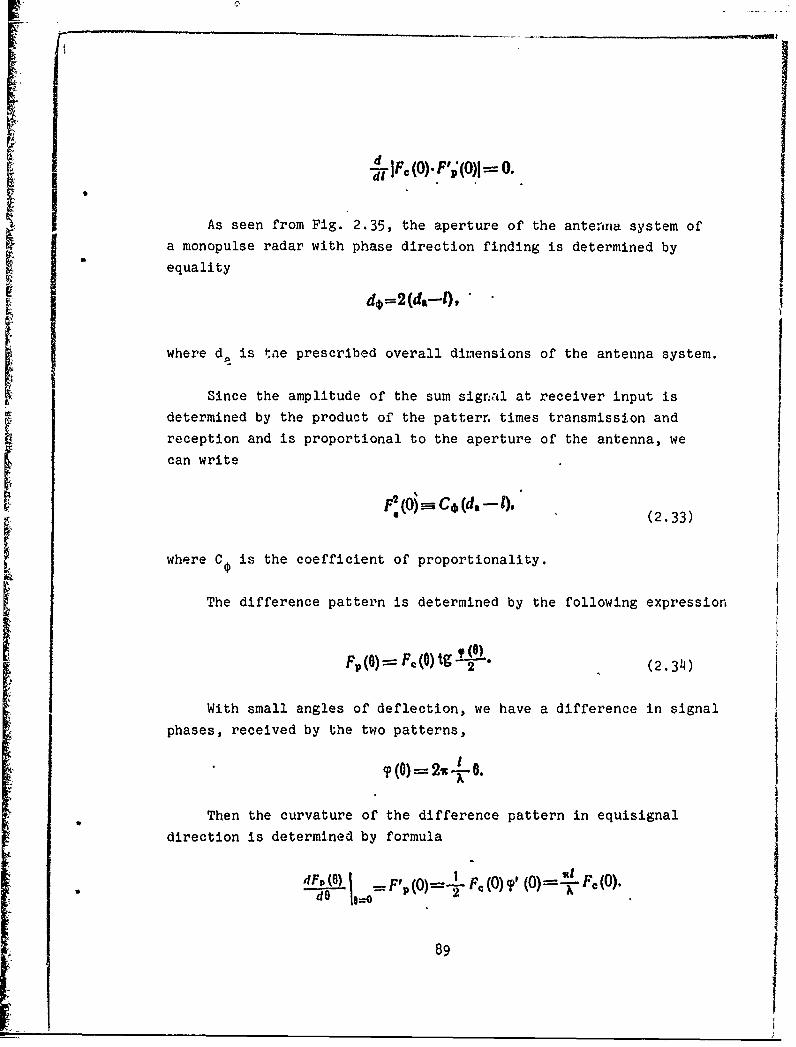
[di
As seen from Fig. 2 .35, the aperture of the antenna system of
a monopulse radar with phase direction finding is determined by
equality
where d• is tae prescribed overall dimensions of the antenna system.
Since the amplitude of the sum sigral at receiver input is
determined by the product of the pattern times transmission and
reception and is proportional to the aperture of the antenna, we
can write
.(0) ýC,6(d -- 0.(2.33)
where C is the coefficient of proportionality.
The difference pattern is determined by the following expression
Fp() =F, (0) ig f 2 32 (2-34)
With small angles of deflection, we have a difference in signal
phases, received by the two patterns,
2% ()-2--6.
Then the curvature of the difference pattern in equisignal
direction is determined by formula
dp+,(0) F? , I o=••~dO 2 (0) =2 (0) '
89 I
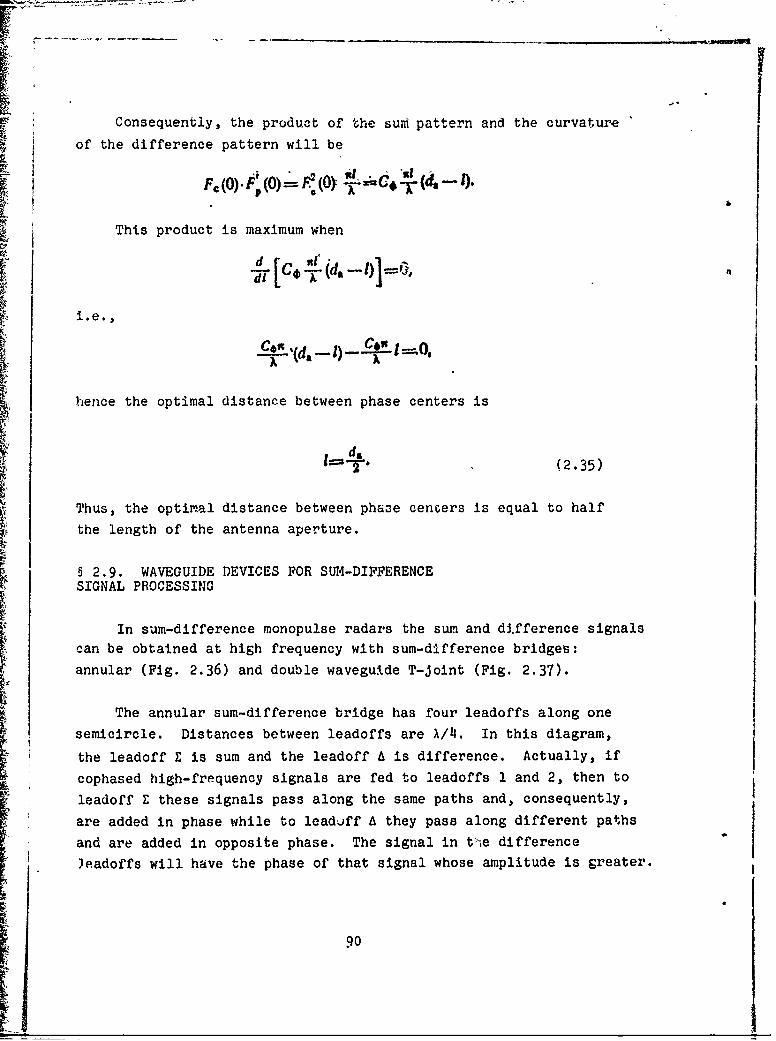
Consequently, the product of the sum pattern and the curvature
of the difference pattern will be
SFc (0). ýPo 0
This product is maximum when
d [C,6 n (da
- '(d,- l) I =
hence the optimal distance between phase centers is
l•-. (2.35)
Thus, the optimal distance between phase cencers is equal to half
the length of the antenna aperture.
§ 2.9. WAVEGUIDE DEVICES FOR SUM-DIFFERENCESIGNAL PROCESSING
In sum-difference monopulse radars the sum and difference signals
can be obtained at high frequency with sum-difference bridges:
annular (Fig. 2.36) and double waveguide T-Joint (Fig. 2.37).
The annular sum-difference bridge has four leadoffs along one
semicircle. Distances between leadoffs are X/4. In this diagram,
Sthe leadoff Z is sum and the leadoff A is difference. Actually, if
• i cophased high-frequency signals are fed to leadoffs 1 and 2, then to
leadoff Z these signals pass along the same paths and, consequently,
are added in phase while to leadoff A they pass along different paths
Sand are added in opposite phase. The signal in tl-e difference
)eadoffs will have the phase of that signal whose amplitude is greater.
9o

When the signal in leadoff 1 exceeds the signal in leadoff 2,
the phase of the difference signal, determined by the phase of the
signal from leadoff 1, is shifted relative to leadoff I proportionally
to 3X/4. The sum signal is shifted in phase relative to leadoffs
1 and 2 proportionally to X/4. Therefore, difference and sum signals
are in opposite phase.
r*4.
Fig. 2.36. Annular waveguide bridge.
fn.',oewcmb XOY=0 00 0 0O
0- 0 0 0 0 00
O~~X 000000000000
fl4ormocm XOZ (2)
,im
Fig. 2.37. Double waveguide T-JointKEY: (1) Plane XDY; (2) Plane XOZ.
91
If the signal in leadoff 1 is less- than the signal in leadoff 2,
the phase of the difference signal, determined by the phase of the
signal from leadoff'2, is shifted relativeto leadoff 2 proportionally
to X/4. The sum signal, has the same shift with respe'ct to leadoff 2.
In this case, the sum and difference signals are in phas~e.I |
In the double waveguide T-Joint two cophased signals, proceeding
to waveguides 1 and 2, form in leadoff E (plane xoy) the sum signal,
and in leadoff A (plane xoz) the differehce signal [18]. Actually,
if we assume that the force lines of the electrical field of the
waveguide in the horizontal plane are directed from the bottom up,
the vectors of the electrical field of signals 1 and 2 proceeding to
leadoff A have opposite direction.
The signal in the difference leadoff will have .the phase of
that signal whose amplitude is greater. In'the case of the equality
of signals 1 and 2, the difference sigizal 'will b6 equal to'zero.
Besides these sum-difference bridges, we can also use other
types of bridges, for example, slot balance bridges [131].
92
92 I
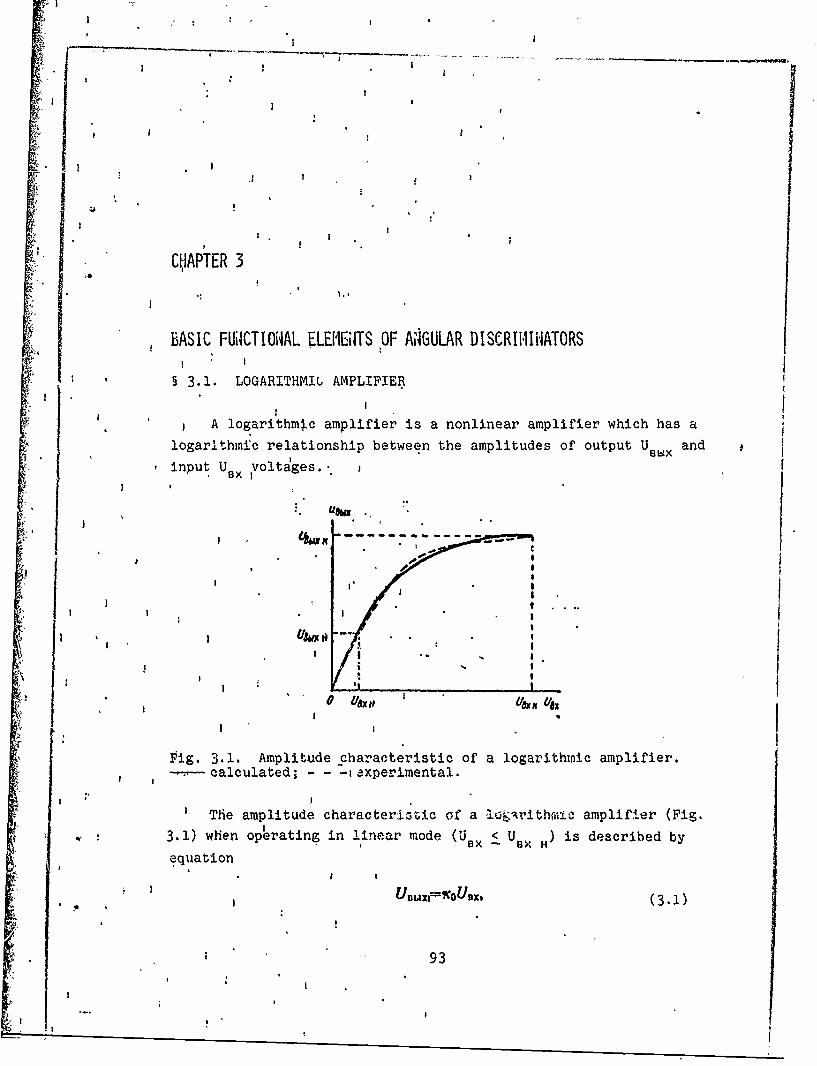
,I i
. 4
I
I I
* II, 2
CIHAPTER 3
BASIC FUliCTIONAL ELEMENTS OF AIGULAR DISCRIMIN,1ATORS
( '§ 3.1. LOGARITHMIG AMPLIFIER
A logarithmic amplifier is a nonlinear amplifier which has a
logar'thmic relationship between the amplitudes of output U and
input UBX voltages.. ,
;i I ~I I " ' ,
Lax.
I ass to UdxMa
Pig. 3..Amplitude characteristic of a lgrtmcapiir
J -~---calculated ; - - -iaxper'imental.
The amplitude characteriztic of a lo3,rithriiic amplifier (Fig.3.1) when operating in 1 lineax1 mode (U BX ýU 6>. H is described byequation
, I
I (3.1)
I 93
~- I

where k0 is the maximum amplification factor in the linear segment;
U H is the input voltage oeginning with which the characteristic
becomes logarithmic,
When a logarithmic, amplifier operates in the logarithmic mode
(Usx H < Ux< U9 x X), the expressio-' for the logarithmic amplitude
characteristic (LAC) will have the form [12]
(3.2)
S wrere a. is the coefficient characterizing the slope of the logarithmic[ characteristic;
U Ux K is the final input voltage at which the LAC of the
amplifier is evaluated.
In addition, a logarithmic amplifier can be characterized by
the following basic qualitative indices:
1) U and U K are the output voltages corresponding to
the beginning and end of the amplifier's logarithmic amplitude
characteristics;
2) dynamic range with respect to input and output voltages is
-- /'. ,x uX U u i '- t.u -- i 7,. (3.3)
3) the compression factor of the amplifier voltage is
---- n , (3.4)
4) the relative accuracy of reproducing the logarithmic amplitude
characteristic of the amplifier, which is the deviation of the
experimental characteristic from the calculated characteristic (Fig.
3.1)
9-U4 3 (
94
Awhere U is the output voltage throughout the dynamic range with9BIX 3
experimental LAC.
"Ux P is the output voltage througno;u the dynamic range withcalculat.ed LAC.
In § 1.3 we have shown that in a monopulse radar with anamplitude angular discriminator using logarithmic amplifiers, thediscrimination of angular information actually occurs as a result
of the subtraction of the logarithmic values of two signals, which
is equivalent to the formation of a logarithm of the ratio. Actually,voltage at output of the subtracting device (Fig. 1 . 4 ),,,on the
assumption that the logarithmic amplifiers are identical, will be
U3ai~ u...gaK9yK.u'xa. Ian !!z-'"a "six " 1(3.6)
where k is the transmission factor of the subtracting device.
In accordance with equalities (1.4 and 1.5), we can write
u', E (t) F1 () =E (1) F (6.- 0),uir, =E (t) s (6) = E (i) F (00 + 0).J (3.7)
: I J Then equation (3.6) assumes the form
Equality (3.8) describes the direction finding characteristic.
From it we see that the direction finding .haral-eristic in such amonopulse system depends upon the properties of the logarithmic
amplifier and not upon the value of the signal. Thereforb, anydeviation of the actual amplitude characteristics of amplifiers
from a precisely logarithmic chara'teristic leads to a distortion
in the direction finding characteristic and, consequently, to error
in determining target direction.
95
With a given permissible relative error of = HinH mUsx H
determining ratio mH = , the values of permissible absolutevx2
and relative deviAtior _h the actual amplitude characteristic
from a precisely logarithmic characteristic at any of its points
are respectively equal to [12]
SI±AUa,=l- lU~aan(l k)
8 'AUz O,7aV-+-a,) o' aaIn'U +-1 (39)
From equation (3.9) it is apparent that the permissible absolute
deviation of the experimental amplitude characteristic from the
-calculated logarithmic characteristic is higher the greater the
maximum amplification factor and input voltage and is constant
throughout the logarithmic range of the amplifier, while the permis.-
sible relative deviation is a variable quantity and reduces with
an increase in the level of comparable voltages. Consequently,
logarithmic amplifiers used in monopulse radars must reproduce
the logarithmic law of amplification at the end of the logarithmic
range with greater accuracy than at its beginning.. This accuracy
increases with an increase in the dynamic range of the amplifier,
In case of nonidentity of amplitude characteristics for twologarithmic amplifiers (a deviation in the experimental amplitude
characteristic of each amplifier from the calculated logarithmic
characteristic greater than the permissible value), output voltage
of an amplitude angular discriminator does not satisfy requirementsimposed on direction finding characteristics of monopulse systems.
Therefore, it ii necessary to achieve, by special measures, an
identity of amplitude characteristics in both amplification channels.
There are several methods for obtaining amplifiers with
logarithmic amplitudi characteristics. At the present time the
most widely used method is the shunting of anode loads in the
amplifier by nonlinear elements and the method of adding in
sequence the amplifiers' stages output voltages [12].
96
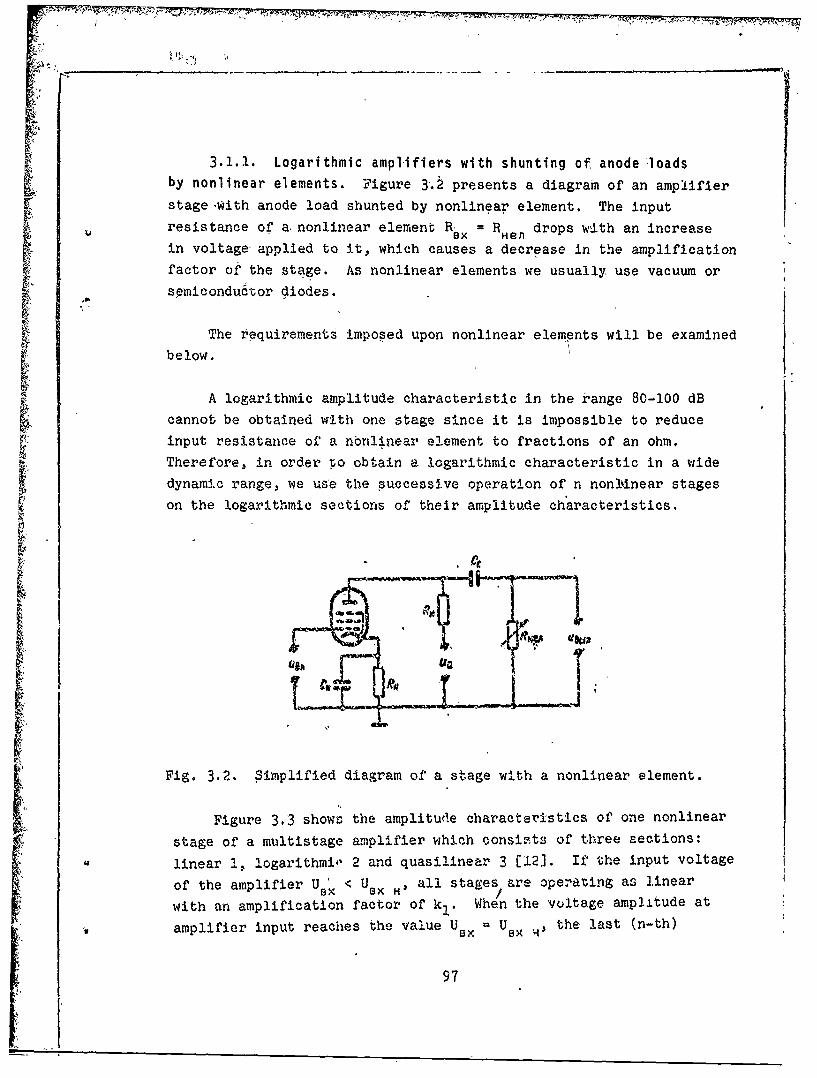
3.1.1. Logarithmic amplifiers with shunting of anode loadsby nonlinear elements. Figure 3'.2 presents a diagram of an amplifier
stage -With anode load shunted by nonlinear element. The input
resistance of a. nonlinear element Rx = R e drops w~th an increasein voltage applied to it, which causes a decrease in the amplification
factor of the stage. As nonlinear elements we usually use vacuum or
smiconductor diodes.
The requirements imposed upon nonlinear elements will be examined
below.
SA logarithmic amplitude characteristic in the range 80-100 dB
cannot be obtained with one stage since it is impossible to reduce
input resistance of a nonlinear element to fractions of an ohm.
Therefore, in order ýo obtain a logarithmic characteristic in a wide
dynamic range, we use the successive operation of n nonlkinear stages
on the logarithmic sections of their amplitude characteristics.
VIAio, l-k o
Fig. 3.2. Simplified diagram of a stage with a nonlinear element.
Figure 3.3 shows the amplitude characteristics of one nonlinear
stage of a multistage amplifier which oonsints of three sections:
linear 1, logarithmi, 2 and quasilinear 3 [121. If the input voltage
of' the amplifier U,, < Usa HJ all stages are operating as ].inear
with an amplification factor of kI. When the voltage amplitude at
amplifier input reaches the value Ux 32 Ua x, the last (n-th)
97

_-#
nonlinear stage begins to work An the logarithmic mode and its inputvoltage is
(3.10)
IIt
US,, (4. Pu
Fig. 3.3. Amplitude characteristic of a nonlinear stage.
With an increase in the input voltage of the last stage to
UB, it works in the logarithmic mode and all the others operate in
linear mode. With this the voltage at output of the nonlinear stage
is
U,,, 2 ýK.U, a,, In Ue + I(3.11)
In the future for the sake of simplicity we shall assume that
an = 1. When the input voltage of the last stage is changed in a
range from UH 1o U., voltage at input of the logarithmic amplifier
U - UH achanges in the range -l , and its amplification factor is
1determined by expression
98 q*+
98
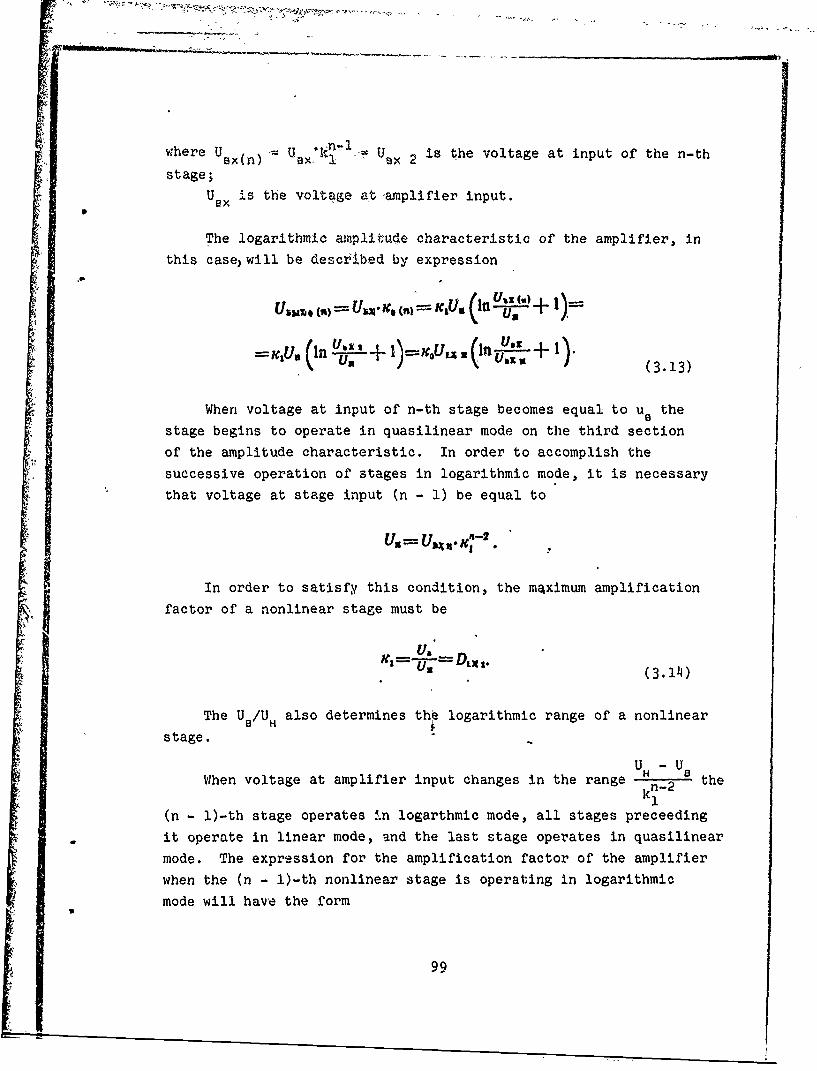
-where U-i -Uwheres(n) 2 i U is the voltage at input of the n-thstage;
USX is the voltage at amplifier input.
The logarithmic amplitude characteristic of the amplifier, inthis case, will be described by expression
g I. U31 4
SU,•, () = U ) • . - L,, I2-O;3II(. )=
fUn-(U . (3.13)
When voltage at input of n-th stage becomes equal to uB thestage begins to operate in quasilinear mode on the third section
of the amplitude characteristic. In order to accomplish the
successive operation of stages in logarithmic mode, it is necessary
that voltage at stage input (n - 1) be equal to
In order to satisfy this condition, the mAximum amplification
factor of a nonlinear stage must be
'U, (3.14)
The U /UH also determines the logarithmic range of a nonlinear
stage.
UH - UWhen voltage at amplifier input changes in the range n-2 the
1(n - l)-th stage operates in logarthmic mode, all stages preceeding
it operate in linear mode, and the last stage operates in quasilinearmode. The expression for the amplification factor of the amplifier
when the (n - l)-th nonlinear stage is operating in logarithmic
mode will have the form
99
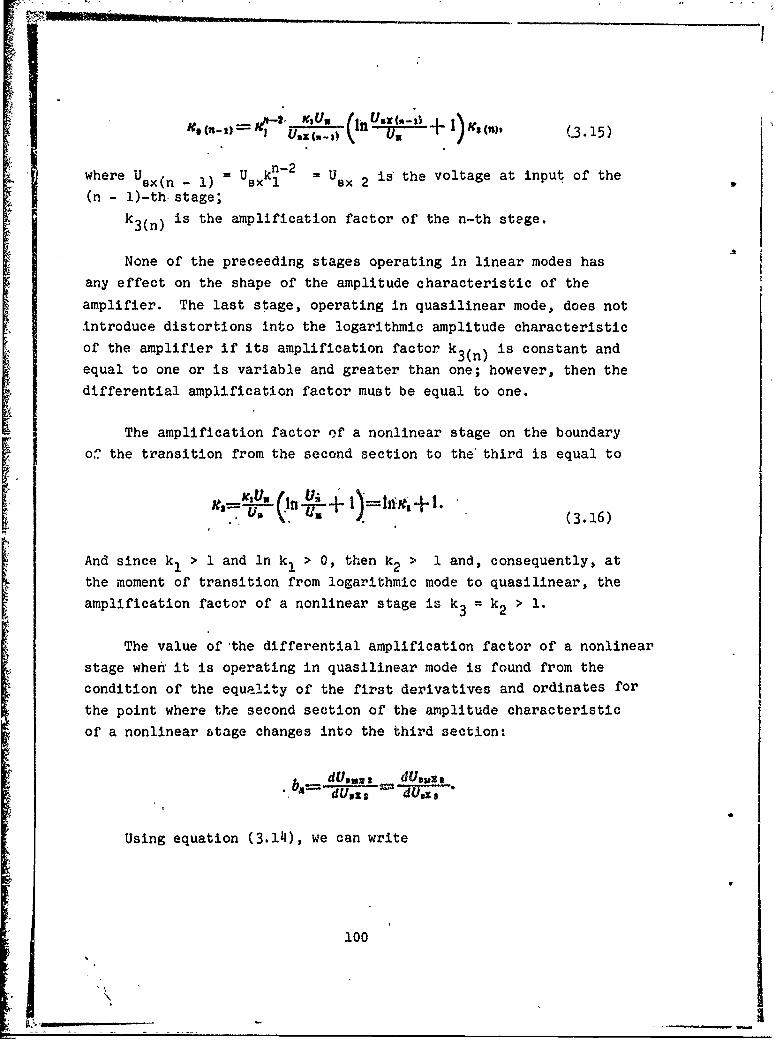
Ks-.•- U••_u _ E- h-•'1 + I Ks (n,
Su,(,-,- (3.15)
, n-2where UsX(n U i) = k 1 = U 2 is the voltage at input of the
(n - l)-th stage;
k3(n) is the amplification factor of the n-th stege.
None of the preceeding stages operating in linear modes hasany effect on the shape of the amplitude characteristic of the
amplifier. The last stage, operating in quasilinear mode, does not
introduce distortions into the logarithmic amplitude characteristicof the amplifier if its amplification factor k3(n) is constant andequal to one or is variable and greater than one; however, then the
differential amplification factor must be equal to one.
The amplification factor of a nonlinear stage on the boundary
of? the transition from the second section to the third is equal to
-( (3.16)
And since k > 1 and ln k1 > 0,'then k2 > 1 and, consequently, at
the moment of transition from logarithmic mode to quasilinear, the
amplification factor of a nonlinear stage is k3 = k2 > 1.
The value of the differential amplification factor of a nonlinear
stage when it is operating in quasilinear mode is found from thecondition of the equality of the first derivatives and ordinates for
the point where the second section of the amplitude characteristic
of a nonlinear stage changes into the third section:
dU.x, dUaexa
Using equation (3.14), we can write
100
* K
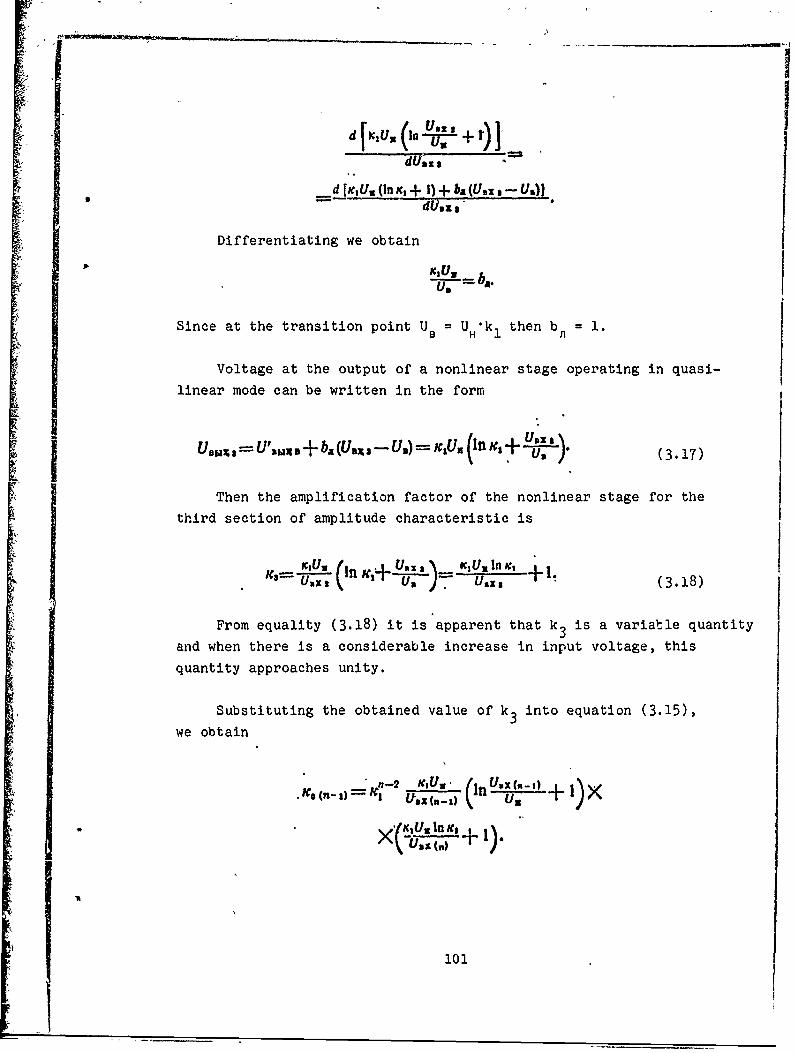
d [X,U. (In ITS-+ t
d jKUz (in K, + 1) + b- (U.1 -- IU.)]dU,x I'
Differentiating we obtain
cU,
Since at the transition point U. = UH k1 then b= i u
Voltage at the output of a nonlinear stage operating in quasi-linear mode can be written in the form
UszUsus =UPAs5+bN(URX -US) = 1X(lnv, + U1,) (3.17)
Then the amplification factor of the nonlinear stage for thethird section of amplitude characteristic is
93 KU (i /C'+ U.: • •,UIn K,+-Ul,, ( ) SK$ (3.18)
From equality (3.18) it is apparent that k3 is a variable quantityand when there is a considerable increase in input voltage, this
quantity approaches unity.
Substituting the obtained value of k into equation (3.15),
we obtain
Ko(- ) -2 1,0. (nmX11 U +) •"+"+° ( ")--_____(-; (fx( I), +
X(fK,ux in , + I
101
__________ _____________oi
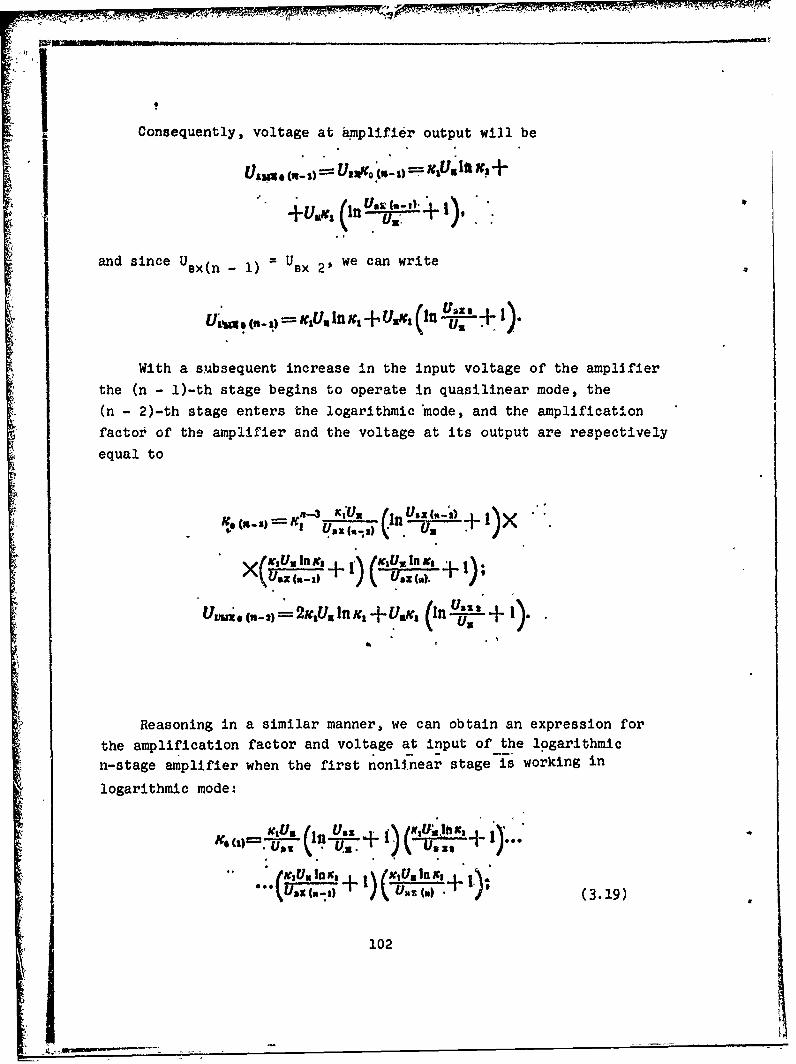
J-
Consequently, voltage at amplifier output will be
and since U x(n 1) UBx 2' we can write
With a subsequent increase in the input voltage of the amplifier
the (n - l)-th stage begins to operate in quasilinear mode, the
(n - 2)-th stage enters the logarithmic "mode, and the amplification
factor of the amplifier and the voltage at its output are respectively
equal to
If.(iss)X5 ~m (,)(in.U~/ + ixX(Ulc. In le,+,u.,il, +1)
Uljwi#CR..i-=2A",U.lfnk,+uM1(, (In~'-+ 1)"
Reasoning in a similar manner, we can obtain an expression for
the amplification factor and voltage at input of the logarithmic
n-stage amplifier when the first nonlinear stage is working in
logarithmic mode:
=.Etuylk USXU;i, !ft 11,+
(le Us II cs+I t U2 1n1+
""USX a vat(a.) (3.19)
102

(i) (3.20)
I Thus, based on the above consideration, we can write a general
expression for the amplification factor of a n-stage amplifier
and the voltage at its output with the strict alternate operation of
nonlinear stages:
g •'u :•--l 1)fig (%_M
- 5=2(3.21)
where (n - m) is the number of nonlinear stages operating in linear
modes;
(n - m + 1) is the number of the stage operating in logarithmic
mode;
(m -. 1) is the number of nonlinear stages operating in quasi-
linear mode.'
Then
UMKo!= KoUxx.(3.22)
Here, after conducting such an analysis, it is easy to express
the basic qualitative indices of a n-stage logarithmic amplifier
for the general case a X 1 in terms of the indices of the separate
stages.
The beginning of the logarithmic amplitude characteristic ofthe amplifier corresponds to the input voltage at which the last
nonlinear stage begins to operate in logarithmic mode,
"-- S-= " Us (3.23)
103

In this case, voltage at amplifier output will be
U+,,,•.U,,.+t•.- U',,,J•..(3.24)
The end of the logarithmic amplitude characteristic of theamplifier corresponds to the input voltage at which the first non-
linear stage begins to operate in quasilinear mode:
Uxx%=UU=U,,.* .- x(3.25)
Then output voltage is
Us u.x l = nUUa, In x. + ,U, = Uxx.2 (na In•x, " I)(3.26)
The dynamic range of the amplifier with respect to input and
output voltages, respectively, will be
,X- a- " (3.27)
D,,,- U;- -=aa,, D,, + I.(3.28)
Consequently, the compression factor of amplifiable voltage
can be written in the form
. D,,+ Daux ;D= 'naa In D.., + 1 (3.29)
In a multistage logarithmic amplifier on intermediate frequency
with shunting of anode loads of the stages by nonlinear elements,
we use most frequently amplifiers consisting of stages to whose
anode circuits are connected single or double-circuit filters. The
equivalent circuit of a nonlinear resonance stage is presented in
Fig. 3.4 [12]. The amplification factor of this stage is
(3.30)
104
II---

Ii
where S' is tube steepness,
RBUx is tube output resistance;
Ra is anode resistance;
R is equivalent circuit resistance;
ReX is input resistance of next tube.
Voltage at output of nonlinear stage is
- Ui.. • ,..+,, (3.31)
When a stage is operating in linear mode, the resistance of
the nonlinear element must be higher and must not shunt anode load,
i.e., R Hen 1 << R . In this case, k= S R .
Fig. 3.4. Equivalent circuit of a nonlinear resonance stage.
The law of variations for resistance of a nonlinear element
RHe• 2' as a function of the output voltage of the stage when the
stage is operating in logarithmic mode, we find after equating the
right sides of equations 3.11 and 3.31:
InUI2 I=SUI aRo~Rwx2 3,2(al U3 -R3 +R~a (3.32)
Introducing the designation
Pa==aIfl U3 25
105

and performing the transformation, we obtain
epx fps (3.33)1.
With similar reasoning and using equations (3.17)'and (3.31),
we find the relationship between RHen 3' and the output voltage of
the stage when it is operating in quasilinear mode: I
92(a-aIn ,c,--I+as) 1 3~l
When p >> ln k1 RHen 3 + l/Sn and, consequently, k3= SnHHen 3 • 1.
In practice, in the design of amplifiers, by the inpuit rcs,istanpe'of the nonlinear element R = R~en we m~an the ratio of the amplitude,
of applied voltage Urm to the current amplitude of the first harmonic;
"mlT
(3.35)
The amplitude of the first harmonic ofcurrent .•lolging through
the nonlinear element is determined based on the stati 'c volt-ampere
characteristic of the element (semicondcuctor or vacuum dq.je),.)which
can be given either graphically or analytically.
A
If the characteristic is given graphically, Iml can be deterninýQ
graphically by the method of five or twelve ordinates [25,] At high
amplitudes of voltages this method has an accuracy o'f 5-8%. With
low amplitudes the graphic method has considerable error; therefore,
it is advisable to determine current amplitude 1ml analytically.mT
These methuds have been described in greater detail in referenlce [12]
and we shall not exramine them further. ,
106
I 1 .
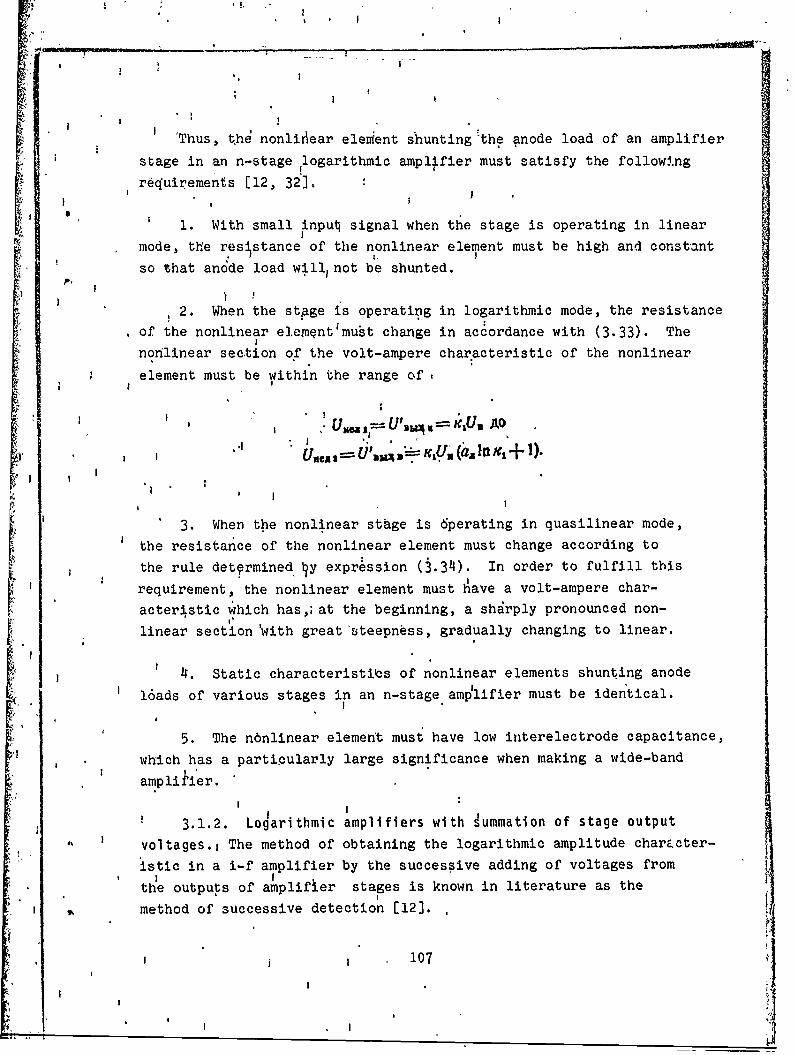
* I
!, £
'Thus, t4h nonliriear element shunting'the anode load of an amplifier
stage in an n-stage logarithmic amplifier must satisfy the followi.ng
requirements [12, 32],,
1. With small inpu4 signal when the stage is operating in linear
mode, the resistance of the nonlinear element must be high and constant' ~so that andde load willa not be shunted.
2. When the stage is operating in logarithmic mode, the resistance
of the nonlinear e.empnt'mubt change in accordance with (3.33). The
nonlinear section of the volt-ampere characteristic of the nonlinear
element must be within the range of
II 1 UM u 3 V ICU. AO. 2 U.,, l p1 Kq, (aa In 9 + 0.
if I I
3. When the nonlinear stage is 6perating in quasilinear mode,
the resistance of the nonlinear element must change according tothe rule determined ly expression (3.34). In order to fulfill this
requirement, the nonlinear element must have a volt-ampere char-
acteristic which has,;at the beginning, a sharply pronounced non-
linear section 'with great'E•teepness, gradually changing to linear.
S4'. Static characteristiles of nonlinear elements shunting anodel6ads of various stages in an n-stage amp'lifier must be identical.
5. The n6nlinear element must have low interelectrode capacitance,
which has a particularly large significance when making a wide-band
amplifier.
"3.1.2. Logarithmic amplifiers with gummation of stage outputvoltages.1 The method of obtaining the logarithmic amplitude char&cter-
istic in a i-f amplifier by the successive adding of voltages fromthe outputs of amplifier stages is known in literature as the
method of successive detection [12].
S107
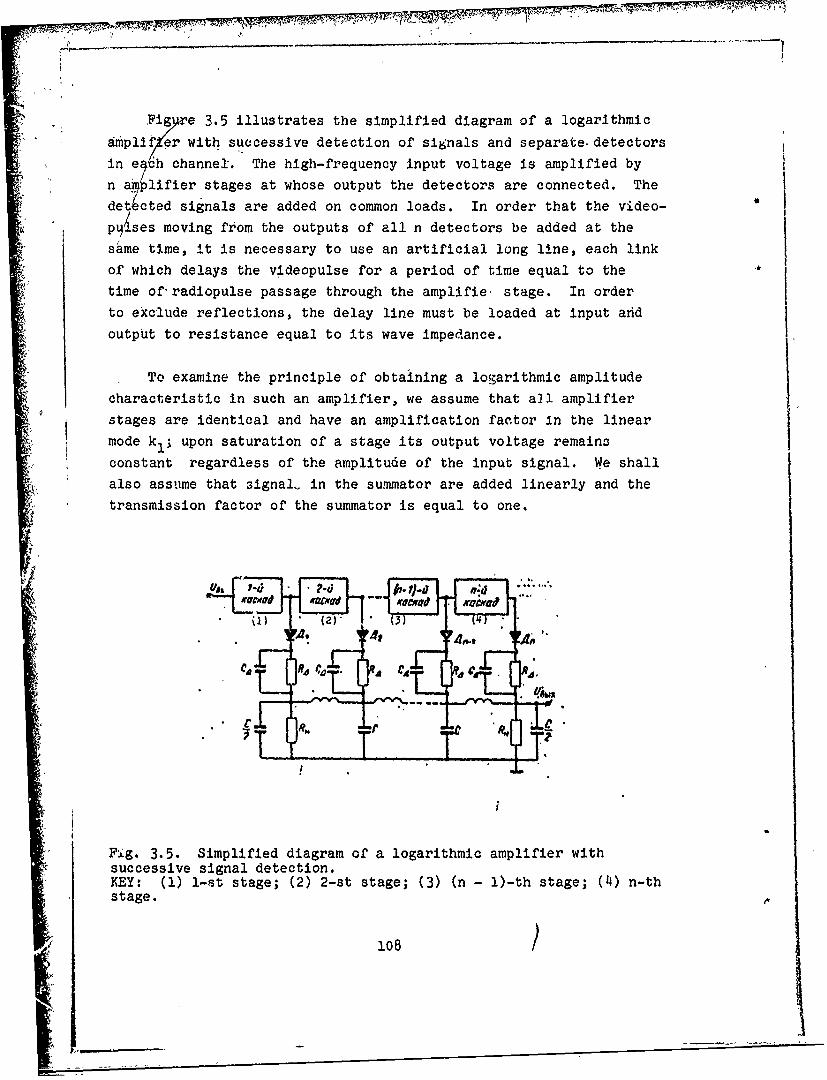
Figwe 3.5 illustrates the simplified diagram of a logarithmic
Afamplifter with successive detection of signals and separate- detectors
in e 4h channel." The high-frequency input voltage is amplified byn aýlpifier stages at whose output the detectors are connected. The
detected signals are added on common loads. In order that the video-
p4.ses moving from the outputs of all n detectors be added at the
same time, it is necessary to use an artificial long line, each link
of which delays the videopulse for a period of time equal to the
time of-radiopulse passage through the amplifie stage. In order
* to exclude reflections, the delay line must be loaded at input and
output to resistance equal to its wave impedance.
To examine the principle of obtaining a logarithmic amplitude
characteristic in such an amplifier, we assume that all. amplifierSstages are identical and have an amplification factor in the linear
mode kpl upon saturation of a stage its output voltage remains
constant regardless of the amplitude of the input signal. We shall
also assume that signal- in the summator are added linearly and the
transmission factor of the summator is equal to one.
0 ) (2)_ "00 -'
. uaba
.c.
Fag. 3.5. Simplified diagram of a logarithmic amplifier withsuccessive signal detection.KEY: (1) 1-st stage; (2) 2-st stage; (3) (n - l)-th stage; (4) n-thstage.
108
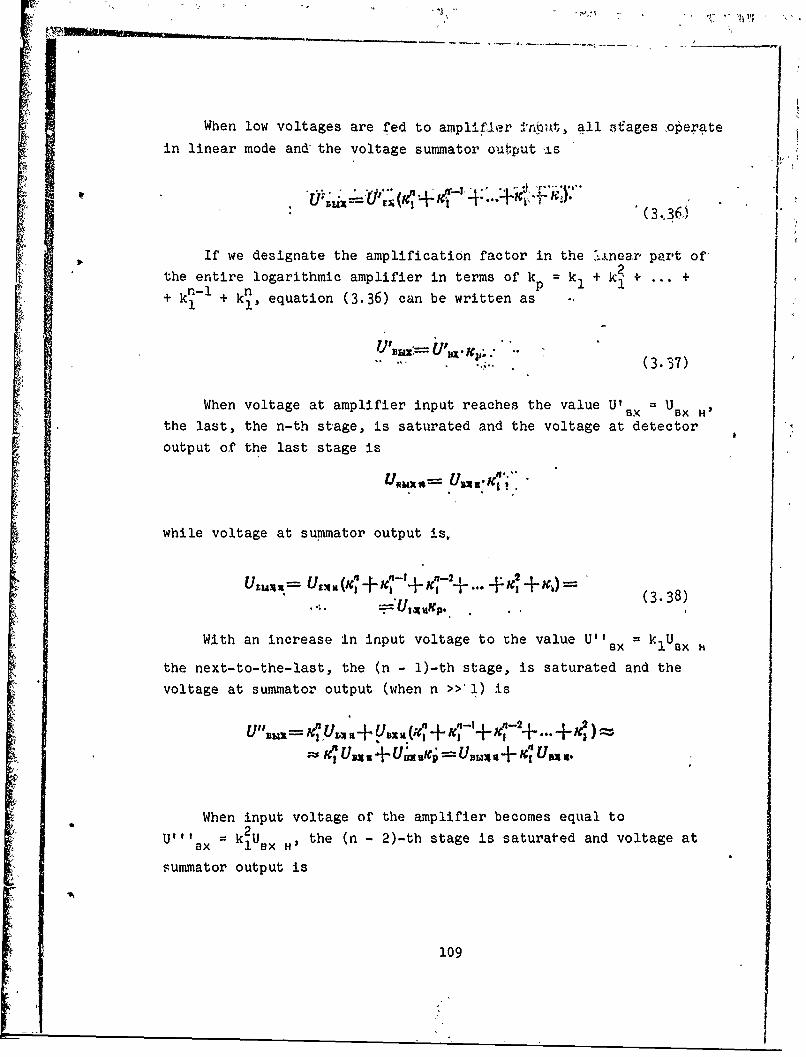
When low voltages are fed to amplifler n all stages ,operate
in linear mode and the voltage summator out;put •ts
If we designate the amplification factor in the ".inear, part of,
the entire logarithmic amplifier in terms of kp = k + 0 +n-l n be wrte+ k + k, equation (3.36) can be written as
(3.-37)
When voltage at amplifier input reaches the value Ut x U BX H'
the last, the n-th stage, is saturated and the voltage at detector
output of the last stage is
while voltage at summator output is,
*ZR UIX (,cn + 'c+ x7j2 + .. +K 21+I (3.-38)
With an increase in input voltage to the value U'" = U13x 1lUBxH
the next-to-the-last, the (n - l)-th stage, is saturated and the
voltage at summator output (when n >>' l) is
yb a .( I +V1 I ..-- x
UUxxUnxU==xBxx I 4'
When input voltage of the amplifier becomes equal toU11 = k 2 U.x H, the (n - 2)-th stage is saturated and voltage at
ex Isummator output is
109

3-
291 =x M C U,,,,, a+"1 Wl• i xU,,.
Similarly', when the first stage is saturated, we can write
"U(n)_r: n_1j-l' '-U"
and, accordingly, voltage at summator output is
B uZ a.. (t-i) ( 3.40). (3140)
From this analysis it is apparent that with the alternate
transition of amplifier stages into saturation mode, input voltage
of the amplifier changes exponentially and output voltages linearly.
'Consequently, between input and output voltages there is a logarithmic
relationship.
Let us write equality (3.39) in the form
I (n)= ( -4) I c + I xN
and we shall then find the value of n:
If we substitute the obtained value of n into expression (3.40)
we obtain
•+x IUm in,, I + l.UN4,=U B"/ In a - .X
( iun a-, (3.41)
110
After comparing expressions (3.2) "nd (3.411), we obtain
The dynamic range of an n-stage logarithmic amplifier withsummation of the output voltages of the stages will be equal,
respectively, for input and output voltages to
U51".-x-----x - . (3-112)
S- Sli, (3.43)n
When k >> 1 , while k k D n.
The compression factor for amplifier voltage is
.D- - (3 .44 )
With the assumption made that the stages have linear characteris-tics up to saturation, the logarithmic amplitude characteristic ofthe amplifier will deviate from a precisely logarithmic characteristic.A precise LAC of an n-stage amplifier with successive signaldetection can be obtained only with fully defined amplitude character-
istics for the stages.-
It is very difficult to find, analytically, the necessary formof the amplitude characteristic of a stage based on the givenlogarithmic amplitude characteristic of an amplifier. However, thiscan easily be done by the graphic-analytical method if the LAOof the amplifier is given U Bx = f(UCX) and the number of stages nis known, as well as the amplification factor of each stage ki[32].The values for voltages at amplifier output, at which all stagesexcept the last operate in linear mode, are given.
111

The selected number of amplifier input voltage values will
determine the number of points on the nonlinear section of the stage's
amplitude characteristic.
0,0 0- 05 -e -1 S
oSX "age
Fig. 3.6. Theoretical amplitude characteristics of a stage.-k- 10, n = 5; -- k 5, n = 5; k 5, n = 4.
Then for each voltage value at amplifier Input the output
voltage for the last n-th stage is
0 = I (U- - - t
•-•s (3.45)
where U Bux i is the output voltage of the i-th stage which is equal
0/02O3"015,S'7""
to UB O"*ji"1
Since a~l stages are identical, the nonlinear section calculated
for the last stage is joined to the linear section of the amplitude
characteristic of the next-to-last stage, at the moment it changes
into nonl1near mode. With an increase in the values of voltage at
amplifier input, the section thus constructed of the characteristic
of the next-to-last stage is used for further calculation of theamplitude characteristic of the last stage. We should note that the
nonlinear section of the amplitude characteristic oo the stage plays
4an important role in forming the amplifier's LAt.
ctntt112
inonniermd. Wiha nraei hevle fvlaea
Figure 3.6 shows the stage characteristics calculated by this
method for a logarithmic amplifier with successive signal detection
at various values for n and k 1 . From this figure it is apparent
that the form of the amplitude characteristic for this stage depends
both on the number of stages in the amplifier and the amplification
factor of the stage.
§ 3.2.7 PHASE DETECTOR
An important element in monopulse systems with phase and sum-
difference angular detectors is the phase detector with wh,;se aid
the direction of target deviation from equisignal direction is
determined.
Figure 3.7 presents the diagram of a vector-measuring phase
detector which has R= R and C= C2
The amplitude detector A1 is fed the sum of voltages ul(t) and
u2(t), and to detector A2 is fed the difference of the voltages.
In the case of suw-difference monopulse systems, ul(t) and u2 (t)
are, respectively, the standardized difference and sum voltages,
while in the case of a phase system they are voltages from the linear
i-f amplifier output. Voltages obtained as a result of detection are
calculated by a special connection of the loads of the amplitudedetectors A1 and A2 .
Considering amplitude detectors as devices which distinguish theenvelope or the square of the envelope of the random input process,
we can obtain the mathematical operations which are accomplishedby a phase detector.
Voltages acting at phase detector inputs are written in theform
U,,= U, sin (w +(3.6)
113
i ... ,: - • L I±_-!l

Figure 3.8 is the vector diagram of voltages which makes it
Spossibleto determine voltages which are detected by amplitude
detectors A, and A These voltages, respectively, are equal to
the vector sums
U_=-U,+Ua.(3.47)
A,
•Tot+tJ.T, +
/1 5 . /Fig. 3.7. Diagram of a vector measuring balance phase detector.
Fig. 3.8. Vector diagram of voltages f'or phase detector.
With linear characteristics of detectors, the output voltage
of the phase detector will be
114
SI 1 1 1
(3.48)
where k¢ A is the detection factor.
From the vector diagram (Fig. 3.8), it follows that
i+ =.VU2+U2+2U,u,2cos (?,%-,?). (3.49)
i- I=V 4+V2+2u1 USCosito80-( ',,
I/u• +u - 2UUC ,os (3-50)
Consequently,
u,.A= ~ [I/uI +u2 + 2UU1. cos (T,.
(3.51)
If U1 << U2 , which is valid for monopulse systems with a sum-
difference angular discriminator, then, expanding each term of the
expression (3.51) in a power series and limiting ourselves to two
terms of the expansion, we obtain [26]
" A= 2 Kc u -u cos 1 - = 2,c4 .7U1 cos (O --
(3.52)
With equality of signal amplitudes U1 = U2 = U (in the case of systems
with a phase angular discriminator), voltage and phase detector
output will have the form
115

jf2[lcos()1)2~~ + (I±Cos(,-,2 (3-53)
I Cos (p
Figure 3.9 presents ,the dependence of output voltage on phaseshift for the two examined cases. When UI << U2 (or when U2 << U1 ),a cosinusoidal dependence of outpuu voltage on phase difference isobtained and when U1 = U2 and variation in (01 - 02) is within 0 tofT, this dependence is rectilinear.
With quadratic amplitude detectors A, and A2, the output voltageof the phase detector is proportional to the average value of thedifference of currents passing through the diodes:
A =f .{[U1 (t) +., (t)' - U, () -. , (t)|'JU••, as u(O (3.54)
Substituting in (3.54) the values of ul(t) and u2 (t) from(3.46), we obtain
S= A U U , Sin ( os + (- sin ((Dt + ?,J
(3-55)
From expression (3.54) it is apparent that a phase detectorwith quadratic characteristics for diodes Parid A2 is equivalentto a simple multiplier (when the highest harmonics wnp are discarded)and the dependence of output voltage on phase shift has the formof' a cosinusoid.
116

UIPA
4e4
S2xe~L 2
2/
Fig. 3.9. Characteristics of a phase detector: 1 - when U1 << U2 ;2 - when U1 = U2 .
The disadvantage of this phase detector lies in the fact that
it limits the range of approach angles to a quantity corresponding
to a phase interval of 1800, whereas the maximum interval in single-
value direction finding, determined by the angle-data transmitter,
can frequently be greater than this value.
Another type of phase detector which makes it possible to broaden
the range of approach angles is Lhe Kirkpatrick phase detector [27, 41].
In this detector the angular range is broadened by decreasing sensitiv-
ity in the equisignal direction, which, however, slightly reduce:
wneasurement accuracy for angular coordinates since this, sensitivity
decrease is carried out at that point in the system where the signal
level iz greatest.
U10') Ra C,) .03
a) (.a) (b) ) .
Fig. 3.10. The Kirkpatrick phase detector: a - simplified detectorcircuit; b - part of circuit illustrating the formation of voltagesacting on diodes.
117
A diagram of the Kirkpatrick phase detector is presented in
Fig. 3.10. From a comparison of diagrams presented in Figs. 3.7 and
3.10 it is apparent that the detecting part of the Kirkpatrick phase
detector is precisely the same as in the usual phase detector and
consists of two diodes and differentially connected loads. Both
detectors have an output voltage which is formed by subtracting thevoltages acting on the diode of the phase detector. However, although
in the usual phase detector the sum and difference of input voltages
act on the diodes, in the Kirkpatrick phase detector voltages which are
a superposition of the components formed by each of the input voltages
act on the diode.
Let us designate the voltages acting on diode inputs as V1 and
V2 . Then voltage u,(t) forms the components V'1 and V' 2 which act
only at the points of the circuit indicated in Fig. 3.10b. Actually,
current ik' induced by the voltage u,(t), is fed to two parallel
resistors, one of which is R0 while the second is formed by the delay
line loaded to wave impedance R0. Therefore, current ik is divided
evenly between these two resistors. As a result, the two components
formed by voltage u (t) will be
V's=u1 () -,"'Em = and]
Similarly, but in reverse order, the corresponding components
of input voltage u2 (t) are formed. Consequently, the output voltageof a Kirkpatrick phase detector in the case of linear diodes, which
is a superposition of these components, will be
"a*- A I U, W -+us(e'I --e10 ()e.1+0 ,( + I.t
•4$ 2 + IU OS(I/27"0
I = .[Vu.+; 14+ U 1U, s(q-..-jfu~+(4 + u , cos (4 os - ,-:+ ,-.)]-
+u;I ++ U2.u2 + u22os,•
(3.56)
118

For a system with a sum-difference angular discriminator
(U1 << U2 ), expanding each term of expression (3.56) in a power
series and using the first two terms, we obtain
YU2
-U 1 +u+
Fk21.o AU, sin.'(p _ <)sin (3-57)-
For a monopulse system with a phase angular discrArlinator
(U1 U2 = U) the output voltage of a Kirkpatrick detector will be
2
I ? +c y- + IxxXSi" " -" sinA(3.58)
Figure 3.11 presents the characteristics of the output voltage
of a Kirkpatrick detector. From a comparison of expressions (3.51)
and (3.57), as well as (3.52) and (3.58) and of the presented
characteristics, it is apparent that the output voltages of an
ordinary phase detector and a Kirkpatrick detector, when 00 = •/2)
differ only by the n/2 shift, and the angular range of single-value
direction finding is limited by the phase interval - v/2 " « 1 - *2 >
> v/2. However, when 0 < n/2, the angular range of the Kirkpatrick
phase detector is broadened to 3600 as 00 approaches zero. As an
example of broadening the angular range, Fig. 3.11 introduces the
characteristic of output voltage for 0 = 0.1; along with the
substantial broadening of the angular range, steepness is severely
reduced.
119
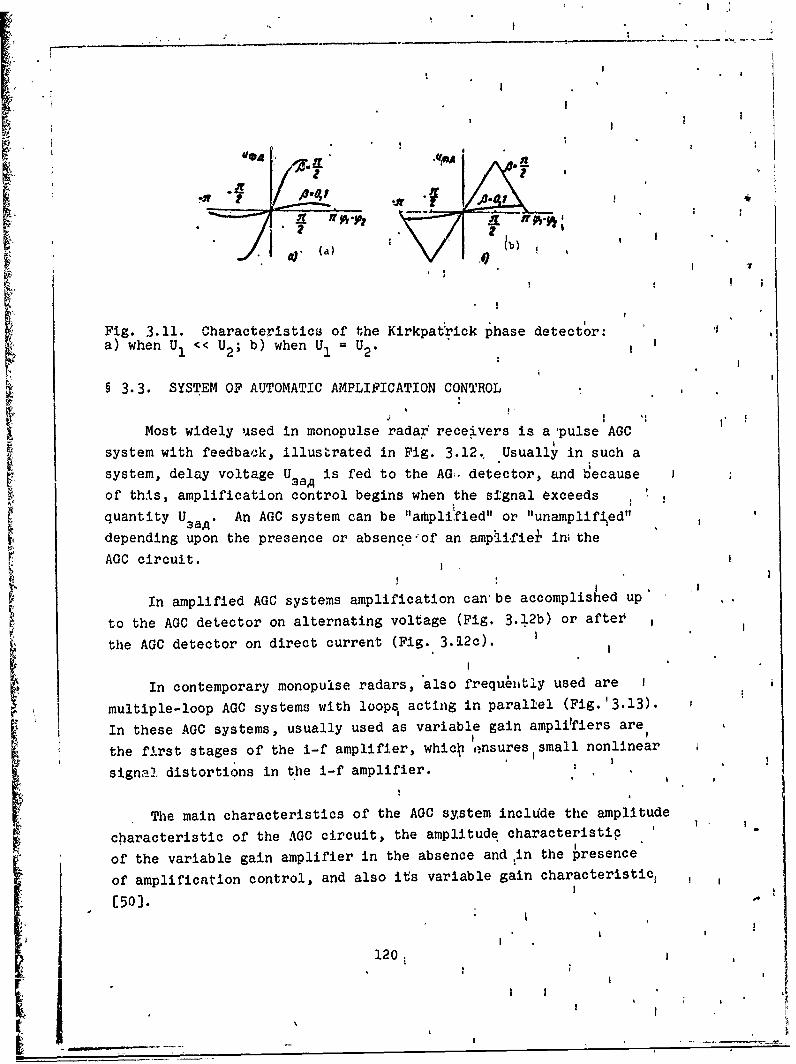
CJ
I *
S I I
(a)
Fig. 3.11. Characteristics of the Kirkpatrick phase detector:a) when U1 << U2 ; b) when U1 = U2 .
§ 3.3. SYSTEM OF AUTOMATIC AMPLIFICATION CONTROL ,
Most widely used in monopulse radar receivers is a 'pulse AGC
system with feedback, illustrated in Fig. 3.12., Usually in such a
system, delay voltage UsaA is fed to the AGt. detector, and because
of this, amplification control begins when the signal exceeds
quantity U . An AGC system can be "arhplified" or "unamplified"
depending upon the presence or absence-of an amphi~fieZ i•i the
AGC circuit.
In amplified AGC systems amplification can' be accomplished up
to the AGC detector on alternating voltage (Fig. 3.12b) or after
the AGC detector on direct current (Fig. 3.12c).
In contemporary monopulse radars, also frequ'tly used are I
multiple-loop AGC systems with loops acting in parallel (Fig.'3.13).
In these AGC systems, usually used as variable gain amplilfiers are
the first stages of the i-f amplifier, whicO -nsures small nonlinear
signal distortions in the i-f amplifier. ,
The main characteristics of the AGC system include the amplitude
characteristic of the AGC circuit, the amplitude characteristic
of the variable gain amplifier in the absence and :in the presence
of amplification control, and also its variable gain characteristic,S~[50] .
120.
-•120I
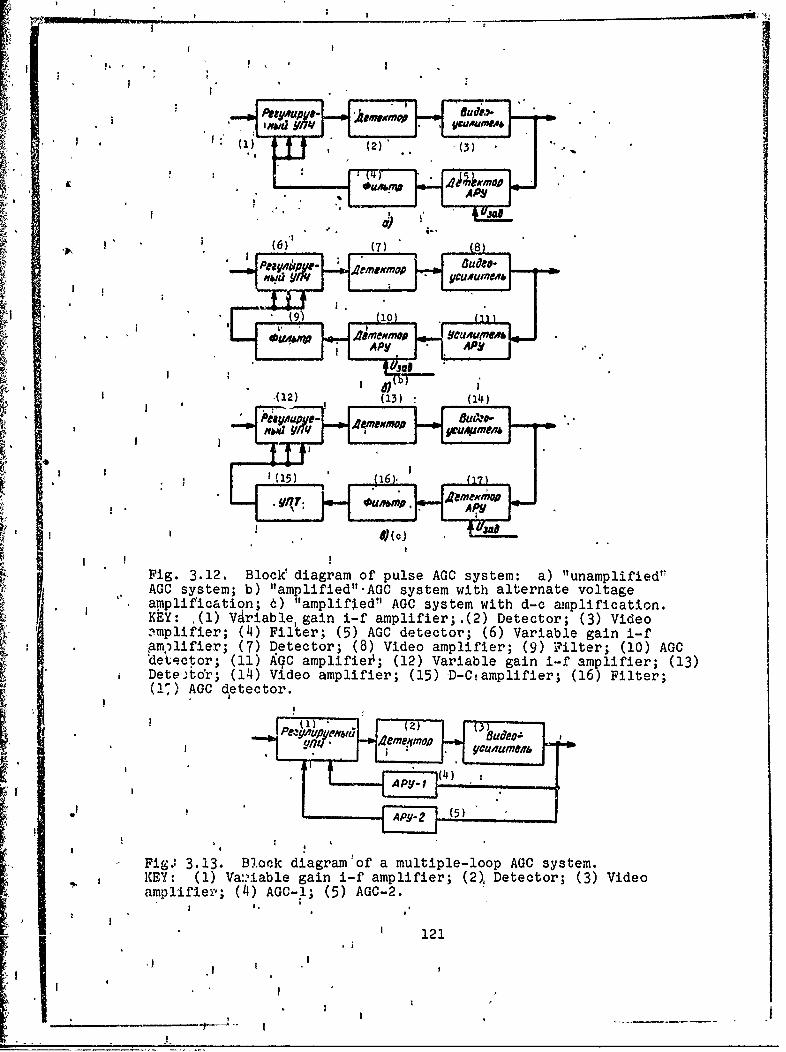
:&,6
(2 (3
* I M
4 110
Au~PY APYjgo
Fig. 3.12. Block' diagram of pulse AGOC system: a) "unamplified"aGpiCication; b) "amplifted"-AGO system with d-crat avplfiatienaGOlisystemn; b) 'amplified" AGO system with alteratepvlfctage .KEY: (l) Vdriable1 gain i-f amplifier;.(2) Detector; (3) Videoz'Implifier; (4) Filter; (5) AGO detector; (6) Variable gain i-fAR.)lifier; (7) Detector; (8) Video amplifier; (9) Tilter; (10) AGOC'detector; (11) Aqc amplifiez'; (12) Variable gain i-f amplifier; (13)Dete~tor; (1~4) Video amplifier; (15) D-C-amplifier; (16) Filter;
F (11) AGO detector.
AVy I
4eme-rm (5)
- Fig.' 3.13. Block diagram'of a multiple-loop AGO system.KEY: (1) Va:Aiable gain i-f amplifier; (2)1 Detector; (3) Videoamplifiev.; (4I) AGO-i; (5) AGC-2.
121

Fig. 3.14. Ampiitude characteristicof- an AGC circuit.
I!
-lob
S....... et" j a .. . . . "
The amplitude characteristic of an AGC circuit represents the
dependence of the control voltage being fed to the variable gain
amplifier on the amplitude of the signal at output of the variable
gain amplifier Uper = f(U BU). The form of this dependence in the
presence of delay voltage in the AGC system is presented in Fig. 3.14.
Control voltage differs from zero when signal amplitude at amplifier
output exceeds delay voltage. With a subsequent increase in U
the working segment of the amplitude characteristic, with the proper
choice of AGC circuit parameters, must be linear. The angle o"
slope to the axis of abscissas determines the amplification factor
of the feedback circuittga • =XGp*"
tg ..Ko=
Fig. 3.15. Amplitude character- Fig. 3.16. Control characteristicistics of amplifier: 1 - without of amplifier.AGO; 2 -with AGO.
Ave.
Fig I5 Amliud charcte- Fi.31.Coto hratrsi
'The• amplitude characteristic of the variable gain i-*famplifier
which determines the dependence of signal amplitude at amplifier
output (UBb×) on signal amplitude at input (Ux×) with and without
an AGC, is presented in Fig. 3.15.
The control characteristic of the amplifier determines the
A dependence of the amplification factor of the variable gain amplifier
on control voltage:
Kper=ft~yer)
The form of this dependence is brought about by the anode-grid
characteristics of the controlled tubes and the number of controlled
stages.- In view of the fact that usually there is a nonlinear
dependence of tube steepness on bias, the control charactdristic also
has a nonlinear character, which appears, to a greater extent, when
the number of controlled stages increases. However, in analyzing
dynamic modes various approximations of the control characteristic
are used: linear, exponential, polynomial, hyperbolic function, etc.
The question of a rational approximation of the control characteristic
must be solved individually in each case depending upon the study
methods used.
In analytical calculations, it is usually considered linear
since such an approach considerably simplifies analysis without
leading to significant errors [26]. A typical form of control
characteristic and its linear approximation are shown in Fig. 3.16.
Many works have been devoted to an analysis of AGC systems;they are examined thoroughly in reference [50]. However, we shall
consider only the main dynamic properties of an AGC system with the
introduction of a number of simplifying assumptions which, ý,ithout
distorting the essence of the phenomena, enable us to obtain ni re
simply the necessary relationships.
We shall assume that there are no nonlinear distortions in tie
receiving device, and ýhe bandwidth of the receiver is somewhat
123
wider than. that oPf the AGC. We shalY'also assume that in the AGC,
circuit a single-section RC filter an( an inertialess detector ",
used.
,The bebav~i6r-of ah AGC system with a single-sectiopIiflter :cane,be described by the following system of equations .[26]:'1%,
when
.U,=• H [ ' U,,, < U8,,,
U-4r =XKoPFA (P) (U- - u.,) npH U 4 > U8 , (U3.5 9 )
where km ip the maximum amplification factor of the amplifier when
U =0;perko~p = kA k is the amplification factor of the feedback circuit,
equal to 'the product of the transmission factors of the AGC amplifierand detector; F (p) " 1 Iis the operator. of the single-
PA +1section AGC filter;
TA is the time constant of the AGC circuit.
With a linear approximation of the control characteristic
4t Kiper = -~ A~r (3.60)
where bA tg 0 A Ukm is the angular ,coefficient of the
Ubm
control characteristic;km
Ubm = b is voltage at which the receiver amplification factorA
reverts to zero.
With the introduction of approximation (3.60), system of equation
(3.59) assumes the form
124~
. • () -•-bA.!) Uiv npa. U9'*> USA,* (P7',i, +1) Uper .• op (Umi UUSI)-U npx Ui,, > UVU:
(3.61)(npm when)
We shall find the reaction of this system to a jump whbse
amplitude exceeds UBx MHH" When U ×= UA = const, system of equation
(3.61) changes into a nonuniform linear differential equation of thefirst order With constani coefficients:
TA dU.. L+ UaU (I + bAKOOpUA) .bAAKo9pUISUIa+K mUA*TAdt
(3.62)
The solution to this equation has the formt
=BA + CAe 'A (3.63)
where BA is the particular solution of the nonuniform equation,,equal to
B K- IUA + bA 4GPU--X
-. (3.64)
TA is the length of the duration process, equal to
TA•A"-• -•, '(3.65)
k3 is the equivalent amplification factor of the AGC system,
equal to
1. (3.66)
125
t%
'After prescribing the initial conditions, we shall find the
integration constant CA* Let us assume that at the initial momen"
When t = 0 voltage on the capacitor of the filter is zero. In this
case, U = 0 and Us× = kmUA. Then the solution to equation (3.63)
'is written in the form
b +bA r eU.~K
(3.67)
If we assume U3 a = 0, from equations (3.67.) and (3.61) we find
'A
UL mW KIPA 1 +~: .
1+,•, "(3.68)
EX
I+.oc (3.70)
Calculated according to equations (3.68) and (3.69), the curvesof input voltage and control voltage versus time are presented in
Fig. 3.17.
Output voltage when t = 0 grows abruptly to the quantity kmUA,and then drops exponentially to a stable value kmUA Control
1i+ ka"voltage, on the other hand, grows exponentially to a stable value
kmkospUA . The time of the transition process, in both cases, is
1 + ka
identical and depends not only on the time constant of the AGC circuit
126

and the parameters of the AGC system (bA and k 0 6 p), but also on the
"amplitude of the Jump UA. As follows from equalities (3.65) and (3.66))
with an increase in UA the time of the transition process decreases
and the fixing process proceeds more rapidly.
In conclusion, we shall study the works of an AGC system for an
amplitude sum-difference monopulse radar, which makes it possible to
ensure the independence of the error signal from the amplitudes of
received signals, owing to the standardization of sum and difference-
signal amplitudes relative to the amplitude of the sum signal. A
block diagram of one of the possible AGC circuits is presented in
Fig. 3.18 [129].
The difference and sum signals are fed to the i-f amplifier
from the converter. 'Each channel has its own AGC circuit. Automatic
amplification control in each i-f amplifier is accomplished by
feeding to its output short reference pulses of intermediate frequency,produced by a pulse oscillator whose amplitude varies in proportion
to the necessary amplification. These pulses are fed with a time
lead relative to the main- pulse of the radar transmitter.
Fig. 3.17. Transition character- In 11Aistics of an AGC system when theinput signal acts intermittently. [--- -
S(a)
-119. .. ."_m
2(b)
127

The blocking oscillator generates signals which trigger the pulse
oscillator. At the same timd these signals are fed through the delay
line to the modulator of the transmitter, which ensures the delay
of the main pulse with respect to the reference pulses. Pulses from
pulse oscillator output are fed to the two-stage i-f amplifier with
variable ,amplification and then through the attenuator to the i-f
amplifier of the sum and difference channels.
" (1) fteJoIEI .fm4D
.(19 Pajnocornw CuI4, e Na 0a-'T-- f'-mO "
4-(9
,40 /M,',A,,,e,, .S:t:ayid . • WW,4M'OV"A
Fig. 3.18. Block diagram of an AGC system and an amplitude sum-difference monopulse radar.KEY: (1) Phase detector; (2) To amplitude detector; (3) Sum signal;.(f) Reference pulses; (5) l-f amplifier; (6) Detector; (7) Video "amplifier; (8) Two-stage i-f amplifier; (9) Voltage proportional tosunm signal; (10) Detector of AGO system; (11) Pulse oscillator; (12)Trigger pulse; (13) Detector of AGO system; (111) Blosking oscillator;(15) To modulator transmitter; (16) I-f amplifier; (17) Detector;(18) Video amplifier; (19) Difference signal; (20) To phase detector,
Then the reference signals are detected b:• the detector and in the
form of negative d-c voltage are removed from the filter to the
grids of the tubes by the video amplifier. From video amplifieroutput voltage of negative polarity is fed to the grids of the tubes
of the AGO system detectors. To these detectors, triggering pulses
128
(1

from the blocking oscillator are also fed. To the cathodes of the
tubes of the detectors, positive bias is fed and, therefore, only
signals exceeding bias voltage are detected. The value of bias
voltage (delay voltage) is ,controlled by cathode followers connectedwith detector tubes so that in the absence of echo signals the
detectors maintain a constant no±se level at the output of the i-f
amplifier of the channels, i.e., act as noise limiters. When the
automatic range tracking system picks up a target, to the two-stage
i-f amplifier is fed positive voltage proportional to the sum signal,
which causes amplification of the reference pulses. As a result)
the AGC circuit accomplishes standardization of the sum and difference
signals with respect to the amplitude of the sum signal and ensures
an equality of the amplitudes of the referenced pulses fed to the
i-f amplifier of the sum and difference channels, and, therefore,
the amplification of the echos in these channels will be the same
both when noise and echo are equal and when echo exceeds noise.
129

-i
1
CHAPTER 4
RESOLUTIOi AiRD DIRECT-I0i FINDING SENSITIVITY OFMONOPULSE RADARS WITH RESPECT TO ARiGULARCOORDIRIATES
§ 4.1. THE CONCEPT OF ANGULAR COORDINATE RESOLUTION
By resolving power we mean the ability of a radar to distinguish
separate targets in a group of targets with sufficient reliability.
Quantitatively, angular coordinate resolution is evaluated by the
minimum angle between directions to target at which it is still possible
to measure separately the angular coordinates of targets which can
not be resolved with respect to range and speed with the necessary
accuracy.
It can be necessary to resolve many targets; however, we shall
examine the resolution of only two targets as the simplest and mnost
frequently encountered case.
As is apparent from the definition of resolution, the resolution
process is indivisible from the detection process; therefore, in the
simplest case, resolution is the detection of two signals corresponding
to two targets. Hence, in the process of direction finding with a
target pair, at receiver output there will be at least two signals,
their resolution will depend upon the relative energy of the signals
and the degree of their overlap with respect to the parameter being
resolved, in this case, the angle. Obviously, the less overlap the
greater the likelihood of tracking each target separately and the
better the resolution of the radar.
130
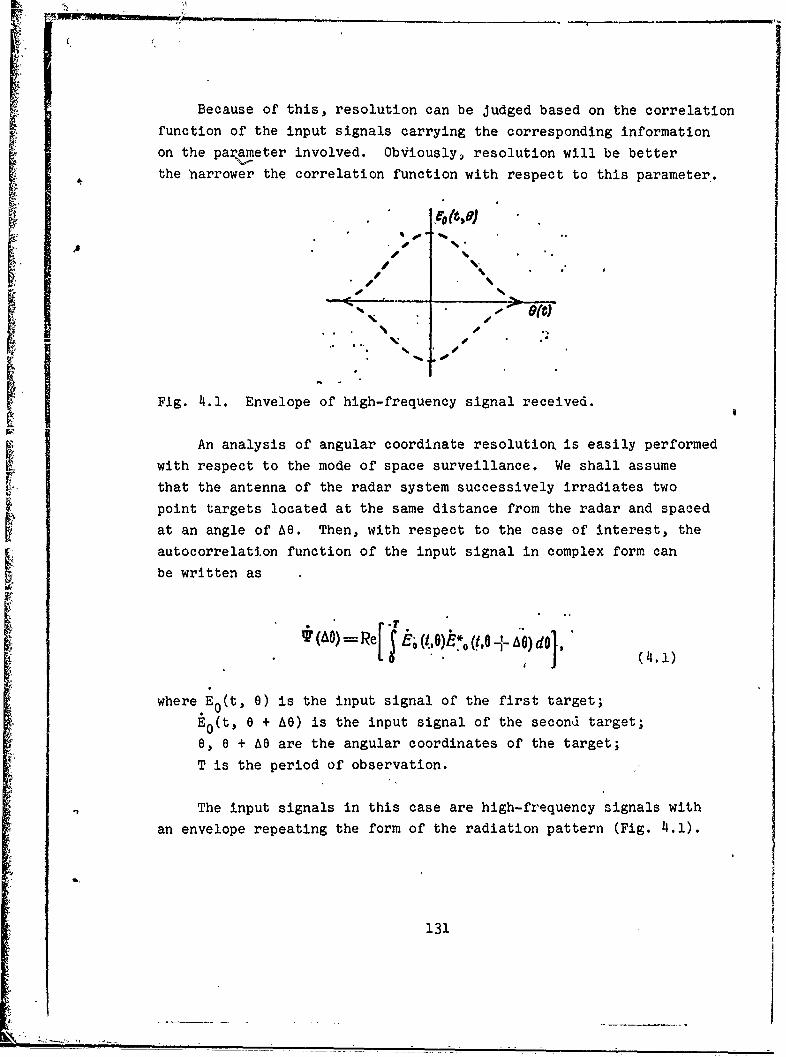
Because of this, resolution can be judged based on the correlation
function of the input signals carrying the corresponding information
on the parameter involved. Obviously, resolution will be better
the narrower the correlation function with respect to this parameter.
'- % ".
- 4%
4% %
•~ --
Fig. 4 .1. Envelope of high-frequency signal received.
An analysis of angular coordinate resolution, is easily performed
with respect to the mode of space surveillance. We shall assume
that the antenna of the radar system successively irradiates two
point targets located at the same distance from the radar and spaced
at an angle of AO. Then, with respect to the case of interest, the
autocorrelation function of the input signal in complex form can
be written as
= Re . )dO,- . " '(4.1)
where E0 (t, 0) is the input signal of the first target;
E0(t, 6 + AO) is the input signal of the second target;
0, 6 + A6 are the angular coordinates of the target;
T is the period of observation.
The input signals in this case are high-frequency signals with
an envelope repeating the form of the radiation pattern (Fig. 4.1).
131

S obviously, with a single amplitude for signal sources
".(t, Oj=Y l (0)exp (iot),.. - ,(4•.2)%N
where F(e), F(O + AO) are the amplitude radiation patterns spaced
at angle AO.
/*1'D
(a) o e
": " ~8)(b"
4 0*1o7R
Fig. 4.2. Form of functions approximating radiation pattern.a) radiation pattern without angular displacements; b) radiationpattern with angular displacement by AO; c) autocorrelation functionof signal envelope.
An exponential factor characterizes the high-frequency signal
filling. Substituting these values in (4.1) we obtain
S(AG) - Re [JF (0) exp (imt),F (0•+AG0) exp (i jet) dO]r°
(0)F(0 + AO) dA. (14 -.4)
132
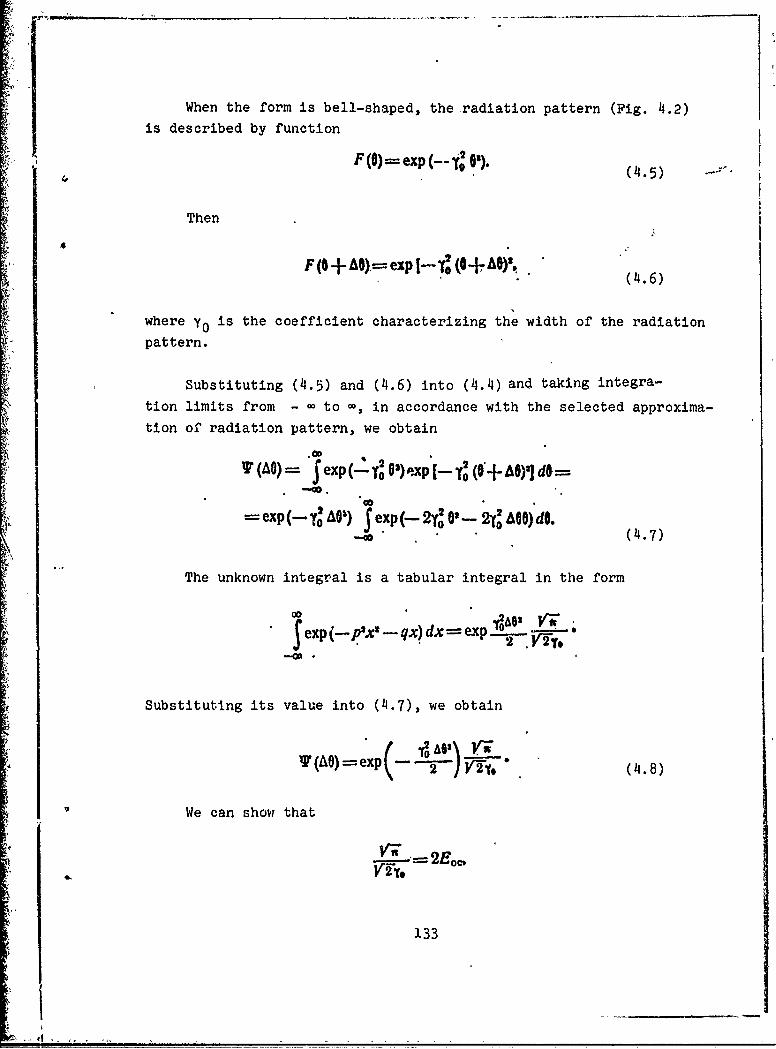
When the form is bell-shaped, the radiation pattern (Fig. 4.2)
is described by function
F ()=exp (-y )(4-5)
Then
F(O+AO),==expH--T (O+AO'.(4.6)
where yo is the coefficient characterizing the width of the radiation
pattern.
Substituting (4.5) and (4.6) into (4.4) and taking integra-
tion limits from - • to -, in accordance with the selected approxima-tion of radiation pattern, we obtain
'I (Ao) =jexp(-" y o,)•xp [- y (0+ AO),J do=.00
(0~ +ex-jexp exp( 2 0'- 2y• AO) dO.
-(4.7)
The unknown integr.al is a tabular integral in the form
Sexp&Px p2e q)d x-0.
Substituting its value into (4.7), we obtain
T(AO)=exp--T) p' 6 2 (4.8)
We can show that
133
I+

. I I
where E is the energy of the high-frequency signal of the given form0c
(Fig. 4.1)1.,
Actually, if we take the time function E0 (t) with a !singie
amplitude and ae'lbeil-shaped envelopey then
0 ____
exp(-2 !y'p) -dt
-. I
( -"2 2 lf-i, ( 4.0
A I.
-Hence it follows that! a
2Eoc ( 2. (402l
The form of T(AO) is shown in Fig. 4.2c.
Let us determine the width of the autocorrelatibn functign,conditionally, at level 0.5 relati.ve to maximum value. Substituting,
for this purpose, the value of T(AO) =W E ntd equation A6 and solving
it with respect to AO, we obtain
a 1~,17 -
(4.11) a
Hence the width of the autocorrelation f£inction.at level 0.5
is a
aoI2Ae., I =..~3 .* r. (14,12)
Let us express coefficient yo through the width of the radiation
pattern with respect to level 0.5 in accordance with the approxima-tion made (4.5). a ,
Obviously, when JF(O)I 0.5 6 G0./2. Taking this intoaccount and solving equation (4.5) with respect to yo, we ,find
134a *
>1 a a
yo .,6 o,.s. (
Hence !
* .~o=2,34,1,66 (4.14)
,A direct relationship has been obtained between the width of
the autocorrelation function of signals received and the width of
the radiation pattern. Since the width of the radiation pattern
determines angular resolution, the width of the autocorrelation
fnctio alo charact~rizes angular resolution and can be used iii the
approximate evaluation of a radar's -resolution.
Expression ( 4 %14 Y confirms the obvious conclusion that in order
ito improve angular resolut- on we must attempt to narrow the radiation
* pattern. Hence the dppendence of signal strength on approach angle
is the same during the operation of a radar on both scanning and
tracking modps, Ghe conclutions obtained are valid also for an
automatic tracking radar.
We, should note that resolution is characterized by the definedvalue only when signal energy substantially exceeds receiver noise
energy. When this condition is not'fulfilled, the value of the
angle of resolution depends upon the signal/noise ratio and is
characterited by the probability of both correct detection and false
alarms.
Hbwever', in praciice, for the value of potential resolution
we use the width of the autocorrelation function of the signals
of the target being resolved, read at a level of 0.5 from maximum.
Thd probability approach to evaluating resolution is lost; however,
this method is convenient because it is simple and easy to visualize.'!.
The actual iesolution of the padar can be considerably worse
than its potential value because of energy loss and signal shape
distortjon 'in various units of the station. Therefore, the actual
135,
* i

value of angular resolution can be represented in the form
* S0~0 +~0~y,8~O,(14-25)
where 6SnoT is the value of potential angular resolution;
6oi is the additional impairment of angular resolution in the
i-th element of the station; _ 8S
Sis the resolution impairment factor, equal to
I Let us evaluate the resolution of monopulse radars and compare
it to the resolution of single-channel radars with conical beam
scanning.
§ 4.2. ANGULAR RESOLUTION OF MONOPULSE RADARS
4.2.1. An amplitude sum-difference monopulse system of direction
finding in one plane. In this case, signals reflected from two point•
targets (Fig. 4.3) for the first and second receiving channels can
be represented in complex form as
Es (460) EZ (0. - Q) exp io + 4,F (*--- )expi (at+ a). (4.16)
Es(t, ). (E (0 ) + 0,) C t+ Er.SF (O.++ Qj exp i(at + 4), (4.17)
where F(0 0 - 0) and F(6 0 + e) are the characteristics of antenna
directivity for the corresponding receiving channels;
80 is the value of the maximum deviation angle of the radiation
pattern from equisignal direction;
81.2 are the angular positions of the first and second signal
source relative to equisignal direction (Fig. 4.3);Eml. 2 is the amplitude of the reflected signals from the first
and second targets;
a is the phase shift caused by the difference in distances to
targets.
136

M PC/ (2)
4. ,
I E
T Oj+F( .+ ,]ix 0
I.I
Fig. 14.3. Angles during direction finding of two point targets.
KEY: (1) Target; (2) ESD.With sum-difference signal processing, at the input of the sum1
and diftference channel we obtain
kE (4,O)== -• [F (00 - O,) .4- F (00 +{ 0,)] exp :!,f•
+ -- fF(0 0- 03)+ +FOG + 62)] exp i (O, + ,),
(4.18)
[ -)F (+ 0 ,)1 exp i a)t.+ .IF (0- (4.19)
At the output of receiving channels with identical characteristics,
we get the following with accuracy up to the constant coefficient;
"+" F(o- O)----F(o+ ) +expi(co,,+0 ) 4o
(14.20)
.. (t_0) - ~F (00_ -0,) -F (0o 4 0+)] exp i .+
137
_ _. . . . .. . . . ... . .._o
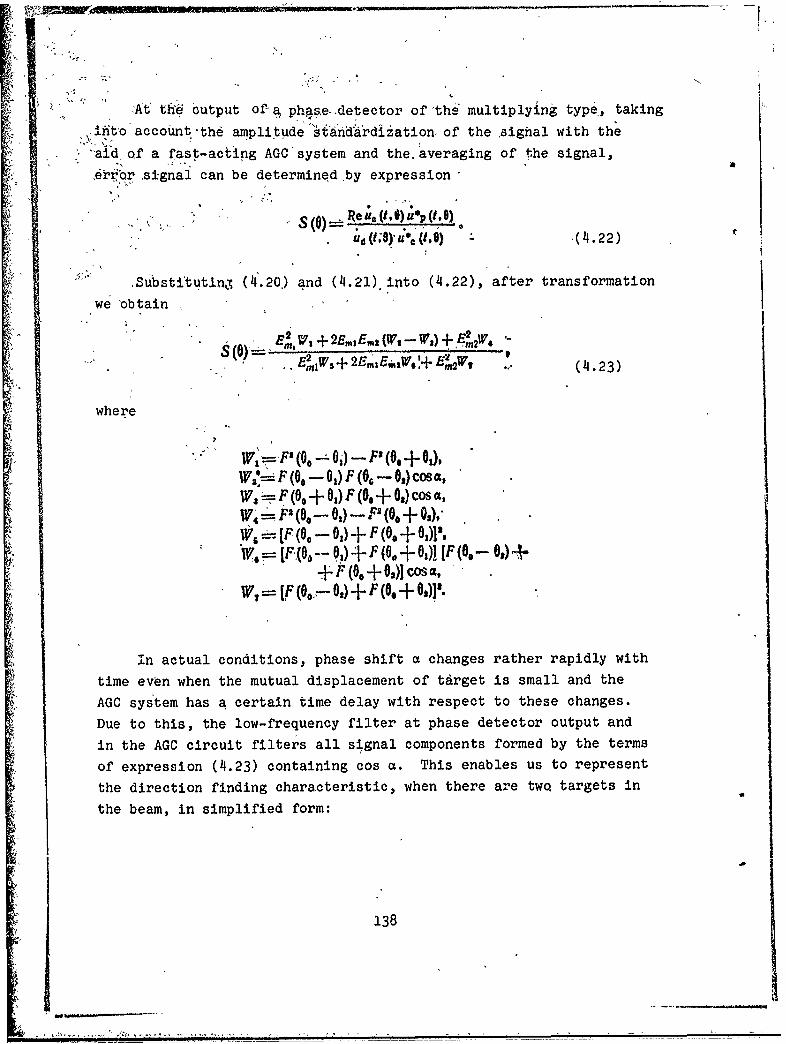
* Atý the• Output of-g phs.e-detector of the" multiplying type, taking
into account the amplitude s -an &'rdi.ationof the sghal with the
",aid of a fast-acting AGCOsystem and the.'averaging of the signal,
errbr .signal can be determined by expression
•M .. , . I •
;Ud (1B, eU* -(YO) "(4.22)
".Substitutin, (C4.20,) and (4.21).into (4.22), after transformation
we 'obtain
"" ,- WS) + -W4
S 0 .iWs + 2C-,., EiW, + E4W, ..' (14.23)
where
W,:=f2(0+0 03) FS(O0+ 01).Oa
W,-F' (60 -0)-F2 (80 + 0,),•. [F, (60 - 01) + F (0. + 6,)1',W's IFVeoo- 01) + F (80 + 601! IF -(a 6) +
+ (0+O,)] cos ,w = (60,- 6,) + F (8. + 8,)]'.
In actual conditions, phase shift a changes rather rapidly with
time even when the mutual displacement of tdrget is small and the
AGC system has a certain time delay with respect to these changes.
Due to this, the low-frequency filter at phase detector output and
in the AGC circuit filters all signal components formed by the terms
of expression (4.23) containing cos a. This enables us to represent
the direction finding characteristic, when there are twq targets in
the beam, in simplified form:
138

(F' (B.e- 01) PAOF@. - 8j)) + aa (F' (O,'-.IF F(6 51a)+FP(00,+0a)'+4'IF(- 1
-- 62) -- P ( +02)] (4.24).F) F (Of + &);
where a E 2 /Em.
'By equating the numerator or expression (4.24) to zero, we can
find the condition for direction finding of two point targets. It is
easy ,to see that, ,in this case, the radar will track from the powercenter of the sources and the equisignal direction will be nearer
the direction to the 5ource whose power is greater.
Of greatest interest is the case where one of the targets, for
exarpple, target number 1, is located at a small ang;le 01 = 66 to
equisignal direction, which corresponds to the condition of targetresolution.
in this case,
F (O±0,) F (Oo) T- A0Ao, F,.
(4.25)
where p is the direction finding sensitivity corresponding to the
steepness of the linear part of the direction finding characteristic
when a single target is involved in the direction finding, and is
equal to
, ,dF(0.0,)4''S(9) d e=e. (4.26)
Substituting (4.25) into (4.24), we obtain after elementary
trans formations
, v, A0 P a0.F (. ,) - F' (8. +8o,)+ a2- 4F' (0.)
- a ' ( ) F .( 0- 0 2) -. ' 8 - -+ ( 4 . 2 7 )' •2F(0.)
139
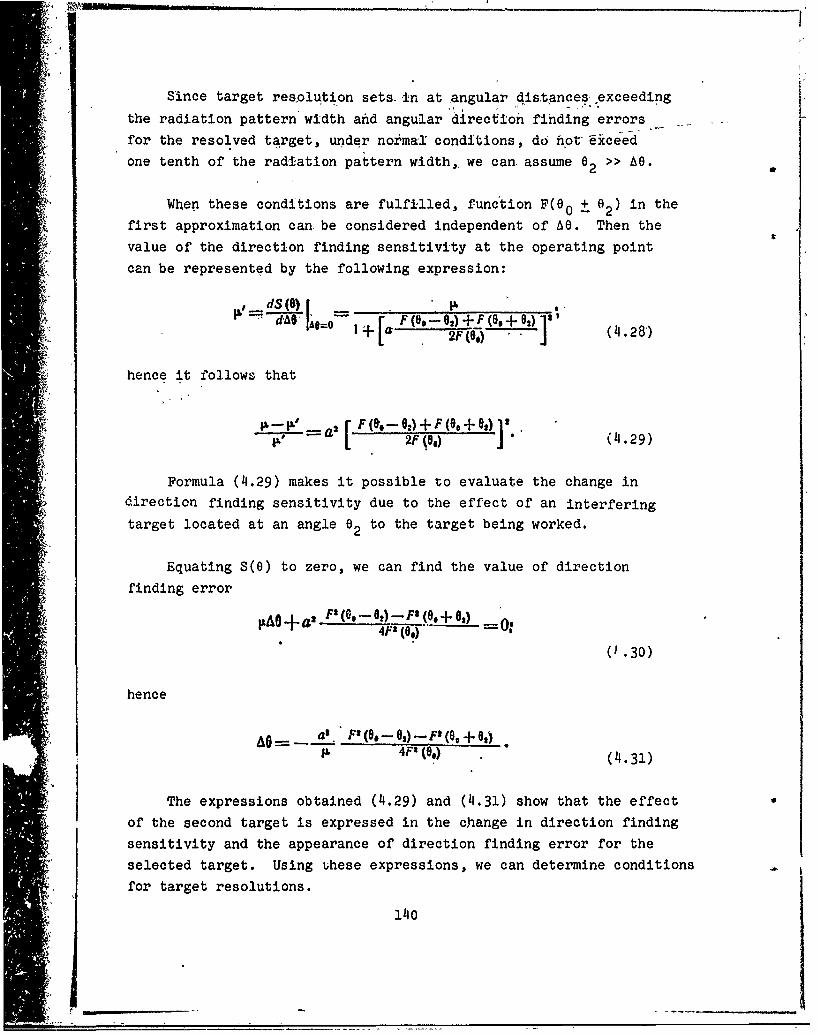
Since target res~olution sets 'in at angular distances ,exceedingthe radiation pattern width and angular direction finding errorsfor the resolved target, under normal' conditions, do ho1t 6ceed
one tenth of the radiation pattern width,, we can assume 02 >> 66.
When these conditions are fulfilled, function F(e 0 + a2) in the
first approximation can be considered independent of AO. Then the
value of the direction finding sensitivity at the operating point
can be represented by the following expression:
_ dS(B) (,)"'F (00-- 2) + F 108+ 01 2)I~ t-,. FQ,-02 +F(-e) (4.28')
hence it follows that
10 a2[.. (4.29)
Formula (4.29) makes it possible to evaluate the change indirection finding sensitivity due to the effect of an interfering
target located at an angle 02 to the target being worked.
Equating S(O) to zero, we can find the value of direction
finding errorIAOa FL (0 -- ,) -f- P 1( + 0,) 0:
"4F% (6,)(1.30)
hence
•-A a. • , Ft (Of-- 02) P-F (0 + Oj).4P, (9) (4.31)
The expressions obtained (4.29) and (4.31) show that the effect
of the second target is expressed in the change in direction finding
sensitivity and the appearance of direction finding error for the
selected target. Using uhese expressions, we can determine conditions
for target resolutions.
140
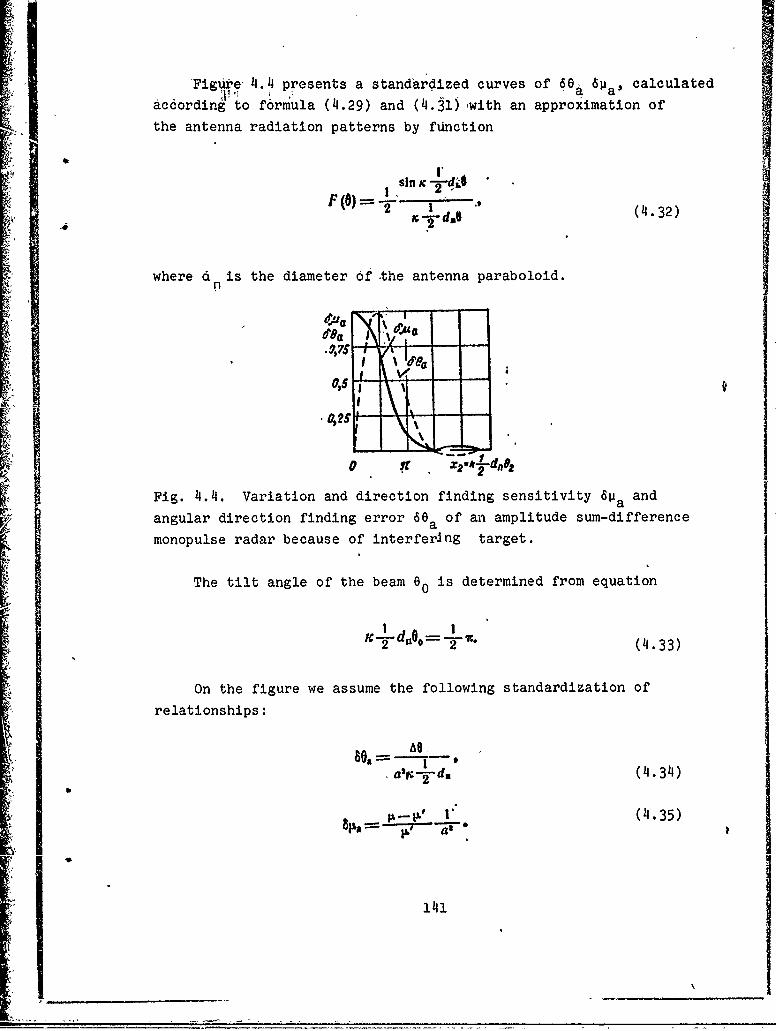
Figure 4.4 presents a standardized curves of 6 ea 6 11a' calculated
according to formula (4.29) and (4.31),with an approximation of
the antenna radiation patterns by function
2-" ) (4.32)
where dn is the diameter of -the antenna paraboloid.n
-e~a a•'
Wttoi g z.•,e
Fig. 4.4. Variation and direction finding sensitivity Sp a and
angular direction finding error 6e a of an amplitude sum-difference
monopulse radar because of interfering target.
The tilt angle of the beam 6 0 is determined from equation
I Id'6 W
2T "O 2"" (4.33)
On the figure we assume the following standardization of
relationships:
4.0
a~o d, (4.334)
1(4.35)
141
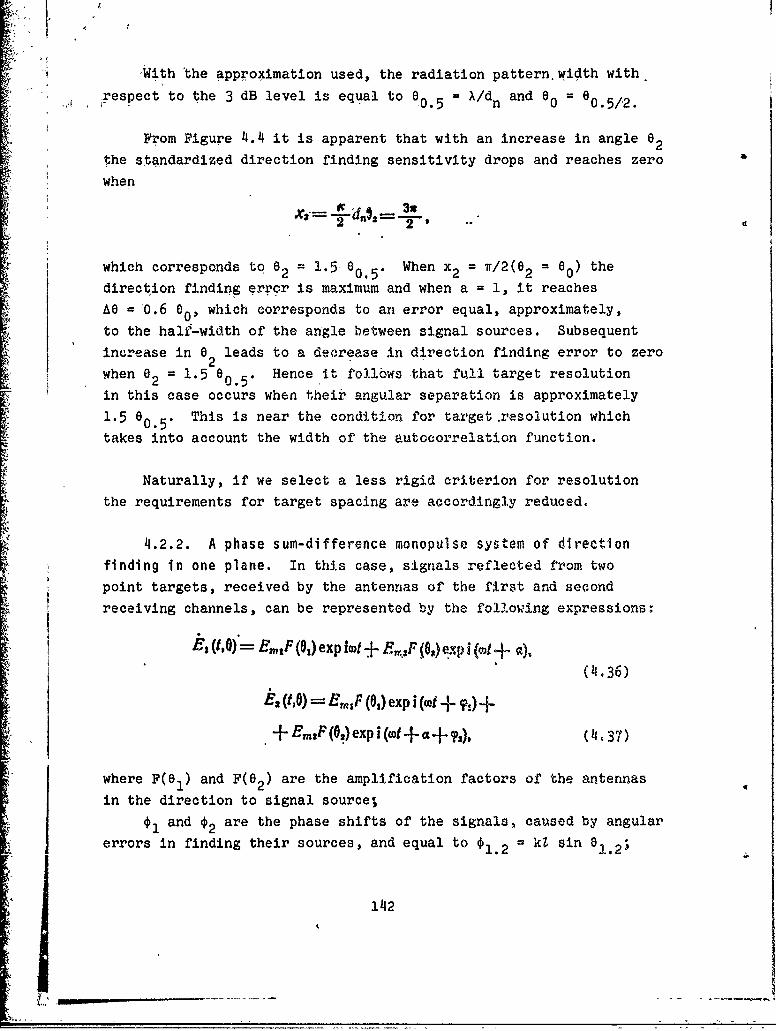
With the approximation used, the radiation pattern.width with
respect to the 3 dB level is equal to 0.5 = /dn and 00 = 05/2.
From Figure 4.4 it is apparent that with an increase in angle 02
the standardized direction finding sensitivity drops and reaches zero
whenX2 412 Sx,= -.. =-y-
2 2'
which corresponds to 02 = 1.5 00.5' When x2 =•r/2(e 2 = 0e) the
direction finding error is maximum and when a =1, it reaches
Ae = 0.6 00, which corresponds to an error equal, approximately,
to the half-width of the angle between signal sources. Subsequent
increase in e leads to a decrease In direction finding error to zero2
when 02 = 1.5 0. Hence it follbws -that full target resolution
in this case occurs when their angular separation is approximately
1.5 B05. This is near the condition for target.resolution whichtakes into account the width of the autocorrelation function.
Naturally, if we select a less rigid criterion for resolution
the requirements for target spacing are accordingly reduced.
4.2.2. A phase sum-difference monopulse system of direction
finding in one plane. In this case, signals reflected from two
point targets, received by the antennas of the first and second
receiving channels, can be represented by the following expressions:
E1 (t.O)-- RmF (O,) exp int + E.., ,F (6,) exp j (in + a),(4.36)
+E)mF (0,) exp i ((t + •437)
where F(61 ) and F(0 2 ) are the amplification factors of the antennasin the direction to signal source;
ý1 and ý2 are the phase shifts of the signals, caused by angularerrors in finding their sources, and equal to *1.2 = k1 sin 81.2;
142

is the phase shift of the signal, caused by target separation
with respect to range.
With sum-difference processing, at the input of the sum and
difference channels we obtain
Ec (t,O) =- A!- F (0,) [exp i(wt-+-p-)+-exp i tl +
Vi (4-- -38) • x "(r-•a]~.,,[exp~w1++~2 )eEp~st+)]; (4.38)
.) [eFp ( t +a+ •,)- (wt+a)]. (4.39)
At the output or receiving channels identical in characteristics,
we get the following with accuracy up to the constant coefficient;
u{F(,)Iexpi(o,,u:tt+±,)+expiwapt+ (4.40)-- aF (0,) [exp i (cOup + a + ) + - exp i (co,,pt + a)]);
,PY(1, 0) =.,,, {F (0,) [exp i (.up t + %) -- exp i coipt] +
+ aF (0) Iexp i ( 'npt-+-a + TO -- exp i (oupt- +a)]}. (4.41)
At the output of the multiplying-type detector, taking intoaccount signal standardization with respect to sum-signal and
additional phase shift or difference signal by 900, the error signal
can be determined by expression
Rei 0 (f, 0) aip(t, )exp I2
F' (e,) sin ?I + a3F' (0,) sin 9, - aF (0,) F (0,) [sin (c -c ,) -. -F' (01) + a3F' (0a) + F' (9,) cos ?I + a2F' (0,) cos T, +
a )-sin(a+72)]at (s) F (02) [cos (4+OSa+COS (a+T,),+cos (a-?,) ( 4.42)
143

Phase shift a in actual conditions, •changes rapidly and we can
assume that the oscillation phases, which can be produced by the
variations, of the error signal are fully filtered in the direction
finding system. Then the expression (4.42) can be simplified by
excluding components depending upon a:
F'. .• F' (6,) sin 11 + a'F' (6,) si, ni
F"(6,) +..a'F' (8,) +-F' (0,) cos Is + as F'(0,) cos ti (4.43)
If target No. 1 is located at a small angle A6 to equisignal
direction, then 01 = AO, F(l) F(O) and sin 01 = A6. Hence it
follows that
[sin iglaO) + at F-6 sin (Kclsin 02)1tT.z) P (0.) (•4.44)
I +a• F'• co1) s + (046)+a ,2 (0) cos (,t sin 6,)
For the area of interest to us 02 >> AO and functions f(O 2 )
in the first approximation can be assumed independent of AG.
Therefore, the steepness of the direction finding characteristic at
the working point can be calculated, approximately, according to
formula
. dS(0) 1 - : -Fd- 2 1 ((0n)
'--'2[ ~x n /sin Us ]=2 [ +a t F'(0) cos' 2 (4.45)
With direction finding of a single source a = 0 and p = k1/2,
which corresponds to standard direction finding sensitivity of a
phase sum-difference monopulse system.
Solving equation (4.45) with respect to V and p', we can find
the foritula which makes it possible to evaluate the change in the
144

direction finding characteristic of the system in the presence of an
interfering signal source, in the form
Equating (4.44) to zero, we find the condition of direction
finding in the presence of an interfering target:
sin (WL,,o)(+ at ip-,Y.,sin 02) ==0
At small values of AO sin k1Ae IkIAe. Hence it follows thatIe P_F2 _-F,(8:) sin (KI sin e,). (4.4)
Figure 4.5 illustrates the dependence of the direction finding
characteristic and the angular errors of a phase sum-difference
monopulse system, designed according to formula (4.46) and (4.47)
155"1.
In the calculations, the radiation pattern was approximated by
function
I
"F• (0)@-2 _L-
(4.48)
To simplify comparison, the dimensions of amplitude and thephase..type radar antennas were assumed identical and equal todn = 2Z.
A comparison of calculated data presented in Figs. 4.4 and 4.5shows that radar of the amplitude type is somewhat more sensitive
to the presence of an interfering signal from a neighboring target
145
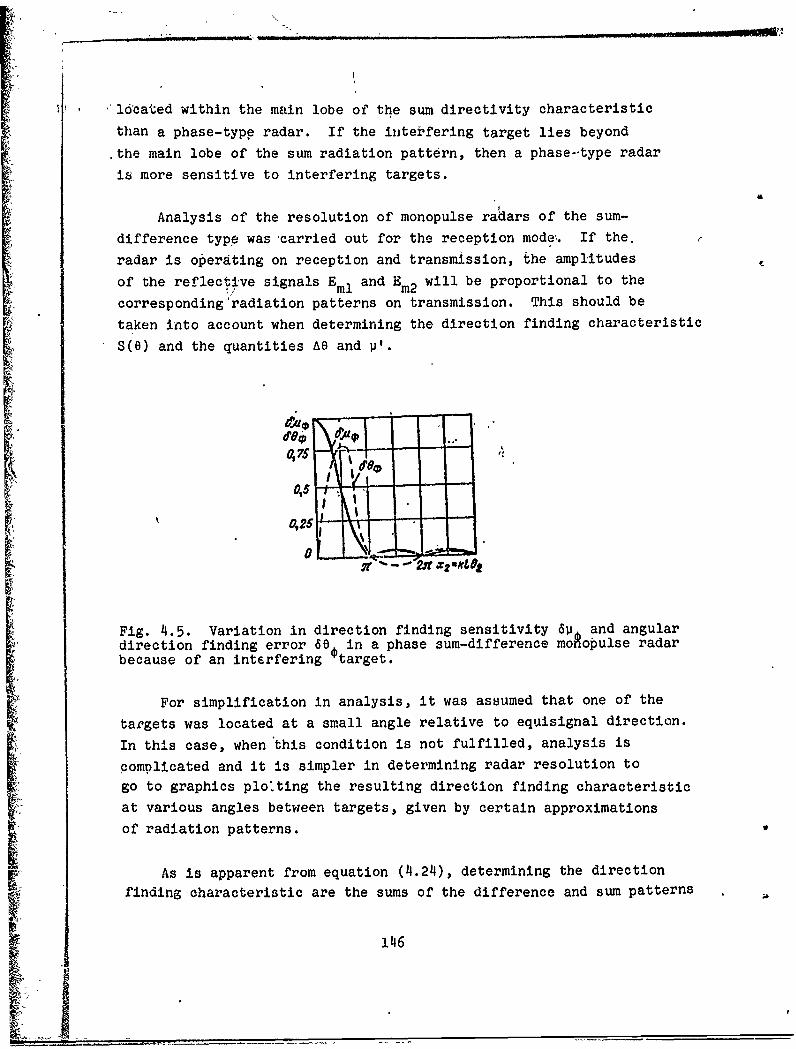
lo1icalaed within the main lobe of the sum directivity characteristic
than a phase-type radar. If the interfering target lies beyond
.the main lobe of the sum radiation pattern, then a phase--type radar
is more sensitive to interfering targets.
Analysis of the resolution of monopulse radars of the sum-
difference type was carried out for the reception modeý. If the.
radar is operating on reception and transmission, the amplitudes
of the reflective signals Eml and Em2 will be proportional to the
corresponding 'radiation patterns on transmission. This should be
taken into account when determining the direction finding characteristic
S(O) and the quantities AO and V1.
Fig. 4.5. Variation in direction finding sensitivity 6v. and angulardirection finding error 60 in a phase sum-difference mohopulse radarbecause of an interfering target.
For simplification in analysis, it was assumed that one of the
targets was located at a small angle relative to equisignal direction.
In this case, when this condition is not fulfilled, analysis is
complicated and it is simpler in determining radar resolution to
go to graphics plo'ting the resulting direction finding characteristic
at various angles between targets, given by certain approximations
of radiation patterns.
As is apparent from equation (4.24), determining the direction
finding characteristic are the sums of the difference and sum patterns
1416

with respect to each of the signal sources, taken with a weightfactor equal to the ratio of the powers of reflected signals from
corresponding sources. Plotting the sum and difference patterns
in corresponding scale (one on tracing paper, the other on a drawing
$ grid) and summing them with various values of angular target
separa'tion, according' to the expression determining the direction
finding characteristic, we can, in each case of interest to us, plot
graphically the resulting direction finding characteristic and, based
on its behavior, determine the moment of target resolution.
The graphic method is convenient because of its immediate visi-
bility and comparative simplicity. Below we shall examine the result
of graphic analysis of radar resolution for various types of radars
amplitude monopulse, with dual swif .g, with conical scanning and
sequential switching of radiatL n patterns [102]. Partial patternsof the radars examined, presented in Fig. 4.6, were approximated
in the region of the main lobe by function cos 2 56.25e, where 0 isthe displacement angle in degrees. The width of the radiation pattern
at the 3 dB level., with the approximati~on used, was 1.20. In the
analysis, the equality of amplitude for signals from targets (a = 3.)
SI was assumed.
Figure 4.7 presents standardized resulting direction finding
characteristics of a monopulse radar with the reception of signals
from a dual target for three values of angular target separation.
In the figure it is apparent that with an angular separation of 10,
the radar does not differentiate the targets. In this case, the
shape of the direction finding characteristic is typical for the
case of a single target. The presence of the second target in the
beam is manifested only by a certain dip in the direction finding
characteristic in the equisignal direction.
With an angular separation of 1.10 there is a break in the
direction finding characteristic in the region of the middle zero
point, which points to the presence of two targets in the irradiation
zone. However, in the region of the direction to each target, the
steepness of the direction finding characteristic is low, which does
147
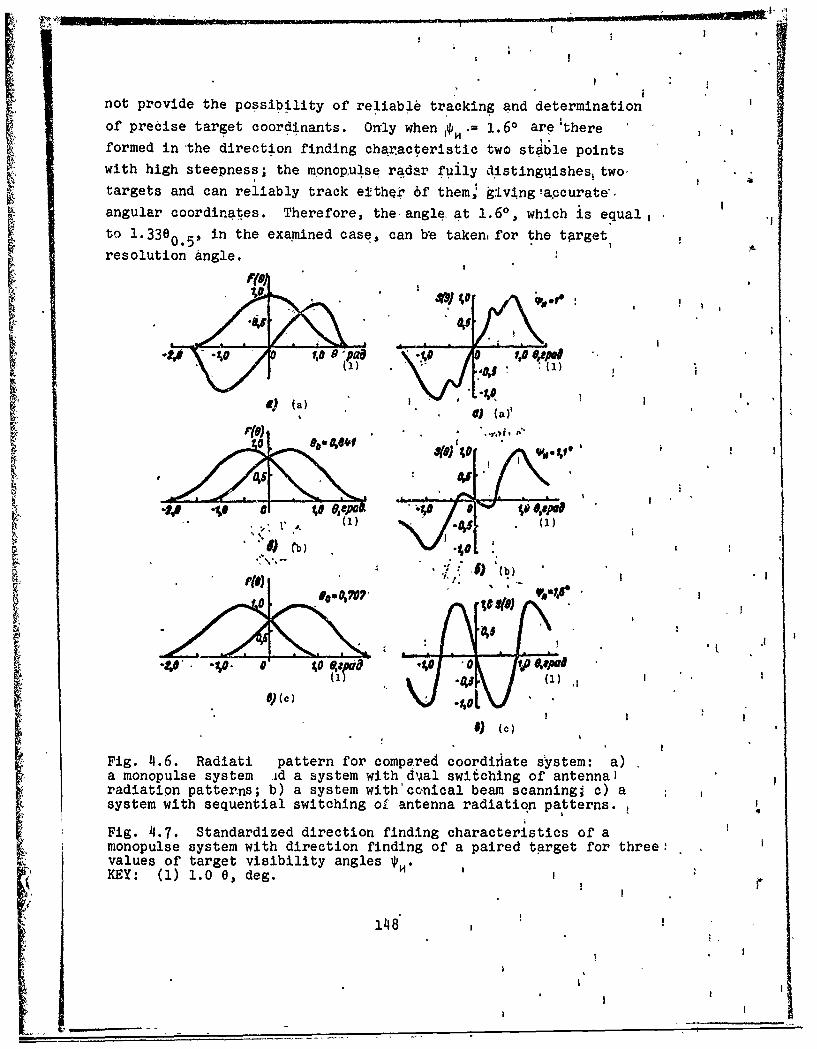
not provide the possibility of reliable tracking and determination
of precise target coordinants. Only when p= 1.60 are there
formed in the direction finding chariacteristic two stable points
with high steepness; the monopulse radar fully distinguishes, two,
targets and can reliably track elthqk 6f them, gLvingaccurate',
angular coordinates. Therefore, the angle at 1.60, which is equal
to 1.330.5) in the examined case, can be taken, for the target
resolution angle.
it) a)I I) Q (a)'
I .,\ ,,-* " 1ge 0 "
I)C_) .40't .
VI
- *.oI .o , ,•
0 I
A-) Ac
Fig. 4.6. Radiati pattern for compered coordinate system: a)a monopulse system id a system with dual switching of antenna]radiatipn patterns; b) a system with'ccnical beam scanning; c) asystem with sequential switching of antenna radiation patterns.
Fig. 4.7. Standardized direction finding characteristics of amonopulse system with direction finding of a paired target for three:values of target visibility angles OH"KEY: (1) 1.0 0, deg.
S148

I I
A s~milar method of determining resolution was used with respect
to .systems with dual and se4uential switching of antehna radiation,
patterns, and also systems with conical.beam scanning. Direction
findinig characteristics for these'systems are similar and are presented
.* ifi Fig. 4.84 From the figore it is apparent that with angular target
separation of 1.50 (upper curve) neither of the systems resolves the
target3. In this case, all $ystems indicate the presence of one
target instead of two.
With angular separation of 1.60 (rpiddle curve) the direction
finding characteristi' of all three systems has its zero-steepness
are& atthe origin of codrdina~es. Thii case can become similar to
!the case of slnkle target direction finding for a radar station with
a large region of insensitivity. When angular target separation is
I 1.701 the direction finding charactbristic indicates the presence of
* more than onet target, but t~rget separation is still insufficient
for the sdparate tracking of either target.
Thqshape'of direction' finding characteristic for the radars
studied, with full target resolution, ls indicated in Fig. 4.9.
Comparative resolution data for the stations studied are presented
"in. Table 4,1.
1In the table M KP is the minimum angular target separation
at which resolution of the targets occurs and the possibility is
provided for separate tracking witherrors not exceeding permissible
quantities. The last column 9f the table contains data on angles
ba'ed on a level of half power.
ofiisltonsadrize ihr e ordain iga it
From the data presented it is apparent that between a monopulse
. I system and a sgstem with dual switching of radiation patterns, thereis little difserenceZin .resolution (less than 10%).
As for radars witO conical scanning and sequential switching
F of' patIterns; they are inferior to the above systems, with respect
1o resolution, byapproximately 30%.
149

a(a) 0J (a)
((b)
77 (b)
,,o
?0 0 09w
i.-
1i ..' - .
,.J-,- -•
Fig. 4.8. Fig. 4. 9.
Fig. 4.8. Standardized direction finding characteristics of systemswith dual switaii,4,ng of radiation patterns, with conical scanningand with sequential switching of the antenna radiation pattern duringdirection finding of paired targets for three values of target visi-bility angle *,H
Fig. 4.9. Standardized direction finding characteristics containingminimum angular distances between targets, at which accurate tracking
" of either target is ensured: a) monopulse systems; b) system withdual switching of radiation patterns; c) system uith conical scanning;d) system with sequential switching of antenna radiation patterns.KEY: (1) 1.0 6, deg.
150

Table 4. 1.
(1) 'TMa Pic ra "$" U,1 j ,IpIfi
(2) Monosimny.bcual k 1.6 1.3(3)C MPHL-Pt nerK.aIoeHetc1 AllarPaMM 1,7 1,4,
flanpasaeHHOcTHAt (4) C KOHMWICcKM cxatlHpo~nawtex 2,0 1,7
[51) C nolce•0BaTe.bHukM nepeLxotteime 2,2 1.8 -
KEY: (1) Type of radar; (2) Monopulse; (3) With dual switching ofradiation pattern; (4) With conical scanning; (5) With sequential
switching of patterns.
As a result of formula (4.24), it has been shown that the phase
shifts of reflective signals can be disregarded on the basis that
they give comparatively high-frequency components in error signals
and are filtered at detector output.
In addition to phase changes, under actual conditions there will
also be changes in reflected signal amplitudes due to the geometric
differences in the targets and the fluctuation in the amount of effective
reflecting surface. Amplitude ratios substantially affect the moment
of target resolution. Since amplitude signal ratios, under actual
conditions, are subject to random fluctuations, the evaluation of
a radar's resolution, when operating on group targets, is generally
a complex problem, and a radar's resolution, even for two targets,
can be expressed only in the form of a probability.
Figure 4.10 presents the density distribution of direction
probability for systems of tracking on each of two targets with
different distances between them, expressed in fractions of radiation
pattern width and taking into account the actual fluctuations in
signal amplitude [19]. These data indicate that it i's possible to
distinguish two targets if they are separated by a distance corresponding
to 0.85 of the width of the antenna radiation pattern. This agrees
approximately with the moment of initial target resolution, obtained
by the above described method, when during the equality of reflected
151
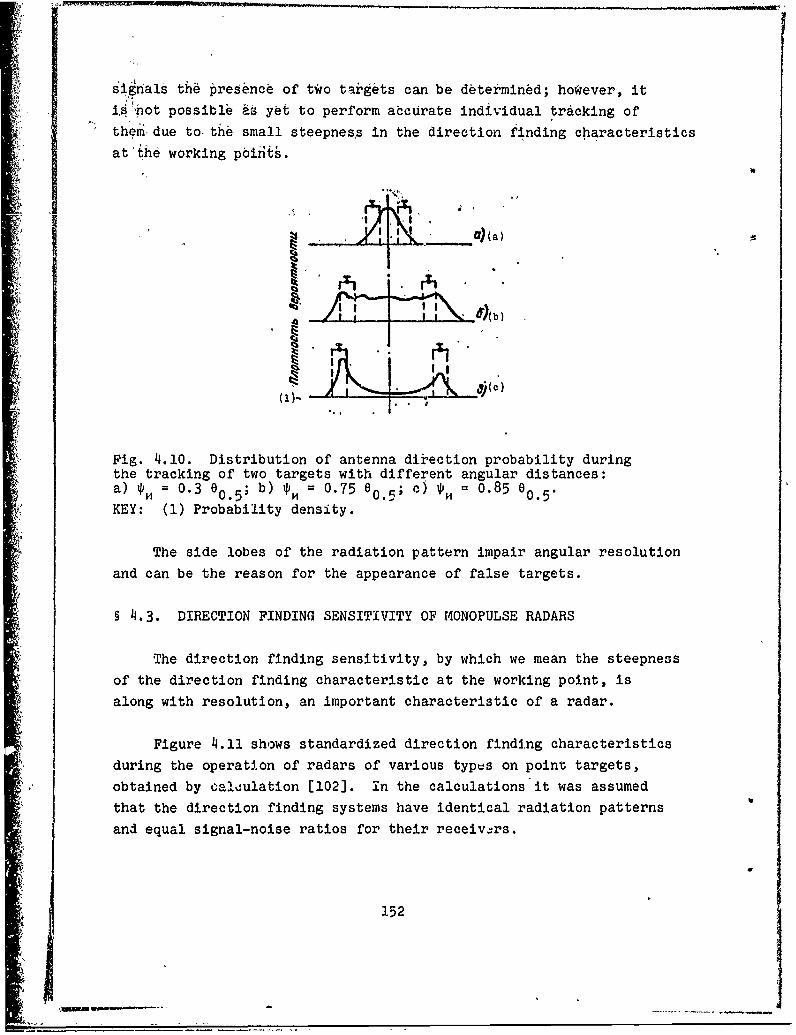
sIinais th6 presence of two targets can be determined; however, itis hot possible as yet to perform abcurate individual tracking of"theni due to the small steepness in the direction finding characteristicsat the working pbiitý.
3I a (a)AX
0(b
(1)- ... i .
Fig. 4.10. Distribution of antenna diiection probability duringthe tracking of two targets with different angular distances:a) C=0.3 00.5; b) 'H = 0.75 00.5; c) ow = 0.85 00.5.
KEY: (1) Probability density.
The side lobes of the radiation pattern impair angular resolutionand can be the reason for the appearance of false targets.
§ 4.3. DIRECTION FINDING SENSITIVITY OF MONOPULSE RADARS
The direction finding sensitivity, by which we mean the steepnessof the direction finding characteristic at the working point, isalong with resolution, an important characteristic of a radar.
Figure 4.11 shows standardized direction finding characteristicsduring the operation of radars of various types on point targets,obtained by calculation [102]. in the calculations it was assumedthat the direction finding systems have identical radiation patternsand equal signal-noise ratios for their receivers.
152

KEY:(9 (1 dg
S ,5 1.4 *4 ,I ~,, -0, . -
Fig. ~4.1l. Standardized directi~on finding characteristics of radars
during the direction finding of a point source: a) monopulse systems;b) system with sequential and dual switching of antenna patterns;c) system with conical scanning.IKEY: (1) deg.
Table 4.2.
THn PAC, fr KpyTH3Ha
4) MOHOHMny.1bChI cyMMapIIO-pa3.1OCTHaII 4.6 15) C nocJI•OBaTeANHbim nepeuKeIeM2iarpaMM HanpaweniocTH 3,3" 0,72
C napHuM IpeKJletoteHHeit AIarpa~im 3,1 0.677) C KoHHlecKiM cKaHlpoa.eM -- 2,7 0,59
KEY: (1) Type of radar; (2) Steepness, 1/deg; (3) Standardizedsteepness; (4) Monopulse sum-difference; (5) With sequential switchingof radiation patterns; (6) With dual switching of patterns; (7) Withconical scanning.
Comparative data on direction finding sensitivity of the selected
systems for low signal/noise ratios are presented in Table 4.2.Steepness is standardized with respec'U to the amount of steepness
of an amplitude monopulse system of the sum-difference type.
The data in the table show that a monopulse system with the
comparatively low signal/noise ratios assumed possesses the highest
direction finding sensitivity, approximately doubling the direction
finding sensitivity of a radar with conical scanning. A similar
conclusion was reached by Fellbrant E53].
153
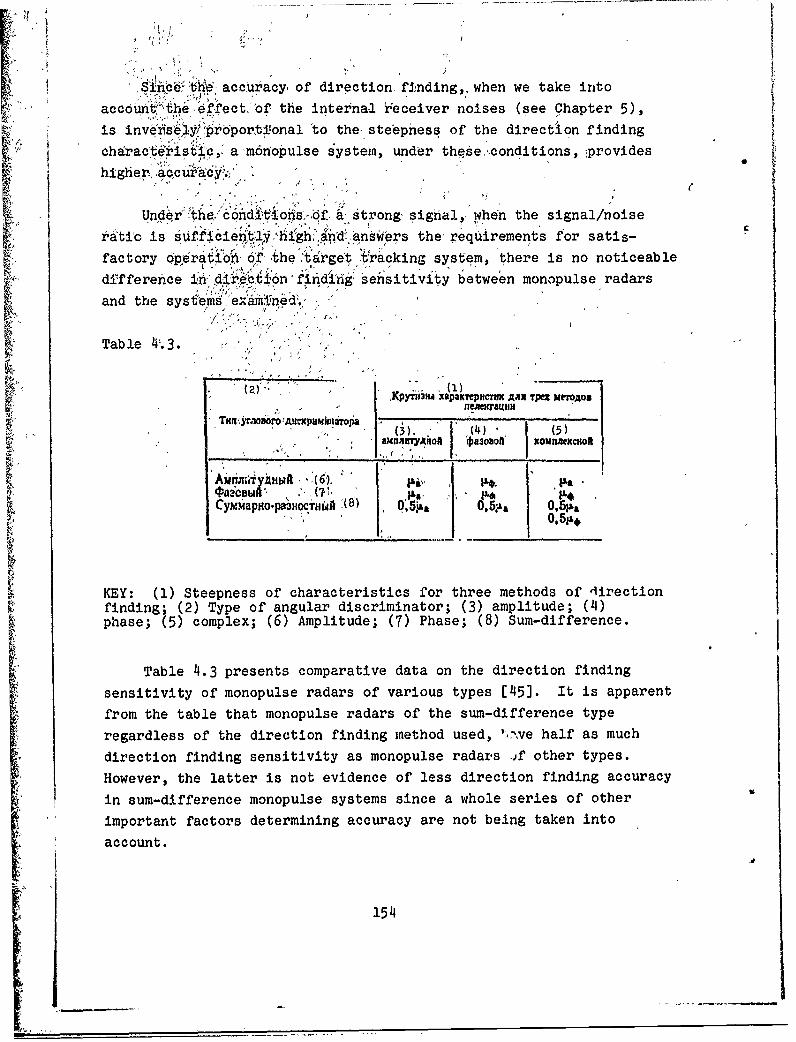
Since •"h\ accuracy, of direction, finding, when we take into
account"he" ,ffecti'of the internal receiver noises (see Chapter 5),is invers'eIY:proportilonal to the steepness of the direction findingcharac't6ristic•,, am6nopulse system, under these,,conditions, provideshigher, .accuracy`.' '
Under rthe.' c6nd-.on-,of-a strong, signal,- whn the signal/noiseratio is sufficieni~,t1 figh.,andanswers the requirements for satis-
factory op:rior• o• ith•'ge tVracking system, there is no noticeabledifference in"dl'ionfind 'ing sensitivity between monopulse radars
and the syst'em' ex'baýmned'.,
Table 4A.3. 2 i",/ ";,: 1
- - .. .. •' "_ ' .h ("3,. (4'77| Kpyma•u XapaKnepXcn •AJI "rpe Melo~ou
Tarn yr~loforoA~~Ka nk.kp• mnopa a7 -
_ __ _ _ _ _ _ I _ _
AJ, ;4I 1 Ab ",.,aa -f6 IaOinaexc-oIL
4)aiob1 (7.' Ps , * ' .,"
005P Pa
KEY: (1) Steepness of characteristics for three methods of directionfinding; (2) Type of angular discriminator; (3) amplitude; (4)phase; (5) complex; (6) Amplitude; (7) Phase; (8) Sum-difference.
Table 4.3 presents comparative data on the direction finding
sensitivity of monopulse radars of various types [45J. It is apparent
from the table that monopulse radars of the sum-difference type
regardless of the direction finding method used, ',.,ve half as much
direction finding sensitivity as monopulse radars .if other types.
However, the latter is not evidence of less direction finding accuracy
in sum-difference monopulse systems since a whole series of other
important factors determining accuracy are not being taken into
account.
154
.(.,•1

Table 4.3 uses the following designations:
* dO I eo*dS (7)
We should keep in mind that the above indices of direction
finding sensitivity and angular resolution cannot be assumed a
completely sufficient basis for the selection of the best system.
In.addition to the parameters indicated, when selecting the type
of coordinates system, it is necessary to take into account also
range sensitivity, design complexity, noise protection with respect
to natural and artificial noises, tactical operating conditions, and
a number of other parameters.
§ 4.4. METHODS OF IMPROVING ANGULAR RESOLUTION INMONOPULSE RADARS
The nee' to increase ang,,ar resolution arises when group targetsarch invol,-a and also when countermeasures are being used by the
enemy on as the dropping of chaff and decoys, which considerably
confts•: the aerial situation. Such a requirement also arises when
working with low-flying targets where a mirror reflection of signalsfrom earth begins to occur.
A well known method of increasing angular resolution is
to decrease the A/d ratio by using shorter waves and antennas with
large aperture dimensions. However, this method is not always
applicable since it requires that the size and weight of antenna
systems be increased. Therefore, recently consideidble attention
has been given to the development of schematic methods of solving
the problem of improving angular resolution in a radar and, in thisrespect, monopuise radars have definite advantages over other types
of direction finding systems.
155
Monopixlse systems" not only have high angular resolution asV
compared with single-channel systems, but a.Iso, under certain condi-
tions make it possible to accomplish the resolution of targets located
within the antenna beam. This possibility is brought about by the
use in monopulse radars of multichannel reception, making it possible
to obtainradditional target information-.
As we know, the nonresolution of targets with respect to angular
coordinates canjappear in two ways. When the signals reflected
from the targets alre identidal in leve), the equisignal direction
of the radar will be set in the direction of a point located
midway between the targets. If low-frequency fluctuation of reflected
signals occur and at times a stronger signal arrives from one target,
the equisignal direction will be shifted'in accordance with the changes
'in signal level from one target to the other. In both cases, the,
radar cannot properly indicate the location of the target; therefore,
the flight of aircraft in groups is considered 'one of the counter-
measures against the guidance systems of guided rockets with radar
homing heads [103).
Since, under actual conditions, the reflected signal fluctuates,
one of the methods for schematic solution to the target resolution
problem for a group target is based on angle gating [103).
4.4.1. Methods for increasing resolution, based on angle gating.
The essence of this method lies in desensitizing the angular--measurement
servosystem with respect to error signals arising at the instant a
stronger signal arrives from another direction, and tracking only
the chosen target.
The gating principle can be used since the fluctuations of signals
reflected from targets lead to rapid changes in error signals.
Error variation during the tracking of a single target is a slower
process; therefore, a certain threshold of angular information
performance can be established in the system so that it will not
respond to error signals from other targets which exceed this threshold.
A block diagram of one of the versions of a multiple system, which
156

usosthis prindigle of target resolution in a group., is presented
in Fig 11.12. ,Us d in the 'system is a lens antenna with four horn
feeds and two trdiibnitters working on spaced frequencies or on one
frequency tut with a time shift.
((1)
A16
(12)rm D
(1)3)~~*- a1'~~
0qed O
0 L.ona4u
'C 07,V0411
LWLgH- ..,E _( 29)
Fi.1.1.Bok iga o oopleraa ih ihrsouinKE:(1 aiain atrno rasite ; 2 Tree1 3
Equsina drecio; 11 Tage 2 () TrnmttrB2 ()Tanmte
(23) F..llowav reciaier;m (2f1 F oull-ae rectfir; (25) Piharseltin
inv)ePhter (26eWaetr rect i amlfier; (27) Mscixera r; (28) TReshold B
bias; (29) Threshold signal channel; (30) Direction AGOC receiver.
157

We should note that the frequency spacing of the transmiitters
must not be too great since the reflecting ability of a target depends
upon frequency and this can affect the logic communication between
error signals. In this respect, it is better to use transmitters
on the same frequency but operating with a time shift. Thus, one
transmitter can be used instead of two. A disadvantage of the methodof time spacing of signals is the complication of target distance
measurement since, in this case, additional ambiguity is introduced.
Thanks to frequency of time shift. of transmitter signals, two
independent error signal voltages are formed in the 'receiving system,
each of which contains information on the location of the group target.
For simplicity let us examine a system of direction finding in
one plane. As is apparent from the figure, the antenna radiation
pattern consists of two separate patterns displaced equal angles
relative to the antenna axis and formed by two feeds, each of which
is excited by a separate transmitter (A or B). The presence of two
separate patterns makes it possible to irradiate targets on different
sides of the equisignal direction by signals from different transmitters.
This ensures that additional information will be obtained on target
position with the reception of reflected signals.
Two separate receivers are provided for the reception and
corresponding processing of reflected signals. The receivers are
similar in design; therefore, in the figure one of them is presented
in greater detail (receiver A).
Signals from antenna output, through the send-receive switch
are fed to the double balance bridge where sum-difference processing
occurs, typical for amplitude sum-difference monopulse systems.
At input of the corresponding receivers are formed sum and
difference signals which then are converted with respect to frequency,amplified In the i.-f amplifier, standardized with the AGC system for
a sum signal, and compared in the phase detector. Signals obtained
at the output of each receiver are fed to common adding and subtracting
devices and used for target selection.
158

To clarify the principle on which target resolution is based,
let us examine analytically the processing of signals during
direction finding of single and paired targets. We shall assume
that one transmitter is used but radiation along independent channels
is spaced in time. In this case, during the irradiation of a target
by the upper antenna radiation pattern (pattern A), the signals
received from the target at antenna channel output can be expressed
as
AA (Y 0) E- AF (0* -- ) exp A',
(4.49)
"E2AQ (,0o)t.EA•F (0O+o) F (o, -- o)exp i ct. (14.50)
Hence, at the sum-difference processer output, with an accuracy C
up to the constant coefficient, we obtain
F-o' (t, A Y)= 06(t) + 'ý2 (Ao
AF (0 0-o) IF (o - o) + F (0o +o)] exp i ot, (4.5l)
E PA .' ) = ~j 4 ' 0 -E2A (01 ) ( 2=EmAF (00 -- 0) [F (0o -0) -F (0o-o- 0)] exp i t. (14.52)I
With identical channels and a conversion factor of one in the
phase detector, error signal at receiver A output assumes the form
SA (0) =Re tcA VI, B)tE 1 (f, 8)4cA VI, O)1i*Ct (t, 8)
_ F (e0 - 0) - F (0 , -: 0) -( 4 .53)- (6#- 0) + F (00+ o)"
Similarly, we can obtain corresponding expressions for the case
when the target is irradiated by the lower radiation pattern (pattern
B):
159
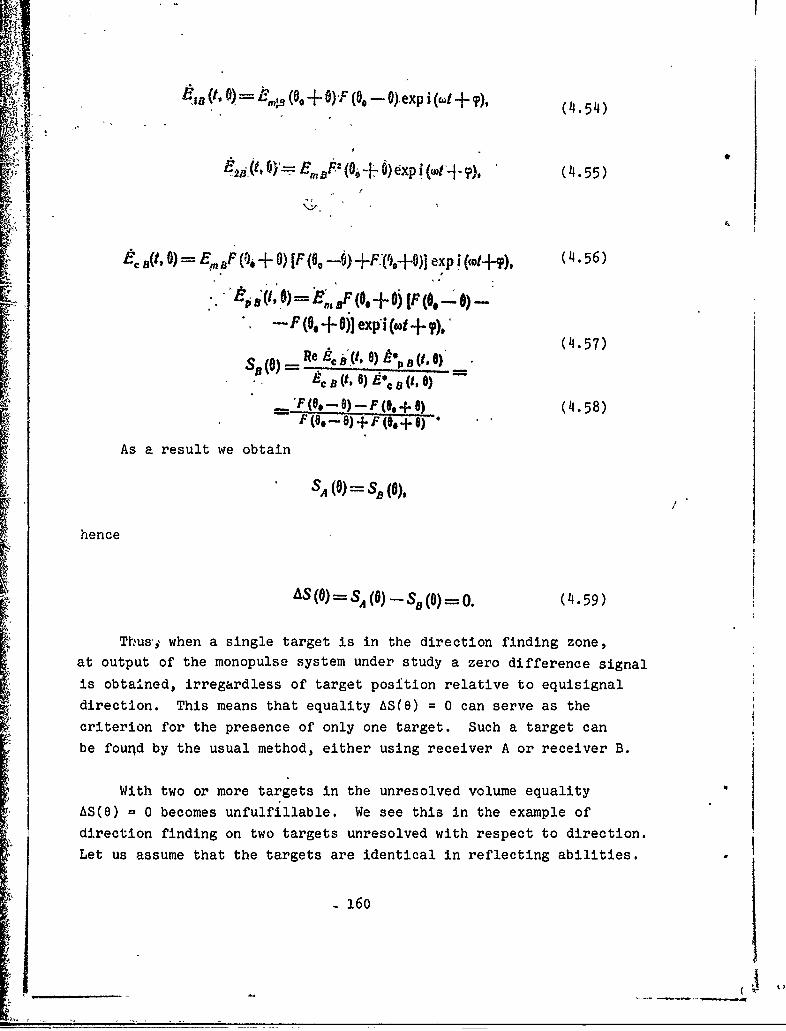
E,8 (1,0 o= ,m%3 (0, + OF (0. -- G).exp i (c, +?. 1 5S(4. 54)
-C B(t, 0) = EmBF (O, + 0) [F (O0 -- ) +F'(,'.+g)] exp i ((1tnt?), (4.56)
O .- (1 (0 0 + Vi ep (,00 •,
(4.57)
Re s~ Y..0 80) -s~ ~~cB ( f)=• , 6)t 6> C, B (I. o
- F (0, + ) (4158)-- F (O,- o)+ •F(_. (14,58)
As a result we obtain
SA (0) S8 (0),
hence
AS s4 (6) - sB (o) =o. (14.59)
Thus• when a single target is in the direction finding zone,at output of the monopulse system under study a zero difference signalis obtained, irregardless of target position relative to equisignaldirection. This means that equality AS(O) = 0 can serve as the
criterion for the presence of only one target. Such a target canbe found by the usual method, either using receiver A or receiver B.
With two or more targets in the unresolved volume equality
ASCe) = 0 becomes unfulfillable. We see this in the example of
direction finding on two targets unresolved with respect to direction.Let us assume that the targets are identical in reflecting abilities.
- 160 It,__ _ _
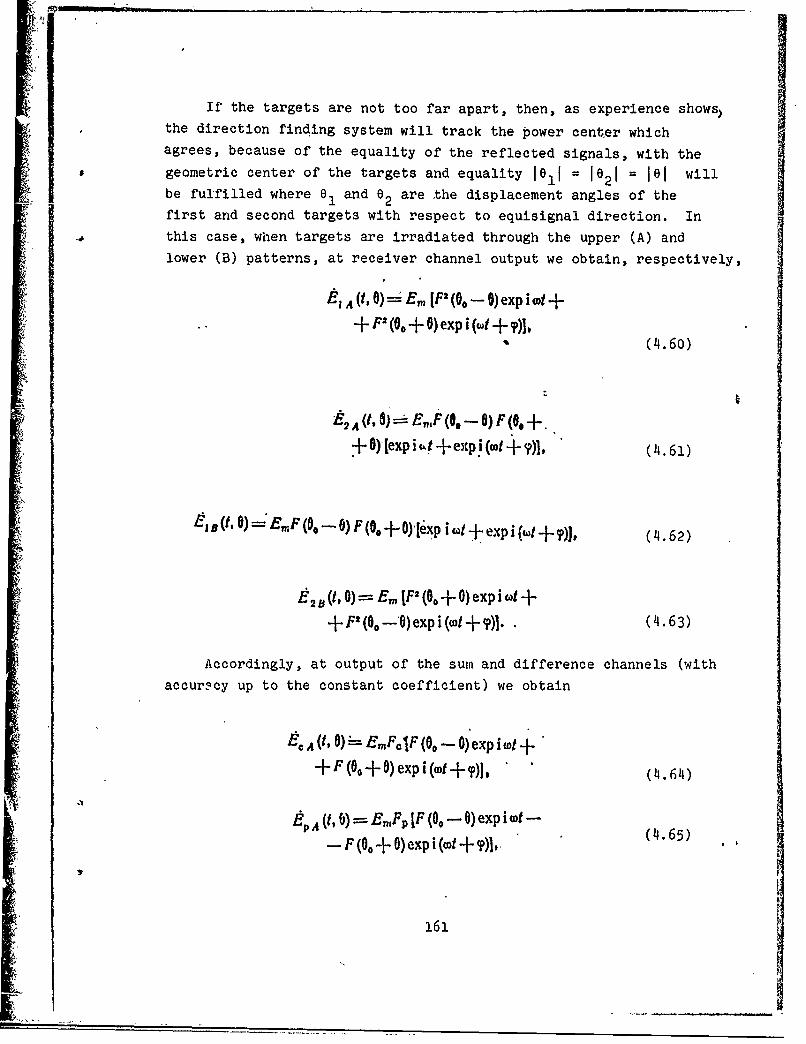
If the targets are not too far apart, then, as experience shows)the direction finding system will track the power center which
agrees, because of the equality of the reflected signals, with the
geometric center of the targets and equality lell -= 1021 = lel willbe fulfilled where 01 and 02 are the displacement angles of thefirst and second targets with respect to equisignal direction. In
this case, when targets are irradiated through the upper (A) and
lower (B) patterns, at receiver channel output we obtain, respectively,
ElA (t, 0) -Em [F2 (0 0) exp i (of ++ F2 (00 + 0) exp i (ct+ ?)],
(4.60)
E2A (to 0) EF (.-0) F (0 +
0) [exp i ,t Jenpi (c ], (14.61)
SB (to 0) = F (o. -- 0) F (0. + 0)*xP i tot + exp i (cot +-7-r)], (14.62)
E240 (t, 0)- Em IF (00 + 0) exp i t ++F (0-0) expi(wt+ ?)]. . (14.63)
Accordingly, at output of the sum and difference channels (with
accur.cy up to the constant coefficient) we obtain
8p A (to 0) = EmF; IF (00 - 0) exp i wt +
EpA (t, 0)- E,,1Fp [F (0O --0) exp i ot----F (00-{- 0) eXp i (cot + ),( .5)
161

(440 1MF IF4t0e x, I ( i
tp ,o- IF (O. +0) exp i•' 6 +
-+F (0--0) exp i,(wt. W• 4. 667E'p 8 (tO) = mFp [F (0, + )expit ! I ., 4,
_- . l u _0)e lpi(®.... )], ii . (4.67); "
where
Fp F(0o-O)-F-(6o+0).
Error signals at output of receiver A arid Bj after elementary
transformation, will be written as
IF (O. -- 0) -- F (Of + OSA (0) =F, (0.- o) + 2F (0(o.- 0) ,P (O + 6) Cos •,+ ,,S (0. + V1'
(~4.68)
,F(8,-O) -P(at+ M)s)S(0)-- F(O' -) + 2F (.-o)F(o o) Cos ?1+' (Of-+-) (4.69) ,.5a(7I
The resulting expressions for S (B) and SB(O) are equal in
modulus, but ppposite in sign. Hence
s, (o)•-'s o. (4.70)"" I
Using this method, we can show that inequality (4.70) is alsofulfilled when there are more than two targets with different reflectinisurfaces in the unresolved volume c- ipace. We can also show thatwhen equisignal direction of the an'tenna of a monopuls'e system i's
shifted to the side of one of the targets and this target at someinstant is more powerful source of reflected signals than the 'other
target, the difference voltage of the error signal AS(eO) will benear or equal to zero just as in the case of a single target.
162
I I
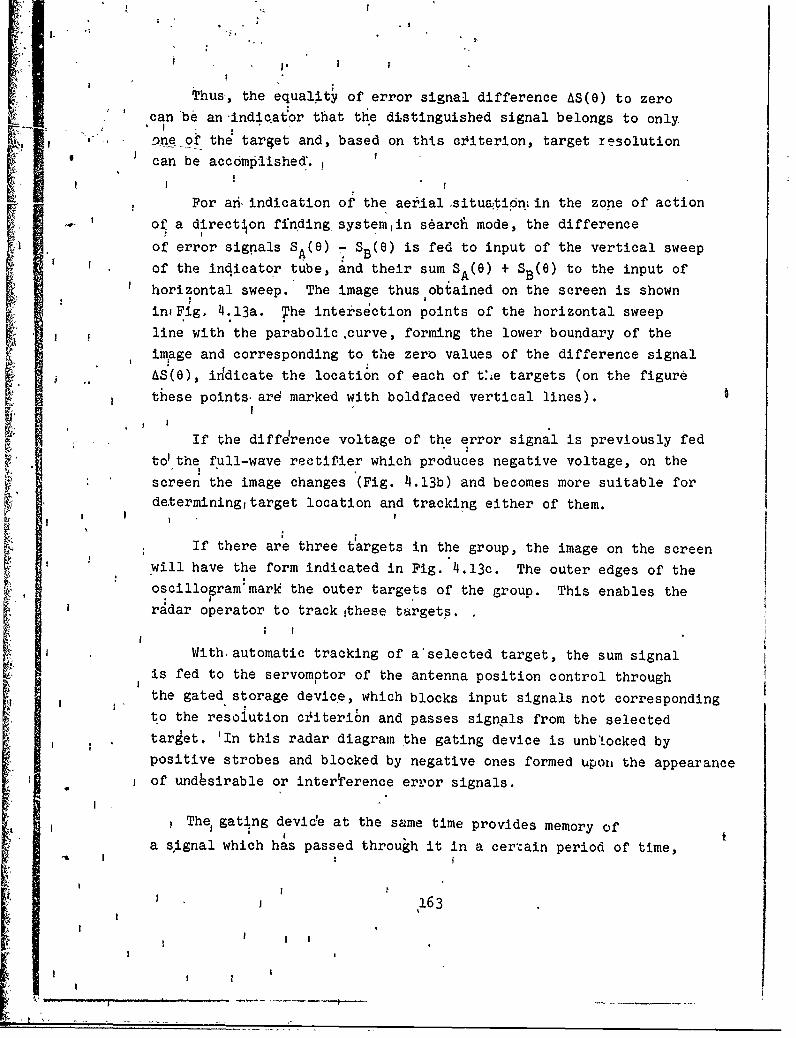
i I' I
Thus, the equality of error signal difference AS(e) to zero
L can'be an-indiqat~or that the distinguished signal belongs to only
2-, ne of th4 target and, based on this cz'iterion, target resolution
,I Ican be accomplished•, I
SFor ant indication of the aerial situati6n, in the zone of action
-' o a direction ffnding systemin searcA mode, the difference
of error signals SA(e) SB(e) is fed to input of the vertical sweep
* of the indicator tube, and their sum SA(e) + SB(e) to the input of
horizontal sweep. The image thus obtained on the screen is shown
iniFig. 4.13a. The intersection points of the horizontal sweep
line with the parabolic,curve, forming the lower boundary of the
image and corresponding to the zero values of the difference signal
AS(e), irdicate the location of each of t'e targets (on the figure
these points, ard marked with boldfaced vertical lines).
If the defference voltage of the error signal is previously fed
tolthe Ifull-wave rectifier which produces negative voltage, on the
screen the image changes (Fig. 4.13b) and becomes more suitable fordeterminingtarget location and tracking either of them.
If there are three t'argets in the group, the image on the screen
will have the form indicated in Fig. 4.13c. The outer edges of theoscillogram'mark the outer targets of the group. This enables theVi
radar operator to trackthese targets.
With. automatic tracking of a'selected target, the sum signal
is fed to the servomptor of the antenna position control through
the gated storage device, which blocks input signals not corresponding
to the resolution cfiteribn and passes signals from the selected
target. 'In this radar diagram the gating device is unblocked bypositive strobes and blocked by negative ones formed upon the appearance
i of undbsirable or interference error signals.
The, gating devicde at the same time provides memory ofa signal which has passed through it in a cerzain period of time,
163
[<I!

which removes the disconnection of the servosystem at the instant
the gating device is blocking when error signals from an undesireable
target are formed in the receiver.
I' I . ' i1 1f I I
7-
SL f
I444
S(a) .. ".(b
j Fig. 4.13. Image on indicator screen: a) direction finding of apaired target (first version); b) direction finding of a pairedtarget (better version); c) direction finding of.a group of threetargets.
As has been indidated, the resolution criterion is the equality
to zero of the difference voltage of the error signal AS(e). At
such instants the sum voltage of the error signal can be both positive
and negative, depending upon which of the targets is at that instant
the more intense source of signals. Therefore target selection for
automatic tracking is accomplished by choosing the working polarity
of the sum error signal with the aid of the target selector, con-
sisting of a switch and a detector connected in series from the
input load of the full-wave rectifier of the sum error signal.
Depending upon the position of the switch, the polarity of the
detector connection and the polarity of the signal transmitted
through it change.
The full-wave rectifier of the sum error signal, regardless of
the polarity of the input signal, developes at its output a voltage
of negative polarity used for the blocking of the gating device.
The blocking of the gating device also occurs if the difference
error signal is zero, blut the main signal source is an undesirable
target.
164

In the system there are a number of additional devices not
indicated in Fig. 4.12 but necessary for improving the quality of
its operation.
[Thus, for example, there is a threshold device which eliminatesýýngul~ar antenna-drift in the case of small signals from targets,
whose level is insufficient to use for tracking the target. A
d-c restorer is also provided to ensure the unblocking of the gatingdevice for certain minimum -and maximum time intervals, therebylimiting the duration of the blocking of the servosyotem. We can
become acquainted with the work of these devices through the complete
description of this system in reference [1031)
It should be noted that this method of design solution for the
problem of target resoluti.on in a group cannot ensure high accuracies) b
for example, the accuracies which can be achieved when tracking single
targets, since it is based on the blocking of the zervosystem forcertain time intervals during which the antenna moves from "inertia".
Nevertheless, its advantages are obvious, particularly, as will
be shown in Chapter 7, in tne protection from certain forms of
active interferences.
From the point of view of achievable accurac,, preference
should be given to another method of increasing resolution [72],
which will be described below. The essence of this method reduces
to the functional processing of signals received simultaneously
along several independent receiving channels.
4.4.2. A method of increasing resolution, based on functional
processing of signals. We know that the plane wave intensity phase
* at arbitrary point "H" relative to reference point "0" located
at the origin of coordinates of the plane of the figure (Fig. 4.14)
due to the difference in distances from radiation source A, is
expressed by formula
(O-- RU) C-- (P cos cos a sin + p sin sin a), (14.71)
165

where R and R is the distance from cignal radiation source to points
"0"andH"p, $ arem the polar coordinates of point "H" relative to point
"0" and the direction finding plane;
:e is the elevation of the radiation source;6 is the azimuth of the radiation source.
If in, the direction finding plane we use rectangular system
dYf coordinates XY, connected with the polar system coordinates by
relati'onships
"y p sin,&; x p cos;
then equation (4,71) assumes the form
•7• q' ~IF---- - c(x cos, sin 0+ !!sin ,).S""[ (4.72)
poiIn th( presence of M sources the resulting field at the examined
point in space is determined from the familiar expression
M A•' A exp - i((xcosau, ,,sin .+ysit,), (4.73)M=1
where Am = Eom expi (wmt + ¢mo) is the complex amplitude of signal
from the m-th source;Wm and *mo are frequency and initial phase of signal from the
m-th source.
Expression (4.73) shows that the resulting field intensity atthe examined po.int in space can be defined as the sum of M complex
equations, each of which is determined only by the location of the
correspondence source.
Obviously, if the receiving system is capable of forming thecorresponding quantity of ndependent equations which characterize
the mutual arrangement of the sources, then by solving these equations
by familiar mathematical methods wi can obtain parameters defining
166
I:

the direction to each ofP the signal sources and thereby solve the
problems of target resolution in space. This also involves the
principle of increasing radar angular resolution by the functional
method.
The necessary quantity of independent receiving charnels for
a direction finding system, when accomplishing the functional method
of target resolution with respect to angular coordinates, is determined
according to formula N = 2M, where M is the number of radiation
sources with disagreeing angular coordinates.
A typical monopulse radar performing two-plane direction
finding has four receiving channels and, therefore, can in principle
successfully resolve a paired target by the method considered when
targets are not being resolved with respect to range or speed.
The following system of equations is formulated for such a
monopulse radar at input of the receiving channels;
tA =A, exp I- i (xU, +-. YVIN) ++ A2 exp [- i (x1UP + yV 2)],
E= A, exp [- i (xU, + y2 V,)] ++Aexp[-i (x2U2+ Y2 VI), ,S=4A1 ex'p [- i (x3U, + Y3V1)] +
+ A2 exp [- i (x3U2 + y3V2)],k 4 = exo[-f (x4U, + yV,)J --
-A2 exp [- i (x4U.-J- y4 V2 )],,
(4.74)
where
V,=Ksine'; U1 =xcose8sinO3;V2= = ,tisn: 2 ; U2= ,cCos ssin 0,.
167
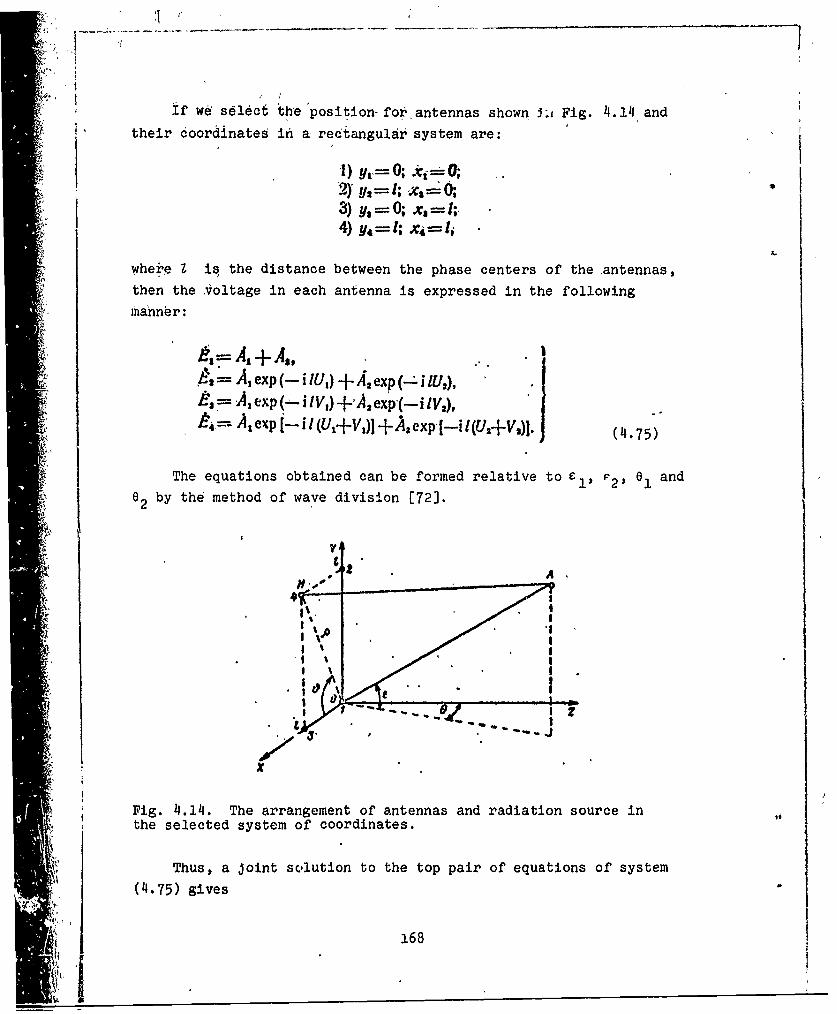
If we select the position-for antennas shown J:i Fig. 4.14 and
their coordinates in a rectangular system are:
2) ya- 0; -ti O
3i) y, =O; x, = I;4) -l x4=l.
where Z is the distance between the phase centers of the antennas,then the voltage in each antenna is expressed in the followingmanner:
A,= A, + As,....-- A, exp (-i IU) "J+ A., "xp (-ý i lU2,)
£,'~~- ,exp -iVI)- -A ex'(-l,,.
4,= A, exp [--il (U,+V,)I +Aexp[-i I(U,+V,)I. (4.75)
The equations obtained can be formed relative to el, P2' 01 and"e2 by the method of wave division [72].
WA
44f
• IIII
-. ,I
X
Fig. 4.14. The arrangement of antennas and radiation source inthe selected system of coordinates.
Thus, a joint solution to the top pair of equations of system(4.75) gives
168

At = E, exp --I luv)-- E "• tx~p (-U3'uo- exp (-i IU,)'
As • e - 91 exp U -BU,)"exp (- i IU:)- exp (- I 1U2) (4477)
Accordingly, we obtain from the joint solution of the bottom
pair of equations from system (4.75)
Ai expL-i1 (U,+ VI)I-exp -i I (U,+V,)) (4.78)
A2. t4, -- ts exp (-- I IU,)
exp -lL (U -+ V)j - exp I- i I(U, + Vo) (L4.79)
Equating in pairs the corresponding equations (4.76)-(4.79),
after elementary transformation we obtain
•,exp (- I )--•,e* p(• V)--.[Eaexp(p--1U2) 1,A'E., exp (- I U2) -- t ( 4,80 )
El exp (-I IUI) E exp(-iIV'•),
E, exp (-I IU,)-- •tV ( 4.81)
Complex equations (4.80) and (4.81) give eour actual equations
and make it possible to determine unknowns Ul, U2 , V1 and V2 .
The values found for U1 , 2 and V1 , 2 enable us to calculate azimuth
and elevation for each of the targets according tý formulas
e_.2- arcsin (4.82)
arsn U,. (4.83)
1V6 .2
169
All operations in calculating angular target coordinates can
be.performed by computers. Subtraction, comparison, and phase shift
for signals, in accordance with formualas ('4.80) and (4.81), can beperformed both high and iritermediate-frequency [72].
I should be noted that the functional method, unlike the
design method examined above for increasing target resolution with
respect to direction, enables us, in principle, to obtain higher
angular measurement accuracy for targets in a group, but its reali-
zation is not a simple task. Thus, the suggested diagram of functional
processing on high frequency [72] requires an increase in receiving
channels of a monopulse radar from four to six and the introduction
of 14 sum-difference bridges into the high-frequency circuit of the
direction finding system. In connection with this, additional
difficulties arise with the provision of identity and stability for
the phase characteristics of the receiving- 6hannels, and power
losses of signals received also rise considerably, which forces
the additi6iia'l amplification in receiving circuits. With functional
processing of signals on intermediate frequency difficulties arise
with the provision of linearity for the receiving circuits in a
sufficiently wide dynamic range.
170
CHAPTER 5
ACCURACY PROBLE14S Il ANGULAR '"EASUREFI1dT BYTHE MONOPULSE METHOD
The accuracy of measuring angular coordinates is evaluated by
direction finding errors caused by various factors.
Origins of direction finding errors are broken down into
external origins, introducted by the target and the medium of radio
wave propagation, and equipment origins, caused by imperfection in
equipment, deficiencies in the measurement method, as well as internal
noises of the receiver and servosystem. In character direction finding
errors are divided into systematic and random.
In accordance with these sources of errors, Table 5.1 offers
a list of the main components of errors determining angular measure-
ment accuracy.
Direction finding errors caused by the effect of nonidentity
of the amplitude-phase characteristics of receiving antennas are
analyzed in Chapter 6. Below we examine the effect of a number of
other reasons for the impairment of accuracy in angular measurement
by the monopulse method.
§ 5.1. THE EFFECT OF RADIO WAVE PROPAGATION CONDITIONSON DIRECTION FINDING ACCURACY
The main factors affecting the accuracy of angular measurer~nt
by the monopulse method and connected with radio wave propagation
conditions are the surface of the earth and its atmosphere.
[ 171
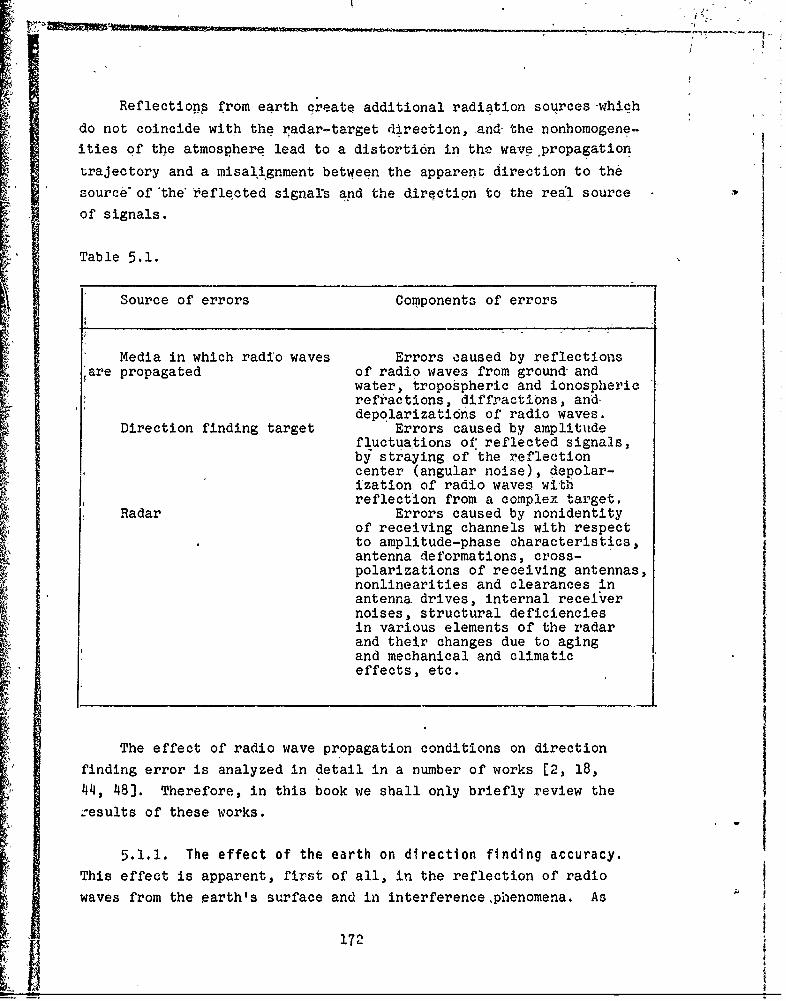
Reflectionp from earth create additional radiation sources -which
do not coincide with the xadar-target direction, .and the nonhomogene-
ities of the atmosphere lead to a distortion in the wave propagation
trajectory and a misal*gnment between the apparept direction to the
source of the- teflected signars and the direction to the real source
of signals.
Table 5.1.
Source of errors Components of errors
Media in which radio waves Errors caused by reflectionsare propagated of radio waves from ground and
water, tropospheric and ionosphericrefractions, diffractions, and-depolarizations of radio waves.
Direction finding target Errors caused by amplitudefluctuations of reflected signals,by straying of the reflectioncenter (angular noise), depolar-ization of radio waves withreflection from a complex target.
Radar Errors caused by nonidentityof receiving channels with respectto amplitude-phase characteristics,antenna deformations, cross-polarizations of receiving antennas,nonlinearities and clearances in
antenna drives, internal receivernoises, structural deficienciesin various elements of the radarand their changes due to agingand mechanical and climaticeffects, etc.
The effect of radio wave propagation conditions on direction
finding error is analyzed in detail in a number of works [2, 18,
44, 48]. Therefore, in this book we shall only briefly review the
.results of these works.
5.1.1. The effect of the earth on direction finding accuracy.This effect is apparent, first of all, in the reflection of radiowaves from the earth's surface and in interference,phenomena. As
172'

can be seen from Fig. 5.1, the radiated antenna energy falls on the
target along two different paths: the direct path from the radar
to the target and after reflection from the earth's surface. The
reflected waVe can be considered direct radiation of a fictitious
source which is a mirror -flection of the real source. The amount
of resulting-signal strei Jh at the reception point will be determined
by the-amplitude and phase relationships of the direct and reflected-signals and will reach maximum when they are cophased and minimum
-when they are antiphased.
Due to the effect of the reflecting surface, a one-lobe radar
radiation pattern in the vertical plane is transformed into a multi-
lobe pattern- (Fig. 5.2). Because of this multilobe nature the-quantity of equisignal zones in the direction finding characteristic
of the system is accordingly increased and false equisignal directions(ESD) appear, located at different angles to the main equisignal
direction. In a number of cases false ESD will fulfill the conditionsof stability and then automatic target tracking with considerable
angular errors is possible. The main equisignal direction with this
also can be displaced [82, 132].
(3)
P/M ~(4-0.)KI.011
Fig. 5.1. Radio wave propagation over a flat reflecting surface.KEY: (1) Radar; (2) Direct wave; (3) Target; (4) Reflected wave.
Direction finding error will also increase because of the factthat during the target's motion the multilobe structure of theradiation pattern changes because of changes in the propagationconditions and radio wave reflection. This leads to variations in
173
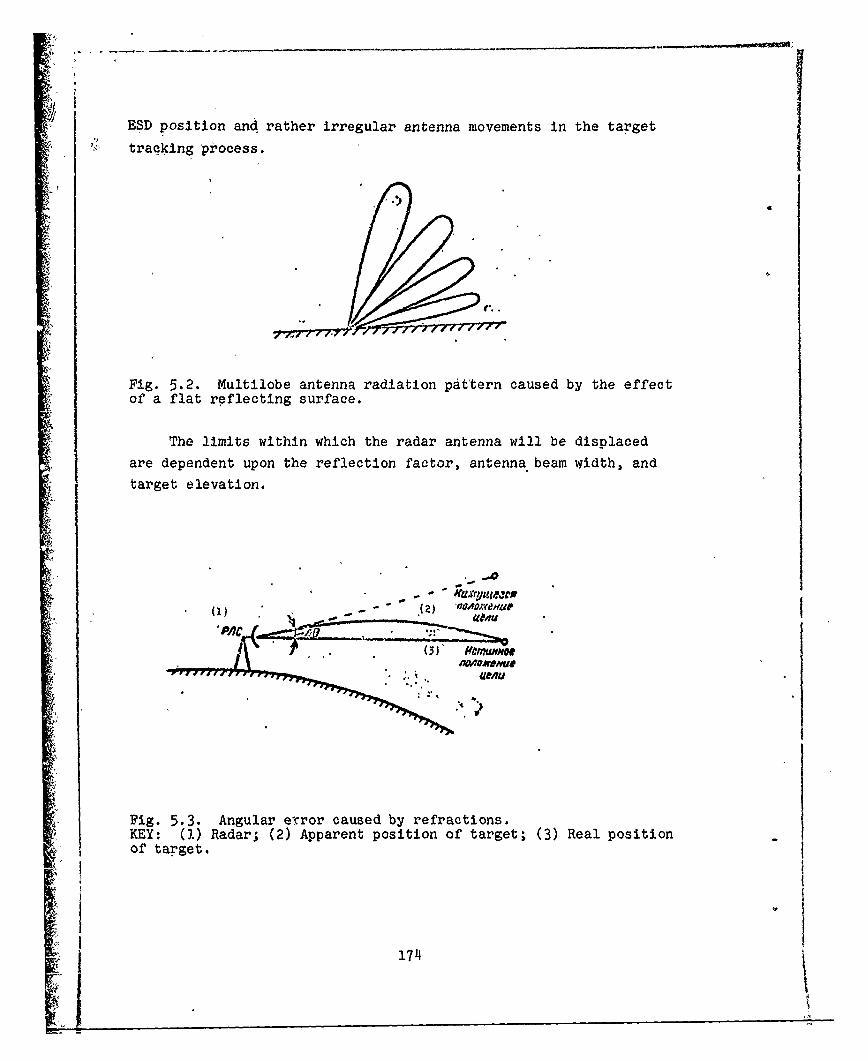
ESD position and rather irregular antenna movements in the target
' tracking process.
4 f..
Fig. 5.2. Multilobe antenna radiation pattern caused by the effectof a flat reflecting surface.
The limits within which the radar antenna will be displaced
are dependent upon the reflection factor, antenna beam width, and
target elevation.
PA J"- (3) Oacf#fjtw
Fig. 5.3. Angular error caused by refractions.KEY: (1) Radar; (2) Apparent position of target; (3) Real positionof target.
1 174
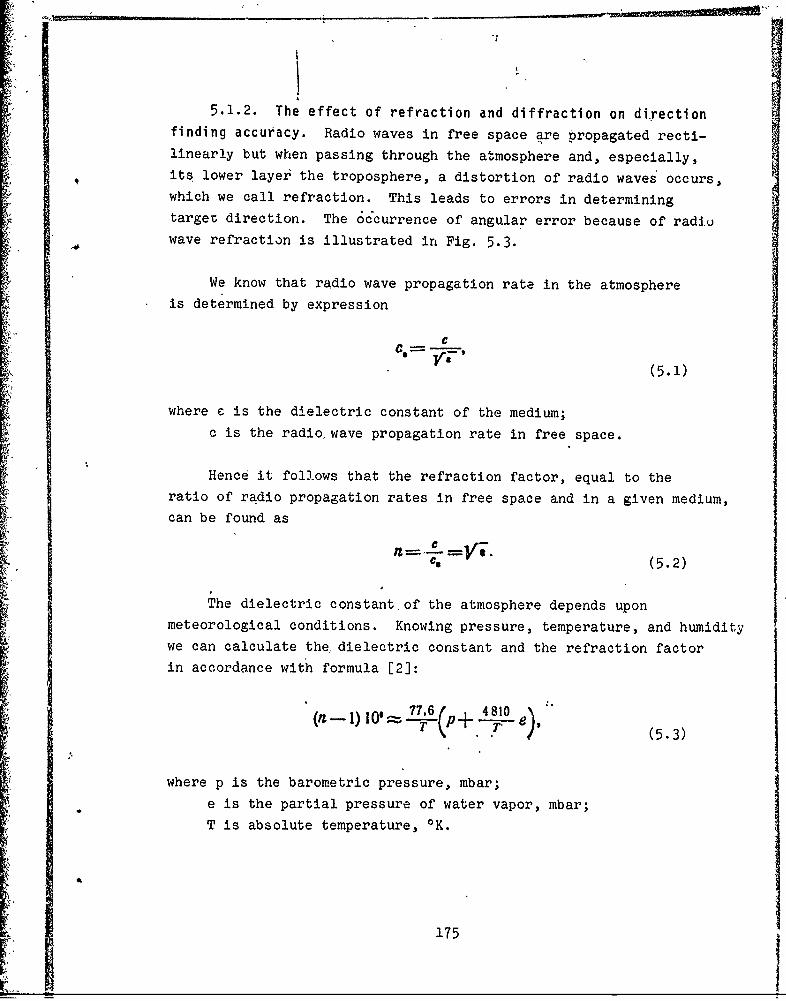
5.1.2. The effect of refraction and diffraction on directionfinding accuracy. Radio waves in free space are propagated recti-linearly but when passing through the atmosphere and, especially,its lower layei the troposphere, a distortion of radio waves occurs,which we call refraction. This leads to errors in determiningtargeu direction. The occurrence of angular error because of radiuwave refraction is illustrated in Fig. 5.3.
We know that radio wave propagation rate in the atmosphereis determined by expression
C
(5.1)
where c is the dielectric constant of the medium;c is the radio, wave propagation rate in free space.
Hence it follows that the refraction factor, equal to theratio of radio propagation rates in free space and in a given medium,can be found as
I (5.2)
The dielectric constant of the atmosphere depends uponmeteorological conditions. Knowing pressure, temperature, and humidity
we can calculate the, dielectric constant and the refraction factorin accordance with formula [2]:
(n 1) 10 (.6 + e)- IT (5.3)
where p is the barometric pressure, mbar;e is the partial pressure of water vapor, mbar;T is absolute temperature, OK.
175

! I
28
'20 _ _ - Fig. 5.4. Errors in measuring, _a • elevation in the lower atmospheric-
it - layers with a humidity of 100%o V (sc!Lid line) and 0° (dashes).
4j I,
002 23 4'5Cv
Since these parameters of the atmosphere change substantiallywith altitude, the greatest radio wave refraction occurs in the
vertical plane. In the horizontal plane refraction ghenomena~appear
to a considerably less extent than in the vertical glanel.
The effect of refraction on direction meadurement accuracy can
be evaluated by the refraction angle, by which we mean the anglebetween the straight line connecting the radar and the target andthe tangent to the radio wave propagation trajqctory at the point
under study. Figure 5.4 presents the calculated dependence [18]
of elevation error measurement (A8) in the lower layers of the
itmosphere on the flight altitudeiof the target' (H) and the slope
of the radar antenna beam (8). As is seen from the figure, the
greatest direction finding errors are noted with low target elevations.
In spite of the fact that the amount of dire6tion finding
error due to refraction is not great and is usually expressed byunits of angular minutes, it should be taken into consideration
in precision radars and compensated by .introducing the propercorrections. The amount of correction, as a rule, is determine'd by,
the experimental method for each region involved.
Diffraction consists of the property oX radio waves to bendaround the curved surface of the earth, similarly to lighttwaves..
Because of diffraction the detection zone can be extended beyondthe horizon. Since this phenomenon is connected with thp distortion
176S, I III

VV
of the radio wave propagation trajectory, as is refraction, targetI |
direction errors are also possible because of diffraction. However,I !
the ability of'electromagnetic waves to bend around earth, 's surface
depends upon frequency and with an increase in frequency this ability
ra~idly.lessens. Waves of the centimeter range have low diffraction
labilftýy Sincelmodern radars are predominantly of the centimeter
range,, the effect of radio wave diffraction or. direction finding
accuracy can be disregarded in the first approach.
§'5.2. THE EFFECT OF AMPLITUDE AND ANGULARFLUCTUATIONS IN REFLECTED SIGNALS ON DIRECTION
Sx FINDING ACCURACY
By fluctuations of signals reflected from a target we mean alarge group of interference phenomena which occur during the irradia-tion of an object of complex form whose dimensions considerably
exceed operating wavelength.:
,Modern monopulse radars operate generally in the centimeter
and decimeter ranges and target dimensions can be hundreds of wave-
lengths; therefore, the interference pattern of secondary .target
radjation is rather complex land noticeably changes with smallvariationq in target positions, generating fluctuations of signals
reflected from tbhe target.
SDetailed studies have showi1 that the fluctuations of reflected
signals can be divided into groups: fluctuations of reflected
signals In amplitude and fluctuations of approach angle. These
fluctuations differ both in nature and in the mechanism of the effect
on radar instruments. 1
5.•..1. The effect of amplitude fluctuations on direction
finding accuracy. Amplitude fluctuations appear in amplitude varia-
tions from pulhe to pulse and are produced by fluctuations of the
' effective rbflecting surface of the target due to its m.vement in
space and change of position relative to the radar irradiating it,
and also by fluctuations in the atmospheric nonhomogeneity,including those caused by variations of meteorological conditionsSI I4on the path of radio wave piopagation.
I,177

DIO-
0 * 8" 12 " 20f 0 20 40 6080 80
Fig. 5.5. Fluctuations spectrum Fig. 5.6. Fluctuations spectrumfor signals reflected from air- for signals reflected from ship.craft.
Depending upon the type of target, the spectral composition ofamplitude fluctuations can change considerably, which is apparent,for example, from the standardized spectral densities of amplitudefluctuation for signals reflected from an aircraft and a ship, pre-sented in Figs. 5.5 and 5.6, respectively, [18].
Since the monopulse method, in principle, makes it possible todetermine angular coordinates with one pulse, and within the pulsethere are no amplitude fluctuation,;, we might expect that directionfinding error in monopulse radars could not be affected by amplitudefluctuations of signals. But this is not the case, Actually,amplitude fluctuations of the reflected signals have a disturbingeffect on monopulse radars although considerably less than they doon radars, with conical scanning or sequential beam switching.
This is explained first by the fact that contemporary monopulseradars do not use their potential capabilities for fast action butextract the angular target information from a series of sequenti-l
pulses. In order to eliminate the effect of the level of approachingsignals on the quantity of angular error, signals are standardizedusually with the aid of an AGC system operating on the sum signal.Since the AGO system has a finite bandwidth and, consequently,limited high-speed action, signal standardization proceeds with a
178
delay. This makes the error, signal, to a certnin extent, dependent
upon the amplitude oT signals received and it is modulated by the
amplitude fluctuations of the signals.
Amplitude modulation components of the error signal, withfrequencies lying within the bandwidth of the radar's servosystem,
inevitability cause an increase in .dynamic direction finding errors.
In order to eliminate the effect of amplitude fV tuations in the
reflected signal on direction finding accuracy' , AGC system must
be fast-acting and capable of, at least, suppressing amplitude
fluctuations whose spectra lie within the bandwidth of the servo-
system. However, as will be seen later, the widening of the half-
band of the AGC system leads to an increase in angular errors, caused
by other sources and, particularly, &igular noise. Therefore, the
selection of AGC passband is a compromise.
The effect of the AGC system on angular errors caused by
different sources is examined in greater detail in § 5.6.
5.2.2. The effect of angular fluctuations in reflected signals
on direction f'inding and accuracy. By angular fluctuations we mean
fluctuations in the approach angle of signals reflected from the
target [5]. That such fluctuations exist in the reflected signal
was established during the development and testing of the first
monopulse radars [19].
In subsequent theoretical and experimental works it was
cetablished that angular fluctuations of signal (angular noise)
are generated. by fluctuations in the slope of the phase front of
the wave. Since the work of any direction finding system for small
targets is based on determining the position of normal to the phase
front of the radio waves, variations in the position of the phase
front during direction finding are one of the limitations on the
accuracy of various angle-measuring coordinators, ir~iluding those
working on the monopulse method. This also pertains, to a certain
extent, to the case of direction finding with extended targetsalthough, in this case, there is no complete correspondence between
179
F
equisignal direction of the radar antenna and the direction of the
normal to the phase front (see Section 5.2.3).
The appearance of angular noise is connected with the change
in the apparent position of the target relative to its physical
center. The reason for it lies in the multipoint structure of thereflecting surfaces of an extended target, causing the straying(flickering) of the reflection center both within the geometric
dimensions of the target and beyond. Considering the universalityof the action of angular noises, let -us pause on their nature formore detail. With this aim in mind, we should examine the formation
of a phase front by a target consisting of a set of reflected points.For simplicity, in the beginning let us examine a target consistingof two Isotropic spaced point sources of signals.
A two-point target provides a visual method of representingthe- nature of angular noises and gives an approximate example ofthe form of such targets as, for example, a small interceptor withtanks on the wingtip or a group of targets consisting of two air-
craft spaced at an angle within the width of the radar's antennaradiation pattern, i.e., resolvable with respect to angle.
The examined model of a target also describes quite well thephenomenon observed when tracking targets at low elevations, when)-in addition to the actual target, the radar also observes its
mirror image because of the effect of the earth's surface.
The phase front of the wave, as you know, is a locus of points
of space with identical phases. Therefore, to find the phase frontfrom a two-point target, It is sufficient to find an expression
defining the phase of the resulting signal for any point of space
and equate it to a constant quantity. Then the found equation
determines the position of the phase front relative to the two-point
signal source.
180
• mlm m-m ---'-- • .- • ...

-ic- L L
Fig. 5.7. Geometric relationships of a two-point signal source.
KEY: (1) Source 1; (2) Source 2.
With this aim, let us assume that the distance between point
sources is L and the points are omnidirectional radiators with
fixed phase shift (Fig. 5.7). At a distant point of space 0 with
polar coordinates R and P, the :'adiators create field strength
E , ( t E . e x p i at • -s i n ,(
5 4
S(5 .4)
E.. (t) .expi(t _2R "2tL sin+ a) (5.5)
Phase shift between these oscillations is determined by the
phase angle a and the difference of path L sin ' depending uponthe direction to point of reception. On Fig. 5.8 the signals ofthe radiators are represented in vector form. The strength of theresulting field can be expressed as
(5.6)
The phase angle of the resulting signal ¢P(*) relative to the
reference signal, corresponding to the direction passing throughthe middle of the distance between sources, can be found as anangle ghose tangent is equal to the quotient from the division of thesum of the vertical component of two vectors by the sum of their
181

horizontal compo6ents, i.e.,
s'lk. - '4i11 (t. + 21oi() - arct' +it (5'7)
where
Assigning a constant phase to the resulting field in expression
(5.6), we can obtain &he relationship between R and 1, which is the
equation of the phase front in polar coordinates:
(5.8)
E,
//
Fig. 5.8. Vector diagram of signals received from a two-iooint source.KEY: (1) Reference line.
When n - 0 the equation of the phase front assumes the form
2R= 11, ('+.T- (5.9)
Figure 5.9 represents the calculated and experimental image
of the pha3e front of waves caused by the presence of two point
sources of signals of equal magnitude [97]. The experimental pattern
of the phase front was obtained with an ultrasonic tank with the
same relative phases, amplitudes, and distance between sources.
A comparison of these diagrams shows that there is an almost complete
analogy between the calculated and experimental data.
182
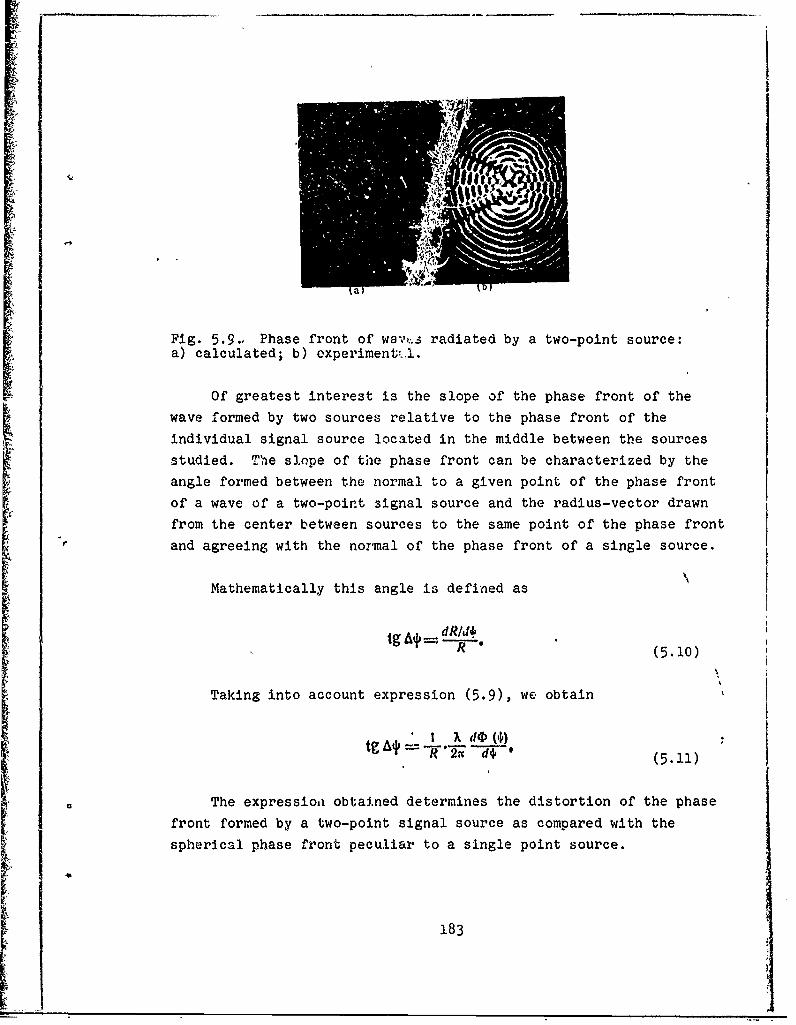
II
Fig. 5.9.. Phase front of wa;'e..s radiated by a two-point source:a) calculated; b) experiment i.
Of greatest interest is the slope of the phase front of the
wave formed by two sources relative to the phase front of the
individual signal source located in the middle between the sources
studied. The slope of the phase front can be characterized by the
angle formed between the normal to a given point of the phase front
of a wave of a two-point signal source and the radius-vector drawn
from the center between sources to the same point of the phase front
and agreeing with the normal of the phase front of a single source.
Mathematically this angle is defined as
dRld+4tg a+= dR/--g -" I(5.10)
Taking into account expression (5.9), we obtain
I d* (5.11)
The expressioni obtained determines the distortion of the phase
front formed by a two-point signal source as compared with the
spherical phase front peculiar to a single point source.
183
Differentiating (5.7) with respect to i and substituting it in
(5.11), after simple transformations we obtain
tg~j' =~-I-as'!+aI.+2&cos T-StfnI++) (5.12)
where R cos € = is the angle of source sighting (angle base).
If Aý is comparatively small, tg A*i A* and
__ 1 -a'
"•= 2[1 + as-+-2acos(!'sln +a)j (5s13)
When ' = 0, when the base of the sources is located perpendicularly
to the direction to reception point, formula (5.13) is simplified:
' A¢ l-a'
" 2 (1 + a2+ 2a cos "(5.14)
From expression (5.14) it follows that distortion in the phase
front of the wave caused by the two-point structure of the target
depends upon the relationship of signal amplitudes and phase shift
between them and is maximum when they are in opposite phase (a = 7r)
and signal amplitudes (a = 1) are equal.
Generally when the case of reflected signals from a two-point
target is considered, amplitude and phase relationships of the signals
fluctuate which causes a fluctuation in the slope of the phase front
of the wave reflected from the target. Variations in the slope of
the phase front, in this case, are conveniently carried out by the
probability method when the probabilities of errors exceeding a
certain level are determined. For simplicity let us assume that
there are no amplitude fluctuations and the phase shifts of reflected
signals are distributed with equal probability in the range from
-W to n.
184
From the theory of random processes we know [34] that the
probability of errors exceeding a certain level M is determined
by expression
P(M)= w(M)dM,(5.15)
where W(M) is the probability density of random quantity M
M [-r, KC = max] is the maximum possible error.
In this case
where W(a) is theprobability density of the phase shift of the signals,
equal to 1/2n in this case.
Solving equation (5.15) relative to a, we find
a- arccos -'-2M (I + a2) (5.17)UaM
Hence after simple transformation we obtain
M;/ -1 + 4.41 (1 + a51(l--al) -- 4A1' ( .
When calculating (5.15), we shall use the tabular integral
[17]V r dx
r --a~ 2 + Ibx- ajp-arcsiu n ±~.
(5.19)
where R a + bx + cxs.
185
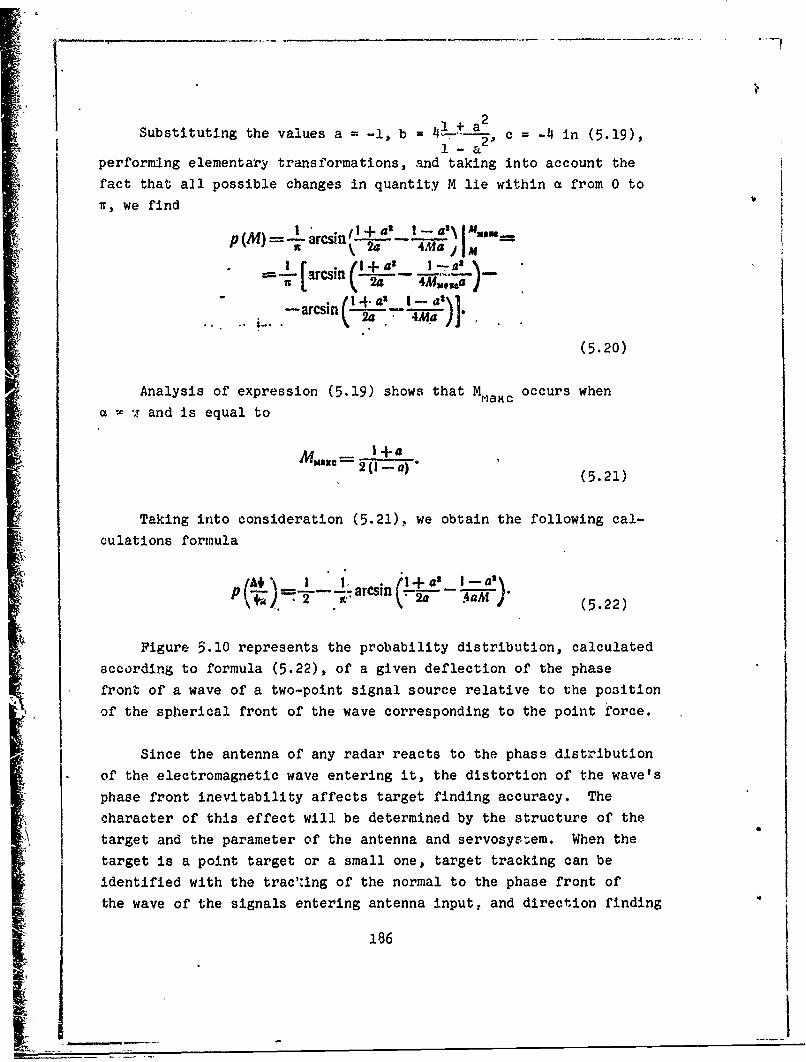
41+ a 2
Substituting the values a -1, b = .. c 4 in (5.19),
performing elementary transformations, and taking into account the
fact that all possible changes in quantity M lie within a from 0 to
it, we find
I I•! + aa' -- a IiP(M -- r-arcsinL+- as -_ -I :"=•, , ,,
M I • 1 +42=y [,rein (• -4M..al-"a----
(5.20)
Analysis of expression (5.19) shows that MmaKC occurs when
a %T,, and is equal to
M� 2 (I-a)" (5.21)
Taking into consideration (5.21), we obtain the following cal-culations formula
/ A & \ ' " 1 +' 1 ak-•j -. [--- arcsin 2a' |-aM
"- c -- -- 4at), (5.22)
Figure 5.10 represents the probability distribution, calculatedaccording to formula (5.22), of a given deflection of the phasefront of a wave of a two-point signal source relative to the positionof the spherical front of the wave corresponding to the point force.
Since the antenna of any radar reacts to the phase distributionof the electromagnetic wave entering it, the distortion of the wave's
phase front inevitability affects target finding accuracy. Thecharacter of this effect will be determined by the structure of thetarget and the parameter of the antenna and servosys.em. When thetarget is a point target or a small one, target tracking can beidentified with the trac1:ing of the normal to the phase front of
the wave of the signals entering antenna input, and direction finding
186
K

~17
error will be determined by expression (5.14). In accordance with
this, if the frequency spectrum of phase fluch*ations in the signals
received does not exceed the bandwidth of t radar servosystem,
which is the case when tracking slowly .ioving (or immobile) targets,
the calculated curves in Fig. 5.10 enable,,us, with fixed ratios of
signal amplitudes, to determine the pzcbability of obtaining direction
finding errors exceeding the pres3cribed quantity. Thus, for example,
the probability of angular deviation in the ESD from the direction
to the centers of the base of the sources by a qaantity equal to the
base, when a = 0.6; 0.8 and 0.95, is approximately 17, 14 and 7%)
respectiv.!y. When a = 0.2 the probability of obtaining an error
exceeding the base of the sources is zero.
* (~~)( 'G 44 fl9 Of U-i0 *
7S•° gl XI\ - .\ L | .**l~
Fig. 5.10. Probability distribution of phase front error withvarious ratios of reflected signal intensity.
Table 5.2.
a 0. 5 0A 0i8 0J6 0.4 0,52 0,12.2 1. 6 10, aIo 1 0.6 0,5 05
187

, I
If we know the law of probability dens~ity distribution W(M),
we can calculate standard error. For the case under study, table
5.2 presents" the calculated dependences of standard direlction finding
errors, standardized- with respect to the value of the source.base
for various ratios of reflected signal amplitude for a two-point .1
target £18].II
If' the spectrum of phase fluctuations in signals from a two-,
point target exceeds the bandwidth of the direction finder's servo-
system, the error calculation method changes. In this case, En
seeking the expression determining the condition for target tracking,
it is necessary to average beforehand the signal received, in
accordance with its statistical characteristic and the time lag of,
the servosystem.
We should mention that it is valid to identify the bearing with
the direction of the normal to the face front of'the resulting
reflected signal only with linearization'of the directibn finding
characteristic for the radar. The latter Is permissible during the
direction finding of small and point targets when angular'deviations
of the radar antenna axis from the direction to the geometric center
of the reflected signals are small. I
With large angular dimensions for the target being tracked, it.
is necessary to take into account the actual antenna radiation
patterns. With this aim, let us examine,,in general form, the direction
finding of a complex extended target. 1
5.2.3. Errors and the direction finding of targets'o,f complex
form. In 4st practical cases the target cannot be tepresented in
simple geometric form convenient for a mathematical description.
Therefore, in analyzing the direction finding errors involved with
a complex target, we replace the actual target with, certain models.
As such a model we usually use a multipoint target when the reflected
signal from the complex target is a collection of reflections1 from
a 6et of point targets characterizing the main reflecting elemnts
I I
-- i
S~~188 1
'7-77--

I I
i of the actual complex target [38). It is, dssumed that amplitudes
and- phases of signals reflected from each point target are mutually
7 independent' .
For simplicity let us e.amine the ,direction fi.nding 'of a complext a g t i i n ! s t t i
target. in one planl in static conditions. Let the complex targetbe §um M of elementary reflectors. Then the signal rflected from
the complex target, is defined as the sum of the signals of the!. .
)elementary reflectors
I ** ": .. '(1) • Eexpi(+t -70,)=1" •(5.23)
~I,where Em is theamplitude of the signal from the m-th reflector;
¢m is the phase of the signal from the m-th reflector.
In accordance with this, at the output of the first and second
antenna channel of an amplitude'sum-difference monopulse system the
reflected signal of a complei target can be represented by expression
E1'(t,0) ~ mF (0,- Om)exp i (cot+s41 (5.24)
I
M, , _Ea(t.0)--- ,•,,,F•(0o+om,) OXp i(~t +?r,), (5. 25)
where 6m is the angular position! of the m-th source relative to
j equisignal direction.'
Wijth sum-difference .signal procdessing at the output of the sum
and difference channels, respectively, we obtain
", ' " ,.=•(5.26)
I M*~ * i=1 (5.27)
189
II I

where
PC (6) =F (08, a,) +'F (60 + 0m)4, (0) = FP (0° - 6M- (06 + 0M).
If the phase detector is of the mult'plying type and the
amplifier channels amplify without distortion, the standardized
output voltage of tne phase detector, as we know, is determinedby expression
S () R yE;( ) &Ep (, )Eto y) ts, 0t6) (5.28)
Substituting into (5.28) expressions (5.26) and (5.27), weobtain
M MRe • Y. .~Fo,. (6) Fp, (0)-.Xp ('3t+?.) XRe
S (0) -- M" "n=
pq .n CM(6) &° (0) exp I (ot + X. ,.,,,,
;- • - =!n:= ....
' •. ' ~...Yexp--it(Qft +,)
Xexp-(cat+a-) -'
M Ai
E E E. IF (Of - .) F (o°- O) -
AtIM
V •l ",IF,,F (is - B.) F (o.- 0.) +.m=! i-=R
F (20 + 0,.) F (Of + 0.)1 Cos (,I. -+F to,+ om) F (6$+ o)H Cos (n -- ) (5.29)
Given the proper approximation of the antenna radiation patterns
and equating the enumerator in expression (5.29) to zero, we can findthe condition of servosystem equilibrium with the reception of signalsfrom the given set of point radiators of a complex target and,consequently, the position of the point to be tracked by the radar
system. Comparing the position of the point of equilibrium with the
190
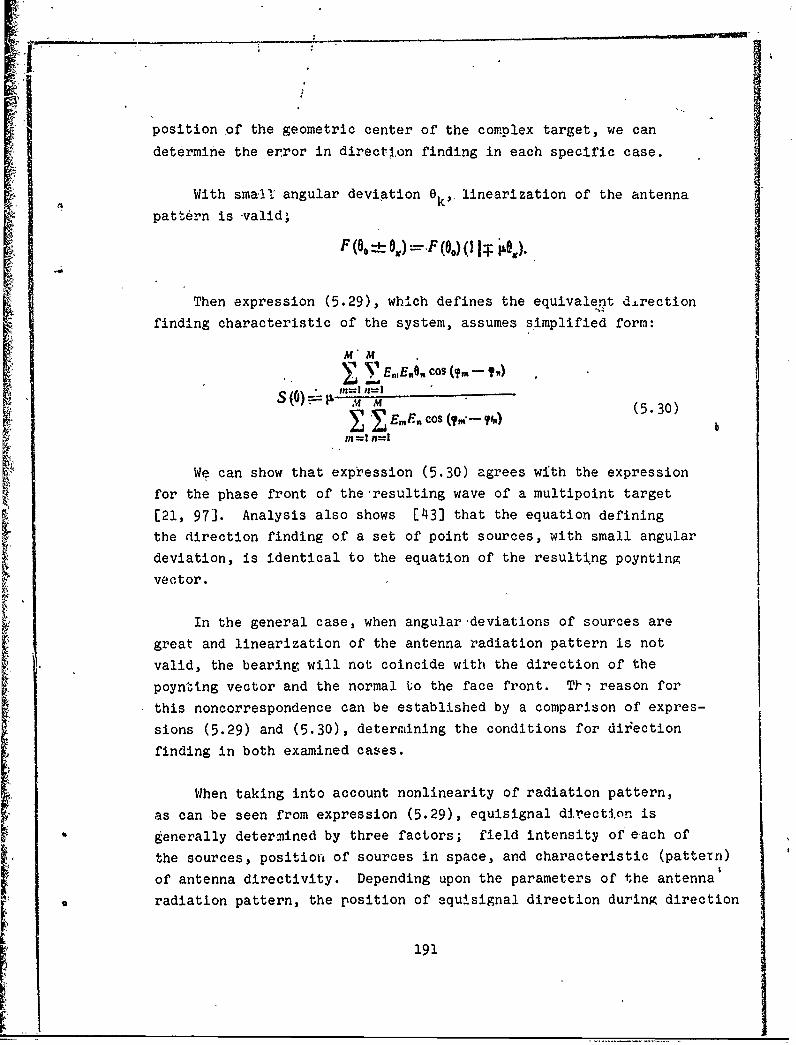
position of the geometric center of the complex target, we candetermine the error in direction finding in each specific case.
With smamll angular deviation ek" linearization of the antennapattern is-valid',
Then expression (5.29), which defines the equivalenut d.Lrection
finding characteristic of the system, assumes simplified form:
S 0 n=l n=1" M (5.30)
YJ Em =1 n=1
We can show that expression (5.30) agrees with the expression
for the phase front of the resulting wave of a multipoint target
[21, 97]. Analysis also shows [43] that the equation defining
the direction finding of a set of point sources, with small angular
deviation, is identical to the equation of the resulting poynting
vector.
In the general case, when angular-deviations of sources are
great and linearization of the antenna radiation pattern is not
valid, the bearing will not coincide with the direction of the
poynting vector and the normal to the face front. T) reason for
this noncorrespondence can be established by a comparison of expres-
sions (5.29) and (5.30), determining the conditions for diiection
finding in both examined cases.
When taking into account nonlinearity of radiation pattern,
as can be seen from expression (5.29), equisignal direction is
generally determined by three factors; field intensity of each of
the sources, positiou of sources in space, and characteristic (patteyn)
of antenna directivity. Depending upon the parameters of the antenna
radiation pattern, the position of equisignal direction during direction
191
finding of a complexý target can vary. This leads to correspondingvariations in di-reccion finding error. As for the ttosition of the
poynting vector, which, cdn be determitned by expression (5.30), it
does not depend upon the re'"ar antenna radiation pattern and is
determined only by the ino ~asities and special arrangement of the
sources. Therefore, when direction fiiiding with extended targets,
where the angular d'imensions exceed the linear part of a direction
finding characteristic, noncorrespondence is inevitable between the
bearing and the dIirection of the poynting vector (normal to phase
f)ront). This noncorrespordence is greater, the greater the target
dimension and the narrower the antehna radiation pattern.
Under actual conditions, amplitude and phase relationships for
signals from a set of sources changes during direction finding accord-
ing to random law, while generatiig angular noise and direction
`inding error fluctuation. The calculation of errors, in this case,
should be performed taking into account the spectral composition of
angular noise, theparameters of the AGO system, and the bandwidth of
the servosystem.
Basic conclusions witn respect to complex target direction
finding by an amplitude monopulse sum-difference system can be extended
to monopulse systems of other types, as well as systems with conical
beam scanning,[38].
Taking into account the sphericity of phenomena connected with
the nature of target noises and the importance of thei:- examination
during the evaluation of the adcuracy of monopulse radar systems,
we shall pause briefly on measurement methodology and target noise
analysis.
5.2.4. Measurement methodology and target noise analysis.
Angular noises cannot be detected by a simple observation of reflected
signals from a target of complex form and, in order to measure them,
it is necessary to develop special methods.
192
~q,
As an example we shall examine experimental studies on fluctua-
tion in a signal reflected from a target,, presented in reference
[19]. The studies were carried out with a modernized pulse radar
of the Mk-50 type, under conditions of automatic aircraft tracking.
The modernization of the radar consisted of using a double set of
receivers, operating on one antenna. One of the sets was used for
autotracking in the passive target finding mode on signals from a
responder beacon installed on the aircraft, and the other for tracking
the target on reflected signal.. The servosystem of the latter set
was released and did not participate in guiding the antenna to the
target to be tracked.
The first set of the equipment made it possible to measure
rather accurately the direction to target under the condition ofno angular noise. Fluctuations of error signal at output of this
set were caused only by the regular errors of tracking a virtually
unfluctuating signal source. The second set had the capability of
measuring error signal with angular and amplitude noises taken into
account on the signals reflected from the target. By measuring-,
voltages at error sign)al detector output and subtracting one result
from the other, we can obtain the voltage whose value is proportional
to angular error, between directions to true and apparent target
position.
Amplitude noise was measured by recording instantaneous. oscil-
lations in the level of signals reflected from target relative to
average level. Since accurate determination of statistical quantities
necessary in target noise analysis requires a very large amount of
data, a magnetic record of errors was used with the subsequent
reproduction and processing of it by special analyzers.
The block diagram of the recording device and error signal
reproduction is illustrated in Fig. 5.11. To excluae the difficulty
of direct magnetic recording of subsonic signals, amplitude modula-
tion by a higher-frequency carrier signal was used. Reoording rate
was 12.7 mm/s; playback. rate, 380 mm/s.
j193

TI!
•1(b1
noises; b) for reproducing them.
KEY: (,1) Sonic generator (100 Hz); (2) Monitor; (3) Subsonic noisesource (0.5-10 Hz); (1) Amplitude modulator; (5) Tape recorder; (6)
Tape recorder; (7) Linear detector; (8) To analy~ers.
((8)
Fig. 5.12. Block diagram of equipment for analyzing noise power
spectrum distribution: 1 - main spectral analyzer; 2 - integrator(R =s20 k, C = 50 F); 3 - recorder; te - cam drive o analyzer for
linear scan.KEY: (0) F-rom magnetic recorder; (2m Scale.
The block diagrams of equipment for analyzing noise power
spectrum distribution and amplitude distribution arze presented in
Figs. 5.12 and 5.13. The curve at distribution analyzer output
directly indicates amplitude distribution density.
194

po, alprO&emue
~ tr~qy,7a~tR7?Pof a3gepmmiutj (2)S(1) •
es(b)
(3)
8pe~~4) 5) flMHom,#cb 6
Fig. 5.13. Block diagram of the installation for analyzing amplitudedistribution (a) and a sample of the working graph (b)! 1 - amplitudedistribution analyzer; 2 - integrator (R = 100 kQ, C = 50 pF); 3 -
recorder.KEY: (1) Increment of voltage measured by amplitude distributionanalyzer; (2) Direction of scan; (3) Amplitude; (.4) Time; (5)Probability density; (6) Amplitude.
OAA
0 100 200 300 's400 Oaeg
Fig. 5.14. Sample of recording of typical angular noise spectrumfrom aircraft.
An example of a recording of the angular target noises spectrum
is presented in Fig. 5.14. Since, with reproduction, there occurred
a broadening of the frequency spectrum by a factor of 30, the actual
spectrum of noise components is obtained by dividing the scale along
the axis of abscisses (Fig. 5.14) by 30. The jaggedness of the
spectrum is caused by the insufficiently completed time integration
of the reading period and can be ignored in analysis. The spike
at the end corresponds to calibration signal.
195

By means of calibrating the radar station, voltage at detector
output can be expressed in 4uantities of linear target tracking
error. In Fig. 5.14, along the axis of ordinates are the mean values
of noise (expressed in linear units of direction finding error)
obtained at output of the analyzer with bandwidth 4 Hz.
'I
-131,6 -390 -49S 0 ý.S9$ 01,(2) 0OwuMf C-1VWt0A1WreNUR,
Fig. 5.15. Probability distribution of noise amplitudes plottedaccording to data on angular target noises.KEY: (1) Probability density; (2) Tracking error, m.
Interpretation of the curves of angular noise amplitude distri-
bution is relatively simple. Plotted in units of linear errors,
the angular noise amplitude distribution curve enables us to evaluate
the possibility of deviation in equisignal direction beyond the physical
dimensions of the target (Fig. 5.15). As a result of experimental
studies it has been established that the scattering of radio waves
by the target from .wo reflectors, in a number of cases, causes a
deviation of apparent position toward actual position at a distance
several times exceeding target dimensions.
§ 5.3. THE EFFECT OF INTERNAL RECEIVER NOISESON DIRECTION FINDING ACCURACY
The nature of internal noises is varied. The malin reasons for
their occurrence include thermal noises connected with the chaotic
196

of e I• .I"
mot1ofn 'electrons in conductors at temperatures ,not equal to
absolute zero, the shot effect caused by the random character ofthe arrival of electrons at the anode (grid) of electronic tubes
and the passage of the barrier layer in semiconductors, and the
flicker effect caused by the nonuniformity of electron emission in
electronic and semiconductor instruments.
Because of their nature, noises always occur in a receiver
and potentially represent the natural sensitivity boundary and the
achievable measurement accuracy. Being amplified along with the
useful signal, noises, to the same extent, disturb the structure of
the error signal, cause fluctuation in it, and determine the zone of
system insensitivity to the measured parameter.
In order to establish the character of the effect of internal
receiver noises on direction finding accuracy, we shall examine
an amplitude sum-difference monopulse system. In the examination
we shall limit ourselves to the case of direction finding in one
plane by a system with identical receiving channels. Because of the
independence of errors in the receiving channel, such an examination
enables us to Judge errors in two planes of direction finding. Taking
into account the allowances.made, the signals at i-f amplifier output
of the sum and difference channels, with accuracy up to the constant
coefficient, can be presented in the accepted designations in the
form of the following expressions:
UC(t, 0)= JKEMF(00) coswUPt + UL (C, ((5.31)
up(t, 0) •-/2iCEmF (0o) PL0 COS Cnpt + Um p(t), (5.32)
where u c(t), u P(t) are noise voltages at 1-f amplifier output of
the sum and difference channels.
When a monopulse radar is operating in target tracking mode,
the signal/noise ratio in the receiver is usually much greater than
one and the displacement angle is small. This makes it possible to
197
disregard the effect of noises in the sum channel. Then expressions
(5.31) and (5.32) can be rewritten in the form
# Y(t 0) = KE cos + .,
where
(5.34)
Error signal voltage at the output of a multiplication-type
phase detector without taking into account standardization with
respect to sum signal and taking into account the filtration of the
high-frequency components, with accuracy up to the constant"component,
is defined as
S (2)-- + kc'E' + p (t) cos'CEý.SO)= 2(5.35)
The first term of the 6btained expression is the useful com-
ponent determining the displacement angle of the target relative
to equisignal di-rection of the antenna. The second term determines
the interference caused by the presence of internal noises in thedifference channel of the receiver. Obviously the noise component
of the error signal is created only by those frequency components
of the np.ise spectrum which are grouped near the i-f amplifier
tuning frequency and do not differ in frequency more than the band-
width of the servosystem.
For a quantitative evaluation of this component let us find
the spectral density of the error signal determined by the second
term-,(5.35',. We shall use the methodtbased on deteimining the
correlation function -f the noise component of the error signal
[18]R(c)= ,EE'u p (t) ua . (t + c) cos wt Cos Wp (t +C) =
=-t - Rnq (1) C03 .0.(. ,2' (5.36)I 198
where Rn4 () is the correlation function of the internal noises of
the difference channel at i-f amplifier output.
As we know, R (T) can be presented in the form
Ru (C ,)csW't (5.37)
where r(T) is a slowly changing function whose character is determined
by the width and the form of the fre4uency characteristic of the
i-f amplifier.
Substituting (5.37) into (5.36) and taking into account thefiltering of the frequency component.2wnp alt phase detector output,we obtain -
).. (5.38)
Hence we can find the dispersion of error signal fluctuationsat phase detector output
0 R(2)= 2) - E'r( (5.39)
Since r(O) is the dispersion of noise voltage at i-f amplifieroutput, then
Oa 2KEJg2 112 Sw(5.40)
where Af is the effective bandwidth of the i-f amplifier;SW is the spectral power density of noises at i-f amplifier
input.
At output of the phase detector, in an automatic target trackingradar, taking into account standardization during an ideally operating
199
AGC or at standardization circuit output in surveillance radars
(with the same P) we can, write
OK - (5.4.)
Then it reduces to finding the power spectrum of the fluctuation
in the bandwidth of the servosystem of an automatic tracking radar
or in the band of,the smoothing filter (the device for secondaryinformation processing) of a surveillance radar.
From the theory of random processes we know that with noise
amplitude modulation the power spectrum of the process has the
same form as the spectrum of a single pulse, but its intensity is
proportional to the dispersion of noises and the pulse repetition
frequency
(5-42)where g(w) is the spectrum of a single pulse;
Tn is the pulse repetition period.
If we assume that the phase detector operates on the principle
of the so-called key peak detector when voltage at its output during
each pulse repetition period is established practically instantaneously
equal to the maximum value of input voltage and is then maintained
unchanged to the end of the repetition period, after which it abruptly
drops to zero; then the output voltage of the phase detector will
have the form of a pulse with a length equal to the pulse repetition
period Tn and its spectrum can be expressed as
WTI' (5.4p)2
Hence the power spectrum of the fluctuations of output error
voltage Oto
COT (5.44)
200
Since the servosystem is narrow-band, random error will be
caused by only those components of the fluctuation spectrum which
adjoin zero frequency. In this case,
G( 2o'. .(5.45)
Finding the spectral density of error signal fluctuations, we
can find the average value of direction finding error caused by the
effect of internal receiver noises according to formula
S Fcc (5.46)
where AFc c is the equivalent bandwidth of the servosystem or the
smoothing filter.
Substituting into (5.46) expressions (5.41) and (5.45) and
performing simple transformations, we obtain
2S1-- f a Tu&F c
(5.47)7Y P Pp
where P, = S ,AfAFc c is the power of noises in the band of the
servosystem;
Pc 2T is the average power of the signal at receiver output.
As is apparent from. the expression presented, the value of
standard error caused by the effect of internal noises is inversely
proportional to the steepness of the direction finding characteristic
and the signal/noise, ratio at receive.r output.
For a monopulse system with amplitude direction finding, as
shown in Chapter 2, intersection of radiation patterns at the half-
power level is optimal, i.e., whie0 0 e0.5 /2.
201
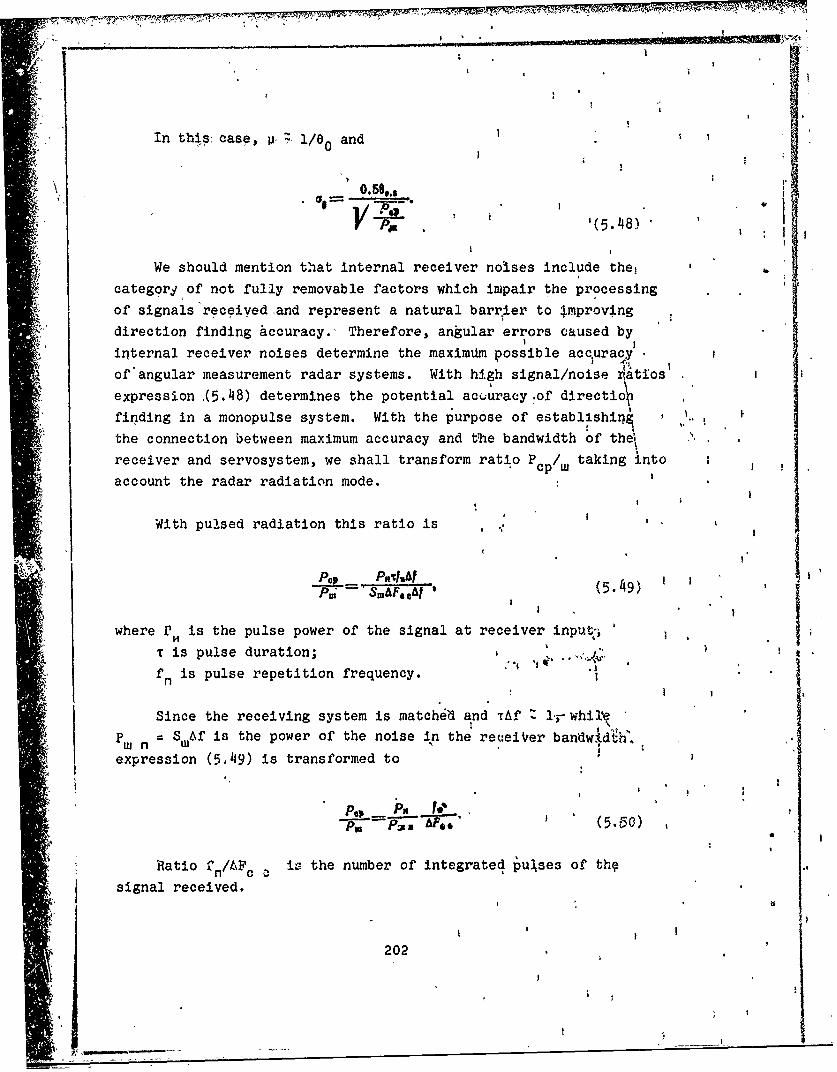
In this- case, j. l/e0 and I
0! I ", "
i ) PP '(5 .48)'
We should mention that internal receiver noises include the,
category of not fully removable factors which impair the processing
of signals'received and represent a natural barrier to Improving
direction finding accuracy.' Therefore, angular errors caused by
internal receiver noises determine the maximUm possible acc.uracy
of angular measurement radar systems. With high signal/noise ýatios
expression (5.48) determines the potential act.uracy .of directio
finding in a monopulse system. With the purpose of establishiq '
* the connection between maximum accuracy and t~he bandwidth of the.
receiver and servosystem, we shall transform ratio P cp/ taking into
account the radar radiation mode. p ,
With pulsed radiation this ratio is I
S, (5.49)
where P is the pulse power of the signal at receiver input-'T is pulse duration;
fn is pulse repetition frequency. *
Since the receiving system is matche• and TAf 1j-WhiJ•
Pw n = S ,Af is the power of the noise in the receiVer bandwldtýh%,
expression (5.49) is transformed to
Ratio f /AFc . iv the number of integrated puJses of thq
signal received.
202
1 4

SWhen the radaris operating in icontinuous radiation mode
"PeP P.'13AF0.
"(5.51).
Consequently,
* ,(5.52)
"where k = -r2 is for a pulsed radar and
I = is for a continuous radar.SI
, Obviously, the higher the coefficient k the higher the maximum
ddlrection finding accuracy of the radar system.I II
We should mention that the' effect of internal receiver noises
on direction finding accuracy in monopulse radars and radars with
conical scanning is sqmewhat different. This was explained by thequantitative difference of the receiver noises, penetrating the serwv-
system bandffdth and the design of a different antenna system. In
a monopulse system where the signals received are not artificially
modulated, from the receiver noise bpectrum only those of frequency
components affect the servosyslem, which ajpear within its doubled
fbandwidth, located symmetrically relati.ve to each frequency component" of the received signal ýpectrum (Fig. 5.16). %
'In direction finding systems with conical scanning the signals
received are mhodulated with respect to amplitude with the scanning
frequency, andithe doubled pass bands of the servosystem, which
determine the parts of the noise spectrum which will affect the
servosystemi are locate'd on both sides of each frequency component
of'the received si nals at the distance 6f the scanning frequency
'(Fig! 5.17). As a result, in systenis with conical scanning, as com-
pared with a monopulse system, there is a doubling of the equivalent
' '203
ibm
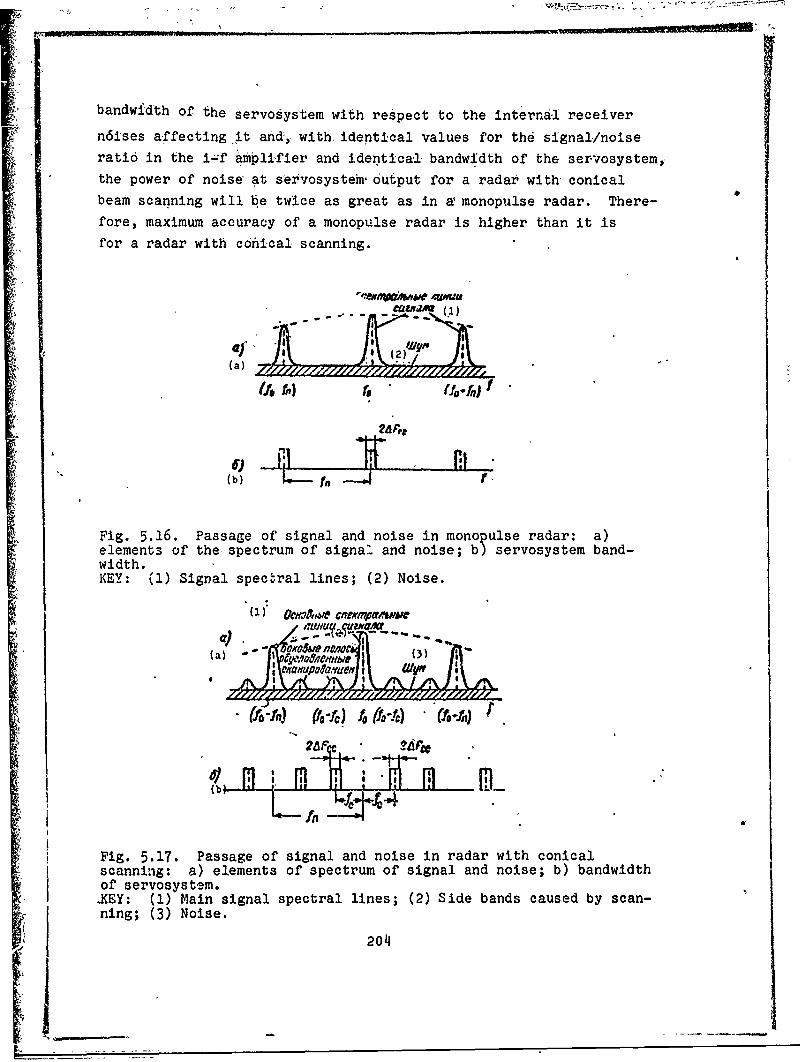
bandwidth of the servosystem with respect to the internal receiver
n61ses affecting .it andý,, with identical values for the signal/noiseratio in the i-°'f amplifier and identical- bandwidth of the servosystem,
the power of noise at servosystem, output for a radar with conical
beam scanning will be twice as great as in a monopulse radar. There-
fore, maximum accuracy of a monopulse radar is higher than it isfor a radar with coniical scanning.
af-a
-All 2)y(a) __"
(f, i,,) $[o[
"(b)
Fig. 5.16. Passage of' signal and noise in monopulse radar: a)elements of the spectrum of signal and noise; b) servosystem band-width.KEY: (1) Signal spectral lines; (2) Noise.
(1z) �O�chv& CfntK/7ntD/M D
-f.6I eouol, gnO4O i I -ot•
% mem
Fig. 5.17. Passage of signal and noise in radar with conicalscanning: a) elements of spectrum of signal and noise; b) bandwidthof servosystem.
XKEY: (1) Main signal spectral lines; (2) Side bands caused by scan-ning; (3) Noise.
204

The advantages of monopulse radars with r~esý,ect to the effectof internal receiver noises on direction find.hg accuracy are alst..
due to the fact that in the tracking process'the target is irradiated
by the maximum radiation pattern and signal losses due to non-agree-
ment of the radiation pattern with the antenna axis, wbich occurs
in radars with conical scanning, are virtually absent. vhis provides
in the receiving channel of a monopulse system a higher signal/noise
ratio than in systems with conical scanning.
Taking into account the higher steepness of the direotion finding
characteristic and the above listed factors enables us to evaluate
the power advantage of a monopulse system with respect to internal
receiver noises during target tracking from a reflected signal of
5.2 dE [4].
?
9- -
3
MIC
Fig. 5.18. The dependence of error in automatic tracking on thegating factor.
At great distances the signal/noise ratio is too low for normal
target tracking and then target losses are possible. Because of
this, the quality of receiver operation, in certain cases, is evaluated
in terms of the loss norm, by which we mean the frequency (number
of times per second) with which tracking error exceeds the maximum
allowable value [44].
205 I

In deriving fofiiula (5.48)i we assumed the pre~enqe of ideal
gating wh~n noises act only during the reception of the useful
signal. If this is the Cabe 'ahd the gating duration exceeds signal
pUlse duration, average errors a. increase. Figure 5.18 presentsa graph showing the depijhdence of tracking error on gating factor
[18), 'by which we mean the ratio, of seledted pulse duealtion to signalpulse duration. As is apparent from the figure, an increase in the
gating factor Can lead to a considelable increase inr tracking errors.
This method of evaluating'tracking errors, valid when Pc/PW >> 1,
can be used also for evaluating other types of monopulse systems.
Analysis shows that tracking errors caused by the effect of internal
receiving noises are of the same order for both phase and amplitudeNoropulse methods of direction finding.
Let us examine the effect of internal receiver noises on direction
finding accuracy in monopulse radars with a phased antenna array,
which "odupies 'a rather unique position in the family of monopulse
direction finders because of the multichannel structure of the angle-
data transmitter.
§ 5.4. ERRORS CAUSED BY RECEIVER NOISES INMONOPULSE RADARS WITH PHASED ATENNA ARRAY
In our examination of errors in determining angular coordinates,
caused by receiver noises in radars with phased antenna array, we
shall assume that a plane wave falls on a linear array at angle 0
to its axis and at the output of each array element (Fig. 2.22)
an ampli'fier is installed [6]. Then voltage at amplifier output
in the k-th channel can be represented in the form
Ug =E,,,cos (cot+ ?on+ AP) + ni,
where o is the reference phase;onA0 is the phase difference in mixed channels
21dp
nk is the noise in the k-th channel.
206
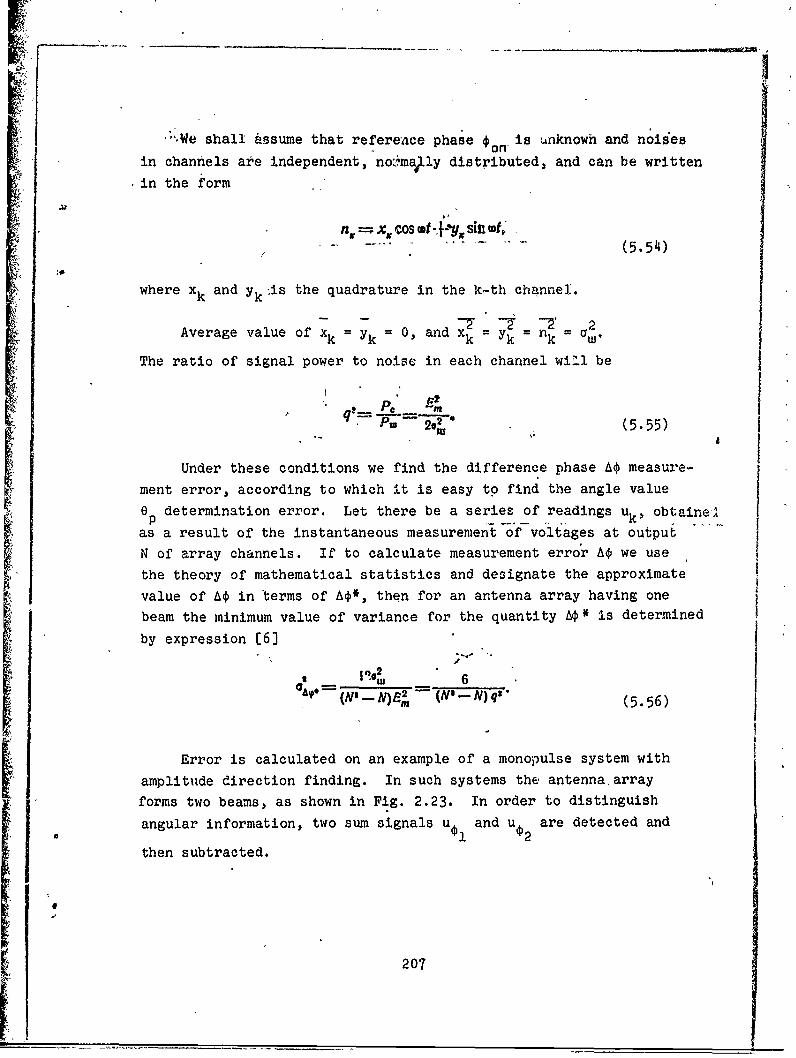
-%.We shall assume that refereace phase on- is unknowh and noises
in channels are independent, no!'ma'Lly distributed, and can be written
in the form
fn,=X, COSM t-'y% Sint,)S. .. .... . .. .. .(5 .54)
where xk and Yk-is the quadrature in the k-th channel.
- ~ 2Average value of xk =Yk = 0, and xk =. = nk= CW.
The ratio of signal power to noise in each channel will be
O (5.55)
Under these conditions we find the difference phase Aý measure-
ment error, according to which it is easy to find the angle value
ep determination error. Let there be a series of readings uk' obtaine',
as a result of the instantaneous measurement-of'-voltages at output
N of array channels. If to calculate measurement error Aý we use
the theory of mathematical statistics and designate the approximate
value of Aý in terms of Aý*, then for an antenna array having onebeam the minimum value of variance for the quantity M'N is determined
by expression (6)
(N N)m (N,-N)q
(5.56)
Error is calculated on an example of a monopulse system withamplitude direction finding. In such systems the antenna arrayforms two beams, as shown in Fig. 2.23. In order to distinguish
angular information, two sum signals u and u are detected and
then subtracted.
I 207
__
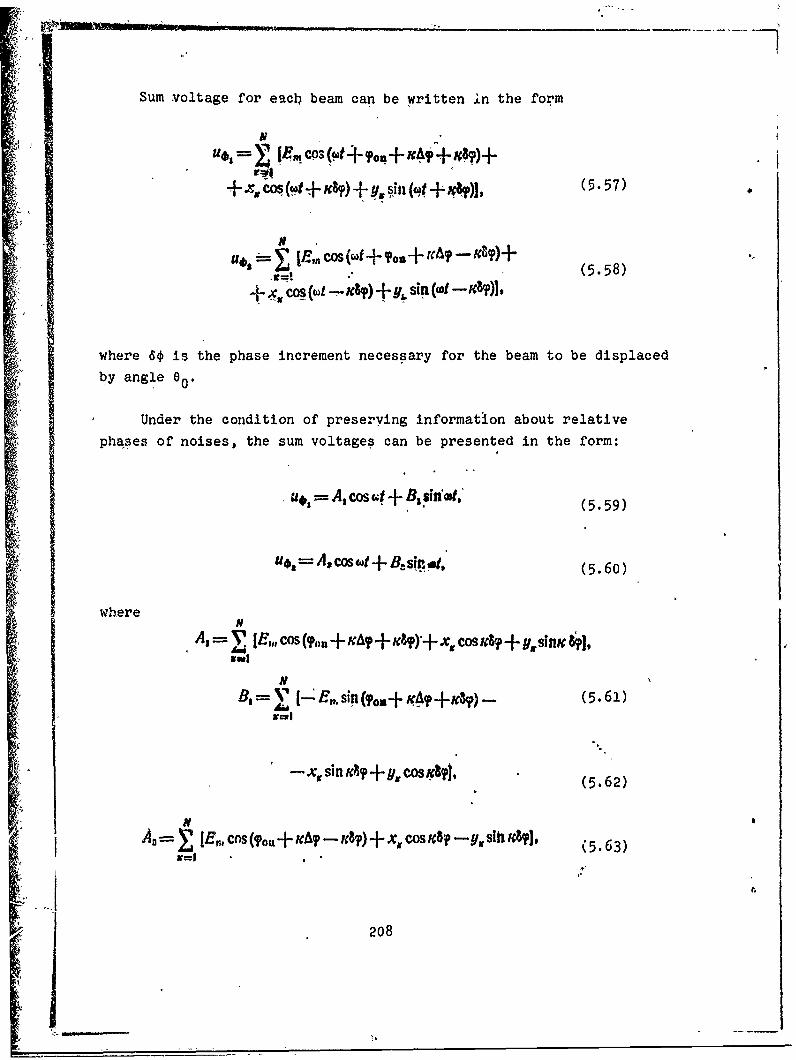
Sum .voltage for eac4 beam can be written in the form
u,, f•r C,,O, •(,4•j+ o,,+tcA•,-,+ ,)+; co (Ot + let) + 010 +ii *
(5.58)
SCps~o - )+ Y, sin (cot -x98A.
where So is the phase increment necessary for the beam to be displaced
by angle 00.
Under the condition of preserving information about relative
phases of noises, the sum voltages can be presented in the form:
au, A, cos + B, si'•a, (559)
(559
uis1 A, c•.os tat + B. s•.ip,l(56)(5.60)
whereN
A, fEi,,, cos ( + IcAp+ g4)-+ x. Cos ,&f + y,, si,,K 8l,ArmiKuil
NB,=V - E#,. sin (?o+ xA,+,C8)- (5.61)
x, si n AT +-y, cos •l, (5.sih
s~t (5.63)
208
N
Ba=S E,, sin (lpou + leAT -X =1
Let us examine square-law and linear detection. At output of
square-law detectors we shall have
=A,+I ; pi=A2+B-L (5.65)
A'fter subtraction we obtain
2 2PO-P 1 -Pi. (5.66)
Standard measurement error A¢l depends upon standard error aO
in determining pO, caused by noise, and derivative p0 with res:•ect
to AO in the absence of noises, i.e.
*Ay1 d(5.67)
With tUhe substitution into equation (5.66) of the corresponding
values determined by expressions (5.61)-(5.65), without taking
noises into account, we obtain
po- ,k,. sIn' €("+ A 8) s,... (n,- 8,)
S1 -O sin'2sh 2 A -•)(f-a) ( 5.68 )
Differentiating equation (5.68) with respect to AO, we obtain
in equisignal direction
'2 [N sin (N8)sin2(- i ~sn
dA I=o3 10l(~ (5.69)
209
k• ,,_ .._ ._
Variance of error in determining pO, caused by noises, is
determined by expression
,oP. w- &J-. (5.70)
With a large signal/noise ratio this variance will be [6)
[ 4 4N 'slsin (2Nap)-2 sin (Na?)
Isin at sIni(At r2I 50
Substituting the obtained values of a2 and dpinto formulaPO d-A no foml
(5.67) and disregarding quantities of the second order, we obtain
wy2VE F~g) F(J) (5.72)
where p = NSO
4+ sin, + sin 2# -- 2 sin +
+4sin'-+ sin' -2 (5-73
From formula (5.73) it is apparent that function F(') depends
upon the phase 6€ determining beam displacement by angle e0 from
equisignal direction. When ý z w the patterns will be intersected
at the half-power level. From the graph of function F(p) presented
in Fig. 5.19 it follows that with a variation in V from 0 to it
angular coordinate measurement error does not depend upon displacement
angle e 0 . With an increase in displacement angle more than a half-width of the radiation pattern, this error will rise.
With beam displacement angle composing less than a halfwidth
of the radiation pattern, F(q) = 24 and, consequently) can be written
(with large N)
CA 6-- •q'N- (5.74)
210
VA: -1
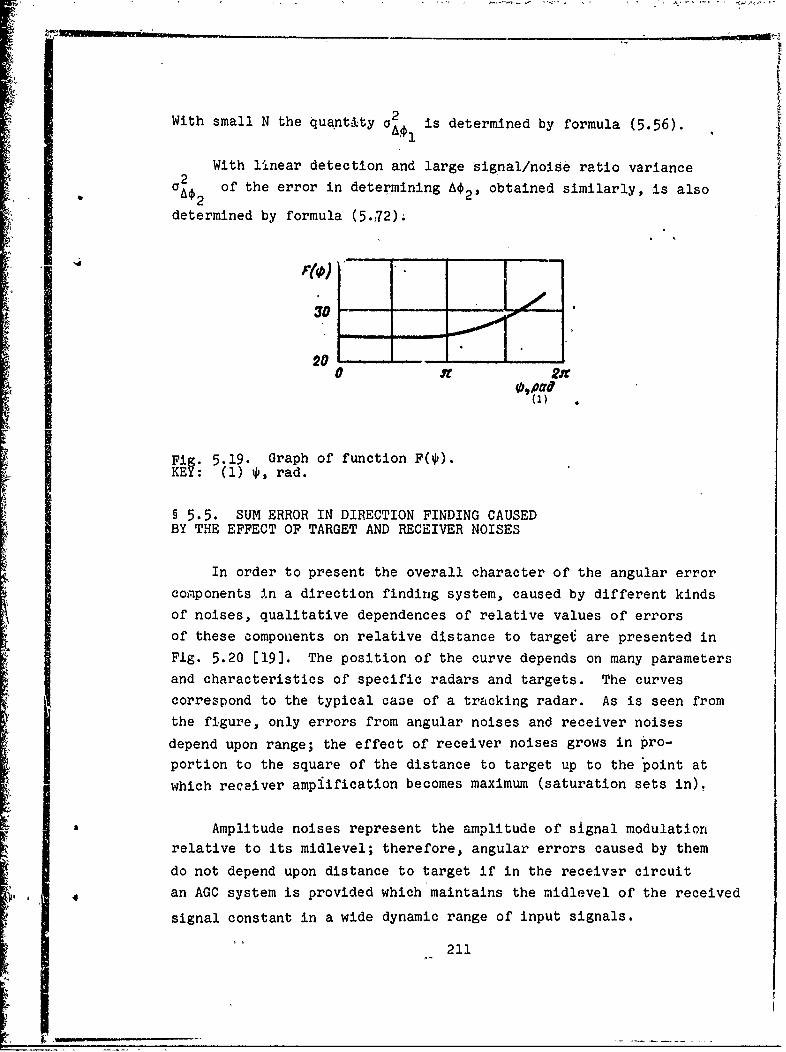
*2
With small N the quantity a is determined by formula (5.56).
2 With linear detection and large signal/noiSe ratio varianceaA2 of the error in determining A2 obtained similarly, is also
determined by formula (5.,72).
10)
30-
0 S 2X
Fig. 5.19. Graph of function F(*).KEY: (1) r, rad.
§ 5.5. SUM ERROR IN DIRECTION FINDING CAUSEDBY THE EFFECT OF TARGET AND RECEIVER NOISES
In order to present the overall character of the angular error
components in a direction finding system, caused by different kinds
of noises, qualitative dependences of relative values of errors
of these components on relative distance to target are presented in
Fig. 5.20 [19]. The position of the curve depends on many parameters
and characteristics of specific radars and targets. The curves
correspond to the typical case of a tracking radar. As is seen from
the figure, only errors from angular noises and receiver noises
depend upon range; the effect of receiver noises grows in pro-
portion to the square of the distance to target up to the point at
which receiver ampiification becomes maximum (saturation sets in).
Amplitude noises represent the amplitude of signal modulationrelative to its midlevel; therefore, angular errors caused by them
do not depend upon distance to target if in the receiver circuit
S 4 an AGC system is provided which maintains the midlevel of the received
signal constant in a wide dynamic range of input signals.
211

: 3 ~ OOa a
- too In
(2) OrnA*oumeR £A,4m6
Fig. 5.20. Dependence of standard errors in automatic tracking ontarget range: 1 - sum error of radar with conical scanning (a)and monopulse radar (b); 2 - errors from amplitude fluctuations; 3 -errors of servosystem; 4 - errors from displacement of reflectioncenter; 5 - errors from receiver noises.KEY: (1) Relative value of standard error; (2) Relative range.
Angular noises are functions of the angular dimension of the
target and the direction finding errors caused by them change in
inverse proportion to distance.
In addition to theze noises, there are also servosystem noises
caused by the presence cf zones of insensitivity, play and friction
in the electrokinematic links of the antenna control mechanism,zero drift. of the d-c amplifiers, unbalance in the circuits of the
drive amplifiers, etc. The value of angular errors caused by servo-
system noises depends neither upon the character of the target norupon range, but is wholly determined by the design peculiarities
of the system, the class of accuracy of mechanisms being used, and
the operational stability of the corresponding electronic circuits.
Sum error in radar direction finding can be defined as the
mean-square value of all the mutually independent errors. Figure
5.20 presents the resulting dependence of angul)ar error on range
for a radar with conical beam scanning (a) and a monopulse type
radar, for comparison, on the rissumption that amplitude noises
exceed servosystem noises (b). If the reverse, relationship is
valid, the advantage of a monopulse system over systems with an
equisignal zone becomes insignificant.
212
--....
.. . . .
• -.... • L• . , • . . ...
These dependence3 show that at short ranges to target the angular
noise i the determining factor in automatic tracking irror. At
medium ranges angular errors are mainly caused by the fluctuations
in reflected signal amplitude and servosystem errors. With long
ranges the predominating influence on automatic tracking error is
internal receiver noise.
§ 5.6. EFFECT OF AUTOMATIC GAIN CONTROL ON DIRECTIONFINDING ACCURACY
The target.being tracked by the radar performs the function of
an element of a closed tracking circuit; therefore, any changes in
the amplitude of a signal reflected from the target can be considered
a change in the amplification of such a closed circuit, which, in
turn, can directly affect target coordinate measurement accuracy.
Thus, the automatic gain control system of the receiver, designed
to keep the amplification of the entire tracking circuit constant
with the necessary accuracy, is of great value. Slow-acting and
fast-acting AGC systems differ in character.
With a slow-acting AGC system in the tracking circuit there is
maintained a constant average amplification. In this case, the AGC
does not react to fast changes in the level of reflected signal,
because of which rapid signal amplitude fluctuations still have their
effect on the amplification of the closed tracking circuit and the
error signal fluctuations caused-by this. A fast-acting AGC system
reacts to mosc of the amplitude fluctuations and the reflected signal
and keeps the tracking circuit amplification constant within a wide
variation of reflected signal level.
The effect of the character of the AGC system on direction
finding accuracy is examined as an example of an amplitude sum-
difference monopulse system. We shall limit ourselves to the case
of direction finding in one plane with errors not exceeding the
linear part of the direction finding characteristic.
213

Earlier it was shown that the signal reflected from a complex
target can be represented as a sum of signals M of the elementary
reflectors forming the target:
M
-m=• (5.75)
In accordance with this, the signals reoeived by the first and
second channels of an amplitude monopulse system can be expressed
in the following manner:
UE,(,,O= •E.,F, (00 -- mexp'i (,-t + r?),
m=I (5.76)M
E2 (t, 0)-- E (O. + ,) exp i (0d + ) (577)m=1
where with the approximation taken
F (o.- F,) (00) 0 + 0M),F (0. + 0.)- (04(O -- Io.,).
Angular position of the m-th reflector 0m relative to the
ESD of the direction finder's antenna can be represented in theform of a vector sum (Fig. 5.21)
oen=0+ AOM, (5.78)
where 0 is the angular position of the center of the target relative
to the ESD;
Aem is the angular position of the m-th reflector relative to
the center of the target.
For the direction finding plane under examination em can bemU
expressed in terms of an algebraic sum of the projections of the
corresponding angles to this plane
214
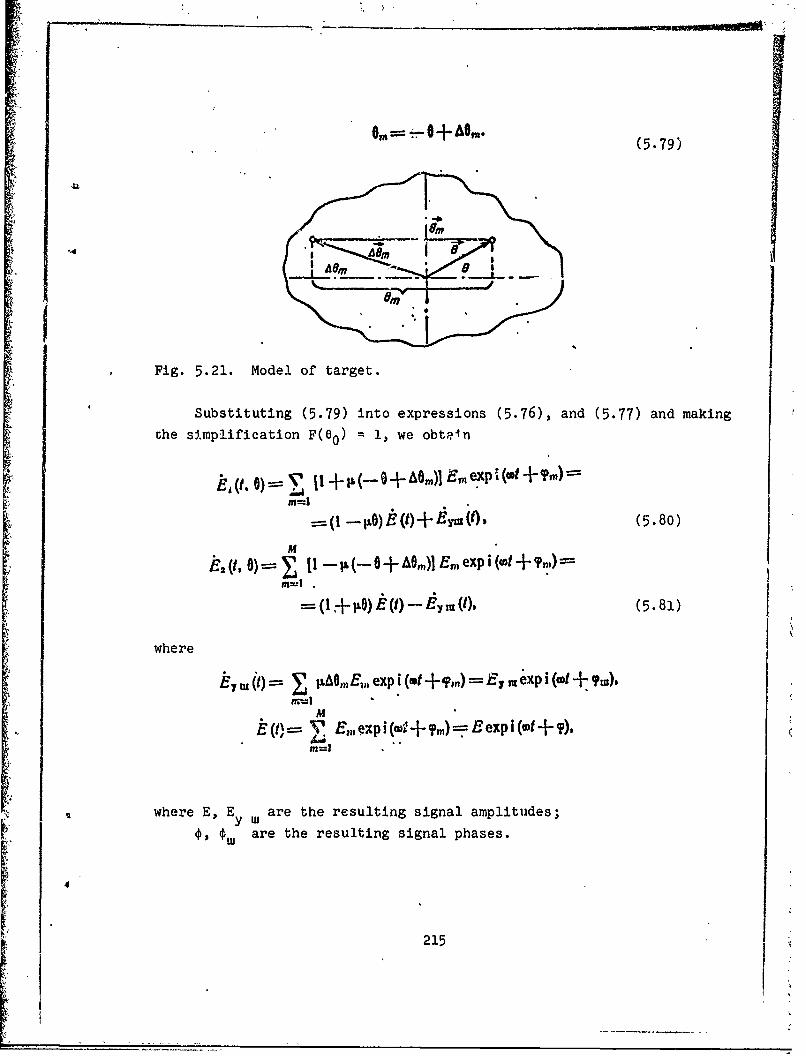
,T,,t
era (5.79)
Fig. 5.21. Model of target.
Substituting (5.79) into expressions (5.76), and (5.77) and makingDhe simplification F(6 0 ) = 1, we obtain
E,(t. O)= • Ii +•(--O+IAOm)1 4,expi(wt+7w)=
mW - + M W (5.80)
•',ItO)11 1 -- t% (--0- -AO,) Er, exp i (tot- +,,)
= .+ •o (t)-- ,,,, t), (5.81l)
where
ky m (t) OnE, exp i (at +'?i,,) = Em e'xp i (cot + ,
M ~~~9X ( - , pi (wý +um E exp i (ot +-T)m=I
where E, E are the resulting signal amplitudes;y,,
0, ýW are the resulting signal phases.
215
4,%

II
IIt is easy ,to see that the first terms con'tain useful infonma-
tion on the deviation of target center relative to E'SD while the
second are rqlated to the finite ,dimensions~of the target and are
interfering components -(angular noise). With sls~w variation inothe
mutual position of the radar as a target and relatively high M,
the processes E(t) and E ,,,(t) can be consider~ed stationary normal
processes [21] and *
E (t) E U,#t) = 0.
Disregarding the effect of internal receiver noises at theII
input of the sum and difference channels, taking 4nto acrcount (5.80)
and (5.81),we obtain
C (t, )=/ -2(t), (5.82)
p (t'. 0)-'- 2 , ,o (t) -- , (t)J. (5'83)
Further processing of signals is carried out with -respect to two
types of AGC systems: inertialess and inertial.:, I
With inertialess (instantaneous) gain control systems the
standardizing signal can be represented asl
I .EAPY Y~ ~CCP.'( 5 .8J4)
where kc is the transmission factor of the sum channel; a
k is the transmission factor of th'e AGC circuit.
Ta•iing standardization into account, signalsI at output of the
sum and difference channels, with accuracy, up ,.o the constant
coe 1fficient, can be represented by expression
?) - -=-- xp + (5.85)
u 0 (t, 0)
216
I I
a a

- e- i , + "-
!A y-A"Y
-, expi (o, pt + 'Pu, (5.86)
Swhere k is the transmission factor of the difference channel.I '
* Hen~e signal at phase detector outpuý is
a10)= Re u( t. 0) Vl, 0)='4 Ii
- . P EY 3. Cos e (OP-- • , (5.87)
1With an inertial AGC system, when the bandwidth of the AGCsystem is much less than the spectral band of reflected signalflluctuations, the standardizing signal assumes the form
J i'1 1
* '(5.88)
I ,where f is the average value of the envelope obtained as a result
of signal passage through a narrowr-band filter.' I
Then, taking into account expression (5.82) and (5.83), we"obtain
Ue (t )=• t ) S exp i(.vt+ (p)i*EAPY !-.PB B
S, *I ,(5.89)
up ( _ 0 EP0- "PB -O xp i (a: +)-K.*I * I 1
e(5.90)SI I
Rence error signal in the presence of an inertial AGO systemis
,u (Q) =Re dc (t,0) d*p (t. 0)
Kp r M COr(?,,).-T '" "' Cm (T, (P-K (5.91)
'217
Ii, I II! ____
I I

Compari-spn, of expzessions. (5.847) and (5.91) shows that when
0 = 0, when equisignaa direction coincides with directi 6 n to center
of a-complex target, error signal is. not zero and, with an inertialess
AGC system, is
I' (5.92)
with an inertial AGC system it is
INOAPY ~(5.93)
With target finding of a point target A6m 0, E = 0 and
u,(e) = u,,(0).
Thus, the obtained expressions point to the-fact that withdirection finding of a complex target, direc .ion finding errors
occur because of angular noises of the target. The values of theseerrors with linnearization of radiation patterns do not depend uponthe angular target center tracking orror but upon the type of AGC
system. With a fast-acting AGC system the effect of angular noises
on dire on finding accuracy ,is somewhat greater than with an inertial
AGC sysuem. In practical circuits, this difference is usually not
great and errors from the effect of angular noise with a fast-actingAGC system do not exceed errors with a slow AGC system by more than
a factor of 2-3 [20].
With an inertial AGC, as follows from expressf.on (5.91.), the
fluctuations of the sum signal affect direction finding accuracy.
In order to reduce the effect of the fluctuations:, we can limit the
sum signal. In this case, error signal can be represented by
expression
• ~ ~ ~ ~ ~ [P - Ej)= Mp CE_•josi-)I(5.94)
where U0 is the threshold signal limitation at sum channel output.
218
Obviously, with an inertial AGC systen, the effect of signal
amplitude fluctuation dgn direction finding accuracy is apparent.
Representing the amplitude of the reflected signal as a sum
of the mean.and fluctuating components, expression (5.94) can be
changed to the form
""u(s) Apy tE-- -- Ey m COS ((- IC](5.95)
where E is the fluctuation component of reflected signal amplitude
relative to the mean value E.
With a fluctuating signal from a point target
,-APYWC• B (5.96)
Hence it follows that With an inertial AGC system amplitude
signal fluctuations affect direction finding accuracy and the direction
finding system virtually ceases to be a monopulse system since the
requirements for signal standardization are not met. The value of
error caused by amplitude fluctuations, unlike errors from the effect
of angular noises depends upon angular target tracking error and
increases with an increase in the latter.
We can evaluate quantitatively the direction finding error from
amplitude and angular fluctuations if the corresponding fluctuation
distributions and the AGC system parameters are given.
We can use calculation formulas obtained from expressions (5.87)
and (5.95) while equating them to zero:
Ey, cos(?_cp,). (5.9()
Eq•' 3V o •,- •,) (5.98)
I 219U! _.. ... I
Qqmpaiidon .oi 9,,expX`-eýýs ions-, (5,,97.) *and -(5,~98) shows :thdt. wit~h a, fast-acting AGO error cjaused by amplitude fluctuations in the reflected'signal Is zero. As forerrors causedhby the change in-the slope
of the reflected signal:phase front, they a&,e sc6newhat greater witha slow AGC. Hgwever, with, a slow AGC the. effect of reflected signalamplitude fluctuations increases. -
Figure 5.22 presents the experimental dependences of sumtracking error, caused~by-damplitude apd angular flqct1atinns cofreflected signals, on antenna pointing error in a monopulse systemwith various values for the AGC bandwidth [201. Errors are expressedin units of target dimension L as a function of errors in the pointingof the directioA'flnhing antenna to the center of the target. Asa result of experiments, it has been established that with trackingerrors equal to half the linear dimension of the target, the levelof error with zslow and fast AGC is approximately the same. Onaverage and log1rnges, when angular target dimensions are smalland the effect of internal noises of the autotracking system increases,the effect of angular noises on direction finding accuracy becomes
insignificant. With small angis6, of antenna deviation from directionto target center, direction finding error with a fast-acting AGOsystem exceeds error with a slow AGC. With short ranges to target,due to an increase in the effect of angular fluctuations, in a numberof cases the use of a slow AGC can be advisable.°
In the course ,of experiments it was also noted that low-frequency components of amplitude fluctuations penetrated into theband of the servosystem and additional angalar errors occurred because
of them. Thus it was indicated that amplitude fluctuations of verylow frequency lying within the servosystem bandwidth affect all radardirection finding'systems, including monopulse. The degree oftheireffect depends upon the characteristics of AGC and the bandwidthof the servosystem.
Since the tracking time lag with a slow AGC increases trdckingerror, the servosystem bandwidth must be increased so as to reduceto minimum the processing time of angular error. However, an increase
220

in servosy5tem bandwidth heightens the effect of noises on the systemand unIder certain conditions can lead to loss of target (Fig.. 5.23)..The effect of internal autotracking system noises rises, which,in turn, with ' slow AGN increases error from amplitude fluctuationsof reflected signals.
'I'
0..
Fig. 5.22. Dependence of standard error caused by amplitude andangular signal fluctuations on error of antenna pointing to targetwith different AGC bandwidth.KEY: (1) Without AdC; (2) AGC 1 Hz;'(3) AGO 12 Hz.
62
0,01(10 - - -
0,01 pit IS0 10,0 NO
Fig. 5.23. Experimental dependence of standard tracking error onservosystem bandwidth in a radar with low AGC and zero delay error.0 - ratio of servosystem bandwidth to width of amplitude spectruld offluctuations at half power.KEY: (1) Loss of target.
221

The advantages of using a fast-acting AGC as compared with
.a sViow-acting oneVwi~ll be the more substantial the greater the internal" radar noises and the wider the servosystem bandwidth is required to
"-Ie with respect to tadctiýal considerations.
Thus, theoretical and experimental studies show that error
caused by angular noises decreases with an increase in the time ,
constant of the AGC system. However, with the increase in this
constant,'error caused by low-frequency amplitude fluctuations of
reflected signals, modulating any error signal,'also increases.
This component is proportional to tracking error and rapidly rises
with an increase in the latter. Internal autotracking system noises
impair even more the work of the servosystemi with a low AGC.
Th-e work of the direction finding servosystem improves with
the use of a fast-acting AGC, effectively eliminating the effect of
amplitude fluctuations in signals reflected from target. Since theeffect of angular target noise on direction finding accuracy rises
with this, the selection of AGC parameters must be a compromise. We
should try for the minimum possible servosystem bandwidth since anexpansion in this bandwidth leads to an increase in the reaction of
"the angular-measurement radar coordinator to internal and external
error sources and thus worsens direction finding accuracy.
§ 5.7. THE EFFECT OF THE DEPOLARIZATION OFREFLECTED SIGNALS ON DIRECTION FINDING ACCURACY
The polarization of waves is determined by the direction of the
vector of the electrical field. Most radar antennas operate with
linear polarization, with which the direction of the vector of the
electrical field is either vertical or horizontal. This is partially
explained by the fact that linear polarization is structurally
easier to accomplish in equipment.
In addition to linear polarization, we find, although considerablymore rarely, the use of circular polarization when the vector ofthe electrical field turns with the frequency of the signal in a
222
511 PSI I
plane perpendicular to the direction of radio wave propagation, to
the right or left. Circular polarization, in addition to the
electrical advantages, has other advantages when operating where
radio waves pass through layers of the ionosphere and where thereI
are severely disturbing meteological factors rain, snow, thunder-
heads, etc.
However, the polarization formed during the emission of signals,
as~a rule, is not kept constant and undergoes some sort of distortion,
which varies depending upon the operating conditions of the radar.
Let us examine reasons for the depolarization of signals and the
impairment of direction finding accuracy connected with it.
5.7.1. Relasons for the depolarization of reflected signals.
One of the reasons for depolarization is the medium of radio wave
propagation. If the radio waves are propagated in a vacuum or in
plasma (in the absence of a magnetic field), their polarization is
maintained constant.
Actually, radio waves are propagated in atmosphere where
different types of inhomogeneities occur including regions of plasma
(ionized gas) found in earth's magnetic field, This generat;os
various changes in signal polarization. Thus, for example, during
the passage of linearly polarized radio waves through ionized sections,
the slope of the polarization plane changes. The direction of
polarization rotation for radiated and reflected waves is the same;
therefore, the total angle of rotation will be twice as large as
it is with radio wave propagation in one direction. Since the value
of the angle of polarization plane rotation is not constant and
cannot be determined beforehand, linearly polarized waves, returning
after reflection from target to radar antenna can have a polarization
orthogonal to the radiated wave, as a result of which signal reception
and target detection becomes either impossible or target direction
finding will have large errors. To avoid this, radars designed
for the detection of space targets when the passage of radio waves
through sections of the ionosphere is inevitable, as a rule, use
circular polarization. A wave with circular polarization, in spite
223
r _4;A
of the effect of-additional rotation of polarization, maintains
a~polarization near circular; which ensures reliable target tracking.
However, the propagation medium is not the only reason for
radio wave depolkitization. Another even-more~important reason is
the target itself, reflecting the radio wave. The actual target
in the overwhelming majority of cases is a complex reflecting surface.
During irradiation, currents with a complex special structure are
induced on its surface. As a result of interference phenomena, the
resulting radiation field (reflected signal) generated by the currents
induced on the target's surface will have a complex structure, as
will its polarization. Instead of the radio waves with a stationary
polarization state, there will occur the so-called partially
polarized waves where, along with regular polarization components,
there will be components of a fluctuation character which do not
have, because of their indeterminancy, representation on a Poincare
polarization sphere. The degree ofPradio wave depolarization which
occurs in .this case will be determined mainly by the structure of
the target, the parameters and dynamics of its motion; therefore,
the depolarizing properties of targets are being widely studied at
present and attempts are made to use them for classification and
identification of targets [28, 83, 84, 106].
In operations with low-flying targets, when elevation angles
are rather small, reflections from ground or water can affect radio
signal depolarization. Reflection and refraction factors of radio
waves, as we know, depend to a considerable extent upon polarization.
Representing the polarization of the incident field in the form of
two polarization components - one parallel to the surface of reflection
and one orthogonal to it - we can show that the reflected wave
will have a distorted (generally elliptical) polarization. Being
summed at the reception point with the direct wave from the target,
the wave reflected from the ground (water) can further deform the
polarization structure of signals received by the radar antenna.
Thus, a radio wave reflected from the target is generally
depolarized, i.e., has a polarization unlike the working polarization
224

of the radar. Along with components agreeing with the radar antenna
polarization there can appear regular components significantly
different from the main (working) polarization and also irregular
(chaotic) components of polarization.
Let us consider to what extent signal depolarization can affect
the direction finding accuracy of monopulse radars.1
5.7.2. The character of the effect of reflected signal depolar-
ization on direction finding accuracy. The effect of reflected signal
of depolarization on direction finding accuracy is mainly caused by
the crosspolarization of the receiving antennas.
As was shown in Chapter 2, most antennas used in modern radars
have crosspolarization, because of which the radiation pattern of
the receiving antenna has a complex polarization structure. Due to
this, the parameters of the radiation pattern for the receiving
antenna are independent of the polarization of radio waves received.
The calculated radiation pattern occurs in practice with the
polarization of signals corresponding to the main (working) polariza-
tion of the antenna. In the other cases, the radiation pattern
is distorted and is the more noticeably so the more substantially
the polarization of signals received differs from the working polari-
zation of the antenna. With signal polarization agreeing with the
crosspolarization of the antenna, the expected distortion of the
radiation pattern is maximum. In this case, the antenna radiation
pattern will be fully determined by the structure of the crosspolariza-
tion of the radiation of a given antenna.
Since the radiation pattern on crosspolarization, as can be
seen from the figures presented in Chapter 2, agrees neither in
form nor position with the radiation pattern on main polarization,
such a deformation of pattern inevitably affects direction finding
accuracy.
Analysis shows [104] that for linearly polarized antennas a
noncorrespondence of polarization in radio waves received with the
225
*1.
working polarization leads to displacement of their equisignaldirection with respect to the optical axis of the antenna; the value
of the displacement depends both on the value of polarization non-
correspondence and the angle of displacement with the tracked source.
Beam displacement due to crosspolarization is noticeable also when
the direction finding antenna has a beam of circular cross-section.
As a rule, the radiation pattern with the alternate reception of
signals radiated by orthogonal dipoles is displaced in opposite
directions relative to the optical axis of the antenna. On the
basis of this we conclude that direction finding errors are approxi-
mately double if the radar antenna is designed for the reception of
both polarizations.
The dependence of antenna beam direction on the polarization
of signals received affects the accuracy of direction finding
systems of various types, including those operating on the monopulse
method. This is apparent in the exanple of the transformation of
direction finding characteristics depending upon the polarization of
reflected signals in an amplitude sum-difference monopulse radar.
As a receiving antenna we shall take an antenna of the truncated
paraboloid type, designed for tracking a target in one plane.
As we know [41], the direction finding characteristic of an
amplitude monopulse radar of the sum-difference type with an instan-
taneous AGC system can be determined according to formula
•S (0) = I e ý f ) oi t,0-tic (f, 0) ý t. •0 ) ' (5.99)
where u c(t, 0) and U p(t, e) are the complex expressions for signals
of the sum and difference receiving channels.
Let us assume that the antenna is linear and the field distri-
bution along its aperture is determined by functions
t(-V)- X (X) ex- - VXey for the first channel
(5.100)
226TO

(x) - (x) e. + '2 jx) e.. for the second channel
(5.101)
where ýi x(x); *2 x(x) are functions determining the excitation field
with respect to the main component of polarization for signals
received;
4l 7(x); q)2 y(x) are functions determining the excitation field
.with respect to the crosspolarization component of the signals
received;
ex and ey are unit vectors.
We shall define functions *1 x(x) and *2 x(x) as
4',A(x):=expi(icxcosaj) f1 (x) .--rd x,•d. (5.102)
j x (x) =: exp i (-, xcosao) f2(x) fAssuming the given functions ' 1 x(x) and ý2 x (x) and opposite
phase for the lobes of the crosspolarization radiation pattern lying
on different sides of the main planes of the antenna aperture,
functions i1 y(x) and i2 y(x) for this case can be represented by
the following expressions:
1, (x) = a. exp i (--xx cos a. + p1) it (X)
(5.103)
•J1y(x)=a.expi(K-xcosa,+cp +• ) f),(x) O'x<d.
I',"& (x) = a, exp i (-cx cos a, .- J -+.) f)(x)(5.1o0)
227
A NOW,
In the above functions the following designations are used:2d is the antenna• apertutre dimension;
!0 is the angle accounting for the asymmetry of the radiation
pattern in space relatiye to equisignal direction;
a is the relative amplitude of the field which can be excited
with respect to the crosspolarization component of the signals
received;
01 is the phase shift of fields excitable in the antenna aperture
with respect to the main and crosspolarization component.
For the sake of simplification, amplitude distribution Lf the
field along the antenna will be considered uniform and equal to
f f2x =(X) = 112d. (5.105)
Let the signal received be defined by the expression
E Ex-,+ Eeb, (5.106)
where
=E xp c(X Cos a+ YCOS + ZCos)(5.-O07)
- is the component of the signal agreeing with the main polarizetiin
of the antenna,
Ey= bE, exp i [,c(xcos a +. ycos +zcos•y) +%] (5.108)
- is the component of the signal with polarization orthogonal to the
main polarization of the antenna.
Here E is the amplitude of the incident field;
b is the ratio of incident field amplitude to two mutually
orthogonal polarizations;
02 is the phase shift between orthogonal components of the
incident field;
228
I

cos a, cos 8, cos y are the direction cosines of a spherical
system, of coordinates.
With direction finding in one plzne y = z = 0, and
- eEx=,exp; xxcosa, (5.109)
"Ey bE. exp i.(,cx cos az+ ,). (5.110)
Let us determine, under the given conditions, the signals atoutput of antenna channels:
(x) Edx-) IW •(x). -+'t,(x)' ]dx-
= exp i Kx (cos a + vaos a.) dx +a {b exp i V x (cs a + cos o) dx+
+aexpbexp
- expi/xx(cos+cos ao)dxI:0'
(5.111)
I,(o)= a (x)Idx i.•(x+•2y(;)kM dx-
L j exp i Ix (cos a - cosa o) dr, +
+ ab exp i , exp i Kx (cos d• cos ao) dx--d
As xa rcoesulta. dxII. (5.112)0
As a result of integration, we obtain
, (0). = •2E + 2a,' b exp", ib" •462., '[" - -i2a~bexpi slit -hi] (5.113)
229

.. .....
n In'
T ki 5 11k
-where
'M Kd a;.~- Cos a.) I
nz=.x,-d (cos a + Cos a.),
HencFL it follows that
u~()==1(+U 2 o)=2Eslnmn. sin h
ti IW L. u i. u
sins
,i•ab exp14 -. n J (5.116)
Sl msn,hi sin,,
up. (6,L -(0 u xs iI (6 = 2E -, -.- n'-4.
+4a~b jj-i. sni+I i 2a!.be n-______ -('.16
0 I n2
I, M--Cn , si n'
ma, '; (5.117)
!" [ I +sf sY
ýc (0) t., (0) 4. (o Is nntX - -' ,
sins M S in s
-- 12%bxpi• • ,n 3" " .' (5.118) ' ,
230

I I
"I10
I.
-know that
cos a' cgs 0 sin O*,
For the case of tracking in one plfane $ 0 and cos a = sin 0,
cos a0 F sin O0..
* Usually 00 = 05/2 1where
"Coefficient A depends upon the type of; antennas and for parabolic
antennas A = 0.8.IA
In1 accordance witli this, expressions m and n can be represented
in the forms'
i=n o (sinO -sih Oo),
(5.J119)
n,. - (sin O+sinO). (5.120)
After dividing expression (5.117) by M5;118), we obtain an
equation defining the direction finding characteristic of the studied
monopulse system as a fuiction of ,he polarization of signals received
and the polarization characteristic' of the receiving antenna. In
accordance with this equation, calculations were made on a computer.
Figure 5.24 illustrates calculated direction finding characteris-tics for different values of aKb when 0 r 10 and 0 = 900.
0 5
KinaAs seen from the figure, an increase in a Kb leads to the trans-formationlof direction finding characteristics, which is manifestedin a displacement of zero, as wiell as a clhange in steepness and
form. With an increase in a' b the value of zero displacement for the
directi6n finding charac.teristic also increases and when (a b + c)
2'tends toward the width of the radiation"pattern (Fig. 5.25). Beginning
231
- I I II
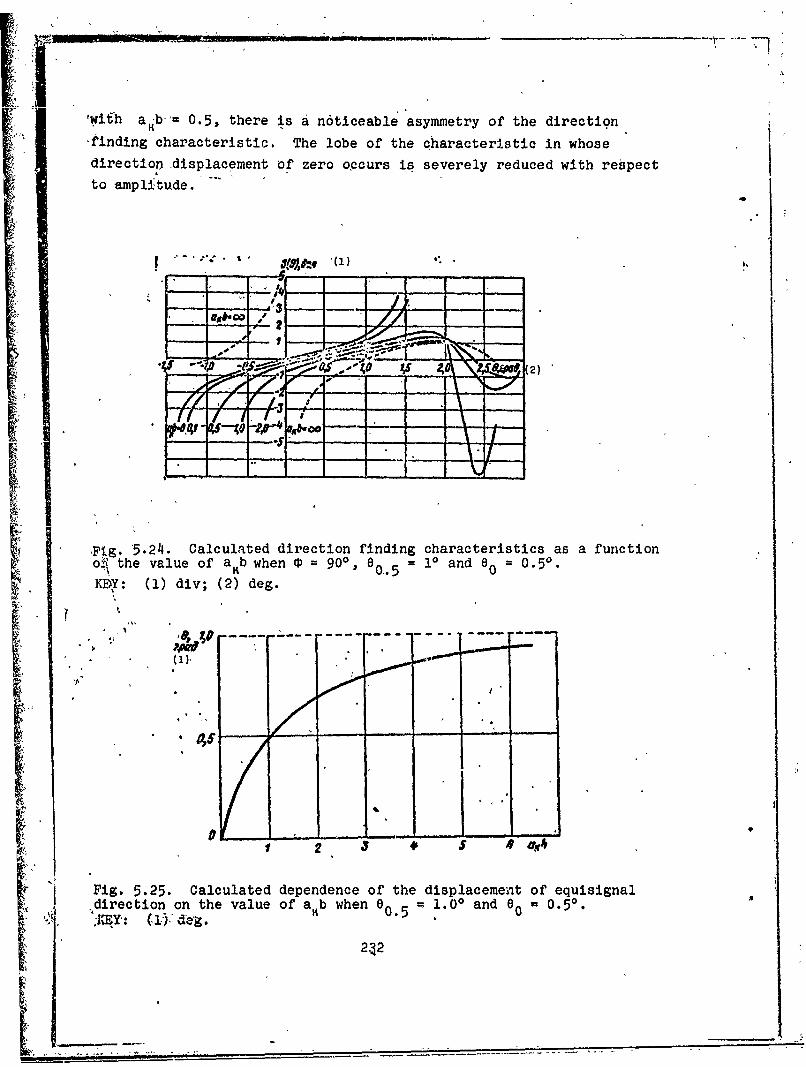
SVwit~h a~b f0.5, there is a n6ticeable asymmetry of the directioný finding characteristic. The lobe of the characteristic in whose
S directiondisplacement of zero occurs is severely reduced with respect
to amplitude.
S-4 - --
-.], I S. . .. •-i•
l.,((.I•_ t•L/•o _. '; i5 2 _,
,Fig. 5.24. Calculated direction finding characteristics as a function
o*, the value of a Kb when 0 = 9g0, 805 = 10 and e0= 0.50.KD•Y: (1) div; (2) deg.
'.
'I-(1Y
/I
Fig. 5.25. Calculated dependence of the displacement of equisignaldirection on the value of aKb when e0.5 = 1.00 and 0 = 0.50.S;KEY": (1i), d2.
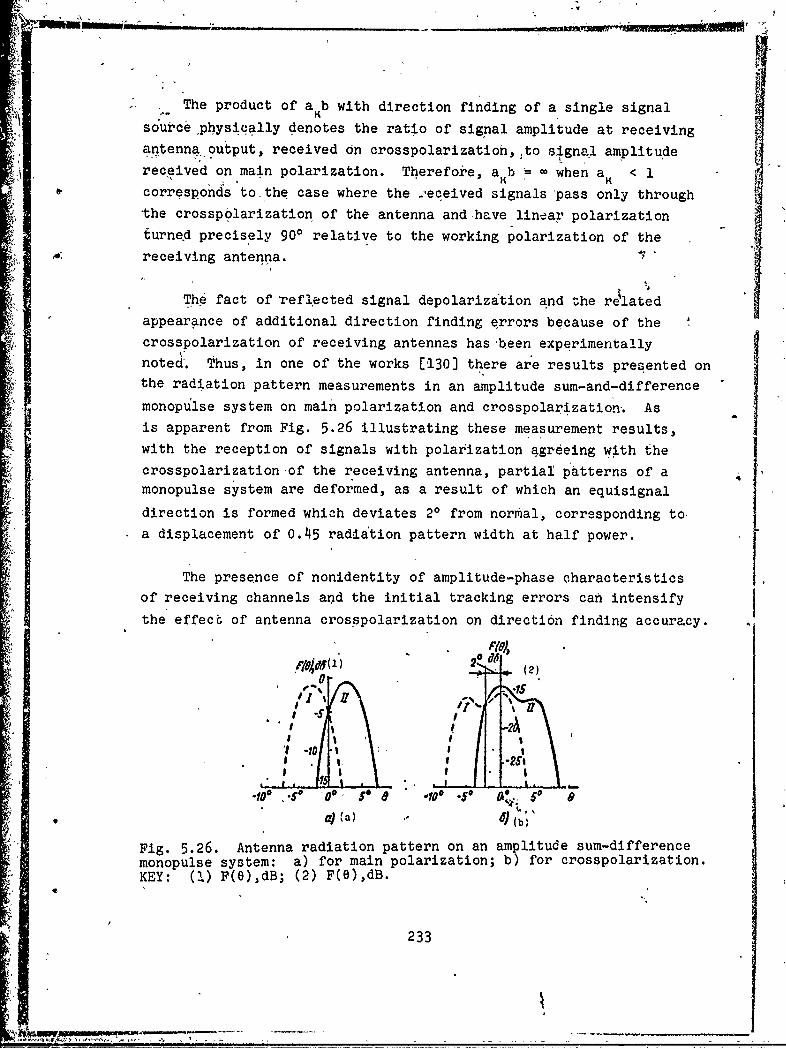
The product of a b with direction finding of a single signalK
source physically denotes the ratio of signal amplitude at receiving
antenna output, received on crosspolarization, to signal amplitude
received on main polarization. Therefore, a b = when a < 1K K
corresponds to the case where the :eceived signals pass only through
the crossp0larization of the antenna and have linear polarization
turnesd precisely 900 relative to the working polarization of the
receiving antenna.
The fact of refl.ected signal depolarization and the related
appearance of additional direction finding errors because of the
crosspolarization of receiving antennas has been experimentally
noted'. Thus, in one of the works E130] there are results presented onthe radiation pattern measurements in an amplitude sum-and-difference
monopulse system on main polarization and crosspolarization. As
is apparent from Fig. 5.26 illustrating these measurement results,with the reception of signals with polarization agreeing with the
crosspolarization of the receiving antenna, partial patterns of amonopulse system are deformed, as a result of which an equisignal
direction is formed which deviates 20 from norrmal, corresponding to
a displacement of 0.45 radlation pattern width at half power.
The presence of nonidentity of amplitude-phase characteristics
of receiving channels and the initial tracking errors can intensify
the effect of antenna crosspolarization on direction finding accuracy.
2 (2)
I I. . ,I ! . .... I . AýI it
I
-10 .- 0S~o 500 S* .10 -so W~. s0 9a (a) (b)
Fig. 5.26. Antenna radiation pattern on an amplitude sum-differencemonopulse system: a) for main polarization; b) for crosspolarization.KEY: (1) F(O),dB; (2) F(e),dB.
233

1Yigure `5.27 presenjts the dependehne of eduisignal difrection
displacement on podlarfnati'on ori,66tnti6n and w6rking frequency,
obtained ,xperimenially with the AN/FPS-16 modified monopulse radar
With circular polarization under conditions 6f signal reception
with linear polarization [49]. From the figure it is apparent that
the value of equkisignal dirgction displacement with a change in the
angle of linear polarization orientation and working'frequency of
received'signa'ls cIianges both in magnitude and in sign and reaches
1.5'. if we coiisider that the normal accuracy of angular measure-
laents for the AV/FPS-16 'is evaluated by tenths of an angular minute
[774], we cannot. disregard the displacemients obtained in equisignal.
direction of radiation ,patterns for the i"eceiving antenna.
4S,
45 '2, v to 801010 o om
IM (40 fwvj
(b)' .((3)
Fig. 5.27. Dependence of equisognal dnspiacement on the angle ofslope in the polarization plane of received signals: a) in azimuth;b),in elevation.
KEY: (1) Ae0 min; (2) Mhz, (3) deg.
Thus, the eperimental results substantiate calculated data on
the effect of crosspolarization of receiving antennas in a monopulse
system on direction finding accuracy. We should mention that a
234

change in the-orientation of the linear polarization of a wjave is alsoexpressed in a chapge of the depth of the minimum difference radiation
pattern as well as the level of its side lobes.
*Under actual conditicns, reflected signals have a partially
polarized structure. Therefore, a deformation in the radiation_ pattern will have a random character, as a result of which the final
effect will be determined by the spectral densitJ of the variationsin polarization and servosystem bandwidth. Under these conditions,
we can expect a reduction in direction finding sensitivity of the!system and an increase in its standard errors.
5.7.3. Methods of lessening the effect of antenna crosspolarlza-
tion on direction finding accuracy. Since crosspolarization is
generally caused by the very principle of radiation pattern formation,
to improve design quality and increase manufacturing precision fordirection finding systems is necessary but insufficient to reduce
s-rosspolarization radiation.
More effective measures for the reduction of crosspolarization
effects are compensation and polarization filtration.
The first method is based on the selection of an irradiatorcapable of compensating the crosspolarization components of the field
inn the aperture of the mirror. One of the simplest irraaiators isa sum of electrical and magnetic dipoles with different moments,
located at right angles to each other. An analog of such an irradiator
is a pyramidal horn [100). For compensating crosspolarization we
can, also use an installation of special correcting plates at the
maxima of the antenna's electrical field [133, 134].
The second method for reducing the effect of crosspolarization
on direction finding accuracy lies in the use of mesh reflectors and
in the installation in antenna apertures of polarization grids
which are ordinary grids of close parallel wires or metal plates
El, 63, 77, 111, 112]. Such reflectors and grids reflect waves4L with a polarization parallel to the wires (plates) and pass wave
235
with an orthogonal polarization direction. This makes it possible,
to a ceztain extent to, filter the components of the reflected signal
whose polarization is near the cross polarization of the antennaand, as a consequence, to lessen their harmful effect on direction
finding accuracy.
With values of wire radius r 0 < 0.05A and spacing between wire
axes S < 0.2X, the attenuation factor for radio waves with a polariza-tibn parallel to che wires of the grid can be-calculated according
to formula [1:.
bd
To-005- 06;092(2 9
I /2S+-- ln2iv./S (5.121)
of where TO is the ratio of the power of a wave which has passed throughthe grid to the power of an incident wave.
When r 0/A = 0.1 and 0.05, calculation according to the cited
formula gives the following, respectively:
db dbT0 Oo,o5(-13 86); o,002(--26 85).
Reduction in phase errors of field dictribution in the apertureof the antenna by reducing the illumination of the edges of the
mirror during its excitation leads to a decrease in the crosspolariza-
tion of the antennas. However, the amplification of the antenna is
also reduced and the main lobe of the radiation pattern is broadened
[100, 121].
236
CHAPTE'i 6
THE EFFECT OF IMPERFECTIORS IN ELEMENTS OF THERECEIVING CIRCUIT Oil TIlE ACCURACY OF MEASURINGANGULAR COORDINATES BY THE MONOPULSE METHOD
§ 6.1. MAIN SOURCES OF EQUIPMENT ERRORS
The monopulse method is based, as indicated earlier, on the
reception of signals simultaneously by two or more receiving channels
with their subsequent comparison with respect to amplitude or phase.
In accordance with this, the accuracy of direction finding using
the monopulse method, in many cases, will be determined by the
identity of the characteristics of each pair of receiving channels
which together piovide direction finding in any coordinate plane.
Hitherto, when examining the reception and processing of signals
in monopulse direction finding systems, we have based our assumption
on the fact that the characteristics of receiving channels are
identical. This enabled us to study the principles involved in
constructing monopulse systems under conditions which ensure the
achievement of the potential capabilities of the monopulse direction
finding method. Actually, however, the structural and circuit makeup
of a monopulse radar can have certain disadvantages which disturb
the identity of receiving circuit characteristics. In a number of
cases, such disruption can occur during the operation of the equipment
because of element aging as well as climatic and mechanical effects.
In these cases, direction finding accuracy, to a certain extent, will
be determined by the value and character of equipment error.
237
L ..* _ 7 - _
Among the maih sources of equipment error in monopulse radarsystems are inadequacies in the formation of antenna radiation patterns,-nonidentity of amplitude-phase characteristics for receiver-amplifierchannels, imperfect operation of the AFC and AGC bystems.
Below we examine the character of the effect of certain sourcesof equipment error on direction finding accuracy.
S6.2. THE EFFECT OF IMPERFECT FORMATION OF ANTENNARADIATION PATTERNS OF MONOPULSE SYSTEMS ON DIRECTIONFINDING ACCURACY.
The character of an antenna radiation pattern is determined bythe amplitude-phase distribution of the excitation field in the'aperture [52, 62]. Since antennas of monopulse radars must formsymmetric pairs of radiation patterns in each direction finding plane,this.assumes certain, requirements on the function of the field dis-tribution in the aperture (requirement of the function of the fielddistribution in the antenna aperture for amplitude and phase directionfinding were examined in § 2.1). The nonfulfillment of these require-ments inevitably leads to the noncorrespondence of radiation patternsto the principles of direction finding, to the appearance ofasymmetry in amplitude and phase, and to a number of other distur-bances. This, in lurn, generates additional dir<•tion finding
errors.
One of the maain reasons for nonfulfillment of required excita-tion field symmetry is the inaccuracy of antenna building. Errorsincurred in the building of antennas bring about irremovable 'dis-tortions in field distribution along the aperture and, as a consequence,lead to the formation of radiation patterns unlike those calculated.
Errors in field distribution along the aperture can be brokendown into systematic and random. The reasons for systematic errorcan include shading of mirror aperture by the feeds and fastening
elements, the diffraction of radio waves on the edges of the mirror
and the feeds, and channel cross-talk. Reasons fdr random error
include random deformations of antenna mirror surface, temperature
238

I..
4rops or wind force changes around" the antenna, which lead to vfluctuations in excitation field phase, errors in building antenna,
etc.
Systematic errors, as a rule, are identical or near in Value
to those of single-type antennas made according to established technol-
ogy ani, therefore, can be studied beforehand with a certain accuracy.
As for random errors, they cannot be studied in advance since they
vary in magnitude within wide limits from sample to sample. Therefore,
an evaluation of random errors usually is done by the statistical
method.
The effect of systematic errors on radiation pattern can be
determined by introducing them into the field distribution along
the aperture according to familiar methodology [62]. We can show
-that the presence of linear phase error along the antenna aperture
leads to the corresponding deviation of radiatioi pattern from the
prescribed direction. If the phase error changes according to
square law, antenna beam defocusing sets in.
Random phase and amplitude errors in field distribution along
the aperture cause an increase in the level of the side lobes,
angular displacement of radiation pattern, and decrease in the
coefficient of antenna directional action. The effect of random
phase and amplitude errors in field distribution along the aperture
on the indicated characteristics of antennas was studied by the
statistical method in a number of works [40, 60, 71, 88, 107, 116,
and 119].
In order to explain the results, let us examine two examples
corresponding to a two-dimensional antenna array [116] and an
antenna of the parabolic type [40].
6.2.1. The effect of errors in field distribution along theaperture of an antenna array on direction finding accuracy. Inanalyzing direction finding errors introduced by the elements of a
phased array, we shall assume that the antenna is a rectangular array
239
arranged in plane XY, and theýmonopulse system is an amplitude .sum-
differentce system.
Displacement of equisignal direction created by errors of arrayexcitation'leads to direction finding error in plane XZ, equal to
* (6.ei)
where 6x0 is the angle defining equisignal direction in the absenceof errors;
of is the angle defining equisignal direction in the presence'of errors.
Usually in monopulse systems with antenna arrays tracking isaccomplished on error signal value without converting the signalS(O) to zero. In this case, an additional source of direction finding
error appears because of the change in direction finding sensitivity.If the direction finding characteristic is assumed linear, definedby relationship S(O) = pex, tracking error can be determined byequality
AO= OIX
(6.2)
where 0' is true direction to target;x po is apparent direction to target, taking error into account;x pAP/P is the relative change in sensitivity during target tracking;
Ox is the displacement of the target relative to equisignaldirection in the direction finding plane X, equal to (0' - "o).
X p x
From equation (6.2) it is apparent that tracking error consists' of two components: the first is caused by the displacemenc of
equisignal direction, while the second by change in direction findingsensitivity.
Sum tracking error will be maximum at maximum displacementof target from equisignal direction. If we assume that the maximum
240
displacement of target will reach half the radiation pattern width,
equation (6.2) is written in the form a.
[Aoj1, 0- = AO+,.* + + ____1 s " + 2Xsin 6,," (6.3)
where X is the dimension of the array in direction x.
The value of the sum tracking error depends upon type and
magnitude of errurs of amplitude-phase excitation field distri-
bution. Let us examine each component of tracking error. For'
example, we find even excitation creating sum pattern F c e) with
amplitude-phase distribution along the array in the form
"r ,n =' 'rn. (I.+. A Ym)exp [-'i(@xnCOs.+'"+ P Y 1 C 6,, c S . -+ + I ( 6 ."4 )
where xn, ym are the coordinate6 bf the radiators;
ynm is the excitation amplitude in the absence of error;
Aynm is amplitude e-ror;
%nm is phase error.
Similarly, with uneven excitation with respect to x and y,
creating difference pattern Fp (6) in plane XZ, amplitude-phase
distribution is described by expression
Tnn n= Inm (I + Aqnm) exp [-- (Ixn COS Ox 0++.i+ py 'Cos 1.. ,-(6.5)
Phase error for any array element consists of error in the
position of this element and error in phase during its excitation:
- O 'utn ± (Xnm Cos + An COS OI).+- Az, s O2,0).6 (6.6)
where Ax m Aynm, Aznm are errors in location of excited element;$1 r' s phase error of excited element.
nm
241
-'C4

Similai~ly, afor ;phase error in excitation field distribution
*during the formation of difference diagram
:. . .,m5 (n 1PLXmC..O. * A cosOS ••,'."c 1.).(6.7)
'For antenna arrays ,having a large number of elements, ,excitation
can be represented in the form of continuous functions y(x, y) and
n(x, y).
Under this condition, expressions for both tracking errorcomponents assume the form [116]
Is(x8,* y)x.(x.u)dA
Let us note that integration is carried out over an equivalerit
aperture of the array, having dimensions X, Y, and none of the
amplitude and phase excitation errors y are introduced into formula(6.8).
Formulas (6.8) and (6.9) can be used for calculating tracking
errors arising both from systematic and from random amplitude and
phase excitation errors [116].
Systematic tracking error is considered for uniform amplitudedistribution of excitation n, when
,q (I YN) X .- -
If 1 np X>0,, (6.10)
(npm = when)while the systematic phase error which occurs has the form
error awhere ro is the maximum value of phase error
242
.• .hase exci atio er ors [16.-. . .... _. _-- ..

on the edge of the array. The components of tracking error, in
accordance with equations (6.8) and (6.9), will be equal, respectively,
to
• r A01. X sin 0. . ] (6.11)
p. 2XsinO.; - XsIf ox. " 4 (6.12)
Consequently, sum error, expressed in fractions of radiation
pattern width is determined by expression
X'x/ sin 0,,.20 " (6.13)
From the graphs showing the dependence oft tracking errors oncubic phase er'ror (Fig. 6.1), it is apparent that displacement of
equisignal direction is the predominant tracking error in the
presence of phase errors.
4eO40,05 2:
0,02 -0,0 3' /
0 0,1 0,2 0,3 4o,pa#,
Fig. 6.1. Dependence ofstandard tracking error on the value ofcubic phase antenna excitation error: 1 - sum error; 2 - errorfrom displacement of equisignal direction; 3 - error from changein direction finding sensitivity.KEY: (1) go, rad.
243

Random tracking errors are, examined for the case when phase
and amplitude excitation field errors :have, normal distribution.:-
With average values of phase errors equal to zero, uniform distributiQn
of y, and" step-utniform distribution of r, the mean-square values
of sum tracking error and its components, in Vhis case,, will be
equal to [116]
(6.14)
(M. V -Xinh1./OX I (6.15)2t
o#,* 10 2X snol $is, (6.16)i
when N is the number of array elements long axis ix;
M is the number of array elements along axis y;
a is the variance of phase error in radiants.
Figure 6.2 presents the dependence of these errors on ag. In
this case, also predominant is the error from displacement of equi-
signal direction.
S/XASin~ .7Fig. 6.2. Dependence of ,/AS•-D .standard tracking error on the 0. -Wvalue of standard phase errorin antenna excitation: 1 - sum 012/ 1Ierror; 2 - error from displace- .
ment of equisignal direction;3 - error from change in directionfinding sensitivity.IKEY: (1) rad. 0,,/V-M "'
a. , o0/ 51z V 3,r
244
II
The standard value of sum tracking error, caused by randomamplitude errors, is' determined by expression [li6]
j YVWA~n (6.17)
where a= A = a is'the standard value of amplitude error.a A
Graphs phowing the dependence of standard sum error on a a arepresented in Fiý. 6.3.'
,The above expressions for errors were obtained for tracking
in one plane; however, they are also valid for tracking in anotherp•ane _•
A6heffect of amplitude and phase errors can also be evaluated'othe point of view of"variations in antenna radiation pattern.
It is coiivenient to-use the statistical,method of calculating".antennas [40, 60]. Thus, with uniform current amplitude distribution
of the element along the aperture and normal phase error distribution
statistical calculation [40, 44] gives the following generalized'
ekpression k'or the Averaged antenna radiation pattern of the array
with respect to power:
SF (0, ).F 2 n=1 n=mE N
4 ; . 'i , 4:•-- , • • . - "
where F(P, @) is the antenna radiation pattern of the array in the
absence of randbm errorsi
I' (, ) is. the coefficient df radiation pattern slope, equal to
S. F(O, )= jos 0 (cos' 0 cO' - sin' ),* 2
a 0 is the meansquare of sum error, eqpal to
2,I
4 I
, , ! _ _ - -- - _

2 is the mean §quare of relative amplitude error;
a is the mean square of phase error;
I is the current in the mn-th element of the antenna, determined
by the given distribution in the aperture;
0, 0 are the angles determining beam orientation in a selected
system of coordinates (Fig. 6.4)
Fig. 6.3. Dependence of standard 0.51/Nr"r' -
tracking error on the value ofstandard amplitude error inantenna excitation./
p 0,3/VF• - .--
0,,
0 0,1 0,2 o, a
Fig. 6.4. System of coordinates. for determining angle 0 and *.
KEY: (1) Beam direction; (2) zPlane of array elements.
a )
X flaOCKMA ~Hl johCOMM" NUPI 1
a lllf M zmo O/, .•t, I r "1 ,•
246
4

From dipression (6.18) it is apparent that the effect of
amplitude and phase errors leads to secondary radiation determined
by the second term of the-expression, and, as , ronsequence, to a
decrease in the coefficient of directional action. The latter can
be determined from the following approximation formula [40, 44]:
I-L, 6 (6.19)G I.where Go, G is the coefficient of directional action for the antenna
in the absence of errors and with errors taken into account, respec-
tively;
Z is the distance between elements of the antenna lattice.P
6.2.2. 'The effect of errors in field distribution along the
aperture of a parabolic antenna on direction finding accuracy. Wi0threspect to parabolic mirror antennas the statistical method with
small phase errors a and normal. law of distribution gives [40, 441
4-c 2.42(12 t %2
=,p(6,+ ý,p)exnl - I-- •" /'(6.20)
where u = sin 6;TO is the correlation interval expressed in wavelengths and
corresponding to the average interval in which errors in excitation
currents cannot be considered independent.
Just as in expression (6.18) the first term of expression (6.20)characterizes the radiation pattern in the absence of errors, whilethe second term describes this distortion caused by phase error in
field distribution along the aperture. Secondary raeiation is propor-
tional to the mean square of the error, just as in an antenna array, and
also proportional to the square of the correlation interval expressed
in wavelengths.
247

'1
With small errors and a small correlation interval the decrease
in the coefficient of directional action is determined by the approxi-
mation expression
3
(6.,2)
and with a large correlation interval by expression
(6.22)
Thus, amplitude and phase errors in excitation field distvibu-
tion along the antenna aperture lead to the distortion of the radia-
tion pattern, which can be manifested, specifically, in a decrease
in the coefficient of directional action. Due to this, nonidentity
of amplitude characteristics for the receiving channels of a mono-
pulse system and an increase in direction finding errors can occur.
In order to evaluate the effect of nonidentity of radiation
patterns on target direction finding accuracy, we shall assume that
the amplification of one of the reoeiving antennas differs from the
other by quantity AG. As is apparent in Fig. 6.5, a variation in
the amplification of one of the antennas of a iionopulse radar involves
the displacement of equisignal direction (ESD) by quantity AO0 and
is a source of systematic direction finding error, linearly connected
with the quantity of antenna nonidentity with respect to amplifica-
tion.
Fig. 6.5. Displacement of % %equisignal direction with a .
change in the amplification of . '
one of the antennas.KEY: (1) ESD. o
248
,IThe value of systematic prror can be determined in the following
manner. Let Go be the amplification factor in equisignal direction
under the condition of identity for radiation patterns; GI is the
amplification factor in equisignal direction during a change in
the amplification of one of the antennas by quantity AG, and p and
p' are the steepness' of the radiation pattern at the working point
for these conditions. Then we can write the following relationship:
(6.23)
0o-.-+ AG =- . o (I +- PA6,). ( 6.24 )
Substituting (6.23) into (6.211) and disregarding the quantity
of the second order of smallness, after elementary transformation,
we obtain
AO-. -x Go.(6.25)
or
ILA -
(6.26)
If we assume the values of the steepness of the direction
finding characteristic and the nonidentity of radiation patterns
with respect to amplitude, we can determine the value of angular
error. Calculations show that with a direction finding characteristic
steepness of 0.25 !/deg, radiation pattern nonidentity with respect
to amplification of 10% leads to systematic angular eri'or or 0.20.
If permissible angular error, in this case, is taken as one minute,
antenna disagreement with respect to amplification must not exceed
0.8%.
2 49

SUsing formulas (6.22), we can calculate permissible standard
errir .with i'ipet, to excitation •field phase for a parabolic antenna.
Thus, with'ajlar£e correlation interyal,
2 0 AG
, ." (6.27)
(6.28)
When AG/G 0 O.I,'4a '=.02 rd 18.03. With a permissible errorof AO0 - m nan AG7G'. 0 08%. Permissible standard error with respect
to phase, in this case, 1s" .' ' ," :,,, ",. " rad '_.
, .,O8)I2 0,) p = .5o.
These are rather 'high requirements for an antenna excitation
field. Therefore, higher requiremient's are iinposed on accuracy in
building and ensuring rigidity of antennas for monopuise systems.
If unbalance of the aiitenna with respect to amplification occurs
because of random errors,, ,in the calculation of permissible phase
and amplitude errors in the excitatkion field distribution of array
and parabolic antennas, we can use formulas (6.19), (6.21), and
(6.22).
Let us examine the effect on direction finding accuracy of non-
identity of amplitude-phase characteristics for receiving channels
of monopulse systems.
§ 6.3. THE EFFECT OF NONIDENTITY OF AMPLITUDE-PHASECHARACTERISTICS FOR RECEIVING CHANNELS OF MONOPULSESYSTEMS ON DIRECTION FINDING ACCURACY
The appearance of nonidentity of amplitude-phase characteristics
for receiving channels is caused by the difficulties involved in
making parts with strictly prescribed allowances, the inevitable
250

processes of aging,, and the related changes in their parameters,
a possibie'-detuning of circuits during equipmentoperation, and
various.types of mechanical and climatic effects.
In studying the effect of nonidentity of amplitude-phase
characteristics, it is expedient that the receiving circuit bedivided into two parts: into the high-frequency part including the
antenna-waveguide receiving circuit up to the i-f mixer and the part
of the receiving circuit operating on intermediate frequency. The
advantage of. this division, ensues from the fact that in studying
the effect of imperfection in the channels of the h-f amplifier, we
can disregard the pulsed character of the signal received since the
bandwidth of these channels is virtually always greater than the
spectral width of the signal. As for i-f amplifier channels, this
is not always valid and we should take into account the relationship
between the spectral width of the signal and the bandwidth of the
i-f amplifier [55]..
To simplify the analy- %• ' ne effect of nonidentity in the
amplitude-phase charteristics, we slill first examine the case
of direction findink in a continuous signal emission mode when
we do not takz .,,-o account limitations on the bandwidth of the i-f
amplifier. U,- the degree and character of the effect of
imperfections in the amplitude-phase characteristics depends, to a
certain extent, upon the construction of the direction finding
system, we shall perform analysis with respect to the most commonly
used types of monopulse systems.
6.3.1. The effect of nonidentity of amplitude-phase characteris-tics in an amplitude-amplitude monopulse system on direction findingaccuracy. A simplified block diagram of an amplitude-amplitudemonopulse system is presented in Fig. 1.7. We shall assume thatthe target is tracked with small angular errors e and linearizationof the radiation pattern in the region of equisignal direction isvalid. If the receiving channels have out-of-phase quantity I andhigh-frequency transmission factors (up to the i-f amplifier)
251

a I andek2 , signals at thc output of the i-f' amplifier with logarithmic
characteristics 'can be represented in the form of the followingexpression:
Lt01, (.). -- vo.,ln n ,Y ,,nF (00 ! -. •.) exp i,(w,,., + ,)
(6.29)
us (t, 0)-= ic, n ic.E. F (0o) (17 __q)e"p io' (6.30)
where k0 1 and k0 2 are coefficients characterizing the steepness
of the amplitude characteristics of the first and second i-f
amplifiers..
At i-f amplifier output, signals are detected and compared
with respect to amplitude by subtraction, forming, with linear
signal detection, errors in accordance with expression
-S( ,(t, 0)()I ,(t,; 0)1.% (6 .31)
Substituting expressions (6.29) and (6.30), we obtain
S(o) =Ko2 [go F In •o(+•+O) -- n+ 14. I I --E ( )!I(6.32)
where
go== EO = E,,F(O0).go•Ke a •
Taking into account the earlier assumptions on smallness of
target finding errors, expression (6.32) can be simplified:
S(0) =4- ojgo0 •1•cEo 0+go.In(1+4p0)-
-1f+2E4--n(1-pO)j=x0. I(k'e 9 (g.-I) ] (6.33)
252

Eqdating (6.33)0 zero and solving relative to pe, we find
the Q.Lrection finding c6ndition in the form
(6.34)
With identical amplitude characteristics for the receivingchannels (go= 1; k, k2 )
I • (6.35)
In this case S(6) = 0 when 0 = 0, which corresponds to thecondition of direction finding without equipment error.
A comparison of expressions (6.311) and (6.35) shows that non-
identity of amplitude characteristics for receiving circuits ofamplitude-amplitude monopulse systems leads to the appearance o fsystematic direction finding errors whose value depends upon thevalu, of nonidentity.
If nonidentity occurs only in high-frequency receiver circuits(go = 1 and kI # k2 ), the value of direction finding error isdetermined by expression
0 "- In g2
(6.36)
where g = kl/k 2 .
When kI = k2= k and go X 1 direction finding errors can be
calculated from formula
I-e(io)( " - In ICEo. (6.37)
253,
41,.

From expression (6.37) it follows that with nonidentity of
,,amplitude characteristics of logarithmic receivers, signal standardi-
zation is disturbed and err~or signal becomes dependent upon the
level of signals received. Thus, an increase in the input signal
to the square leads to a doubling of direction finding errors.
Figure 6.6 presents the dependence of generalized angular error
on nonidentity of receiving channel transmission factors, calculated
from formula (6.36). If we know the steepness of the direction
finding characteristic with respect to generalized direction finding
error, we can determine the absolute value of angular direction
finding error with any given nonidentity of amplitude characteristics
for receiving channels. Thus, for example, if v = 0.25 1/deg, non-
identity of channels wifh respect to high frequency is 10% (g = 1.1),
equipment error in direction finding is 0.2 deg. It is easy to cal-
culate the permissible nonidentity of amplitude characteristics for
high-frequency channels with any given allowable error.
Fig. 6.6. Dependence of generalized angular error in directionfinding on nonidentity of transmission factors of receiving channelsin an amplitude monopulse radar.
254
"4 --

The dependence in Fig. 6.'6 can be used for evaluating direction
finding errors when g = 1 and go X 1 if by the quantity jeil
we mean the standardized quantity i and instead of g we usel n kE 0
go-
The obtained results of analysis also show that phase non-
identity of receiving channels does not affect the accuracy of
amplitude-amplitude monopulse systems. We can see that the con-
clusions with respect to the effect of nonidentity of amplitude-
phase characteristic for receiving channels in amplitude-amplitude
monopulse systems with logarithmic receivers are valid also for
cases when receivers are used with linear and quadratic characteristics.
We have examined the case of small angular deviations when the
diiection finding system operates in linear mode.. In a number of
cases because of considerable unbalance of receiving channels with
respect to amplitude, direction finding errors can go in value beyond
the linear section of the direction finding characteristic. In this
case, the problem of finding direction finding errors is solved in
general form, approximating the radiation pattern with the appropriate
functions. Since in the great majority of cases equipment errors
are small, such a complication of calculations is not necessary and
we will not attempt It here.
Let us proceed to an examination of another type of monopulse
system.
6.3.2. The effect of nonidentity of amplitude-phase characteris-
tics for receiving channels of an amplitude sum-difference monopulse
system on direction finding accuracy. A simplified block diagram of
an amplitude sunm-difference monopulse direction finding system is
presented in Fig. 1.9. Let the transmission factors of the high-
frequency receiving circuits up to the sum-difference converter
be, respectively, k1 and k 2 , and nonidentity with respect to phase
be expressed by quantity 4. Then the sum and difference signals at
summator output can be represented by the following expressions:
255

2~ t2 (t. ON~
4Ee [(I +.ýO) expi (64 +q )g(i -F0)expi4, (6. 38)
=4 (1 +.uo)expV (t+4*) -w +(I.--)exiwt], (6.39)
where E (t, e) and E20(t, e) are mathematical-expressions of signals
received by the first and second high-frequency receiving channels:
At i-f amplifier output of the sum and difference channels,
respectively, we obtain
o(4, o0)= Eoice [(I + ,,) exp i(•,.t + I + Y) ++u g. (I -- to) exp i (w,,•t + V)I, (6.40)
•(t, 0)• EoK.P [(I +1-.) exp(®•-.)---9( - O exp Iw l (6.41)
where kc and kp are the transmission factors of the sum and difference
channels, respectively;
y is the quantity of phase nonidentity for sum and difference
channels.
In the error signal detector of the direction finding system
the sum and difference signals are multiplied and high-frequency
components filtered. Because of this, error signal) taking standard-
ization with respect to sum signal into account, can be represented
as
S(") Re Uo (1, 0) u p(t, 0)=
.Xp (10 +p.O)' - g' (V -0)'1 cos y+ 2g (I W6'1') sin ~siny)e - .- - -2 (6.42)
256

Hence the condition for target finding is determined by
equation
[(l~ ~ 9 1-&)0- e i -)21 cost + 2g (I p"610) sin + sin =0."(6.43)
Solving this equation with respect to pO, we obtain the
following expression determining the value of generalized angulardirection finding error as aftunction of the character and value of
nonidentity of amplitude-phase' characteristics for receiving channels
in an amplitude sum-difference monopulse system:
s+ =2- __ + 2g__ -± _ s .(1-g) -..2gtgsin+ (6.44)
O' practical value is the solution with a plus sign determining
the steady state of the direction finding system-with comparativelysmall angular errors. Solution with a minus sign gives higher value
of generalized errors and is not valid with the assumption made on
operation in a linear region of the direction finding charactaristic.
With identical characteristics of receiving channels expression
(6.42) is transformed into the familar expression correspondingto the case of direction finding without equipment errors:
SO) o. (6.45)
Differientiating expression (6,42) with respect to 0, we find
the expression for steepness of direction finding characteristic
at the working point:
.. S (o).i Cp 4g(g2gcosY+Cos(_y)+gg•+ o (ý_y) I, KO! (l+ g '+ 2g cos f) I 4(6 .46 )
Comparing expressions (6.42) and (6.45), we see that nonidentity
of amplitude-phase characteristics for receiving channels affects
257

direction finding errors. In order to understand the character of
the dependence of direction finding errors on nonidentipy ofj
receiving channels, we shall examine a number of particular cases..
Case 1. Amplitude-phase characteristics of sum and difference
channels are identical; high-frequency channels are identical with
respect to phase but nonidentical with respect to transmisai.cn
factor.- In this case kp = kc =k; y = O; = 0;g i.
Substituting these values into expression (6.44) and performingelementary transformations, we obtain the equality
.g+1' (6.47)
indicating.that nonidentity of amplitude characteristics for high-
frequency channels in an amplitude sum-difference monopulse system
leads to a displacement of equisignal direction and additional
direction finding errors.
Since high-frequency receiving circuits in a sum-difference I
direction finding system usually do not contai, effective elements,
their identity generally will depend upon the identity of their
matching and electrical length in the operating frequency band. i
Therefore, when designing and making the waveguide-feeder:lines
which are the high-frequency channels of a direction finding system,
we should give particular attention to their quality and accuracy.'
4(t~eJ .~ ,E*---.e
! I-$p
A
Fig. 6.7. Diagram of a slotted balance bridge.
258

. , |
.
I I;
One of the important elemients of high-frequency circuits in
"monopulsq radars is the waveguide bridge for sum-difference signal
, ''proo~s:g. This bridge is illustrated in Fig. 6.7 where matching
in the arms is chaboacterizedlby complex reflection factors ri, and
the elemelnts. of phase tuning are donditionabLly illustrated by the
shaded inserts.I
In reference [131] it is shown-that taking into account im-
'perfect agreement. of arms, the sum and difference signals at bridge
output can be represented in the form of ,the following complex
expressiofis.:
(I[EI(,)( +2 -- E (r, 9) (t, + rttfVI+I -
2 ""(6.48)
EP (t, 0)~= [~~1ai 4 -- I .I 2 ( 3 1.
'I• • J (6.49)
wher?, with respectt to amklitude direqtion finding,
SA't, 0)_��E"F ( +o) (1-Q,)expipt,; • (6.50)
"* ' d�Mt, 0) Emf(0o (l --. 0)expiwt. (6.51)
i !
Because of the fact that thp quantities ri are complex quantities,
unmatching of bridge arms causes not only a change in amplitudes
of sumland difference signal', but also a phase shift between thesesignals.
Disregarding phase signals for the sake of simplification,
the direction Vinding characteristic of an amplitude sum-difference
monopulse system taking into account matching in the waveguide
bridge can be represented in, the form
I259
' 259
I * I
-�S( , oR),. ( t. 0) , 'O
I .I(1:+ i�.�6)( *+ r r -( . p) (1± r,r+yj u (, +,O)' +..10 - (,i e + rr,).+
+(1 O) + (I P )J' " (6.52)-{ •.•.+ ~,+ 0o - • 0 + r,,r,) P(-2
Equating the numerator to zero and solving the equality with
respect to p6e, we find the dependence determining direction finding
error caused by the nonidentity of waveguide bridge channel matching:
2 + r. (r. + r,)
(6.53)
Since the reflection factor is connected with the standing
wave ratio (SWR) by the familiar expression
-•" F•KGB--!
._ KCB+ t' "(6.54)
The relationship O = f(r) can be considered vO = f(SWR) and
possible errors from arm mismatch in the waveguide bridge can beevaluated directly in terms of the permissible values of the corres-ponding standing wave ratios.
Case 2. Sum and difference channels are identical with respect
to characteristics; high-frequency channels are identical w"threspect to transmission factor but nonidentical with respect to
phase. In thts case kc = lp = k; Y = 0; g = 1; P # 0 and expression
(6.44) assumes the form pO = 0. This means that regardless of
the value of phase nonidentity for high-frequency channels, thereis no zero shift for the directton finding characteristic. But this
still does not mean that the operational capability of an amplitude-difference monopulse direction finding system, under the examined
260
A J

conditions,, remains normal since it is unknown how steepness ofthe direction finding characteristic changes in this case.
Using expression (6.46) and applying it to this case, we obtain
dS (0) 21i_
10--o (m+cos) "(6.55)
In normal direction finding conditions 0 = 0, and
dS() I()
When v = T expressions (6.38) and (6.39) are transformed as
te (t. 0)'EO [g (1 -- 4.) expJ Q--(It nt- 0) exp ioW)
0(6.56)
EP (t, .O- -Eo [g (I .-- O) expo wt +(I. Oexp io. (6.57)
Functionally the channels change places; the sum channel becomesdifference and the difference channel sum. Due to this, the operational
ability of the direction finding system breaks down completely.
Substituting f = ' into (6.55), we find
dS (0) _dOh ce=o t, (6.58)
which is a consequence of standardization with respect to dif.ference
signal, equal to zero when'0 = 0. This case is illustrated inFig. 6.8 where radiation pattevns with respect to sum and differencechannels "are presented schematically. There, however, for comparison
are presented the corresponding radiation patterns when ' = 0,corresponding to the normal operating conditions of a direction
finding system.
261
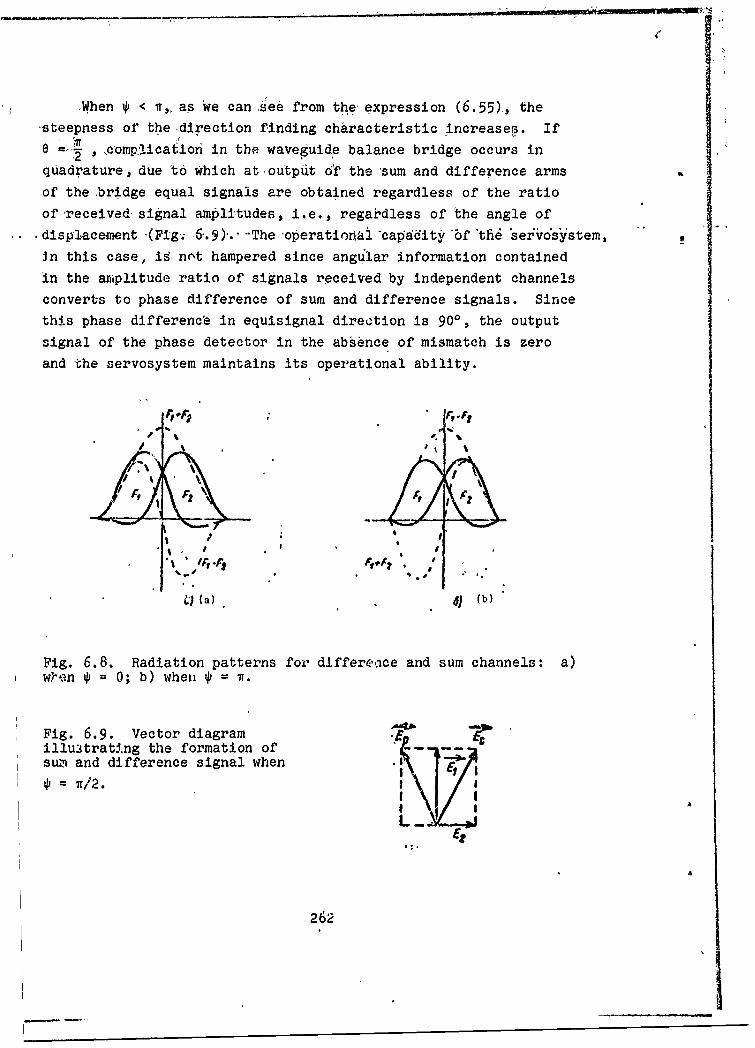
When p ,< , as 'we can see from the expression (6.55), the
-steepness of the .direction finding characteristic increases. Ife -A* , •comp.licafion in the waveguide balance bridge occurs in
quadrature, due to which at outpuit o6f the sum and difference arms
of the •bridge equal signals are obtained regardless of the ratioof-received-signal amplitudes, i.e., regaidless of the angle of
dispgacement -(Fig- 46.)." --The operatiomal "capadit' "bf "tfi se6rosystem,
in this case, ig not hampered since angular information contained
in the amplitude ratio of signals received by independent channelsconverts to phase difference of sum and difference signals. Since
this phase difference in equisignal direction is 900, the output
signal of the phase detector in the absence of mismatch is zero
and the servosystem maintains its operational ability.
r, .12F -A
- (a) 4J (b)
Fig. 6.8. Radiation patterns for differece and sum channels: a)w)en P = 0; b) when 1 =
Fig. 6.9. Vector diagramillu3trating the formation ofsu~i and difference signal when
S= �v/2.
262
We should mention that a 900 shift of signal circuit preceding
the sum-difýerence processor', in a number of cases, is specially
used for information conversionv,[45, 122].
When i and p 0 the sum and differencr signals are out
of phase. The state of the direction finding system with which............................ -• ........ o@....... . . .... ..
channels are out of phase can be considered undesirable, leading
to a crossover of channels and a disruption to some degree of its
stability.
Case 3. High-frequency circuit of receiving channels are
identical in amplitude-phase characteristics; sum and differenie
ch:v,%nels are identical in amplitude but nonidentical in phase. In
this case, g = 1; kc = k = k; P = 0; y X 0 and directi.on finding
conditions are determined in accordance with (6.42) and (6.46) by
expression
S ().= cos T, (6.59)
dS (0) I(6.60)
Equality S(O) = 0 is fulfilled when e = 0. This means that
zero shift of direction finding characteristic is absent. The
presence of phase nonidentity affects direction finding sensitivity
and steepness.
When y = + 900 error signal in the direction finding system
becomes equal to zero regardless of the value of the displacement
angle. Operation of an automatic trackiag system, in this case
becomes impossible. When 900 < y < 2700 the steepness of the direction
fJnding 4haracteristic becomes negative, which is equivalent to out-
of-phase condition and loss of stability in the servosystem of the
direction finder.
Thus, it is impossible to disregard phase nonidentity of sum
and difference channels. Although it does not lead to direct dis-
263
_
.0Acement Qo equisignal direction, its value must liewithin a
certain,-permissible range. $The value, of permissible nonidmntity
I can be determined based on the permissible decrease in directionfinding sensitivity. Thus, for example, if the permissible sensi-
tivity drop is 50%, then the permissible out-of-phase condition
",fbr sum aiid-dfffreric6 dkianne1g• i n notex&ned'" +6'0 "
Case 4. High-frequency circuits for receiving channels are'identical in amplitude-phase characteristic; sum and difference
channels are id~ntical in phase but nonidentical in amplitude. In
this: case g = 1; 4 = 0; y = 0; kc # kp and direction finding
conditions ,are determined by expressions
S1 . (6.61)
dS (6) 1I"dO i. 17-a (6.62)
, Error signal equals zero when 0 = 0 and a shift in equisignal
direction of the direction finding characteristic does not occur.
TheefCret of nonidentity of sum and difference channels is
apparent only on direction finding sensitivity, which can be char-
acter±ied by formula
W7.. ' - Ke (6.63)
Change in sensitivity is directly proportional to unbalance of
one of the channels with respect to transmission factor. Thus, ifthe permissible sensitivity Icss is expressed by quantity 0.5, the
transmission factor of the difference channel must not be less than
half the transmission factor of the sum channel.
Case 5. Receiving channels before and after sum-difference
converter are identical in ampl!.tude characteristics but nonidentical
264

in phase characteristics. In this case, g = 1; kc = kp = k;
9d 0, y -ý 0 and direction finding conditions for the system, as
follows from (6.44) and (6.46), are determined by eXpressions
l - -+ 1/1 +n2 Si tge -
sin ý t9 y (6.64)
"dS(O) 2' 2j•cos"
1' (6.65)
Expression (6.64) is analogous to the expression obtained by a
somewhat different method in reference [86].
When ' = 0, y X 0 (case 3) p0 = 0.
The effect of phase unbalance is apparent only in the direction
finding sensitivity. When y = 0, X , 0 (case 2); similarly p0 = 0.
Thus, systematic selection finding errors appear only during phase
nonidentity of high-frequency circuits and sum and difference
channels simultaneously.
-50 ~ ~ Ol -7 6 :.. ,
00
• I .--- 0 1
.-,
Fig. 6.10. Dependence of generalized direction finding error onvalue of out-of-phase condition for sum and difference receivingchannels calculated with various values for out-of-phase conditionof high-frequency channels.KEY: (1) deg.
265

Figiire-6.10 presents the values of generalized errors calculated4 1 according to formula (6.64) for various values of out-of-phase con-
dition for receiving channels. Using calculated data and prescribing
the yaltiu of airection finding sensitivity, we 9an determine angularsystematic error as a function of the. value of phase nonidentity ofchannels. in an amplitude sum-difference'monopulse system. Thus,
for example, when p 0.25 1/deg, y = 450, 10 = 10 and 450, systematicangular error, respectively, is 0.350 and 1.270. If permissibleerror is taken as one minute, nonidentity in phase of high-frequency
_circuits with y = 450 must not exceed J = 0.50.
Results of analysis show that amplitude sum-difference monopulse
systems unlike amplitude-amplitude monopulse systems require a
rather high-quality in-phase condition for high-frequency receivingchannels.
Taking into account the substantial effect of phase unbalancein high-frequency circuits on target finding accuracy, in designinga radar the waveguide bridge intended for sum-difference signal
processing should be located as near as possible to the antennain order to reduce the possible nonidentity with respect to phase
in high-.frequency circuits.
Without going into a detailed analysis, we should examine
a method for analyzing the effect on direction finding accuracyof nonidentity in amplitudb phase characteristics of receivingchannels, taking into account the nonlinearity of the direction
finding characteristic. For this we shall approximate the amplituderadiation pattern with respect to voltage by a Gaussian curve [44]:
12a
F (8) =exp( 0 o2e (6.66)
where a = 2,776/00.5,
e0 5 is the width of the antenna beam with respect to half-power level.
266

For •th6 case of mutually independent feeds, signals at antenna
output in each channel will be proportional
2 (6.67)
e _' )= 06 1 j (6.68)
where E(t) is a function determinirg the signal entering antenna
system input from the target.
The signal in the sum and difference channel can be expressed
as
S(t, 0) - Ak (t)ofe (0., 0),(6.69)
(6.70)
where Fc(0 0 , 0) Fpe0, 0) are the sum and difference radiation
patterns with respect to voltage.
Obviously,
PC 003o 6)= exp -T 0 [
F + Lo, ( 2 ) j
f '2exp O) c (ao00).. F(6.71)
Analogously we can show that the difference radiation pattern
Fp(00, 0)" V xp--r (0+/2 sh(a.0oO). (6.72)
267
/ With a given approximation of radiation patterns the directionfinding-characteristic of the system,. without taking into accountnonidentities of the amplitude-phase characteristics for receivingchannels, can be represented in the form
.. t. )A (t . 0 )% (6.73)
The expression obtained shows that error-zignal is related by
nonlinear dependence with the angle of target deviation from equisignal
direction and only with small angular errors'can it be expressedby linear function
S ()) a, 0.0.(6.74)
Steepness of direction finding characteristics in equisignaldirection is defined as
SdS.(O)_j '-0. (60 (6.75)
Substituting the value of a0 in (6.75) and assuming e0 =0.50 2,
we find 1,k (6 .76)
Given the width of the radiation pattern with respect to halfpower level, we can determine the value of direction finding char-acteris ,c steepness, and knowing the steepness, it is easy tocalcul from the above calculated dependences direction findingerrors th any possible nonidentities of amplitude-phase char-acter• cs for receiving channels of the system. The dependence ofdire.- n finding characteristic steepness on radiation patternwid nd the amount of its maximum deviation from antenna axiscan determined by this method for any approximation of radiationpa taking into account the nonidentity of characteristics for
re ing channels.
268
I6.3.3. 'he effect of nonidentity in amplitude-phase characteris-
tics of receiving channels for a phase-phase monopulse system on
direction" finding accuracy. A simplified- block diagram of a phase-
phase-monopulse sys.tem is presented in Fig. 1.8.
Earlier it was shown that signals at output of thet first andSsecond channels 6.L'the antenna in such a system can be repr'esented
by expressionZ', t O=EmP (0) exp i (6-77) '•
Si (Wt(6.78)
in et us assume that tpuansmission factors for.recevng channelsare ki and k2t respecttvely, and phase shift in one channel is900- + •.Then at the amplifier channel output we have
u, (t, 0)- (, 0r -exp i W ePt --+9(6-79)
L2 (t, ) -Uo(,,exp A ®?+ 90), (6.80)
Sand at phase detector output, taking into account limitation of
sgaswitA-h respect to amplitude in the receiving circuits
S () ) *2(,61-R ca U2 exp i (AT -- 90 -
-) -- : UOTPsn(•-} ) (6.81)
Substituting into (6.81) the value of A• and equating error
signal to zero, we obtain
orsn O--A' (6.82)
269

+in8~ - - (6.83)
With automatic target tracking angular errors are comparatively
small and sin e z 0. Hence it follows that
I.s t (6.84)
or
06,5 (6.85)
Equality (6.85) shows that phase unbalance of receiving channels
leads to the appearance of angular direction finding errors directly
proportional to the value of phase unbalance. Direction finding
errors for phase servosystems do not depend upon.the value of the
measurable phase difference caused by target deviation from equi-
signal direction [65].
As for amplitude unbalance of receiving channels, the use of
limitation excludes its effect on direction finding accuracy in
phase-phase monopulse systems. This agrees with the conclusion inreference [55].
"6.3.4. The effect of nonidentity of amplitude phase character-
istics for receiving chainels of a phase sum-difference monopulsesystem on direction finding accuracy. A simplified block diagram
of a phase sum-difference monopulse system is presented in Fig. 1.11.
The same designations for phase and amplitude nonidentity are used
as were used in our study of amplitude sum-difference monopulse
Ssystems. Signals at waveguide bridge output can be represented in
a form of the following expxecssions:
+ g 2xp 7 1i AT (6.86)
270
where
At the output of the sum and difference channel
he (t, 6 )-= E.. [exp i av + At -Y2
A -(6.89)-5-Y-T -gexpi CO ---L •Y • • (189
At phase detector output, taking into account sum signals tandardi zat:1on,
S(0)= Re 4(1, 0) i&*p(t,.0)Uh ((, 0) =*o (t, 0)
-_p [(1 -g)'slny + 2 sn (A? + ') cos2yK0 (1 +g) 2e 2g cos ((FL +) - (6.90)
Hence the condition of equilibrium fointhe direction finding
system is determined by equation
(I --. g^-) sin y+ 2g sin (A? -+ +) cos y 0 . ( 6.91 )
Solving this equation relative to A', we find
A A=.arcsin 2g. igyj (6.92)
Substituting into (6.92) the value of A' = 1_ and taking
into account equality 80.5 = X/1, we obtain the following formula
for direction finding, error:
271
I- .... .. .-
-- n ar""Tp- t --J (6.93)
Let us examine a number of practical cases.
Cbs'e l:'H'•'gf-rdjuen'cy circuits are identical in phase but non-
identical in transmission factor; sum and difference channels have
identica: amplitude-phase characteristics. In this case; ' = 0;
g # 1; kc = kp = k; y = 0.
Substituting these values into equations (6.90) and (6.93), we
find"2gsin A?S• $ (0 = (-1 + 02) +.,2gSos Al "w
o ' (6.94)
0.-•.0.
Consequently, amplitude unbalance for the high-frequency :part
of the receivers in a phase sum-difference system., does not especially
affect direction finding accuracy; the zero of the direction finding
characteristic is not shifted and only direction finding sensitivity
changes, but insufficiently.
Case 2. Sum and difference channels are identical in character-
istics; high-frequency channels are identical in transmission factor
but nonidentical in phase shifts. In this case, kp = k= k;
y = 0; g 1 1; ' # 0 and for comparatively small direction find'ing
errors
(6.95)
9T,,, (6.96)
12
272 '
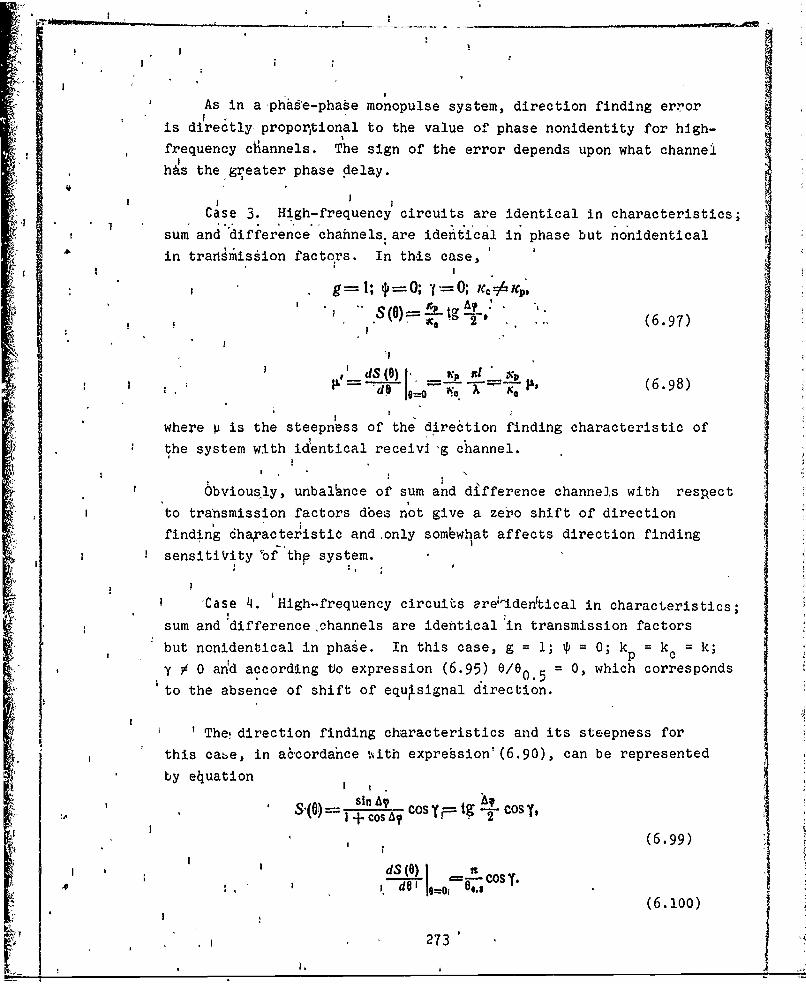
1'-
As in a phase-phase monopulse system, direction finding erroraI -
is directly proportional to the value of phase nonidentity for hJgh-
frequency ckannels. The sign of the error depends upon what channei
has the greater phase delay.
in I trrIisonat~ InticaeCase 3. High-frequency circuits are identical in characteristics;
sum and difference chahnels. are identical in phase but nonidenticalSin transm'ission facto ;rs. In this case,
g 1; 0; Y ; . P
' "" S(O)= A tg-2 . (6.97)
'dS (0) NP ', o(6.98)
where p is the steepness of the direction finding characteristic of
lthe system with identical receivi-g channel.!
O Obvious.ly, unbal~nce of sum and difference channels with respect
to transmission factors dbes not give a zero shift of direction
finding dharacteiistic andonly sombwhat affects direction finding
sensitivity bf'thp system.
'Case 4. aHigh-frequency circuits erel.den~tical in characteristics;
sum and 'differencechannels are identical'in transmission factors
but nonidentical in phage. In this case, g = 1; = 0; kp = kc = k;
y ' 0 and according to expression (6.95) /0/0.5 = 0, which corresponds
to the absence of shift of equjsignal direction.
St The! direction finding characteristics and its steepness for
this cabe, in a6cordahce hith expressionl(6.90), can be represented
by equation
SiS.(O) •-inA coshy tg t Cosy,a. a.' S'(0)~+c ,Cos y1g-C2 T
(6.99)
a dS (0) n==-COST.
(6.100)
a. ,1 a. 273
!I
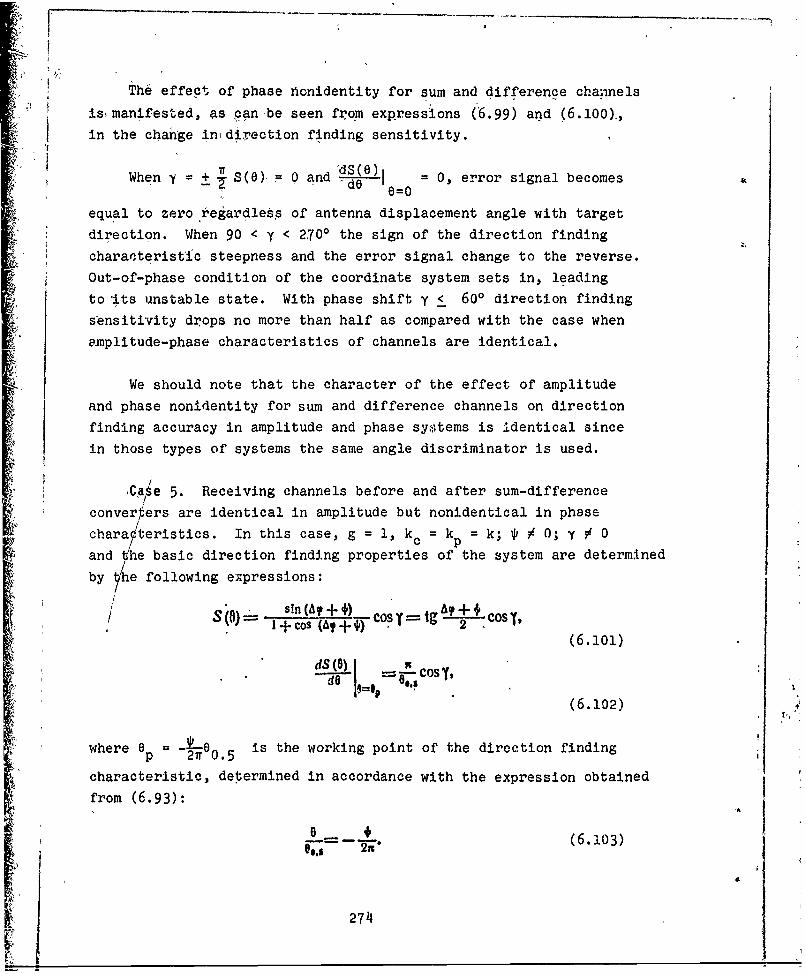
The effect of phase nonidentity for sum and difference channels
is• manifested, as can be seen fx~om expressions (6.99) and (6.100),,
in the chahge infdirection finding sensitivity.
S~ds(e)lWhen -y = S(O)= 0 and '-- - 0, error signal becomes
e=0
equal to zero regardless of antenna displacement angle with target
direction. When 90 < y < 2.(0 the sign of the direction finding
characteristic steepness and the error signal change to the reverse.
Out-of-phase condition of the coordinate system sets in, leading
to its unstable state. With phase shift y < 600 direction finding
sensitivity drops no more than half as compared with the case when
amplitude-phase characteristics of channels are identical.
We should note that the character of the effect of amplitude
and phase nonidentity for sum and difference channels on direction
finding accuracy in amplitude and phase systems is identical since
in those types of systems the same angle discriminator is used.
Ca e 5. Receiving channels before and after sum-difference
converpers are identical in amplitude but nonidentical in phase
chara teristics. In this case, g = 1, kc = kp = k; 0 # 0; y ý 0
and 'he basic direction finding properties of the system are determined
by he following expressions:
/ S"O) On Cos Y Sf A Atg c+ CS- +cos (A?+ .02(6.1Ol)
dS (0) ~ CS
(6.102)
where p = -0 s the working point of the direction finding
p1 0ir.5 icharacteristic, determined in accordance with the expression obtained
from (6.93):
e-s- =-. (6.103)
274
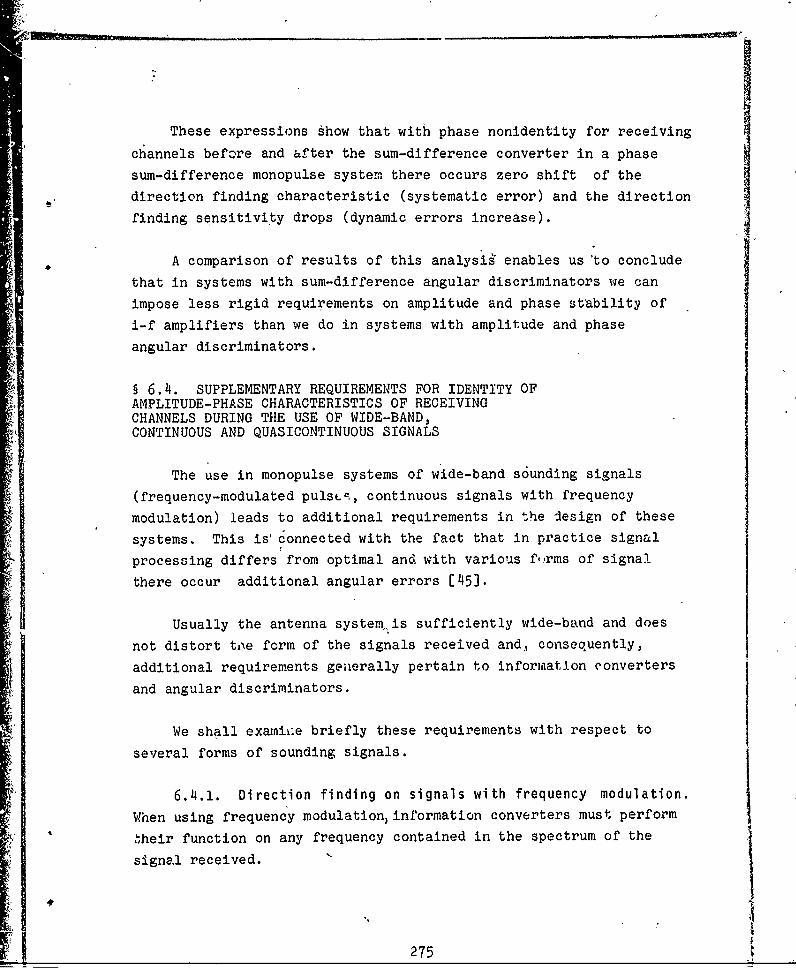
?IThese expressions show that with phase nonidentity for receiving
channels before and after the sum-difference converter in a phase
sum-difference monopulse system there occurs zero shift of the
direction finding characteristic (systematic error) and the direction
finding sensitivity drops (dynamic errors increase).
A comparison of results of this analysis enables us'to conclude
that in systems with sum-difference angular discriminators we can
impose less rigid requirements on amplitude and phase stability of
i-f amplifiers than we do in systems with amplitude and phase
angular discriminators.
§ 6.4. SUPPLEMENTARY REQUIREMENTS FOR IDENTITY OFAMPLITUDE-PHASE CHARACTERISTICS OF RECEIVINGCHANNELS DURING THE USE OF WIDE-BAND,CONTINUOUS AND QUASICONTINUOUS SIGNALS
The use in monopulse systems of wide-band sounding signals
(frequency-modulated pulsi', continuous signals with frequency
modulation) leads to additional requirements in the design of these
systems. This is' connected with the fact that in practice signal
processing differs from optimal and with various f,.rms of signal
there occur additional angular errors [45].
Usually the antenna system.,is sufficiently wide-band and does
not distort ti~e form of the signals received and, consequently,
additional requirements generally pertain to information converters
and angular discriminators.
We shall examii.e briefly these requirements with respect to
several forms of sounding signals.
6.4.1. Direction finding on signals with frequency modulation.
When using frequency modulation)information converters must perform
,,heir function on any frequency contained in the spectrum of the
signal received.
-! 275

The use of a double waveguide T-Joint ensures sufficient wide-
band conditions for an informatio', converter. As for phase switchers
they perform their function only with small relative frequencydeviations. We see this in the example in [451.
Let at input of a monopulse system a signal with linearfrequency modulation enter
(t) - Em exp iot,
(6.lo4)
where w = + wt'(t-0.5T ) is instantaneous frequency;
Sis mean signal frequency;•, dwat is the signal frequency change rate;
T is the frequency modulation period.
The instantaneous phase of this signal is
7 5d ='dL(M', -0,5M'T1) t+O0,50T + fp. (6.105)
The phase switcher can be similar to the delay device. T'Jen
the phase of the signal delayed by time T is determined by expression
y= (0,-- 5o•'T,) (t+)+0,50 (t -oC,)+, (6.106)
and phase difference corresponding to time shift T is determinedby the following time function:
(6.107)
In accordance with this, error signal at output of angular jdiscriminator during target finding on signals with frequency modula-
tion will also be a function of time, which reduces direction finding
accuracy and the interference immunity of the system.
2761'4
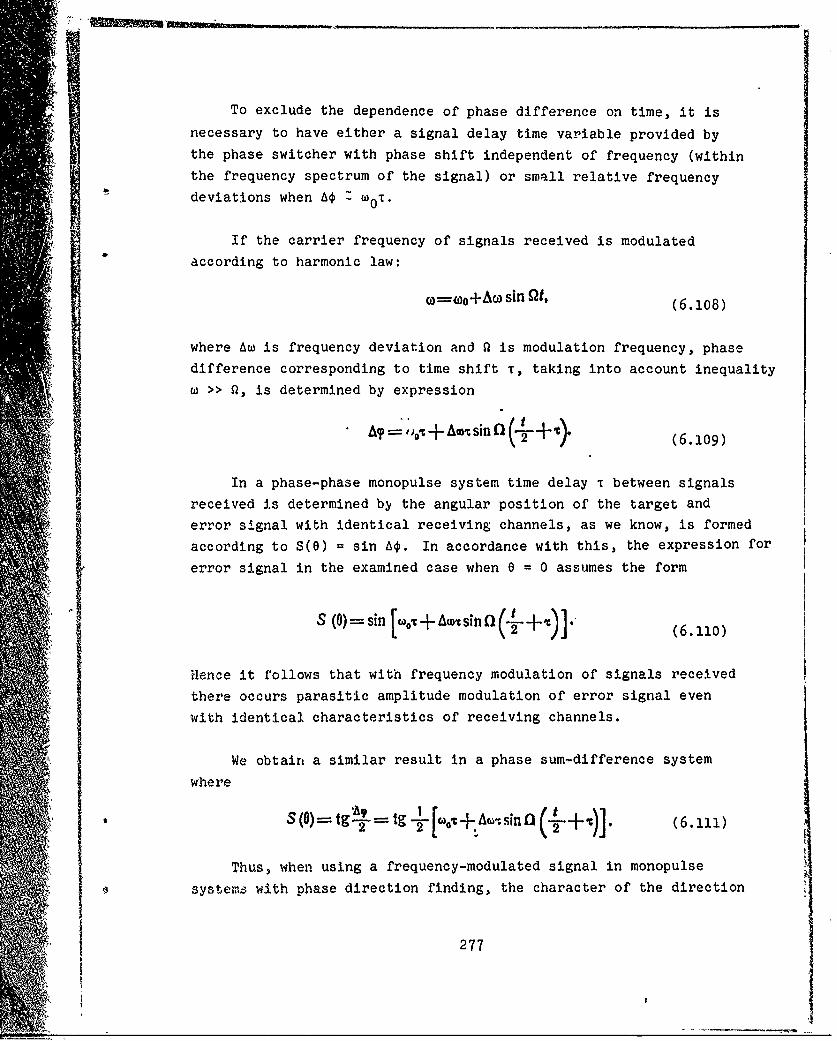
To exclude the dependence of phase difference on time, it is
necessary to have either a signal delay time variable provided by
the phase switcher with phase shift independent of frequency (within
the frequency spectrum of the signal) or small relative frequency
deviations when A Z wo T.
If the carrier frequency of signals received is modulated
according to harmonic law:
o)=o-o+A) sin Ot, (6.108)
where Aw is frequency deviation and 0 is modulation frequency, phase
difference corresponding to time shift T, taking into account inequality
w >> 9, is determined by expression
2 =,.i +)
In a phase-phase monopulse system time delay T between signals
received is determined by the angular position of the target anderror signal with identical receiving channels, as we know, is formed
according to S(O) = sin Aý. In accordance with this, the expression for
error signal in the examined case when 0 = 0 assumes the form
S (0)=si 0%+A= s inQ (6.110)
Hence it follows that with frequency modulation of signals received
there occurs parasitic amplitude modulation of error signal even
with identical characteristics of receiving channels.
We obtain a similar result in a phase sum-difference system
where
SA(P)=tg g t±[o.C + Aw-sin Q(L. .+ %)] - (6.111)
Thus, when using a frequency-modulated signal in monopulsesystenz with phase direction finding, the character of the direction
277
[I

finding function is distorted and parasitic amplitude modulation
of error signal appears, reducing direction finding accuracy. There-fore, in systems with phase direction finding it is permissible to
use a frequency-modulated signal with a small relative frequency
deviation.
In monopulse systems with amplitude direction finding and
identical receiving channels the effect of a frequency-modulated
signal appears in the dependence of the amplitude radiation patterns
on frequency and in the parasitic amplitude modulation of error
signal and, as a consequence, reduces accuracy.
With nonidentical amplitude-phase characteristics for receiving
channels the effect of a frequency-modulated signal on direction
finding accuracy intensifies and error increases. Therefore, when
operating with frequency-modulated signals, requirements for identity
of amplitude-phase characteristics for receiving~channels are higher
than with signals discussed earlier. These requirements can be
evaluated with the method described above for each case.
6.4.2. Direction finding on continuous and quasi-continuous
signals with speed selection. Examples of monopulse direction
finders with speed selection are presented in Chapter 1. The
characteristic peculiarity of sucn systems is the measurement of
angular target coordinates after the selection of signals with respect
to doppler frequencies. Therefore, each receiving channel includ.es
a doppler filter terminating in a phase detector.
Since the doppler shift of signal frequency depends upon speed,
course parameters, and aerodynamic properties of the target and,
under actual conditions, varies within a wide range, in direction
finding systems using speed selection there are imposed particularly
high requirements on identity of doppler filter characteristics.
Having a narrow band and great steepness of phase-frequency char-
acteristics, such filters, with insufficient identity of characteris-tics and a change in doppler frequency shift during target tracking
basedm speed, can create large equipment errors in the direction
278 3
finding system. To lessen 'his we must turn to frequency stabiliza-
tion of signals entering h, doppler filter to the phase detector.
Requirements for id ',tity of receiving channels during operation
on signals of quasi-cont.iuous and continuous type are similar.
6.4.3. Direction 'Hiding during the use of pulsed signal
compression. As we kr)., for the purpose of preserving high resolu-
tion with respect to r.n";e and of improving the power ratios withlimited peak power, wc resort to an expansion of the working pulse
and interpulse freque:,oy (phase) modulation. Such a pulsed signal,after having passed tirough the optimal filter of the receiver,undergoes compression with respect to width.
Pulse width compression is brought about by thn fact that theoptimal filter creates delay of each central component of the signal
in accordance with its frequency in such a manner that the low-frequency components are delayed longer and the high-frequency
components are 0hlayed less. This ensures, at a certain moment oftime, phase addition of all frequency components and formation zfa short pulse of high amplitude.
Nonidentity of medium tuning frequencies for optimal filtersleads to a variation in the signal amplitude ratio, the appearanceof parasitic phase shift, and frequency modulation, which causes acorresponding variation in error signal and a reduction of direction
:jnding accuracy. If the medium frequency of the signal and thenonidentity of optimal filter tuning are stable in time, error signaldistortion in a direction finding system can be removed by tuning
the equipment. In the opposite oase, a reduction in both accuracyand interference immunity is inevitable.
Nonidentity of filters can be apparent in the nonagreement of
frequency change rates and the envelope of pulse filter response
with the corresponding parameters of the input signal. In this case,
even with identity of filter medium frequency tuning, parasiticphase shifts and residual frequency modulation can reach a significantvalue.
279

Hence, it follows that the provision of a certain degree bf
optimal filter identity in monopulse direction finding systems
operating on pulsed signals with frequency modulation is very
important.
Given the values of permissible parasitic phase shifts and
residual frequency modulation, we can determine the requirements
for identity of optimal filters from formulas [45].
Ap = 0,5 (arctg £± arctg C4-BO c, (6.112)Ah .
Cf=-In -_- -2-B•21'I +q-+2 +q- (6.113)
where
ae. asa0 + a 2
4= (+a+ w'
Ah is the difference in frequency change rates;Sa0 -is the coefficient characterizing the change rate of
the input signal envelope;Wc is the change rate of the input signal feuny
a1 and a2 are coefficients characterizing the variation insigna± envelope with~ passage through optimal filters of the firstcand second receiving channels;
•land w2 are signal frequency change rates withpasgS~through optimal filters of Ihe first and second receiving channels.
280
§ 6.5. DESIGN METHODS OF DECREASING DIRECTION FINDINGEQUIPMENT ERROR
Methods of decreasing equipment error arp varied. They include
technological methods connected with the perfection of the technologyinvolved in making separate units and elements of equipment; opera-tional methods connected with the preparation of equipment for work,
its tuning, calibration, and operation; and design methods connected
with working out schematic solutions which enable us to reduce sub-
stantially or comp2etely exclude the ef.'ect of nonidentity in ampli-Lde-
phase characteristics of receiving channels.
Of greatest interest are the design methods covering various
procedures for uniting the receiving channels of monopulse radars,
stabilizatieq of intermediate frequency, cross-switching of receiving
channels, and a number of others.
Let us pause on the question of joining receiving channels.
The essence of this lies in the fact that instead of two or three
receiving channels necessary in accordance with the principle of a
monopulse radar, one channel is used functionally replacing the two
or three channels. Since, in this case, the extent of the separatechannels is reduced to minimum, equipmenot errors caused by nionidentity
of characteristics for these channels are also reduced. At the
present time there are many methods enabling us to join functionally
the receiving channels into a single channel. We should examine
some of them.
6.5.1. A method of joining receiving channels on high frequency.
The simplified system whose block diagram is presented in Fig. 6.11
relates to one of the first .,ionopulse radars with amplitude direction
finding, designed for determining coordinates in one plane [1241.
The antenna system of this station consists of two parabolic
reflectors mechanically connected to each other, one of which is
receiving and the other transmitting. This design of antenna system
makes it possible to avoid problems connected with the switching
of high-frequency circuits to reception and transmission.
281
• . 2 2 z - _ ... .. . .. . . . . . . . . .
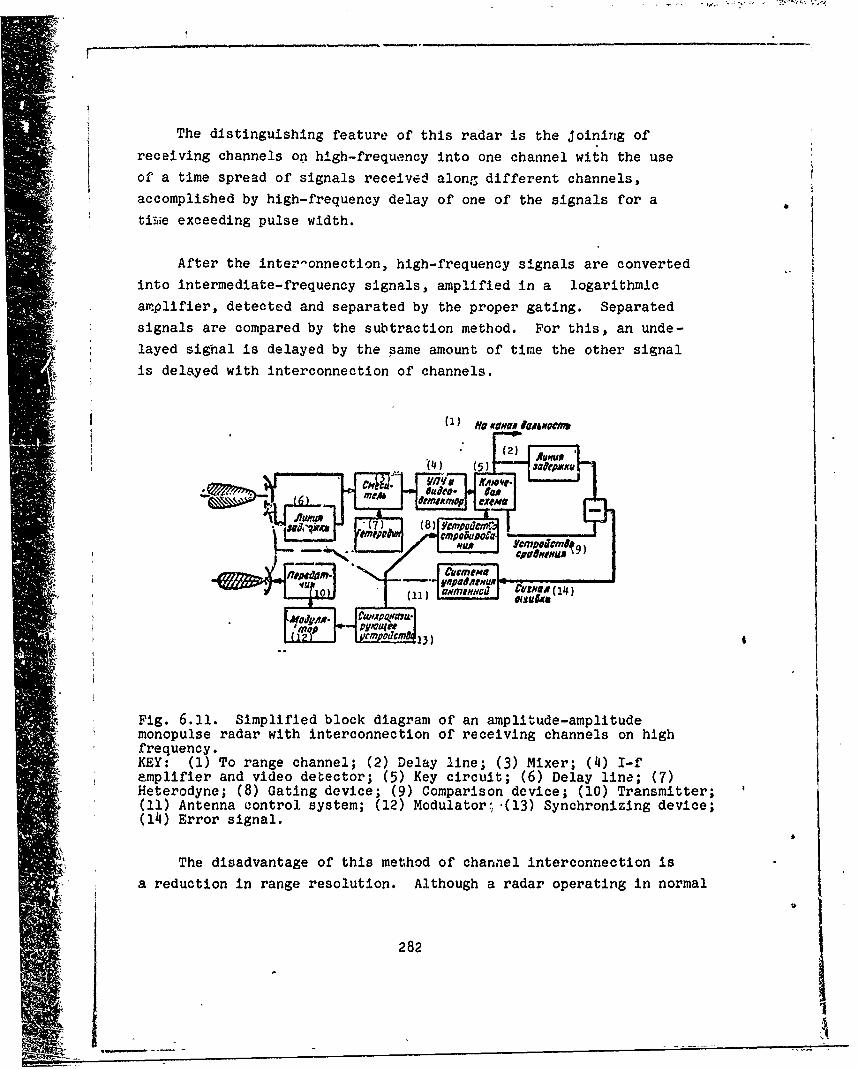
The distinguishing feature of this radar is the Joining of
receiving channels on high-frequency into one channel with the use
of a time spread of signals received along different channels,
4 accomplished by high-frequency delay of one of the signals for a
tiiae exceeding pulse width.
After the inter-onnection, high-frequency signals are converted
into intermediate-frequency signals, amplified in a logarithmic
aamplifier, detected and separated by the proper gating. Separated
signals are compared by the subtraction method. For this, an unde-
layed sighal is delayed by the same amount of time the other signal
is delayed with interconnection of channels.
(1) fts •IUU lVai#
7) (8 (y51edi
Fig. 6.11. Simplified block diagram of an amplitude-amplitudemonopulse radar with interconnection of receiving channels on highfrequency.KEY: (1) To range channel; (2) Delay line; (3) Mixer; (14) I-famplifier and video detector; (5) Key circuit; (6) Delay line; (7)Heterodyne; (8) Gating device; (9) Comparison device; (10) Transmitter;
(11) Antenna control system; (12) Modulator• (13) Synchronizing device;(1i4) Error signal.
IV90
A The disadvantage of this method of channel interconnection is
a reduction in range resolution. Although a radar operating in normal
282
ampifer ndvido eteto; () ey iruit () Dla lie1(7Heeoye 8 aigdeie 9 oprsndeie 1)Tasitr
(11)Antnnaconrolsystm; 12)Modlatr;-13) yncronzin deice(1)Err inl
mode is capable of distinguishing targets radially spaced at a
value corresponding to pulse width, this system is not capable of
distinguishing targets whose radial spacing does not exceed two
widths of the sounding pulse. in this case, signals reflected from
a distant target and the delay stgnýl i'rom a near target will pass
through the receiver simultaneously and nct be separated.
Another disadvantage of this system is the fact that it is
sz.b5ject to the effect of interference in the form of paired pulses
spaced at the value of delay, introduced into the system with the
interconnection of receiving channels.
A design disadvantage of joining high-frequency receiving
channels is the awkwardness of the delay line. Thus, in the Sommers
radar [124] the delay line is a waveguide 3.5 m long rolled into a
coil. A corresponding compensation for signal attenuation in the
delay line is necessary. With this design there-are alfficulties
in ensuring the identity of characteristics for the unjoined parts
of the receiving channels.
6.5.2. A method of joining intermediate-frequency receiving
channels. A simplified block diagram of the receiving part of a
monopulse radar with amplitude direction finding and interconnection
of intermediate-frequency receiving channels is presented in Fig.
6.12 [110].
Signals received by antennas 1 and 2 enter the mixers where,
with the aid of the common heterodyne, they are transformed into
i-f signals and then amplified in preliminary i-f amplifiers PIFA.
After one of the PIFA the delay line is switched on, ensuring time
delay for one of the signals received by a value exceeding the working
pulse width. Spacing of signals with respect to time enables us to
establish the amplification of both received signals in a common
i-f amplifier.
283

(4)
(7)L (8)
A'HD
2 - - .. 4
(13) ow'
Fig. 6.12. Simplified block diagram of the receiving part of an
amplitude-amplitude monopulse r. tr with interconnection of inter-mediate-frequency receiving channels.KEY: (1) Mixer; (2) PIFA; (3) I-f amplifier and detector; (4) Gatingdevice; (5) System of automatic range tracking; '(6) Xey circuit;(7) Heterodyne; (8) Delay line; (9),Mixer; (10) PIFA; (.11);Delayline; (12) Comparing device; (13) Antenna control syst'e; (1•4) Errorsignal.
After amplification in this amplifier. the signals are detecteQ,
separated into two channels with the aid of the key circuit gating
and fed to the comparing device.
The operation of the receiving system is ýxplained by the
diagrams in Fig. 6.13.
The receiving part of a monopulse radar withl.phase direction
finding and interconnection of i-f receiving bhannels can be 'designed
similarly.
Since it is considerably simpler to make a compact delay lineon intermediate frequency than on high frequency, bhis diagram has
an advantage over a diagram with the inter'connection oif high-frequency
receiving channels presented in Fig. 6.11. Another advantage is
the fact tOat with interconnection of intermediate-frequency rebeiving
channels the direction finding system can be prý,tected from the
effect of interference in the form of paired pulses by the introduction294
el 4
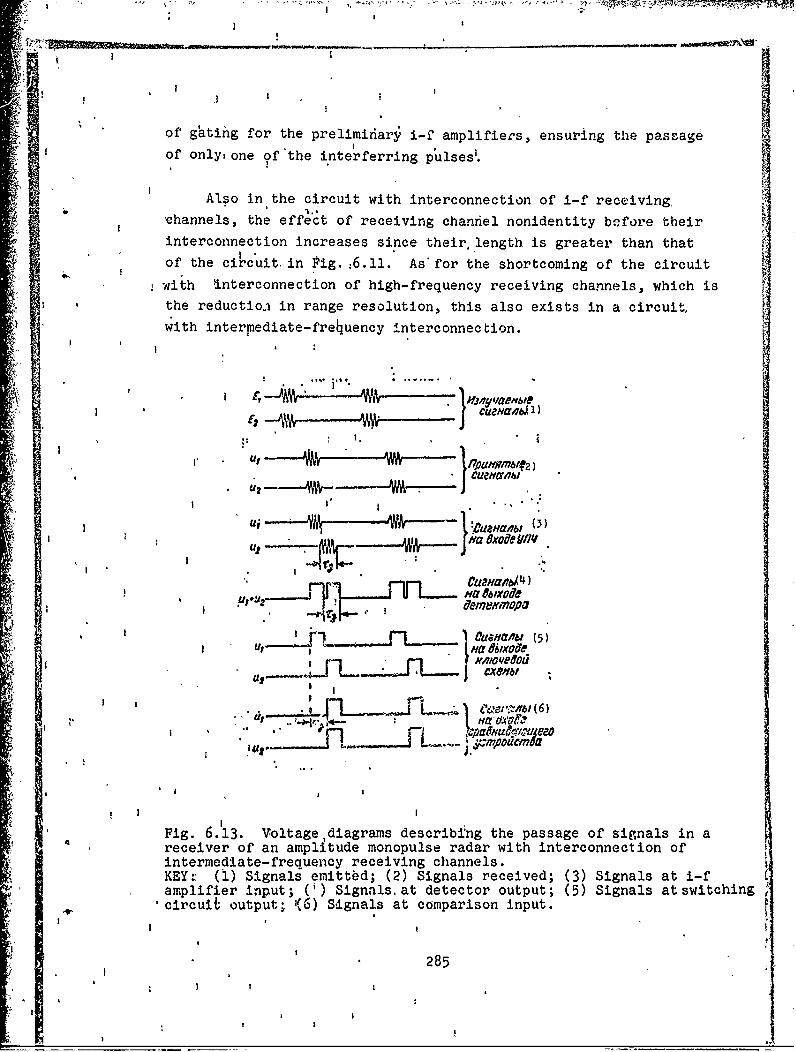
I a
of gating for the preliminarý i-f amplifiees, ensuring the passageof only, one of the interferring pulses'.
Alpo in the circuit with interconnection of i-f receiving,
channels, the effect of receiving channel nonidentity before their
interconnection increases since their, length is greater than that
of the circ'uit. in i'Lg. :6.11. As'for the shortcoming of the circuit
with -nterconnection of high-frequency receiving channels, which isthe reduction in range resolution, this also exists in a circuit,with intermediate-fre4uency interconnection.
II
A 3 ; iffya~b (3)~' jfla 8xvi7e.Wfl4
r~k,
C1_uaHasbA 4 )
'UP 1 I
demers77topi(6
Fig. 6.113. Voltage diagrams describing the passage of signals in aS~receiver of an amplitude monopulse radar with interconnection of
intermediate-freouency receiving channels.KEY: (1) Signals emitted; (2) Signals received; (3) Signals at i-famplifier input; () Signals. at detector output; (5) Signals at switchingcircuit output; '(6) S~ignals at comparison input.
285I
I I

6.5.3. A method of joining i-f receiving channels with theuse of phase shifts and time delay of signals. A simplified diagramof the receiving part of an amplitude sum-difference monopulse radar
with the interconnection of range-measuring and angie-measuriiigchannels by the method studied is presented in Fig. 6.14 [120].
Channels are Joined at two stages. First the angle-m.)asuringchannels are Joined. For this the difference signal of the azimuth
channel Ep a is shifted in phase 900 and is summed with the signal of
the angle-measuring channel E After this the resulting angle-
measuring signal is converter to an i-f signal, amplified in thepreliminary i-f amplifier (PIFA), delayed in time equal approximately
to the received signal width, and summed with the i-f sum sit-al
which is simultaneously the range signal and the reference signalof the angle-measuring channels.
The output signal of the common i-f amplifier is branched intothree directions: one is fed to the phase-sensitive detector ofthe angle-.measuring channel, another with a phase shift of 900 to
the phase-sensitive detector of the azimuth channel, and the third4 part of the signal, after additional amplification in the i-f
amplifier stage and delay by a value equal to the delay uf the angle-measuring signals before channel interconnection, is fed through the
phase'switcher to the range channel and to the phase-sensitive angle-
measuring.detectors as the reference signal.
Phase-sensitive elevation and azimuth detectors makes it possibleto obtain elevation in azimuth signals. Upon obtaining an elevation
signal, one signal from the common i-f amplifier is fed directly tothe phase detector, and the other through the supplementary gatedi-f amplifier stage, delay line, and phase switcher. Because of thisthe reference portion of the first signal appears in the deteutor
simultaneously with the angular portion of the second signal (see
voltage diagram in Fig. 6.15) and interacts with the latter, ensuringerror signal proportional to the angle of target displacement withrespect to elevation at the detector output.
286
1I

A' Zarm
(3 0 )4'+O o1• oy~ em
(1 ) Soo 0o6Ku f
4ememoro
E~, 03040 (15)~ a~m(18)o
(80U(46 8a 00/fu
Fig. 6.14. Simplified block diagram of a receiver in an amplitudesum-difference monopulse radar with interconnection of range-measuring and angle-measuring channels on intermediate frequencywith the use of phase shifts and time delay of signals. Ec sum
signal; Ep y difference signal of elevation channels; Ep a difference
signal of azimuth channel.KEY: (1) Elevation error signal; (2) Phase detectcr of angle-measuringchannel; (3) Mixer; (4) PIFA; (5) I-f amplifier; (6) Supplementaryi-f amplifier; (7) Delay line; (8) Phase swi.jTher 3600; (9) Localheterodyne; (10) Delay line; (11) Phase switcher; (12) Mixer; (13)PIFA; (14) Phase detector of azimt'.h channel; (15) P!iase switcher;(16) Range autotracking system; (17) Azimuth error signal; (18) Rangechannel.
The part of the angle-measuring signal which corresponds to theangle of target displacement with respect to azimuth will not developan erro:., signal since it is in quadrature with the reference signal.
Upon obtaining an azimuth error signal, one signal from the outputof the i-f amplifier is fed to the phase detector through the phase
switch, shifting it 900 in phase, while the other (reference) isfed through the supplementary gated 1-f amplifier stag~e, the delay
line, and the phase switcher. In this case the angular part of thefirst signal moves to the detector simultaneously with the reference
287

part of the second signal and develops at detector output an azimuth
error signal. Part of the angle-measuring signal corresponding
to the angle 6f target displacement with respect to elevation does
not pass throu<)J 'the detector because of its quadrature with the
referonce sigr• I,
Fig. 6.15. Signal voltage diagram, .describing the work of thereceiver of an amplitude sum-difference monopulse radar,illustrated in Fig. 6.14 (signal .phase ratios are conditionallydesignated by errors). 1 - atoutput of waveguide bridges; 2-at Input of angle-measuringchannel mixer; 3 - at output of rp my'ps--- *"-- 3angle-measuring channel mixer;4 at input of i-f amplifier;5 at output of i-f amplifier; fit• ~~6 -at inp~ut of azimuth channel |
phase detector; 7 - at output of rwo--azimuth channel phase detector;
8 - at input, of elevation channelphase detector; 9 - at outputof elevation channel phasedetector. F.p
i(c
17
.4,9
Since two delay lines are used in• the circuit, this can causea substantial misphasing of reference and angle-meisuring signals.In order to compensate the paraidtic phase shifts in the reference
288
' \

signal channel, a. phase switcher with wide phase control limits
is provided.
In order that the signal/noise ratio not be impaired during
signal passage through the receiving circuit, the PIFA is gated,
thus ensuring the operation of the amplifier only during signal
passage. A delay signal after the PIFA is essential since this
improves the signal/noise ratio. Delay before the PIFA leads to
signrl. attenuation at amplifier input and, consequently, a drop
in the signal/noise ratio, which causes an impairmenu of the target
tracking accuracy with respect to angular coordinates and range.
The disadvantage of this system is the relation of high
sensitivity to phase difference for receiving channels. This
deprives it of the main advantage of monopulse direction finders
of the sum.-difference type, in which a parasitic phase shift in
receiving channels does not lead to a shift in equisignal direction.
Sensitivity to phase nonidentity makes this system scarcely suitable
for use in a radar with frequency tuning in a wide range.
In a number of cases the above relationship occurs only for
difference channels and, In order to eliminate errors occurring withfrdquency tuning, automatic phase control is used for the channels
[81, 93].
6.5.4. A method of receiving channel interconnection with the
use of low-frequency modulation in one of the channels. A simplified
block diagran: of the receiving portion of a monopulse amplitude
sum-difference radar with interconnection of channels by using low-
frequeney modulation of different signals is presented in Fig. 6.1%
[1251.
In this circuit the usual method of shaping sum and difference
signals with a double waveguide bridge is used. The difference
signal containing angular information on target position is modulated
with respect to &uplitude by a signal of sonic frequency Q and is
summed by a signal of the sum channel.
I.289
iI
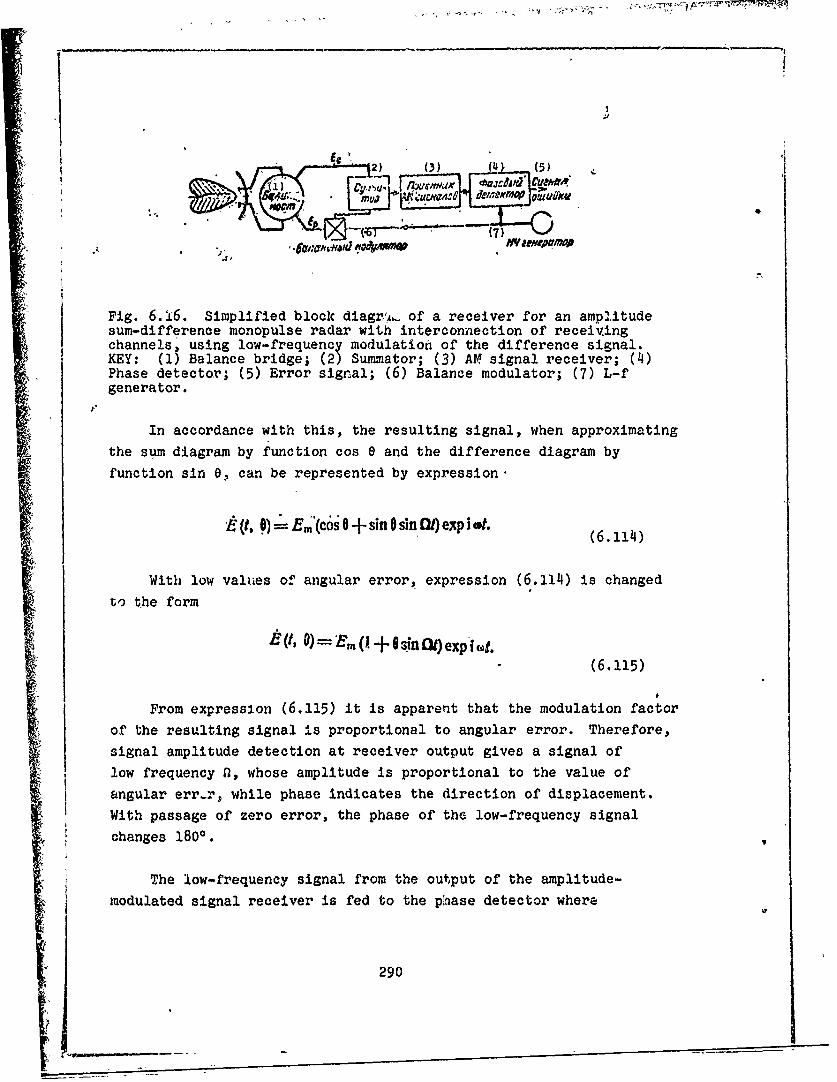
2 (3) (4 (5)
* 1'..de Ctleksff
Fig. 6.'1 6 . Simplified block diagr,,t. of a receiver for an amp2litudesum-difference monopulse radar with interconnection of receivingchannels, using low-frequency modulation of the difference signal.KEY: (1) Balance bridge; (2) Summator; (3) AM signal receiver; (4)Phase detector; (5) Error signal; (6) Balance modulator; (7) L-fgenerator.
In accordance with this, the resulting signal, when approximating
the sum diagram by function cos e and the difference diagram byfunction sin 0, can be represented by expression-
(1, 0) E=r=,E'(cOS 0+ sin 0 sinG!) exp i at. (6.114)
With low values of angular error, expression (6.114) is changed
to the form
-+ (6.115)
From expression (6.115) it is apparent that the modulation factor
of the resulting signal is proportional to angular error. Therefore,signal amplitude detection at receiver output gives a signal oflow frequency a, whose amplitude is proportional to the value ofangular err-r, while phase indicates the direction of displacement.
With passage of zero error, the phase of the low-frequency signal
changes 1800.
The low-frequency signal from the output of the amplitude-modulated signal receiver is fed to the phase detector where
290

it is co••ared with respect to phase with the signal of the 1-f
oscillator and forms an error signal of constant voltage which
acts on the servomechanism of the antenna position control.
rn the rec-ivlng system we can use wide-band signal processing
devices without reducing its sensitivity and because of this we
can substantially reduce parasitic phase shifts. The narrow-band
i-f amplifier, critical to tuning, ceases to be a source of errors
since the sum and difference signals passing through it are shifted
in phase by an identical quantity.
The system is simple enough to tune and stable under various
operating conditions. However, the introduction of low-frequency
modulation with the interconnection of receiving channels makes the
direction finding system sensitive to amplitude fluctuation of the
received signals and also vulnerable to the direction of limited
amplitude-modulated noises. Obviously, in order to create such
noises, it is enough to know the modulation frequency being used in
the radar with an accuracy up to the band width of the servosystem.
This is a serious disadvantage of this design of monopulse radarreceivIng system and limits its use.
6,5.5. A method of joining receiving channels with the use
of signal spacing based on frequency. A simplified block diagram
of a receiver for an amplitude sum-difference monopulse radar with
interconnection of channels by spacing signals with respect to
frequency is presented in Fig. 6.17 [42).
The principle of receiving channel interconnection consists
in the fact that the sum and difference h-f signals are converted
into i-f signals near in value, summed, and rigidly limited in a
multistage wide-band amplifier - limiter. From the i-f amplifier
output signals move to band-pass filters tuned to the corresponding
frequencies of the Joined signals and are separated by these filters
into sum and difference signals. After separation the frequency of
the sum signal is converted to the frequency of the difference
signal. The signal obtained as a result of conversion is used as
291
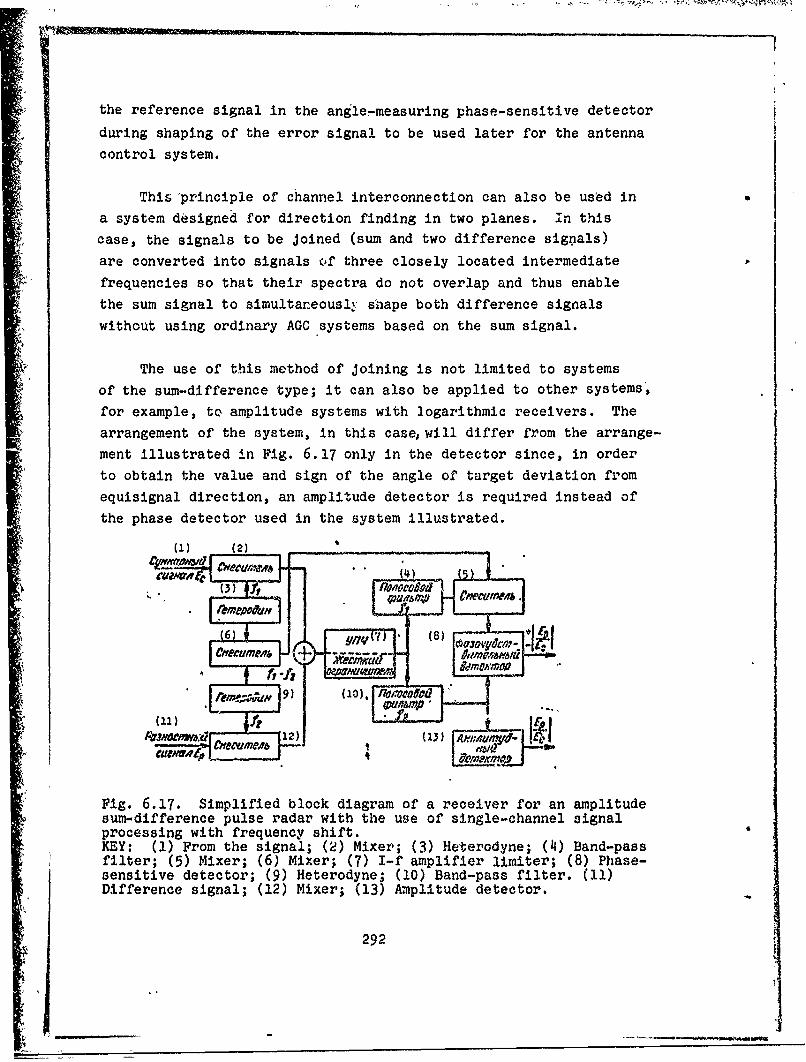
the reference signal in the angle-measuring phase-sensitive detector
during shaping of the error signal to be used later for the antennacontrol system.
This 'principle of channel interconnection can also be used in
a system designed for direction finding in two planes. in this
case, the signals to be Joined (sum and two difference sigpals)
are converted into signals of three closely located intermediate
frequencies so that their spectra do not overlap and thus enable
the sum signal to simultaneously shape both difference signals
without using ordinary AGC systems based on the sum signal.
The use of this method of Joining is not limited to systemsof the sum-difference type; it can also be applied to other systems',
for example, to amplitude systems with logarithmic receivers. The
arrangement of the system, in this case, will differ from the arrange-ment illustrated in Fig. 6.17 only in the detector since, in orderto obtain the value and sign of the angle of target deviation from
equisignal direction, an amplitude detector is required instead ofthe phase detector used in the system illustrated.
(1) (2)Cgw;v(7,ws/ CNe~UJ'•MrI . 4)"
•xuuun• idrnO•'7Or•
Fig. 6.17. Simplified block diagram of a receiver for an amplitude
I• sum-difference pulse radar with the use of single-channel signalprocessing with frequency shift.KEY: (1) From the signal; (2) Mixer; (3) Heterodyne; (11) Band-passfilter; (5) Mixer; (6) Mixer; (7) I-f amplifier limiter; (8) Phase-sensitive detector; (9) Heterodyne; (10) Band-pass filter. (11)smDifference signal; (12) Mixer; (13) Amplitude detector.
292

Let us explain analytically the bases for the examined method
of signal processing for the case of an ideal wide-band uneven
limiter, by which we mean an installation consisting of the sucdessive
connection of an inertialess nonlinear element and a linear band-
pass filter. For simplification, we shall perform our analysis in
actual form.
4 Let the voltage of a signal at output of an ideal limiter be
equal to the sum S(t) of two narrow-band signals Sl(t) and S2(t),
where
St s, ) = pCos (M.,t + (P,),(61)/ (6.116)
S2 EC =oCOS (021 + ,,(.lTEP EP (t); E= = EC (t); 617
With the aid of simple trigonometric transformation, S(t)
can be expressed by a single-narrow-band function with carrier
frequency wi in the following form
S ()= {E; + E; + 2EE cos [( -- ol t +
+ TS- ff}IIP CO'S imet + arctg' xEp sin 7, + BE stn I(w: -- t,) t + T2
>EPCOS 1 + EO COS [(0=-coi) tf+ Till (6.118)
We know that when a narrow-band signal with amplitude and phase
modulation is fed to input of an ideal band limiter, at output
a signal is obtained with constant amplitude and the same phase
modulation as the signal at input.
Taking this, into account and the fact that after wide-band
uneven limitat`on the signal assumes the form of a "meander,"
at limiter output we obtain
293

+-arct• op Fn .+S t (.•-.-4P Cs of: + cs1l4h - 0h1 + #tl' (6.119)
where U is limitation threshold.orp
If we use a trigonometric expansion in the form of
cos (wt + arcig x) -- cos (,,I cos (arctg x) -
-sin ,,t sin (arctg x) = Cos ,t cos
--sinwtsin [arcsin = !
-X (cosoit--xsin-,O.N
we perform the following transformations of expression (6.119):
"X I+ zw sf+E,.SI(C-,co aj)1T2,+ -- OtjtI
- 4U 0 L r EpC~•+oSI+Y)+EcO(( =)gI+Ya. ,) =
4, • cosT,,+ E.cosf(,o,-- ~to f,) '" + t)
- --• L +( + Ec +2EpEcos [(to'- ) t + ,-)112 ""
X § Cos ((*it + TO, +B Cos((Ott + Ti)•".
"(Ecos + E2o+2pcos fI~, , wi.1+ ,2--. ... :..
(6.120)
Dividing the numerator and denominator by E., we obtain
29
29'I
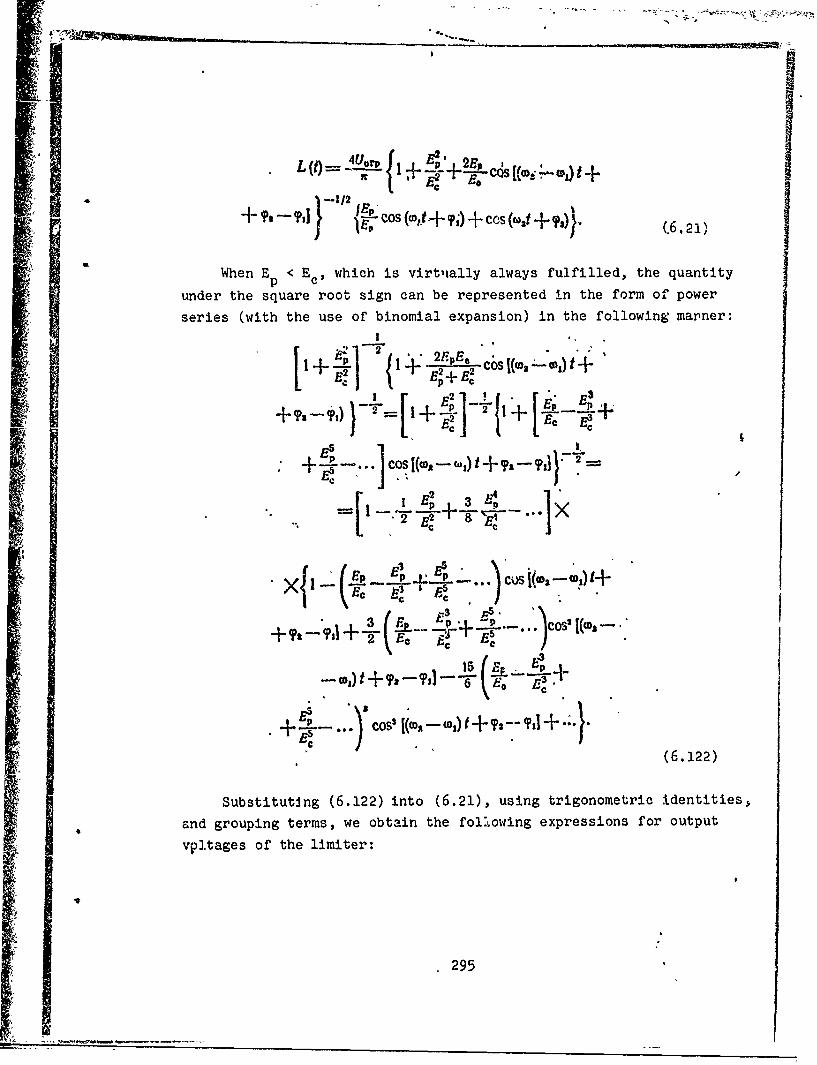
4.~ -- 12 E
12ACos (wojt+ ?J)+CS(
When Ep < Ec, which is virtuially always fulfilled, the quantity
under the square root sign can be represented in the form of power
series (with the use of binomial expansion) in the following manner:
+I +-. cos[( *-- c,) +•.-, -Y=+
., 2 E-3 +
+-•.S+
vpltages of th lmie
p2 5
*~~~ ...... CoSC aWat~s1+f}
2 295

Soarp~~ ~ _,j+I " XI-- -- -- ....... +''-+--.
24, , 16
tc /[other terms on carrier frequencies q w .i )t
(6.123)
where n - 2, 3,'"4,
At output of filters we obtain•l :~ E= -St• -- . .
(6.124)
4 I 2 £-(6.125)
Where E p/Ec <<-I
,, cos( 00 + (6 .2,
(6.126)S--t)• 4 L•-•(CO=i+ Y,). (6.127)
The calculated dependences of amplitudes SIT) and -S(t on
the ratio of instantaneous values of difference and sum signalamplitudes E p/E. are represented in Fig. 6.18. As seen from thefigure, with low amplitude ratios for difference and sum signals,which usually occurs during automatic target tracking, output voltageSIM is almost directly proportional to the instantanenus value ofamplitude ratio E p/E. and, consequently, directly proportional tothe amplitude ratio of signals r'eceived by the radar antenna. Thiscircumstance makes it possible to measure direction to target bythis method of signal processing with sufficient accuracy. Theresults obtained can be extended to both continuous and pulsesignals.
296
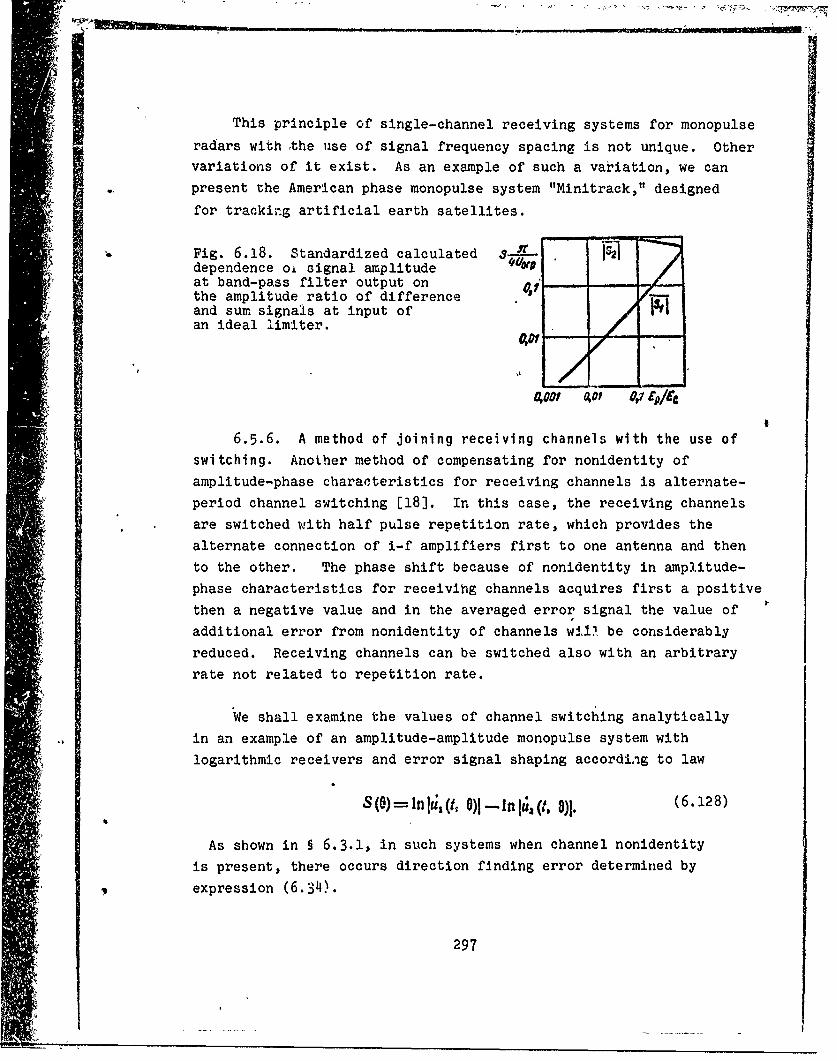
This principle of single-channel receiving systems for monopulse
radars with the use of signal frequency spacing is not unique. Other
variations of it exist. As an example of such a variation, we can
present the American phase monopulse system "Minitrack," designed
for tracking artificial earth satellites.
Fig. 6.18. Standardized calculated 3 ISAdependence oi signal amplitudeat band-pass filter output onthe amplitude ratio of difference Am--.and sum signals at input of tan ideal limiter.
A.00 V?0 41 Ep/Ec
6.5.6. A method of joining receiving channels with the use ofswitching. Another method of compensating for nonidentity ofamplitude-phase characteristics for receiving channels is alternate-period channel switching [18]. In this case, the receiving channelsare switched with half pulse repetition rate, which provides thealternate connection of i-f amplifiers first to one antenna and thento the other. The phase shift because of nonidentity in amplitude-phase characteristics for receivihg channels acquires first a positivethen a negative value and in the averaged error signal the value ofadditional error from nonidentity of channels wil1 be considerablyreduced. Receiving channels can be switched also with an arbitraryrate not related to repetition rate.
We shall examine the values of channel switching analyticallyin an example of an amplitude-amplitude monopulse system withlogarithmic receivers and error signal shaping according to law
S (0) = In i•i1 (t, 6)1-In 1,). (6.128)
As shown in § 6.3.1, in such systems when channel nonidentityis present, there occurs direction finding error determined by
expression (6.34).
297
II
Let the receiving channel be idehtical in phase 'and switched
directly at antenna output accoading ,to square laW. Then signals atthe i-f amplifier output of the channei-can be represnted ifi the
formh of the following expression:
(6.i29)
u1(t ) ic, In ,c2E, (I-zO exp W (6130• ~(6.130)
12 (t, 0) - 01 n K, E•c 1 -1 10) expi w5 -t, (6.131)
•I j.422 (t, K)'02 1n Yc2E.(I + 0) exp iwpf, (6. 132)
where Ull(t, 0), u2 1 (t, 0) and Ul2 (t, 0), u2 2 (t,l0) are the expressions
for signals at output of the first and:secpnd ,channels aftbr the
first and second half-period of switching;i respectively.
In accordance with this, error signals for the first and second
half-periods of switching are defined by expression
s, (0) j1 , (t, 0)1,-- IQ (t, 0)1= ic., In 1 0'(I 4.'
""+ M2 (6.133) N
s2 (0) = l*,, (t, Oii (, N
With the, signal processing used the signs of errorisignatls
Sl(0) and 3.2 (C. are opposite; therefore, the resulting error signal
is the half-difference of the error signals for the first and second
half-period of switching, i.e.,
S' N
S('() 1 (6.135)
298
I N
_ _ - - .- -
1 1
a I
'Substituting expressions (6.133) and (6.134) and assuming
direction finding errors are small, after elementary transformation
we obtain!
S O ,I f , , . .0 ' -
* 4-.121oO + 2•c0o.O = ,, (go ) + .(2"" (6. 136)
Obviously, the direction'finding condition S(e) = 0 is fulfilled'when 0 0 regardless of.,nonidentity of channels with respect to
amplitude1 ; however, directior finding system sensitivity drops bya factor of 2/(g0 + 1). Thus, when using switching, the difference
, in aniplification of reýceiving channels does not lead to systematicdirection finding errors.
When the location of receiving channel switching, is far from
antenna oUtput, te direction finding, system becomes sensitive to
nonidentity of amplituda characteristics for high-frequency channelseven under the channel .switching conditions. We shall show this
analytically. Let switching be accomplished directly on input of
,channel i-f amplifiers. Tpen
a'U1 (t. mo)xlnx 1 E0 (I +,u) e (6.137)
u21 (t, O)- o1 In xEo (I -- 1) exp i o.w;4t, (6.138)
1 , , (N, i)=Xo Inx 2Eo (1 14) exp i .pt, (6. 139)
i~ •u, ,0) =- i 02 n xE 0 (o1 + iO)'exp i wt, (6.140)
II I
's (o) =-, is. (o,) _S. (0)]=
=-2- a:,l •jU I+ 1A
K0o (go +)(In g + (6.141)
* I299
.3
For the-equation S(6) relative to VO, we find
0III ( Ig In g(6.142)
The expression (6.142) is similar to expression (6.36), obtainedin the examination of direction finding errors f'rom nonidentities
of amplitude characteristics for high-freequency receiver circuits
without the use of channel switching.
There are also other methods for interzonnection of receiving
channels with the use of switching. One of these methods is based
on high-frequency gating of the interconnected channels, which provides
for turning them on alternately for a time period n times less than
- 'the operating pulse width (n is the number of interconnected channels).
One of the components of the resulting signal in the receiving
channel is used as the reference signal and the other two as angle-measuring signals [76). Owing to the time separation of the received
pulses being formed, the conversion and amplification of these
signals can be accomplished with a singleo-channel reciver. The
misphasing of signals which then occurs is compensated by specially
selected delay lines and che corresponding signal separation at
receiver output is accomplished by gating synchronized with the
gating of the input channels.
A method is known for Joining receiving channels by the alternate
connection of antenna outputs without splitting the pulse [96).
The original circuit for channel interconnection with the use
of switching is used in the monopulse system whose block diagramis illustrated in Fig. 6.19 [75]. The switching elements of this
circuit are ferrite phase switchers connected to waveguide antenna
channels and controlled from a special power source according to
a specific program by feeding pulsed voltage.
In the absence of a magnetizing pulse on the ferrite phase
switchers, all channels are in phase and the resulting radiation
300
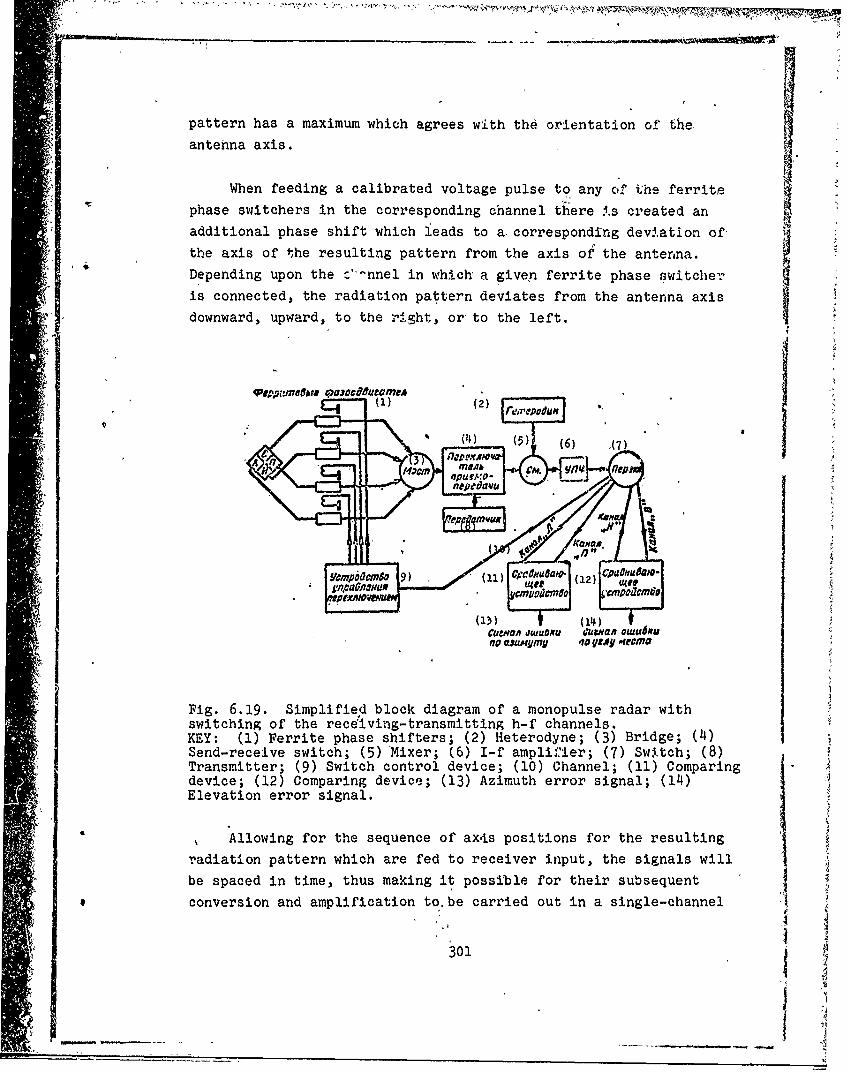
$[pattern has a maximum which agrees with the orientation of the
antenna axis.
When feeding a calibrated voltage pulse to any o:f the ferrite
phase switchers in the corresponding channel there ý.s created an
additional phase shift which leads to a- corresponding devi.ation of,
the axis of the resulting pattern from the axis of the antenna.Depending upon the c'--nnel in which' a given ferrite phase switche%.'
is connected, the radiation pattern deviates from the antenna axis
downward, upward, to the right, or to the left.
2'(2)
(4 ) () (6 ) 17(14)
170 od$4WgMI '70 VhAY oeecm&
Fig. 6.19. Simplified block diagram of a monopulse radar withswitching of the receiving-transmitting h-f channels."KEY: (1) Ferrite phase shifters; (2) Heterodyne; (3) Bridge; (4)Send-receive switch; (5)'Mixer; (6) I-f amplif"ier; (7) Switch; (8)Transmitter; (9) Switch control device; (10) Channel; (11) Comparingdevice; (12) Comparing device; (13) Azimuth error signal; (14)Elevation error signal.
S, Allowing for the sequence of ax.ts positions for the resulting
radiation pattern which are fed to receiver input, the signals will
be spaced in time, thus making it possible for their subsequent
conversion and amplification to.be carried out in a single-channel
3I
receiving device. At iýeceiver odtput Signals are separated with a9witch controlled synchronously with the fei'rite phage switcherand directed in 'paiig to Ohe comparinig devices which form azimutýh'and elevation &rror signals. .
The antenna beamh control rate can i'each several kilohertz.in combination with coding, such a switching system is sufficiently
noise-proof with respect to synchronous organized noisesý and low-frequency amplitude fluctuations inherent in reflected signals.
' 302

CHAPTER 7
INTERFERENICE IMMUN ITY OF MONOPULSE RADARS
It is difficult to operate radar systems in combat situations
without interference; therefore, in developing radars considerable"attention is gilven to the problem of interýference immunity. By
the interference immunity of a radar system we usually mean its
ability to reproduce with sufficient accuracy a useful signal andto perform the necessary operations with respect to target detection,coordinate measurement, and tracking, under noise conditions. If
a radar cannot perform under these conditions, it cannot be designated
noise-proof in spite of its'high performance in the absence of
interference.
With respect to autoruatic target tracking radars, interference
immunity means the ability of the radar to track a target by itscoordinates, with the necessary accuracy when radar countermeasures
are being used.
Widely applied in this field before the introduction of the
monopulse method, foreign single-channel,.angle-measuring systemsof automatic tracking, based on the method of conical scanning
and sequential beam switching, were vulnerable to organized inter-
ferences and could not perform their combat tasks in the presence
of countermeasures. Thus, for example, these systems have low
noise immunit, from responding noises with amplitude modulation
on beam scanning (switching) frequency. Therefore, cne of the main
reasons for developing the monopulse method and for the wide intro-
duction of it into radar bechnology, which has been noted in the
303

,2
last ten years, was. the need to increase interference immunity in
the:ang:le-measuring channel, which is the main channel in radar
systems for ground control of interception and automatic tracking.
In evaluating noise immunity in monopulse radars, with respect
to contemporary forms of noise, it is, necessary to take into account
the fact that the monopulse method is used only for measuring angular
coordinates. As for the method of determining range and speed, as
well as methods of tracking by range and speed, they do not differ
in princ-1ple from methods used in ordinary single-channel tracking
radars. Therefore, there is a continuity in types of noises andmethods of protection between single-channel and two-channel coordi-
nates.
Before analyzing the interference immunity of monopulse radars
and evaluating their advantages over single-channel angle-measuring
coordinates, let us examine the present methods for creating radar
interference.
§ 7.1. METHODS OF CREATING RADAR INTERFERENCE
By interference we mean any radio signal which upon reception
impairs the quality of radar operation and destroys the reliability
of its target information. Bazed on its character, interference
can have both natural and artificial origins [10, 13, 30, 51, 61, 66,
67). The first category includes noises occurring due to atmospheric
* storms, various types of precipitation (snow, hail, rain), the
operation of poorly shielded electrical equipment, etc. The second
category incJudes all noises intentionally created to disturb the
operation of the radar equipment.
Artificial or intentional noises are usually created to camou-
flage or misinform. They also include noises from atomic explosions.
Camouflaging noises are used to prevent or substantially hinderdetection cr proper determination of target location. Jamming
transmitters are the most widespread active means of creating suchnoises; metallic tape dipole reflectors are a passive means.
304

Misinforming noises are intended for the disorientation of the
operator or the automatic radar equipment by creating false signals
imitating the parameters of real targets and hindering the selection
of true targets from false. The means of creating such noises can
be either-active (special transmitter) or passive (decoys).
The eesential difference between misinforming noises and
camouflaging noises is• the degree to which their action can be
concealed. A radar operator usually cannot determine that he is
being misinformed, while he can easily recognize that camouflaging
noises are being created from the image on the screen.
Noises from high-altitude nuclear explosion covers an entire
complex of phenomena which occur during these explosions, leading
to a disturbance of conditions for radio propagation and affecting
electronic equipment.
Let us examine in greater detail the main characteristics ofintentional noises.
7.1.1. Active camouflaging interference. The most widespread
means known today of active camouflaging interference is ja'mming.
When the power is sufficient, this causes the screen to fully or
partially light up with interference, due to which the blips of the
actual targets are camouflaged (Fig. 7.1).
The classical method of jamming is to radiate a continuous
high-frequency signal modulated in amplitude, frequency, or phase
by noises. Selective Jamming and barrage Samming differ. Selective
jamming is characterized by a narrow noise spectrum -oomnensuratewith the passband of the radar being suppressed and, in this respect,
has power advantages over barrage jamming. However, selective
jamming suppresses only one chosen radar and, with its insufficient
mobility, it can be tuned out by changing the working frequency
of the radar. Barrage Jamming is characterized by a wide spectrum
of modulating noises and, in principle, can act simultaneously on
305

several radars, including radars with limited frequency tuning.But this is done at the cost of power loss. In order to create the
same effect, a barrage Jamming transmitter must have considerably
high power than a selective Jamming transmitter.
Fig. 7.1. View'of ?PI screen+ •under the effect of mid-power_* (a) and high-power (b) Jamming. *
(a ) "(b )
The advantage of barrage Jamming lies in the fact that a radar
under its effect, as a rule, cannot be tuned from it by frequency
retuning. Barrage jamming can be achieved by the direct amplification
of noise of a corresponding source (for example, a directly heated
noise diode) with a uniform noise spectrum.
An intermediate position between selective and barrage Jamming
is occupied by noise with frequency wobbling. Such noise makes it
possible for a specific period of time to concentrate a high density
of noise power in, all the working channels being covered. With the
proper selection of frequency wobble rate for the noise transmitter,
the radar receiver will not be able to reestablish full sensitivity
in the period between effects, as a result of which the camouflaging
effect of this noise will be sufficiently effective. In order to
create noise with frequency wobbling, a carcinotron, modulated with
respect to noise frequency, can be used for providing random variatiorn
in noise frequency.
The effect of noise with random frequency variation differs some-
what from the effect of noise with amplitude noise modulation. With
a deviation in carrier frequency significantly exceeding the receiver
passband and a sufficiently narrow spectrum of modulating noises
as compared with the carrier frequency, the effect of such noise
will cause at receiver output pulses of almost constant amplitude
306
X!,whose shape is similar to the frequency characteristic of the
receiver. Such pulses will be obtained during each pass of the
carrier frequency through the receiver passband, and the interval
between them will vary according to random law.
Camoufla-gig noises can also include nonisynchronous pulsed
noises with low and high repetition rates. Such noises cý.eate coarse
or fine-grained indicator lighting with a bright spot for a group
of pulsed spots moving on the amplitude indicators, making detection
and tracking of the actual target difficult.
These active camouflaging noises belong to the category of"power" means of countermeasures since they suppress radars at the
cost of rather high noise power. Active misinforming noises, as
we shall show later, require less power losses.
Power suppression noises should also include noise in the form
of an unmodulated carrier. This noise is capable, with the proper
power, of.,reduclng radar receiver sensitivity so much that an
illusion of station failure is created.
Recently foreign countries have been ;:idely studying new means
Sof creating active camouflaging noises with the use of ejectable
miniature radiators. These radiators usually are made on solid-
state circuits and generate noises at a certain frequency for a
short period of timb sufficient, it is assumed, to get ballisticmissiles through an antimissile defense system [1133.
7.1.2. Passive camouflaging noises. One of the first means
for creating passive camouflaging noises, which has found practical
application, is the use of dipole reflectors which are ordinary
metal tapes half the length of the working wavelength of the radar.
Ejected from aircraft, packages of dipole reflectors are spread by
the wind and form an extended reflecting cloud, as a result of which
on the screen of unprotected radars there is formed an intense
cloud of light corresponding to the dipole cloud camouflaging the
target.
307

Since radars, as a rule, operate at spaced frequencies, dipole
reflectors are made with various dimensions in accordance with the
knQwh or probable Working frequencies of the radars whJ oh fney are
intended to suppress;
An effective method of combating this type of passive noise
is the use of frequency selection based on the frequency difference
between signals reflected from the actual target and those reflected
from the dipole reflectors, which is caused by the difference in
speeds. The speed of dipole reflectors is determined by their
weight, aerodynamic characteristics, and wind speed; as compared with
an aircraft, dipole reflectors are slowly moving targets which makes
their elimination possible based on speed.
Dipole refiectors can be ejected with the aid of special instru-
ments in any direction from the aircraft they are protecting.
Reflectors ejected forward can disrupt, for a certain period of time,
the operation of the speed and range tracking system and even cause
a radar to reaim on the dipoles [441.
With the aim of improving dipole noise effectiveness, dipole
1lumination is sometimes resorted to with the aid of high-frequency
sigoals created by special transmitters installed on the object
being protected [105). The illuminating signal Is emitted either
with a frequency shift relative to the frequency of the radar beam
illuminated in order to imitate false dipole speed or with a time
shift imitating the range displacement of the dipole. This ensures
that the characteristics of these signals received from the dipole
cloud are similar to the characteristics of the actual targets and
substantially hinder their selection.
Since the length of a dipole must correspond to the wave length
of a radar and increases with an increase in the latter, a conversion
of the radars in foreign antiaircraft and antimissile defense systems
in the upper region of decimeter and meter ranges of waves is con-
sidered one of the possible means of weakening the interferingeffect of dipole noises [113).
308
7.1.3. Active-misinforming noises. Unlike Jamming noises,
misinforming noises mainly distort 'the information about the target
by forming interference signals with false parameters, which differ
little from the parameters of actual reflected signals. Therefore,
the result of such noises is not to camouflage signals reflected
from a target' but to introduce error for the operator and the automatic
instruments of the radar station. Creating such noises requires a
more complex apparatus and a greater quantity of information on the
operating principles of the radar being suppressed.
Misinforming noises created from one point in space include:
- multiple responding noises;
- range diversion noises;
- speed diversion noises;
- angular coordinate diversion noises.
The principle involved in creating multiple responding noises
consists in the fact that the noise transmitter in response to a
radar pulse received emits on the same frequency a series of similarlyshaped moving pulses, spread in range and angle and imitating a
group of targets [87). Such noise hinders the operator's selection
of the true target and reduces the operational effectiveness of the
detection and target-indicating system. Because of this, instead of
the actual target, interception may be undertaken for many false
targets. This leads to a scattering of forces and means of aerial
defense, which has a favorable effect on the probability of the
aircraft reaching their objectives. Multiple noise along with the
imitation of aerial targets can be used also for imitating naval
targets. •
The effectiveness of multiple responding noises increases when
the multiple responding noise is combined with jaroming (Fig. 7.2)
and thus the targets covered by the noise producer are imitated,
and also when false target blips are created not along the main
lobe of the radiation pattern but along the side lobes, which is
ensured by the proper synchronizaticn of the respond•.ng pulse emission
with the scanning period of the radar [128).
309
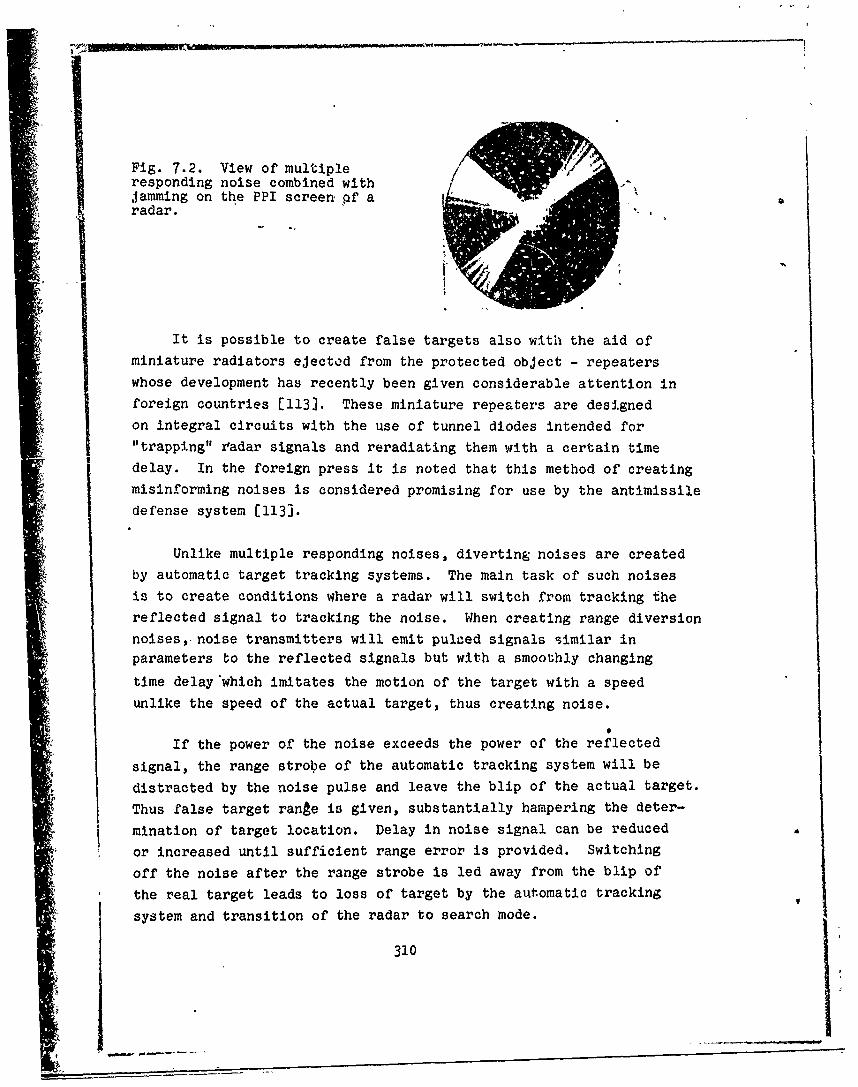
III INC
Fig. 7.2. View of multipleresponding noise combined withjamming on the PPI screen pf aradar.
It is possible to create false targets also with the aid of
miniature radiators ejectod from the protected object - repeaters
whose development has recently been given considerable attention in
foreign countries [1131. These miniature repeaters are designed
on integral circuits with the use of tunnel diodes intended for
"trapping" radar signals and reradiating them with a certain time
delay. In the foreign press it is noted that this method of creating
misinforming noises is considered promising for use by the antimissile
defense system [1131.
Unlike multiple responding noises, divertin& noises are created
by automatic target tracking systems. The main task of such noises
is to create conditions where a radar will switch from tracking the
reflected signal to tracking the noise. When creating range diversion
noises,ýnoise transmitters will emit pulzed signals similar in
parameters to the reflected signals but with a smoothly changing
time delay'which imitates the motion of the target with a speed
unlike the speed of the actual target, thus creating noise.
0If the power of the noise exceeds the power of the reflected
signal, the range strobe of the automatic tracking system will be
distracted by the noise pulse and leave the blip of the actual target.
Thus false target range is given, substantially hampering the deter-
mination of target location. Delay in noise signal can be reduced
or increased until sufficient range error is provided. Switching
off the noise after the range strobe is led away from the blip of
the real target leads to loss of target by the automatic tracking
system and transition of the radar to search mode.
310

Similarly speed diversion noise is created for a radar with
continuous and quasicontinuous radiation mode, the only differencebeing that, in this case, a smooth variation in noise signal frequency
relative to radar signal frequency occurs. This leads to a smooth
variation in doppler frequency and the 1'•i`tion of' target speed
variation. With a sufficient surplus of noise power the speed
tracking strobe moves according to the noise frequency shift and
the servosystem gives out erroneous target speed information.
Switching off noise after signal frequency is shifted by a value
exceeding the width of the speed strobe leads to loss of target
and transition of radar to search mode just as when switching off
range diversion noise.
The principle involved in creating angular coordinate diversion
noises consists of providing noises with such properties as to
ensure error signal in the au*otracking system when there is no
antenna disagreement with target direction.
It should be noted that active misinforming noises are more
advantageous with respect to power than active camouflaging noises
since virtually the maximum power which can be provided by the
noise receiver is concentrated in the radar receiver band. However,
from the technical point of view, such noises are more complicated
since they require special complex equipment.
7.1.4. Passive misinforming noises. Passive misinforming
equipment creating radar noise includes various decoys capable of
imitating the actual target. If the radar does not distinguish the
decoy from the target, the operator or automatic device can take
it for a dangerous target and direct interception against it, which
reduces the probability of interception for the actual target.
Fig. 7.3. The Quail missile.
+ 311
UI
I ! ,
The simhplest decoys are angular reflectors, with comparativeily
6iali ge6ometfic dlmen6oois, capdle of giving•reflected signals
correspondifig ih level to large targets. Being ejected at the
moment of an attack, in imany cases, these reflectors can divert the
mea~ns of interception from the object being protected and cause
them to track the decoy. The more modern decoys, can have their
own motors with which to imitate the target not only in refledting .i
properties but in speed. The typical size of such decoys used by the
Capitalist Armed Forces is the small aircraft missile slung under
the wings of a bomber and launched into free flight at the proper
moment (Fig. 7.3) [30). In order to increase the density of signalsu"
reflected-from small objects, sometimes active responders are located
on them.
Decoys have been given considerable attention 6verseas in the
protection of warheads for overcoinihg antimissile defense systems
* [•i6). Taking into account the specifics of warhead' moti6n, In the
middle portions of the flight trajectory, thq use of light decoys
is provided (inflated spheres, balloonsO, and in the final section,
of the trajectory upon reentry, heavier decoys capable of motion
in the atmosphere without burning up.t I
As passive misinforming noises, bundles of dipole reflectors
can also be used, ejected from the protected object in order to
realign the radar on the decoy.
7.1.5. Noises from atomic explosions. Atomic explpsions create
substantial noises in the operation of radar stations [68). .These
explosions are accompanied by electromagnetic effects of two main
types. One of these is the radiation of short-duration electromagnetic I
pulses as a result of the appearance of a certain asythmetry in the-distribution of the electrical charge in the regions s~urrounding
the explosion and because of the rapid expansion of rather
conductive plasma which forms with the explosion in earth's magnetic
field. The second effect is con:nected with. the considerable disturbanbes
of the electrdmnagnetic waves used in the radio and rhdar, ranges,312
I I
312 i
I I

I I j
r • • r
I
which occur under the effect of -the ionizing radiation of the
1nuclear blas-t or are caused by fission products or water vapor
introduced intothe atmosphere as'a res~ult of' the explosion.
Ionization, i.e., the formation of ion pairs consisting of
s eparated electronp and.positive ions, is the main cause of the
disruption of radar operation in a wide range of waves. Ionization
can occur either •directly or indiiectly under the effect of gamma
rays and neutrons of the initial nuclear radiation, beta particles
and gamma rays of the residual nuclear radiation, and also under
1the'effect pf X-rays and even ultraviolet rays present in the primary
thermal radiation. Conseqiently, after' an atomic explosion electront!
density in the atmogphere in the region of a blast increases strongly.
These electrons can affect radars in at least two ways. First,
under the proper cqnditions, they can reduce wave energy and thus,. '
weaken the signal; second, a wave front propagating from one region
tolanother (with differing electron density) will be twisted, i.e.,
the direction of ridio~ave propagation will be changed. This
phenomenon is called refraption. Consequently, the ionized region
occurring in the atmosphere under the effect of a high-alt4tude
nuclear blast williaffect radars whose propagation trajectory passes
through this region.
* The effect of atmospheric ionization on radars depends upon
the altitude and power of the explosion, the type and working
irequency of the station. In the foreign press it has been noted
that explosions. at altitudes bVel'w 16 km do not bring about significant
or prclonged ionizatilon and, consequently; do not affect radars
seriously. With blasts at altitudes above 16 km and particularly
at altitudes above 70 km, where the air density is less, significant
i _z.... ation occurs and exerts a strong effect on the operation of
radars.
In many cases,;the refraction Lf a radar beam, as a result of
electrott density changes with ia nuclear explosion, can play as
impi'rtant a role as its attenuation. The amount of beam deflection
""•th thislis directly proportional to, the change in electron density
313
and inversely proportional to the square of the signal frequency.
With large angles of beam incidence signal reflection will occur
and a radar sigral vill'be tur'.ed back without passing through the
attenuating layer.
On the basis of an analysis of a large amount of experimental
data, American experts assume that high-altitude nuclear explosions
can disrupt the operation of radar stations for a period from several
seconds to several hours depending upon the powe:7 and altit.ude of
the Explosion, as well as the type and working frequency of the radar
station.
§ 7.2. NOISES BY MONOPULSE RADAR SYSTEMS
It has been mentioned earlier that in monopulse radars only
the angle-measuring channels have high noise immunity, while the-,
speed and range-measuring-channels with respect to noise imunity
have no advantages over the speed and range-measuring
hannels in single-channel radars. Such noises as speed and range
.±version noises will affect rather effectively monopulse radars
also if no special protection measures are provided them. Speed
and range noises, to a certain extent, impair the noise immunity of
the angle-measuring channel. A disruption of range or speed tracking
forces the radar to search mode on corresDonding pa.rameters.' 'If
uhere are several targets in the radar's coverage !one, it is possible
to pick up a new target located in a different direction from that
of the one being tracked earlier. This leads to a resightilig of
the radar's antenna and an increase in angular errcrs. Furthermore,
range and speed, as we know, in foreign rocket complexes are used
in calculating the anticipated firing angle (rocket launch). If
these parameters are fed into a computer with significant errors,
the anticipated point of encounter will also be determined with
error, which in turn, affects firing accuracy. When the rocket is
launched, an error in calculating the anticipated point can lead to
an increase in G forces on the rocket during its motion and a
reduction in the probability of striking the target.31
3111
•Because of this, the protection of target selection 6hanne-1 must
also be given rather serious consideration, although it is not
fundamental, since in radar systems for tracking and guidance the
main channel is the" angle-measuring channel.
The high noise immunity of the angle-measuring channel in a mono-
pulse system is due to its operating principle. As we know, in
monopulse systems one pulse is sufficient, in principle, for the
accurate determination of target direction. Since during the time
of this pulse the effective reflecting surface of the target is
virtually unchanged',a monopulse system has little sensitivity to
amplitude fluctuations in the reflected signals. Hence it follows
that the angle-measuring channel has little sensitivity also to
* noises with amplitude modulation. On the contrary, amplitude-
modulated noise, posse.ssing a certain poyer excess over a reflected
signal, eases the operation of a monopulse angle-measuring channel
since it increases the equivalent reflecting surface of the target
and thus broadens the range of ranges in which normal target tracking
is possible.
This is valid not only for amplitude-modulated noises but also
for noises with other types of modulation emitted from one point in
space, for example, frequency modulated and phase modulated noises,
if only the receiving channels are identical in amplitude-phase
characteristics.
However, in practice it is difficult to create ideal monopulse
receivers and defects can occur in design and circuitry,. These
defects can reduce noise immunity with respect to active noises,
including noises emitted from one point. IDefects which reduce noise immunity in monopulse radars, in
addition to nonidentity of amplitude-phase..characteristics, usually
include nonlinearity of amplitude characteristics for receiving
channels, time lag of the AGC system, a differencu in transmissionS~factors for antenna channels, etc.
315

2 k
2. .-. -'
�pcaniplitude characteristics strong
of the �a�itbtrac1dn�syst�em,, the transmission of a�nplit�i�de signal
i� hindere4, which, with the, �.mplitude �nethod offiriding,�Leads t.p. ,pa�ti�6r. 12> .�reakdown -of error signal
p The 1attez� i�equiv�lent to servosys�tem disconnection and inevitably
increases dir�c�t�on �1nd�ix�g, error.....Errors obvi9u4y'tnc�ease.if' is created pray
overload eiodicllby rn�nipu1at�n (tui�ning &n of ,nois es ��nce, i'n this, case,to elimiriate' errors in a rada, identity �of static characteristicsis insufficient; .identity of dynamic characte4stics for the receiving
.'channels -is also required. In a number of cases, the effect ofpowerful holse, manipulated with a spedific frequency,. can causean angular swing of the antenna bec�ause of the res6nance propertiesand the time �ag of the �servosystem. However, tpe possibility .�of
* manipulated noises i� substantially reduced �iith �he use of receivers
with logarithmic characteristics and high-speed amplification con-:trol sUstems.
In the presence of an inertial AGO system, the switching offof powerful noise can lead to the *disconnectiqn o� the se�vosy5t�m
L circuit for the period. off time necessary to restore sensitivity of
N the receiver to a level sufficient for the reception of reflected
signal. Without control signa2,s at its input, the antenna systemin this period will either r�emain still or move from inertia, which,
in both cases, increases arzguJar, tracking errors. In The case ofV I a logarithmic receiver �r a receiver with a high-speed AGC system,motion from inertia or a constant antenjia state will be reduced toa minimum since after switching off the powerful noise the servo-systemalmost instentaneously will go to tracking on the signal
�*. J ref2ected from the target.
Occupying a somewhat isolated position with respect to noiseimmunity are monop�lse systems which use receiving channel switchingto reduce the requirements for identity of amplitude-phase char-
I
316

F'-- -
acteristics The int bduction of,switchingminakes such systems,
under certain conditions, vulnerable to amplitude-modulated noises
emitted from one point [75]. We •hall illustrate this in the
-example O'f an amplitude-amplitude system with signal processing
according to, the principle
S (0) In la, (t. 0)j - In I•, (t. 0)._ • ( 7 .1 )
7.2.1. Noises of a monoP~lse rad~a on receiving-channelS~switching frequency. Wren switching receiving channels" in an amplitude-
Amplitude monopulse radar with logarithmic amplifiers, as shown in
in Chapter 6 (section 6.4.6), error signal is determined by
expression
(0) (o,(. + ). A(7.2)
According t1o 'this expression, the equilibrium of the system
corresponding to the condition for target finding occurs at 0= 0
regardless'of the inequality of receiving chinnel transmission• factors.
Let us consider the effect of amplitude-modulated noise on
direction finding accuracy for this system. For simplicity we shall
disregard the reflected signal and assume that the noise is modulated
by a signal of meander form with switching frequency of the radar
receiving channels in phase with the switching signal. Then signals
at output of the i-f amplifier channels 'for the first and second
cycles of the switch in designations used for Chapter 6 can be repre-
sented in the form of the following expressions:
L ,,(t, 0)= ico, In ic, E +m.)(1-HL0)expiw.P, (73)
.t,0) = mot. In ic,. (I -mo) (l -- pO) exp icon,(, (7.4)
=,,(t l I)-gtn cE.(I -m.) (I -- t0) exp ita.p,(75
317
1~ j

S(7.6')
where m Ais the modu1•ibon index of 'the noise.
Hence we obtain the resulting error signal at output of the
comparifig device:
s (o)=± [s,.(o) - s2 (0)1 _-±,[ f,'. (4, 0)1-
j~~a~'~1, M);)~~ (4 )I + 1'46)4 n
-- 0, In 0 .(t) + M .) (I")_•,n0 0+ 14,)(0-•)]
2 o [g --or1) In + Ma )+- .
(7.7)
Equating S'(O) to zero and solving 'the equation relative to vO, we
fina
ge•- Iu, Intn 1- '+., m=' ~" u ,. 7
'ggo - 1
where K 2 0iJ~ P(go + ')"
The quantity under the logarithm sign is posiLtive and small
with the assumptions made. This makes it possible to use the
318
I-
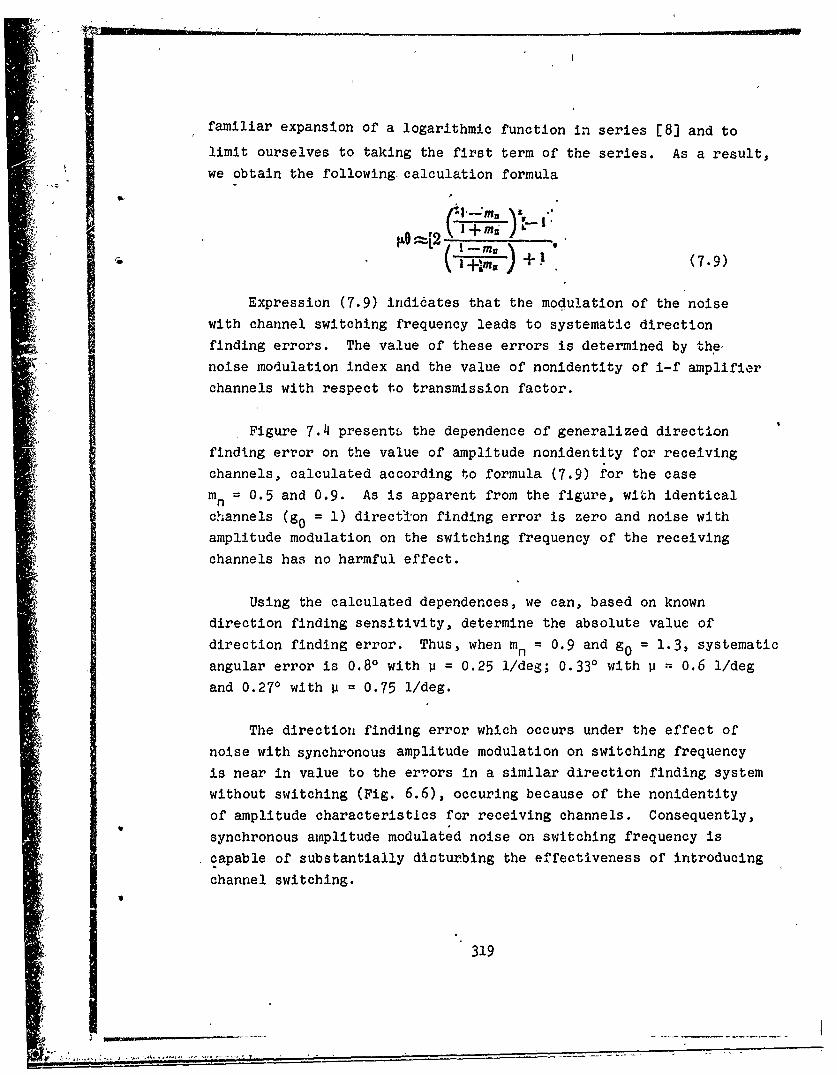
x. I
familiar expansion of a logarithmic function in series [8] and to
limit ourselves to taking the first term of the series. As a result,
we obtain the followingcalculation formula
P \ý"l -+ (7.9)
Expression (7.9) indicates that the modulation of the noise
with channel switching frequency leads to systematic direction
finding errors. The value of these errors is determined by the
noise modulation index and the value of nonidentity of i-f amplifier
channels with respect to transmission factor.
Figure 7.4 presents the dependence of generalized direction
finding error on the value of amplitude nonidentity for receiving
channels, calculated according to formula (7.9) for the case
mn = 0.5 and 0.9. As is apparent from the figure, with identical
channels (go = 1) directIon finding error is zero and noise with
amplitude modulation on the switching frequency of the receiving
channels has no harmful effect.
Using the calculated dependences, we can, based on known
direction finding sensitivity, determine the absolute value of
direction finding error. Thus, when mn = 0.9 and go = 1.3, systematic
angular error is 0.80 with p = 0.25 I/deg; 0.330 with V n 0.6 1/deg
and 0.270 with p = 0.75 1/deg.
The direction finding error which occurs under the effect of
noise with synchronous amplitude modulation on switching frequency
is near in value to the errors in a similar direction finding system
without switching (Fig. 6.6), occuring because of the nonidentity
of amplitude characteristics for receiving channels. Consequently,
synchronous amplitude modulated noise on switching frequency is
capable of substantially disturbing the effectiveness of introducing
channel switching.
319

0,2
04"
Fig. 7 .4. Dependence of generalized systematic direction findingerror on the value of nonidentity of transmission factors forreceiving channels under the effect of amplitude-modulated noiseon switching frequency.
This cas6. corresponds to ideal oonditions when noise modulation
in amplitude is accomplished in phase with switching frequency for
receiving channels. Under actual conditions, such a case does not
exist since we can calculate only to an approximate value the
switching frequency of the receiving channels. In this case, the
effectiveness of noise will depend not only upon its modulation index
but also upon modulation frequency and phase ratios of the modula-
tion and switching signals.
Since the servosystem of the radar is narrow-band, one of the
conditions for creating noise on switching frequency is
(7.10)
where AP., is the passband width of the radar's servosystem, Rn is
the noise modulation frequency, and 9 K is the switching frequency of
the receiving channels.
Condition (7.10) means that amplitude-modulated noise can havean effect on a monopulse i-adar using the switching of receiving
320

channels only if its modulation frequency is equal to the switching
frequency of the channels with accuracy up to the passband of the
servosystem.
When the switching frequency is accurately known but it is not
possible to synchronize the amplitude modulation of the noise with
respect to phase, the phase ratios can be changed from -n to 7 and
the effectiveness of the noise will also change from zero to itsmaximum value determined by formula (7.9). The need to change
phase ratio is also brought about by instability of switching
frequency for receiving channels and modulation frequency of the
noise.
On the assumption of the equally probable law of phase shiftdistribution in the process of a noise effect, the value of errors
in this case, can be aharacterized by standard error
(7.11)
Taking into account the secret nature of svitching frequency,
the possibility of creating synchronous noise on the switchingfrequency is unlikely. This is even more valid if switching based
on a special coded program is used.
7.2.2. Coherent noises created from two points in space.Tl..: principle involved in creating coherent noises is found in the
creation of phase nonuniformity in the aperture of the receiving
antenna by irradiating it with coherent signals from two separated
points in space [10, 78].
The physical bases for this method of creating noise is dis-
cussed in Chapter 5 in sufficient detail in the discussion of a
phase wave front of a signal from a two point target. It has been
established that if the target has two signal sources, then, with
certain amplitude and phase ratios for the signals, the phase
321

front of the wave is distorted as compared with the case of a single-
point target, due to which conditions are created which impair
direction finding accuracy for several types of radars including
those working on the monopulse method.
For further clarification of phenomena connected with the
reception of signals from a two-point target and encompassing
the possibility of countermeasures by radar direction finding
systems with the aid of organized noises, let us examine the reception
and processing of signals from two point coherent sources in amplitude
and phase monopulse systems.
" (11 •(2)
I
Fig. 7.5. Diagram of amplitude direction finding on a two-pointtarget.KEY: (1) Source 1; (2) Source 2; (3) ESD.
1. Direction finding of a two-point source of coherent eignaZa
by an ampZitude aum-difference monopuZse radar. Let us assume that
point sources of coherent signals (VIE, 7.5) are located within
the linear section of the direction finding characteristic and a linear
approximation of radiation patterns is valid
322
rp

(7.12)
In analyzing the direction finding of a two-point source ofcoherent signals by an amplitude sum-difference monopulse system,we use expression (4.23). Taking into account (7.12): we obtain
W, =.4 1 F (0.),17,:= (1-+-•)) (1+-,O) F (0,) cos a,
- (= iLOS) (I-ji0,) F' (00) COS a,W'j= 4z,Ae2F2(o.),Ws -4FP (0o),W. = 4F' (0j)coa,W, = 4F,(Oo).
Substituting these values into (4.23), after elementary con-
versions we obtain
(0)Ij ---L[0, ru+acosd-l+ (Oa-+ac ac .I I+2acosz+a2 (7.13)
Equating (7.13) to zero, we find the condition determining theposition of equisignal direction during direction finding on atwo-point target:
0,(1 +acos a) + e(a2-Sa coa) O.(7.14)
For convenience, let us estimate the direction finding error
being formed relative to the middle of the base (distance betweensources). In this case,
"2- 2'
Substituting the values of 01 and 02 into (7.14) and takinginto account the fact that a < 1, as a result of solving equation(7.14) relative to 0, we obtain the familiar expression first deducedby Meed [33]
323

-2(1 ++2ac o) (7.15)
Expreasion (7.15) is analogous to expression (5.14) determining
the change in the slor 3f the phase front of a wave from a two-point
source as compared with the phase front formed by a point signal
source.
The correspondence obtained attests to the fact that during
direction finding on point sources with small errors a radar system,
in the final analysis, seeks the direction of the normal to the
phase front of waves reflected from target, and distortions of the
phase front from interference phenomena of a multipoint source of
target signals or from intended parameter control by radiated
noise signals must inevitably lead to an increase in direction
finding errors. The value of direction finding error, as can be
seen from expression (7.15), depends upon the distance between
radiating sources, the phase shift of signals emitted by them, and
their amplitude ratios at input of the direction finding system.
Figure 7.6 presents the calculated dependences of angular
direction finding error in relative values of base dimension (distance
between sources) on amplitude and phase ratios of noise signals.
The calculated curves show that the value of direction finding errors
does not depend upon the direction of the deviation relative to
* the sources.
Examining the dependence when a - 1.25, we can see that with
signals in phase the value of angular error is approximately 0.6
the value of angular distance between sources. Therefore, even
* with proper aiming of the radar to one of the sources, equisignal
direction moves to a point located approximately in the middle
between the targets. With an increase in noise signal phase difference
the value of angular error increases and reaches maximum value with
a signal phase shift of 1800. Theoretically, direction finding
error, at this moment, can reach very high values. In practice,
324

ip
however, these errors are limited by the radiation pattern and
cannot exceed in value the width of the radiation pattern of the
suppressed radar's receiving antenna.
With receiving signals in phase (a = 0) direction finding
error decreases to a value of (1 - a)/2(l + a), which corresponds
to the power "center of gravity" of the two sources. If signal
amplitudes are equal, the power "center" agrees with geometric
center, passing through the middle of the base of coherent signal
sources.
The direction of radar antenna deflection upon reception of
signals from two coherent sources is determined by amplitude ratio
a and when passing through a point corresponding to equality of
signals, changes to the inverse (Fig. 7.7). We should keep in mind
that- the graphs presented in Figs. 7.6 and 7.7 are valid only up to
values of errors lying within the linear part of the antenna radiation
pattern.
.49
1,2
Fig. 7.6. Calculated .e,dependence of angular /-direction finding errors .,for a two-point targeton amplitude and phaseratios of coherent asignals radiated by the 0Itarget.
0,2S.
KEY: (1) Target I Zp o s i t i o n . -4 4 14 M (1 )
325
K
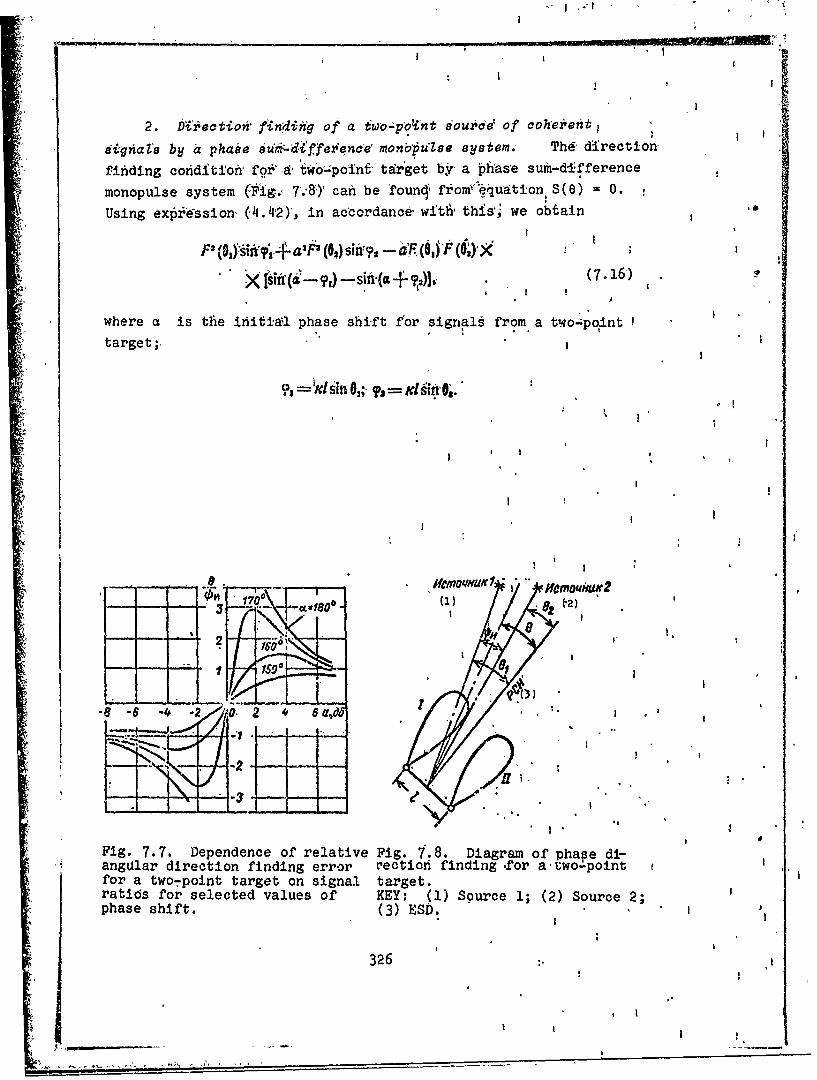
I I * .
I A
2. Di4;ecti'oA* fin*?din~g of a two-ýpltnt 8ýouzidd of cohel~eit1
4itgHate by a phase ouir-di&ffeience' monbzuiZse system." Thdý direction
finiding cofiditionb foi'& t t•wopoint, target by' a phase sum-dIfference
monopulse system (Fig. 7:8)1 can be foun, fromequfation, S() = 0.
Using expiression' (4.4,2), in accordance, witfh this' we obtain '0
P (91) sii, 4. a F (Os) si•,- aJ(O,) F (OJ×,
• X [sif(a'-•,) - sk~i(a+4 )h .(7.•"16)
where a is the initia'l phase shift for signals from a two-point 1
target;.
1 'idsin O; •- --- l•hin..,
lo 1700 owO 1
760
I I
-' -4 2 C6adSO I e2)
IV.Ii"8 - 0 2* 22 a , ". • " I
Fig. 7.7. Dependence of relative Fig. 7.8. Diagram of phape di-angular direction finding error cection finding -for atwo-pointfor a two-point target on signal target.ratids for selected values of KEY: (1) Source 1; (2) Source 2;phase shift. (3) ESD.
326
, I- ~ -

SI.a
a I
Assuming the: radiation pattern of the receiving antenna is
wide' enoug& and.angles 61 and e2 a:•e small, we can take F(61 ) = F(e 2 )
i and then ;equation (7.16) is simplified t6 lies
•~~~ ,Sin •,--a' sins,% - a: [sin (a .•,1-
- n (a -- 0. . (7.17)'.
a, Substituting'into equation (7.17) the values o and a 2'
wei obt hini-
0
sin KIO, + a'sin M6O,- a Isin (a--I0,) -
-- Sin:(i + ldO,)] J 0.a I (7.18
I j
Introducing angular coordinate',e, read from the middle of the
base of sources and the angularlvalue of the ýase •, connected
with the relationships 6, = 0 +2 = 0 - T.,'and performing
elementary trigonometric transformations, equation (7.18) can
be presented~in the form
sin WO cos id -!L+Cos Kl0 Sin Id +
2 2
t, 2. ÷. 221
I (7.19)
.Wit'h small direction finding errors the vallies of k1O and
kz2a-. are rather low; therefore)
a i Io,''"• .12
sin• -x Oo COS'n!
I I 2
a, I~32"7
I, a
•',:• .. •,.. . ,• ., ,. . . .. . ..
'In accordance with this, expr.eslson- (7.19) is simplified to:
• ,+ (2 -) + c ,a..s, • (7.20)
or~
• . -1).(7.21)
Disregarding the, quantity Tr H/6O5 as compared with the value
of a, since the region of highest errors. (of interest to us) liesnear a = 7, we obtain with a < 1
0. I-at(7.22)
The expression obtained is analogous to that derived for the4 case of an amplitudq sum-difference monopulse system. We can show
that for simple amplitude and phase monopulse systems expressions
determining direction finding error for. a two-point signal source
are obtained'in .the same manner.
Thus, with respect to angular errors during the direction
finding of E, two-point source of coherenp signals, monopulse systems
with amplitude and phase direction finding are identical and all
conclusions made with respect to an amplitude monopulse system
pertain, to the same extent, to a phasemonopulse system.
The correspondence of formulas (7.22) and (5.14) attests to
the fact that phase systems, as well as amplitude, during direction
finding'of points target with low errors, determine, the position of
the normal to the phase front of the gigpals received and the
different distortions of the phase front inevitably lead to a
reduction in direction finding accuracy.
' 328

The phenomena described above, observed during dfrection finding
of two-point sources of coherent signals1 are basic to the creation
of coherent noises by a monopulse radar.- Because of this, in the
4b creation• of coherent noise radiation is carried out through two
antennas and,the parameters of the noise signals (amplitude and
phase ratios) are adjusted so as to ensure the conditions for
obtaining maximum direction finding errors by the suppressed radar.
The effect of coherent noise is manifest in the deflection of the
equisignal'\direction of the suppressed radar from the direction to
noise prcducer-target.
A limitation of'this method of creating nois3 is the fact that
it requires rapid information processing with optimization of noise
signal parameters and also that it is suitable only for use at short
distances [18]. The-latter is a consequence of the operating char-
acteristics of coherent noises, the fact that directipn finding
errors are proportional to the value of the distance between noise
sources and at great distances, when the angle of sight for sources
arranged within the geometric dimensions of the noise producer is
of low value,, they are insignificant. Therefore, the expected
effectiveness of coherent noises at great distances to the noise
producer is low. To arrange these sources with the purpose of
increasing the base for variousaircraft obviously is not advisable
since difficulties are involved with ensuring the coherence of noise
signals.
Coherent noise also has power limitations'since in creating
it high power levels are required. This is due to the fact that
its maximum effect is noted with signals out of phase, when, in
essence, noise signals emitted through the spaced antennas signifi-
cantly compensate each other. Therefore, in order to create the
necessary excess of resulting noise over reflected signals, compara-
tively high power levels for the noise signals are required. Theselevels, in practice must exceed the levels of known noises emitted
from one point in space.
329
I -
"*'With an, increase, i'tthe :distance ,between ýcoherent noise sources,.6the:',tequireme~nts,,,,ox;,~-~e p 4e, as fr idneacua onis
6ignals in amplit;,d6, and Dhaseo,, •re so ewhat. reduced.
In spite of- t 'e" stin• ljmimati6ns,,,'cpherent noise is usuallyccnsidered ond oI" the poij.bIe type~i odf aqt1ýve .noises in a counter.--:
measure. syem and. the. 'haracter of its, action ±is, taken into account.We should keep inmind the fact. that coherent..nois&e.acts both on.
s!ngle-channeYX and. two-channel ang;le-measuring coordinators to thesame extanr;" therefore-, monopulse direction finding systems wiith
respect. to coherent noise immunity; have no special advantages overO6rdihary single-elhannel systems of direction finding.
7.2.3. Flickering-noi-ses, crea-ted, fiom. two poin~ts in space.In the creation of flickering noise from t!o points in space foreign
engineers have, installed on- theii- noise barriers autonomous transmitterswith programmed emission.. In the simplest version thi'sis merely
the alternate switching of transmitters on, and off. The effect ofthis noise is based on the limited resolution of. angle-measurirgcoordinators and can b e explained, in the following nlanner.
Let several signal s6urces be located in the unresolvable
space rf an angle-measuring coordinator. Without assuming the
possibility of resolution for each of the sources with respect todirection, the radar will track the position of the equivalent powercenter. In the case of an amplitude sum-difference monopulse radar,au shown in § 4.2, the position of the power center M of the sources
can be determined from equation
M0Pm() MFP(o0o0 ) + on:))= (.3• (7.23)
where Pm is the power radiated by the u-th source;
em is the angular coordinate of the m-th source relative toequLsignal direction.
330
In thepresence of two noise producers with ,angular-positions
and 02) equation (7.23) assumes the form
jPum ,'I)'+ PcI ()][F(O )F 2 ( .- 0J+
+ [P 2I ()4 + Pc, (t)] IFI (00- 02) -PF 2 (60 - 01)) 04
where P cl and Pc2 are the powers of signals reflected from 'targets;P nlý'nd Pn2 are the powers of noises radiated by the targets.
Approximating the radiation pattern by the proper f'nctions,
we can find the direction finding condition atr any value of target
spacing and power ratios for signals being emitted from the target.
With small angular target spread, when the antenna radiation
pattern can be approximated by linear function
(7.25)
we obtain
lP.,1 (t) + PC, 01~ +, - P,, (t) -+ PC( 6,3 0. ( 7.26 )
Assuming Pc = Pc2 = P., which is sufficiently valid with single-type
targets and reading direction finding error AO relative to the posi-
tion of the geometric center of the targets, when
O),=AO--$ n O,=A0-+--.,
[.:and]2
where IH is the angular base of the sources, equation (7.26) can
be represented in the form
[P(i)2 (t)J AO - [s, (t) -M, (21 ±=o.
331

Hence it follows that
(7.27)
The equation obtained defines the provision of the power centerof the radiation relative to the geometric center of the signal
sources.
For simplificatipn let us assume that the power of the reflected
signal is substantially less than the.power of the noise sources.
Then we can write
20 P., (t)--P, (0)= X-i, (1) T P.? (7.28)
From expression (7.2.8) it follows that position of the power
center of the radiation is determined by the power ratios of the
noise sources and the character of the noise variation with time.
Let the noise transmitter power be equal and transmitter emissionbe alternate. Then when Pnl = 0 M = -1, when P 0 =1.
We obtain a trival result establishing the movement of the power
center within the source arrangement in a cycle with the switching
of noise transmitters.
A radar tracking the noise producers, in this case, will attempt
to track first one then another target, due to which the radar
antenna will swing in cycle with the switching of the noise. This
substantially complicates determining angular coordinates of targets
and their resolution with respect to direction. The angle between
targets, at which their resolution under flickering noise begins,
increases.
In guiding a missile to a paired target, an increase in critical
target resolution angle inevitably leads to an increase in the
extent of the miss, since a miss and critical target resolution
332
angle are connected by relationship [10]
.2 .... (7.29)
where At is the value of the miss in linear units;
4 16 is the projection of the linear value of the base (distance
between target) to a plane perpendicular to the line of view;
ng is the maximum possible G forces;
V 0TH is the rate of convergence of rocket and target;
eKP is the critical target resolution angle.
Because of this, foreign experts consider flickering.noise
an effective type of noise for missile guidance systems [1031.
Obviously, in order that the direction finding system track the
power center moving in space under the effect of flickering noises,
transmitter switching frequency must be in agreement with the pass-band of the servosystem of the angle-measuring coordinator AFc c"
If we assume the minimum duration of radiation for each of thetransmitters as equal to the time constant of the servoSystem, thenwith a high-speed AGC system for the radar receiver the permissibleswitching frequency for noise transmitters on square law can bedetermined from the following inequality:
2~hF 0 0'(7-30)
-' where T. is the transmitter switching period.
Hence
2 (7.31)
333
Since th6 affect of flickerihg noises reduces to th6 repeated
re alignment of the suppiesed anglelm~asuring coordinator from one
target to another by irradiating it With a more powerftul signal fromanother direction, anbt1hr no less importailt hoise parameter than
switching frequency is its. power' or, more accurately, the excess of
noise over the signal. With the lineirizhtion of direction findingcharacteristic assumed, the excess of noise power over signals
necessary for causing radar realignment can be determined fromexpression (7.27).
Let us assume that at the initial moment target 2 is being tracked.
When the radar is realigned on target 1, noise emission from target
2 ceases (Pn2 = 0) and noise emission by target 1 is turned on.Expression (7.27) in this situation assumes the form
ZG Pm,
'in- P-7FM4-0(7.32)
PnlSolving equation (7.32) relative to a ---- we obtainPc
1-Y (733)2A8
where y =
The quantity y = 1.0 corresponds to the case of accurate directionfinding when the radar antenna swings in a sector equal to theangular separation of the noise proaucers V o
Calculations with formula (7.33) show that in order to provideantenna swing in sector 0. 8ý., noise excess over signals must be
9 dB. If the dimension of the angular target base exceeds the limitsof the linear section of the direction finding characteristic, calcu-
lations must be performed taking into account the actual radiation
pattern and expression (7.24), using this method. We should mentionthat noise transmitter switching can be carried out only according
to random law.
334~
.. ......... '
As with coherent noise emitted from two points, fljckering
noise is universal in the sense that under certain conditions it
can affect direction finding systems of various types. This is
explained by the fact that its affect, in the final analysis is
also connected with the change in the slope of the phase front of
radio waves received by a radar antenna.
7.2.4. Noises with frequency wobble created from two or more
points. It was shown earlier that transmitters with continuous
rapid retuning (wobbling) of frequency can be used as a source of
camouflaging noises. As in the case of flickering noises, a radar
in this case, as it were, sees various targets appearing in a rapid
sequence as the frequency of the noise transmitters successfully hits
in the passband of the radar receiver. The interfering effect from
the angle-measuring channel, in this case, will be somewhat similar
to the effect of an ordinary group target with the only difference
being that range resolution will be impossible since the noise
transmitters operate in continuous mode [103].
If the transmitter frequency wobble rate decreases in accordance
with the requirements of action on an angle-measuring channel, and
the aircraft flying in a dispersed formation are supplied with such
transmitters, frequency-retunable noises, in principle, can create
the effect of flickering noise and can be a means of suppressing
an angle-measuring channel, including one operating on the monopulse
method.
The effebt of flickering noises with frequency wobble, in this
case, is explained by the fact that a radar at the moment noise
frequency agrees with the tuning frequency of its receiver will go
to autotracking on the corresponding noise producer. With noise
frequency output beyond the passband of the receiver, radars will
continue to track the same target but always on the reflected signal.
At the moment the frequency of noise emitted from another
aircraft coincides with receiver tuning, the range-measuring channel
of a radar is jammed by the noise, due to which target selection
335
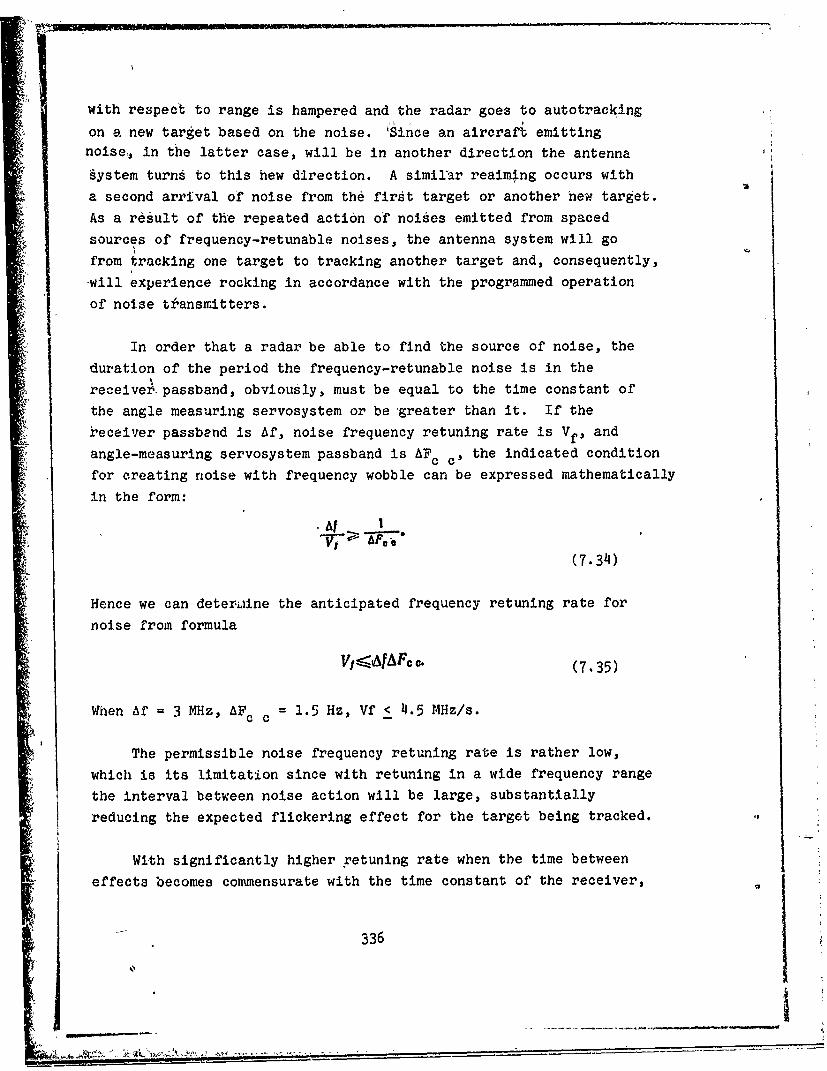
with respect to range is hampered and the radar goes to autotracking
on a new target based on the noise. 'Since an aircraft emittingnoise, in the latter case, will be in another direction the antenna
§ystem turns to this hew direction. A similar reaiming occurs with
a second arrival of noise from the first target or another hew target.
As a result of the repeated action of noises emitted from spaced
sources of frequency-retunable noises, the antenna system will go
from tracking one target to tracking another target and, consequently,
will experience rocking in accordance with the programmed operation
of noise tf:ansmitters.
In order that a radar be able to find the source of noise, the
duration of the period the frequency-retunable noise is in the
receivezý. passband, obviously, must be equal to the time constant of
the angle measuring servosystem or be greater than it. If the
receiver passbend is Af, noise frequency retuning rate is Vf, and
angle-measuring servosystem passband is AFc c, the indicated condition
for creating noise with frequency wobble can be expressed mathematically
in the form:
~At ~
(7.34)
Hence we can deteri.iine the anticipated frequency retuning rate for
noise from formula
V1 fAfAc. (7-35)
When Af = 3 MHz, AFc c 1.5 Hz, Vf < 4.5 MHz/s.
The permissible noise frequency retuning rate is rather low,
which is its limitation since with retuning in a wide frequency range
the interval between noise action will be large, substantially
reducing the expected flickering effect for the target being tracked.
Wi'th significantly higher retuning rate when the time betweeneffects becomes commensurate with the time constant of the receiver,
336
the exI~cted effect in the angle-measuring channel is similar to
the effect of a group target regardless of the difference of distances
from the radar to the separate targets of the group, since range
resolution, in this case, is hampered by the effect of the noise.
The effect of noise with frequency wobble on many radars whose
operating frequencie~s cover the range of transmitter frequency
tuning and the comparative simplicity of the noise equipment are
advantages of this type of noise.
7.2.5. Noises on crosspolarization. Unlike the types of
noises examined in paragraphs 7.2.2.-7.2.4, noise on crosspolarization
is created from one point and therefore, is considered suitable
for the individual prote~tion of objects. The principle of its
creation lies in the irradiation of radar receiving antennas by high
frequency signals which agree in frequency but have polarization
which agrees with tho crosspolarization of the antenna [78].
Earlier (Chapter 2) it was shown that antenna systems, in addi-
tion to radiation on a main (working) polarization, radiate part
of their power in crosspolarization, orthogonal to working polarization.
Because of this, an antenna, in addition to a radiation pattern on
working polarization, has a radiation pattern on crosspolarization
which differs in its structure. Thus, in parabolic antennas the
radiation pattern on crosspolarization usually has four lobes
symmetrically ranged with respect to the equisignal direction of
the antenna, with maxima which do not coincide witn the maximum of
the main diagram.
Since the level of the pattern on crosspolarization differs
from the level of the pattern on main polarization by approximately
two orders, under normal operating conditions, the effect is scarcely
noticeable. When an antenna is irradiated by powerful signals with
a polarization which agrees with its crosspolarization, the role
" - ---__of the radiation pattern on crosspolarization can be amplified and
thus disoirt the-radiation pattern of the uirection finding antenna.
337

In the extreme case.,, when the power of the noise exceeds by
sev~ra! orders the power of the reflected signal, the resulting
pattern of the receiving antenna will be determined by the pattern
on crosspolarization. Since the radiation pattern )n crosspolariza-
Lion subs,antially dtffers in structure from the main radiation
pattern, this leads to a distortion. of the direction finding char-
acteristic of the system and, as a consequence, to the substantial
impairment of direction finding accuracy.
During countermeasures on a radar with linear polarization the
effective noise is noise with a polarization orthogonal to the
working polarization of the radar. In this case [78], noise on
crosspolarization generates a strong interconnection of azimuth
and elevation channels, i.e., leads to a misphasing of the coordinate
system. With the creation of such noise, guidance based on polariza-
tion is accomplished automatically based on radar signals received
on board the aircraft with the aid of a system which analyzes the
polarization of the radar signals and automatically establishes a
polarization of the emitted noise signals orthogonal to the polariza-
tion of the suppressed radar [78].
Since noise on crosspolarization leads to a distortion of the
worKing radiation pattern for the radar antenna, it must act both
on monopulse and on the ordinary single-channel angle-measuring
coordinators. In *this sense, noise on crosspolarization is universal.
§ 7.3. METHODS OF PROTECTING MONOPULSE RADARS FROMCERTAIN TYPES OF RADIO NOISES
Table 7.1 lists several types of noises which can be applied
to monopulse radars and the possible method of protection from them[68, 743.
The listed type of noises generally affect either the visual
channel of the radar or the target tracking channel with respect to
range and speed. Let us pause for more detail on the protection
of an angle-measuring channel from certain noises.
338

Types of radio noises Protectio m~ethods
Nonsynchronous pulsed noise Pulse delay for repetitionwith low repetition frequency period, its comparison with next
pulse and blanking.Wide-band noise. Nonsyn- Increase of observation time
chronous pulsed noise with very and integration. Suppression ofhigh repetition frequency side lobes of antenna radiation
pattern. iTransmitter frequencyretuning.
Noise in the form of unmodu- Elimination of receiver sat-lated carrier uration (instantaneous automatic
gain control, use of logarithmicIlifiers, etc.).
Multiple responding pulsed Repetition frequency wobblenoise .L.fn combination with protection
measures against nonsynchronouspulsed noise.
Noise with low-frequency As in the case of nonsynchron-wobble ous pulsed noise.
Noise with high-frequency As in the case of wide-bandwobble noise.
Decoys Selection based on reflectingproperties, mass and dimensions,with respect to trajectory para-meters, degree of decelerationin the atmosphere, and ionizationof the air.
Dipole reflectors Selection based on speed andacceleration.
Diversion of range strobe Use of Doppler shift of fre-from true target quency, narrow range strobe, gating
based on acceleration.Noises from high-altitude Territorial spacing of radars
nuclear explosions of one group, operation on differentfrequencies of single-type stations,dupleication of objects for theantiaircraft and antimissiledefense systems.
7.3.1. Methods of protection from flickering noises created
from two or more points in space. Since flickering noises, as has
been shown, pursue the target, impairing target resolution, one of
the possible methods of radar protection from such noises is the
increase of radar resolution undergroup-target operating conditions.
Therefore, the version of a monopulse system with increased resolu-
tion, discussed in Chapter 4 (Fig. 4.12), also has increased immunity
from flickering noises. With the creation of flickering noises,
339

transmitteris installed on targets, flylng in a group are turned on
and off periodically or randomly and substaptially! complicate thý
tracking of a specific target for the time necessary- for an acutirate.
determination of its location and the properIdefense measures. Under
these conditions the monopulse system discussed above makes At posgi-
ble to track either a left or right target according to the choice
made by the operator.
If tracking is carried out, for example, on a left target and
the signal from this target suddenly disappears and instead of it,
there appears another signal emitted by a target located to the right,
the resulting negative error signal for the target selection channel
will block the gating device for a certain period of time and the
servosystem will not go to tracking the new powerful signal source
[103]. Thus the main target pursued by the flickering hoises and
lying in the area of autotracking breakdown or resolution impairment
will not be reached.
The effect of noises with frequency wobble, created from several
targets of a group, is similar to the *ffect of flickering'noises.'
Therefore, the described method of protection from flickering noises
is also a protection from noises with frequency wobble.
Restricting the radiation pattern:and reducipg its side lobes
is also a means of increasing the noise immunity of monopulse
radars from flickering noises and noises with frequency wobble since
this procedure leads to an increase in the required noise power
and an increase in the resolution of a radar with respect to angular
coordinates. I
7.3.2. Protection from noises on crosspolari:zation. Since
noise on crosspolarization differs substantially in polarization
from the working polarization of a radar, the obvious method of pro-
tection from it is the polarization selection of, signals. A familiar
means of such selection is the polarization grids installed in!
antenna apertures [28, 77].
340
a I ' -!
L I

As described in Chapter,6, such grids ensure the transmissionof the working signals with low attenuatidn and strongly attenuate
signals with a polarization orthogonal to the working polarization.
Thus noise ion cross polarization during passage through the polariza-
tion grid is strongly attenuatpd and its effectiveness considerably
reduced. I '!
Sometimes'as a polarizationifilter the antenna reflector itself
is used, for which it is made in the formiof a system of parallelmetal plates (wires) [62, 63,.112]. In this case, 'the crosspolariza-
tion components of the excitation field pass through the reflector
and are npt-reflected'from it, which also substantially weakens the
cross polarijzation components'of the emitted and received signals.
Measures directed toward.reducing antenna crosspolarization,
partially discussed in Chapters 2 and 5, can also be considered
;protection from noises on crosspolarization.
Presently in foreign'countries serious attention is being given
to the development of radar systems with a polarization spread [130].
Such systems are buili on the 'multichannel principle and can operate
on a receiving channel whose polarization most nearly agrees with
the polarization'of the signa)l.s received. This makes it possible tosubstantially compensate the effect of the depolarization of signals
refiected from the target and also increase the immunity of a radar
from noises 'on crosspolarization..
*34
! • I
*11
oI ,

CHAPTER 8
THE USE OF MODELING Wi A STUDY OF COORD '.INArEDETERMINATION ERRORS FOR MONOPULSE RADARS
§ 8.1. COMMON PROBLEMS AND TRENDS INSIMULATION
In the development of monopulse radars a wide circle of problems
must be solved, such as:
- the evaluation of the basic characteristics of a station and
their laws of distribution;
- the establishment of the dependence of main characteristics
on various factors and the'clarification of the most substantial
and least important factors;
- the processing and evaluation of algorithms used in handling
radar information;
- the development of assumptions with respect to the perfection
of specific characteristics.
In order to solve these problems, in recent years, along with
full-scale tests and physical simulation, mathematical modeling has
been widely used. Since any monopulse radar can be characterized
by a series of characteristics, in practice, we can follow two
directions for modeling:
- the development of a common model which makes it possible to
obtain the evaluation of all characterisitcs;
- the development of specific models each of which enable us to
evaluate one or several characteristics.
342
2_.• •' 4 • •J : • : '. , *,-.,. .. .',.-.2 : • • •.. _ • : . ".....__"_ .. .

The development of a mathematical r,,odel enablfig-the evaluationof all characteristics is a very difficult task and, in addition,such a model cannot always be accomplished in a computer. Therefore,
4L it is expedient to use models following the'second direction. If,
however, in studies with a model we find that it is necessary toobtain certain other c.iaracteristics, we must refine the old modelfurther or develop a new one. The composition of new models whichdiffer from those already developed is not particularly difficultbecause of the presence of a number of separate model units and theexperience acquired by the developer.
To study the main characteristics of monopulse radar, numericalprobability (statistical) models, also called Monte Carlo models,have been the most widely used.
Below we shall discuss such models for the evaluation ofcoordinate determination accuracy by amplitude sum-difference monopulseautotracking radars and monopulse scanning radars with amplitudedirection finding, using a wide-band signal.
§ 8.2. A MODEL OF AN AMPLITUDE SUM-DIFFERENCEMONOPULSE TRACKING RADAR
A simplified block diagram of an amplitude sum-differencemonopulse radar designed for the automatic tracking and determiningof angular target coordinates in one plane is presented in Fig. 1.9.
The greatest complexity in modeling is the machematicaldescription of the angular discriminator. This desciiption can bemade by several methods. We shall examine thn method connected withcal~ulating signals and noises in elements of the angular discriminator.
This method most fully describes the processes taking place in anactual discriminator, and, in addition, makes it possible to calculatethe effect of phase nonidentity in channels.
In this monopulse radar, to form the radiation pattern a parabolicantenna with diameter d is used. With uniform field distribution in
343

the antenna aperture each of the four partial raaiation patterns is
described by expression(
where Jl(X) is the Bessel function of the first type;ee L • is the angular coordinate in relative units;
0.5
. is the width of the partial beam in minutes;
0 is the angular coordinate in minutes, read from the center of
the radiation pattern.
Coefficient 2.62 is selected from the condition of obtaining
the width of the square of the sum radiation pattern with respect to
.oltage equal to one at level 0.7 from maximum value. Standardization
of the radiation pattern with respect to the square is due to the use
of the same antenna for transmission and reception. The cross-
section of the sum radiation pattern in one plane (from the four
horns), passing through equi.signal direction, is described by
expression
P&(O) F (0-0,625) + F (0+0,625) + 2F (W-Fg'+2. .(8.2)
The difference diagram has the form
F '--- -0, 625) - F(9 + 0,625)(8.3)
Coefficients 1/2 and 1//2 are due to the summation (subtraction)
of signals received by t•ach beam of the antenna, in the waveguide
bridges. The reflected signal at antenna input can be written in the
form
(8.4)
344

where u' is the component of the reflected signal depending on
potential and range to target;
uis .the component of reflected signal depending on the
fluctuations of the effective scattering area of the target.
Fo-' further studies the reflected signal is conveniently repre-
sented in relative units reduced to the receiver noise power of the
'sum channel.
The signal/noise ratio with respect to power, converted to antenna
input, can be written in the form
S, -(8.5)
I where n is the potential of the station determined by transmitter
power, receiver sensitivity, and losses in the circuits;
G(O ) is the effective scattering area of the target;LA
R is range to target.
In amplitude sum-difference monopulse radars the value of phase
nonidentity for the high-frequency circuit is usually 10-40. Such
phase nonidentity has a substantial effect on angular coordinate
determination accuracy and is only slightly expressed in a decrease
in the value of the sum signal. Therefore, we shall disregard the
effect of the phase nonidentity of the high-frequency circuit in
calculating the amplitude signal and the sum/noise ratio in the sum
"channel.
Under these conditions, the expressions for sum signal and
signal/noise ratio with respect to power at waveguide bridge output
have the form
a Z (8.6)
0 F(o). (8.-7)
345
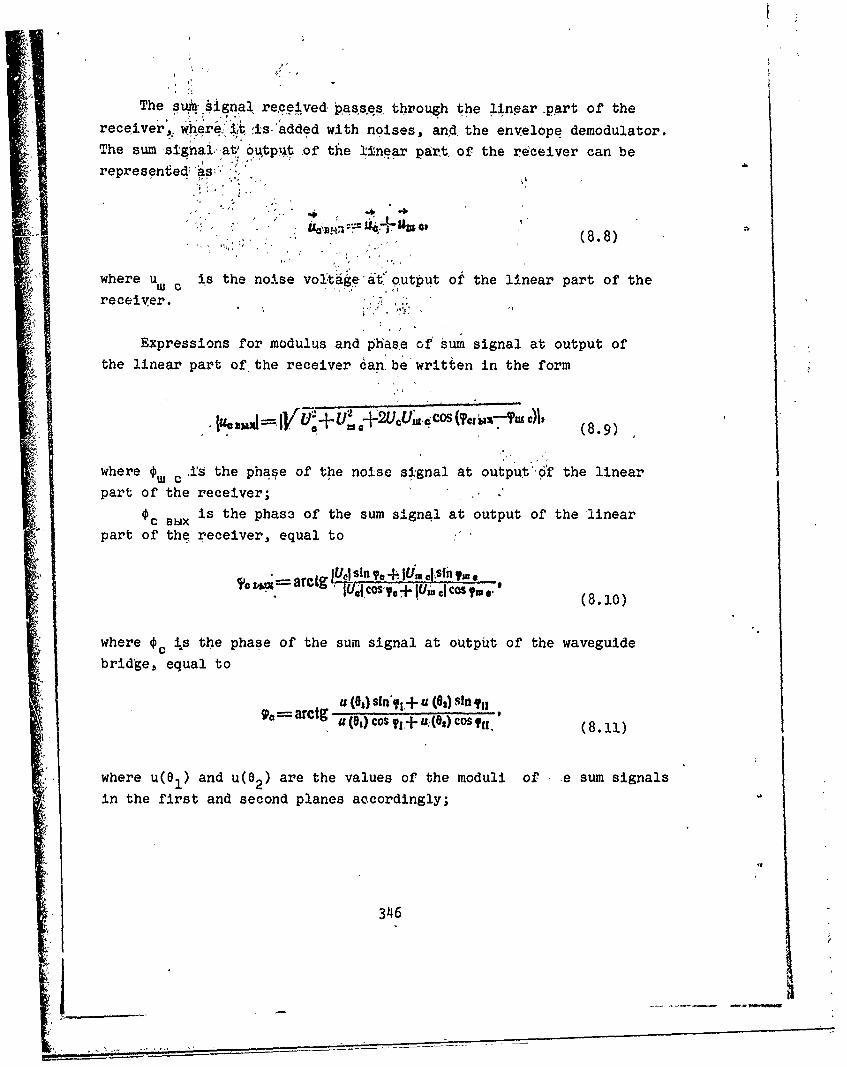
The suxmv ,ignal re~ceived, pas.soes through the lingar +part of the
receiver', where. iAt 's 'added with noises, an4d the envelope demodulator.
The sum signalat' 6 utput of the linear part, of the receiver can be
represented 'as .
C. Mw+Uc-, (8.8)
where u is the noise vol:tageat 9output of the linear part of the
receiver.
Expressions for modulus and phas.e of sum signal at output of
the linear part of the receiver can. be written in the form
Su,= =.I/V+ ' -: u= ot' o M i "(8.9)
where • ' T iS the pha~e of the noise s ignal at output'*6' the linearpart of the receiver;
is the phas3 of the sum signal at output of the linear
part of the receiver, equal to
~ retg jU,, sInl Ye+ 1U1 'S'n T=% =•+'=ar•+s lUAt os'? + luin CI Cos= To ( ..
where .4 ,s the phase of the sum signal at output of the waveguide
bridge, equal to
u (0) sn'I•-- a (0,) sin IIIWe-acga (e,) cos y,=-j- u(e,) cos •='(8.11)
where u(BI) and u(O 2 ) are the values of the moduli of. ,e sum signals
in the first and second planes accordingly;
346

__ I
u (s) ~~ (s) F (01) +2 F (0 -Fs (01) Cos
- u' IF 2 (02) + F2 (0:)+2F. (0.) F0 (0).• co
SI and.@ll are thi phases of sum signal3 in the first and secondplanes,
(?I : arctg F, (01) sin 71 + F, (0,) sin 4,
F, (0,) cos I, + F, (01)cos y'F:0s)sinTs+ F4 (01) sin i(pi arctg .. 02)cos ~+~.(,
S1, ý2, 43 and @ are the initial phases of the signals receivedalong each partial radiation pattern, taking into account phase non-
identity.
The law of phase distribution for noise oscillations can beassumed uniform in thb ,-'<' -21T.
For furt• • studies, the n .dulus of the sum signal at detector
input Is cr., oniently represented in relative units reduced to the
noise p'w-r of the receiver of the sum channels. Then
U -CZ., /,.,V ... III Uc io (8.12)
The signal/noise ratio at output of the linear part of the sum
channel receiver can be written in the form
•: 2, A" O-'OF1(0) 2.,
q,, ,.,,--:+-'-•'--"- =o ,,-q, ý U €
+ 2 'q F' ] l 0CIC S( CU ; ? UC,( . 3
• ~Um
where Um C 0TH - W is the relative value of the amplitude of
sum channel receiver noise.
347
F.
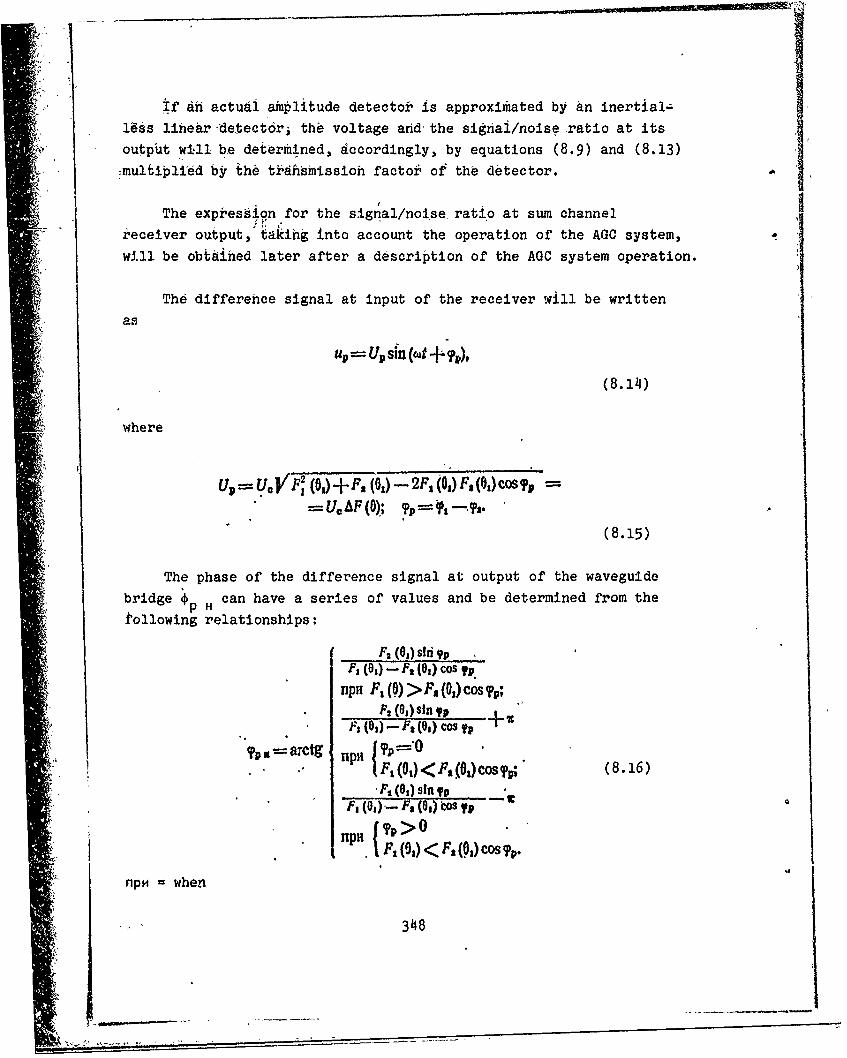
if dh actual amplitude detector is approximiated by an inertial-;
l1ss linear -detect6ri the voltage and the sigriai/noise ratio at its
output will be determined, accordingly, by equations (8.9) and (8.13)
'multiplied by the trdhSimissioh factoi of the detector.
The expiression for the signal/noise ratio at sum channel
receiver output, taking into account the operation of the AGC system,
will be obtained later after a description of the AGC system operation.
The difference signal at input of the receiver will be written
as
up upSin (WI + (P),
(8.1 4 )
where
up U. J/'F (Oj + F2 () - 2F, (01) F, (0t) cos •'P
=uJAF(0).; '?Pp ,--.
(8.15)
The phase of the difference signal at output of the waveguide
bridge *p H can have a series of values and be determined from the
following relationships:
F, (0,) sin Op
F1 (0) - F, (0,) cos yp
npH F, (0) > F, (0,) COS (PV;
F2 (O1) sin p -' . .Fs (03)-- FS (01) Wos TP
. F, (0,) < , .(0,) cos PP (8.16)
,F, (0t) sin vpSF1 (01)- Fe (01) Los is
'PI. ,(0,) < F', (0,) COS •.-
npH = when
348
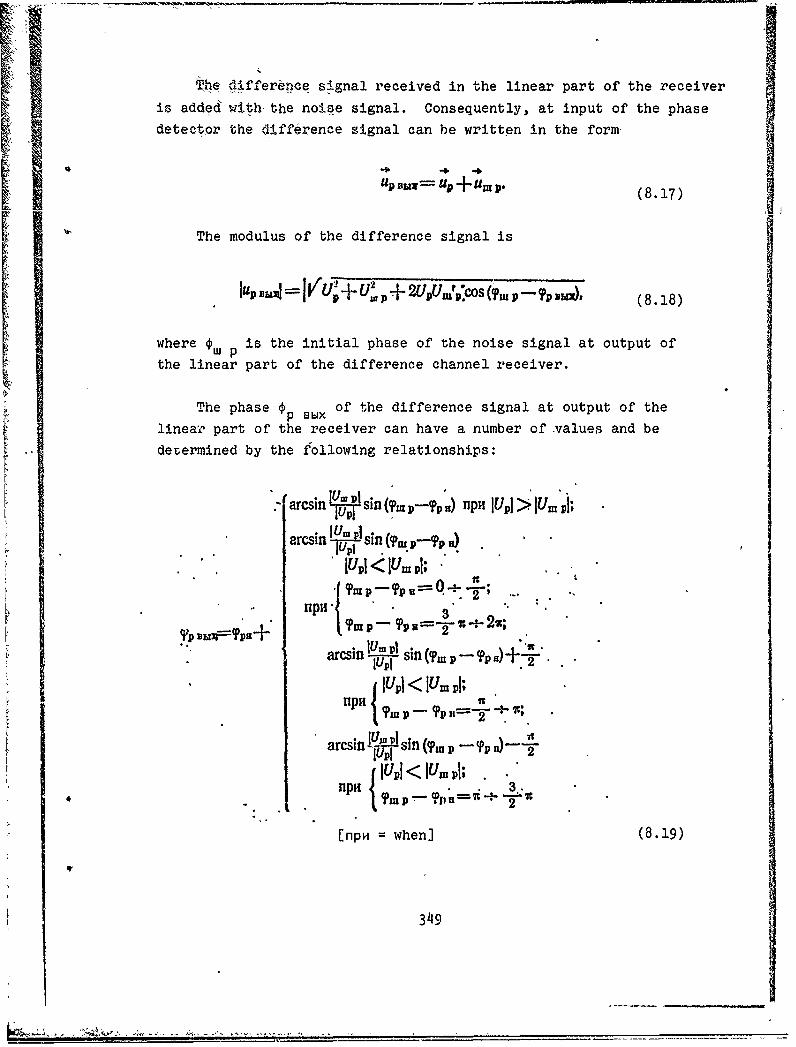
The differenee signal received in the linear part of the receiver
is added with the noise signal. Consequently, at input of the phase
detector the difference signal can be written in the form
up -'UT = up +Um P. (8.17)
The modulus of the difference signal is
,UP,, 4,,, Up,,+=U' P+U, pU,,'psS(•lu,-,p,•. (8. 18)
where * P is the initial phase of the noise signal at output of
the linear part of the difference channel receiver.
The phase p PUx of the difference signal at output of the
linear part of the receiver can have a number of .values and be
derermined by the following relationships:
arcsin IU-7 P sin (,,m n) p.H IUpI > 1U.r I;
areinpp~ I -siIUPIUl < P f,. '1;
{ Y1-1, = 3+.-- z; ...
1UmpI .2T Pu, < IU, H=; ,2
arcsin •-•J sin (&m p -- ?p
2
[npH = when] (8.19)
349
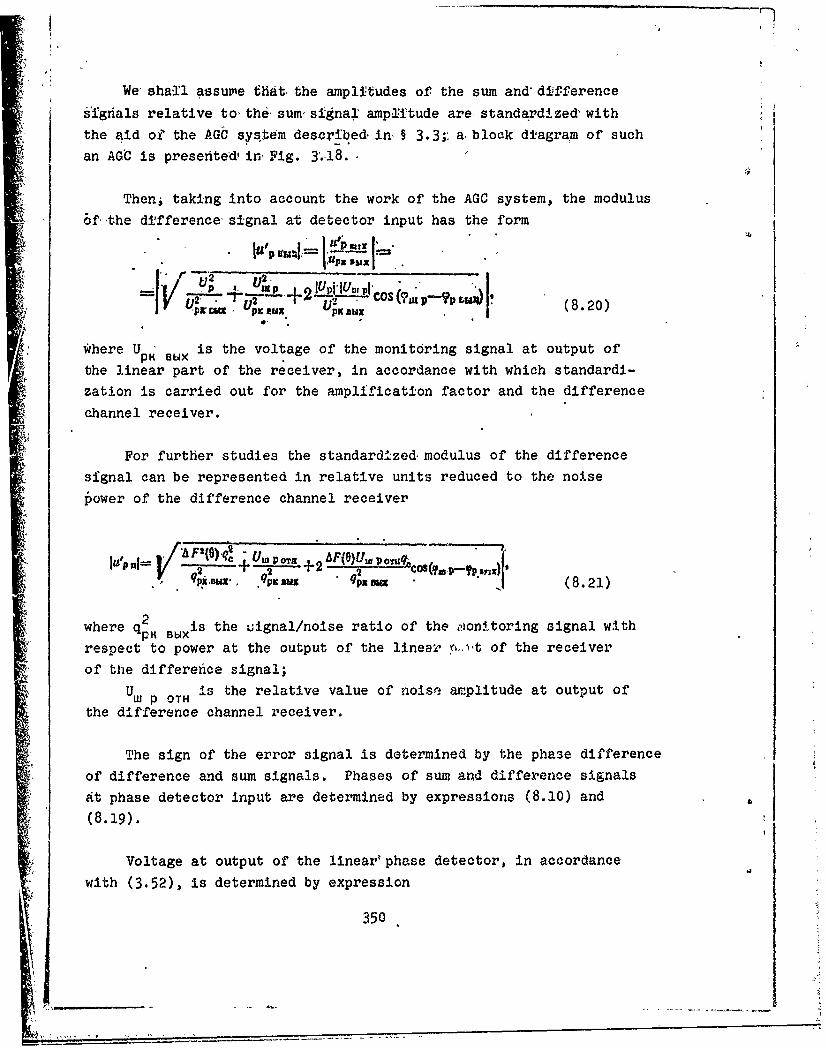
We' sha-Il assume that the amplitudes of the sum and' difference
s6ignals relative to, the sum'signal amp~ltude are standardLzed'with
the aid of the AGO system deseribed- in § 3.3; a. block diagram of such
an AGC is presented' inr Fig. 3.18.,
Then, taking into account the work of the AGC system, the modulus6f- the dffference signal at detector input has the form
21r~~ _Up'2U_ -1 CO IUP-? ll'P-MW- Upr I. RUaX •PKn~ DX (8.20)
where Up U is the voltage of the monitoring signal at output of
the linear part of the receiver, in accordance with which standardi-
zation is carried out for the amplification factor and the difference
channel receiver.
For further studies the standardized, modulus of the differencesignal can be represented in relative units reduced to the noisepower of the difference channel receiver
IU'P c+ !L PI + 2COIV ==(t, - Urn po~ +2AF •(O)Uw p . . .,. .E"I"' (8.21)
where q2 s the uignal/noise ratio of the oonitoring signal withrespect to power at the output of the linear yP.,it of the receiverof the differenice signal;
Up TH is the relative value of noise amplitude at output ofthe difference channel receiver.
The sign of the error signal is determined by the pha3e differenceof difference and sum signals. Phases of sum and difference signalsat phase detector input are determined by expressions (8.10) and(8.19).
Voltage at output of the linear' phase detector, in accordance
with (3.52), is determined by expression
350
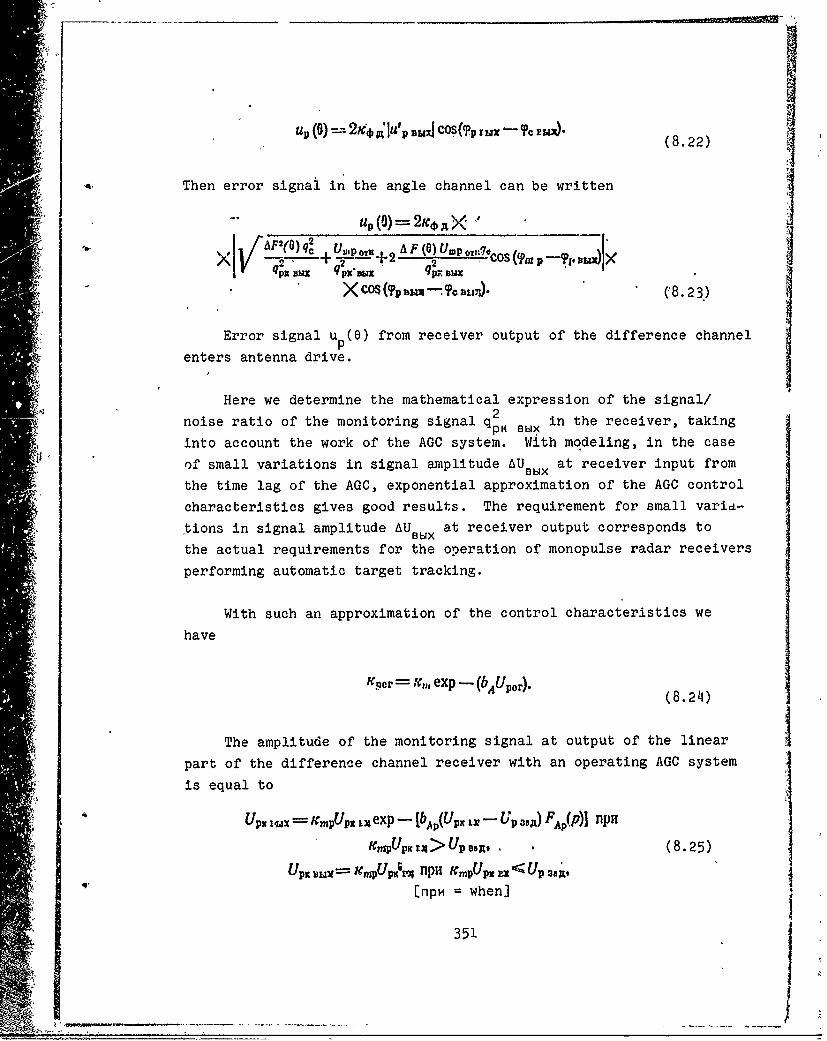
U.9 U4, 2i j'u' .. I cos((Pp r,, Te ru). ( . 2
U .... qM ...a... S.
-- 0 (.22)j
Then error signal in the angle channel can be written
[+ p (0) = 2K,6 X X
2 2 A F (O' M O'.XIA,2 0)q.,42 F 2 * 0 ~•;Cos ((?,a P -- Cp,. ,•=)
q px' p uPX Kbl flX a PUX
X COS (?P Bu "cz 111r). ('8.23)
Error signal u (0) from receiver output of the difference channelP
enters antenna drive.
Here we determine the mathematical expression of the signal/noise ratio of the monitoring signal qin the receiver, taking
into account the work of the AGC system. With modeling, in the case
of small variations in signal amplitude AUBU at receiver input from
the time lag of the AGC, exponential approximation of the AGC control
characteristics gives good results. The requirement for small varid-
tions in signal amplitude AU at receiver output corresponds to
the actual requirements for the operation of monopulse radar receivers
performing automatic target tracking.
With such an approximation of the control characteristics we
have
-- x,, exp - (bAUpor). (8.24)
The amplitude of the monitoring signal at output of the linear
part of the difference channel receiver with an operating AGC system
is equal to
UpS ax = KmpUp. l exp - [bAp(UPX L. -Up 3,A) FAp(P)1 npHS' UPKr X.>Up8A, .(8.25)
Upx ~ XmUplr 11PH h.,mpUpx jI - Up38'~"[npH = when]
351
W P'6

where U1 is the amplitude of the monitoring signal voltage atPK1 BUXinput of the difference channel recelver.
The values of n bA, U ;,F (p-) were determined in § 3.3.
U I. , U1v eXp - IbAC(U'c , ;- Uo ,MAYFAJ)A nP - UC<Uc .1AI
*Upg ly==UC nPHI LUh <UC sm, (8.26)[npH - when]
where U' ' is the amplitude of the sum signal voltage atBbIX
output of the linear part of the sum channel receiver, taking into
account the operation of the AGO system.
After dividing the right. and left sides of equations (8.25)
by ma p = V*,, Px'kmp, we obtain
qt x- qp , xexp - [b'AP (qp, ,,- qP 38,,FAV(P)I
1ipil q1w IEX qp 881.
"qs m,•,•- qp, ux npH qpg su < qV 3,A-. bf',p b#'•]/ (8.27)
[npH = when]
Analogously, for (8,26) we write
qt I x q. exp - IJb Ac(q'C r -&- qO's,)F 0 (p))
npui q'CI-WS>q48aA
qpv=--q, npi q'cxx;qc3VA. (8.28)[npm = when]
Accordingly, taking into account the work of the AGOC system, at
output of the linear part of the sum channel receiver we can write
qlc iux = qa exp - [b'Ac(q'c V;= - qC 83A) FA=(P)I
flJI! q'Orw4Z2>' qc.33At
' q'O.rwx,7oq npH q'c•ux<qcgDA. (8.29)
[npH = when]
332
_ _ __ _
'A A

in order to take into account the effect of reflected signal
fluctuations on angular coordinate determination accuracy, it is
necessary to describe mathematically and well the reflected signal
fluctuation in the reflected signal shaping unit. The selection
of the type of approximation will depend upon the type of target,
(aircraft, rocket, satellite) and upon the convenience of its use
for modeling. The method of imitating reflected signal fluctua-
tions will not be discussed.
The above analysis makes it possible to conclude that a model
(Fig. 8.1) for studying the accuracy of angular coordinate determina-
tion in one plane by an amplitude sum-difference monopuls6-tracking
radar must consist of the following basic units: reflected signal
shaping taking into account the fluctuation of the effective scattering
area of the target; antenna and sum-difference waveguide bridges;
sum signal receiver with AGC; amplitude detector; difference signal
receiver with AGC; phase detector; noise generators (transmitters
of random numbers); antenna drives; target trajectory shaping;
"statistical processing of angular coordinate measurement error.
Algorithms simulating the antenna radiation pattern and signal
at outputs of the sum-difference waveguide bridge are made up onthe basis of expressions (8.2), (8.3), (8.4), (8.5), (8.6), (8.7),
(8.14), (8.15) and (8.16). The sum signal at output of the linear
part of the receiver is described by expressions (8.9), (8.10) and
(8.13). The sum signal at output of the amplitude detector is
determined by expressions (8.9), (8.13), (8.29), multiplied by the
detection factor.
To describe the difference channel receiver unit equalities
(8.18)-(8.21) are used.
The work of the phase detector is approximated by expression(8.23).
The amplification factor standardization circuit with the aid
of the AGO in the difference and sum signal receiver is modeled
in accordance with expressions (8.25) and (8.29).
353

<1 K
be I i
omit
(7)Mn5Up p~Oh, ~ 7 (8)( rvEarna 1l
alM.• CtYg• (CAP ...
"Fig. 8.1, Block diagram of a model of an anplittide sum-differencemonopulse tracking radar. IKEY: (1) Unit for reflected signal shapig (taking fluqtuationsinto account); (2) Noise generator,; (3) Unit for target trajectoryshaping; (14) Antenna and sum-difference bridges; (5) Sum signalreceiver with AGO; (6) Amplitude detectors; (7) Noise generator'(8) Difference signal receiver with AGO; (9) Phase detector; (16)Ant-enna drive; (11) Unit for statistical processing of boordinatemeasurement errors.
The noise generator (random number transmi 'tter) must generate* a random sequence of numbers with a normal law of distribution.
Noise dispersion is calculated for maximum radar range based on
a single sounding signal width. Methods of shaping such randomsequences in a computer are discussed itn [ 9].
Modeling the antenna drive is not difficult and ~we will notdiscuss it here.
As an input effect on the input of the model 'in thie targettrajectory shaping unit we can assign the e~uivalent sinusoid
_ . ) A ,, ,Asin f= , . -
(8.30)
3514
- !

I 4- - ' J
where A = - is aijpýlitude. and = is 1frequency;
x and x are the first and second derivative of the polynomial
approximating, tafget traJectorr.
Reference -data for determining dynamic and fluctuation errors
in Iangular, coordinate meas'urement are the models of error signal
for prodessing .f input effect by antenna drives in the presence of
receiver noises and reflected' signal fluctuations. Statistical
processing is carried out on a group of models for the selected
me'an values of 'the signal/noise !,atio.I V
,The task of statisTical processing is to distinguish the dynamic
and fluctuation component from the total tra6king error
Aa (t) ,a1 mt) a, j 8 A sin(m3t+ )+As (t), (8.31)
I I
where as× (1) is the measured value of an angular coordinate;
6& and 4A arq amplitude and phase of dynamic errors;Ae(t) is, the value of fluctuation error.
1Amplitude and phas4 of dynamic error when writing in discrete
form can be determined from expressiontn
2. ,i Aa (•t-.i) cos (w,4t.1) +=It
+ os A ("4. i) sin( t, i)], (8.3
l ~ l . )( 8 .3 2 )I n
'=e ",ctgt n
40 (At-0 sin (o,,41t.) (8-33)
where At-i = t;
* I
Aa (A4 -A (At ,) Aa((tt.•)tn
355
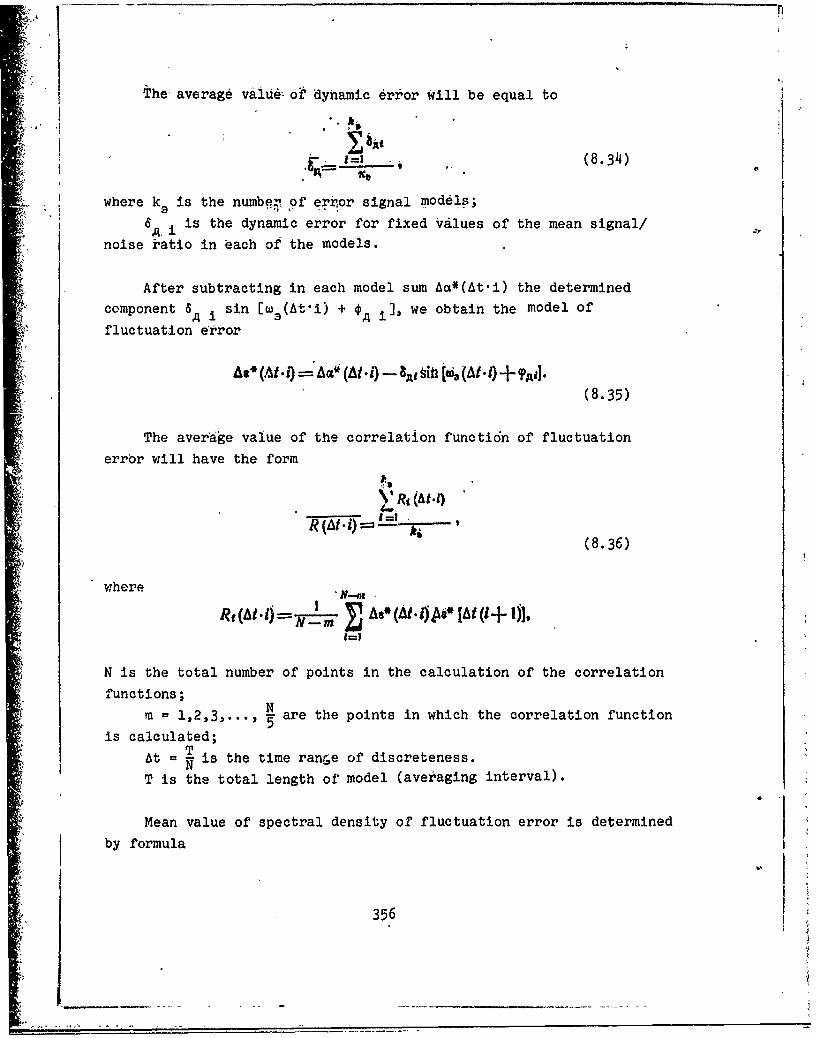
The average vaiiu of dynamic dri'or Wiill be equal to
(8.3J4)-
where k is the numbe- of er:ror signal models;
a ~i is the dynamic error for fixed values of the mean signal/
noise ratio in each of the models.
After subtracting in each model sum Aa*(At-i) the determined
component A i sin [w3 (At'i) + *0 A), we obtain the model of
Sfluctuation error
Ae(MUi = Acc' (AW~) 84 Mh ta6[ei (At-i) +?Ail.(8.35)
The aver'age value of the correlation functidn of fluctuation
error will have the form
T(-At-i)=•(8.36)
where
, M A0 (At - Ad* [At(I+ 1)1,1=1
N is the total number of points in the calculation of the correlation
functions;1,=p2,3..., are the points in which the correlation function
is calculated;
At = is the time ranGe of discreteness.NT is the total length of, model (averaging interval).
Mean value of spectral density of fluctuation error is determined
by formula
356

A -. -"
001-=4At(8.37)
where Af is the frequency interval of discreteness.
The average value of fluctuation error variance will be
@ ko n
Roo n 4 (8.38)
Parp.mpters N, m, At, Af and k are selected based on the necessary
accuracy involved in obtaining estimates of dynamic and fluctuation
errors.
§ 8.3. OVERALL BLOCK DIAGRAM OF A MODEL OF ASCANNING MONOPULSE RADAR WITH FREQUENCY-MODULATEDSIGNALS AND AMPLITUDE DIRECTION FINDING
The task of determining coordinate measurement accuracy with a
model will be examined for an arbitrary signal/noiý • ratio and the
case when at model output are formed single evaluations of measured
parameters of the signal and the evaluations obtained are not leveled.
In models of scanning monopulse radars whose block diagrams are
presented in Figs. 1.12 and 1.13, the main difficulty lies in describing
the stgnal and the angular discriminator.
In ',he model at input of each channel is shaped a pulse whose
amplitude depends upon the angle of target devivation frcm equisignal
direction in accordance with the antenna radiation patterns, while
the envelope and instantaneous pulse phase are determined by the
type of sounding signal selected in the radar. Then amplitude
phase distortions required for studying the fcrm (random or regular)
are introduced into the pulse. The distorted pulse is mixed with
normal white noise whose spectral density can be varied for the
assignment of a necessary signal/noise ratio. Then linea.ý filtration
of the signal and noise mixture i's modeled by a filter with a weight
357
function in agreement with the undistorted signal or containing dis-
tortions of the required form. Detection in the model can be
represented as a determination of the process envelope at' output of
the linear filter. After detection, evaluations of amplitude and
pulse time delay can be formed with respect to algorithms';selected
for processing radar information, which were examined in Chapter 1.
Let us consider models of an amplitude-amplitude and an amplitude
sum-difference scanning radar for determining coordinates in one
plane. In connection with this it j.s necessary to represent in themodel two different measuring channels in which the amplitude of
input pulses, distortion, and noise must be assigned independently.
If the volume of 'onmpter memory in which modeling is produced is
sufficient, we can model both channels in parallel; in the opposite
case, first one of the channels is modeled and the output results
are stored and then che second channel is modeled and an evaluation
of the angle of target deviation from equisignal direction is formed.
This gives an overall representation of one cycle of modeling work.
The model will be described in more detail below.
In order to determine the statistical characteristics of
evaluating measured paramebars, the computing cycles on the model
are repeated. In each cycle a new model of noise and random
distortions is used. When necessary, we can cha. gt the amplitude
of input signals and their temporary position, from cycle to cycle,
for modeling the fluctuation 'of reflected signals and the displacement
of the target with respect to angular coordinates and range. In this
case, tne given models will be used later for studying smoothing
algorithms for output coordinates and characteristics of trajectory
determination accuracy.
8.3.1. Representation of signal and noise. In modeling witha computer the signal s(t) can be represented only by a set of severalnumbers, knowing which, we can calculate any of the current values
of the signal, using prescribed operationz.
R53
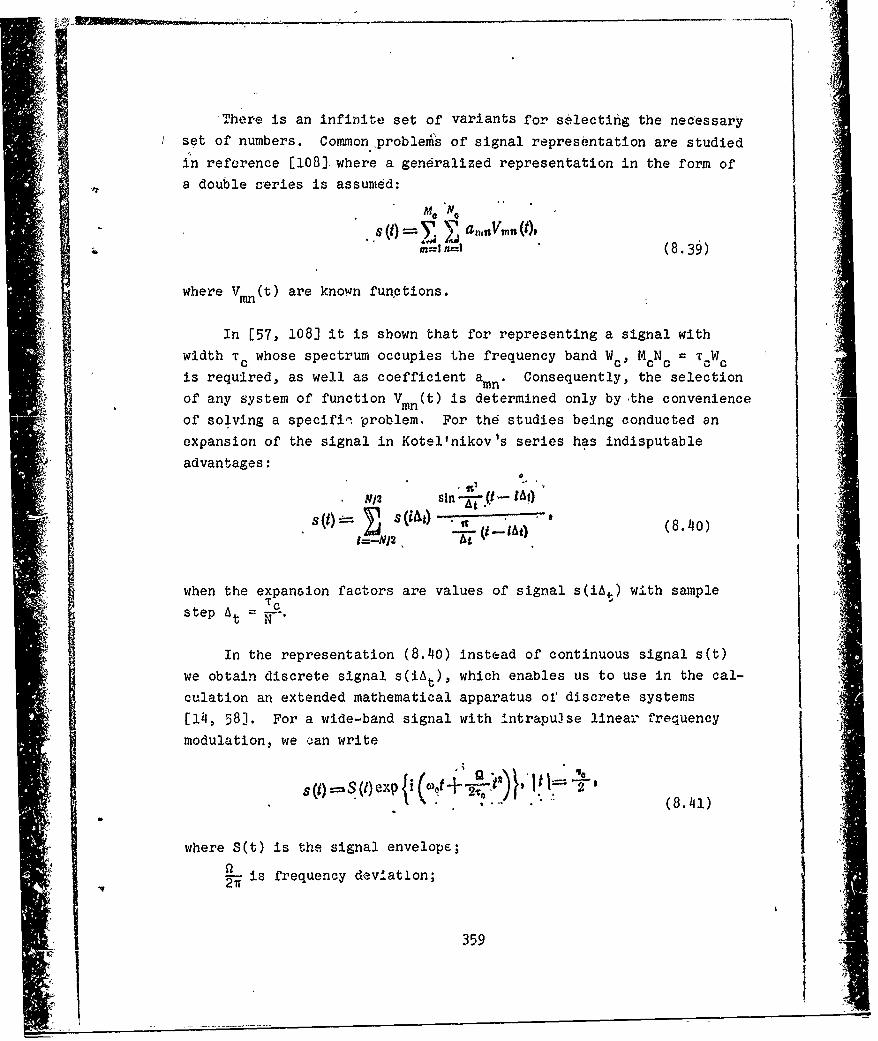
There is an infinite set of variants for selectifg the necessary
set of numbers. Common problelns of signal representation are studied
in reference [108] where a generalized representation in the form of
a double ceries is assumed:
Me No
M=1 n=1 (8.39)
where Vmn(t) are known functions.
In [57, 108] it is shown that for representing a signal with
width Tc whose spectrum occupies the frequency band W., McNc = TcWc
is required, as well as coefficient amn. Consequently, the selection
of any system of function Vmn(t) is determined only by -the convenience
of solving a specifii problem. For the studies being conducted an
expansion of the signal in Kotel'nikov's series has indisputable
advantages:
'Vs2n-jj..- tsi).sia .l (tA) (8.40)
V-N12 4At
when the expansion factors are values of signal s(iAt) with sample
s t e p A = --.
In the representation (8.40) instead of continuous signal s(t)
we obtain discrete signal s(iAt), which enables us to use in the cal-
culation an extended mathematical apparatus of discrete systems
[14, 58]. For a wide-band signal with Intrapulse linear frequencyttmodulation, we can write
* ~~s (1) =S (1) exp 2i~~+~t(8.41)
where S(t) is the signal envelope;
is frequency deviation;
217 , ~359 -
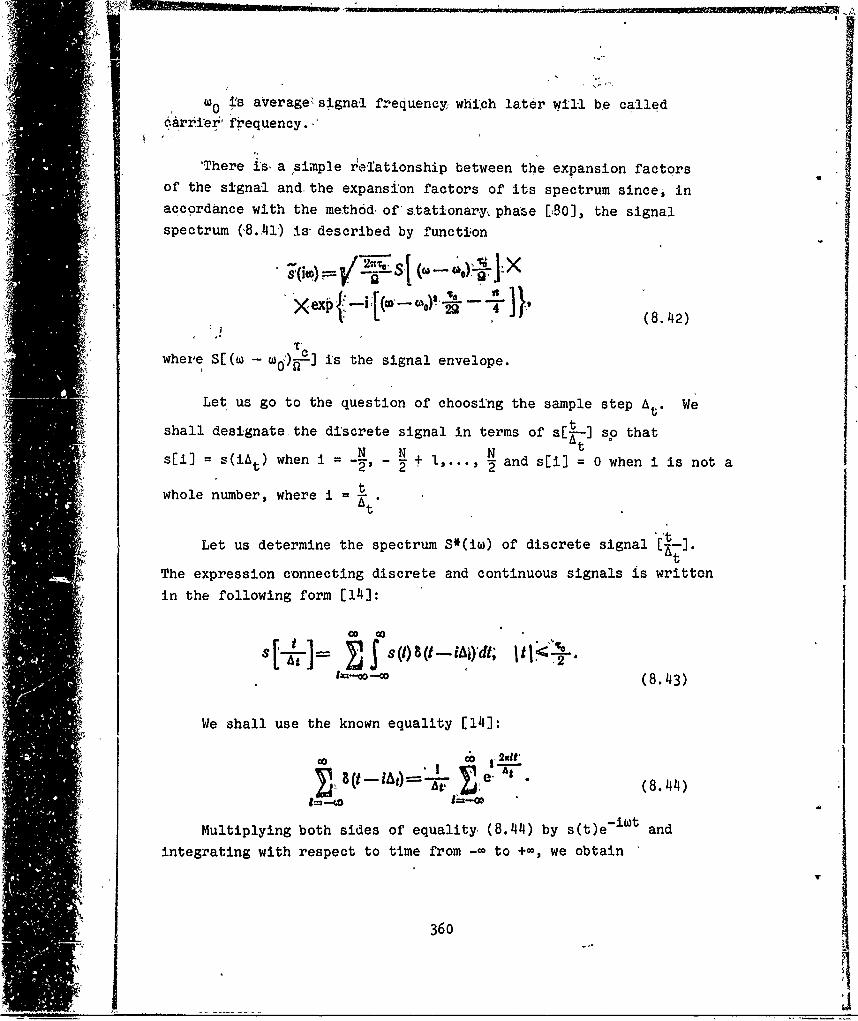
O i's average` signa-l frequency; whi:ch later will be called
6arri'er' frequency.
'There is, a simple reIationship between the expansion factorsii of the signal and. the expansion factors of its spectrum since, in
accordance with the method of stationary, phase [380], the signal
spectrum (8.41) i1s described by functi-on
8'LiD) s....Lj (* -,.- .I "x•,pl-,T -" -T 1}
t -- 0- 1 (8.42)
where S[(w w is the signal envelope.
Let us go to the question of choosing the sample step At. We
shall designate the discrete signal in terms of s[E-t so thatt• i ••'s[i] =s(iAt) wheni = N N N -
,•.2' -) whe,..., A and s[i] = 0 when i is not a
t•i '•, whole number, where i=At
Let us determine the spectrum S*(iw) of discrete signal A]
The expression connecting discrete and continuous signals is written
in the following form [14]:
I - -Go (8.43)
We shall use the known equality [14]:
, (t- ,)= e.-t (8.44),,1 = -o GO... •
Multiplying both sides of equality, (8.44) by s(t)e and
integrating with respect to time from -• to +•, we obtain
360
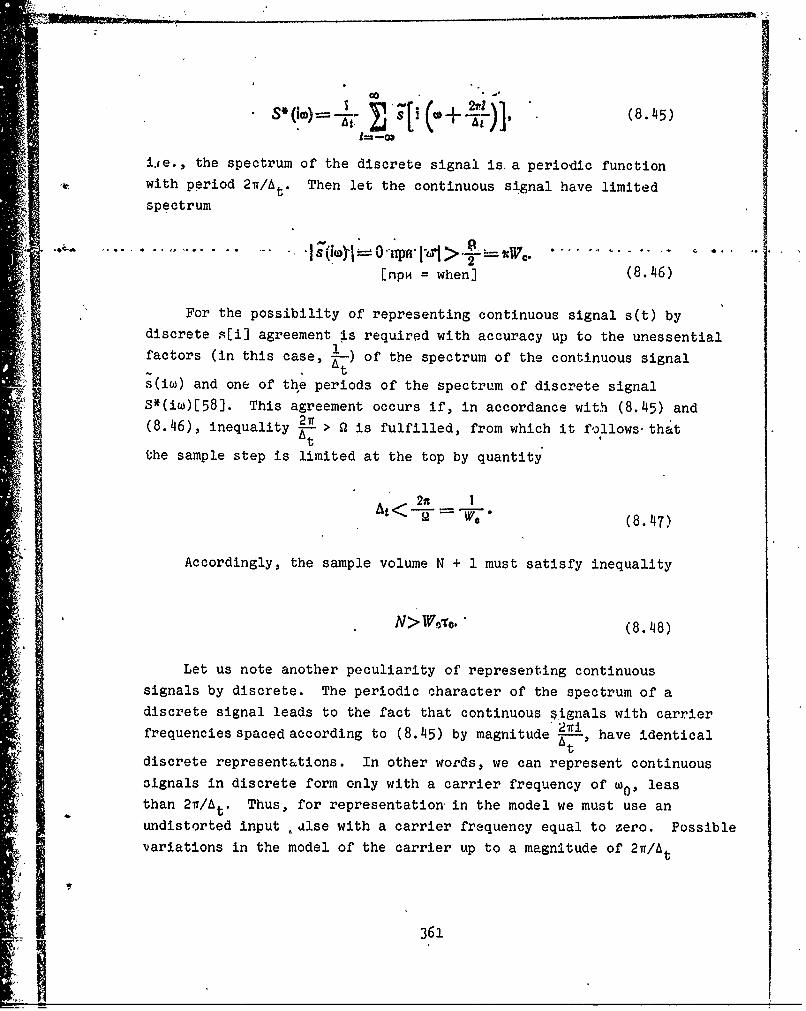
S(8.45
• * •I=o : (W; +-•)'(.5
i.je., the spectrum of the discrete signal is a periodic functionwith period 2N/At. Then let the continuous signal have limited
spectrum
[npH = when] (8.46)
For the possibility of representing continuous signal s(t) bydiscrete s[i] agreement is required with accuracy up to the unessential
factors (in this case, A-) of the spectrum of the continuous signalAts(iw) and one of the periods of the spectrum of discrete signal
S*(iw)[58]. This agreement occurs if, in accordance with (8.45) and21T
(8.46), inequality y > S is fulfilled, from which it follows, thatt
the sample step is limited at the top by quantity
S2n
'<-- -=-•-,. (8.47)
Accordingly, the sample volume N + 1 must satisfy inequality
N>WO.- (8.48)
Let us note another peculiarity of representing continuous
signals by discrete. The periodic character of the spectrum of adiscrete signal leads to the fact that continuous signals with carrierfrequencies spaced according to (8.45) by magnitude have identical
Atdiscrete representations. In other words, we can represent continuous
signals in discrete form only with a carrier frequency of w0' leasthan 21/At, Thus, for representation in the model we must use anundistorted input ,alse with a carrier frequency equal to zero. Possible
variations in the model of the carrier up to a magnitude of 2r/At
361
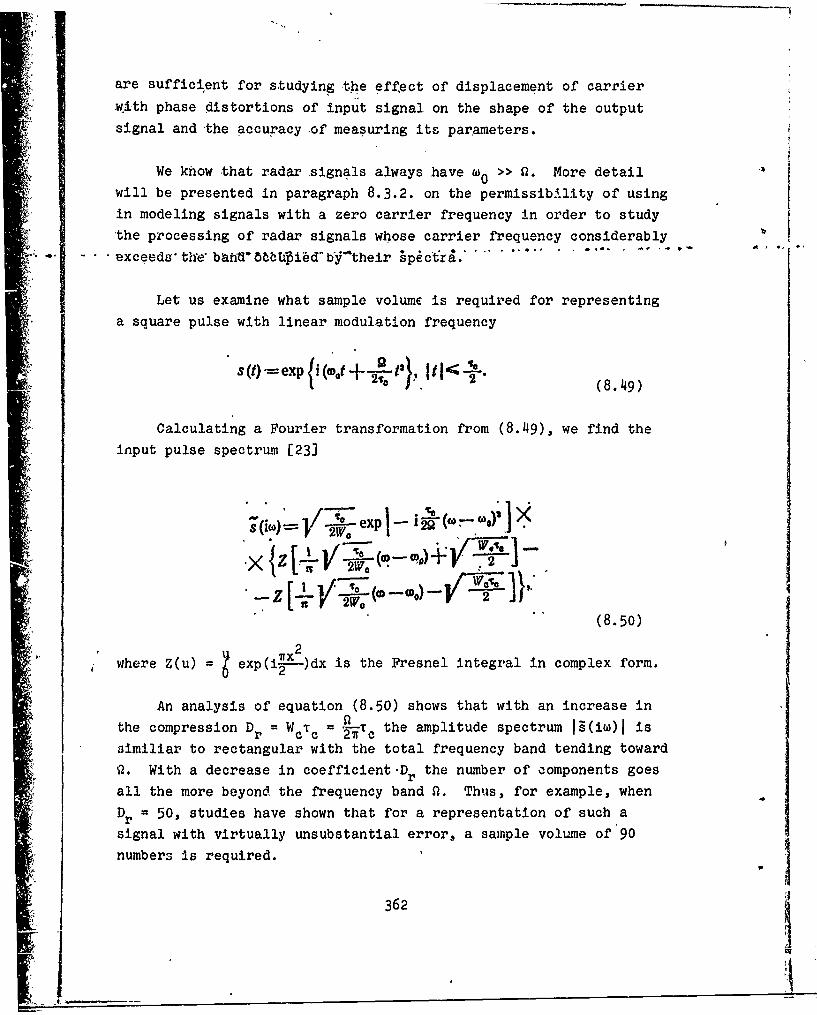
are sufficient for studying the effect of displacement of carrier
with phase distortions of input signal on the shape of the output
signal and the accuracy -of measuring its parameters.
We know that radar signals always have w0 >> Q. More detail
will be presented in paragraph 8.3.2. on the permissibility of using
in modeling signals with a zero carrier frequency in order to study
'the processing of radar signals whose carrier frequency considerably
.exceeds" ti" baftd8ft5Ui~d'bd their 5pgctrg................... ......-
Let us examine what sample volume is required for representing
a square pulse with linear modulation frequency
sT"e 2 (8.49)
Calculating a Fourier transformation from (8.49), we find the
input pulse spectrum [23]
'oa exp --
2W0 29 o
'go; W. -TO
Z[ W-,0 - Iý
7 (8.50)
where Z(u) = exp(i•---)dx is the Fresnel integral in complex form.V2
An analysis of equation (8.50) shows that with an increase in
the compression Dr = Wc~c = TTc the amplitude spectrum ;s(iw)l is
similiar to rectangular with the total frequency band tending toward
il. With a decrease in coefficient.Dr the number of components goes
all the more beyond the frequency band Q. Thus, for example, when
Dr = 50, studies have shown that for a representation of such a
signal with virtually unsubstantial error, a sample volume of 90numbers is required.
362

Linear filtration does not lead to an expansion of the signal
spectrum. Let us examine, therefore, the expansion of signal
spectrum during detection. In the case, of the large compression
factors from (8.50) we obtain [35)
-~rect(8.51)
The signal at output of the matched filter is
0t ..
s-7'(!:,,.,) di =o •2n 2 0 0=t- P•0) (8.52)
and the signal after square-law detection is determined by expression
On
2 (8.53)
A Fourier transform from (8.53) can be written as
00 T2
2 (8.54)
Comparison of formulas (8.51) and (8.54) shows that a square-
law detector expands the spectrum by a factor of 2. Taking into
account the fact that the spectrum of the input signals with distortions
can be somewhat expanded as compared with the spectrum of an undistorted
signal and keeping in mind the convenience of using output data, we
finaily obtain a sample volume equal to 201, i.e., N = 4Dr = 200,
and a sample step of A, = E. Thus, the signal in actual form with
a zero carrier frequency and compression factor Dr 50 will be
S t --Cos J2, Il T ," =50a~2t zeocare (8.55)
• 363

and is 'represented in the ,model by 4screte ýsignal
SI[2CG \ N(8.56)
N + 1 N.where i N 2,,. *,
O~r
For the selected numerical values N = 200 ad D= 50, we
obtain 20 = 0.00393.
At the beginning of this section it was shown that in the model
the amplitude of the input pulse serves for the assignment of target
deviation from equisignal direction and modeling of reflected signal
fluctuations, while the additi onal components characterize the dis-
tortions of the envelope and instantaneous phase. Consequently,
input pulse can be represented by a discrete signal in the form
a;di =Ac(I + AS (lCos 4) 11 rect{~I(8.57.)
where
(D) [11 +,+€.i + ?0e. i +?,,.3 i'+ I, (l1."
The quantities Ac and AS[i] serve to change pulse amplitude
and to assign the distortions of the pulse envelope. Coefficient
402 determines the steepness of linear frequency modulation,
Coefficients O, OW 00 and the quantity A€$[iJ serve to assign
various laws of variation for instantaneous pulse phase. The
quantities ASDIJ and AO Ci] can be random.
In examining the question of rbpredenting white noise in P mode].,
normal noise n(t) with mathematical expectation nU) = 0 and
correlation function
364[ ---
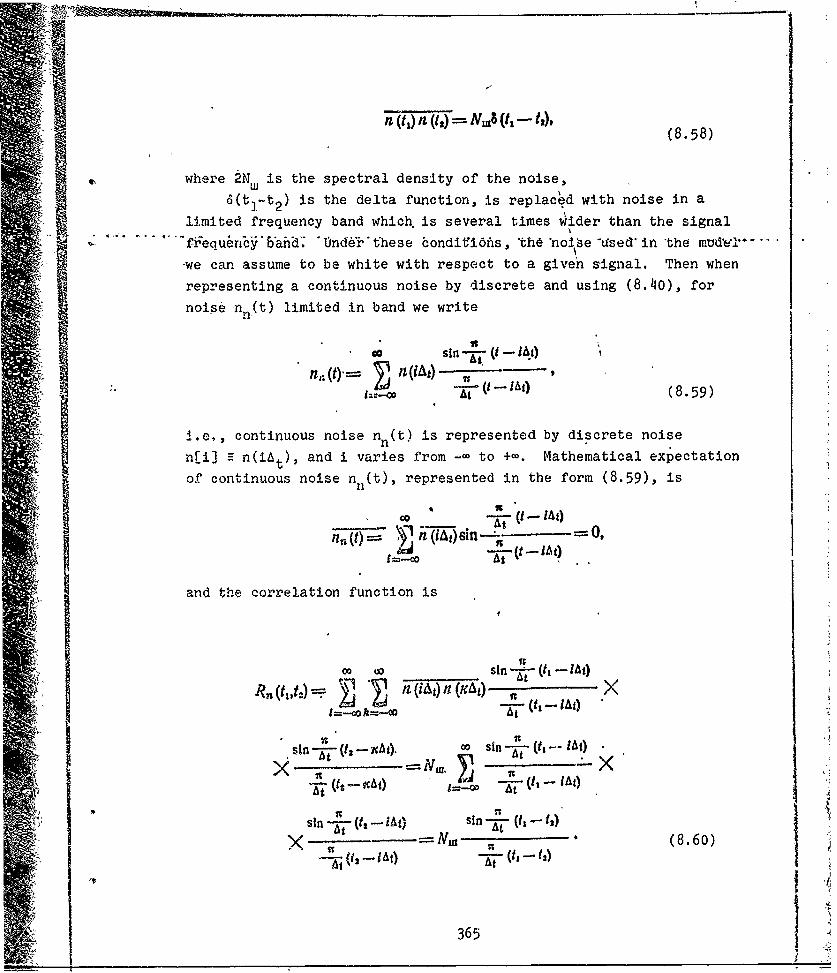
n (t)n Nina- v (t,- t,),(8.58)
where 2N is the spectral density of the noise,
6(tI-t2) is the delta function, is replaced with noise in a
limited frequency band which' is several times Wider than the signal
f.•equkncy'*ahfi. "nde'•'these bondit'6hs, "th "noi e -Used" in *the madVT...
-we can assume to be white with respect to a given signal. Then when
representing a continuous noise by discrete and using (8.40), for
noise-nn(t) limited in band we write
Co sin y (At) 'In,• (t)=--- 1•i t) - (-- A
at):• _ •A tq ( 8 .5 9 )
!.e,, continuous noise nn(t) is represented by discrete noise
n[i] F n(iAt), and i varies from -- to +-. Mathematical expectation
of continuous noise n n (t), represented in the form (8.59), is
- -- (t- iii)
t=-conr,(t)= WiTdsn,
and the correlation function is
CO CO sin -•- (ti - IAO
R (tilt.-) it x /, (cAt)1=-co k=-c ( -C
Ss t
sin- (t,--• t,) oo sin - , - AA At>< .~ ~- - j..= Nu,. t- A
sln-•-(, -•0sin-• (f, - t2)(---) (8.60)
365 1
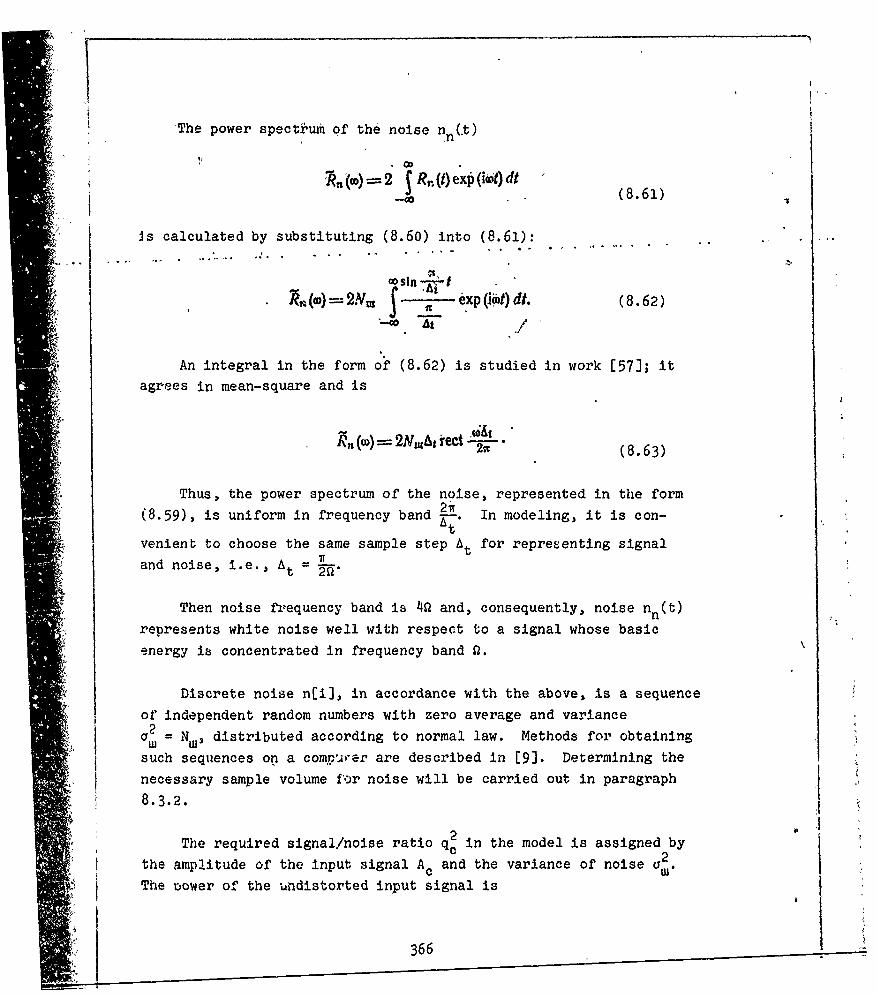
'The power spectium of the noise n Ct)
2 jRr(O)exo'(iht) di(8.61)
:2' Js calculated by substituting (8.60) into (8.61):
(w) =2N, exp (o t) d.(8.62).................
-0c At/
An integral in the form of (8.62) is studied in work [57]; it
agrees in mean-square and is
2%-!4L (8.63)
Thus, the power spectrum of the noise, represented in the form(8.59), is uniform in frequency band 2Lt" In modeling, it is con-
tvenient to choose the same sample step At for representing signal
and noise, i.e., At =-
Then noise frequency band is 4Q and, consequently, noise nn(t)represents white noise well with respect to a signal whose basic
energy is concentrated in frequency band f2.
Discrete noise n[i], in accordance with the above, is a sequence
of independent random numbers with zero average and variance2a2 Nw, distributed according to normal law. Methods for obtaining
such sequences on a compu•er are described in [9]. Determining the
necessary sample volume for noise will be carried out in paragraph j8.3.2.
2 aThe required signal/noise ratio qc in the model is assigned byc2
the amplitude of the input signal Ac and the variance of noise 0 .
The Dower of the undistorted input signal is
• ~366

represented in the form (8.4C), equal to
2 at At 2
.A Xvr eo s2- P(A t.)) .... .
N12
E ý=••1 2 C (8.64)
SPe ral density of the noise, according to (8.63), is equal to
2a02At, .onsequently, the ratio of signal energy to spectral density
of noise will be determined by formula
Nj2
2 1--r-Nj22oll (8.65)
Substituting into (8.65) the selected values N : 200 and
Dr =40, we ..obtain
I __ 100
8.3.2. Modeling the processing of a signal in the receiving
channel. Signal processing in the receiving channel includes the
linear filtration of input pulse and noise, as well as the dis-
tinguishing of the envelope obtained after the filtration of the
additive mixture of signal and noise. We shall write the input pulse
in the form
S1m epjj -I-*- (8.66)2
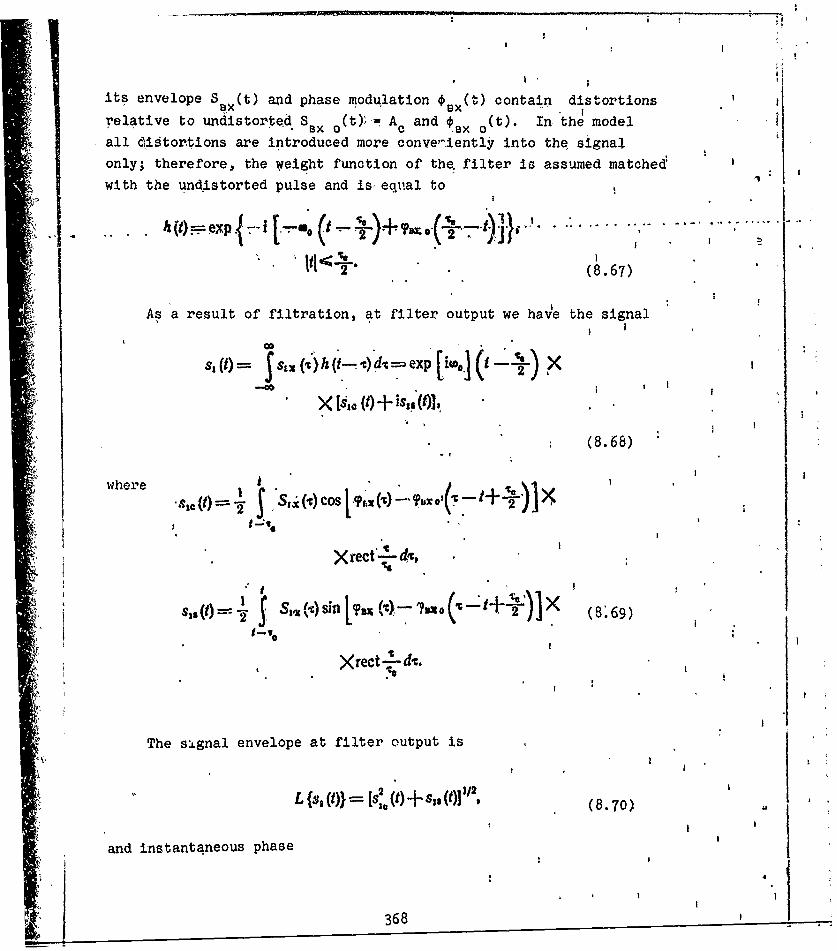
,I I
its envelope S (t) and phase modulation 0 (t) contain distortionsBX ex ntn
relative to undistorted SB× (t),=, Ac and xO Ct). In the model i
all distortions are introduced more conve'iently into the signal.
only; therefore, the weight function of the, filter is assumed matched
with the undistorted pulse and is- equal toia,,.-.-o,(.-, (..-..u ( ..-.. . .. .. . .. .. . ......(- ) . ..'..............
*2 1.- • (8.67)
As a result of filtration, at filter output we have the signal
- ~ ,. I,,to .[-(,c h,(,-t•-ow t)'. ('-p-x Pi Ms o1+ is,(lý
E. " (8.68)
where .( - .S,.(,)COS 1, .(, (¶ '+7 )1)•
iS., ",) i [CF. - 2:+ -]Xrect-Ld-t,
The s'ignal envelope at filter output is
L {I,30}--[So(- -s,(tl, (8.70)
and instantafneous phase
368
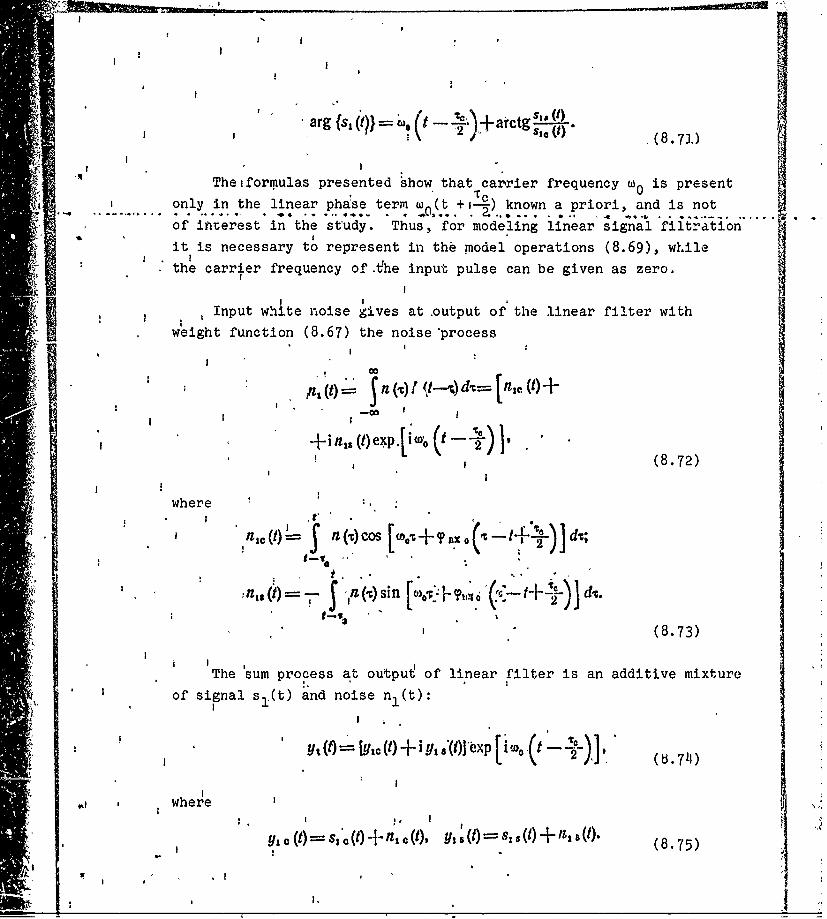
I 1 I .
I I A'~.y---a.6(~y.(8.7].)
Theiformulas presented show that carrier frequency w0 is present
only in the linear phase term +0 (t .--. )..) own a priori, and is not
of interest in the study. Thus, for modeling linear signal filtration
it is necessary to represent in the model operations (8.69), while$ Ithe carrier frequency of.t'he input pulse can be given as zero.
Input white noise gives at .output of the linear filter with
weight function (8.67) the noise 'process
, I.
S.~~n, t n (c)! t-• d,€=t' (t)"+
., ~~+ n,,, (t) e.p.[iWo• (,-) .(8.72)
where ",
(8.73)
The'sum process at outpuý of linear filter is an additive mixture
of signal s 1 (t) and noise nl(t):
.o(t) +,y, ()I exp i o0 (t _ , ( .71 )
where
-o C (t) S hc( + t)s,(I+ (t). (8.75)
S , II
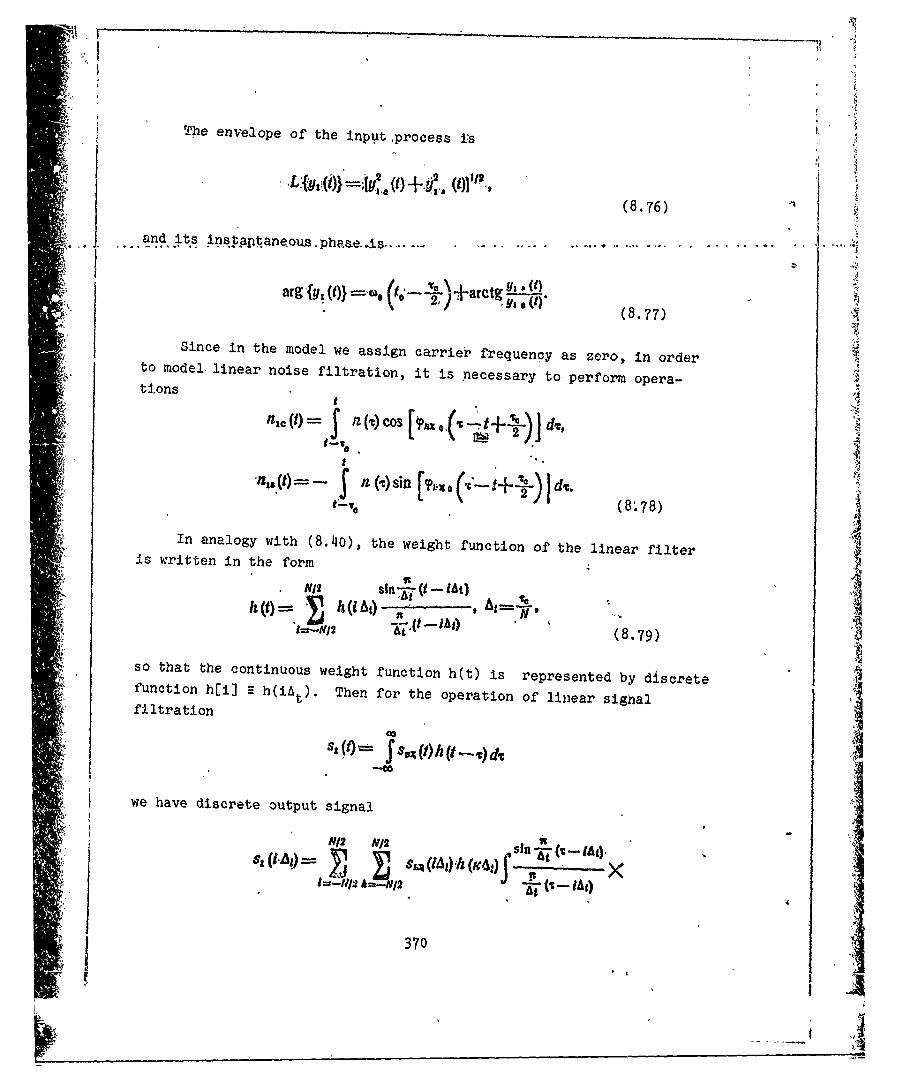
The envelope of the input ,process i.s
01 .:,•ty'=l.~t a g V)"• V3(8.76)
and.. ts insta aneoous.phaae..is. ......
: ~arg ly, (i}---,we o' +arctg Y-'-0 • (8 .77)
"Since in the model we assign carrier frequency as zero, in orderto model, linear noise filtration, it is .necessary to perform opera-tions A
nIo(0= q(ocos ot dt,,
n - Y) (C) sin ?vx ( 1~+21-) l dv. (8 )III , It- (8.78)
In analogy with (8.40), the weight function of the linear filteris written in the form
-t0 A n A =..(t- i ) ,M1N2 -dt(8.79)
so that the continuous weight function h(t) is represented by discretefunction h[i] h(iAt). Then for the operation of linear signalfiltration
CO
•,t0 fsox(t) h(t-,,
we have discrete output signal
l2 N/2 sin-
t=-41/l h=-N12 - " - Ma)
370
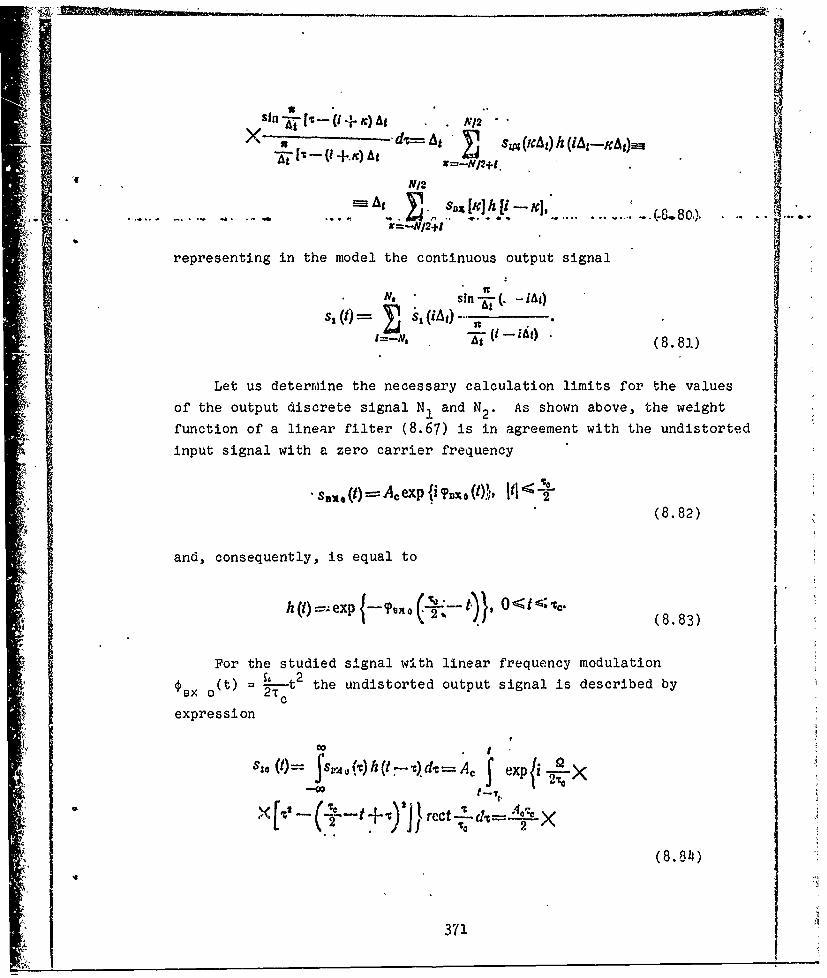
sin Z[Qi)g .. N2r
X + XN+-X --Ad= A•t si s(Kt¢) h yAJ--C•t)a3
r-N12+1.
NI2
_•. a• .... ..-[] -€ - (,. , 8 8o),x=-N/2+1
representing in the model the continuous output signal
N', sin -- . -i~x)
1=-N, (8.8).)
Let us deterrmine the necessary calculation limits for the values
of the output discrete signal N1 and N2 . As shown above, the weightfunction of a linear filter (8.67) is in agreement with the undistorted
input signal with a zero carrier frequency
Sa a~,() A. exp ji %o(tI)x . l0 -
(8.82)
and, consequently, is equal to
2 % ( 8 . 8 3 )
For the studied signal with linear frequency modulation
(t) = 2-t 2 the undistorted output signal is described by
expression
-00 Y 2
(8.84)
371
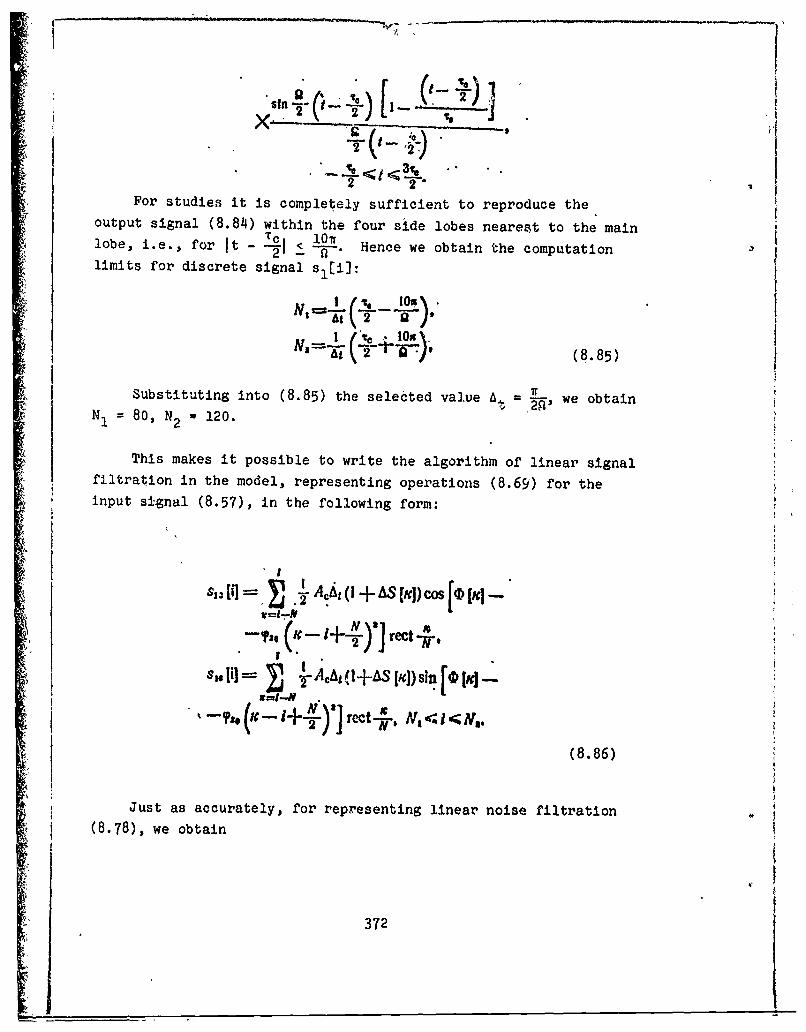
St _ _ _ _ _
"4C'+)(, Žz±Ž.
Forstuie itis2 • TFor8tuie, itisCompletely sufficient to reproduce the
output signal (8.814) within the four side lobes nearesit to the main•1 lO•r
lobe, i.e., for It - <-a--. Hence we obtain the computationlimits for discrete signal s 1 [i]:
Substituting into (8.85) the selected va].ue A4 =,, we obtainN1 = 80, N2 2 120.
This makes it possible to write the algorithm of linear signal
filtration in the model, representing operations (8.69) for theinput signal (8.57), in the following form:
limit s for disc [ect) sga [i- j ,
(8.86)
I Just as accurately, for representing linear noise filtrationS (8.78), we obtain
372
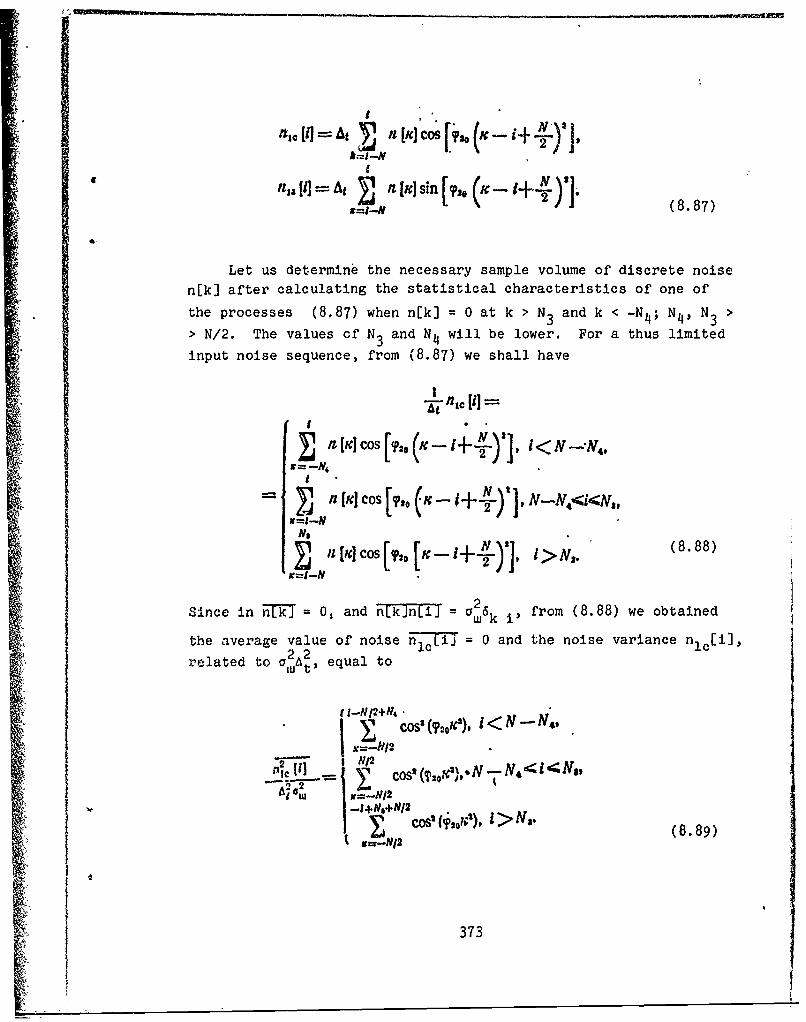
I-- I.--I
nE,[ [ l,, O - .(8.87)
Let us determine the necessary sample volume of discrete noise
n[k] after calculating the statistical characteristics of one of
the processes (8.87) when n[k] = 0 at k > N3 and k < -N 4 ; NP, N3 >
> N/2. The values cf N 3 and N4 will be lower. For a thus limited
input noise sequence, from (8.87) we shall have
IIit~ ~ j lie] [os =70(
A
~NN
Since in n-k] = Os and n~k]n~i]" = a2tsk i, from (8.88) we obtained
the ~average value of noise iTT = 0 and the noise variance nlc[i],2 A2
related to om t, equal to
S(-N28.8)
I t373
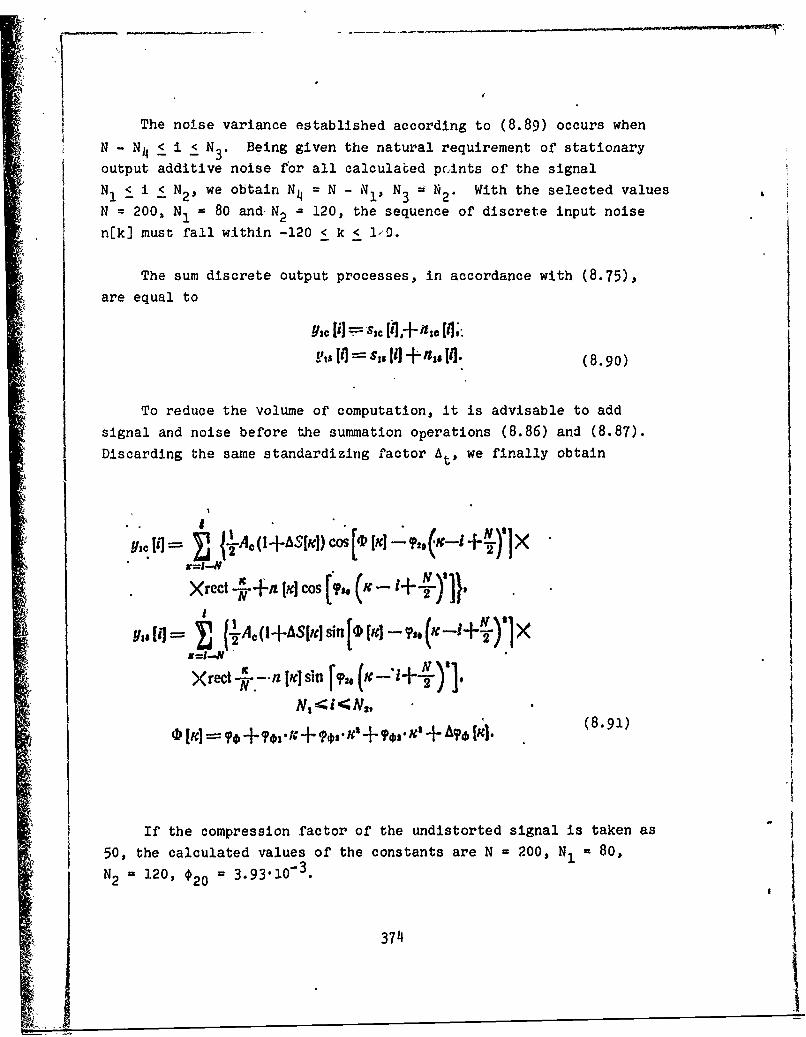
The noise variance established according to (8.89) occurs when
N -N 4 < i < N3* Being given the natural requirement of stationary
output additive noise for all calculated prints of the signal
N, i i < N2 , we obtain N = N - N1, N3 N2 . With the selected values
N = 200, N1 = 80 andN 2 a 120, the sequence of discrete input noise
n[k] must fall within -120 < k < 10.
The sum discrete output processes, in accordance with (8.75),
are equal to
t',o [i] =-sicP, [l+,o ate;"
Yis $i =sl• +/,is~l (8.90)
To reduce the volume of computation, it is advisable to add
signal and noise before the summation operations (8.86) and (8.87).
Discarding the same standardizing factor At, we finally obtain
2 Ix
Xrect +n [m] cos [t()+~ ~~~~ý2 xo + ~+, }y+,[iJ,= (J.Ac( + ,S[Jd ,,r c,- vs. (,,-i+-)-1' ><
N, <i <Ns,,4)~c]~+?, 3 (8.91)To lc ,+ +ol •+., + Ift,',M1 + (pox.,€ + A~p, ,b.(.1
If the compression factor of the undistorted signal is taken as
50, the calculated values of the constants are N = 200, N1 - 80,
N2 = 120, $20 = 3.93110 3.
374I
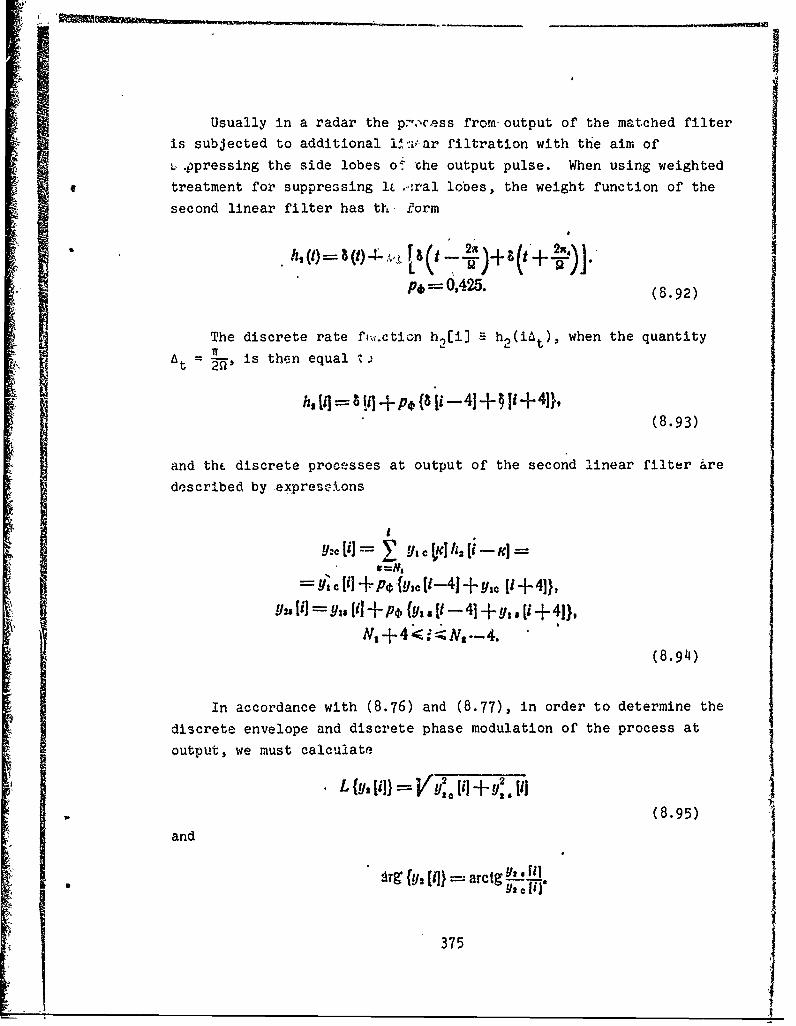
Usually in a radar the p.,%c-ess from output of the matched filter
is subjected to additional !! ýxi-ar filtration with the aim of
L..ppressing the side lobes oC 'che output pulse. When using weighted
treatment for suppre3sing lt ,oral lobes, the weight function of the
second linear filter has th, form
pb = 0,425. (8.92)
The discrete rate fx.ction h 2 [i] - h2 (iAt), when the quantity
A =-, is then equal t-
h, 2'1 • !i + pt {8 i -41 + §[I + 4]),(8.93)
and the discrete processes at output of the second linear filter are
described by expres*.kons
Y:[i= Y yc ,oK[h 2ifi-- =
-Y, [i1+ p, + ,.yc 1i-41 +y/c [1- +4]},YS YI = + P+• -- y1 [t -4 4 + y, a V + 4]},
N, + 4 < •N,.-4. '
(8.94)
In accordance with (8.76) and (8.77), in order to determine the
discrete envelope and discrete phase modulation of the process at
output, we must calculate
{YL [i]} Vyo [ij- ] +-Y [i](8.95)
and
Srg fy, [I]) = arctg Y 1.
375

Let us note that in order to exclude the operation of suppressing
side lobes of a signal, it is sufficient to assume p, = 0.
All discrete signals in the model represent actual continuous
signals and are connected with them by a Kotel'nikov series (8.40);
therefore, when it is necessary to obtain intermediate values of
signals at points i + nM, hnMI < 1, we should perform interpolation
(8.96)
where F(k] is the interpolated signal.
Figure 8.2 presents a simplified block diagram of' the part of
the model described, for one receiving channel. In the signal unit
(6C) the following quantities are calculated:
Ac( + AS ("ic). H
[M = and]
for - < k < H. Quantitiez Ac, AS[k], AO [k] are given by table or
are calculated in other units of the model, depending upon the purposes
of the study. Units of the matched filters (6CP.-l and BCc-2) performthe operation (8.91) and the weighted processing unit (660) the
operations il, (8.94). Two square-law function generators and the
add circuit represent the amplitude quadratic detector. If, however,
it is necessary to model a linear amplitude detector, at output of
the add circuit the unit which extracts the square root is connected.
Later, when we study the block diagram of a model of a specific
scanning monopulse radar, the BCO and EBO units will be designated
600 (optinmal processing unit); the two square-law function generators,
the add circuit, and the square-root extraction unit will be called
the amplitude detector unit (6AA).
376
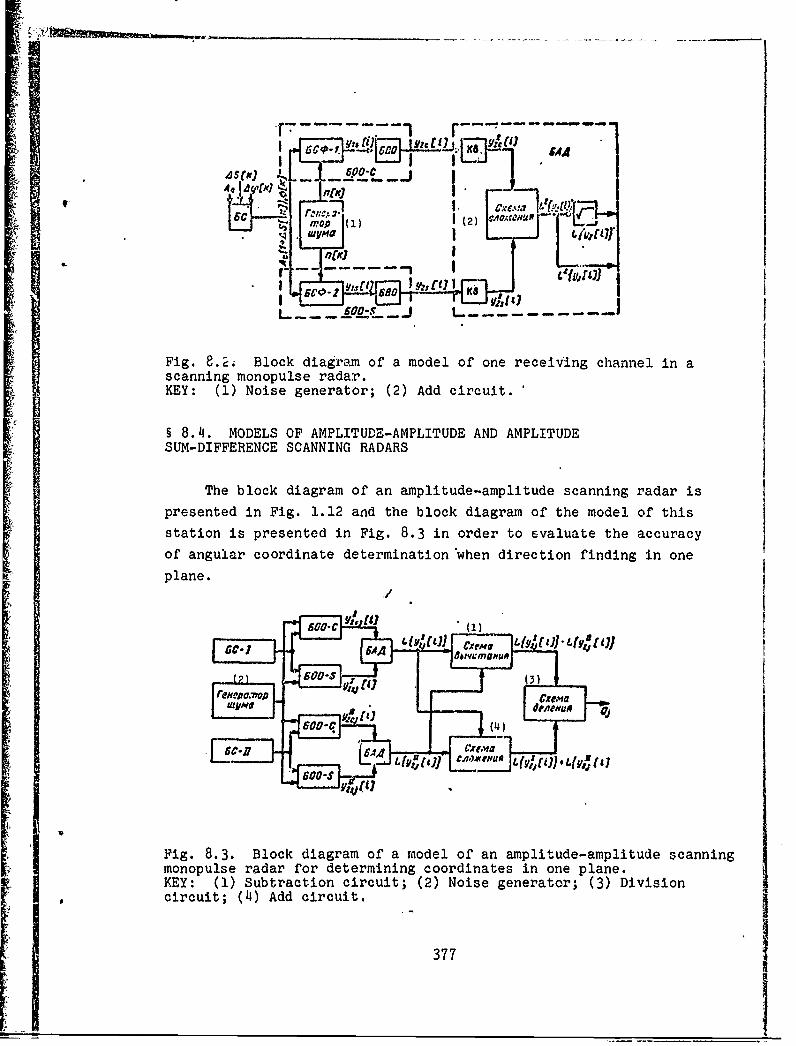
-r-- 7 7 - -
I Ic-~ A600-C _...
" I (xe I (aR, 17[g)(
v t 7m ~op, (1) )r 1,_.dgm a
r - , I "-I-l LV)Il •() zsJ
I. r vosI = Q
Fig. 8.2i Block diagram of a model of one receiving channel in ascanning monopulse radar.KEY: (1) Noise generator; (2) Add circuit.
§ 8.4. MODELS OF AMPLITUDE-AMPLITUDE AND AMPLITUDESUM-DIFFERENCE SCANNING RADARS
The block diagram of an amplitude-amplitude scanning radar ispresented in Fig. 1.12 and the block diagram of the model of thisstation is presented in Fig. 8.3 in order to evaluate the accuracyof angular coordinate determination when direction finding in one
plane.
_60 -- e-
lip Fig. 8.3. Block diagram of a model of an amplitude-amplitude scanningmonopulse radar for determining coordinates in one plane.KEY: (1) Subtraction circuit; (2) Noise generator; (3) DivisionScircuit; ((4) Add circuit.
377
_ _ _ _ _ _ _ _ _ Ix W

In accor'd'ance with formula (1.39)i in order to form an evaluationof the angle of target deviation from equisignal direction, in themodel the following ratio is used
- jj f'--2 ]1 L i'V2-N1
(8.97)
where L and LIU, are the values of signal envelopes atoutputs of the ampiLtude detector units for the first and secondchannels when i 2, which, with undistorted input signal, correspondsto the maximum value of the output signal envelope. In formula (1.36)they are designated as ul(8) and u2 (e), respectlveiy At model inputin each of these cycles with respect to J, input signals are given:
S A'j (I + ASc [1) , J•1,1s H xjv.= A" (I + As" [Ki) Cos 'I);" [I.(.sX (8.981
where
-J (II) -- -, , (II).'o,A' 49A" 4#,•&s(5). = a,,p1 ®0; A: =a .(O
aq j is the coefficient assigning the value of the signal/noiseratio in accordance with (8.65).
Radiation patterns F1 (O) and F 2 (e) can be given by table or bycorresponding formulas.
The quantities AS [k], 00 is fo lJ' 00 2J' "0 3JP 40 j[k),which deterqmine amplitude and phase distortions of input signals canoe given Independently in both channels or in only one channel. Inthe latter case, they will represent the relative distortions of thecharacteristics of one channel with respect to the other.
378

P •nvelopes L{yl Eill and Lfy II Ci]} of pt-ocesses at outputs of
the first dnd second channels are obtained in the, model according
to the algorithms described in paragraph 8.3.2.
The angle of target deviati:,,n from equisignal direction e6is determined according to the ,t-lue obtined for Q (8.97) from
the direction finding charazteristic, equal to
F, (0) FFA9)o Q==s (0) =- . ..F, (6) + -, (0) (8.99)
A block diagram of an amplitude sum-difference scanning monopulseradar is presented in Fig. 1.13 and the block diagram of the model
in Fig. 8.4.
In reference [55J it-is shown that antenna radiation patterns
for the sum and difference channels are determined according to the
diagrams of the first and second channels with the aid of a matrix
equation
, 5) , ,I,, )to (8(8)
4 (8.100)
where complex quantity nj,, (iJ = 1, 2) gives the ampl~tude and phasenonidentity of the difference waveguide bridge. If we designate
then from (8.100) we obtain
1C (0)F----[FC,(0) exp PigC (6)],
jX (0)= Fp (o):exp jip (0)), (8.101)
where F 2( 9) = Ir q, t Cos ?z1 r, (0) + 11, Cos TIAF: (a)f' +
+ [h4 sin T,,F, (0) +-7-•;sin'?,,, (0))', (8.302)?= ()• actffi1, sin y,,,F, (9) + 7,, sin •,,F, (0).
Till Cos TI (7) +119 Cos TS,•, (0)
, 379
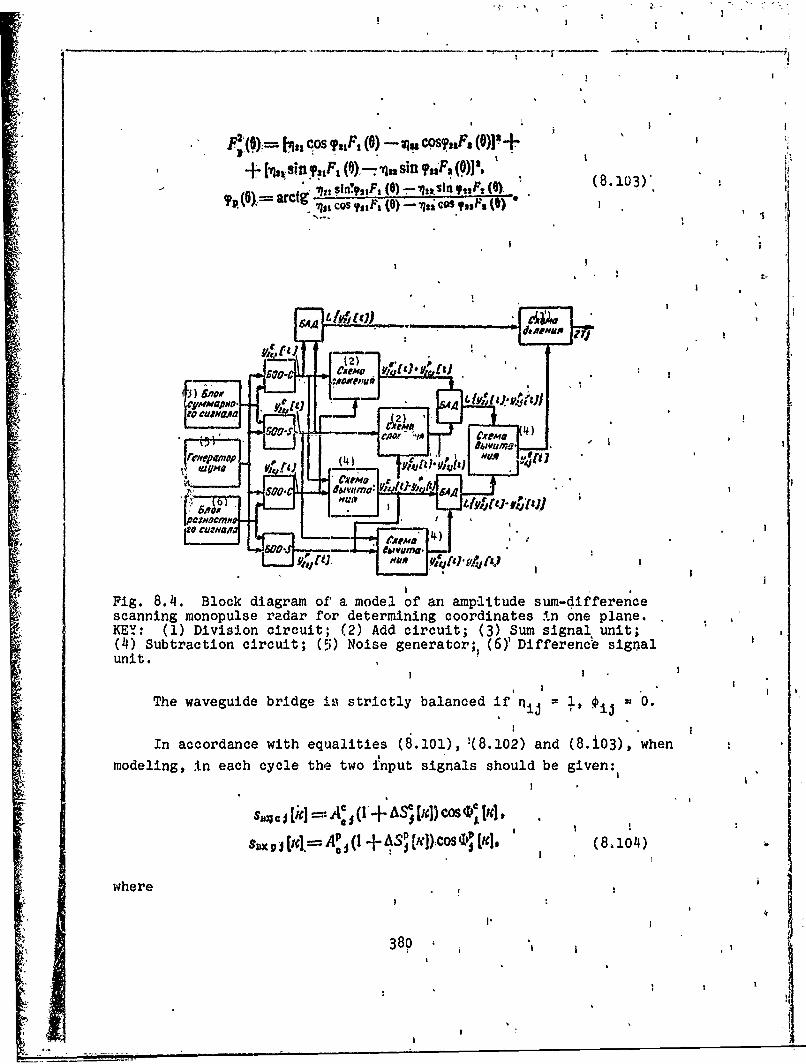
F~ 2(Oy.=1 22 qOG T21rP1 (6) -;I C'P'f'2F (0)] +r
- + ['tai~fli' 1 F1 0 2't(0)~ -! 121Sl T1 F. (01))' .8130 -arctg' Issjo ,4 COS ?$I 0)-~ c aF$ (t) '
CIL
N-I
30 5. : a* "! h, 5
unt
fe r~il !1
in a.ccorc witgrm hof e qua lofa.liti 1e and(80)wenc,
modeling, tono s each r cycl thetwo minpuingnl co houldte boe giv nen:
KEY (1 Diisoncicut; v (2)- Add circuit; (3)' Su sina unit
Inaccodanceithequal es(8),(8.102) (8.103)
moelng In eac cyl thw$n inlssol egvn
son c j A..." .4
where
N I
380o *
M
) l

I~~~C C C___________
+ I93R{O, A'a+ PC 2 '? S)• ,•+ (PC (0);(
JTjP jX ,,j/+?,h,*40"T j A l + •
J I
'•..
signals (8.104) mixed with noises give, at output of the linear
part of the model, processes y c[i] and yPt[i], represented by
two orthogonal components (8.94), each in accordance with algorithms
In order to evaluate target deviation from equisignal ,direction,
processes are Used, as indicated in Chapter 1, at phase detector
output and at sum channel output. To model the process at quadratic
phase detedtor output, it is necessary to calculate
yv, [/]--4-• L{yJ [il +- Y,W + } IKC
4 (8.105)
At linear detect.or output we must determine
yf [i=- L {yj [i -+ y, [} --
2--i- j-U, IiJ}' (8.106)
After this, ih au, cordance with formula (1.43), to determine
the target deViation angl, trom equifignal direction, the following
I rat'io is computed:
L C
S381

Or
I (8.107)
where L{Y•E]1 is the value of the sum signal envelope at output of .the amplitude detector unit.
Target deviation angle from equisignal direction e is determinedbasedl on the value obtained for T from the direction finding char-
acteristic
(8.108)
Methods of assigning various types of amplitude and phasedistortions for input signals and methods cf processing resultsare determined by the specific purpose of the study, as well as thepurpose and characteristics of the radar, and we shall not discuss
them here.
382
2-Ii

CHAPTER 9
AREAS OF APPLICATION ANID CERTAINCARACTERISTICSOF FOREIGN MONOPULSE RADARS
Monopulse systems, as indicated above, have high accuracy, noise
immunity, and rapid action. Because of these advantages they have
foundwide appllcation in guidance and control systems of rocket
weapons, ballistic and space target interception systems and satellite
tracking systems..
In this chapter we shall examine monopulse radars for these
systems, about which we have information from foreign and domestic
literature.
§ 9.1. RADARS FOR TRACKING BOTH BALLISTIC ANDSPACE TARGETS
The first monopulse radar used in the USA for tracking ballistic
rockets and artificial satellites is the AN/IhS-16 [73, 89]. The
antenna system of this set ccnisists of a parabolic refleector and a
four-horn feed (Fig. 9.1). Tracking is carried out in two planes.
In double waveguide bridges the sum and two difference signals
are processed, then amplified and multiplied in the phase detector.
The error signals obtained are used for bringing into motion the
antenna drive, i.e., the AN/FPS-16 is an amplitude sum-difference
monopulse target tracking radar.
The characteristics of many AN/FPS-16 radars presently in
operation have been considerably improved as a Lesult of a whole
383
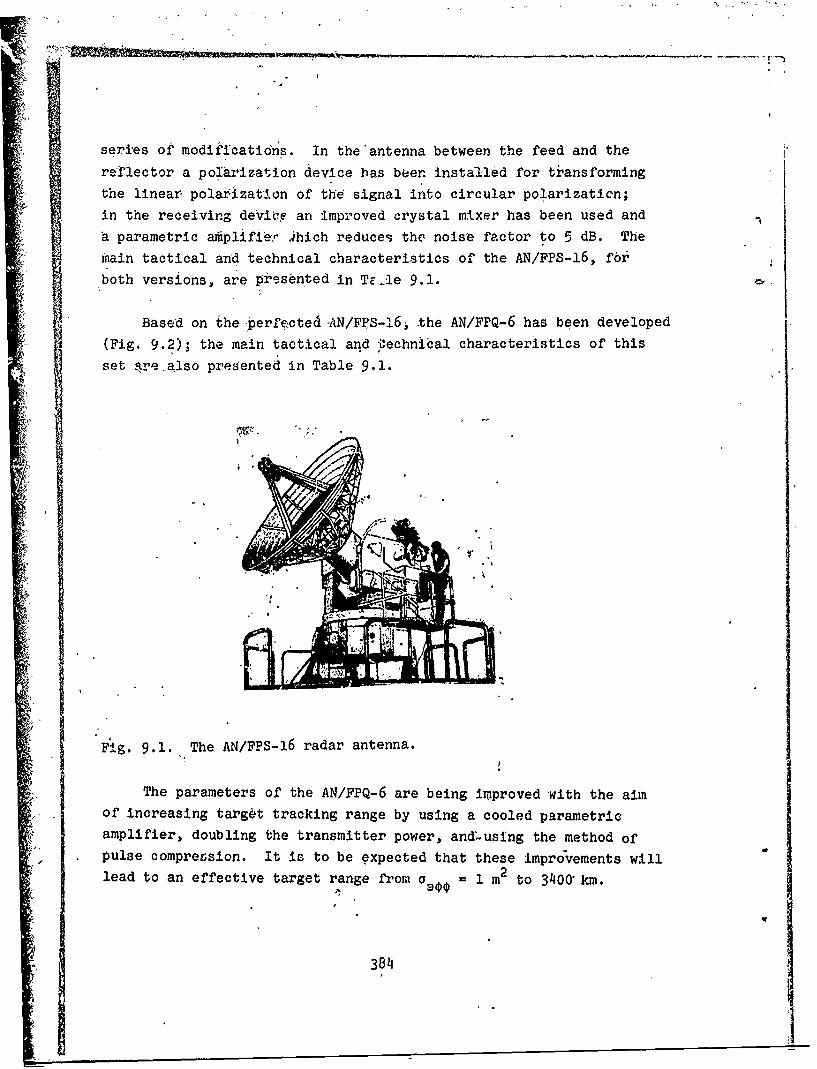
series of modifications. In the antenna between the feed and the
re'lector a polarization device has been installed for transforming
the linear polar3zation of the signal into circular polarization;
in the receiving device an improved crystal mixer has been used and
A parametric a•iplifi;r Ahich reduces the noise factor to 5 dB. The
main tactical and technical characteristics of the AN/FPS-16, for
both versions, are presented in Te-le 9.1.
Based on the perfected AN/FPS-16, the AN/FPQ-6 has been developed
(Fig. 9.2); the main tactical and iUechnical characteristics of thisset are also presented in Table 9.1.
Fig. 9.1. The AN/FPS-16 radar antenna.
The parameters of the AN/FPQ-6 are being iroproved with the aim
of increasing target tracking range by using a cooled parametric
amplifier, doubling the transmitter power, and.using the method of
pulse comprecsion. It is to be expected that these improvements will
lead to an effective target range from a = 1 m2 to 3400*km.
384
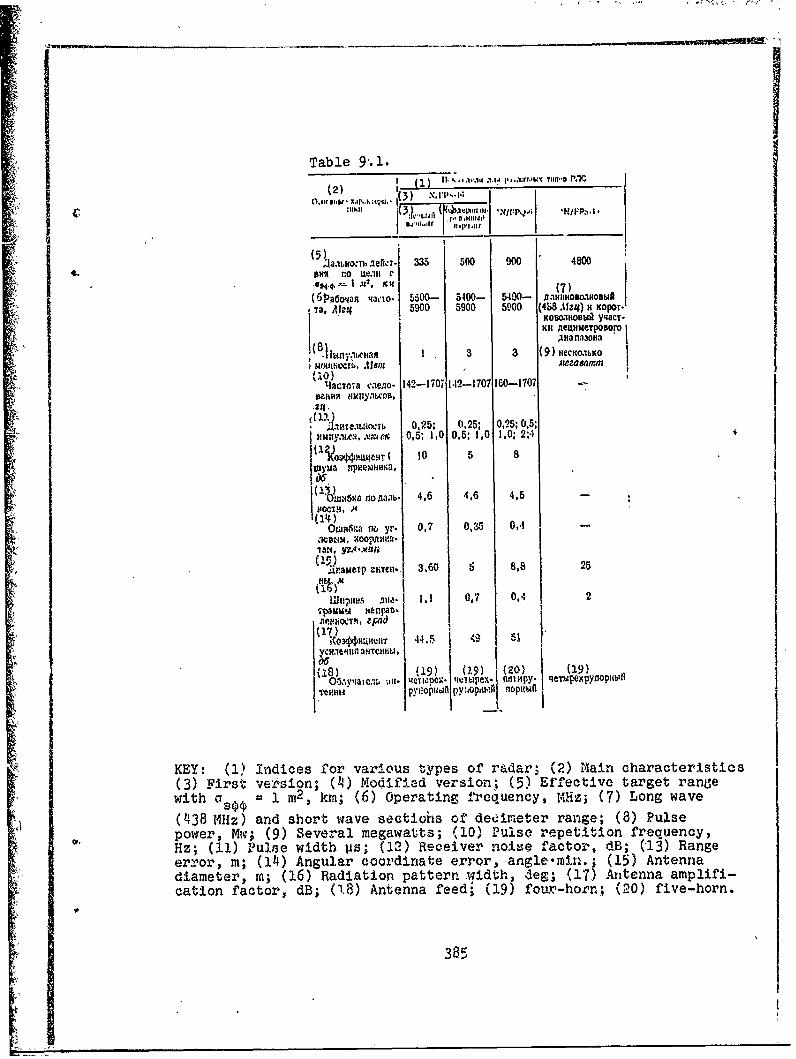
Table 9. 1.I |II I, ,.,,,'a .1.14 l,=a-IWIJWV T110-8a P.AC
(2) ( 1 ' .o., ,�,ic�s',ia X~r~ N XW. 1(3) 8., 11..;
335 500 900 4800
Ta, 'le 5900 5900 5900 (4S8 A1ztq) H KOPOT.
I ;. . KOB,,OBbIA Y•I "TII i(1. Aeziwl"rPaoBw I
uaraln130"a
i1 3 3 (9) Hecxoao
MaOLlHOCTb, i- Aooaooo Mow&l lf(10)
tifce-toa o.eiio. 142-1707 142-1707 160-1707
j(11'4.~re0o .025; 0,25; 0,25; 0.5;
(I YOV4HMleU ( ,1 0 8
-o, p,• =- i .. , B.I 7
(14)
Owxfta no yr- 0.7 0,35 0,-
KO3O1, OA'* y*fl
;nameTp £lintCi, 3,60 e 8,8 25
11hpinH lls An 1.1 017 0.4 2ýWpaM -A b anpao
3 )e44.5 4'o51
Vf leH IIS~Z~CIU
- 6.1yt atoa . nIll. 4C '1dO01 14-2 pe- - n0-1py0 -Th1Py 1i fj
VteI(H1 pyliopu.jfl py1'Opdb't%1 no
KEY: (1) Indices for various types of radar;, (2) Main character'istics(3) First verosion; (14) Modified version; (5) Effective target rangewith aO= 1 in2 ) kmi; (6)Operating frequency, Hz; (7) Long wave
(438 MHz) and short wave sectiuhs of deuimeter range; (8) Pulsepower, Mw; (9) Several megawatts; (10) Pulse repetition frequency,Hz; (11) P~ulse width pis; (12) Receiver noiee factor, dB; (13) Rangeerr'or, m;, (114) Angular coordinate er'ror, angle-inin.; (15) Antennadiameter, m; (16) Radiation pattern .width, deg; (17) Antenna amplifi-cation factor, dB; (18) Antenna feed, (19) fou.r-horcn; (20) five-horn.
385 85
k , 45-

1111 -JGRAPHIC NOT~L¾. ~ ~ 47REPRODUCIBLE'
Fig. 9.2. Overall view of AN/FPQ-6 radar.
The monopulse AN/FPS-49 radar in the early warning BMEWS system
is designed for detecting and tracking long-range and medium-rangerockets as well as artificial earth satellites. It is a pulse-doppler
radar operating on two frequencies in the long wave region of the
detonator range and in the short wave region of this same range.
In target search spiral scanning is used. The set detects targets
from a aoo = 1 M 2 at a range of 4800 km and after detecting them
changes to tracking mode, during which time it calculates speed,
direction of flight, and impact point if the carget is a rouket £36).
The antenna has a parabolic reflector 25 m in diameter (Fig. 9.3)
mounted on a dome 45 m in diameter. The frameless spherical dome
(Fig. 9.4) of honeycomb design has very small losses. It is made up
of 1646 hexagonal elements 15 cm thick. The overall weight of the
dome is Approximately 100 t. It can withstand windspeed up to 200
km/h. Antenna rotation is accomplished with a hydroelectric drive.
Space scan in azimuth is 3600 and in elevation is 900. The basictactical and technical data are presented in Table 9.1.
386
I.-
t
Fig. 9.3. The AN/FPS-49 radar antenna.
In the detection mode signals reflected from a target and received
by the AN/FPS-49, from receiver output are fed to a system of infor-
mation logging and preliminary processing. Information on range,
angular coordinates, and doppler rate is fed into a preliminarydata processing computer which, by correlation of signals, shifts
signals reflected from nonballistic targets and preliminarilydis-
tinguishes potentially dangerous targets with a ballistic trajectory.
Data on these targets are fed into an IBM 7090 computer which
performs the final solution concerning the presence of a target. In
this computer intercontinental ballistic missiles are separated from
artificial satellites based on the rate of azimuth and range variation
and also a comparison of dynamic characteristics of targets described
in the memory. The IBM 7050 can simultaneously compute the trajectoriesof several hundred targets and distinguish potentially dangerous
387
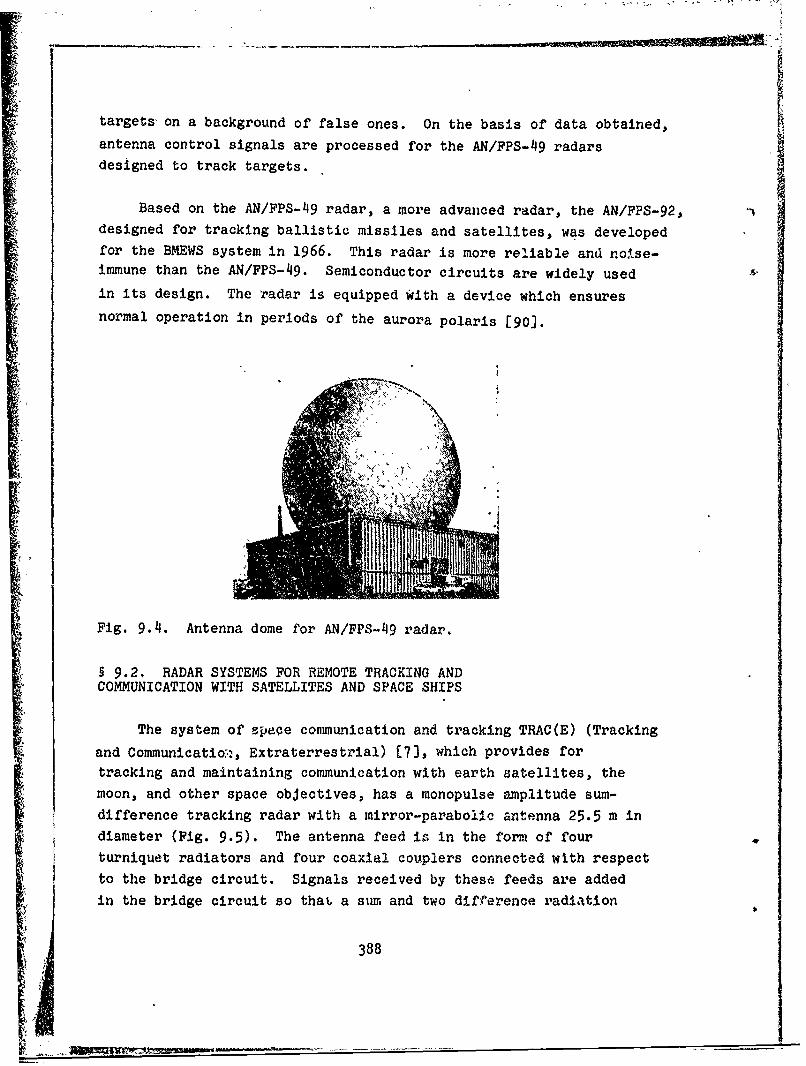
targets-on a background of false ones. On the basis of data obtained,antenna control signals are processed for the AN/FPS-49 radars
designed to track targets.
Based on the AN/FPS-49 radar, a more advanced radar, the AN/FPS-92,designed for tracking ballistic missiles and satellites, was developed
for the BMEWS system in 1966. This radar is more reliable and noise-immune than the AN/FPS-49. Semiconductor circuits are widely used
in its design. The radar is equipped With a device which ensures
normal operation in periods of the aurora polaris [90].
Fig. 9.4. Antenna dome for AN/FPS-49 radar.
§ 9.2. RADAR SYSTEMS FOR REMOTE TRACKING ANDCOMMUNICATION WITH SATELLITES AND SPACE SHIPS
The system of 9pepe communication and tracking TRAC(E) (Tracking
and Communications, Extraterrestrial) [7), which provides fortracking and maintaining communication with earth satellites, themoon, and other space objectives, has a monopulse amplitude sum-
difference tracking radar with a mirror-parabolic antenna 25.5 m in
diameter (Fig. 9.5). The antenna feed io in the form. of four
turniquet radiators and four coaxial couplers connected with respect
to the bridge circuit. Signals received by these feeds are added
in the bridge circuit so that a sum and two difference radiation
388

`7p-ttterns are obtalned. 'The width of the sum pattern at the half-power'level is on the order of 10. To detect moving targets the station is
provided-with spiral space scanning in a +30 sector with controllable
scanning rate.
r
Fig. 9.5. Overall view of receiving set for TRAC(E) system.
The TRAC(E) system is one-sided, enabling it to measure angular
coordinates, doppler frequency, and receive telemetric information.
The ground station of the system operates on signals from a transmitter
on board. The tracking range for the space rocket Pioneer IV, on
board which there is installed a responder with a power of 0.2 W
operating at a frequency of 960 Mhz, is 690000 km.
The monopulse method of determining angular coordinates is used
in ground stations of the detection and automatic tracking system
for the communications satellite Telstar [39]. The system accomplishes
multiple transmission of various coded information along 118 channels.
Transmission of a full cycle of information requires 1 min.
Telstar has the following characteristics:
apogee 5600 km
perigee 1100 km
orbital information 450
tangential velocity 560 km/mmn.
389

2 3 14V-
Fig. 9.6. Functional diagram of ground equipment. 1 - coarseguidance station; 2 - precise guidance station; 3 - computer; 4 -antenna of automatic tracking station; 5 - autotracking system; 6 -control panel.
Two beacons operating on frequencies of 136 MHz and 4080 MHz,as well asltelemetric and communications equipment, are installed on
the satellite. Signals communicated from earth to the satellite aretransmitted on a frequency of 6390 MHz and from the satellite to
earth on a frequency of 4170 MHz. Telemetric data from the satellite
is transmitted on 136 MHz; the satellite beacon signal will be
modulated at this frequency by telemetric data.
The ground post of the system consists of stations for coarseguidance, precise guidance, and automatic tracking (Fig. 9.6), which
operate on signals from the two satellite beacons [39).
Fig. 9.7. Antenna of coarseguidance station.
390

l- J I
Satellite detection and tracking is accomplished in the following
-, manner. According to data obtained -after launching the satellite,operators from the control panel of the ground post -direct the antenna
device of the command line (Fig., 9.7), used in the coarse guidance
station, to a point where the satellite is expected to appear. After
the reception of signals from the beacon on board the satellite at
a frequency :of 136 MHz, the coarse guidance system changes to automatic
tracking mode. After this, the operators send a series of commands
which bring into action the main systems of the satellite.
On the satellite the: beacon begins to operate on a frequency of
4080'MHz; its signals are received by the precise guidance station
and lock-on occurs. After lock-on by the pr-ecise guidance station,
ite automatic tracking begins and the antennas of the precise
guidance and automatic tracking stations operate synchronously.
The coarse guidance station is a phase sum-difference station.
In addition to a -rough determination of satellite position, this
station receives microwave telemetric signals from it and the antenna
system is also used for transmitting coded signals to the satellite.
The transmitter with a power of 200 W operates In continuous mode.
A block diagram of the statton is presented in Fig. 9.8.
(5)(2) K71 jno9?,
rapaoemo flU P
m.Qodkuxv CuU"Medb D00vuP CUZVOs(2) 0 AU xU no
Fig..9.9. Block diagram of precise guidance station.KEY: (1) Lock-on receiver; (2) Parametric amplifier; (3) Doublewaveguide T-Joints; (4) Tracking receiver; (5) Elevation error signal;(6) Antenna drive; (7) Azimuth error-signal.
391

0) 4.3 0W -C%
cd.AP4 r.> 4 r. 'l
24 O w4 ;t 4v)~s 0qn 7 (D*0i 0H 1-'0
Ot :5 , t : 0) W r--%
4. -^ -- - 4 . C"
bO -~ r. 4-)
W V) -I4- ) % 41H )
-H r- I O $
0H *.HP 4) r- (D
R 4.~0 0- 0
$4 -r- 4- 0~~0 0
43 4- 0) '0 4
.r4 -H %-I r4 C\J0
43 392 C
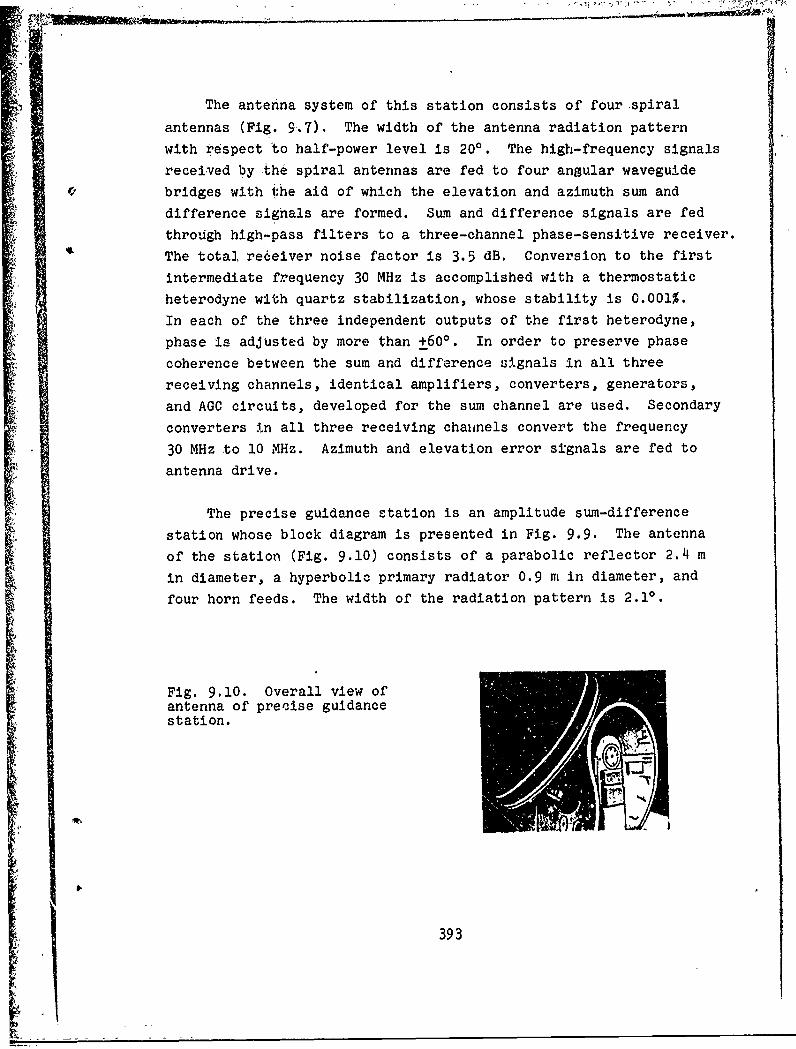
The antenna system of this station consists of four spiral
antennas (Fig. 9.7). The width of the antenna radiation pattern
with respect ,o half-power level is 200. The high-frequency signals
received by the spiral antennas are fed to four angular waveguide
bridges with the aid of which the elevation and azimuth sum and
difference signals are formed. Sum and difference signals are fed
through high-pass filters to a three-channel phase-sensitive receiver.
The total receiver noise factor is 3.5 dB. Conversion to the first
intermediate frequency 30 MHz is accomplished with a thermostatic
heterodyne with quartz stabilization, whose stability is 0.001%.
In each of the three independent outputs of the first heterodyne,
phase is adjusted by more than +600. In order to preserve phase
coherence between the sum and difference signals in all three
receiving channels, identical amplifiers, converters, generators,
and AGC circuits, developed for the sum channel are used. Secondary
converters !n all three receiving chaLnels convert the frequency
30 MHz to 10 MHz. Azimuth and elevation error signals are fed to
antenna drive.
The precise guidance station is an amplitude sum-difference
station whose block diagram is presented in Fig. 9.9. The antenna
of the station (Fig. 9.10) consists of a parabolic reflector 2.4 m
in diameter, a hyperbolic primary radiator 0.9 m in diameter, and
four horn feeds. The width of the radiation pattern is 2.10.
Fig. 9.10. Overall view ofantenna of precise guidancestation.
393
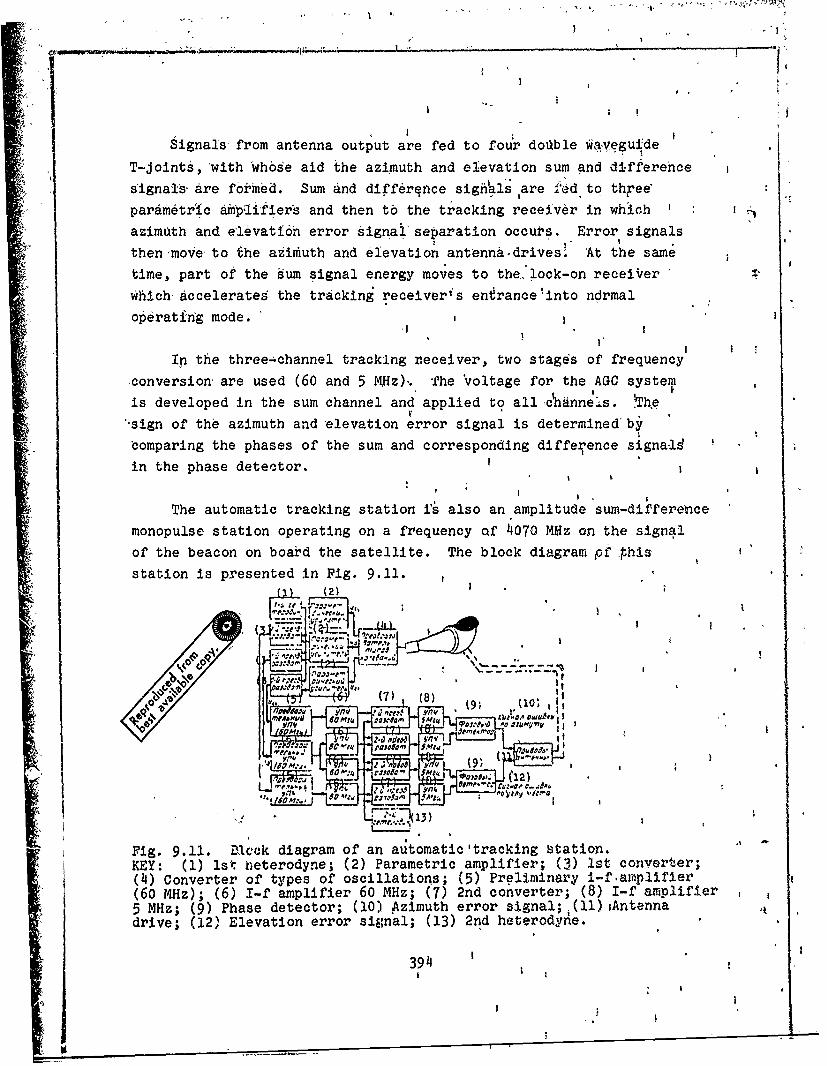
Signals from antenna output are fed to four doikble waiveguide
T-Joints, with 'whose aid the azimuth and elevation sum and differehces~ignals• are formed. Sum and diff~rqnce sighiIals a 'ed to thaee"
parametr'c amplifiers and then to the tracking receiver in which
azimuth and e'levati6h error signai separation occurs. Error signals
then 'move to the azimuth and elevation antenna-drives. At the same'
time, part of the sum signal energy moves to the.,lock-on receiVer
which accelerates the tracking receiveris enirancelinto ndrmal
"operating mode. i
In the three-channel tracking receiver, two stages of frequency
conversion are used (60 and 5 MJz),. The 'voltage for the AGC system
is developed in the sum channel and applied to all I hannels. 'Thle
.sign of the azimuth and elevation error signal is determined by
comparing the phases of the sum and corresponding difference signald
in the phase detector.
The automatic tracking station i's also an amplitude sum-difference
monopulse station operating on a frequency of 4070 MHz on the signal
of the beacon on board the satellite. The block diagram pf this
station is presented in Fig. 9.11.
Vc -e,. i!""(7) (8)
/ * e .-'% .& Z j .SOu M o
"Fig. 9.11. Dl3ck diagram of an automatic'tracking station.KEY: (1) lst heterodyne; (2) Parametric amplifier; (3) 1st converter;(4) Converter of types of oscillations; (5) Preliminary i-f ,awplifier(60 MHz); (6) I-f amplifier 60 MHz; (7) 2nd converter; (8) I-f amplifier
5 MHz; (9) Phase detector; (10) Azimuth error signal; (i1)iAntennadrive; (12) Elevation error signal; (13) 2nd heterodyne.
3914

* I
A horn-parabolic antenna, whose overall view is presented in
.Fig. 9.12, is used in the'station. The antenna consists of aparabolic
.refleqtor irradiated by a coni'al horn. The tip of the horn agrees
with the focus of thelparaboloid; the axis of the horn is perpendicular
to the ax.•s of the paraboloid. The antenna has the following basiccharacteristics: :
Saperture angle of conical horn - 31.50
focal distanpe - 18.2 m
aperture diametei 20.6 m
:aperture area 334 - mbeam width (at frequency 4080 MHz) - 0.240.
The antenna is covered by an inflated dome 65 m in diameter.
I i Two types of waves, H1 1 and E0 1, are propagated in the horn on
beacon frequency. For waves H1 1 there are both vertically polarized
and horizdntalty polarized .components (i.e., vertinally polarized and[ horizontally polarized waved of thig type are propagated). In [39]
it is shown that the radiation patterns of a circular aperture
excited by, H 1 andiE 0 1 waves are very similiar in form to the sum
and difference patterns of a monopulse system. The sum pattern is
formed by' the H1 wave and the difference by the E wave. The H1 1
and E0 1 wave'are separated in the station with a converter of
oscillation types'. Since the components of the H1 1 wave are geometri-
'sally ozithogonal, with the hid of two hybrid Junctions, they are
-separated into vertical and horizontal components.
Fig. 9.1p. Antenna of automatictracking station. 1 - upper equip-ment; 2 - bearihig of elevationrQta~tion device; 3 - wheel of.elevation device; 4 - parabolicmirror; 5 a azjmuth drime gear;6 - door; 7 - compressors ofdome inflation systpm.
019 t
•395I1 '

Then horizontal and vertical components are modulated and amplified
separately. Two of these sum signals u U along with the modu-
lated difference signal uA, form three automatic tracking signals
obtained from the component of the elliptically polarized incident
wave. These three signals ucx, Ucy and u. are amplified and converted
with respect to frequency in independent channels. Each channel
consists of a varactor parametric amplifier, a balance mixer, anda preliminary mixer on 60 MHz. Then these signals on intermediate
frequencies 60 MHz are fed/'o the 1-f amplifier in which the difference
signals are standardized.. Then a second conversion of intermediate
frequency occurs (to 5 MHz). The angular error in each plane is
separated by the phase detector to which the sum ,id difference
signals are fed. Error signals move to the elevation and azimuth
antenna drives, respectively.
The radar complex Haystack, developed in the USA, is a monopulse
radar'of very high power, designed both for tracking space vehicles
and for operating in the fields of communication aýnd radio astronomy,
including obtaining information on such distant planets as Mars,
Mercury, and Jupiter [36).
The antenna of the station (Fig. 9.13) consists of a parabolic
reflector 37 m in diameter with a primary radiator 2.85 m in diameter
and horn reeds. The reflector consists of separate aluminum panels
of honeycomb design. The antenna amplification factor is 69 dB
and radiation pattern width is approximately 3 angular minutes. The
antenna is protected from winter winds and frost by a spherical
dome 45 m in diameter made from glass fibre 0.76 mm thick reinforced
with aluminum.
In order to ensure antenna orientation accuracy no less than
+0.3 angular minutes with a radiation pattern width on the order of
3 angular minutes, the use of a special hydrostatic bearing weighing
approximately 24 t is necessary. The antenna position is controlled
by a UNIVAC-490 computer.
396

The transmitter operates in contihixtic' radiation modo or. by
pulses of long duration and has an average 6utput. :power of 00b k14'
and working frequency of 7750 MHz.
* Weak signals are received with the aid of several praagnetic Iamplifiers (masers) and parametric amplifiers which can bt cooledto the temperature of liquid helium.
Fig. 9.13. Haystack an1:enna complex.KEY: (1) Detachable box.
§ 9.3. RADARS OF THE ANTIMISSILE DEFENSE SYSTEM
At the presqnt time the USA has developed and is using in their,
antimissile defense system the Nike-X, designed for the defense oft •large cities, industrial centers and concealed rocket bases where
the Atlas, Titan*, and Minuteman rockets are located.
397

t
The basic, elements of the Nike-X system are the MAR,, TASMAR,
PAR,'MSR radars, the Spartan and Sprint antimissiles, a computer
for processing data obtained during target tracking and used forguiding the antimissile missile 136, 69, 79.]., These elements- are
assumed to be in the antimissile defense system Nike-X, designed
for protecting the territory of the USA from massive rocket and
nuclear 'attack. This system will be deployed in the second stage
of the antimissileýdefense system 3reation. In the first stage the
Department of Defense made the' decision to deploy the "limited"
safeguard system with the introduction period in 1972-1973.
I2 (()
*14
Fig. 9 .111. Elements of the "limited" ABM system, the Safeguard.KEY: (1) Decoy; (2) Spartan; (3) Warhead; (4) Sprint; (5) Communicationslink; (6) Computer complex; (7) Atmosphere.
The Safeguard ABM system will have the PAR and MSR radars, acomputer complex consisting of several computers, 15-20 launch posi-
tions for the Spartan antimissile missile (to intercept warheads beyond
the dense layers of atmosphere) and for the Sprint (to intercept
warheads at low altitudes), and a communications line (Fig. 9.14).
398
4. .. .
The MAR multioperationfal radar, in the case of a massive enemy
missile attack using advanced means of ABM 6ystem penetration, solves
the following problems: performs search and detection of targets
at a range of approximately 3000 km, target tracking and identification
of warheads from decoys, and guidance of antimissile missiles. The
MAR radar has to serve several launch positions for the antimissile
missiles And is located 25 km from them.
The MAR equipment is mounted in an underground reinforced concrete
sit.e With a useful area of 6006 m2 and under three protective domes
(Fig. 9.15). Under the large dome is the receiving equipment and
under the two smaller ones the transmitting equipment. In the walls
of the large and one of the two small domes are "1windows" in which
antennas made in the form of phased arrays are mounted.
6RAPHIO NOT REPRODUCIBLE
Fig. 9.15. Overall view of MAR station. 1 - large dome; 2 - small
domes.
The TASMAR radar, which is a somewhat simplified version of the
MAR, solves the above listed prob~lem during a less than massive
missile attack using less advanced means of ABM system penetration.
The radar is located in one building 30 m high and occup±es one area
of 75 x 75 m.
The PAR radar serves for very remote target detection and alsofor guiding the Spartan antimissile missile, designed to intercept
399
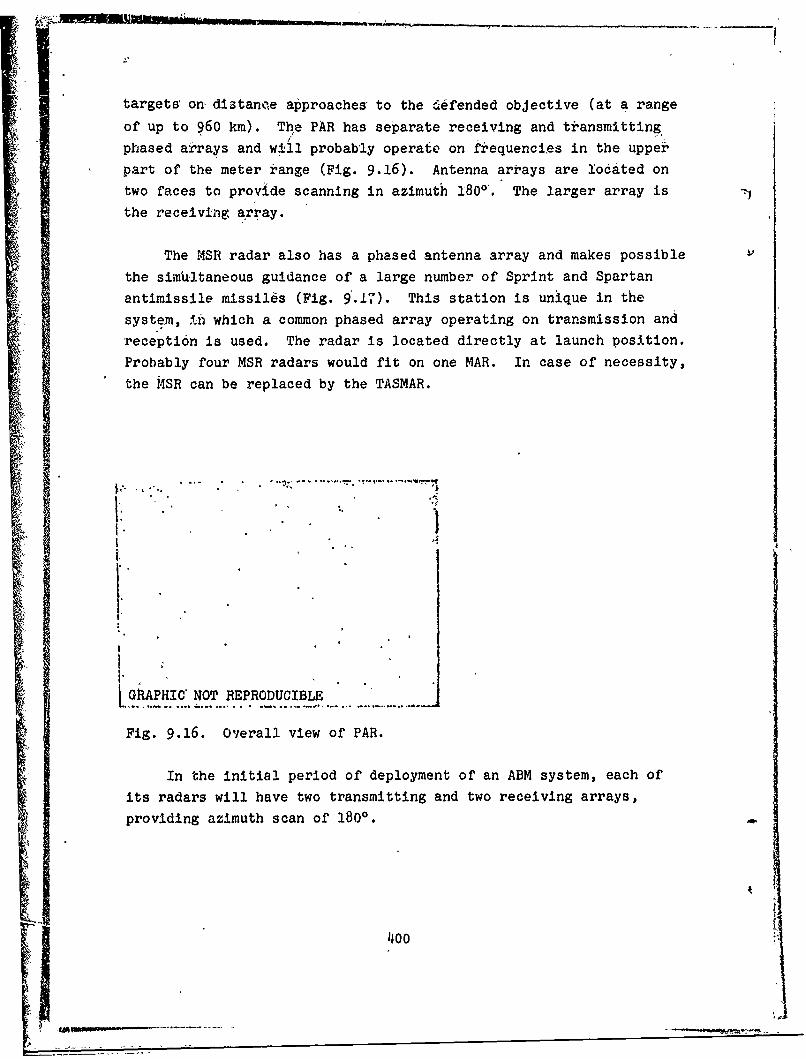
targets' on distance approaches to the defended objective (at a range
of up to 960 km). The PAR has separate receiving and ti'ansmitting/
phased arrays and will probably operate on frequencies in the upper"
part of the meter range (Fig. 9.16). Antenna arrays are located ontwo faces to provide scanning in azimuth 1800'. The larger array is
the receiving array.
The MSR radar also has a phased antenna array and makes possible
the simrltaneous guidance of a large number of Sprint and Spartan
antimissile missiles (Fig. 9.17). This station is unique in the
system, in which a common phased array operating on transmission andreception is used. The radar is located directly at launch position.
Probably four MSR radars would fit on one MAR. In case of necessity,
the MSR can be replaced by the TASMAR.
.. ]
1'
[GRAPHIC-NOT REPRODUCIBLE
Fig. 9.16. Oyerall view of PAR.
In the initial period of deployment of an ABM system, each of
its radars will have two transmitting and two receiving arrays,providing azimuth scan of 1800.
400
- -u-
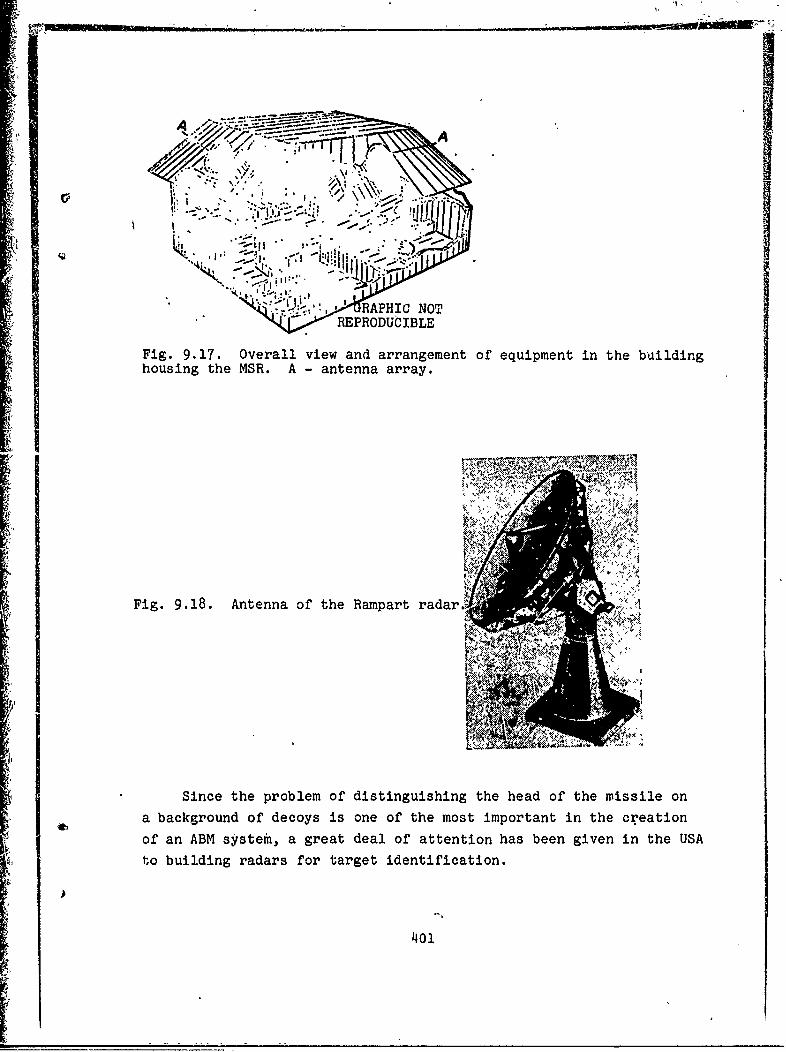
A
A"" V' , . , .1 .
RAPHIC NOTREPRODUCIBLE
Fig. 9.17. Overall view and arrangement of equipment in the buildinghousing the MSR. A - antenna array.
~i'i
10"' I
Fig. 9.18. Antenna of the Rampart radar.
Since the problem of distinguishing the head of the missile on
a background of decoys is one of the most important in the cr'eation
of an ABM system, a great deal of attention has been given in the USA
to building radars for target identification.
401
A

Thus, the Rampart monopulse radar has two transmitters with a
total power of 24 MW which operate on one antenna 18 in in diameter
(Fig. 9.18). Radiation is on a frequency of 3032 MHz. The antenna
has an amplification of 52 dB [36]..
The emitted pulse consists of ten separate pulses, eaih 1 us
in duration, spaced 1 MHz in frequency. The front of ear;h pulse
coincides with the drop of the preceding pulse so that ';he signal
emitted appears as one pulse 10 us in duration. Signals reflected
from a targ.t and received by the radar receiver are fed from its
output to v-:,ual indicators and are recorded on tape or paper tape,
and, in digital form, on magnetic tape.
A more modern experimental radar for identification than the
Rampart is the.Tradex, designed for studying complex targets and
identifying warheads at ranges to 3200 km [36].
The overall view of the antenna for this radar is presented in
Fig. 9.19. A two-frequency method of operation is used, with which
two transmitters operate simultaneously. The first transmitter with
a pulse power of 4 MW operates on a frequency of 425 MHz. The
second transmitter operates on 1320 MHz and has a pulse power of
1.25 MW. Pulse repetition frequency is 1500 Hz.
Fig. 9.19. Antennaof Tradex radar.
402
Search and detection of target are carried out at 1320'MHz.
At this frequency pulses broaden during radiation and contract during
reception. With a pulse expansion factor of 50, a 50-fold increase
in the energy of the emitted pulse is achieved with the same pulse
power of the transmitter. After reception the pulse is compressed
by a factor of 50.
Target tracking is accomplished by the monopulse method at
425 MHz. Data obtained during target tracking are stored and converted
to digital and analog form for use by computers and operators.
To analyze a complex target containing a large number of separate
parts, data on all elements of the complex target are stored in the
i-f channel. Upon target lock-on 30 successive range strobe pulses
are generated; the signals in each strobe are stored from pulse to
pulse on a magnetic disk in accordance with the sequential position
of each strobe. Information is given in the form of a continuous
sequence of signals corresponding to the doppler frequencies of the
targets in each strobe. The simultaneous use of frequency and time
methods of analysis, i.e., range strobing and narrow-band filtration
in the i-f channel provides high resolution.
Because of this high resolution, the wide-band range tracking,
and the narrow-band tracking based on doppler frequency, data on
dimensions, target shape, forward speed, rotational velocity, and
acceleration can be obtained from the statements of the developers.
S 9.4. RADARS FOR GUIDING ANTIAIRCRAFT ROCKETS
Monopulse radars are widely used in American and British systems
for guiding ground-to-air rockets (Nike-Ajax, Nike-Hercules, Bloodhound)
and in ship systems for controlling the fire of antiaircraft rocKets
(Tartor, Talos, Terrier).
The Nike-Ajax system includes a circular scan section, a target
tracking section, and an antiaircraft rocket j.aidance section (ZrR),
403

the last two of Which are monopulse stations MPA-4 [98]. These setsoperate on 9100, MHz (X - 3.3 cm)) and have lens antennas 1.9 m indiameter And a beam width of 1.20. The external view of the antennais presented in FSg. 9.20. Pulse power of the transmitter is 200 kW.Pulse width is 0.25 1is and repetition frequency is 2000 Hz.
•" 'l!i '._e- K
A,,t I ~~i f
•.- -_-- -. *; ....*. • ,,: .- t ',# .*_7T* .L. '1''aU .IQ2__ REPRODUB hRAPHIC NOT REPRODUCIBL
Fig, 9.20. Antenna for Nike-Ajax Fig. 9.21. Antenna for Nike-tracking system. Hercules guidance system.
The Nike-Hercules [91, 114] has a target detection radar anda monopulýse ZUR guidance station. A spherical antenna system with adouble lens (#ig. 9.21), enclosed in a dome of silicone resin isused in the guidance station.
In the modified ZUR guidance radar the transmitter power hasbeen increased and the antenna dimensions almost doubled (i.e., itsaperture is 8 m). Phe modified Nike-Hercules sy,,tem is capable ofacting not only against aircraft but also against rockets; rockets aredetected at a range of 300-1000 km.
In the English Bloodhound system a two-channel radar stationis used for illuminating and guiding ZUR (Rig. 9.22) while accomplishing,at the same time, target tracking and rocket guidance. In this
S404
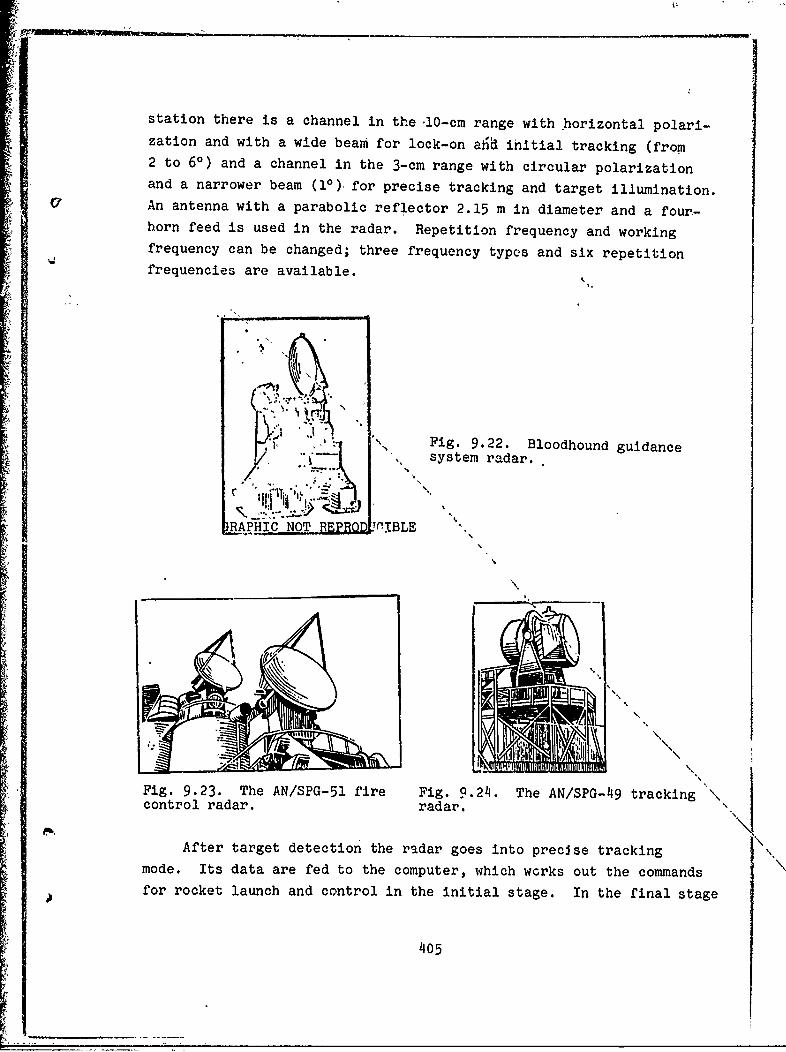
station there is a channel in the -10-cm range with horizontal polari-zation and with a wide beam for lock-on aga initial tracking (from2 to 60) and a channel in the 3-cm range with circular polarizationand a narrower beam (10), for precise tracking and target illumination.
V An antenna with a parabolic reflector 2.15 m in diameter and a four-
horn feed is used in the radar. Repetition frequency and workingfrequency can be changed; three frequency types and six repetition
frequencies are available.
rr.
Fig. 9.22. Bloodhound guidancesytmradar..
•RAPHIC NOT- RERO eBLE "
%L
.I
Fig. 9.23. The AN/SPG-51 fire Fig. 9.24. The AN/SPG-49 tracking\control radar_ radar.
After target detection the radar goes into precise trackingmode. Its data are fed to the computer, which works out the commandsfor rocket launch and control in the initial stage. In the final stage
405

of flight the rocket is brought to .a semiactive self-guidance
mode on signals reflected from the target.
Monopulse radars with lens antennas have found wide application
in ship systems for controlling the firing of antiaircraft rockets.
In the Tartor system the AN/SPG-51 monopulse radar is used to
control firing (Fig. 9.23), which ensures automatic lock-on andtarget tracking [92]. Several seconds before launch the intensifying
beam is turned on and the rocket is guided by signals reflected from
the target. For tracking and intensification, one parabolic reflector
antenna 2.4 m in diameter is used.
In the Talbs system, to detect the targets and guide the ZUR,
the monopulse AN/SPG-49 (Fig. 9.24) is used [70, 115). In-1958 anew AN/SPG-56 was developed for this system. Lens antennas are Qsedin the stations, forming simultaneously both the'lock-on and target
tracking beam and the tracking beam used during the flight of the
ZUR; therefore, they can simultaneously guide to a target two or more
ZUR.
In the AN/SPG-49 a magnetron with a power of 4 MW is used, and
in the AN/SPG-56 a klystron with an average power of several kilowatts.
In the Terrier system [99] for guiding antiairci;aft rockets
an AN/SPG-5 ,(Fig. 9.25) is used and since 1957 an AN/SPG-55 wita
lens antennas. Powerful klystrons with an average power of several
kilowatts are used in the transmitters. These radars have long range,
altitude, high accuracy, and stability in guiding rockets launched
in groups or singly.
9.5. A RADAR FOR DETECTPING GROUND TARGETS ON
THE LOCAL BACKGROUND
In 1958 the USA developed a phase sum-difference experimental
monopulse radar for detecting and determining the distance to ground
targets on a background of interfering reflections from vegetation
406
\I

[59]. The block diagram of this station is illustrated in Fig. 9.26
dnd Jts basic characteristics are presented in Table 9.2.
Fig. 9.25. The AN/SPQ-5 anti-aircraft rocket guidance radqr.
Table 9.2.
Basic characteristics Indices
Working frequency 35000 MHzPulse power 35 kWPulse width 0.06 psRepetition rate 4000 pulse/sIntermediate frequency 60 MHzI-f amplifier bandwidth 20 MHzReceiver noise factor ineach channel 18 dBDiameter of each parabolicantenna reflector 61 cmAntenna amplification 44 dBRadiation pattern width
in azimuth 30in elevation 10
The antenna system is a double parabolic reflector with two
horn feeds whose centers are spaced 61.4 cm in the horizontal plane
for signal phase comparison.
Signals reflected from the target move from the antenna system
output to the double waveguide T-Joints in which summation and
subtraction of high-frequency signals is performed; then, the converted
signals are fed to the two-channel receiver at whose output sum
407

and difference Video signals are obtained. The electroni.c switch at
receiver output 6nsures the simultaneous'•ndication of sum and
difference video signals on the indicator.
(1) (2) (3) 71•
Et-(7) m-isA' Nm, '~ p •u I
Fig. 9.26. Block diagrata of 'a groun4 target detection radar.KEY: (1) Send-receive switch; (2) Mixer; (3) Sum channel receivef.:'(4) Magnetroin; (5) Modulator; (6) Synchronizer; (7) Electionic switch;(8) Video signals of sum and difference channels; (9) Heterodyne;(10) ASC; (11) Difference channel receiver; (12) Two indicator sweepsynchronization.
Id
Fig., 9.27. Antenna of ground Fig. 9.28. Oscillqgrams of£video
target detection radar. signals at radar output. a) with
•conical scanning; b) suý channelin monopulse radar; c) difference)
channel. i
Figure 9.28 illustrates data on:the simultaneous variation of *
video signals in sum (b) and difference (c),channels during reflection . I
from a truck on a background of thick bushes andwoods. ýhe observa-
tion results were compared with data obtained with:a T-47 radar with
conical scanning, located beside the mIonopdlse radar. The video pulses'
at receiver output for the radar with conical scanning are shown
408 '

in Fig. 9,.28a. The distance between the truck and the radars was7!50 m...
I. As seen from Fig. 9.28a thp detection of a truck on a backgroundo f bt~shes w~ith a radar having, conical beam scanning Is practicallyimpos -sibleldue t~o the;very high level 'of interfering refle'ctions..A monopulse station correctl~y detects such a target based on the.
U -ýnaximum value of the sum sig nal (d) and.the absence of a difference*si~gnal.',The signal C(e) fpllowing the signal from the truck is causedby reflection ifrom tfie side of-the ro'ad behind the truck.
Bibliography
2. A p e it e p r A. r'., PEC1nPOCTpalene Ae LelHmeTpoabux It calITHIeMP.OBUX sioAi. H3A-Do tCoserCKoe paAHo*., 1957.
3. Ia~y X T1. A., BO0AJ IIbwa X 0B H. A. H 'AP. BonpoCul CraTHCnTH'iCkoft TeOPHHI pazuionIoxaitiw. T. 1,: 2. 113A-00 4CCOBO*TCKOe PaAHo291 9 6 4 .
m i e , c a l i . T O4.B a p TO0 H AL. K., Pa;JHjOAO(aWItOHHbie CHCTeM.fe Car lO. pA. K. H. TpoýH~tona. BoeHH3AaT, 1967. aHXA5.' Bip K 0 e p , M. YrIoDUe 0111161MH paAIIO-1oxa2IUOIIluX alHA
acTo~taTHqe1CxH COnPOBao(AAtOuwkX uIXC.b kBonpocu- paAHoaloKa~tHoH*
6. B.p e it A a Hi A1 E. To'uocM H13mepeII1I yrMoBbix IOOPAHHaT PaAHO.qlOKaTopdm C 8HTeHHOJ1 B 11HJIe cjM3pODaiHHoR peweTKH, q3apy6e)K-ita. .111pAHo3JneKTpdIwKa*, 1962, X2 1. tOTPABP'o malaM. X., ByxI3HaH X. P., IyP.A HMSA H HI r .TI. P. Clucre~a TRAC (E) AuIR CB113H H coflpoON()AeHHR;:q)cmHt4ecKH% o6-neKTOB. 43apy6ewiiasi paMXoqj~eKTpOHHKa*, 1960,
8. 9 uwveIhti'1 MIR'H it CetteH!Afes K. A. CnpanýOIIHHK 110 Ma'TC riKe. rocTeXH3AaT, M93. :
9. Byc.ieH;Ko H. ri. 1 U~PeAAep 10. A. Me.TOA CraTHcTHqecxiix!,CnUraun1A (MOHre.KapnIo) H ero peaAHI381W1R Ha BbltHCJIHTe~bHb[XN:wiia)111X. 4si3marrH3p 1961.j'
10. Bax~ii C. A., IHYCTOB 31. H. OC1IO1013i PaAHonpoTHDOAeft(TBHNHi 1PaAI1oTeXHw'ecxcaft pa3BeCKH. 113A-80 fCone'rcxoe paAHOSI, 1968
11. BaCH.II B. B.,' B~naqoB 0. B., 'JAYAHHIC 11. H., Crena'tion 5). MA AnnawboHuas11 PaAHoAzo1aI~um. 143A-130 BBH :A KM.- npo4.H. E. ;4yxoncxoro, 1964.Kts
12. B Ga Ion B. M. Jlorapl!4MltHecK~e YcnIAHreAH. 1'orTeXH3AaT, ~B19652.
13 P n -4 u H n A. H., AIt 0i 0 H '1 B. A. 11pOTHJ3OP8AHojIoI~atWS1. BoeH*
14. B o jr I'iH JI. 1J., 3AemeiIThl Te0PHH yflPpBARIOioaHx 1JaUHH. 143A~ýConje1~cxoe p;;.ifb7,, 1962.
15. Bynpi Y PAt. IN. 11 Jl ayo Y J~ C 0 Teope'rniUCcas Tdqutocm no.Ay'IeHjnn~IfI):*WVOAb1IOA. AMarjpatfilb H3AqyqHHR HCTO'1HHIga KOHe'lHBlX
409
16. r Ifx s6y p r'B. B. Bex oifa H. 1H. Pac'aer napa6oan'iecx~ifx am-rczrn. H3A-BO- i~ose1fcioe, paono; 1959.
A. 1-7., rp aA tII e ft i H. C., Phg-ý{ iiic"H. M. Ta6drnuu HIITcrpaJIOB,A."M,UPR!AOB H UP 0113B ernlikt (!)HMaTrls3, 1963.18. Jenaq ,zB E., KOPOCTeaen A. A. X, AP. Teopem'emceO011O11H P8A~iOAOK8IWH. I43A-BO CCOI~eTCKoOePaAwoi, 1964.
-19.'A2 a it if, A 03It ,p A, K ifi n r. ~Miunie, 4),.IyKTyauIlft mo0wcifria.a Ila'paOoTy Pa~Il0ji0K1'.~)iIIIt~X' zýcrainunii C6fp06.i~c.uWIs ucal. Oamio-Te~ile)(a H,9iwrpoauni~ 3in y 15A 6.
20.. lt&i iu, X0o saPA p S.-mq'ie aitimoiaTItltOA j)CryjIIfpoBKug yýciie-awn Ila TzOqIICCm conpoDoxminetlil: Le.'icri moowincify.hcIIusmI -paiviicsjioxawuoill;:'milI cieww'11. 9PAXiIOTOXlaaKa. It 3AUPOHiISK 3a pY-
* 6exKon, 199 2~5.21.-AJenanauo-P. TgopHH ieptaNnzus.i: itestI yrmow.e OIIJI6KsI 1i'pt; pa-
AHOJIOKBWIXH6]11OM C0IHp0DOKAelfillf. KBonpocu paxio.ioxaunonnoft10'V ?0~~~TXHIIIXHX. 1954,MI 10. B. loKrnoa. uriio4
Jlepltibix'YCTP.*'rpQ.:cr1. 3Ic!!'--no'IsCPrlw, 1966. 1-.23. K'-iay A CP H-. P. iH np. Tcapimn It pac'Ier IMf1YJlbCHbIX Pa.LtoflROXa*
Lt!1011I1bIX CT1ai141111 C tulICrOTIMAl mio.y.insseh. t3apydemuasa pa.Ano-WaInHpoin:Ka113. 1961, A 1.
24. K opý At., SP aII IIA-111s C. M., AJo y A. F. Otionpe~memoe11351epl~ll~e yrjiou~ux RoopAsIlIar mitorox uteieft c flUMOU~bIO NIonIo*IflURYAUbIOi PAIC COrlpOOO)KAJLQIIH9. t3spy6citssa paAH0oJnCXTpoIsW*
* Kas, 1963. Xt 8.25. K p a o H. H. 9JCT~ext npotteccu a HemmAnul~Ihx fienox
p aAHorpipIeMIMII'oD. Cuf13hl3AaT, 1949.26. KA i Hia if it x if f B. X. ADOarolsrts'ccxae CHCTC.Mb Pa)W~OTCXjIIII'eCKIIX
27ycrpoilcro. rocque roH3AaT, 1962.27. HK npaca T p It X P. PA. C1ba3OBMAR jiCreiKaP c pacwHpeiIIICM yrito.
8* 7 Aor fiarla3Oiia. 11Oremn' CWlA Me 2751555 omAait 19.6.95C 3IpII0pUTeTOIS OT 3.10.1951.
28& K aH-,' p e A I;, HA. S3., n a 13 A 0D H. 0., Hrl0Te x itH B3. A. no-.nopit3biits pal1c1lo4aIOlll110blX ctrnajnua. H'JA-o vCaBeTcx~oe pa-AlOw,',. 1968 8
29. K a p Rn tTbei AtO . Coopemelnnan Teo ii paAHo~ioxaUIti. flop.aliI. 143A-1o tCOBeTCHoe paIuO), 1965
30. HT, Xojiaxa i, 21sxc, CxmUcou, Jlam6epT, X3r'ier..vYLOOAbi R Texiti~a PaAB~lopop~ipmfilcutoht it 6opsh6b c 11111. (
p6exllas Pa1uso71e)(TPOlIMKIa:, 1960, N2 1L31. WKyi. H1oisuWCHHO B3II-IRTUBH1OCTI1 paA1lO.'lolaitlIJ0lIiblX YCTP0ACCt
3a c'1CT cx{aTiti1 H(Wnyjlha. 93OPY6CN(HIIII PaAltoWICI{polna3'. 1910,N11 9.
32. P11 y c0wKOW IH H 17 . Pa.4isoaoxa2wlounbe ycHJIHTeJIH c 6OJbwHm.AIIIIUB3OHOM BXOAIINX CHFiIIIJIO. H3A-UO tCoiieTmoe paAIIo*, 1964.
33. A oK ic A. C. Yopamaenme CHOPHAamit. VIcp. c r'1fri. rocT0,1H3AaT,.1957.
34. A C~i B tH1. P. Teopnta 'cjly'aWllbx flpQ1ecc0B Hf eC 11pHUCIwlelHB P&AifOreXiIuII(e. 143A-Do CConeTC~oe P3IA103, 1960.
35. A1 e3a itit 10. C. OUTMia~lbmme Clfl~bTpbl If II8KOIIKTCAII H?4nyJlbCbcIIXcuisra~noa. 143A-u0 CCOCqoaec e pD2U1O, 196.
36. A1 eO~ 03t A. 1H. PaAlboaoxazussl I; npovitiopaicem0o o6opoaie. BoelH-H3AaT, 1967.
37. 0OC T P013H TIO 10B P. B. K sonpocy o6 ymon0B0M UyiJ. CPaAHO..& 'rTex~iixa its 3felTpowtiK8v. 1966, Xt 4...
3X je? e pc; B e im 4ep. PasuioJ1oKaztHouIHOe COnpoao)K~eHue chiom kilflux itee~le c3apydescuan paAjH09.1ClfTpOI1Ka*, 1964, Xft 7.
39. 110K pa c A. M. AnreIIIuAC yC&poflCTIa 38py~e)KIINlX JlilHHft C89311tqepe3 tickyurugietmol r~tyTlII1K1t JeMjhfl HSA-1P 4CI34PI~ 1%5-
4110

40,. Py 3e ILBaHRHnte owit6ojc pacxpmea no Jxiarpammru iiaflpaBAOU.IIOCmH anrTcirn. <Bonpocu:- PafHo.ioKaftH0IIIu)A remfxiii, 1956,, W Z.
41. P '0 A C A; P. BieAeinge B, motownyabenY~byio psaiinoxa0awgo. MlO.6 anrim. H3;X-BO iCoaerc~oe paamo, 3960.
42. P y 6 H_ it', K a mI c~ u. 11oau14 %teTot nocmpoemist cxewr Cpa 81109HRS 31011O1B~ly.lbCII1iI paAH0o11aox~ujw. t3apy6cmiasq paa~Ho~aompohu-xao, 1965, e 8.
43. Cop r iice CK)IIfi B. Ai. Onpe~ca'eime yrjiouLIx KOOpAHHaT COBO-.KyflIIOCTH 113,7Y4laezek. ;PaAIIorexn;,Ka~o, 1967, J% 4.
Q 44. C X 0.7111 H K M4: BBCLCenIIC B TCiIHky paAtfofioxaRHoalIIux cuCTem.flop. c aitra. no~t peA. K. H. -Tpo~ntltooa. 113A-iSO KMitp, 19SM.
45; C B It p H4 A 0 1; S. 0'. CpaiaIIHmeibiI an 3(94eXTHDlI~OCb N*OHOIH.%flYJTLC-HLIX paAfl0o10o(MUa0tolIIbX CHCTCM nCJICuraWiu. H3;L-BO (CyAoCTpOe-miILN, 1%4.
46. C e p r H e B c K it ft B. AJ. MeTOALI H CPeACTha n9OTHIIoAeA 'cTaHI.npomiIaopaxemniO o6opoiie. c3apy6emi~as pa tfO3l.1eKTpoHHKa*, 1966
47. Ci Be p c A. 11. Paxaloaoicawtonnwe npjiehHHKHf. Pacqe-r H ajpoex-Upoaim.13A. 3. H 16 CouercKoe p.to,1959.
48. C ono Bbel s H. H.' Ompa)tca)iouwe caofi~c-i a 3emnu~x floKpOBaB.eTpy~bi P~imcioro ulInCmTIIYma immneiepoa rB4)), 1963, aian. 27.
419. C Nt HtT. l~tipoxonoacicuna alITmdnna Kpyroaoii HOJUIlPH3aBUHH AHafa-30Ha ZC AJIJII OARiOHMtflflb~oro noiaaropa. B cd. riOpeB0AostAiTemmIL 3.1.11HflTH'feCKOA 11OJ)~HP13aU.H1 -H3Ax-B0 HHocTpaHHoA Jill-Tcpamypbl, 1961.
50. T a p T a K 0 a C X H A r. rl. .Lmia~iNa~Ha cHcText aBITOM8aTilliCX pe-,ry~inipOOKIf roc3iIeprOH3xAaT, 1957.
51. T po Hp ifMOB K. H. IlomsoxH pa2WIOJI0K~UIAIOiII~lbM CraITIwisiM. H3A-IsO52 IbA 51. H., B e if e if C~i 0 H . C. Auimernfu CliITitmeTpOlbUX H
AewIHIrpobImX 110.11, '4. 1. ftt*Do BBI4A ii.m. npoý. H. E. )KyKoB-CKoro, 1955.
53. P0hEA1~aa6p a ii. Cpaaneuae 'IyBCTBHTealbliOCTII MOIIOIIMflYJIbCiIlIMXCHCTCMf 11 PJIC C KCoiIH'eCKHM cxaHlipOlailmem. c3apyfetwasi paAflO-W3CI(Tpoim~ka)ý, 1964, .Wg 8.
54. (D a aI b~ X0 11 H '1 C. E. lpitem paAinOioxaunoi mbx caimiasoB na ýoiieýJiiOK(TyalHORIMIiX nomex. 113A-sO cConeTCK'OC piaan, 1961.,
55. Xe a r p e i 1r. BoBpocul TO~pH lliOItOHmflyabCmofI paaHionoatiHit.o3apy6emuani pa;LHo~.;.eKT Oliiima, 1162, Ne 12; 1963, K2 1.
56. X a IiH3a i n. AlBYM~Pi~aAbIibIe alITCHIMib, noCupoemmlH.4 a flpuiflliHflTenecicOna Kaccepuaia. x3apyfetwiax, PlAjwo1TICxmpolnIrM, 1961,Mg 22.
57. X ypr~t Rin5. H., 51K a e B B. MCTOAlbi TeOpiff t~eAUX ýYHKZXHIIB PafHiOý13mce, TO~PHhl CBII3H i1 OfTITIKC (1)n11MMM3, 1962.
58: Ij~nki fi K q i5. 3. TvqpHR iilflyjlbCllbIX ClICTem. 04)IZI~Mrt3, 1958.59. 4 e itr CT a 6H A IfTO. 9KCfOpiUeleITaabIIhC HCIaMODaimeI BO3MO)K-
IIOCT11 flpiNCllC-IIHH MO~I~IlH.IryJlbC11oirI PAC0 AJISI Bbi-Aeaclimg crH3HOJIBOT 1123emiLix itenerf ma 4one AtecTllocrit. c3apy6emitan paAHo3JneK-'TPOHIIKa*, 1961, X2 11.%
60. llht pitiiP 51. C. CTaTmcrrna 11o.18 a41inielinoft aHlcUlib. 143A-BOAPTA im. roaopofa, 1962.
61. W~ a e 3 If if r ep P. Pa.inotaexmpomiaan normla. IBoeauaf~aT. 1963.62. eAtuaCenaau CaIaTHuMCpo3l~X .BommP fep. c anra. nojA peA.
51. H. 4) e A b A a. 143A-Bo KCobeTcxoe D8AiHo*. 1950,63. Cicaanapyloulite aliTen1i~Ze CommCH CB34. flop. c aimi. noa peA.
P..T. blapicota f 'A. -D). tlat.i~iana. 113,1-13 KC013CTKOC pa-
Aillo), 1966.A ~64. CnpasotimiK no ocI!oiam pa~iIOHO1WaLIHO1HORl TexiinKlH. floA peA.
B.13. B. Jp y MItItH Ita. BoenlIDAnaT, 1967.65. F-:Tto.'.Ic(o'oCWr it flomCxoYeToI'itlhOCTUf (ýMIIIlJX PflAHO
aIIIcln,.r: qop)0. Mmm~icH craTerl AOLiHObCKOrO atilH~IltWIoiiioO HHICTH-TyTa. lbl LýO4AjiIOHFH3;P.l '959.'
113JI-i~411

66.Paj~uio::.~~oinaaflOfl):Ilep. c aufa.-t 113g-flO4Cooe cx~ ,pa.
'87. npn1:ec;C1A'P,FHpAwo~oiJwe. Rep. C aR~IM.ý H3A-bo 'CCo.
68. )Jket'cic'rte ugeleporo 'opy~xiui Ile C cý. a 661H3ra, .%369. Aviation gk 9,25123 oI3.a16.'10.-.Aviation Week, 4958, 3111.71. B ate s R. H.''$~tosiivapdrture, <ributions`;:RE Trans.,
1C v. AP-.~,p72. B3 a' u'r. Der WV~ei~ci~tialsatbr.,.Frequenz, M3~ r. 14, Xt 2.
7.B a rton h-D K. The future oaf pulse:radar 'fo'r'missile and 'spacerange in~ti":ientation. "IRE Tranas., 161,' i. MIL-5, X, Xt 4.
4. B a'rt~o D. K._ Acýýfacy of a raionopulse radar. Pr~c. 3 Conf.Nat. Cony.1'Military Electronics,'1959, p.,179-186.
75,l.B it' sbrj L AX, Hughes W.. 'A., Lader "L.,J. Sequential* oin system with. ferritc phase'eshifters. ia'reUr CIIIA X9 2929058or '4/i V-1955.76 BlIa sb er g L. A., HuitghIe s W. A."L a de rL 1,LSingle~'chinneI
'monop uls,'radar systeim. Ilamur1 CWlA X?'3175215',o '8.9.1954.'77.'B o c Al. J., .LRos e ' H;.A.',Polar~iatloui grating for scanning
antennas IiCHT UA M- 31g8642 or 26.8:1959.78. B u t 1'e r J. L.' R'ddar cdutunriiieasur 3Ts a
CILA X 317125 or'5.10.1961.y70. Bulletin of Atomic, Scien~tists, 1967, v. 2.3. N! p. 21-24.:80., Bernf eld'b.M, Coo'k 'C.,'Paol1 o .1., Pal nueri ,C. Mat-
clted filtering pulse compression and waveform design. -Microwave1., 1964, Part 1, M 10; Part 11, Ne~ 11; PNO Ill, M2' 12.
81.'Chad uick 0. G. and Sý heIt'o, it . V'. Two-channel tmonopulsetechniques. Theory and practie. 1E.E Miitiary Electro'nics Confe-
82roen Recrd Steluasington p. 177-)8182mConopule n .Syt eI m e t z eC.rM. Amplitude and phase .s..ensing
Monouls sytem'parmetrs.Part 1. Microwave J., '1959, v. 2Wg 10, p. 21ý-23. .Part 1I, Ke 11, p. 33-38.
83. C o p e I e n d .1. R. ,Radar targe classification by polarization. pro-perties. Proc. IRE, '1960, v. 48, viI, xg 7.
84. Chu T. S., K~onyoumia-n R~. G. An analysis of polarizatiohvariation and Its applk~itin to circulirly -ýolarlzed radiators.IR1E Trans., M69., 4. AP-lo, 3V2.
5.D e v e!1 e I J. A. Thermal - nbise errors in -simultaneous - lobing'and conical - scan angle -- tracking systems.. IRE' Trans., 1961,
6.v. SET-7, VI, p. 42-51.8.D u n n J. H., H o wea r d D. D. Preeision tracking with rnon6pulse
radar., Electronilcs, 19SO, v. 33, JAW 17i p. 51-46.87. Deloral ne E. M., Busi gnilIs H-. G, Pulse radar countermea-
sure. 7IaReUr CWlA M2 2913318 0T 6.8.1942,88. Ell Io t R. S. Mlechanicatl and electrical tolerances for two -
dimensional scanning Antenna arrays. Ws~ tranv., 1A6, v..P
890. Elecronics, 1962, 25/ VIIG1. Electroniics, 1WKS, 25/X1.92'. Electronics, 1951, 30/XI.91-F~Pranklin S. 63., Hilbers C. L. and Kosydar W. E. A wl-
r ~deband two channel nionopulse technique.. IEEE Militery Electro-nics Conference Record, 1965, Washingtoit, p. 174-176.
9.H a is, z N., Z a c It a r y R. A. Phase-aniplitwl'e monopulse system.IRE Trans., U-52, v. MIL.6, JVt, 2. .
95. H a n n a n P. WV'and I o t h P. A. A inonopulse antenna Indepen-'dent optimization' of the sum and difference modes. IRE Intern.ýCony. Record, 1961. Part 1.
FTD-M4T-24I--982-71 '11

98.~1 ov a 'R.E. Monouis receiving4ý apparatus. H~areim CIlIAMW~ 3220287 oi 1.7.196&.
9?.,11 o w a r'd P. 'Radail tiiget- angulair .Iscintillatlon !in tracking and,gui'Nfice system bakcd on echo sfgnal~phas front-distortion. Proc.
98.-H am'm~a n P. L. Thei radar ot' Nike-Alax. Bell Labs.. Rec.. 4§59.
99. Interavi.viAir,.Letter, 1960, 20111. .. ,
100.3,61oniis. Low% side 'l6es iii' penciI beam antennas. Convention"-Record of'the IRE, 1953,,Pt 2.
3101. J o n~%., Ra ms iY'3. F. Polarization characteristics of a~nten-fias. IRE Intern. Cony., Record, 1932, Pt.'!
102, Ge o rge S., P:, Zarain na ko s A. S. 'Multiple target resolutionof .monopulse versus scanning ,radars. Proc. of the National Elec-tro'nics Coniference, 1959, v. XV,' p,. 814--M2
103.K~u c k J. H. Means, -for traclkiny miultiple target formations bradar., rIareiur C[UA X23130402 o$T 12.2.1957. b
104.'K e I Fe c~h e r', K. .S.,' IS c o t t W; 'C.'Crogs-polarizntion effect onantenna radiation patterns.' Conventions Record IEE, -1966, v. 4.Pt. .1.'
105. 1(0 w n a c k I S. Simulation of radar range and doppler effect bymeans of, stationary target. IEEE Trans. of Aerospace and Elec-'tronics Systems, 1,067, p.' 148- A49.
106. Kr Is he n 1.< Ko epselI *W. W., Du rr an I. S. H. Cross-polarl-zation measurements and thuir ~relation to target -surface proper-ties. IEEE Transactions on Antenrnas and Propagation, 1966, M9J5,E0.L 629-635.17,.e i c h t e r M.. Beam., pointing errors of long line sources. IRETrans., 1960,.'v. AP-8, p. 268-275.108 Le n rR.*M. flpeAcTaunaeuie caritanon. IRE Trans. Circuit:Theory; 1959, v..., V.
109.Mathis H. F., Zurcher L. A., Cundernian R. J. Cut ra-dar hardWare needs and costs-with a special multi -mode anten-na feed that requires only two^ hybrcids to& measure azimuth ande~evation. Electron. Design, '1966, F2a
10M cC tell an C. Mlonopulse rada~r system. flaTe)Ir CILIAX2,2980906 OT 18.04.1961.
lII.McCa~nn J. G., Stegen R. J., Falstrom W. Split para-bolic ri~dar antenna utiiz~ing means to discriminate against cross-polarized energy. Tla'reHT CILA 34 3G92834 oT 23.10.195M
112. MIller P. S.; Pee le t G. D. M. Polarization filter antenrautilizi~ng- reffector cinsistInFg of parallel 'separated metal stripsmounted on low, loss dish. FHaveiT CWlA Ne 3119109 or 31.12.1958.
-113 AIMIFIe r B. US prxŽi-Ara- tt c~apability erodes. Aviation Week andSpece. Techinologiy M-3, ;1~ 17, p. P-), 95, 98, 99, 105, 108, 109.
114. Missiles and R~ockets, 1961, M' 20, 15/IV.115. Missiles and Rocke~ts. 1959, 21jIX.110. 14 e'st er: N. 11-1. A 'iyof tra~ckinig acrcyn onopiulse pha-
s-d arrays. IRE Trans., 1C32, v. Ail-10, M? 3.117. Pa ge P. M. Mlonopuke radar. IRE Cony. Record, 1955, Pt. 8.
118. R I r a r d I L.. N I r o L. Dc.f.In of a t,..vehornmopusfedIRZE Intern. Cbnv; Pelcard, 1961, Pt. 1, Iff.
119. R o n d I n e II I' L. A. E~ffects of ranidom errors on the performanceof antenna array~s-of minny clernents. IRE Nail. Cony. Record,1959,.*v. 7, Pt: 1, p. 173-187.
12O.Raboy B. 'Radar sysýtem. Ila'IeTi CUlIA X2 3129125 OT 27.9.1957..121. R u s c h W. V. T. Phanse error and associated cross- polarizationi
effects In Cassegraihilan -fed microwave antennas. IRE Trans.,1906, v. AP-14. X2 3. p. 2G8-275.
12,2. 5c liw a r zk op D. A h~igh precision monopulse receiver. micro-wave J., 1967, v. 10, JN 9, P. 92-101.
123. S o n n e r G. El. Three beam monopulse radar system and appara-tus. liareur CiliA XV 3129425 or 27.9.1957.
FTD-MT-24-982-71 413

124.Som mers H. S. Signal comparison system. FlaTeaT ClIAWt 2721320.12.5. S It o r kWe F. P. A thOnopulse Instrumentation system: Prec., IRK.1981, v. 49, M 8, p. 1328---1329.126. S h a r e ns o n S. Abgle estimation with a& monopulse radar inthe search mode. IRE Trans., 1962,. v. ANE-9, 3.&127.Watson R. B., Hor~to,,'u G. W. Simultaneous lobe comparison
for radar direction fin'in .aTeHT CIA M 3025517 b 31.01.195"28:Wh't te S. B. Radar countermeasure. ]'raTetT CWIA M 3019433
or' 27:.11959.19. Z a c ha r Y R. Automatic gain control for',monopulse radar. fa-
TOHT CLIA A 2013317.)Ty I o r R. E. 'Satellite tracking simultaneous-- tobing monopul-
se receiving system with polarization diversity capability. RETrans., 1961, v. AES,3, M 4.
13.Th our e L. Thcorie des circuits hyperfrjiuence i comparalsonde phase on danmplitude. Annal6s de Radioelc|tricitt, 1958, J* 52,
1 , p. 130-139.132. Tho mpson A. S. Boresight shift In phase se.sing monopulse
antennas due to reflected signals. Microwave J., '496, v. 9, * 5,!p;47--48. .. .. • • " 1,
133. a T o C ocy xs H Ap. YcTpOiACTOO AAIR yCMlmixe nepexpecTHOR'.fO9apt3IauHH B ain'uene. 5InoncxaW na8eHt 1,1 223,27"or 27.02.63.134. KaTe C.-0CpY X , 'H a 3XI xpa& C Hr !)o, Yc'rpoficruo An ycTpa-NeM.,: 0' nepeiieci•oA 11o.SpH•altH. qHuoHCKHA nazeWT 30 1720,5 oT4.04.63.
FOTD-MT-214-982-71 414t
',o
/I
U-