Sediment budget of the Napo River, Amazon basin, Ecuador and Peru
Upload
khangminh22Category
view
2download
0
Fluvial Sediment in Hocking River Subwatershed 1 (North Branch Hunters Run), Ohio
GEOLOGICAL SURVEY WATER-SUPPLY PAPER 1798-1
Prepared in cooperation with the U.S. Department of Agriculture Soil Conservation Service
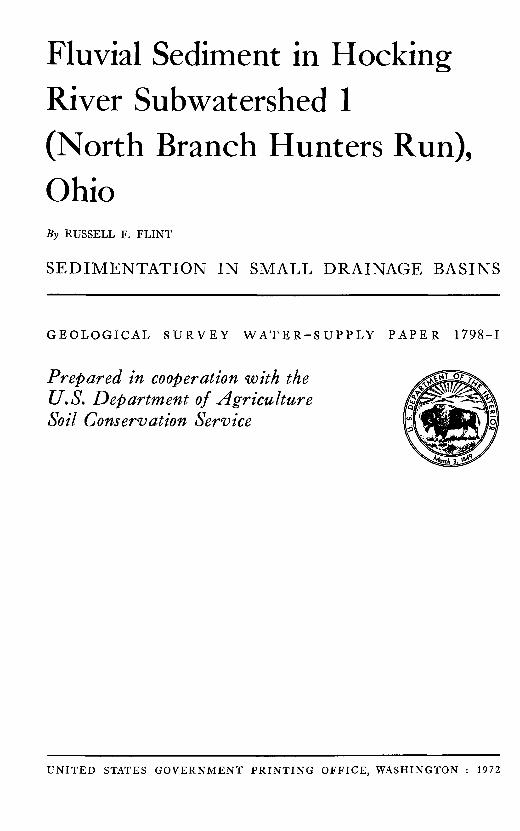
Fluvial Sediment in Hocking River Subwatershed 1 (North Branch Hunters Run), OhioBy RUSSELL F. FLINT
SEDIMENTATION IN SMALL DRAINAGE BASINS
GEOLOGICAL SURVEY WATER-SUPPLY PAPER 1798-1
Prepared in cooperation with the U.S. Department of Agriculture Soil Conservation Service
UNITED STATES GOVERNMENT PRINTING OFFICE, WASHINGTON : 1972
UNITED STATES DEPARTMENT OF THE INTERIOR
ROGERS C. B. MORTON, Secretary
GEOLOGICAL SURVEY
V. E. McKelvey, Director
Library of Congress catalog-card No. 71-190388
For sale by the Superintendent of Documents, U.S. Government Printing OfficeWashington, D.C. 20402 - Price 30 cents (paper cover)
Stock Number 2401-2153
CONTENTS
PageAbstract __________________ UIntroduction __________ -- 1
Acknowledgments ___ __ 2Description of the area __ - 3
Elevations and slopes __ ________ 4Soils and land use ___________ 4Geology ___________________ 4Climate __________________ 5
Hydraulic structures _____________ 5Runoff _________________________________ __ 9Fluvial sediment ________________ 12
Suspended sediment _____________ 13Deposited sediment ___________ 19Sediment yield ______________ 19Trap efficiency of reservoir 1 _____________ - 21
Conclusions _____________________________________ 21References _______________________________-- 22
ILLUSTRATIONS
PageFIGURE 1. Map of Hocking River subwatershed 1 (North Branch
Hunters Run) __________________________ 13 2-6. Photographs showing
2. Upstream face of detention structure . 63. Reservoir 1 ______ 64. Minor floodwater-retarding structure R3 75. Minor sediment-control structure S4 76. Outflow conduit of reservoir 1.___ 13
7. Trilinear diagram showing percentage of sand, silt, and clay in suspended-sediment samples of inflow and out flow, reservoir 1 ___________-_____ 15
TABLES
PageTABLE 1. Area and capacity of reservoir 1 as constructed at indi
cated elevations ____..___________ 182. Summary of outflow from reservoir 1, 1956-62. 103. Monthly water and sediment discharges, Hocking River
subwatershed 1 (North Branch Hunters Run) near Hooker, Ohio ___________________ 11
in

IV CONTENTS
PageTABLE 4. Reservoir discharge, precipitation, and miscellaneous hy-
drologic data, reservoir 1, 1956-62______________ 1125. Particle-size analyses of suspended sediment, inflow to
reservoir 1 ___________________________ 166. Chemical-quality analyses of inflow and outflow, reservoir
1, May 1956 to February 1962 _________________ 187. Particle-size analyses of suspended sediment, outflow from
reservoir 1 __________________________ 208. Suspended-sediment discharge in outflow from reservoir 1 _ 21
SEDIMENTATION IN SMALL DRAINAGE BASINS
FLUVIAL SEDIMENT INHOCKING RIVER SUBWATERSHED 1
(NORTH BRANCH HUNTERS RUN), OHIO
By RUSSELL F. FLINT
ABSTRACT
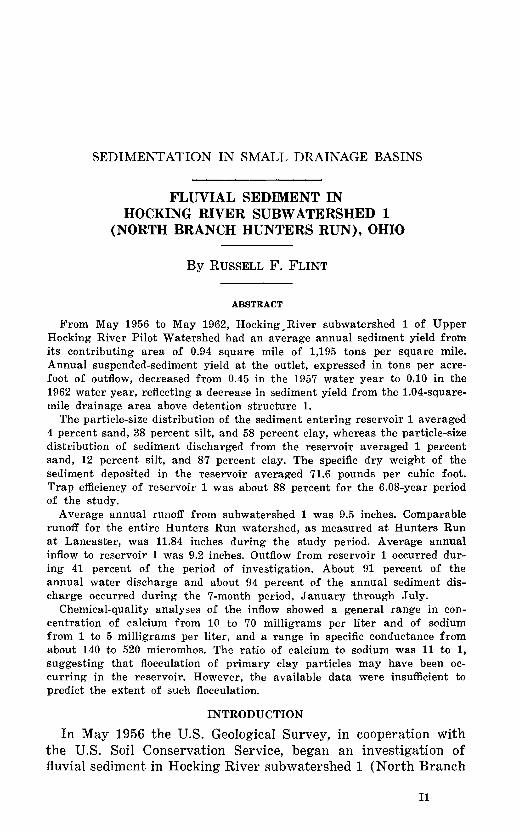
From May 1956 to May 1962, Hocking e River subwatershed 1 of Upper Hocking River Pilot Watershed had an average annual sediment yield from its contributing area of 0.94 square mile of 1,195 tons per square mile. Annual suspended-sediment yield at the outlet, expressed in tons per acre- foot of outflow, decreased from 0.45 in the 1957 water year to 0.10 in the 1962 water year, reflecting a decrease in sediment yield from the 1.04-square- mile drainage area above detention structure 1.
The particle-size distribution of the sediment entering reservoir 1 averaged 4 percent sand, 38 percent silt, and 58 percent clay, whereas the particle-size distribution of sediment discharged from the reservoir averaged 1 percent sand, 12 percent silt, and 87 percent clay. The specific dry weight of the sediment deposited in the reservoir averaged 71.6 pounds per cubic foot. Trap efficiency of reservoir 1 was about 88 percent for the 6.08-year period of the study.
Average annual runoff from subwatershed 1 was 9.5 inches. Comparable runoff for the entire Hunters Run watershed, as measured at Hunters Run at Lancaster, was 11.84 inches during the study period. Average annual inflow to reservoir 1 was 9.2 inches. Outflow from reservoir 1 occurred dur ing 41 percent of the period of investigation. About 91 percent of the annual water discharge and about 94 percent of the annual sediment dis charge occurred during the 7-month period, January through July.
Chemical-quality analyses of the inflow showed a general range in con centration of calcium from 10 to 70 milligrams per liter and of sodium from 1 to 5 milligrams per liter, and a range in specific conductance from about 140 to 520 micromhos. The ratio of calcium to sodium was 11 to 1, suggesting that flocculation of primary clay particles may have been oc curring in the reservoir. However, the available data were insufficient to predict the extent of such flocculation.
INTRODUCTION
In May 1956 the U.S. Geological Survey, in cooperation with the U.S. Soil Conservation Service, began an investigation of fluvial sediment in Hocking River subwatershed 1 (North Branch
II
12 SEDIMENTATION IN SMALL DRAINAGE BASINS
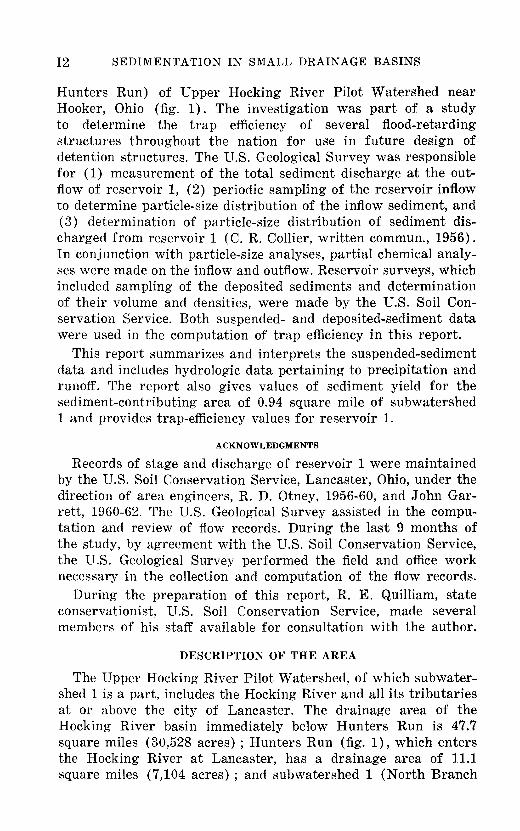
Hunters Run) of Upper Hocking River Pilot Watershed near Hooker, Ohio (fig. 1). The investigation was part of a study to determine the trap efficiency of several flood-retarding structures throughout the nation for use in future design of detention structures. The U.S. Geological Survey was responsible for (1) measurement of the total sediment discharge at the out flow of reservoir 1, (2) periodic sampling of the reservoir inflow to determine particle-size distribution of the inflow sediment, and (3) determination of particle-size distribution of sediment dis charged from reservoir 1 (C. R. Collier, written commun., 1956). In conjunction with particle-size analyses, partial chemical analy ses were made on the inflow and outflow. Reservoir surveys, which included sampling of the deposited sediments and determination of their volume and densities, were made by the U.S. Soil Con servation Service. Both suspended- and deposited-sediment data were used in the computation of trap efficiency in this report.
This report summarizes and interprets the suspended-sediment data and includes hydrologic data pertaining to precipitation and runoff. The report also gives values of sediment yield for the sediment-contributing area of 0.94 square mile of subwatershed 1 and provides trap-efficiency values for reservoir 1.
ACKNOWLEDGMENTS
Records of stage and discharge of reservoir 1 were maintained by the U.S. Soil Conservation Service, Lancaster, Ohio, under the direction of area engineers, R. D. Otney, 1956-60, and John Gar- rett, 1960-62. The U.S. Geological Survey assisted in the compu tation and review of flow records. During the last 9 months of the study, by agreement with the U.S. Soil Conservation Service, the U.S. Geological Survey performed the field and office work necessary in the collection and computation of the flow records.
During the preparation of this report, R. E. Quilliam, state conservationist, U.S. Soil Conservation Service, made several members of his staff available for consultation with the author.
DESCRIPTION OF THE AREA
The Upper Hocking River Pilot Watershed, of which subwater shed 1 is a part, includes the Hocking River and all its tributaries at or above the city of Lancaster. The drainage area of the Hocking River basin immediately below Hunters Run is 47.7 square miles (30,528 acres) ; Hunters Run (fig. 1), which enters the Hocking River at Lancaster, has a drainage area of 11.1 square miles (7,104 acres) ; and subwatershed 1 (North Branch
82
°42
'30
"
Susp
ended-s
edim
ent
sam
plin
g
site
an
d n
um
be
r
Dete
ntio
n s
truct
ure
and
num
ber
R3
Re
tard
ing
str
uct
ure
and
num
ber
aS
4S
edim
ent-
contr
ol
str
uctu
re
and
num
ber
O
Far
m p
ond
Dra
inag
e ba
sin
bo
un
da
ry
o
o w t I 2 o CO a w cc
W o w
FIG
UR
E 1
. D
rain
age
area
of
H
ocki
ng
Riv
er
subw
ater
shed
1
(Nort
h
Bra
nch
Hunte
rs
Run
) in
w
est-
centr
al
Fai
rfie
ld
Cou
nty,
O
hio,
sh
owin
g hydra
uli
c st
ruct
ure
s an
d in
stru
men
tati
on f
or
the
stud
y.

14 SEDIMENTATION IN SMALL DRAINAGE BASINS
Hunters Run) is 9.4 percent (1.04 square miles or 666 acres) of the Hunters Run basin. (See Cross, 1967, p. 17.)
Reservoir 1, shown in figure 1, is in west-central Fairfield County, Ohio, 0.3 mile north of State Highway 188, 3.2 miles southwest of Hooker, and 4.6 miles west of Lancaster, and is included on the Amanda, Ohio, 7.5-minute topographic map. It is in the glaciated Allegheny Mountain section of the Appalachian Plateaus physiographic province (Meeker and others, 1960, p. 4).
ELEVATIONS AND SLOPES
North Branch Hunters Run, shown in figure 1, heads in the southwest part of subwatershed 1, about 2.2 channel miles up stream from reservoir 1. The highest elevation in subwatershed 1 is 1,180 feet above mean sea level near the extreme southwest corner. The lowest elevation is 972 feet above mean sea level near the upstream base of detention structure 1.
Slopes of the upland surfaces of the basin range from 6 to 25 percent, whereas those of the bottom lands range from 0 to 5 percent.
SOILS AND LAND USE
Thirteen soil types have been mapped by the U.S. Soil Conser vation Service in subwatershed 1 (Meeker and others, 1960). Ninety percent of the soils were formed on calcareous glacial till, glacial outwash terraces, or in glacial depressions. The most important soil series is the Alexandria. Two soil types of this series, Alexandria silt loam and Alexandria silty-clay loam, cover about 61 percent of the drainage basin. Silt loams of other series, chiefly the Loudenville, Marengo, and Cardington, comprise most of the remaining soils of the area. Most of the soils are well drained.
In 1951 about 50 percent of subwatershed 1 was cropland and about 47 percent was in pasture or woods; the remaining 3 per cent was used for farmsteads and roads. The percentage of crop land has decreased with time. Practically no cultivation in the subwatershed was observed by the author in 1970.
GEOLOGY
The bedrock of the subwatershed is a coarse sandstone and conglomerate of the Cuyahoga Group of Mississippian age. The area was covered by both the Illinoian and Wisconsin ice sheets. Surface deposits of subwatershed 1 are glacial drift of late Wis consin age. They were derived from local sandstone and shale; from limestone, dolomite, and shale outcrops in central and northwestern Ohio; and from granite, quartzite, and other cry-

HOCKING RIVER SUBWATERSHED 1, OHIO 15
stalline rock outcrops in the Canadian highlands (Meeker and others, 1960, p. 5).
CLIMATE
The climate of the area is classified as continental (Miller, 1968), which is characterized by large variations in temperature. Summers are moderately warm and humid, and winters are cold and cloudy with an average of 4 days of subzero temperatures.
Rainfall is abundant and well distributed throughout the year. Annual precipitation averages 38.42 inches.
No evaporation data are available for the immediate vicinity, but pan data collected during the season May to October at Senecaville, Ohio, indicated an average annual evaporation of about 37 inches for the period of investigation (Kohler and others, 1959). This figure was not converted to lake values as it is as sumed that pan values of evaporation closely approximate small reservoir values (M. E. Miller, oral commun., 1970).
The growing season averages about 155 days per year. The frost-free season extends from early May to early October. From 1935 to 1967, temperatures of 32°F were recorded as early as September 17 and as late as May 25 (Miller, 1968).
HYDRAULIC STRUCTURES
During 1955-61, the U.S. Soil Conservation Service installed eight major floodwater-retarding structures and 22 minor stabiliz ing and sediment-control structures in the Upper Hocking River Pilot project area. Detention structure 1, which was completed in 1955, was one of the major structures. As pictured in figure 2, it is a sodded earthen dam with concrete drop outlet works and an earthern emergency spillway. In April 1956 reservoir 1, shown in figure 3, had a storage capacity of 450.0 acre-feet and a surface area of 36.9 acres at the crest of the emergency spillway (eleva tion 1,009 feet above mean sea level). Table 1 gives the "as constructed" area and capacity of reservoir 1 at 1-foot increments of elevation based upon the April 1956 survey.
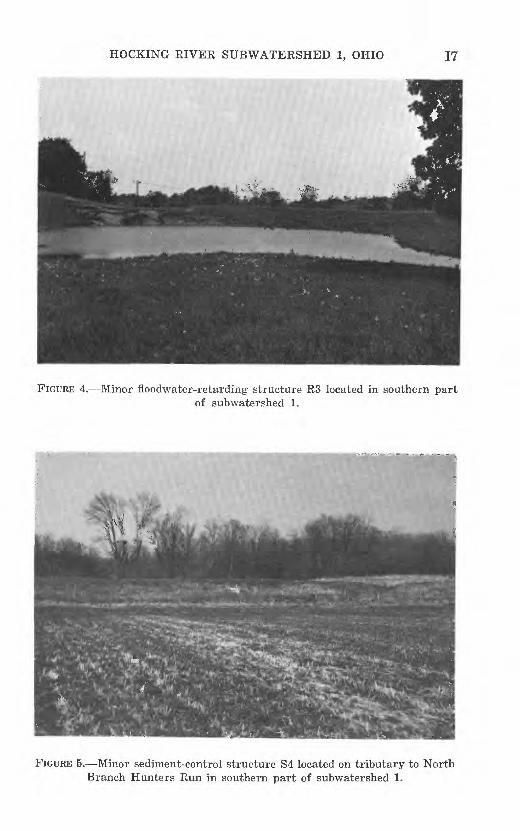
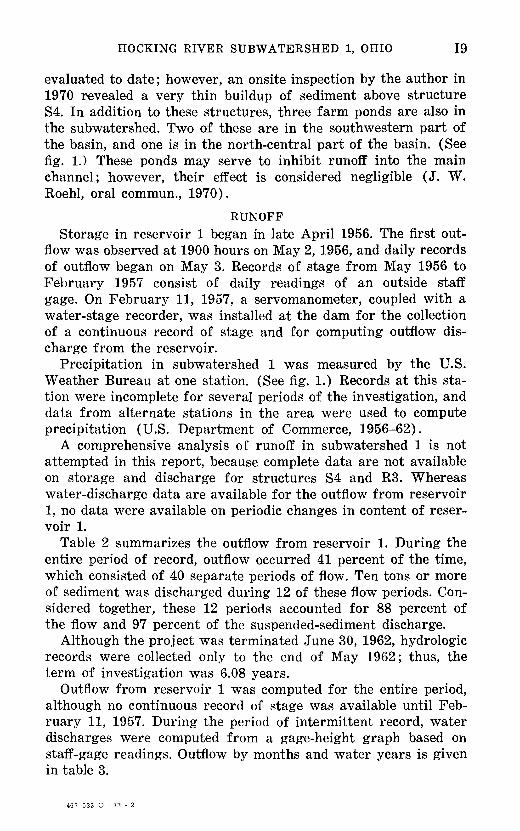
Structures R3 (drainage area, 47 acres) and S4 (drainage area, 18 acres) located in the southern part of the subwatershed (fig. 1) were constructed in 1956 to control runoff and to serve as sediment traps. Both structures have sodded earthen spillways with 18-inch discharge tubes. Structures R3 (fig. 4) and S4 (fig. 5) have sediment-storage capacities of 1.27 acre-feet and 0.15 acre-foot, respectively, and maximum temporary floodwater- storage capacities of 5.8 acre-feet and 0.8 acre-foot, respectively. The effect of these structures as traps for sediment has not been

16 SEDIMENTATION IN SMALL DRAINAGE BASINS
FIGURE 2. View of upstream face of detention structure 1 showing high- and low-stage risers of outlet works. Emergency spillway at left end of dam is ,not shown. Photograph by C. R. Collier.
FIGURE 3. View of reservoir 1 looking upstream from roadway on top of detention structure 1. Photograph by C. R. Collier.
HOCKING RIVER SUBWATERSHED 1, OHIO 17
FIGURE 4. Minor floodwater-retarding structure R3 located in southern partof subwatershed 1.
FIGURE 5. Minor sediment-control structure S4 located on tributary to North Branch Hunters Run in southern part of subwatershed 1.

18 SEDIMENTATION IN SMALL DRAINAGE BASINS
TABLE 1. Area and capacity of reservoir 1 as constructed at indicatedelevations
Elevation (feet above
mean sea level)
973974975976977
978979980981982
983984985986987
988989990991992
993994995996997
998999
1,0001,0011,002
1,0031,0041,0051,0061,007
1,0081,0091,0101,0111,012
Surface area
(acres)
0.3.4.6.7.8
1.01.11.31.51.8
2.12.43.03.84.5
5.46.37.38.39.4
10.912.514.115.817.3
18.920.522.123.825.5
27.228.930.431.933.4
34.936.939.041.343.6
Capacity (acre-ft) Remarks
0.2.5
1.21.52.5
3.14.05.06.17.9
10.012.8 Gage datum.15.819.123.1
27.5 Crest of low-stage inlet.33.540.548.557.2
67.579.893.2
108.5125.5
143.8163.5184.3207.0231.1
258.5286.0316.2 Crest of high-stage inlet.347.5379.5
413.5450.0 Earth spillway.487.5527.0_ _
HOCKING RIVER SUBWATERSHED 1, OHIO 19
evaluated to date; however, an onsite inspection by the author in 1970 revealed a very thin buildup of sediment above structure S4. In addition to these structures, three farm ponds are also in the subwatershed. Two of these are in the southwestern part of the basin, and one is in the north-central part of the basin. (See fig. 1.) These ponds may serve to inhibit runoff into the main channel; however, their effect is considered negligible (J. W. Roehl, oral commun., 1970).
RUNOFF
Storage in reservoir 1 began in late April 1956. The first out flow was observed at 1900 hours on May 2, 1956, and daily records of outflow began on May 3. Records of stage from May 1956 to February 1957 consist of daily readings of an outside staff gage. On February 11, 1957, a servomanometer, coupled with a water-stage recorder, was installed at the dam for the collection of a continuous record of stage and for computing outflow dis charge from the reservoir.
Precipitation in subwatershed 1 was measured by the U.S. Weather Bureau at one station. (See fig. 1.) Records at this sta tion were incomplete for several periods of the investigation, and data from alternate stations in the area were used to compute precipitation (U.S. Department of Commerce, 1956-62).
A comprehensive analysis of runoff in subwatershed 1 is not attempted in this report, because complete data are not available on storage and discharge for structures S4 and R3. Whereas water-discharge data are available for the outflow from reservoir 1, no data were available on periodic changes in content of reser voir 1.
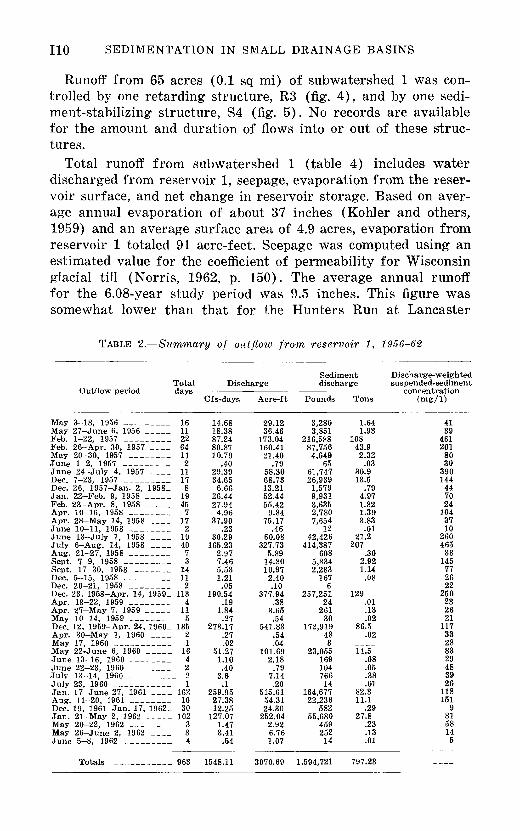
Table 2 summarizes the outflow from reservoir 1. During the entire period of record, outflow occurred 41 percent of the time, which consisted of 40 separate periods of flow. Ten tons or more of sediment was discharged during 12 of these flow periods. Con sidered together, these 12 periods accounted for 88 percent of the flow and 97 percent of the suspended-sediment discharge.
Although the project was terminated June 30, 1962, hydrologic records were collected only to the end of May 1962; thus, the term of investigation was 6.08 years.
Outflow from reservoir 1 was computed for the entire period, although no continuous record of stage was available until Feb ruary 11, 1957. During the period of intermittent record, water discharges were computed from a gage-height graph based on staff-gage readings. Outflow by months and water years is given in table 3.
no SEDIMENTATION IN SMALL DRAINAGE BASINS
Runoff from 65 acres (0.1 sq mi) of subwatershed 1 was con trolled by one retarding structure, R3 (fig. 4), and by one sedi ment-stabilizing structure, S4 (fig. 5). No records are available for the amount and duration of flows into or out of these struc tures.
Total runoff from subwatershed 1 (table 4) includes water discharged from reservoir 1, seepage, evaporation from the reser voir surface, and net change in reservoir storage. Based on aver age annual evaporation of about 37 inches (Kohler and others, 1959) and an average surface area of 4.9 acres, evaporation from reservoir 1 totaled 91 acre-feet. Seepage was computed using an estimated value for the coefficient of permeability for Wisconsin glacial till (Norris, 1962, p. 150). The average annual runoff for the 6.08-year study period was 9.5 inches. This figure was somewhat lower than that for the Hunters Run at Lancaster
TABLE 2. Summary of outflotv from reservoir 1, 1956-6
Total
May 3-18, 1956May 27-June 6, 1956Feb. 1-22, 1957Feb. 26-Apr. 30, 1957 ____May 20-30, 1957June 1-2, 1957June 24-July 4, 1957 ___Dec. 7-23, 1957Dec. 26, 1957-Jan. 2, 1958_Jan. 22-Feb. 9, 1958Feb. 23-Apr. 8, 1958Apr. 10-16, 1958Apr. 28-May 14, 1958 ____June 10-11, 1958June 13-July 1, 1958 ____July 6-Aug. 14, 1958 ___Aug. 21-27, 1958Sept. 7-9, 1958Sept. 17-30, 1958Dec. 5-15, 1958Dec. 20-21, 1958Dec. 23, 1958-Apr. 14, 1959_Apr. 19-22, 1959Apr. 27-May 7, 1959May 10-14, 1959Dec. 12, 1959-Apr. 24, 1960_Apr. 30-May 1, 1960 ____
May 22-June 6, 1960June 13-16, 1960June 22-23, 1960July 13-14, 1960July 23, 1960Jan. 17-June 27, 1961 __Aug. 11-20, 1961Dec. 19, 1961-Jan. 17, 1962_Jan. 21-May 2, 1962May 20-22, 1962May 26-June 2, 1962 _ _June 5-8, 1962
16112264112
1117
81945
717
21940
73
1411
2113
411
5135
2
164221
1621030
102384
Discharge
Cfs-days
14.6818.3887.2480.8710.79
.4029.3934.65
6.6626.4427.94
4.9637.90
.2330.29
165.232.977.465.531.21.05
190.54.19
1.84.27
273.17.27.02
51.271.10.40
3.6.1
259.9527.3812.25
127.071.473.41
.54
Acre-ft
29.1236.46
173.04160.4121.40
.7958.3068.7313.2152.4455.42
9.8475.17
.4660.08
327.735.89
14.8010.972.40.10
377.94.38
3.65.54
541.83.54.04
101.692.18
.797.14.20
515.6154.3124.30
252.042.926.761.07
Sediment Discharge-weighted discharge suspended-sediment
Pounds
3,2803,851
216,58887,7564,649
6561,74726,939
1,5799,9313,6352,7807,654
1242,426
414,387608
5,8342,283
1676
257,25124
26130
172,919483
23,055169104766
14164,67722,236
58255,680
459252
14
Tons
1.641.93
10843.92.32
.0330.913.5
.794.971.821.393.83
.0121.2
207.30
2.921.14
.08
129.01.13.02
86.5.02
11.5.08.05.38.01
82.311.1
.2927.8
.23
.13
.01
(mg/1)
4139
461201
8030
390144
447024
1043710
260465
38145772622
250232621
11733288329483926
118151
9815814
5
Totals _________ 963 1548.11 3070.69 1,594,721 797.23
HOCKING EIVEE SUBWATEESHED 1, OHIO 111
H
i0>3» is:>3S
10
^
^ ^
!« <H ^
ff
*> ?*
*. s£
J S
O Q^
3 co^ 5»£®
g S* £"
1*3 o
S^3 "*-§"£
o*|£-
* ^w'o
5
3
3at4
{le«H3*g°I
Hj1'
H
%en
tut)sj^
31-3
01C3
1-3
(«
S
j?
a
.0QJ
Ca1-3
8Q
|
+3o O
s--S!3(0 $
*
t 8
S« 8.2 a
1
(M CO CO CO rH O5 OST-HOJ rH OJ iH
CD OS CD O CO CO ** O CD OJ rH OS CO C-; CO 00 O ** OS C- '*'CO O IO OS (M 00 <*
OJ COrH CO OJrH
00050000OS
rH
OOOOOOOO OO COCD t>
OO5 00 O O O OCDi-l C-
'(NI CO*
rH
CO O CD O i-l rH CD OS i-l ** t- O5 C-U3O5 0 <M CD
!N CO rH
CO O5 ** CO C- OS CDi-l t- CD CO <M OS 00
tN i-i co iaia
1 CD Id <M 00 C- rH 1 IG> rH CD OS O5 U3 "* O5 CD O3 N i-iCDrH iHOO rH
1 O CDO5 O <* N 1 tN 00 U3 CD <M rH^" CD OJ ** 00 16 rH rH CO CO 1O CO
1 Id 00 rH ^ O ^ 1 CO rH CD CO 00 O
O5 00 00 1C: O3 CD
rH
1 O IO C- 00 ^f O1 tfi OS Tj* O l£>
<M (M U3 CO ID!N 0 CD CO
rH
1 O t-00 U3 O U31 rHO5 00 O5
rHrH <*Tj< CO
OOOOOO
OOOOOO
CD C- 00 OS O rH OJIO »O U3 l£> CD CD CD OS OS OS OS OS O5 OS
1 O1 O
rH
3 \00
r-T
OS05N rH rH
CD"*.
co' co
c-toCD OS
rH
t-00IO CD00
i-lOr-5 (M00 i-l1-1
OSc-t> COOS rHrH
T-I
CDi-5 (MO5 i-l rH
(Mco
c- 01CO
-*kOOS IdO3 rH
10OS00 U5t-
0 0
0 0
11
03 '-t-1 i io ci
o> "*°
?H O
f^
c§a.S
I1 3+*G
VI
rH CO !N CD !N !N Tf!N CO rH rH rH
rH IO 00 OS 00 CO C- CO O CD CO C- iH 00
C- O 00 C- t- CD CD t- rH IO OS 00 IO CO IO (NrH rH
oot-oooorH rHoo"
O OOO OO CD OO CO^ ' S,'^ OQ
!NI
O OS O5 OO OOrH 00 00rH CD_ C-O~
rH
00 CO CD O ** 00 i-H (M 03 CO OOO tN^* CD '^ CD CDiH rH OJ rH
CD**
CO OS OJ O OJ OJ !NO -^ T-I OS CD !N rH
IO <* CD OJ OS
1-1
1 OJ i-l IO OJ OS CD 1 OJ 00 rH CD IO -^
CD ^f rH CO Ol00 CO
1 OOrH O C-0 OS 1 03 C-O OJ O O
CO rH
1 ** ** »O CO IO O 1 OJ CO OS OJ Ol CO
rH CD OJ COOJ rH
1 O O CDO CO OJ1 CO C-rH 00 Tf
'^l,'^,'^, 1""' ^
OS C-O OS
rH
IOOCOOOC-1 OS CD T-I OJ
** OJ C^00 COOJ rH
OOOOOO
OOOOOO
CD t- 00 OS O rH OJ IO IO IO IO CD CD CDos os os os os os os
I O1 0
rH
rH |
OS
r-T
C- rH1-1
oo"
** OJ"**"?.CDOJ
00 CD00 OJ**?.rH rH
O C-c-00^t*
orH
O O510
ofrH
10 00 00oo"OJrH
Oo" c-
»-J ooCO OJ
IO
rH OJ** rH*^t*O5T-I
o coosOj""^
0 0
0 0
1 1,_ 103 '
^so> "*°
OH
112 SEDIMENTATION IN SMALL DRAINAGE BASINS
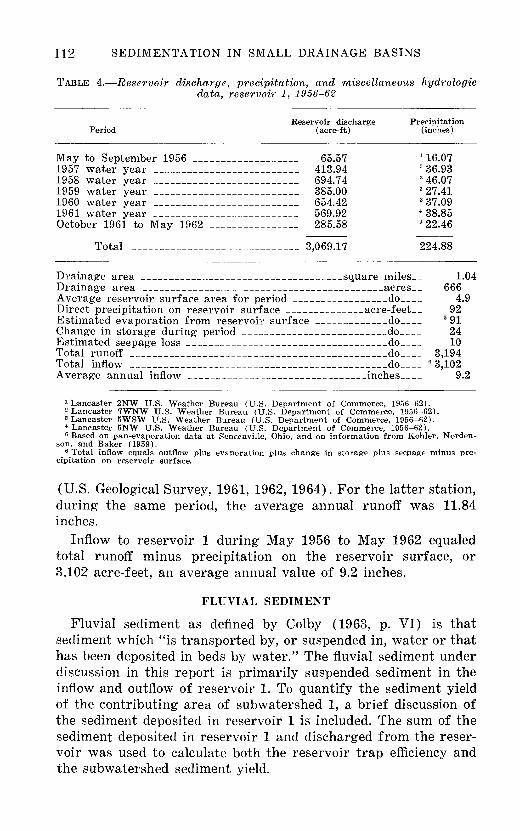
TABLE 4. Reservoir discharge, precipitation, and miscellaneous hydrologic data, reservoir 1, 1956-62
Period
May to September 19561957 water year1958 water year1959 water year1960 water year1961 water yearOctober 1961 to May 1962
Reservoir discharge (acre-ft)
65.57._ _ __ 413.94. _ __ 694.74. _ ___ 385.00
654.42_ __ __ 569.92
. _ ___ 285.58
Precipitation (inches)
1 16.073 36.933 46.073 27.413 37.094 38.854 22.46
Total ____________________ 3,069.17 224.88
Drainage area _______..______________square miles_ 1.04Drainage area ________________________acres__ 666Average reservoir surface area for period _________do____ 4.9Direct precipitation on reservoir surface _________acre-feet__ 92Estimated evaporation from reservoir surface _______do__ 5 91Change in storage during period ________________do__ 24Estimated seepage loss _______________________do__ 10Total runoff ________________________________do__ 3,194Total inflow ________________________________do__ u 3,102Average annual inflow _______________________.inches__ 9.2
1 Lancaster 2NW U.S. Weather Bureau (U.S. Department of Commerce, 1956-62).- Lancaster 7WNW U.S. Weather Bureau (U.S. Department of Commerce, 1956-62). 3 Lancaster 5WSW U.S. Weather Bureau (U.S. Department of Commerce, 1956-62).* Lancaster 5NW U.S. Weather Bureau (U.S. Department of Commerce, 1956-62)." Based on pan-evaporation data at Senecaville, Ohio, and on information from Kohler, Norden-
son, and Baker (1959).6 Total inflow equals outflow plus evaporation plus change in storage plus seepage minus pre
cipitation on reservoir surface.
(U.S. Geological Survey, 1961, 1962, 1964). For the latter station, during the same period, the average annual runoff was 11.84 inches.
Inflow to reservoir 1 during May 1956 to May 1962 equaled total runoff minus precipitation on the reservoir surface, or 3,102 acre-feet, an average annual value of 9.2 inches.
FLUVIAL SEDIMENT
Fluvial sediment as defined by Colby (1963, p. VI) is that sediment which "is transported by, or suspended in, water or that has been deposited in beds by water." The fluvial sediment under discussion in this report is primarily suspended sediment in the inflow and outflow of reservoir 1. To quantify the sediment yield of the contributing area of subwatershed 1, a brief discussion of the sediment deposited in reservoir 1 is included. The sum of the sediment deposited in reservoir 1 and discharged from the reser voir was used to calculate both the reservoir trap efficiency and the subwatershed sediment yield.

HOCKING RIVER SUBWATERSHED 1, OHIO
SUSPENDED SEDIMENT
113
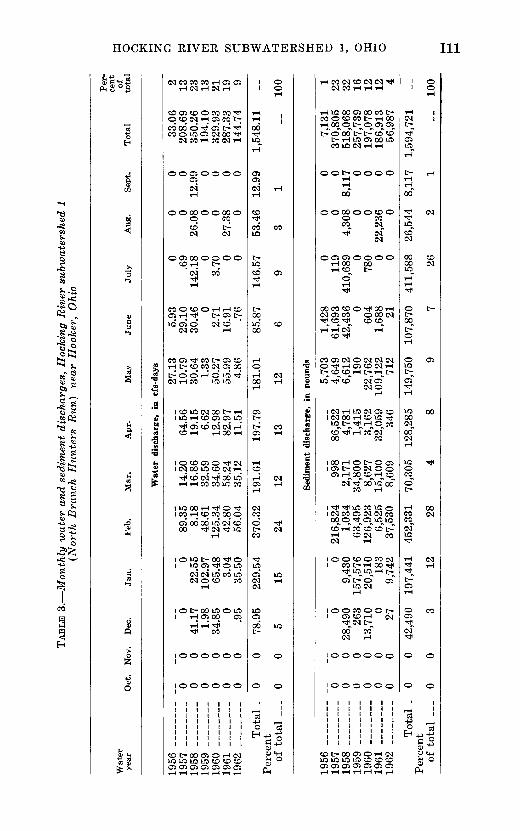
A DH-48 sediment sampler was used to collect depth-integrated sediment samples at the outflow of reservoir 1. (See fig. 6.) The established frequency of collection was sufficient to define the daily concentration. During periods of increased inflow to the reservoir, additional samples were collected at sampling site 1 on the inflow channel. (See fig. 1.) Both inflow and outflow loca tions were analyzed to determine the sediment concentration in milligrams per liter, and selected samples were analyzed to de termine the particle-size distribution of the suspended sediment. Table 2 shows sediment discharge, in pounds, for the periods of flow from reservoir 1. Table 3 gives a summary of monthly dis charges for water and sediment, liable 3 indicates that 91 percent of the total water discharge and 94 percent of the total sediment discharge from reservoir 1 occurred during the 7-month periods, January through July. Ninety-one percent of the total sediment discharged from reservoir 1 occurred during only 5 percent of the period of investigation. Because this included only 107 days, the importance of increased frequency of sampling during major runoff events is demonstrated.
Because sampling of the outflow includes the entire depth of flow, the computed sediment discharge represents the total sedi-
FIGURE 6. Outflow conduit of reservoir 1 showing walkway from which sediment samples were taken. Photograph by C. R. Collier.

114 SEDIMENTATION IN SMALL DRAINAGE BASINS
ment discharge from the reservoir. Samples that were collected at the inflow to the reservoir are also thought to be representa tive for the channel flow. The turbulence at this point probably suspends most of the sediment particles that were available for transport. Sediment discharge of the inflow was not a part of this study; however, one measurement taken during flood runoff on January 21, 1959, indicated an instantaneous sediment discharge of 20,400 pounds per day into the reservoir. The measured inflow at this time was 10.8 cubic feet per second, and the sediment con centration was 351 mg/1.
The maximum daily load of the outflow for the period of record was 170,000 pounds (85 tons) on July 7, 1958. This represented more than 10 percent of the sediment discharged during the entire period of investigation. The maximum daily mean concentration was 569 mg/1 on February 9, 1957. The highest observed instan taneous concentration at the outflow was 892 mg/1 on May 8, 1961. For this sample, the instantaneous sediment discharge amounted to 315,000 pounds per day, of which 76 percent was clay and 24 percent was silt.
Particle-size analyses of both inflow and outflow samples of reservoir 1 were made by sieve and sedimentation methods. The sedimentation device used for analysis of the silt and clay frac tions was the bottom-withdrawal tube. The results of 65 analyses of the inflow are given in table 5. Of these 65 particle-size anal yses, 33 were analyzed in a distilled-water settling medium. The remaining 32 were analyzed in a native-water settling medium. The distilled water, with a chemical dispersing agent added, was used to determine the particle-size distribution of the discrete particles of sediment. The dispersing agent served to promote deflocculation of the silt and clay particles. Analysis of samples in the native-water medium was intended to partially preserve the particle-size characteristics of the sediment as they might occur in the natural setting. Results of distilled-water particle- size analyses of the inflow samples indicated an average particle- size distribution of 4 percent sand, 38 percent silt, and 58 percent clay. The percentages of sand, silt, and clay in the inflow analyses are shown in figure 7, along with definitions of the size ranges included for sand, silt, and clay.
Flocculation occurred in the native-water settling medium in the laboratory. Analyses in native water indicated an average reduction of 15 percent clay, and an equal increase in percentage of silt when compared with their distilled-water counterparts. A clue to the cause of this flocculation is offered by the chemical- quality analyses of the native water, the results of which are

HOCKING RIVER SUBWATERSHED 1, OHIO 115
EXPLANATION
Inflow
+ Outflow
;' V V V \ v V /
$ % * <o -o °
PERCENTAGE OF SAND (0.062-2.00 MILLIMETERS)
FIGURE 7. Percentage of sand, silt, and clay in suspended sediment of inflow and outflow, reservoir 1.
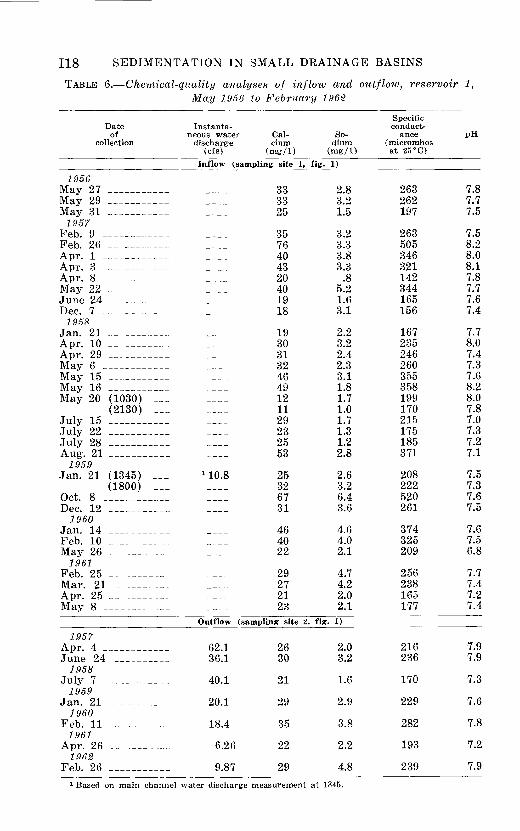
shown in table 6. A high calcium-sodium ratio in water will cause flocculation of soil colloids, and water with a low calcium-sodium ratio will tend to disperse soil colloids (Rainwater and Thatcher, 1960, p. 127, 265). The average calcium-sodium ratio in the 34 chemical analyses shown in table 6 is 11 to 1. Calcium concentra tions generally ranged from about 10 to 70 mg/1, sodium ranged from about 1 to 5 mg/1, and specific conductance ranged from about 140 to 520 micromhos. Under these conditions and with a calcium-sodium ratio in the native water of 11 to 1, the discrete clay particles tend to flocculate and acquire sedimentation char acteristics of larger particles.
The precise amount of flocculation in the inflow water of reser voir 1 could not be determined because natural factors such as turbulence and temperature conditions, both important in sedi mentation processes in the reservoir, were not duplicated in the laboratory. However, it can be stated that flocculation occurred in the inflow samples. The deposited sediments would likely con tain some of these floccules.

TABL
E 5
. P
arti
cle-
size
an
alys
es
of
susp
ende
d se
dim
ent,
inf
low
to
res
ervo
ir 1
[Met
hods
of
anal
ysi
s:
B,
bott
om
-wit
hdra
wal
tu
be;
C
, ch
emic
ally
dis
per
sed;
N,
in
nat
ive
wate
r;
S,
siev
e;
W,
in
dis
till
ed
wat
er.
Sam
pli
ng
si
te
1,
fig.
1]
Sus
pend
ed
sed
imen
t
Dat
e of
co
llec
tion
1956
May
27
May
27
May
29
May
29
May
31
May
31
1957
Feb
. 9
Feb
. 9
Feb
. 26
Feb
. 26
Ap
r.
1A
pr.
1
Apr.
3
Ap
r.
3A
pr.
8
Apr.
8
May
22
May
22
June
24Ju
ne
24D
ec.
7D
ec.
7
1958
Jan
. 21
Apr.
10
Ap
r.
10A
pr.
29
Apr.
29
May
6
May
6
May
15
May
15
May
16
Tim
e
1400
1400
1900
1900
2200
2200
1800
1800
0900
0900
1800
1800
1800
1800
0600
0600
0600
0600
0800
0800
1500
1500
1700
1700
1700
0845
0845
1630
1630
1730
1730
1730
Conce
n
trati
on
(mg/1
)
288
288
1,55
01,
550
1,50
01,
500
658
658
938
938
464
464
598
598
736
736
2,12
02,
120
818
818
760
760
1,50
01,
500
352
352
733
733
1,29
01,
290
1,66
0
Per
cent
fin
er th
an
indic
ated
siz
e,
0.00
2
52 46 58 43 33 25 84 64 21 3 68 41 65 36 78 75 35 11 72 50 44 21 46 36 27 43 34 37 25 57 22 42
0.00
4
64 58 79 58 42 36 90 93 28 7 76 58 73 60 86 86 49 20 88 96 55 33 56 46 38 58 47 50 37 69 37 55
0.00
8
77 80 95 80 52 54 95 97 37 16 82 78 81 72 91 92 61 30 96 96 68 53 69 59 53 71 68 63 56 86 65 64
0.01
6
88 91 99 99 72 74 97 97 54 36 90 89 88 82 96 96 77 51 98 99 80 80 82 75 74 86 90 82 81 95 96 82
0.03
1
92 94 99 100 81 90 97 98 76 74 96 95 94 90 98 98 93 87 99 99 89 91 91 91 90 95 97 95 96 97 99 95
in
mil
lim
eter
s
0.06
2
94 96 100 97 97 98 98 94 91 98 98 98 97 99 99 98 98 100 99 97 97 96 95 95 98 99 97 98 99 99 98
0.12
5
96 97 99 99 98 98 98 97 99 99 100 98 100
100
100
100
100
99 99 98 98 98 100
100 99 100
100
100
100
0.25
0
98 100
100
100 99 99 99 99 100
100 98 _ 100
100
100 99 99 100 _ _
0.50
0
100
100
100
100
100 ....
100
ibb
100
Met
ho
d
of
anal
ysi
s
SB
WC
SE
NS
BW
CE
NS
BW
CS
EN
SB
WC
SE
NS
BW
CS
EN
SB
WC
SE
NS
BW
CS
EN
SB
WC
SE
NS
BW
CS
EN
SB
WC
SE
NS
BW
CS
EN
SB
WC
SB
WC
SE
NS
BW
CS
EN
SB
WC
SE
NS
BW
CS
EN
SB
WC
SEDIM 1 1-3 p> l_3 > I o z t t
^ CO s tr1
" O fj r*
IT* Q ra W CQ > i
"71,
CQ

May
16
May
20
May
20
May
20
May
20
July
15
July
22
July
22
July
28
July
28
Aug
. 21
Aug
. 21
1959
Jan
. 21
Jan
. 21
Jan
. 21
Jan
. 21
Oct
. 8
Dec
. 12
Dec
. 12
1960
Jan
. 14
Jan
. 14
Feb
. 10
Feb
. 10
May
26
May
26
1961
Feb
. 25
Feb
. 25
Mar
. 21
Mar
. 21
Apr
. 25
Apr
. 25
May
8
May
8
1730
1030
1030
2130
2130
2000
1645
1645
1715
1715
1730
1730
*134
5H
345
1800
1800
1630
0900
0900
2115
2115
1500
1500
2100
2100
1510
1510
0910
0910
1310
1310
0735
0735
1,66
02,
260
2,26
03,
460
3,46
04,
120
2,04
02,
040
6,26
06,
260
773
773
351
351
10,6
0010
,600 15
450
250
2
413
413
2,49
02,
490
2,78
02,
780
1,12
01,
120
1,04
01,
040
1,62
01,
620
5,12
05,
120
13 51 34 33 25 42 36 19 31 17 49 20 47 39 30 11 86 54 41 46 21 31 18 61 55 51 26 58 25 40 15 30 13
21 64 47 43 35 57 45 32 41 26 61 33 55 54 36 23 87 60 57 59 38 40 27 77 70 63 32 69 41 49 25 38 20
39 80 67 54 50 68 60 51 55 42 77 60 67 65 53 35 95 72 71 70 57 51 43 89 88 76 52 79 67 60 42 49 32
73 93 88 65 67 84 72 72 72 63 90 93 79 81 71 53 97 86 90 85 81 66 59 95 94 90 79 90 87 73 56 64 46
97 98 97 77 81 95 91 90 88 88 96 96 93 93 84 80 99 92 96 97 97 82 81 98 98 97 94 95 91 94 81 81 66
98 99 99 82 82 98 96 96 95 95 98 98 96 97 93 92 99 96 98 99 100 92 89 99 99 99 95 99 92 94 86 90 80
99 100
100 88 88 100 99 99 99 99 99 99 99 99 98 98 100 99 99 100 98 96 100
100
100
100
100
100
100 96 96 92
100
....
....
96
100
96
100
100
....
100
100
100
100
100
100
100
100
100
100
100
ibo
100 ....
.... ....
_10
0 99
100
98
100
SE
NS
BW
CS
EN
SB W
OS
EN
SB
WC
SB
WC
SE
NS
BW
CS
EN
SB
WC
SE
N
SB
WC
SE
NS
BW
CS
EN
SE
NS
BW
CS
EN
SB
WC
SE
NS
BW
CS
EN
SB
WC
SE
N
SB
WC
SE
NS
BW
CS
EN
SB
WC
SE
NS
BW
CS
EN
w 0 o i i o ?o 5 1^1 s ?o 05 d w ^H
t^ h-J M W CQ w M O ^j-1
O W i i 0
*Wat
er d
isch
arge
equ
al t
o 1
0.8
cubi
c fe
et p
er s
econ
d.
118 SEDIMENTATION IN SMALL DRAINAGE BASINS
TABLE 6. Chemical-quality analyses of inflow and outflow, reservoir 1, May 1956 to February 1962
Dateof
collection
Instanta neous water
discharge (cfs)
Cal cium
(mg/1)
So dium
(mg/1)
Specific conduct>
ance(micromhos at 25°C)
PH
Inflow (sampling site 1, fig' 1)
1956May 27 _______ __ 33 2.8 263 7.8May 29 _______ __ 33 3.2 262 7.7May 31 _______ __ 25 1.5 197 7.5
1957Feb. 9 ________ __ 35 3.2 263 7.5Feb. 26 _______ __ 76 3.3 505 8.2Apr. 1 ________ __ 40 3.8 346 8.0Apr. 3 ________ __ 43 3.3 321 8.1Apr. 8 ________ __ 20 .8 142 7.8May 22 _______ __ 40 5.2 344 7.7June 24 _______ __ 19 1.6 165 7.6Dec. 7 ________ __ 18 3.1 156 7.41958
Jan. 21 _______ __ 19 2.2 167 7.7Apr. 10 _______ __ 30 3.2 235 8.0Apr. 29 _______ __ 31 2.4 246 7.4May 6 ________ __ 32 2.3 260 7.3May 15 _______ __ 46 3.1 355 7.6May 16 _______ __ 49 1.8 358 8.2May 20 (1030) _ __ 12 1.7 199 8.0
(2130) _ __ 11 1.0 170 7.8July 15 _______ __ 29 1.7 215 7.0July 22 _______ __ 23 1.3 175 7.3July 28 _______ __ 25 1.2 185 7.2Aug. 21 _______ __ 53 2.8 371 7.11959
Jan. 21 (1345) _ x 10.8 25 2.6 208 7.5(1800) _ __ 32 3.2 222 7.3
Oct. 8 ________ _ 67 6.4 520 7.6Dec. 12 _______ __ 31 3.6 261 7.51960
Jan. 14 ______ __ 46 4.6 374 7.6Feb. 10 _______ __ 40 4.0 325 7.5May 26 _______ __ 22 2.1 209 6.81961
Feb. 25 _______ __ 29 4.7 256 7.7Mar. 21 ______ __ 27 4.2 238 7.4Apr. 25 _______ __ 21 2.0 165 7.2May 8 ________ __ 23 _____2.1______177______7.4_____________________Outflow (sampling site 2, fig. 1)_____________________
1957Apr. 4 ________ 62.1 26 2.0 216 7.9 June 24 ______ 36.1 30 3.2 236 7.91958
July 7 ________ 40.1 21 1.6 170 7.31959
Jan. 21 _______ 20.1 29 2.9 229 7.61960
Feb. 11 _______ 18.4 35 3.8 282 7.81961
Apr. 26 _______ 6.26 22 2.2 193 7.21962
Feb. 26 _______ 9.87 29 4.8 239 7.9
1 Based on main channel water discharge measurement at 1345.
HOCKING RIVER SUBWATERSHED 1, OHIO 119
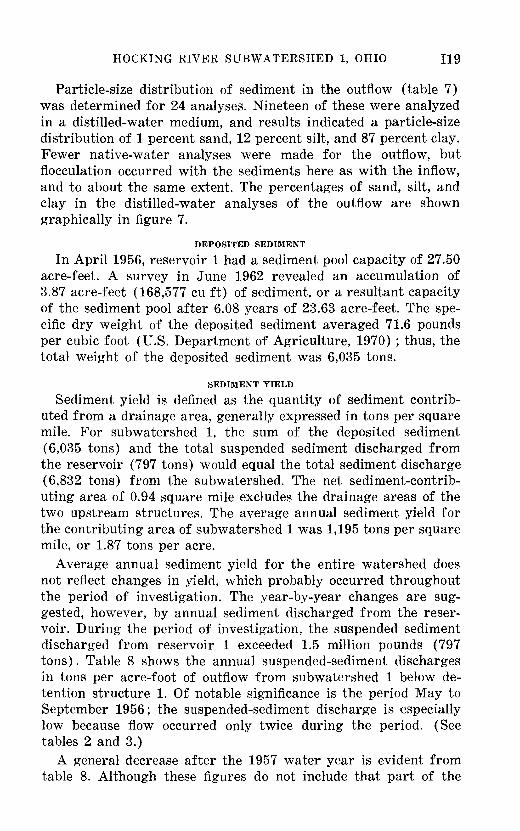
Particle-size distribution of sediment in the outflow (table 7) was determined for 24 analyses. Nineteen of these were analyzed in a distilled-water medium, and results indicated a particle-size distribution of 1 percent sand, 12 percent silt, and 87 percent clay. Fewer native-water analyses were made for the outflow, but flocculation occurred with the sediments here as with the inflow, and to about the same extent. The percentages of sand, silt, and clay in the distilled-water analyses of the outflow are shown graphically in figure 7.
DEPOSITED SEDIMENT
In April 1956, reservoir 1 had a sediment pool capacity of 27.50 acre-feet. A survey in June 1962 revealed an accumulation of 3.87 acre-feet (168,577 cu ft) of sediment, or a resultant capacity of the sediment pool after 6.08 years of 23.63 acre-feet. The spe cific dry weight of the deposited sediment averaged 71.6 pounds per cubic foot (U.S. Department of Agriculture, 1970) ; thus, the total weight of the deposited sediment was 6,035 tons.
SEDIMENT YIELD
Sediment yield is defined as the quantity of sediment contrib uted from a drainage area, generally expressed in tons per square mile. For subwatershed 1, the sum of the deposited sediment (6,035 tons) and the total suspended sediment discharged from the reservoir (797 tons) would equal the total sediment discharge (6,832 tons) from the subwatershed. The net sediment-contrib uting area of 0.94 square mile excludes the drainage areas of the two upstream structures. The average annual sediment yield for the contributing area of subwatershed 1 was 1,195 tons per square mile, or 1.87 tons per acre.
Average annual sediment yield for the entire watershed does not reflect changes in yield, which probably occurred throughout the period of investigation. The year-by-year changes are sug gested, however, by annual sediment discharged from the reser voir. During the period of investigation, the suspended sediment discharged from reservoir 1 exceeded 1.5 million pounds (797 tons). Table 8 shows the annual suspended-sediment discharges in tons per acre-foot of outflow from subwatershed 1 below de tention structure 1. Of notable significance is the period May to September 1956; the suspended-sediment discharge is especially low because flow occurred only twice during the period. (See tables 2 and 3.)
A general decrease after the 1957 water year is evident from table 8. Although these figures do not include that part of the

CO o
TABL
E 7.
Par
ticl
e-si
ze
anal
yses
of
su
spen
ded
sedi
men
t, o
utfl
ow fr
om
res
ervo
ir 1
[Met
hods
of
an
aly
sis:
B
, bo
ttom
-wit
hdra
wal
tu
be;
C
, ch
emic
ally
di
sper
sed;
N
, in
nat
ive
wat
er;
S,
siev
e;
W,
in d
isti
lled
wat
er.
Sam
plin
g si
te 2
, fi
gure
1]
Sus
pend
ed
sedi
men
tD
ate
of
coll
ecti
on
1957
Apr
. 1
Apr
. 4
Apr
. 4
Apr
. 4
Apr
. 8
Apr
. 8
Jun
e 24
Jun
e 24
Dec
. 20
1958
Jun
e 14
July
7
1959
Jan
. 21
Jan.
21Ja
n.
2119
60F
eb.
11F
eb.
11F
eb.
1319
61A
pr.
26A
pr.
26M
ay
8A
ug.
1419
62Ja
n.
22F
eb.
26F
eb.
26
Tim
e
1800
1200
1300
1800
0600
1400
0800
1200
0855
1000
0700
1220
1220
1725
0500
1615
2035
0950
0950
0930
1145
0925
1345
1345
Dis
ch
arg
e (c
fs)
3.74
43.0
62.1
61.2 1.32
9.51
41.9
28.9 9.51
27.5
40.1
20.1
20.1
20.8
18.5
18.4
16.0 6.26
6.26
65.5 .9
8
30.0 9.87
9.87
Con
cen
tr
atio
n
(mg/1
)
147
422
686
534
198
246
968
629
207
458
467
347
347
346
329
292
280
259
259
892 54 107
175
175
Per
cent
fine
r th
an
indi
cate
d si
ze,
0.00
2
74 71 67 73 80 68 62 73 88 86 75 74 60 60 82 70 92 87 55 62 87 76 81 31
0.00
4
83 84 80 86 87 78 77 91 94 96 91 84 81 75 91 88 94 98 72 76 93 89 94 54
0.00
8
90 94 92 94 93 84 89 96 95 98 97 91 93 83 95 98 96 99 94 90 97 99 99 85
0.01
6
93 97 97 98 96 90 95 98 99 99 97 93 94 87 97 99 98 99 97 99 98 100
100 99
0.03
1
97 98 99 99 97 93 97 99 100
100 98 96 97 91 99 99 99 100 99 100 99 99
in
mil
lim
eter
s
0.06
2 0.
125
0.25
0
98
100
99
99
100
99
100
99
100
98
99
100
96
97
100
98
98
*99
100
100
.".'.'."
."."."."
100
100
100
100
100
100
ibb
"".
....ib
b ....
....
ibb
.""
....
Met
hods
of
an
alys
is
SB
WC
SB
WC
SB
WC
SB
WC
SB
WC
SB
WC
SB
WC
SB
WC
BW
C
BW
CB
N
BW
CB
NB
WC
BW
CB
NB
WC
BW
CB
NB
WC
BW
C
BW
CB
WC
BN
W W O f
O O
W
*Per
cent
age
of p
arti
cles
fin
er t
han
0.5
mil
lim
eter
s is
100
.

HOCKING RIVER SUBWATERSHED 1, OHIO 121
TABLE 8. Suspended-sediment discharge in outflow from reservoir 1
Sediment Period , in
outflow (tons per acre-ft)
May to Sect. 1956 ______________________________ 0.06Oct. 1956 to Sept. 1957 ____________________________ .45Oct. 1957 to Sept. 1958 ____________________________ .37Oct. 1958 to Sept. 1959 ____________________________ .34Oct. 1959 to Sept. 1960 ____________________________ .15Oct. 1960 to Sept. 1961 ____________________________ .16Oct. 1961 to May 1962 ____________________________ .10
Average ________________________________ .26
sediment which was trapped in the reservoir, the values in the table indicate that the sediment yield from the subwatershed above detention structure 1 probably decreased. The decline in cultivation and the increasing effectiveness of conservation prac tices before and during the period of investigation no doubt caused a decrease in sediment yield.
TRAP EFFICIENCY OF RESERVOIR 1
The trap efficiency of a reservoir is the percentage of the sedi ment inflow that is retained by the reservoir. Trap efficiency can be computed by the equation:
A TE= xlOO
where TE = trap efficiency of the reservoir, in percent,A = weight of sediment (tons) retained by the reservoir,
andB = weight of sediment (tons) inflow into the reservoir.
The trap efficiency of reservoir 1 is 88 percent. This is about 9 percent below the estimated figure based on the capacity-inflow ratio method given by Brune (1953, p. 414). The upstream struc tures in the subwatershed probably trap many of the coarser sedi ments from 10 percent of the drainage area. They probably af fected the particle-size distribution of sediment entering reservoir 1 by decreasing the proportion of coarser particles. Had the struc tures not been present, a larger percentage of inflowing sediment might have been trapped by reservoir 1.
CONCLUSIONS
Based on the 6.08 years of study of fluvial sediments of sub- watershed 1, the following conclusions are made: 1. Outflow from reservoir 1 during the study period occurred
only 41 percent of the total time during 40 separate flow
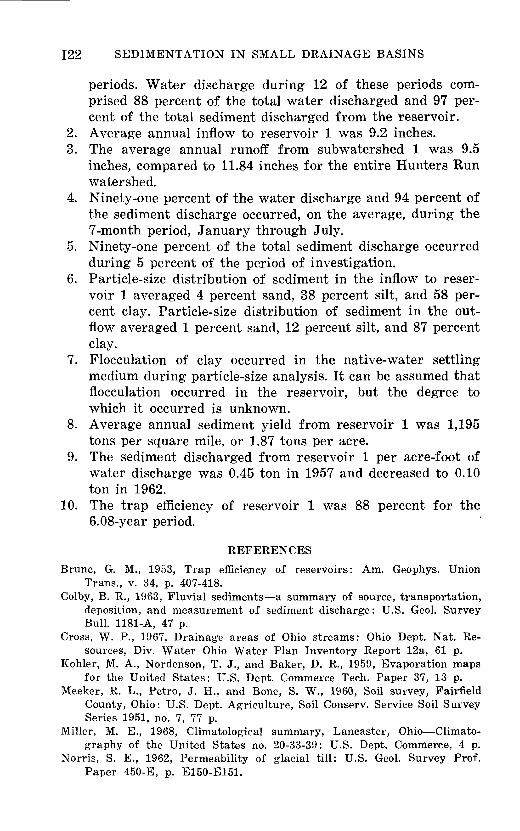
122 SEDIMENTATION IN SMALL DRAINAGE BASINS
periods. Water discharge during 12 of these periods com prised 88 percent of the total water discharged and 97 per cent of the total sediment discharged from the reservoir.
2. Average annual inflow to reservoir 1 was 9.2 inches.3. The average annual runoff from subwatershed 1 was 9.5
inches, compared to 11.84 inches for the entire Hunters Run watershed.
4. Ninety-one percent of the water discharge and 94 percent of the sediment discharge occurred, on the average, during the 7-month period, January through July.
5. Ninety-one percent of the total sediment discharge occurred during 5 percent of the period of investigation.
6. Particle-size distribution of sediment in the inflow to reser voir 1 averaged 4 percent sand, 38 percent silt, and 58 per cent clay. Particle-size distribution of sediment in the out flow averaged 1 percent sand, 12 percent silt, and 87 percent clay.
7. Flocculation of clay occurred in the native-water settling medium during particle-size analysis. It can be assumed that flocculation occurred in the reservoir, but the degree to which it occurred is unknown.
8. Average annual sediment yield from reservoir 1 was 1,195 tons per square mile, or 1.87 tons per acre.
9. The sediment discharged from reservoir 1 per acre-foot of water discharge was 0.45 ton in 1957 and decreased to 0.10 ton in 1962.
10. The trap efficiency of reservoir 1 was 88 percent for the 6.08-year period.
REFERENCES
Brune, G. M., 1953, Trap efficiency of reservoirs: Am. Geophys. UnionTrans., v. 34, p. 407-418.
Colby, B. R., 1963, Fluvial sediments a summary of source, transportation,deposition, and measurement of sediment discharge: U.S. Geol. SurveyBull. 1181-A, 47 p.
Cross, W. P., 1967, Drainage areas of Ohio streams: Ohio Dept. Nat. Re sources, Div. Water Ohio Water Plan Inventory Report 12a, 61 p.
Kohler, M. A., Nordenson, T. J., and Baker, D. R., 1959, Evaporation mapsfor the United States: U.S. Dept. Commerce Tech. Paper 37, 13 p.
Meeker, R. L., Petro, J. H., and Bone, S. W., 1960, Soil survey, FairfieldCounty, Ohio: U.S. Dept. Agriculture, Soil Conserv. Service Soil SurveySeries 1951, no. 7, 77 p.
Miller, M. E., 1968, Climatological summary, Lancaster, Ohio Climato-graphy of the United States no. 20-33-39: U.S. Dept. Commerce, 4 p.
Norris, S. E., 1962, Permeability of glacial till: U.S. Geol. Survey Prof.Paper 450-E, p. E150-E151.
HOCKING RIVER SUBWATERSHED 1, OHIO 123
Rainwater, F. H., and Thatcher, L. L., 1960, Methods for collection and analysis of water samples: U.S. Geol. Survey Water-Supply Paper 1454, 301 p.
U.S. Department of Agriculture, 1970, Reservoir data summary, Upper Hocking No. 1: U.S. Soil Conservation Service, 2 p.
U.S. Department of Commerce, 1956-62, Hourly precipitation data, annual summaries for Ohio: U.S. Weather Bureau.
U.S. Geological Survey, 1961, Surface water records of Ohio, 1961: Colum bus, Ohio, Water Resources Division, 190 p.
1962, Surface water records of Ohio, 1962: Columbus, Ohio, Water Resources Division, 190 p.
1964, Compilation of records of surface waters of the United States October 1950 to September 1960, Part 3-A, Ohio River basin except Cumberland and Tennessee River basins: U.S. Geol. Survey Water- Supply Paper 1725, 560 p.
U. S. GOVERNMENT PRINTING OFFICE : 1972 O - 467-532
Copyright © 2022 FDOKUMEN