Discrimination of illumination and reflectance changes on color constancy

Journal of Hydrology 382 (2010) 49–63
Contents lists available at ScienceDirect
Journal of Hydrology
journal homepage: www.elsevier .com/ locate / jhydrol
The use of sediment colour measured by diffuse reflectance spectrometry todetermine sediment sources: Application to the Attert River catchment(Luxembourg)
Núria Martínez-Carreras a,*, Thomas Udelhoven a, Andreas Krein a, Francesc Gallart b, Jean F. Iffly a,Johanna Ziebel a, Lucien Hoffmann a, Laurent Pfister a, Desmond E. Walling c
a Centre de Recherche Public-Gabriel Lippmann, Department of Environment and Agro-Biotechnologies, 41 rue du Brill, L-4422 Belvaux, Luxembourgb Institute of Environmental Assessment and Water Research (IDÆA), CSIC, Lluis Solé Sabarís s/n, E-08028 Barcelona, Spainc School of Geography, Archaeology and Earth Resources, University of Exeter, Amory Building, Rennes Drive, Exeter EX4 4RJ, United Kingdom
a r t i c l e i n f o s u m m a r y
Article history:Received 6 July 2009Received in revised form 13 November 2009Accepted 11 December 2009
This manuscript was handled by P. Baveye,Editor-in-Chief, with the assistance ofMagdeline Laba, Associate Editor
Keywords:Particle colourSuspended sediment sourcesDiffuse reflectance spectrometrySediment fingerprintingSediment source tracingLuxembourg
0022-1694/$ - see front matter � 2009 Elsevier B.V. Adoi:10.1016/j.jhydrol.2009.12.017
* Corresponding author. Tel.: +352 47 02 61; fax: +E-mail address: [email protected] (N. M
Colour coefficients measured by diffuse reflectance spectrometry were used to quantify suspended sed-iment sources using the fingerprinting approach. The investigations were undertaken in the Attert Rivercatchment (NW Luxembourg), where time-integrated suspended sediment samples and samples ofpotential sediment sources (topsoil and channel bank samples) were collected, in order to test the abilityof colour to provide a fingerprint property for sediment source tracing. Sediment colour coefficients werecomputed from diffuse reflectance spectrometry measurements (ASD FieldSpec-II spectrometer, 0.4–2.5 lm) taken over the visible wavelength range. The linearly additive behaviour of these colour coeffi-cients, which is an important requirement for its use in the mixing models, was tested in the laboratoryby means of artificial mixtures. Model prediction uncertainty associated with the spatial variability ofsource tracer properties was assessed using an inclusive approach to mixing models based on Bayesianerror estimation and employing Monte-Carlo simulation. The results provided by the colour measure-ments were compared with those obtained using the classical fingerprinting approach in the same catch-ments (i.e. using geochemical, radionuclide and organic tracers). Even though neither of the twoapproaches is definitive, and the results involve considerable uncertainty, the consistency between theapproaches encouraged the extension of the approach to include measurements on the particles retainedon glass fibre filters. This permitted use of small samples collected by an automatic sampler to investigatesource variability during a storm runoff event. Preliminary results obtained using this approach demon-strated that colour provides a useful property for use in sediment source fingerprinting investigations,which is both fast and easy to measure. It also provides a rapid and cheap means of investigating hill-slope-to-channel coupling and the transfer of eroded material during storm runoff events, even at lowconcentrations. High spatial and temporal variability of the characteristics of suspended particles wasobserved. The use of sediment colour measured by diffuse reflectance spectrometry is seen to representa useful development, in terms of reducing analytical costs associated with composite fingerprintingprocedures.
� 2009 Elsevier B.V. All rights reserved.
Introduction
Due to the many environmental problems linked to the trans-port of suspended sediment by rivers (e.g. siltation of dams, reser-voirs and channels, transport of nutrients and contaminants anddegradation of aquatic habitats), there is increasing interest inidentifying suspended sediment sources, in order to implementeffective sediment and diffuse source pollution control strategies.However, given the spatial and temporal complexity of sediment
ll rights reserved.
352 47 02 64.artínez-Carreras).
mobilisation and delivery, the use of traditional approaches forinvestigating suspended sediment sources is typically constrainedby problems of representativeness and cost (Collins and Walling,2004).
Against this background, the sediment fingerprinting approachhas gained increasing attention as a means of establishing sus-pended sediment sources, and it has now been applied in numer-ous studies in many different areas of the world (Walling, 2005).The technique uses the distinct fingerprints or signatures of the po-tential sources to determine their relative contribution to themixed signature associated with a suspended sediment sample(Walling et al., 1993; Collins et al., 1998). The methodology is

50 N. Martínez-Carreras et al. / Journal of Hydrology 382 (2010) 49–63
based on the assumption that the properties or fingerprints of sus-pended sediment can be directly compared with the equivalentproperties of the materials identified as potential sources. An effec-tive tracer or fingerprint property should be capable of differenti-ating between potential sources, exhibit conservative behaviourduring erosion and transport (Foster and Walling, 1994) and exhi-bit linearly additive behaviour during mixing (Lees, 1997). Previ-ous studies have demonstrated the potential of a range of tracersfor discriminating fine sediment sources, including geochemistry(Foster and Walling, 1994; Collins et al., 1998), mineralogy (Eismaet al., 1993; Merefield, 1995), mineral magnetism (Walling et al.,1979; Walden and Slattery, 1997), radionuclide activity (Wallingand He, 1994; Walling et al., 2000), biogenic properties (Peart,1993), and physical properties (Peart and Walling, 1986; Higgittand Walling, 1993). However, it is now accepted that no singlediagnostic property of sediment can reliably distinguish severalsources (Walling et al., 1993; Lees and Pethick, 1995). Compositefingerprints, comprising several tracer properties, are thereforenow commonly used to discriminate between potential sedimentsources (Walling and Woodward, 1995; He and Owens, 1995; Col-lins et al., 1998). However, despite the increasing number of stud-ies that have employed the fingerprinting approach, there are atpresent no generic guidelines for pre-selecting the most usefulcombinations of tracers for discriminating sediment sources in dif-ferent catchments (Foster and Lees, 2000; Collins and Walling,2004). Consequently, the most efficient means of optimising sedi-ment source discrimination is generally to select a range of possi-ble fingerprint tracers from a number of groups of properties andtest their ability to discriminate the potential sources identified,before finally selecting the optimum group of properties to includein the composite fingerprint (Collins and Walling, 2002). The needfor costly laboratory analysis of potential sources materials for awide range of properties can make fingerprinting exercises highlylabour-intensive and costly to undertake.
This contribution attempts to address this constraint by explor-ing the potential for employing a easily derived colour coefficientsas fingerprint properties. Previous attempts to use colour to iden-tify sediment sources have relied on the Munsell soil colour chartsto define soil and sediment colour visually (DeBoer, 1997; Grim-shaw and Lewin, 1980; Peart, 1993; Phillips and Marion, 2001).However, the approach involves a number of important limita-tions, because the values obtained do not represent a continuousphysical variable suitable for use in a mixing model and theymay be influenced by variables independent of soil/sediment prop-erties. For example, Post et al. (1993) showed that soil scientistsagreed on the same colour chip components only 52% of the time.Such operator variance can result in serious errors in the applica-tion of soil colour criteria in soil classification (Shields et al.,1966). More recently, Udelhoven et al. (1997) and Krein et al.(2003) measured the colour of suspended sediment transportedduring low flow conditions more objectively, by scanning (normalcolour scanner) the dry residue retained on a glass fibre filter usedto filter a known volume of river water. Those studies concludedthat particle colour was a valuable parameter for examining varia-tions in suspended particle characteristics even at very low con-centrations. Spectrometers and chromameters permit morephysically-based characterization of soil and sediment colour andthus the use of colour coefficients not only as a qualitative descrip-tor, but also as a quantitative measure for both describing sus-pended sediment particles and identifying their sources(Udelhoven and Symader, 1995).
Soil colour also carries important information regarding thechemical and physical properties of a soil (Levin et al., 2005), sincethe spectral characteristics of the soil are determined by thoseproperties (Ben-Dor, 2002). Previous studies have demonstratedthat organic matter, water molecules, iron oxides, carbonates and
the chemical composition of transition metals contained in clayminerals are the major chemical components affecting soil colour.Grain size, as a physical chromophore, also plays an important rolein affecting colour (Ben-Dor et al., 1998). Despite its pedologicalsignificance, precise methods to measure soil colour and soil reflec-tance properties, especially under field conditions, have not beenwidely adopted (Melville and Atkinson, 1985; Post et al., 1993).
The main purposes of the study described in this contributionwere: (i) to develop a colour-based fingerprinting approach forinvestigating suspended sediment sources in the Attert River basinin Luxembourg using time-integrated suspended sediment sam-ples; (ii) to compare the results of the colour-based fingerprintingapproach with the classical fingerprinting approach (i.e. using geo-chemical, organic and radionuclide sediment fingerprint proper-ties); and (iii) to explore the possibility of using colourmeasurements on small amounts of sediment obtained frominstantaneous samples and retained on glass fibre filters to inves-tigate both source variability during runoff events and the sourceof sediment transported during low flow conditions, when sus-pended sediment concentrations are low. For these purposes, col-our coefficients (CIE, 1931) were computed from diffusereflectance spectrometry measurements and used as fingerprints.The uncertainty associated with the use of a mixing model toestablish the relative contribution of a set of potential sources toa sediment sample was also assessed.
The study areas and their sediment sources
The Weierbach (0.7 km2), the Huewelerbach (2.7 km2), and theWollefsbach (4.4 km2) experimental catchments were selected asstudy sites (Fig. 1). These were seen as being representative ofthe main physiographical characteristics of Luxembourg. Theyare sub-catchments of the Attert River basin (290.1 km2, outlet atBissen), which is located in the NW of the Grand Duchy of Luxem-bourg. The Attert River is one of the main left bank tributaries ofthe Alzette River, which drains most of the southern part of thecountry.
The mean annual rainfall for the study area (1971–2000) is esti-mated to be 845 mm (Pfister et al., 2005). There is no major sea-sonal difference in monthly rainfall totals. Mean monthlytemperatures are characterized by a maximum of about 18 �C inJuly and a minimum of 0 �C in January. Air temperatures below0 �C at 2 m above ground typically occur approx. 80 days per year(1971–2000 mean). The hydrological regime is pluvial oceanic,with low flows observed from July to September due to high sum-mer evapotranspiration, while high flows occur from December toFebruary (Salvia-Castellví et al., 2005), when evapotranspiration isat its lowest. Due to the different physiographic characteristics ofthe three study catchments (e.g. different size, land cover and geol-ogy) important contrasts exist in their hydrological and sedimen-tological regimes (see Table 1).
The Weierbach catchment is underlain by schist and it is mainlyforested (85% of the surface area). The altitude ranges from 422 to512 m a.s.l., and the mean slope is 5.25�. Although the schist bed-rock is relatively impermeable, surface runoff only occurs duringintensive rainfall events, indicating high surface infiltration ratesand/or storage capacity of the soils (Van den Bos et al., 2006). Run-off is dominated by delayed groundwater flow, supplied by theweathered shale (Krein et al., 2007), which is sensitive to seasonalfluctuations in groundwater storage, and flow ceases during dryperiods. The main stream flows from north to southeast and thechannel width is normally lower than 1 m. During storm runoffevents storage areas of fine sediments are scoured and sedimentis redeposited over a few days.

Fig. 1. The location of the Weierbach, the Huewelerbach and the Wollefsbach catchments, their land use and the location of suspended sediment, surface soil and channelbank sampling points within the catchment.
N. Martínez-Carreras et al. / Journal of Hydrology 382 (2010) 49–63 51
The thin soils developed on the schists of the Weierbach catch-ment constrain the land use in the catchment: the slopes of thevalleys are mainly covered with forest, whereas the plateauxmainly support cultivated land (14% of the surface area). However,field surveys have demonstrated a complete disconnection be-tween the cultivated areas and the stream network. Selective cut-ting occurs in the catchment throughout the year and a densenetwork of unmetalled roads has been developed to facilitate ac-cess to the forest areas. In this catchment, the primary sources ofsuspended sediment comprise the forest topsoil, the channel banksand unmetalled roads. One road, parallel to the stream, has beenobserved to be subject to erosion after major rainfall events.
The Huewelerbach catchment is underlain predominantly byLuxembourg sandstone. It is mainly covered by forest (93% of thesurface area), but grassland dominates in the alluvial areas (6% ofthe surface area). The altitude ranges from 289 to 401 m a.s.l.,and the mean slope is 3.85�. The stream bed (<1 m width) is man-tled by large amounts of fine sand, which is easily transported dur-ing runoff events. Previous studies have demonstrated that thesandstone bedrock maintains a very stable base flow regime, withwinter discharge peaks being mainly caused by saturated overlandflow generated from the alluvial zones (Pfister et al., 2006). Selec-tive cutting is again practiced throughout the year. Channel banks,unmetalled forest roads, and grassland and forest topsoils wereidentified as the main potential suspended sediment sources.
The bedrock of the Wollefsbach catchment is predominantlyKeuper sandy marl. The land use is primarily grassland and culti-vated land (65% and 27% of the surface area, respectively). Thereare some areas of forest (7%), but these are mainly located close
Table 1Flow characteristics and specific suspended sediment yield (SSY) for the three study catch
Catchment Area(km2)
Mean discharge(m3�s�1�km�2)
Water yield(hm3)
Weierbacha 0.4 0.018 0.210
Huewelerbach 2.7 0.004 0.390
Wollefsbach 4.4 0.006 0.872
a Water level recorder located upstream of the suspended sediment trap (see Fig. 1).b Based on values of instantaneous suspended sediment concentration (SSC, mg�l�1) a
to the perimeter of the catchment. The altitude ranges from 245to 306 m a.s.l., and the mean slope is 2.53�. Surface water is rapidlycollected by a dense surface drainage system. This results in a fla-shy runoff regime. However, since the slopes are gentle, some sig-nificant surface and sub-surface storage is likely (Van den Boset al., 2006). A dense sub-surface drainage system extends overthe entire cultivated area, but its exact layout is unknown and itis difficult to estimate its influence on discharge (Pfister et al.,2006) and sediment transport. The main stream flows from westto east. Field visits provided visible evidence of eroding streamchannels. After several field inspections during storm events, chan-nel banks, and the surface of areas under cultivation, grassland andforest were identified as potential suspended sediment sources.
Methods
Suspended sediment sampling
Stream water was sampled at frequent intervals during floods(1–3 h) and less frequently during low flows (2–4 days) by meansof automatic water samplers (ISCO 6712 FS). Samplers contained24 bottles (1 L) and were linked to the recording stream gauges.While sampling was triggered by flow conditions, the control func-tion was seasonally adjusted. Sampling points were fix and locatedapproximately in the middle of the stream and of the base flowwater column. A good correlation existed (n = 5, r2 > 0.8) betweensuspended sediment concentration (SSC) measured on manualdepth-integrated and automatic single point samples in the threestudied catchments.
ments in 2006.
Peak discharge(m3�s�1�km�2)
Sediment rating curveb Specific SSY(Mg�km�2)
0.163 SSCi ¼ 184:519 � Q0:607i
22.5
0.050 SSCi ¼ 225:168 � Q0:398i
342.6
0.434 SSCi ¼ 1843:588 � Q0:582i
34.8
nd instantaneous discharge (Q, m�s�1).

52 N. Martínez-Carreras et al. / Journal of Hydrology 382 (2010) 49–63
SSC was determined by filtering a known volume of samplethrough 1.2 lm WHATMAN GF/C glass fibre filters, using a Milli-pore vacuum pump. The filters were first dried at 105 �C andweighed. After filtering the filters were dried again at 105 �C andreweighed.
Bulk samples of suspended sediment were collected duringstorm runoff events over the period October 2005 to February2007, using time-integrated suspended sediment traps (Phillipset al., 2000, Table 2). The grain size composition of the suspendedsediment particle size was predominantly <63 lm in the Weier-bach and Wollefsbach catchments (mean 83% and 89% by weight,respectively), but fine sand was also transported in suspension inthe Huewelerbach catchment (mean 53% by weight <63 lm).
Source material sampling
Source material sampling strategy was based on previousknowledge of the hydrological and erosion processes occurring inthe study catchments. Representative samples of source materialwere collected, ensuring that only material likely to be mobilisedby erosion and to reach the stream network was sampled. Particu-lar attention was given to collecting surface material (top 5 cm)from large areas representative of each source type in differentparts of the study catchments. At each sampling site, five individ-ual samples were collected from a representative area of 25 m2.This material was well mixed to provide a homogeneous sample.Representative samples of sub-surface soils exposed in channelbanks were also collected. The number of samples collected in eachcatchment per source is listed in Table 2. This number was approx-imately proportional to the area occupied by each source (Fig. 1).Even though a small number of samples were collected from theunmetalled roads in the Weierbach catchment, they were includedin the analysis, since previous studies have shown that unmetalledroads can be important sediment sources in agricultural catch-ments (Motha et al., 2004) as well as in mountainous catchments(Ziegler and Giambelluca, 1997). In the same way, just two sampleswere collected from the forest topsoil in the Wollefsbach catch-ment since forest covers only a 7% of the catchment.
It was assumed that source colour values did not vary signifi-cantly over the duration of the investigation, since temporal evolu-tion of soil composition over time is difficult to assess due to thesmall magnitude of the changes and the importance of spatial var-iability. Furthermore, available evidence suggested that source col-our values could be assumed to be conservative during sedimentmobilisation and transport. Colour changes due to chemical reduc-tion associated with sediment storage in stream beds (Phillips andMarion, 2001) were also assumed to be unimportant, since thestudy catchments are highly dynamic small headwater basins.Soils do not have high iron levels and the episodic seasonal flow re-gime of the streams limits storage of fine sediment on the channelbed during delivery to the catchment outlet. Furthermore, both thestreams and the upper hyporheic zone are characterized by highlevels of dissolved oxygen, which limit the potential for reduction.
Table 2Number of samples collected for each potential suspended sediment source and numberduring the monitoring period.
Catchment Area(km2)
Number of potential suspended sediment sources
Cultivatedtopsoil
Foresttopsoil
Grasslandtopsoil
Weierbacha 0.7 – 16 –Huewelerbach 2.7 – 13 6Wollefsbach 4.4 13 2 17
a Suspended sediment trap located downstream of the water level recorder (see Fig. 1
Reduction may occur at greater depths in the hyporheic zone, butsuch sediment is unlikely to be remobilised. In addition, colourmeasurements undertaken on samples of fine sediment recoveredfrom the channel bed at three sampling points per catchment atapproximately monthly intervals during 2006 confirmed the ab-sence of significant intra-annual variability that might reflect pro-gressive change in the colour of stored sediment.
Classical fingerprinting approach analyses
Following Walling and Woodward (1992), all suspended sedi-ment and source material samples were sieved to <63 lm in orderto minimize contrasts in particle size composition betweensamples.
All source material samples (n = 99) and almost all suspendedsediment samples (n = 42, only spectral reading were taken whenthere was not enough material for the rest of the analyses) wereanalysed using ICP-MS (ELAN DRC-e equipped with Dynamic Reac-tion Cell, Perkin Elmer) after HCl/HNO3 (9.0 mL of conc. HCl and3.0 mL of conc. HNO3) microwave digestion (Multiwave 3000, An-ton Paar). The use of a closed vessel microwave assisted digestionsystem under high temperature and pressure permits shorterdigestion times, provides good recoveries and lowers the risk ofcontamination and volatilisation. This procedure provided infor-mation on the concentration of a range of major elements (Al,Mg, Fe, Mn), trace elements (Li, Be, Sc, V, Cr, Co, Ni, Cu, Zn, Ga,As, Rb, Sr, Sn, Sb, Cs, Ba, Pb), rare earth elements (La, Ce, Pr, Nd,Sm, Eu, Gd, Dy, Er, Yb), as well as several actinides (Th, U). TotalC and N were measured directly by pyrolysis using a CE Instru-ments automatic analyser. Total P was determined colorimetricallyafter digestion, following the ascorbic acid method proposed byMurphy and Riley (1962) and using a Beckmann Coulter spectro-photometer. 137Cs and total 210Pb activities were measured bygamma spectrometry (Well-type HPGe detector, e = 25%; N-typeHpGe detector with Be window, e = 43%; LEGe detector (carbon-proxy), e = 41%). Counting times of ca. 86,400 s provided a meanmeasurement precision of ±5.6% for 137Cs and ±8.0% for 210Pb atthe 95% level of confidence.
Colour-based fingerprinting approach analyses
For all source material samples (n = 99) and almost all sus-pended sediment samples (n = 44), spectral readings were takenin 1 nm increments over the 0.4–2.5 lm wavelength range witha spectroradiometer (ASD FieldSpec-II). It was not possible to mea-sure the reflectance of some suspended sediment samples becausethere was not enough material left after the analyses required forthe classical fingerprinting approach. The optical head of the ASDFieldSpec II was mounted on a tripod perpendicular to the measur-ing surface. The distance between the optical head and sample orreference panel (Spectralon) was 10 cm. Both the soil samplesand the reference panel were illuminated with a 1000-W quartz-halogen lamp mounted at a distance of approximately 30 cm, with
of time-integrated suspended sediment samples collected at the study catchments
Number of bulk suspended sedimentsamples
Channelbanks
Unmetalledroads
8 2 169 5 168 – 15
).

N. Martínez-Carreras et al. / Journal of Hydrology 382 (2010) 49–63 53
an illumination angle of 30�. Absolute bidirectional reflectancespectra were obtained by multiplying the raw reflectance spectraby the certified reflectivity of the Spectralon standard. All sampleswere air-dried and sieved prior to measurements in order to obtainreproducible results. Measurement conditions, as well as the lightsource and the detector, were maintained constant.
Spectral readings were also made on the filters previously usedto measure suspended sediment concentration, when they werecompletely covered by sediment. Moreover, a suspended sedimentsample was used to determine the minimum amount of sedimentrequired to give reliable readings. Colour values (chromatic coordi-nate x, y and brightness) were estimated for several filters contain-ing increasing amounts of sediment (up to 120 mg). The results ofthese measurements indicated that values were unreliable for fil-ters supporting less than 60 mg of sediment (Fig. 2), probablydue to the influence of the underlying white filter (Krein et al.,2003). Only filters coated with more than 60 mg were consideredin the rest of the study. These results are in accordance with the re-sults obtained by Krein et al. (2003). Samples collected during therunoff event of the 4th of August 2006 in the Huewelerbach catch-ment were used to illustrate the procedure. This catchment waschosen according to data availability and because all filters werecoated with more than 60 mg of sediment. No significant relation-ship existed between suspended sediment concentration and thecolour parameters measured on the filters.
To identify the wavelengths in the total reflectance spectra(0.4–2 m) showing the highest potential to differentiate betweensediment sources, a multivariate selection criterion was computed.The available spectra for each source type from the Weierbach,Huewelerbach and Wollefsbach catchments were merged (n = 99)and the following groups were considered: cultivated topsoils,grassland topsoils, forest topsoils, channel banks and unmetalledroads. Since pooling the spectra from different catchments in-creased the within class variability of the groups, which constitutesan important property in variance-based selection criteria, thespectra were normalized as follows. Each spectrum is consideredas a vector from which first its length is calculated; then each ofits components (the reflectance values) is divided by the length.Wavelength selection was carried out using a multivariate algo-rithm that is based on covariance analysis combined with thesequential forward selection search strategy (Rauber, 1994; Ude-lhoven et al., 2003). The aim was to rank the spectral informationof each wavelength. The feature selection algorithm involves thefollowing steps: a candidate feature (a wavelength) is added topreviously selected features, and the selection criterion, a partialF-value, is calculated to evaluate the discrimination power of thecandidate feature. As soon as this has been done for all candidatefeatures, the one with the highest score is joined to the set of se-
0
10
20
30
40
50
60
70
80
0.36
0.38
0.40
0.42
0.44
0 20 40 60 80 100 120 140
Bri
ghtn
ess
Chr
omat
ic c
oord
inat
e x,
y
Sediment residue [mg]
Ccx Ccy Brg
Fig. 2. The relationship between chromatic coordinate x (ccx), y (ccy) andbrightness (brg), and filter sediment weight. All sediment is from the same sample.
lected features. The search procedure is stopped when the desirednumber of selected features is reached or the discriminating powerof a new feature drops below a predefined statistical threshold. Thedefinition of the multivariate selection criterion is taken from themultivariate analysis of variance (MANOVA) and from multipleregression analysis. This algorithm takes into consideration theinterdependence between features and selects a set of preferablyindependent features from the spectra that are discriminative forthe problem. Fig. 3 shows the location of the 50 best-suited wave-lengths, the majority of which are located in the visible part of thespectrum. The result of this analysis underscored the potential va-lue of colour as a property for distinguishing sediment sources.
Following CIE (1931), colour coefficients were computed fromspectra reflectance measurements over the visible wavelengthrange, using in-house software. In the colorimetric system of theCIE XYZ, a given colour is represented by (X, Y), virtual componentsof the primary spectra, and Z, the brightness (Wyszecki and Stiles,1967). These values characterize uniquely the colour aspect of theobject studied under given illumination conditions and for a stan-dard observer (Judd and Wyszecki, 1975). In this study the calcula-tions were made with a 5 nm step for a daylight C-type illuminate,following Eqs. (1)–(3) (Wyszecki and Stiles, 1967):
X ¼X770 nm
380 nm
HðkÞ � CðkÞ � �xðkÞ ð1Þ
Y ¼X770 nm
380 nm
HðkÞ � CðkÞ � �yðkÞ ð2Þ
Z ¼X770 nm
380 nm
HðkÞ � CðkÞ � �zðkÞ ð3Þ
where k is the wavelength, H(k) is the spectral irradiance of the lightsource, C(k) is the spectral reflectance of the sample, and �x (k), �y (k),and �z (k) are the colour matching functions of the CIE, 1931 Stan-dard Observer. However, the XYZ tristimulus are not easily visual-ised. CIE defined the CIE Yxy colour space to overcome thisproblem. The CIE chromatic coordinates x and y values were calcu-lated by normalizing X and Y. Viscarra Rossel et al. (2006) describethe algorithms used for transformation between the colour spacemodels commonly used by soil scientists. Values x and y specify col-our variation from blue to red and blue to green, respectively. Chro-maticity coordinates x, y, and brightness are referred to as ccx, ccyand brg, respectively, hereafter.
Linearly additive behaviour of tracers is an essential prerequi-site for their use in tracer mixing models for source ascription(Lees, 1997). An experiment was conducted using laboratory mix-tures of up to four sediment sources (end-members) to confirm
ig. 3. Wavelength selection for the separation of potential source material in theeierbach, Huewelerbach and Wollefsbach catchments: cultivated topsoil, grass-nd topsoil, forest topsoil channel bank and unmetalled roads.
FWla

54 N. Martínez-Carreras et al. / Journal of Hydrology 382 (2010) 49–63
that this requirement was met by the colour coefficients and thusthe validity of using linear mixing modelling techniques. Knownproportions of randomly selected source material samples weremixed to create artificial samples. Reflectance was measured on22 different source material samples (end-members, randomly se-lected from the catchment source sediment samples), and 16 lab-oratory mixtures.
The fingerprinting approach with uncertainty evaluation
The relative contributions of the individual sources to the sus-pended sediment samples were calculated using a multivariatemixing model based on mass balance equations. The model seeksto solve the system of linear equations represented by:
Xm
j¼1
ai;j � xj ¼ bi ð4Þ
While satisfying the following constraints:
Xm
j¼1
xj ¼ 1 ð5Þ
xj P 0 ð6Þ
where, bi is the value of tracer property i (i = 1–n) in the suspendedsediment sample, ai,j is the value of tracer property i in source type j(j = 1–m), xj is the unknown relative contribution of source type j tothe suspended sediment sample, m is the number of source types,and n is the number of tracers. In general, the relative contributionsof m different sources can be uniquely determined by the use ofm � 1 different tracers. However, the system has infinite solutionswhen the number of tracers is equal to, or higher than, the numberof sources. The system is then mathematically over-determined, butcan normally be solved by optimisation, based on minimizing theerrors between measured and estimated values. In this study weminimized the function f(xj) given by the sum of squares of relativeerrors (Collins et al., 1997a, Equation 7a).
f ðxjÞ ¼Xn
i¼1
bi �Xm
j¼1
ai;j � xj
!,bi
!2
ð7Þ
The tolerance criterion placed on constraint violations and tracervalues (the maximum value by which tracer estimates can violatethe constraints and still allow successful convergence) was set to±10�6. Following Motha et al. (2003) the initial values of xj wereset to 1/m, as providing the best starting point for optimisation.
The Kruskal–Wallis H-test was used to test if colour coefficientswere able to discriminate between the different potential sourcesin the catchment. Discriminant function analysis (DFA) was usedto assess the power of individual colour coefficients to discriminatebetween the potential sources (Collins and Walling, 2002).
Some studies have included particle size, organic matter andconservativeness correction factors in the mixing model formula-tion (Collins et al., 1997a; Walling et al., 1999; Gruszowski et al.,2003; Motha et al., 2003). The particle size correction factor is fre-quently estimated as the ratio of the specific surface area of thesediment sample to the mean specific surface area of each poten-tial source type (Collins et al., 1998). However, Russell et al.(2001) took into account the non-linear nature of the relationshipbetween constituent concentrations and the grain size composi-tion of sediment and source samples, and provided specific correc-tion factors for individual constituents. Calculated correctionfactors ranged from 0.12 to up to 4.5 for different elements. Inthe same way, Motha et al. (2003) used enrichment ratios consid-ering several particle size fractions. These studies illustrate thecomplexity of the relationships between constituent concentra-
tions and the grain size. For this reason, no correction factors wereemployed in this study and only suspended sediment propertiesfor which the recorded values fell within the range of values ofthe same property associated with the sources were consideredin this study (Walden and Slattery, 1997). This does not excludethe possibility of alteration of the composition of the suspendedsediment relative to the source material during transport or stor-age, but might indicate that any such effects have been relativelysmall (Walden and Slattery, 1997). In addition, the effect of particlesize contrast between sediment and sources were minimized byrestricting the analysis to the <63 lm fraction. No corrections wereapplied to take into account differences in organic matter contentbetween sources and suspended sediment samples (Collins et al.,1997b; Owens et al., 2000). The relationship between tracer con-centration and organic matter content is complex and difficult togeneralize (Walling et al., 1999).
Moreover, as previously mentioned, mixing models are gener-ally based on rather simplistic assumptions and hypotheses thatmake the approach inherently uncertain (Foster and Lees, 2000).These include:
(i) that selective erosion does not change the properties of thetracer or, if it does, only in a way that can be effectively mea-sured and modelled;
(ii) that differences between the properties of individual sourcesdo not significantly change over the period underinvestigation;
(iii) that the tracer undergoes no transformation (enrichment,dilution or depletion) during transport; and
(iv) that the mixing or un-mixing models used to reconstructsediment sources are able to deal with the inherent variabil-ity in source properties or provide estimate of source contri-butions within known or predictable tolerances.
Even though it was not possible to deal with the uncertaintyassociated with all of these assumptions, model uncertainty wasassessed using a Bayesian uncertainty-inclusive approach. Theuncertainty in the results obtained from the mixing model asso-ciated with the spatial variability of source tracers was exploredusing a Monte-Carlo simulation technique (10,000 iterations).The sample mean and standard deviation for each tracer propertyassociated with a particular source was estimated using a boot-strap procedure, and these values were assumed to approximatethe population mean and standard deviation, in order to definethe statistical distribution of the tracer property values for a par-ticular source. The distribution is assumed to reflect the labora-tory analytical error as well as the spatial and temporalvariability of the tracers. After undertaking a Normality test(Kolmogorov–Smirnov Normal distribution test, a = 0.05), acumulative Normal distribution function was produced for eachtracer property for each source. From this function, tracer prop-erty values corresponding to a series of randomly generatedcumulative frequency distributions were obtained for eachsource type. Negative tracer property values were eliminatedby repeating the above procedure until all the values were with-in the desired range. The system of linear equations was solved10,000 times. Mixing diagrams were forced to include suspendedsediment values at each run.
The methodology used to assess uncertainty employs the con-ceptual foundation outlined in Beven and Binley (1992) based onacceptance of the possible equifinality of models. The applicationof this methodology in sediment fingerprinting was first intro-duced by Franks and Rowan (2000), Rowan et al. (2000) and Smallet al. (2004). The robustness of the source ascription solutions wasassessed using a mean ‘goodness of fit’ (GOF, modified from Mothaet al., 2003):

N. Martínez-Carreras et al. / Journal of Hydrology 382 (2010) 49–63 55
GOF ¼ 1� 1n�
Xn
i¼1
bi �Xm
j¼1
ðai;j � xjÞ�����
�����,
bi
!( )ð8Þ
The replicate random sampling permitted the calculation of confi-dence limits for the estimates of the relative contribution of eachindividual source type to each suspended sediment sample, by di-rectly weighting the likelihood of the 10,000 mixing model itera-tions, which were subsequently used to derive the predictiveprobability of the output variables. Only sets of tracers that ob-tained a GOF higher than 0.95 (accepted sets) were used in the sub-sequent steps. This threshold was subjectively chosen afterexploring several measures of model performance. Mixing modelsincorporating three-tracers were used in all cases, in order to com-pare results obtained when using the colour-based fingerprintingapproach (3 colour coefficients available) and classical fingerprint-ing approaches (>3 tracers available). In the latter case, at eachrun, first three-tracers were randomly selected from the list ofavailable tracers, and then their values were randomly selectedfrom their distribution functions. Results were sorted from thesmallest to the largest and a weighted likelihood was assigned toeach value that summed to unity, so the distribution function wasobtained. 90% confidence intervals were assigned to the source con-tribution values between 5% and 95% cumulated probability. Thecentroid (50%) was used as a measure of the modal behaviour (Bev-en and Binley, 1992). It is important to note that as the number oftracers included in the mixing model is increased, fewer tracer setsare able to achieve GOF higher than 0.95 and, as a consequence, theuncertainty range decreases (Martínez-Carreras et al., 2008).
Tracer specific weightings (Wi) were used to ensure that the tra-cer property values for a particular source characterized by thesmallest standard deviations exerted the greatest influence uponthe optimised mixing model, since it was evident that as the stan-dard deviation of the tracer property values increased, the sourceascription uncertainty also increased. The weighting value (Wi)was calculated using the inverse of the root of the variance associ-ated with each source tracer. In the same way, the possibility of
0%
20%
40%
60%
80%
100%
ccx ccy brg
Succ
ess
rate
[%
]
0%
20%
40%
60%
80%
100%
2 3
Succ
ess
rate
[%
]
Number of sources in
0.360
0.365
0.370
0.375
0.380
0.385
0.360 0.365 0.370 0.375
Est
imat
ed c
cy
Measured ccy
0.37
0.38
0.39
0.40
0.41
0.42
0.37 0.38 0.39 0.40 0.41 0.42
Est
imat
ed c
cx
Measured ccx
(b)
(a)
Fig. 4. (a) Estimated versus measured chromatic coordinates x (ccx), y (ccy) and brightnethe mixing experiments in terms of the percentage difference error between estimated
constraining the mixing model by incorporating existing under-standing or knowledge of the process system was explored. Itwas achieved by limiting the relative contributions of somesources to a particular numerical range. For example, the relativecontribution of the channel banks in the Weierbach catchmentwas limited to less than 50% (i.e. xj 6 0.5), because if their contribu-tions were higher, then the channel banks would be much moreeroded.
Results and discussion
Linearly additive behaviour of colour coefficients
The results of the test for linearly additive behaviour are shownin Fig. 4a, where estimated versus measured colour coefficient val-ues are shown, and in Fig. 4b which shows the overall results forthe success rates of the 16 mixtures in terms of the percentage er-ror between simulated and measured values and colour coefficient(Fig. 4b, left), and number of sources in mixture (Fig. 4b, right). Onethree source mixture was considered as an outlier since it revealedup to 25% error between estimated and measured values (not plot-ted in Fig. 4a).
It was found that chromatic coordinates x (ccx) and y (ccy) werethe most reliable linearly additive measurements, with an errorusually lower than 2% (Figs. 4a and 4b). For brightness (brg), esti-mated values were lower than the measured values, and a slightoffset exists (non-linear effect) over the middle range of values.However, 42.9% of the samples have an error lower than 5% and71.4% lower than 10%. For this reason, this phenomenon was as-cribed to undetermined interactions (e.g. changing some physicalcharacteristics of the source material once mixed) (Lees, 1997).Nevertheless, errors were not considered to be sufficiently largeto cause poor mixing results for the known source proportion usinglinear mixing models. Moreover, four sources can be mixed to-gether with reasonable success. A minimum of 75% of the samples
4 mixture
> 10% Error
5 - 10% Error
0 - 5% Error
0.380 0.385 10
12
14
16
18
20
22
24
26
10 12 14 16 18 20 22 24 26
Est
imat
ed b
rg
Measured brg
2 Sources Mixt.
3 Sources Mixt.
4 Sources Mixt.
ss (brg) values when mixing sediment from 2 to 4 sources; and (b) success rates forand measured values and type of tracer (left), and number of tracers (right).
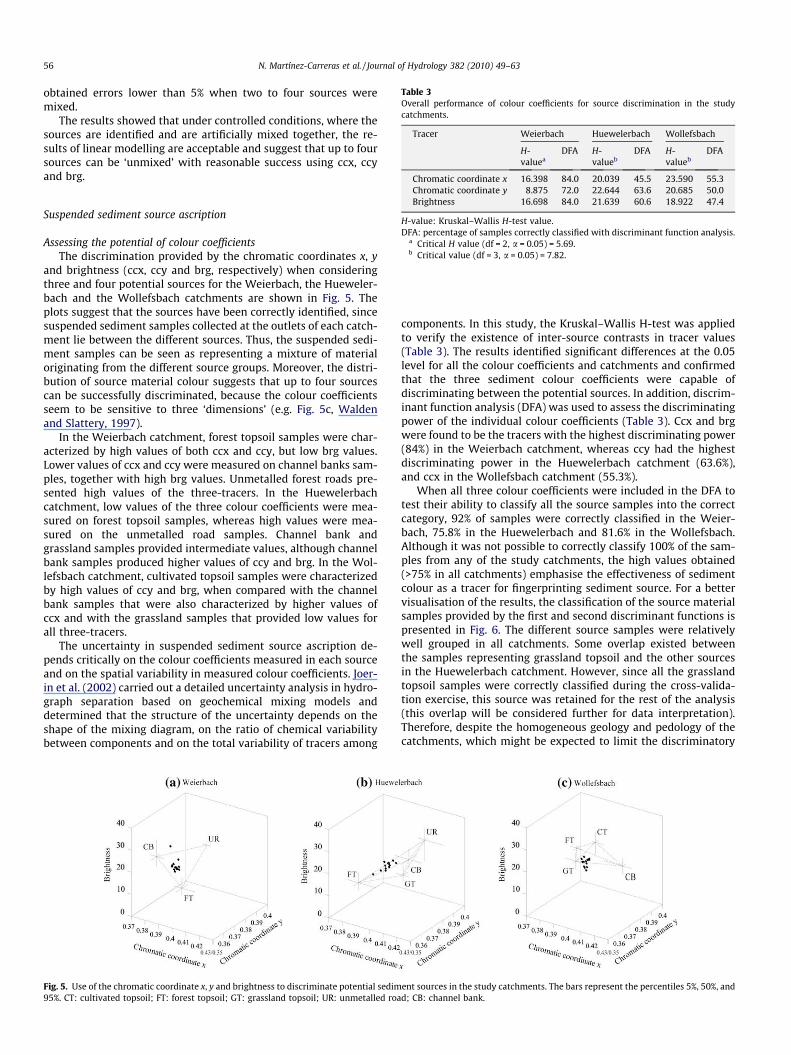
Table 3Overall performance of colour coefficients for source discrimination in the studycatchments.
Tracer Weierbach Huewelerbach Wollefsbach
H-valuea
DFA H-valueb
DFA H-valueb
DFA
Chromatic coordinate x 16.398 84.0 20.039 45.5 23.590 55.3
56 N. Martínez-Carreras et al. / Journal of Hydrology 382 (2010) 49–63
obtained errors lower than 5% when two to four sources weremixed.
The results showed that under controlled conditions, where thesources are identified and are artificially mixed together, the re-sults of linear modelling are acceptable and suggest that up to foursources can be ‘unmixed’ with reasonable success using ccx, ccyand brg.
Chromatic coordinate y 8.875 72.0 22.644 63.6 20.685 50.0Brightness 16.698 84.0 21.639 60.6 18.922 47.4
H-value: Kruskal–Wallis H-test value.DFA: percentage of samples correctly classified with discriminant function analysis.
a Critical H value (df = 2, a = 0.05) = 5.69.b Critical value (df = 3, a = 0.05) = 7.82.
Suspended sediment source ascription
Assessing the potential of colour coefficientsThe discrimination provided by the chromatic coordinates x, y
and brightness (ccx, ccy and brg, respectively) when consideringthree and four potential sources for the Weierbach, the Hueweler-bach and the Wollefsbach catchments are shown in Fig. 5. Theplots suggest that the sources have been correctly identified, sincesuspended sediment samples collected at the outlets of each catch-ment lie between the different sources. Thus, the suspended sedi-ment samples can be seen as representing a mixture of materialoriginating from the different source groups. Moreover, the distri-bution of source material colour suggests that up to four sourcescan be successfully discriminated, because the colour coefficientsseem to be sensitive to three ‘dimensions’ (e.g. Fig. 5c, Waldenand Slattery, 1997).
In the Weierbach catchment, forest topsoil samples were char-acterized by high values of both ccx and ccy, but low brg values.Lower values of ccx and ccy were measured on channel banks sam-ples, together with high brg values. Unmetalled forest roads pre-sented high values of the three-tracers. In the Huewelerbachcatchment, low values of the three colour coefficients were mea-sured on forest topsoil samples, whereas high values were mea-sured on the unmetalled road samples. Channel bank andgrassland samples provided intermediate values, although channelbank samples produced higher values of ccy and brg. In the Wol-lefsbach catchment, cultivated topsoil samples were characterizedby high values of ccy and brg, when compared with the channelbank samples that were also characterized by higher values ofccx and with the grassland samples that provided low values forall three-tracers.
The uncertainty in suspended sediment source ascription de-pends critically on the colour coefficients measured in each sourceand on the spatial variability in measured colour coefficients. Joer-in et al. (2002) carried out a detailed uncertainty analysis in hydro-graph separation based on geochemical mixing models anddetermined that the structure of the uncertainty depends on theshape of the mixing diagram, on the ratio of chemical variabilitybetween components and on the total variability of tracers among
Fig. 5. Use of the chromatic coordinate x, y and brightness to discriminate potential sedim95%. CT: cultivated topsoil; FT: forest topsoil; GT: grassland topsoil; UR: unmetalled roa
components. In this study, the Kruskal–Wallis H-test was appliedto verify the existence of inter-source contrasts in tracer values(Table 3). The results identified significant differences at the 0.05level for all the colour coefficients and catchments and confirmedthat the three sediment colour coefficients were capable ofdiscriminating between the potential sources. In addition, discrim-inant function analysis (DFA) was used to assess the discriminatingpower of the individual colour coefficients (Table 3). Ccx and brgwere found to be the tracers with the highest discriminating power(84%) in the Weierbach catchment, whereas ccy had the highestdiscriminating power in the Huewelerbach catchment (63.6%),and ccx in the Wollefsbach catchment (55.3%).
When all three colour coefficients were included in the DFA totest their ability to classify all the source samples into the correctcategory, 92% of samples were correctly classified in the Weier-bach, 75.8% in the Huewelerbach and 81.6% in the Wollefsbach.Although it was not possible to correctly classify 100% of the sam-ples from any of the study catchments, the high values obtained(>75% in all catchments) emphasise the effectiveness of sedimentcolour as a tracer for fingerprinting sediment source. For a bettervisualisation of the results, the classification of the source materialsamples provided by the first and second discriminant functions ispresented in Fig. 6. The different source samples were relativelywell grouped in all catchments. Some overlap existed betweenthe samples representing grassland topsoil and the other sourcesin the Huewelerbach catchment. However, since all the grasslandtopsoil samples were correctly classified during the cross-valida-tion exercise, this source was retained for the rest of the analysis(this overlap will be considered further for data interpretation).Therefore, despite the homogeneous geology and pedology of thecatchments, which might be expected to limit the discriminatory
ent sources in the study catchments. The bars represent the percentiles 5%, 50%, andd; CB: channel bank.
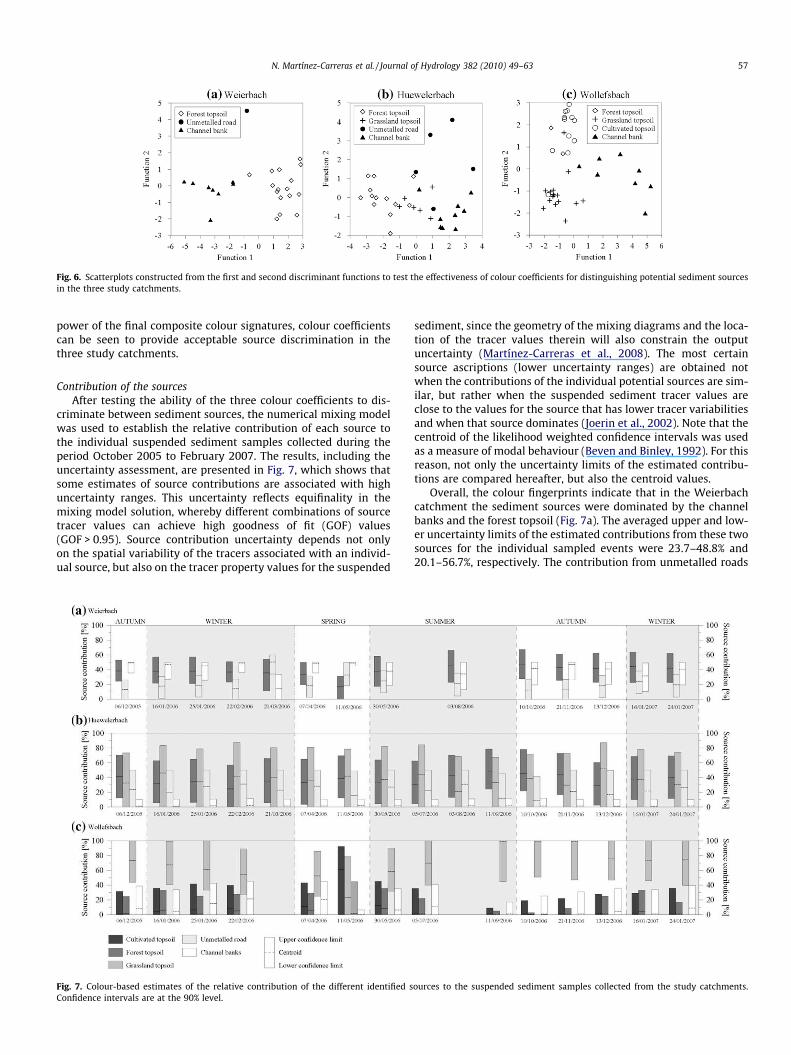
Fig. 6. Scatterplots constructed from the first and second discriminant functions to test the effectiveness of colour coefficients for distinguishing potential sediment sourcesin the three study catchments.
N. Martínez-Carreras et al. / Journal of Hydrology 382 (2010) 49–63 57
power of the final composite colour signatures, colour coefficientscan be seen to provide acceptable source discrimination in thethree study catchments.
Contribution of the sourcesAfter testing the ability of the three colour coefficients to dis-
criminate between sediment sources, the numerical mixing modelwas used to establish the relative contribution of each source tothe individual suspended sediment samples collected during theperiod October 2005 to February 2007. The results, including theuncertainty assessment, are presented in Fig. 7, which shows thatsome estimates of source contributions are associated with highuncertainty ranges. This uncertainty reflects equifinality in themixing model solution, whereby different combinations of sourcetracer values can achieve high goodness of fit (GOF) values(GOF > 0.95). Source contribution uncertainty depends not onlyon the spatial variability of the tracers associated with an individ-ual source, but also on the tracer property values for the suspended
Fig. 7. Colour-based estimates of the relative contribution of the different identified sConfidence intervals are at the 90% level.
sediment, since the geometry of the mixing diagrams and the loca-tion of the tracer values therein will also constrain the outputuncertainty (Martínez-Carreras et al., 2008). The most certainsource ascriptions (lower uncertainty ranges) are obtained notwhen the contributions of the individual potential sources are sim-ilar, but rather when the suspended sediment tracer values areclose to the values for the source that has lower tracer variabilitiesand when that source dominates (Joerin et al., 2002). Note that thecentroid of the likelihood weighted confidence intervals was usedas a measure of modal behaviour (Beven and Binley, 1992). For thisreason, not only the uncertainty limits of the estimated contribu-tions are compared hereafter, but also the centroid values.
Overall, the colour fingerprints indicate that in the Weierbachcatchment the sediment sources were dominated by the channelbanks and the forest topsoil (Fig. 7a). The averaged upper and low-er uncertainty limits of the estimated contributions from these twosources for the individual sampled events were 23.7–48.8% and20.1–56.7%, respectively. The contribution from unmetalled roads
ources to the suspended sediment samples collected from the study catchments.

58 N. Martínez-Carreras et al. / Journal of Hydrology 382 (2010) 49–63
was less important, with the averaged uncertainty limits lying inthe range of 6.0–34.8%. Thus, the averaged uncertainty ranges ofthe estimated contributions for the individual sampled eventswere 36.6% for the forest topsoil, 28.8% for the unmetalled roads,and 25.0% for the channel banks. A low annual suspended sedimentyield (22.5 Mg km�2, Table 1) was estimated for the Weierbachcatchment in 2006. This value is low when compared with thosefor the other two study catchments. Only small amounts of mobi-lised sediment are deposited and stored in the stream channel andsediment mobilisation and transport occur primarily during therising limbs of hydrographs.
In the Huewelerbach catchment, the results obtained from theuse of colour coefficients as sediment source tracers indicated thatboth forest and grassland topsoils were the most importantsources (Fig. 7c). The averaged upper and lower uncertainty limitsof the estimated contributions for the sampled storms were 9.7–67.5% and 0–78.1%, respectively. Unmetalled roads were importantsources of sediment during some rainfall events (e.g. 22/02/06 and07/04/06; the averaged centroids of the estimated contributionsfrom this source for the sampled storms was 22.1%), but channelbanks seem to be less important as a source, with the averagedupper and lower uncertainty limits of the estimated contributionslying in the range of 0–10.7%. The averaged uncertainty ranges forthe individual sampled events was 57.8% for the forest topsoil,78.1% for the grassland topsoil, and 49.1% for the unmetalled roads.Thus, a high uncertainty rage was estimated for the grassland top-soil because likelihood scores >0.95 were obtained throughout the
Table 4Overall performance of the selected tracers used for source discrimination in the study ca
Weierbacha Huewelerbachb
Tracer H-value DFA Tracer H
137Cs (Bq/kg) 16.95 92.0 Gd (lg/g) 26Sb (lg/g) 17.19 92.0 Th (lg/g) 25U (lg/g) 16.80 88.0 Mn (lg/g) 23Pb (lg/g) 16.70 84.0 Sm (lg/g) 24Sn (lg/g) 16.95 84.0 Ce (lg/g) 25V (lg/g) 16.40 84.0 Dy (lg/g) 23C (%) 16.80 80.0 La (lg/g) 24P (%) 15.08 80.0 N (%) 23Gd (lg/g) 16.65 76.0 Nd (lg/g) 25Sc (lg/g) 13.55 76.0 137Cs (Bq/kg) 25210Pb (Bq/kg) 16.70 76.0 Eu (lg/g) 23Li (lg/g) 16.18 72.0 Pr (lg/g) 25N (%) 16.64 72.0 Pb (lg/g) 19Rb (lg/g) 11.93 72.0 Er (lg/g) 22Cs (lg/g) 10.42 60.0 Ni (lg/g) 17Dy (lg/g) 8.57 60.0 Al (lg/g) 20Ga (lg/g) 14.05 60.0 Ga (lg/g) 22La (lg/g) 8.42 60.0 Mg (lg/g) 22Ce (lg/g) 8.77 52.0 V (lg/g) 14Sm (lg/g) 7.24 48.0 Yb (lg/g) 21
Ba (lg/g) 20Co (lg/g) 20210Pb (Bq/kg) 21Cr (lg/g) 17Rb (lg/g) 17C (%) 24Li (lg/g) 24P (mg/g) 15Sr (lg/g) 18Sc (lg/g) 22U (lg/g) 18Cs (lg/g) 19Fe (lg/g) 11Cu (lg/g) 15
H-value: Kruskal–Wallis H-test.DFA: percentage of correctly classified samples with discriminant function analysis.
a Critical H value (df = 2, a = 0.05) = 5.69.b Critical H value (df = 3, a = 0.05) = 7.82.
full range of grassland topsoil source contribution. As a conse-quence, most of the solutions have a high degree of overlap. Thisis due to the fact that the three colour coefficients employed wereunable to discriminate this source from the other sources (Fig. 6b).However, greater sensitivity was exhibited by the channel banksource, since the contribution from this source lies between 0%and 10%, indicating a real limit to the contribution from channelbanks during almost all events. Even though some informationcan be extracted from the colour-based fingerprinting exercise,other tracers should be added in order to add ‘dimensionality’ tothe results and reduce the uncertainty bounds.
In the Wollefsbach catchment the suspended sediment sourcescontributions were more variable than in the Weierbach andHuewelerbach catchments (Fig. 7c). The dominant suspended sed-iment source was the grassland topsoil, probably because a densesub-surface drainage system extends over the catchment. Theaveraged upper and lower uncertainty limits of the estimated con-tributions for the individual events lied in the range of 36.9–93.5%,whereas the averaged centroids of the estimated contributions was64.5%. Forest and arable topsoil sources are poorly connected withthe stream network and therefore make only a relatively smallcontribution to the overall suspended sediment yield of the catch-ment. The averaged upper and lower uncertainty limits of the esti-mated contributions from these two sources for the individualsampled events were 0–26.2% and 0–36.2%, respectively. In thiscatchment, channel banks provide a much smaller contribution,with centroid values close to zero in almost all runoff events. It
tchments.
Wollefsbachb
-value DFA Tracer H-value DFA
.89 84.4 Th (lg/g) 24.09 67.5
.30 78.1 137Cs (Bq/kg) 27.66 62.5
.89 71.9 N (%) 22.05 62.5
.98 71.9 Ni (lg/g) 13.77 60.0
.97 68.8 C (%) 23.38 57.5
.75 68.8 La (lg/g) 19.87 57.5
.97 68.8 Cr (lg/g) 11.58 52.5
.31 68.8 Pr (lg/g) 22.16 50.0
.28 68.8 Sc (lg/g) 17.37 50.0
.50 68.8 Ce (lg/g) 19.61 47.5
.86 65.6 P (mg/g) 21.57 42.5
.66 65.6 U (lg/g) 13.68 42.5
.94 62.5 Eu (lg/g) 13.91 40.0
.94 59.4 Mg (lg/g) 10.08 40.0
.44 59.4 Al (lg/g) 10.30 37.5
.43 56.3 Ga (lg/g) 12.96 37.5
.52 56.3 Nd (lg/g) 17.18 37.5
.25 56.3 Dy (lg/g) 10.00 35.0
.87 56.3 210Pb (Bq/kg) 9.27 35.0
.83 56.3 Li (lg/g) 10.39 32.5
.25 53.1 Cs (lg/g) 12.59 27.5
.04 50.0 Sm (lg/g) 10.89 27.5
.01 50.0 Gd (lg/g) 8.12 25.0
.05 46.9
.71 46.9
.30 43.8
.03 43.8
.05 43.8
.28 43.8
.25 40.6
.03 40.6
.54 37.5
.96 37.5
.86 31.3

N. Martínez-Carreras et al. / Journal of Hydrology 382 (2010) 49–63 59
is also possible to observe in Fig. 7 that less overlap exists betweenthe solutions and that uncertainty bounds are therefore lower.Thus, it was possible to use ccx, ccy and brg in the Wollefsbach ba-sin to discriminate between four potential suspended sedimentsources.
Comparison with the classical fingerprinting approach
The results obtained with the colour-based fingerprinting ap-proach were compared with those obtained using the classical fin-gerprinting approach involving geochemical, radionuclide andorganic tracers, in order to evaluate the consistency of the results.However, comparison of the results provided by both techniquescannot provide independent validation of the colour-based finger-printing, since both techniques use the same fundamental ap-proach and the results involve considerable uncertainty.
In order to apply the classical fingerprinting approach, individ-ual tracers were tested for their ability to discriminate between thepotential sediment sources using the Kruskal–Wallis H-test. In thesame way, tracers that showed evidence of enrichment during theerosion and sediment mobilisation process were rejected from theanalysis and were not considered in the rest of the study. For thetracers retained for estimating the contribution of the potentialsediment sources to the suspended sediment output from thestudy catchments, Table 4 presents the Kruskal–Wallis H-values,as well as the percentage of samples correctly classified by eachtracer using discriminant function analysis (DFA). Tracers areranked from higher to lower percentage of samples correctly clas-sified using DFA.
After discarding the enriched tracers, 20, 34, and 23 tracerswere finally used to estimate the relative contribution of the po-tential sediment sources in the Weierbach, Huewelerbach andWollefsbach catchments, respectively. In all catchments, the finalset of tracers comprised major elements (e.g. Al, Mg and Mn), traceelements (e.g. Cr, Ni, La, Ce and Pr), organic constituents (N, C andP), and radionuclides (137Cs and excess 210Pb). The advantages ofusing composite signatures including tracers from several groupsor sets of tracer properties have been previously emphasised (Col-lins et al., 1997b; Olley and Caitcheon, 2000; Walling, 2005).
In the Weierbach catchment, 137Cs and Sb were the tracers withthe highest discriminating power (92%), whereas Ce and Sm werecharacterized by the poorest performance (52.0% and 48.0%,respectively). In the Huewelerbach, Gd and Th were able to cor-rectly classify 84.4% and 78.1% of the samples, while Cs, Fe andCu had the lowest discriminating power (37.5%, 37.5%, and 31.3%,respectively). Th, 137Cs, and N, were the tracers with the highestdiscriminating power in the Wollefsbach catchment (67.5%,
Fig. 8. Scatterplots constructed from the first and second discriminant functions todistinguishing potential sediment sources in the study catchments.
62.5%, and 62.5%, respectively), whereas Gd, Sm and Cs revealedthe lowest performance (25.0%, 27.5% and 27.5%, respectively).
Stepwise DFA was applied to all pre-selected tracers (Table 4) toensure that the tracers used were able to correctly discriminate theidentified sources. In the Weierbach catchment, 96% of the sampleswere correctly discriminated and the optimum composite finger-print for discriminating individual source types included 137Cs, Vand Ga. In the Huewelerbach catchment, 100% of the samples werecorrectly classified, and the optimum composite fingerprint com-prised P, 137Cs, Gd, Th, U and Mn. In the Wollefsbach catchment,87.5% of the samples were correctly classified. In this case the com-posite fingerprint comprised N, 137Cs, Mg, La and Sm. The classifi-cation of the source material samples provided by the stepwise-selected tracers is examined graphically in Fig. 8. However, it hasbeen assumed that inclusion of all pre-selected tracers, instead ofjust using the optimum composite fingerprint, increases the likeli-hood that inappropriate tracers (e.g. those subject to geochemicaltransformation during fluvial erosion and transportation) couldbe represented in the model (Martínez-Carreras et al., 2008).
After pre-selecting the tracers to be included for each catch-ment, and studying their capacity to distinguish between the po-tential sediment sources, the numerical mixing model was usedto establish the relative contribution of each source (with uncer-tainty assessment) to the individual suspended sediment samplescollected over the period October 2005 to February 2007 (Fig. 9).A high uncertainty is associated with the results. This is mainlydue to the fact that a high number of sets of tracers can achieveGOF > 0.95 when using mixing models based on only three-tracers.In order to be directly equivalent to the three colour coefficientsused in the colour-based exercise, three-tracers were randomly se-lected from the list of pre-selected tracers (10,000 different sets oftracers were generated) for use in the mixing model (this is furtherexplained in Section 3.4). However, the uncertainty range generallydecreases when the number of tracers in the model is increased(Martínez-Carreras et al., 2008), since as the number of tracers in-cluded is increased, fewer tracer sets are able to achieve high GOFvalues. Nevertheless, the estimated centroid source contributionvalues were seen to be highly stable. As a consequence, althoughin some cases results are not well constrained and informative, itwas still possible to establish suspended sediment sources byapplying mixing models incorporating three-tracer.
A comparison of the results obtained by applying the classicaland the colour-based fingerprinting technique indicates that 94%of the centroid suspended sediment source ascriptions estimatedusing the colour-based fingerprinting approach in the three smallstudy catchments were within the estimated confidence boundsof the equivalent estimates obtained using the classical finger-printing approach. A high consistency exists between the centroid
test the power of pre-selected geochemical tracer properties (see Table 4) for

Fig. 9. Estimates of the relative contribution of the different identified sources to the suspended sediment samples collected from the three study catchments provided by theclassical fingerprinting approach. Confidence intervals are at the 90% level.
60 N. Martínez-Carreras et al. / Journal of Hydrology 382 (2010) 49–63
source ascriptions estimated using both methods for all sourceswithin the Wollefsbach catchment. A good consistency exists be-tween both methods in the Huewelerbach catchment for three ofthe sources, but not for the grassland topsoil. The two approachesidentified a different dominant source in the Weierbach catch-ment. Whereas the colour-based fingerprinting approach identifiedforest topsoil as the main sediment source in the Weierbach catch-ment, the classical fingerprinting approach identified the unme-talled roads as the main source (averaged inter-storm centroidcontribution equal to 48.5%). The latter result is consistent withother studies that have identified unmetalled roads as importantsediment sources in forested catchments. For instance, Froehlichand Walling (1997) investigated forested areas within the Homer-ka experimental catchment (Polish Flysch Carpathians) and foundout that unmetalled roads represented the main suspended sedi-ment source. In the same way, Motha et al. (2003) demonstratedthat unmetalled roads contributed 20–60 times more sedimentthan the undisturbed forest in a catchment in south easternAustralia.
Sediment source variability during storm runoff events
The agreement between the colour-based and the classical fin-gerprinting approaches prompted the further development of theapproach to include measurement of colour coefficients on the par-ticles retained on a glass fibre filter. This has the advantage that itcan be applied to small, essentially instantaneous, suspended sed-iment samples collected at frequent during storm events usingautomatic pump samplers. This approach permitted investigationof sediment source variability during individual storm runoffevents. A runoff event sampled on the 4th of August 2006 in theHuewelerbach catchment is used here to illustrate the potentialof the approach. Fig. 10 shows the hydrograph, the measured sus-pended sediment concentration (SSC) during the event and thesediment source ascription including the uncertainty assessment
for the individual samples collected during this storm runoff event.The total rainfall measured was 22.6 mm, with a maximum inten-sity peak of 4.6 mm h�1. It was not a highly erosive rainfall event,and thus usefully demonstrates the potential for using the method-ology at relatively low sediment concentrations.
The analysed samples provided evidence of appreciable intra-storm variability of colour coefficients, which can be assumed toreflect changes in the composition of suspended solids caused bychanges in the relative contributions from the different sedimentsources (Fig. 10). However, high uncertainty was associated withthe results due to the fact that a high number of tracer setsachieved GOF > 0.95 when using three-tracers mixing models withthree colour coefficients. However, when increasing the GOFthreshold (e.g. using sets of tracers that obtained GOF > 0.99 to as-sess uncertainty) the uncertainty associated with the results de-creased but the centroids were seen to be stable (results notshown). Thus, the estimated centroids, which were used as a mea-sure of modal behaviour, provided an indication of the changingcontributions of individual suspended sediment sources as theevent proceeds.
In the Huewelerbach catchment, sediment derived from foresttopsoil, grassland topsoil and unmetalled roads was mobilised dur-ing the entire event, but there was no evidence of sediment con-tributed by channel bank erosion (Fig. 10). This could indicateremobilisation of mixed sediment deposited on the channel bedduring previous events. The contribution of grassland topsoil in-creased during the rising limb, while its contribution decreasedagain after peak runoff. Conversely, the contribution from unme-talled roads increased during the falling limb.
The suspended sediment load associated with the sampledevent (ca. 349 kg) was established by interpolating the suspendedsediment concentration measurements collected during the entirerunoff event and combining this record with the detailed flow re-cord for the event. The centroid of the estimated contributionsfrom the individual sources (centroid of the likelihood weighted

Fig. 10. Water discharge, suspended sediment concentration (SSC), and suspended sediment source contribution for the storm runoff event that occurred on the 4th of July2006 in the study catchments.
N. Martínez-Carreras et al. / Journal of Hydrology 382 (2010) 49–63 61
confidence interval) estimated from the colour measurementsundertaken on the filters were used to calculate the amount of sed-iment coming from each source. The results indicate that around160 kg (45.7% of the total) came from the grassland topsoil,whereas around 98 kg and 92 kg came from the forest topsoiland the unmetalled roads, respectively (28% and 26.3% of the total).These results are comparable with the results obtained using sed-iment coming from the time-integrated suspended sediment trapfor the same storm runoff event (Fig. 7b). The centroids of thesource contribution values for the event were estimated to be42.8%, 21% and 30.8% for the grassland topsoil, forest topsoil andunmetalled roads, respectively.
Conclusions
Colour coefficients measured with diffuse reflectance spectrom-etry were used to quantify suspended sediment sources in the Att-ert River catchment (Luxembourg) using the fingerprintingapproach. Initially, a multivariate selection criterion was used toshow that most of the best wavelengths in the total reflectancespectra (0.4–2.5 m) for discriminating between sediment sourceswere located in the visible part of the spectrum. The linearly addi-tive behaviour of colour coefficients was also tested to confirmtheir suitability for use in source ascription mixing models. Modeluncertainty was assessed using a Bayesian uncertainty-inclusiveapproach to mixing models. A Monte-Carlo procedure was usedto randomly select input source tracer values from the Normal dis-tribution for each tracer.
The relative contribution of a number of potential sources tosuspended sediment samples, collected during sixteen rainfallevents in three small catchments representative of the main phys-iographic characteristics of Luxembourg, was investigated byapplying the colour-based fingerprinting approach. The resultsshowed that forest topsoil and channel banks were the mainsources in the Weierbach catchment. Forest topsoil and grasslandtopsoil were the main sources in the Huewelerbach catchment;and grassland topsoil was the main source in the Wollefsbachcatchment. Even though high uncertainty was associated withthe results, it was possible to observe the temporal variability ofsuspended particle characteristics when looking at the modalbehaviour (centroid of the likelihood weighted confidence inter-
vals). This variability was attributed to changes in the compositionof suspended solids caused by the changing source areas.
The results obtained using the colour-based fingerprinting ap-proach was compared with those obtained by applying the classi-cal fingerprinting approach (i.e. using geochemical, radionuclideand organic tracers). This comparison showed that 94% of the cen-troid suspended sediment source ascriptions estimated using thecolour-based fingerprinting approach, in the three study catch-ments, were within the estimated confidence bounds of the esti-mates provided by the classical fingerprinting approach. Theconsistency of the results prompted further work to explore thepotential for using colour measurements on small amounts of sed-iment obtained from instantaneous samples and retained on glassfibre filters to successfully investigate both source variability dur-ing runoff events and the source of sediment transported duringlow flow conditions, when suspended sediment concentrationsare low.
Particle colour has been shown to be a useful, fast and easilymeasurable sediment property for use in sediment source finger-printing procedures. However, even though high uncertaintyranges were associated with some estimates of sediment sourcecontributions, because different combinations of source tracer val-ues achieved similar high GOF values (equifinality), the estimatedcentroid source contributions were seen to be highly stable. Conse-quently although in some cases the results were not well con-strained, it was still possible to identify the primary suspendedsediment sources by applying a three-tracer mixing model.
The use of particle colour to trace suspended sediment is seento be an important development, in terms of the cost-effectivenessof applying composite fingerprinting procedures, since sedimentcolour represents an easily and rapidly measured sediment prop-erty. Nevertheless, the capability of colour coefficients to discrim-inate between potential sediment sources would be lower incatchments where inter-source colour variability is low, and/orwhere there is a higher number of potential sources. In the lattercase, combining geochemical tracers with colour coefficients couldincrease the dimensionality of the data sets for the catchmentswere there is a lack of dimensionality when using only one groupof tracers (e.g. colour coefficients) in isolation.
Moreover, the procedures used in this study offer considerablepotential for further exploiting the fingerprinting approach using

62 N. Martínez-Carreras et al. / Journal of Hydrology 382 (2010) 49–63
spectral reflectance data and for extending its use to routine inves-tigations. Spectral reflectance measurements offer the potential toprovide estimates of geochemical sediment properties through cal-ibration of spectral reflectance data against direct measurementsof sediment geochemistry, using partial least-square regressionmodels; and the potential adaptability of diffuse reflectance spec-troscopy measurement techniques for in situ field use (ViscarraRossel and McBratney, 1998).
Acknowledgments
This study was supported by the ‘‘Ministère de l’EnseignementSupérieur et de la Recherche du Grand-Duché de Luxembourg”. N.Martínez-Carreras was the beneficiary of a grant funded by the Na-tional Research Fund of Luxembourg. The authors would like tothank A. Kies and Z. Tosheva from the Radiation Physics Laboratoryat the University of Luxembourg for radionuclide analysis, and the‘Administration des Services Techniques de l’Agriculture’ in Ettel-bruck (Luxembourg) for C and N analysis, and F. Barnich at theCRP-Gabriel Lippmann for his help with the P analysis. Thanksare also extended to S. Mader from the Remote Sensing Depart-ment at Trier University, for writing the code for extracting CIE col-our values from FieldSpec2 spectra. The authors also wish to thankthe two anonymous reviewers for their insightful comments on anearlier version of the manuscript.
References
Ben-Dor, E., 2002. Quantitative remote sensing of soil properties. Advances inAgronomy 75, 173–243.
Ben-Dor, E., Irons, J.R., Epema, G.F., 1998. Soil reflectance. In: Rencz, A.N. (Ed.),Remote Sensing for the Earth Sciences. Manual of Remote Sensing. John Wiley &Sons, New York, pp. 111–188.
Beven, K.J., Binley, A.M., 1992. The future of distributed models: calibration andpredictive uncertainty. Hydrological Processes 6, 279–298.
CIE, 1931. In: Commission Internationale de l’Eclairage Proceedings. CambridgeUniversity Press, Cambridge.
Collins, A.L., Walling, D.E., 2002. Selecting fingerprint properties for discriminantpotential suspended sediment sources in river catchments. Journal ofHydrology 261, 218–244.
Collins, A.L., Walling, D.E., 2004. Documenting catchment suspended sedimentsources: problems, approaches and prospects. Progress in Physical Geography28, 159–196.
Collins, A.L., Walling, D.E., Leeks, G.J.L., 1997a. Source type ascription for fluvialsuspended sediment based on a quantitative composite fingerprintingtechnique. Catena 29, 1–27.
Collins, A.L., Walling, D.E., Leeks, G.J.L., 1997b. Use of geochemical record preservedin floodplain deposits to reconstruct changes in river catchment sedimentsources. Geomorphology 19, 151–167.
Collins, A., Walling, D.E., Leeks, G.J.L., 1998. Use of composite fingerprints todetermine the provenance of the contemporary suspended sediment loadtransported by rivers. Earth Surface Processes and Landforms 23, 31–52.
DeBoer, D.H., 1997. Changing contribution of suspended sediment sources in smallcatchments resulting from European settlement on the Canadian prairies. EarthSurface Processes and Landforms 22, 623–639.
Eisma, D., Van der Gaast, S.J., Martin, J.M., Thomas, A.J., 1993. Suspended matter andbottom sediments of the Orinoco delta: turbidity, mineralogy and elementarycomposition. Netherlands Journal of Sea Research 12, 224–251.
Foster, I.D.L., Lees, J.A., 2000. Tracers in geomorphology. In: Foster, I.D.L. (Ed.),Tracers in Geomorphology. Wiley, Chichester, pp. 3–20.
Foster, I.D.L., Walling, D.E., 1994. Using reservoir deposits to reconstruct changingsediment yields and sources in the catchment of the Old Mill reservoir, SouthDevon, UK, over the past 50 years. Hydrological Sciences Journal 39, 347–368.
Franks, S.W., Rowan, J.S., 2000. Multi-parameter fingerprinting of sediment sources:uncertainty estimation and tracer selection. In: Bentley, L.R., Brebbia, C.A., Gray,W.G., Pinder, G.F., Sykes, J.F. (Eds.), Computational Methods in Water Resources.Balkema, Rotterdam, pp. 1067–1074.
Froehlich, W., Walling, D.E., 1997. The role of unmetalled roads as a sedimentsource in the fluvial systems of the Polish Flysch Carpathians. In: Walling, D.E.,Probst, J.-L. (Eds.), Human Impacts on Erosion and Sedimentation, vol. 245.Wallingford, IAHS Publ., Berlin, pp. 159–168.
Grimshaw, D.L., Lewin, J., 1980. Source identification for suspended sediment.Journal of Hydrology 47, 151–162.
Gruszowski, K.E., Foster, I.D.L., Lees, J.A., Charesworth, S.M., 2003. Sediment sourcesand transport pathways in a rural catchment, Herefordshire, UK. HydrologicalProcesses 17, 2665–2681.
He, Q., Owens, P.N., 1995. Determination of suspended sediment provenance usingcaesium-137, unsupported lead-210 and radium-226: a numerical mixingmodel approach. In: Foster, I.D.L., Gurnell, A.M., Webb, B.W. (Eds.), Sedimentand Water Quality in River Catchments. John Wiley, Chichester, pp. 207–227.
Higgitt, D.L., Walling, D.E., 1993. The value of caesium-137 measurements forestimating soil erosion and sediment delivery in an agricultural catchment,Avon, UK. In: Wicherek, S. (Ed.), Farm Land Erosion in Temperate PlainsEnvironments and Hills. Elsevier, Amsterdam, pp. 301–305.
Joerin, C., Beven, K.J., Iorgulescu, I., Musy, A., 2002. Uncertainty in hydrographseparation based on geochemical mixing models. Journal of Hydrology 255, 90–106.
Judd, D.B., Wyszecki, G., 1975. Color in Business, Science and Industry, Third ed.John Wiley & Sons, New York.
Krein, A., Petticrew, E., Udelhoven, T., 2003. The use of fine sediment fractaldimensions and colour to determine sediment sources in a small watershed.Catena 53, 165–179.
Krein, A., Salvia-Castellví, M., Iffly, J.F., Barnich, F., Matgen, P., Van de Bos, R., Pfister,L., Hoffmann, L., Kies, A., 2007. Uncertainties in chemically hydrographseparation. In: Pfister, L., Hofmann, L. (Eds.), Uncertainties in the ‘monitoring-conceptualisation-modelling’ sequence of catchment research. IHP-VI TechnicalDocument in Hydrology, no. 81. Unesco, Paris, pp. 21–26.
Lees, J.A., 1997. Mineral magnetic properties of mixtures of environmental andsyntethetic materials: linear additivity and interactions effects. GeophysicalJournal International 131, 335–346.
Lees, J.A., Pethick, J.S., 1995. Problems associated with quantitative magneticsourcing of sediment of the Scarborough to Mablethorpe coast, northeastEngland, UK. Earth Surface Processes and Landforms 20, 795–806.
Levin, N., Ben-Dor, E., Singer, A., 2005. A digital camera as a tool to measure colourindices and related properties of sandy soils in semi-arid environments.International Journal of Remote Sensing 26, 5475–5492.
Martínez-Carreras, N., Gallart, F., Iffly, J-F., Pfister, L., Walling, D.E., Krein, A., 2008.Uncertainty assessment in suspended sediment fingerprinting based on tracermixing models: a case study from Luxembourg. In: Schmidt, J., Cochrane, T.,Phillips, C., Elliott, S., Davies, T., Basher, L. (Eds.), Sediment Dynamics inChanging Environments, vol. 325. IAHS Publ., Wallingford, pp. 94–105.
Melville, D., Atkinson, G., 1985. Soil colour: its measurement and its designation inmodels of uniform colour space. European Journal of Soil Science 36, 495–512.
Merefield, J.R., 1995. Sediment mineralogy and the environmental impact ofmining. In: Foster, I.D.L., Gurnell, A.M., Webb, B.W. (Eds.), Sediment and WaterQuality in River Catchments. Joan Wiley, Chichester, pp. 145–160.
Motha, J.A., Wallbrink, P.J., Hairsine, P.B., Grayson, R.B., 2003. Determining thesources of suspended sediment in a forested catchment in southeasternAustralia. Water Resources Research 39, 1056.
Motha, J.A., Wallbrink, P.J., Hairsine, P.B., Grayson, R.B., 2004. Unsealed roads assuspended sediment sources in an agricultural catchment in south-easternAustralia. Journal of Hydrology 286, 1–18.
Murphy, J., Riley, J.-P., 1962. A modified single solution method for thedetermination of phosphate in natural waters. Analytical Chimica Acta 27,31–36.
Olley, J., Caitcheon, G., 2000. Major element chemistry of sediment from theDarling–Barwon River and its tributaries: implications for sediment andphosphorous sources. Hydrological Processes 14, 1159–1175.
Owens, P.N., Walling, D.E., Leeks, G.J.L., 2000. Tracing fluvial suspendedsediment sources in the catchment of the River Tweed, Scotland, usingcomposite fingerprints and a numerical mixing model. In: Foster, I.D.L.(Ed.), Tracers in Geomorphology. John Wiley & Sons Ltd., Chichester, pp.291–307.
Peart, M.R., 1993. Using sediment properties as natural tracers for sedimentsources: two studies from Hong Kong. In: Peters, N.E. (Ed.), Tracers inHydrology, vol. 215. IAHS Publ., Wallingford, pp. 313–318.
Peart, M.R., Walling, D.E., 1986. Fingerprinting sediment sources: the example of adrainage catchment in Devon, UK. In: Hadley, R.F. (Ed.), Drainage BasinSediment Delivery, vol. 159. IAHS Publ., Wallingford, pp. 41–55.
Pfister, L., Wagner, C., Vansuypeene, E., Drogue, G., Hoffmann, L., 2005. AtlasClimatique du Grand-Duché de Luxembourg. Musée national d’histoirenaturelle, Société des naturalistes luxembourgeois, Centre de Recherce Public-Gabriel Lippmann, Administration des services techniques de l’agriculture,Luxembourg, 80 p.
Pfister, L., Barnich, F., Bouchet, A., El Idrissi, A., Hoffmann, L., Iffly, J.F., Matgen, P.,Salvia-Castellví, M., Taillez, C., Van-den-Bos, R., Hofmann, H., Kies, A., Stellato, L.,Tosheva, Z., 2006. Cycleau project final report. National Research Fund –Program ‘Eau’. Centre de Recherche Public-Gabriel Lippmann, DépartementEnvironnement et Biotechnologies and Uniersité du Luxembourg, Laboratoirede Physique des Radiations.
Phillips, J.D., Marion, D.A., 2001. Residence times of alluvium in as east Texas streamas indicated by sediment color. Catena 45, 49–71.
Phillips, J.M., Russell, M.A., Walling, D.E., 2000. Time-integrated sampling of fluvialsuspended sediment: a simple methodology for small catchments. HydrologicalProcesses 14, 2589–2602.
Post, D.F., Levine, S.J., Bryant, R.B., Mays, M.D., Batchily, A.K., Escadafal, R., Huete,R.A., 1993. Correlation between field and laboratory measurement of soilcolour. In: Bigham, J.M., Ciolkosz, E.J. (Eds.), Soil Color, Soil Science and Societyof America. Madison, WI, pp. 35–50.
Rauber, T.W., 1994. Inductive Pattern Classification, -Methods-Features-Sensors-,PhD thesis, Universidade Nova de Lisboa, Facultade de Ciências e Tecnologia,Lisboa, Portugal, 173 p.

N. Martínez-Carreras et al. / Journal of Hydrology 382 (2010) 49–63 63
Rowan, J.S., Goodwill, P., Franks, S.W., 2000. Uncertainty estimation infingerprinting suspended sediment sources. In: Foster, I.D.L. (Ed.), Tracers inGeomorphology. John Wiley & Sons Ltd., Chichester, pp. 279–290.
Russell, M.A., Walling, D.E., Hodgkinson, R.A., 2001. Suspended sediment sources intwo small lowland agricultural catchments in the UK. Journal of Hydrology 252,1–24.
Salvia-Castellví, M., Iffly, J.F., Borght, P.V., Hoffmann, L., 2005. Dissolved andparticulate nutrient export from rural catchments: a case study fromLuxembourg. The Science of the Total Environment 344, 51–65.
Shields, J.A., Arnaud, S.T., Paul, E.A., Clayton, J.S., 1966. Measurement of soil colour.Canadian Journal of Soil Science 4, 83–90.
Small, I.F., Rowan, J.S., Franks, S.W., Wyatt, A., Duck, R.W., 2004. Sedimentfingerprinting using a Bayesian approach yields a robust tool forenvironmental forensic applications. In: Croft, D.A., Pye, K. (Eds.), ForensicGeosciences Principles Techniques and Applications, 232. Geological Society,London, pp. 207–213 (Special publication).
Udelhoven, T., Symader, W., 1995. Particle characteristics and their significance inthe identification of suspended sediment sources. In: Leibundgut, Ch. (Ed.),Tracer Technologies for Hydrological Systems, vol. 229. IAHS Publ., Wallingford,pp. 153–162.
Udelhoven, T., Nagel, A., Gasparini, F., 1997. Sediment and suspended particleinteractions during low flow in a small heterogeneous catchment. Catena 30,135–147.
Udelhoven, T., Novozhilov, M., Schmitt, J., 2003. The NeuroDeveloper�: a tool for
modular neural classification of spectroscopic data. Chemometrics andIntelligent Laboratory Systems 66, 219–226.
Van den Bos, R., Hoffmann, L., Juilleret, J., Matgen, P., Pfister, L., 2006. Conceptualmodelling of individual HRU’s as a trade-off between bottom-up and top-downmodelling, a case study. In: Conf. Environmental Modelling and Software. Proc.3rd Biennal meeting of the international Environmental Modelling andSoftware Society. Vermont, USA.
Viscarra Rossel, R.A., McBratney, A.B., 1998. Laboratory evaluation of a proximalsensing technique for simultaneous measurement of clay and water content.Geoderma 85, 19–39.
Viscarra Rossel, R.A., Minasny, B., Roudier, P., McBratney, A.B., 2006. Colour spacemodels for soil science. Geoderma 133, 320–337.
Walden, J., Slattery, M.C., 1997. Use of mineral magnetic measurements tofingerprint suspended sediment sources: approaches and techniques for dataanalysis. Journal of Hydrology 202, 353–372.
Walling, D.E., 2005. Tracing suspended sediment sources in catchments and riversystems. The Science of the Total Environment 344, 159–184.
Walling, D.E., He, Q., 1994. Rates of overbank sedimentation in the floodplains ofseveral British rivers during the past 100 years. In: Olive, L.J., Loughran, R.J.,Kesby, J.A. (Eds.), Variability in Stream Erosion and Sediment Transport, vol.224. IAHS Publ., Wallingford, pp. 203–310.
Walling, D.E., Woodward, J.C., 1992. Use of radiometric fingerprints to deriveinformation on suspended sediment sources. Erosion and Sediment TransportMonitoring Programmes in River Catchments, vol. 210. IAHS Publ., Wallingford,pp. 153–164.
Walling, D.E., Woodward, J.C., 1995. Tracing sources of suspended sediment in rivercatchments: a case study of the River Culm, Devon, UK. Marine and FreshwaterResearch 46, 327–336.
Walling, D.E., Peart, M.R., Oldfield, F., Thompson, R., 1979. Suspendedsediment sources identified by magnetic measurements. Nature 281,110–113.
Walling, D.E., Woodward, J.C., Nicholas, A.P., 1993. A multiparameter approach tofingerprinting suspended sediment sources. In: Peters, N.E., Hoehn, E.,Leibundgut, Ch., Tase, N., Walling, D.E. (Eds.), Tracers in Hydrology, vol. 215.IAHS Publ., Wallingford, pp. 239–338.
Walling, D.E., Owens, P.N., Leeks, G.J.L., 1999. Fingerprinting suspended sedimentsources in the catchment of the River Ouse, Yorkshire, UK. HydrologicalProcesses 13, 955–975.
Walling, D.E., Owens, P.N., Waterfall, B.D., Leeks, G.J.L., Wass, P.D., 2000. Theparticle size characteristics of fluvial suspended sediment in the Humber andTweed catchments, UK. The Science of the Total Environment (251/252),205–222.
Wyszecki, G., Stiles, W.S., 1967. Colour Science: Concepts and Methods,Quantitative Data and Formulae, First ed. John Wiley & Sons Ltd., New York.p. 628.
Ziegler, A.D., Giambelluca, T.W., 1997. Importance of rural roads as source areas forrunoff in mountainous areas of northern Thailand. Journal of Hydrology 196,204–229.
Copyright © 2022 FDOKUMEN