Pressure drop and flow distribution characteristics of single ...
Upload
independentCategory
view
1download
0
Fluvial adjustment of the Lower Jordan River to a drop
in the Dead Sea level
Marwan A. Hassan a,*, Micha Klein b
aDepartment of Geography, Hebrew University of Jerusalem, Mount Scopus, Jerusalem 91905, IsraelbDepartment of Geography, Haifa University, Mount Carmel, Haifa 31905, Israel
Received 27 August 1999; received in revised form 14 July 2000; accepted 14 October 2001
Abstract
Water utilization in the upper part of the Jordan Basin has led to a significant reduction in inflow to the Dead Sea. Over the
last 70 years, a drop of about 22 m in mean sea level has occurred and has resulted in a continual adjustment of the Lower
Jordan River. The impacts of this lowering on the channel morphology of the Lower Jordan River were examined using aerial
photographs. Until the late 1970s, the drop in the sea level was small but still led to channel extension. Since the early 1980s, a
rapid drop in sea level took place leading to major changes in channel morphology and deep incisions. The greatest change in
channel width was recorded near the river mouth. Between 1850 and 1980, there were only insignificant changes in channel
sinuosity, but subsequently, a 25% increase of channel sinuosity has been recorded. Most of changes in the channel sinuosity
were recorded in the newly exposed area. Over the last 30 years, the active channel width has narrowed by almost four times.
Until the late 1980s, the channel was relatively stable with minor bank collapses and only one bar detected near the Jisr
Abdallah. During the 1990s, a number of bars developed along the channel. The downcutting is in parallel with the sea level
drop resulting in the development of terraces along the lower part of the study reach. In 1983, the channel incision reached 8 km
upstream and by 1993 it was about 11 km. D 2002 Elsevier Science B.V. All rights reserved.
Keywords: Base level; Dead Sea level; Bar; Sinuosity; Downcutting; Channel adjustment
1. Introduction
Both geomorphologists and geologists have long
recognized the relatively important role that base level
changes play in controlling the behaviour of alluvial
channels. Rivers are expected to respond to base level
changes by degradation, aggradation, changes in chan-
nel pattern and geometry or a combination of these.
Lowering the base level can cause the initiation of
gullies and degradation, development of channel ter-
races, knickpoint migration and acceleration of bank
erosion (e.g., Begin et al., 1981). Adjustment will
begin at the mouth of the stream and propagate up-
stream through the stream system (Bonneau and Snow,
1992).
The response of a river to a change in base level is
complex and difficult to forecast. The complexity of
the river response to base level changes is due to the
large number of controls on the fluvial system. Var-
iables that seem to be significant can be lumped into
three groups (Schumm, 1993): (1) base level controls
0169-555X/02/$ - see front matter D 2002 Elsevier Science B.V. All rights reserved.
PII: S0169 -555X(01 )00187 -8
* Corresponding author. Department of Geography, University
of British Columbia, Vancouver, B.C., Canada V6T 1Z2.
E-mail addresses: [email protected] (M.A. Hassan),
[email protected] (M. Klein).
www.elsevier.com/locate/geomorph
Geomorphology 45 (2002) 21–33

(e.g., magnitude, direction, rate, duration), (2) geo-
logical controls (e.g., lithology, structure) and (3) geo-
morphic controls (e.g., river morphology, valley
morphology, surface gradient).
A relative fall in the base level will increase drain-
age basin relief and increase the potential energy
available in the landscape (Summerfield, 1991). A fall
in the base level can also lead to erosion and incision of
a fluvial system. However, this will usually depend on
the inclination of the ‘‘newly exposed area.’’ Three
different cases have been distinguished: (1) deposition
occurring when the slope of the ‘‘new’’ area is lower
than that of the channel, (2) no change when the slope
of the ‘‘new’’ area is similar to that of the channel and
(3) downcutting, knickpoint migration and develop-
ment of terraces when the slope of the ‘‘new’’ area is
steeper than that of the channel (Summerfield, 1991).
Our knowledge of the impact of base level low-
ering on fluvial systems is derived largely from flume
experiments (e.g., Begin et al., 1980, 1981; Gardner,
1983) and simulation models (e.g., Van der Pool,
1982; Begin, 1987; Slingerland and Snow, 1988;
Bonneau and Snow, 1992). Based on flume experi-
ments, Begin et al. (1981) examined the impact of
base level lowering on the development of the longi-
tudinal profile of the channel, the sediment discharge
at the outlet and the rate of knickpoint migration. All
three aspects of the process were then integrated
through a basic diffusion model. His flume experi-
ments suggest that the final profile of a stream will
tend to be parallel to the original one. However, the
final bed gradient may be steeper in the case of he-
terogeneous material when an armouring process
accompanies the incision (Begin et al., 1981). Brush
and Wolman (1960) observed a steeper final gradient
in flume experiments in which artificial knickpoints
were created in the mid-flume locations. An exponen-
tial decrease in erosion in the upstream direction was
suggested by Hamblin et al. (1981).
A review of the literature indicates that there are
few field studies that have examined the impact of base
level lowering on a fluvial system or have determined
the rate at which disturbance following the lowering of
base level moves through the fluvial system (e.g.,
Whitten and Patrick, 1981; Robbins and Simon,
1983; Rockwell et al., 1984; Schumm et al., 1984;
Schumm, 1993; Yodis and Kesel, 1993). A key ques-
tion is, how much time is needed to reach a new
equilibrium following the lowering of base level (see
Yodis and Kesel, 1993). Using several field examples,
Leopold and Bull (1979) asserted that base level chan-
ges affect the vertical position of a river only locally
and even then to a minor extent. In addition to gradient
adjustment, they argued that parts of the effect of base
level changes are absorbed in the adjustments of chan-
nel pattern, roughness and shape. The direction of
change, the magnitude, rate and duration of change
appear to be important variables. Large changes are
likely to cause river incision and, in the case of very
large changes, they may affect the entire drainage
basin. In addition, the amount and type of change in
the fluvial system are both affected by the rate and
duration of change (Yoxall, 1969; Wood et al., 1992).
With rapid incision, flows will cause deep channels
resulting in increasing flow energy that, in turn, accel-
erates the effects of base level lowering (Schumm,
1993). Based on observations made in the southwes-
tern U.S.A., Schumm et al. (1984) stated that, follow-
ing the initial incision, flows were concentrated in the
newly enlarged channel, with the incision moving
upstream. In the case of the mouth of a large stream
with sufficient discharge, uniform incising is possible,
with all of the base level lowering transmitted up-
stream (Merritts and Vincent, 1989).
Due to water utilization in the upper part of the
Jordan basin, inflows to the Dead Sea from the Jordan
River have been reduced significantly. As a result, the
Dead Sea level dropped from � 392 m in the early
1930s to � 414 m in 1998—a total sea level drop of
22 m, averaging about 32 cm per a year. The purpose
of this paper is to examine the effects of base level
lowering on the channel morphology of the southern
end of the Lower Jordan River. The recent chronology
and rate of channel changes through the lower reach
of the river caused by the lowering of the base level—
changes in the longitudinal profile and channel plan-
form—are documented.
2. The Jordan Basin
The Jordan River is situated along the Jordan Rift
Valley and drains an elongated area of 17665 km2
(Schattner, 1962; Fig. 1). The Rift Valley trends
north–south and has a 15-km wide depression in
which the Dead Sea acts as a regional base level.
M.A. Hassan, M. Klein / Geomorphology 45 (2002) 21–3322

The depression is bounded on both sides by normal
faults (Freund et al., 1970; Begin, 1974). The basin
extends from Mount Hermon in the north to the Dead
Sea in the south. The average annual precipitation
diminishes from 1600 mm in the north (Mount Her-
mon) to 250 mm south of the Sea of Galilee and to
about 100 mm near the Dead Sea.
Most of the valley bottom south of the Sea of
Galilee is covered with Lisan marl, deposited in Lake
Lisan, which occupied the region during the last
glaciations, 60,000–18,000 years B.P. (Begin, 1974;
Begin et al., 1985). In the Lisan marl, laminated
deposits are discernable, with alternating thin layers
of fine-grained clastic material and layers of aragonite.
The drainage basin is divided into two parts. The
upper Jordan River drains into the Sea of Galilee
while the Lower Jordan River is situated between the
Sea of Galilee and the Dead Sea. Hence, floods
occurring in the upper Jordan River have no direct
impact on the lower part. The meandering river south
of the Sea of Galilee is incised in fine sediment of the
Lisan formation. The Sea of Galilee and Yarmouk
River are the two main sources of water to the Lower
Jordan River. The river floodplain is called Zor and on
both sides of the Zor a 30–50-m high slope leads to
the ancient elevated valley floor called Ghor. The
majority of the tributaries are wadis or seasonal
streams that carry water on only a limited number of
days each winter.
The flow regime of the river has been altered se-
veral times. In 1932, a barrage was built at the exit of
the river from the Sea of Galilee to regulate the out-
flow for hydropower purposes. The main goals of the
dam were to reduce the winter flows and to store
water for summer release. After 1948, the hydropower
station was abandoned and the barrage became part of
the irrigation system of the Lower Jordan Valley
(Schattner, 1962). In 1964, the Israeli National Water
Carrier was completed which diverted water from the
Sea of Galilee. In the late 1960s and early 1970s, the
Jordanians diverted a large proportion of the base flow
from the Yarmouk. Water utilization has a tremendous
impact on the Lower Jordan base flow. However, the
main source of floods in the Lower Jordan is the Yar-
mouk River winter floods.
Flow data have been collected for various periods
along the Lower Jordan River (Fig. 1). The Daganya
station has operated since 1926 and is located near the
outlet of the Sea of Galilee. The other stations are
Nahrayim (since 1977), Jisr El Majama (1934–1944),
Allenby Bridge (1932–1943) and Adasia on the
Yarmouk River (since 1988). The Nahrayim and Jisr
El Majama stations can be considered for joint anal-
ysis because of their proximity (6 km) to each other
and because there is no tributary between them.
Although the stations cover two different periods of
record, they can be used to assess changes in the flow
regime of the Lower Jordan River due to water
utilization.
Fig. 2 presents the frequency of annual peak flows
of the Lower Jordan River and the Yarmouk. Most of
the contemporary floods in the Lower Jordan River
are due to the contribution only of the Yarmouk River.
During years of heavy rainfall the flow from the Upper
Jordan River and the Sea of Galilee contributes to
increased flooding of the Lower Jordan Valley. Al-
though the largest two floods in the Lower Jordan
River were recorded during the 1934–1944 period, the
bulk of the data for the two periods overlap (Fig. 2).
Both periods yielded about the same mean annual
flood of 250 m3 s� 1. For recurrence intervals of 2
years or more, the two records coincide. The mean
annual flood of the Yarmouk River for the observation
period, which is rather short, is 90 m3 s� 1 (Fig. 2).
Although the flood magnitudes are lower, the flood
analyses of the Yarmouk station revealed a pattern
similar to that obtained for Nahrayim. Fig. 2 shows
that water diversion did not significantly change the
magnitude of the large floods in the Lower Jordan
River. However, the effect of water utilization becomes
evident for flows with recurrence interval less than 1.8
years, where data from Jisr El Majami station exceed
those from Naharayim by a factor of seven.
The mean flow has been altered significantly. Prior
to the main water diversion by Israel and Jordan, the
yearly discharge of the Lower Jordan River ranged
between 648 and 1680 Mm3/year with a mean dis-
charge of 1250 Mm3/year (Schattner, 1962; Klein,
1985). Between 1964 and 1970, Israel diverted about
200 Mm3/year out of the basin from the Sea of Galilee.
Since 1971, the amount has increased to about 350
Mm3/year (Klein, 1998) and some 60 Mm3/year
pumped for local use. As a result, the annual discharge
from the Sea of Galilee at the Daganya gauge station
has decreased from 480 to about 70 Mm3/year (Klein,
1985, 1998). The mean annual discharge of the Yar-
M.A. Hassan, M. Klein / Geomorphology 45 (2002) 21–33 23

Fig. 1. The Jordan River system and the study area.
M.A. Hassan, M. Klein / Geomorphology 45 (2002) 21–3324

mouk is estimated at 445 Mm3/year, of which Jordan
initially diverted about 70 Mm3/year in the mid 1960s
subsequently increased during the 1970s to about 200
Mm3/year. In addition, about 150 Mm3/year has been
diverted by Syria (Klein, 1998, 1999). Overall, flow in
the Lower Jordan River dropped from 1250 Mm3/year
prior to the water diversion in the early 1960s to 213
Mm3/year by the end of the 1980s and then to 150
Mm3/year by 1998 (Klein, 1998). In the last 21 years,
there are only eight occasions when the gates of the
Daganya dams have been opened for water release to
the Dead Sea as a result of lack of storage in the Sea of
Galilee.
3. Methodology
Fieldwork in the area is not possible because the
river course forms the border between Jordan and
Israel. In addition, on both sides of the border, a large
number of land mines were carried by the river floods
and are scattered throughout the floodplain area.
Accordingly, assessment of changes in the southern
end of the Lower Jordan channel is based on analyses
of aerial photographs from the years 1946, 1971, 1980,
1983, 1991, 1992, 1993 and 1995 obtained from the
Survey of Israel. Prior to 1946, channel pattern was
determined using a map prepared in 1850 by Lynch
(1850, 1852; see also Schattner, 1962). The aerial
photographs have a scale of 1:15,000 except those of
1971 (1:50,000) and 1991 (1:45,000). The channel
profile was determined photogrammetically by taking
very frequent height readings along the water surface
during low flows. The photogrammetric work was
completed using a stereoplotter at the Israel Mapping
Centre. It is assumed that a low flow water surface
provides a good approximation of the bed profile. In
some places the vegetation was very dense and an
accurate reading was difficult to obtain. The estimated
error of the longitudinal profile readings at the 1:15,000
Fig. 2. Annual flood frequency analyses of the Lower Jordan River and Yarmouk River at different gauge stations (MAF=mean annual flood).
M.A. Hassan, M. Klein / Geomorphology 45 (2002) 21–33 25

scale is in the order of few cm (up to 10 cm) while it
could reach a few tens of cm (up to 70 cm) in the case of
the 1:50,000 scale. On average, at least 50 measure-
ments were taken for every kilometre of channel length.
To reduce the effect of errors in our measurements, the
water surface profile was determined by using a run-
ning average of 10 readings.
4. Observations
4.1. Dead sea: sea level and bathymetry
The Dead Sea monthly level data were obtained
from the Israel Hydrological Service. Fig. 3 presents
changes in sea level over time. Between 1930 and
1937, the sea level dropped by 4 m and then remained
essentially constant between 1938 and 1956. A drop of
3 m was recorded between 1956 and 1962 and no
change in the sea level was observed during the years
1963–1972. Since 1973, a rapid drop of about 15 m in
the sea level has been observed. The bathymetry of the
Dead Sea coastal area was determined by surveying a
cross-section at the Lido, about 4 km west of the
contemporary river mouth (Fig. 4; for cross-section
location, see Fig. 5). It is assumed that the cross-section
represents the frontal part of the river’s delta. The
surveyed cross-section was matched with the sea level
using the 1946 benchmark. Up to the late 1980s, the
rapid decline in the Dead Sea level resulted in the ex-
posure of a wide area with a relatively low slope of
1.7%. In addition, the slope of the river in the exposed
area is about that of the sea floor, (about 2%). Since
then, further falls in base level have exposed a narrow,
relatively steep area with an average sea-floor slope of
14%. The rapid decline in sea level has resulted in up-
stream progressing incision of the channel beds of most
wadis that drain into the Dead Sea (Schechnovitz-Pir-
tel, 1999). In the Jordan mouth, the slope of the newly
exposed area is steeper than that of the river, leading to
possible downcutting along the main channel.
4.2. Longitudinal profiles
Fig. 6 shows the longitudinal profiles of the river
toward the river mouth between 1946 and 1993. Dis-
tance in Fig. 6 is measured along the water line. In
addition, the bankfull profile of 1932 and the Dead Sea
level are shown (Schattner, 1962). In 1932, the distal
bankfull level was 392 m below mean sea level. The
figure shows a clear trend of downcutting. Between
1946 and 1980, an upstream cutting of about 7 km
along the main channel is evident. The response was
very rapid because the channel is incised in relatively
fine and highly erodable material. Up to 1983, theFig. 3. Changes in Dead Sea level over time.
Fig. 4. Dead Sea bathymetry along the Lido cross-section, about 4
km west of the river mouth (for location, see Fig. 5). The Dead sea
level is shown on the profile.
M.A. Hassan, M. Klein / Geomorphology 45 (2002) 21–3326

Fig. 5. View of the Jordan River between Nahal Perat and the Dead Sea (photo taken in 1995). Points 1, 2 and 3 in Fig. 8 are indicated.
Measured channel widths (River Mouth, Middle Point and Jisr Abdallah in Fig. 6) and the Lido cross-section (in Fig. 4) are indicated.
M.A. Hassan, M. Klein / Geomorphology 45 (2002) 21–33 27

channel headward incision reached about 8 km
upstream from the river mouth. By 1993 the headward
incision had reached about 11 km (Fig. 6).
Using the 1973 and 1981 aerial photographs, a
cross-section 1.5 km upstream of the river mouth was
carried out. During the same period, the sea level
dropped by 4 m. In 1973, the low water level depth
relative to the bankfull level was 6.1 m at the east
bank and 6.5 m at the west bank. The measured
values for 1981 were 10.6 and 10.6 m, respectively.
This implies a downcutting of 4 m over the period,
which is identical to the rate of sea level fall during
the same period.
4.3. Channel width
Changes in bankfull channel width were examined
using aerial photographs taken between 1968 and
1995. Since all examined photographs were taken in
the dry summer season, errors associated with the river
level are expected to be minimal. The bankfull width
was measured in three locations along the river chan-
nel; near the river mouth, midway between the mouth
and the Jisr Abdallah and near the Jisr Abdallah (Fig.
5). Bankfull was measured as the distance between
vegetation found on both banks. Changes in the chan-
nel width are presented in Fig. 7. The greatest change in
channel width is recorded near the river mouth. During
the study period, a general decline in channel width was
evident. A similar trend in channel width was recorded
in the other two sites, although with less severity than
near the river mouth. The variation in channel width
between stations was initially high due to degradation
of the recently exposed area. Variation in the width is
significantly lower in the later time periods since the
channel has become progressively incised.
4.4. Channel morphology
Channel bars, bank stability and sediment supplies
from banks to the main channel were examined using
all available aerial photographs. Two examples, 1968
and 1995, of channel morphology are shown in Fig. 8.
For clarity, only the lowermost 350 m is displayed.
The other reaches are similar. Both the 1946 and 1968
photographs show relatively vertical banks with no
evidence of bank collapse. In addition, no bars were
identified along the active channel. North of the Jisr
Abdallah (Fig. 5), a 10-m long mid-channel bar is evi-
dent in the 1970 photograph. However, this bar was
destroyed between 1970 and 1975. No significant
changes in channel morphology and bank stability
were noted between 1975 and 1981.
During the 1990s, major changes in bar density and
size were observed. In addition, large number of bank
collapses were noted (Fig. 8). A summary of bar cha-
racteristics in 1992 and 1995 is presented in Table 1.
The average bar spacing in 1992 and 1995 was 79 and
Fig. 6. Longitudinal profiles of the study reach as derived from
aerial photographs between 1932 and 1993.
Fig. 7. Changes in the active channel width of the Lower Jordan
River between 1968 and 1995, as derived from aerial photographs
(for location, see Fig. 5 and text). In the figure, we do not report
channel width data near the river mouth for the year 1991–1992
because it was an exceptionally wet winter and raised the sea level
by 2 m, temporarily flooding the area near the river mouth.
M.A. Hassan, M. Klein / Geomorphology 45 (2002) 21–3328

Fig. 8. Successive maps of channel and bar morphology of the Lower Jordan River as derived from aerial photographs.
M.A.Hassa
n,M.Klein
/Geomorphology45(2002)21–33
29
92 m, respectively. Comparing bar locations between
1992 and 1995 shows that a significant number of
bars were destroyed or merged with others to form
larger ones (Table 1). This implies a relatively active
channel during the 1990s in comparison to the 1960s
and 1970s. The 1992 photograph shows that some of
the bars are found immediately downstream of a
meander that was cut during the 1992 flood event
(Fig. 2). It appears that the sediment eroded from the
meander was the main source for forming these bars.
In 1995, new bars were formed near the river mouth.
4.5. River sinuosity
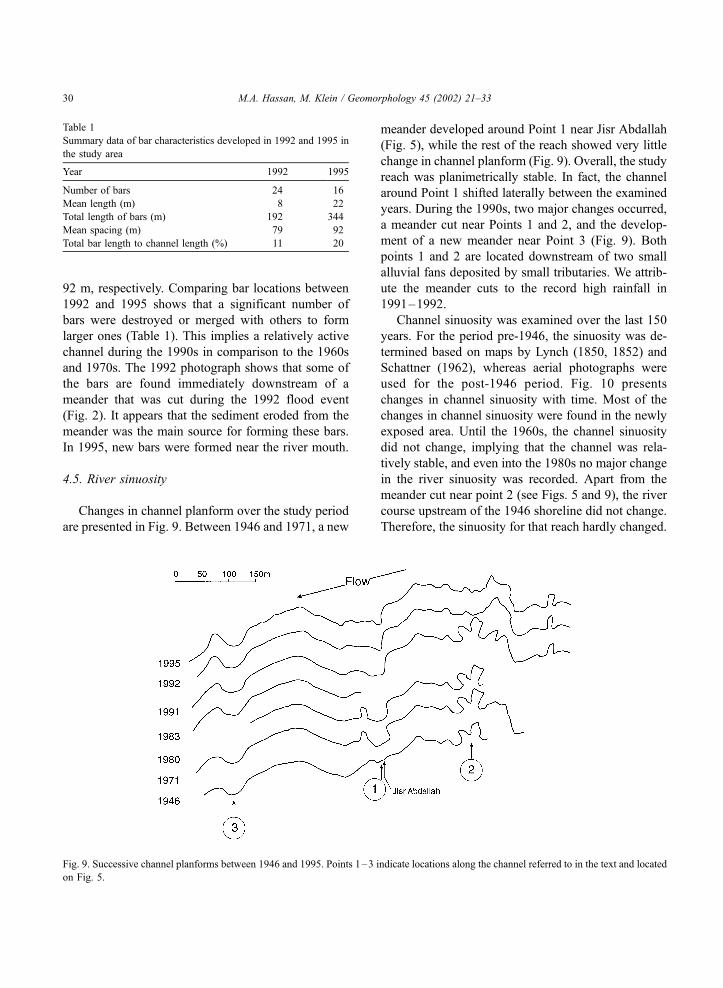
Changes in channel planform over the study period
are presented in Fig. 9. Between 1946 and 1971, a new
meander developed around Point 1 near Jisr Abdallah
(Fig. 5), while the rest of the reach showed very little
change in channel planform (Fig. 9). Overall, the study
reach was planimetrically stable. In fact, the channel
around Point 1 shifted laterally between the examined
years. During the 1990s, two major changes occurred,
a meander cut near Points 1 and 2, and the develop-
ment of a new meander near Point 3 (Fig. 9). Both
points 1 and 2 are located downstream of two small
alluvial fans deposited by small tributaries. We attrib-
ute the meander cuts to the record high rainfall in
1991–1992.
Channel sinuosity was examined over the last 150
years. For the period pre-1946, the sinuosity was de-
termined based on maps by Lynch (1850, 1852) and
Schattner (1962), whereas aerial photographs were
used for the post-1946 period. Fig. 10 presents
changes in channel sinuosity with time. Most of the
changes in channel sinuosity were found in the newly
exposed area. Until the 1960s, the channel sinuosity
did not change, implying that the channel was rela-
tively stable, and even into the 1980s no major change
in the river sinuosity was recorded. Apart from the
meander cut near point 2 (see Figs. 5 and 9), the river
course upstream of the 1946 shoreline did not change.
Therefore, the sinuosity for that reach hardly changed.
Fig. 9. Successive channel planforms between 1946 and 1995. Points 1–3 indicate locations along the channel referred to in the text and located
on Fig. 5.
Table 1
Summary data of bar characteristics developed in 1992 and 1995 in
the study area
Year 1992 1995
Number of bars 24 16
Mean length (m) 8 22
Total length of bars (m) 192 344
Mean spacing (m) 79 92
Total bar length to channel length (%) 11 20
M.A. Hassan, M. Klein / Geomorphology 45 (2002) 21–3330

Since the 1980s, the sinuosity has increased with time
and reached a maximum in 1995. Most of the changes
took place in newly exposed steep areas.
5. Discussion
The adjustment of a river channel to a base level
lowering is complex, with periods of incision fol-
lowed by sediment storage and renewed incision
(Schumm et al., 1987). The rate and extent of channel
adjustment varies from one fluvial system to another
and depends on a large set of variables. However,
most of our knowledge of the impact of a base level
lowering on the fluvial system comes from flume ex-
periments. Due to scale and material differences, the
applicability of the experimental results to natural
rivers is very limited.
Water utilization in the upper part of the Jordan
River reduced the annual flow in the Lower Jordan
River from 1250 to about 150 Mm3/year by the year
1998. The water diversion resulted in the lowering of
the Dead Sea level by about 22 m in the last 68 years
(0.32 m/year). Frequency analysis of the annual flood
indicated that the impact of the water diversion on the
flood magnitude is limited to relatively low flows.
However, large floods in the river are the result of the
combined contribution of both the Upper Jordan River
and the Yarmouk River. Over the last 21 years, only
eight floods had flows that exceeded the mean annual
flood. On average, once every 3 years a large flood
occurs such that it can erode and transport sediment
along the river.
The response of the Jordan River to the lowering of
the Dead Sea base level is controlled by a large number
of variables. These variables include the rate of base
level drop, flow characteristics (frequency and magni-
tude of floods), bed and bank material of the river and
slope of the newly exposed area relative to that of the
river. Since the decline in the sea level is an ongoing
process, it is very difficult to determine the relaxation
time of the fluvial system. In this sense, our analysis is
at an intermediate stage and a final assessment cannot
be made as long as the sea level continues to drop.
In our analysis, we discerned two periods of Jordan
River response to the lowering of sea level: 1930–
1980 and 1980–1997. However, the second stage is
an ongoing process and, therefore, the final response
of the river has not yet been achieved. During the first
period, the sea level dropped by 0.17 m/year and a
relatively gentle and wide foreshore was exposed. The
rate of sea level drop exceeded 0.50 m/year during the
second period and exposed a relatively steep fore-
shore. The response of the river during the first period
was by incision and a gradual decrease in the active
channel width. Few changes, if any, were recorded in
the channel pattern and channel morphology. Even
though in the newly exposed area the river flows
Fig. 10. Changes in channel sinuosity with time as derived from maps and aerial photographs. The sinuosity between 1850 and 1946 was based
on Lynch (1850) and Schattner (1962) maps.
M.A. Hassan, M. Klein / Geomorphology 45 (2002) 21–33 31

through soft, fine sediment over a gentle slope, the
reaction was more of vertical incision than of lateral
shifting as one would expect (for example, see
Schumm, 1993). However, the river is incised in a
relatively confined floodplain and, therefore, the ver-
tical adjustment along the incised channel is the main
option for the river to deal with base level lowering.
Between the 1930s and early 1980s, about 8 km of
headward incision was recorded and therefore the
average upstream migration of the knickpoint was
about 200 m/year. Put in another way, for each 1 m
of sea level drop the upstream migration was about 1
km.
Between 1983 and 1995, within the second period,
the slope of the shelf was much steeper than that of the
river. The channel response was a significant change in
channel morphology and pattern. The channel sinu-
osity increased from an almost straight channel to that
of a meandering channel. The streambed lowering,
during both periods, led to bank heights that were un-
stable, excessive bank erosion and the release of re-
latively large amounts of sediment. This sediment
moved through the fluvial system and was stored in
the form of bars. Such bars did not exist in the lower
part of the river before the 1980s. The existence of bars
will probably reduce further degradation until they
have been flushed out of the system. In the case of
the channel width, the 1990s results indicate a slowing
in the decrease of active width.
The upstream incision rate obtained for the Jordan
River is comparable to values reported in the literature.
The knickpoint migration along the Lower Jordan
River averaged about 0.27 km/year for the last 70
years. Values obtained for Mississippi tributaries
ranged between 0.06 and 0.37 km/year (Yodis and Ke-
sel, 1993). However, all of the Mississippi tributaries
have a smaller drainage area than that of the Jordan
River. According to the reported relation between back
channel erosion and drainage basin area developed for
the Mississippi tributaries (Yodis and Kesel, 1993, Fig.
14), the rate of back erosion by the Jordan River should
be at least one order of magnitude higher than the
measured value. It seems that the Yodis and Kesel
function is suitable only in basins similar to the Mis-
sissippi Basin (for which the function was developed).
The differences between the Mississippi case and ours
could be attributed to differences in flow regime,
morphology and lithology.
6. Conclusions
Over the last 70 years, water diversion from the
upper part of the Jordan River reduced flows into the
Dead Sea. As a result, the Dead Sea level dropped by
0.32 m/year. The drop in the sea level was not evenly
distributed over the period and most of it occurred
since the early 1980s. During the first period (1930–
1980), the base level drop was relatively small (slow)
and the river responded by incising, upstream migra-
tion of the knickpoint and narrowing its width. The
greatest changes in the channel width were recorded
near the river’s mouth. Since the 1980s, the rapid drop
in the base level resulted in upstream incision, bank
collapses, development of mid channel bars, increase
in channel sinuosity, development of terraces and
narrowing of the channel width. However, most of
the increase in the channel sinuosity was limited to the
newly exposed area.
Acknowledgements
The authors thank Na’ama Raz-Yasif for helping
with the aerial photography analyses. This paper
benefited from comments and suggestions made by G.
Brierley, S. Berkowicz and an anonymous reviewer.
References
Begin, B.Z., 1974. The geology in the vicinity of Jericho. Bull.-
Geol. Surv. Isr., Bull. 67, 35 pp.
Begin, B.Z., 1987. ERFUS6—a FORTRAN program for calculat-
ing the response of alluvial channels to baselevel lowering.
Comput. Geosci. 13, 389–398.
Begin, B.Z., Meyer, D.F., Schumm, S.A., 1980. Knickpoint migra-
tion in alluvial channels due to baselevel lowering. J. Waterw.,
Harbors Coastal Eng. Div., Am. Soc. Civ. Eng. 106, 369–388.
Begin, B.Z., Meyer, D.F., Schumm, S.A., 1981. Development of
longitudinal profiles of alluvial channels in response to base-
level lowering. Earth Surf. Processes Landforms 6, 49–68.
Begin, B.Z., Broecker, W., Buchbinder, B., Druckman, Y., Kauf-
man, A., Magaritz, M., Neev, D., 1985. Dead Sea and Lake
Lisan levels in the last 30,000 years: a preliminary report. Re-
port Geol. Survey of Israel No. 29/85, 18 pp.
Bonneau, P.R., Snow, S.R., 1992. Character of headwaters adjust-
ment to base level drop, investigated by digital modeling. Geo-
morphology 5, 475–487.
Brush, L.M., Wolman, M.G., 1960. Knickpoint behaviour in non-
cohesive material: a laboratory study. Geol. Soc. Am., Bull. 71,
59–74.
M.A. Hassan, M. Klein / Geomorphology 45 (2002) 21–3332

Freund, R., Garfunkel, Z., Zak, I., Goldberg, M., Weissbrod, T.,
Derin, B., 1970. The shear along the Dead Sea Rift. Philos.
Trans. R. Soc. London, Ser. A 267, 107–130.
Gardner, T.W., 1983. Experimental study of knickpoint and longi-
tudinal profile evolution in cohesive, homogeneous material.
Geol. Soc. Am. Bull. 94, 664–672.
Hamblin, W.K., Damon, P.E., Bull, W.B., 1981. Estimates of verti-
cal crustal strain rates along the western margins of the Colorado
Plateau. Geology 9, 293–298.
Klein, M., 1985. The adjustment of the meandering pattern of the
Lower Jordan River to change in water discharge. Earth Surf.
Processes Landforms 10, 525–531.
Klein, M., 1998. Water balance of the Upper Jordan River basin.
Water Int. 23, 244–248.
Klein, M., 1999. Water balance and water resources development in
the Upper Jordan basin. Water Irrig. 394, 22–27 (in Hebrew).
Leopold, L.B., Bull, W.B., 1979. Base level, aggradation, and grade.
Proc. Am. Philos. Soc. 123, 168–202.
Lynch, W.F., 1850. Narrative of the United States’ Expedition to the
River Jordan and the Dead Sea, 2nd edn. Rich. Bentley, London.
Lynch, W.F., 1852. Official Report of the United States’ Expedition
to Explore the Dead Sea and the River Jordan. National Observ-
atory USN, Baltimore.
Merritts, D., Vincent, L.R., 1989. Geomorphic response of coastal
streams to low, intermediate, and high rates of uplift, Mendocino
triple junction region, northern California. Geol. Soc. Am. Bull.
101, 1373–1388.
Robbins, C.H., Simon, A., 1983. Man-induced channel adjustment
in Tennessee streams. U.S. Geol. Survey, Water Res. Invest.,
Report 82-4098, 129 pp.
Rockwell, T.K., Keller, E.A., Clark, M.N., Johnson, D.L., 1984.
Chronology and rates of faulting of Ventura River terraces.
Geol. Soc. Am. Bull. 95, 1466–1474.
Schattner, I., 1962. The Lower Jordan Valley. Scr. Hierosolymitana
XI, 123 pp.
Schechnovitz-Pirtel, Y., 1999. The Morphological Impact of the
Lowering Dead Sea Base Level. Master thesis, Department of
Geography, Ben-Gurion University of the Negev, Beer-Sheva,
94 pp. (in Hebrew).
Schumm, S.A., 1993. River response to baselevel change: implica-
tions for sequence stratigraphy. J. Geol. 101, 279–294.
Schumm, S.A., Harvey, M.D., Watson, C.C., 1984. Incised Chan-
nels: Morphology, Dynamics, and Control. Water Res. Publ.,
Littleton, CO, 200 pp.
Schumm, S.A., Mosley, M.P., Weaver, W.E., 1987. Experimental
Fluvial Geomorphology. Wiley, New York, pp. 192–250.
Slingerland, R.L., Snow, R.S., 1988. Stability analysis of the re-
juvenated fluvial system. Z. Geomorphol. N. F. Suppl. 67,
93–102.
Summerfield, M.A., 1991. Global Geomorphology. Longman, Es-
sex, UK.
Van der Pool, N.L., 1982. ERODE—a computer model of drainage
basin development under changing base level conditions. In:
Craig, R.G., Craft, J.L. (Eds.), Applied Geomorphology. Allen
& Unwin, London, pp. 214–223.
Whitten, C.B., Patrick, D.M., 1981. Engineering Geology and Geo-
morphology of Streambanks Erosion. Rept. 2 Yazoo River basin
uplands, Mississippi, U.S. Army Engineer Waterways Experi-
ment Station, Vicksburg, MS, 178 pp.
Wood, L.J., Etheridge, F.G., Schumm, S.A., 1992. The effects of
rate of base-level fluctuation on coastal-plains shelf, and slope
depositional systems: an experimental approach. Spec. Publ. Int.
Assoc. Sedimentol., 18.
Yodis, E.G., Kesel, R.H., 1993. The effects and implications of
base-level changes to Mississippi River tributaries. Z. Geomor-
phol. N. F. Suppl. 37, 385–402.
Yoxall, W.H., 1969. The relationship between falling baselevel and
lateral erosion in experimental streams. Geol. Soc. Am. Bull. 80,
1379–1384.
M.A. Hassan, M. Klein / Geomorphology 45 (2002) 21–33 33
Copyright © 2022 FDOKUMEN