Pressure drop and flow distribution characteristics of single ...
12
Journal of Mechanical Science and Technology 26 (9) (2012) 2995~3006 www.springerlink.com/content/1738-494x DOI 10.1007/s12206-012-0706-y Pressure drop and flow distribution characteristics of single and parallel serpentine flow fields for polymer electrolyte membrane fuel cells † Seung Man Baek 1 , Dong Hyup Jeon 2 , Jin Hyun Nam 3,* and Charn-Jung Kim 1 1 School of Mechanical and Aerospace Engineering, Seoul National University, Seoul, 151-742, Korea 2 College of Energy and Environment, Dongguk University, Gyeongju 780-714, Korea 3 School of Mechanical and Automotive Engineering, Daegu University, Gyungsan 712-714, Korea (Manuscript Received November 29, 2011; Revised April 14, 2012; Accepted May 4, 2012) ---------------------------------------------------------------------------------------------------------------------------------------------------------------------------------------------------------------------------------------------------------------------------------------------- Abstract This study numerically investigates pressure drop and flow distribution characteristics of serpentine flow fields (SFFs) that are de- signed for polymer electrolyte membrane fuel cells, which consider the Poiseuille flow with secondary pressure drop in the gas channel (GC) and the Darcy flow in the porous gas diffusion layer (GDL). The numerical results for a conventional SFF agreed well with those obtained via computational fluid dynamics simulations, thus proving the validity of the present flow network model. This model is em- ployed to characterize various single and parallel SFFs, including multi-pass serpentine flow fields (MPSFFs). Findings reveal that un- der-rib convection (convective flow through GDL under an interconnector rib) is an important transport process for conventional SFFs, with its intensity being significantly enhanced as GDL permeability increases. The results also indicate that under-rib convection can be significantly improved by employing MPSFFs as the reactant flow field, because of the closely interlaced structure of GC regions that have different path-lengths from the inlet. However, reactant flow rate through GCs proportionally decreases as under-rib convection intensity increases, suggesting that proper optimization is required between the flow velocity in GCs and the under-rib convection inten- sity in GDLs. Keywords: Polymer electrolyte membrane fuel cell; Serpentine flow field; Under-rib convection; Flow distribution; Pressure drop; Flow network model ---------------------------------------------------------------------------------------------------------------------------------------------------------------------------------------------------------------------------------------------------------------------------------------------- 1. Introduction Fuel cells are promising power sources because of their numerous advantages, such as high efficiency, clean emission, and flexible scalability [1, 2]. Extensive research efforts have been employed to utilize fuel cells as power sources for driv- ing automobiles or for powering portable electronic devices. Polymer electrolyte membrane fuel cells (PEMFCs) and direct methanol fuel cells (DMFCs) are the most suitable fuel cell technologies for the aforementioned purposes partially be- cause of their low operating temperature, which contributes to their satisfactory start-up and ideal transient characteristics. Studies on PEMFCs are currently focused on enhancing their operating current density and power density. This goal is pri- marily achieved by developing new fuel cell materials with better operating properties. In addition, system-level factors, including flow-field design, thermal and water management, and operational control, also require optimization [3-5]. When PEMFCs or DMFCs are operated at high current densities, cell performance is affected by mass transport limi- tations, such as reactant deficiency in under-rib regions and electrode flooding in porous transport layers. Thus, flow-field design is an important factor for system-level design because of its influence on mass transport limitations, including reac- tant distribution and product exhaust, as well as liquid water removal [6, 7]. Thus, under-rib convection has received con- siderable attention as a potential method for the performance enhancement of PEMFCs and DMFCs at transport-limited operating conditions. Under-rib convection refers to the flow of reactant gas through porous gas diffusion layers (GDLs) and under inter- connector rib structures in PEMFCs and DMFCs. Under-rib convection is an essential transport mechanism for PEMFCs based on interdigitated flow fields with dead-end reactant channel designs [8, 9]. In addition, under-rib convection has also been recognized as an important transport process for PEMFCs and DMFCs that employ serpentine flow fields (SFFs) with long and meandering reactant channel designs [10-19]. Experimental and numerical studies demonstrated that im- proved under-rib convection is favorable for the performance of PEMFCs because of the enhancement of reactant transport to under-rib regions and the facilitation of liquid water exhaust * Corresponding author. Tel.: +82 53 850 6675, Fax.: +82 53 850 6689 E-mail address: [email protected] † Recommended by Associate Editor Yong-Tae Kim © KSME & Springer 2012
-
Upload
khangminh22 -
Category
Documents
-
view
1 -
download
0
Transcript of Pressure drop and flow distribution characteristics of single ...
Journal of Mechanical Science and Technology 26 (9) (2012) 2995~3006
www.springerlink.com/content/1738-494x
DOI 10.1007/s12206-012-0706-y
Pressure drop and flow distribution characteristics of single and parallel serpentine
flow fields for polymer electrolyte membrane fuel cells†
Seung Man Baek1, Dong Hyup Jeon2, Jin Hyun Nam3,* and Charn-Jung Kim1 1School of Mechanical and Aerospace Engineering, Seoul National University, Seoul, 151-742, Korea
2College of Energy and Environment, Dongguk University, Gyeongju 780-714, Korea 3School of Mechanical and Automotive Engineering, Daegu University, Gyungsan 712-714, Korea
(Manuscript Received November 29, 2011; Revised April 14, 2012; Accepted May 4, 2012)
----------------------------------------------------------------------------------------------------------------------------------------------------------------------------------------------------------------------------------------------------------------------------------------------
Abstract
This study numerically investigates pressure drop and flow distribution characteristics of serpentine flow fields (SFFs) that are de-
signed for polymer electrolyte membrane fuel cells, which consider the Poiseuille flow with secondary pressure drop in the gas channel
(GC) and the Darcy flow in the porous gas diffusion layer (GDL). The numerical results for a conventional SFF agreed well with those
obtained via computational fluid dynamics simulations, thus proving the validity of the present flow network model. This model is em-
ployed to characterize various single and parallel SFFs, including multi-pass serpentine flow fields (MPSFFs). Findings reveal that un-
der-rib convection (convective flow through GDL under an interconnector rib) is an important transport process for conventional SFFs,
with its intensity being significantly enhanced as GDL permeability increases. The results also indicate that under-rib convection can be
significantly improved by employing MPSFFs as the reactant flow field, because of the closely interlaced structure of GC regions that
have different path-lengths from the inlet. However, reactant flow rate through GCs proportionally decreases as under-rib convection
intensity increases, suggesting that proper optimization is required between the flow velocity in GCs and the under-rib convection inten-
sity in GDLs.
Keywords: Polymer electrolyte membrane fuel cell; Serpentine flow field; Under-rib convection; Flow distribution; Pressure drop; Flow network model
----------------------------------------------------------------------------------------------------------------------------------------------------------------------------------------------------------------------------------------------------------------------------------------------
1. Introduction
Fuel cells are promising power sources because of their
numerous advantages, such as high efficiency, clean emission,
and flexible scalability [1, 2]. Extensive research efforts have
been employed to utilize fuel cells as power sources for driv-
ing automobiles or for powering portable electronic devices.
Polymer electrolyte membrane fuel cells (PEMFCs) and direct
methanol fuel cells (DMFCs) are the most suitable fuel cell
technologies for the aforementioned purposes partially be-
cause of their low operating temperature, which contributes to
their satisfactory start-up and ideal transient characteristics.
Studies on PEMFCs are currently focused on enhancing their
operating current density and power density. This goal is pri-
marily achieved by developing new fuel cell materials with
better operating properties. In addition, system-level factors,
including flow-field design, thermal and water management,
and operational control, also require optimization [3-5].
When PEMFCs or DMFCs are operated at high current
densities, cell performance is affected by mass transport limi-
tations, such as reactant deficiency in under-rib regions and
electrode flooding in porous transport layers. Thus, flow-field
design is an important factor for system-level design because
of its influence on mass transport limitations, including reac-
tant distribution and product exhaust, as well as liquid water
removal [6, 7]. Thus, under-rib convection has received con-
siderable attention as a potential method for the performance
enhancement of PEMFCs and DMFCs at transport-limited
operating conditions.
Under-rib convection refers to the flow of reactant gas
through porous gas diffusion layers (GDLs) and under inter-
connector rib structures in PEMFCs and DMFCs. Under-rib
convection is an essential transport mechanism for PEMFCs
based on interdigitated flow fields with dead-end reactant
channel designs [8, 9]. In addition, under-rib convection has
also been recognized as an important transport process for
PEMFCs and DMFCs that employ serpentine flow fields
(SFFs) with long and meandering reactant channel designs
[10-19].
Experimental and numerical studies demonstrated that im-
proved under-rib convection is favorable for the performance
of PEMFCs because of the enhancement of reactant transport
to under-rib regions and the facilitation of liquid water exhaust
*Corresponding author. Tel.: +82 53 850 6675, Fax.: +82 53 850 6689
E-mail address: [email protected] † Recommended by Associate Editor Yong-Tae Kim
© KSME & Springer 2012
2996 S. M. Baek et al. / Journal of Mechanical Science and Technology 26 (9) (2012) 2995~3006
out of these regions. Xu and Zhao [20] recently proposed a
novel flow field design called convection-enhanced serpentine
SFF (CESFF) and experimentally demonstrated that better
performance and more stable operation of a DMFC can be
achieved using CESFF as the cathode flow field. They attrib-
uted the observed superior performance to the enhanced un-
der-rib convection intensity in CESFF, which improves mass
transport characteristics [20]. Similar flow field patterns were
independently developed for temperature uniformity in cool-
ing plates for PEMFCs [21, 22]. Uniform temperature is also
believed to be favorable for the operation control and the long-
term durability of PEMFCs.
Inspired by these studies [20-22], Nam et al. [23] proposed
a systematic design method to generate reactant flow fields
with maximized under-rib convection intensity in a given cell
area, which resulted in a new class of flow fields called multi-
pass SFFs (MPSFFs). Geometrical characterization showed
that gas channel (GC) regions with different path lengths
(measured from the inlet) are closely interlaced in MPSFFs,
which can significantly increase under-rib convection intensity
[23]. In addition, numerical studies [24, 25] showed that more
uniform temperatures can be achieved at a fixed coolant flow
rate when MPSFFs are used for the cooling plates of PEMFCs.
This result was also ascribed to the special flow field pattern
formed in MPSFF, the proximally positioned GC regions with
different path lengths. The close placement of flow channels
with different path lengths was proposed and demonstrated by
Kaufman and Terry [26] and Qi and Kaufman [27]. Notably,
under-rib convection intensity is generally negligible in
PEMFCs with parallel flow fields (PFFs) because GC regions
with similar path lengths are located across an interconnected
rib region.
In this study, the single-phase laminar flow of reactant gas
in a conventional SFF was first calculated using a commercial
computational fluid dynamics (CFD) code called STAR-CD
(CD-Adapco Inc., Korea). Based on CFD results, a flow net-
work model that considers Poiseuille flow in GCs, Darcy flow
in GDLs, and secondary pressure loss in the curved regions of
GCs was developed and validated. Using this flow network
model, the reactant flow in several single and parallel
MPSFFs was calculated, while pressure drop and flow distri-
bution characteristics were investigated.
2. Theory and calculations
2.1 Physical model
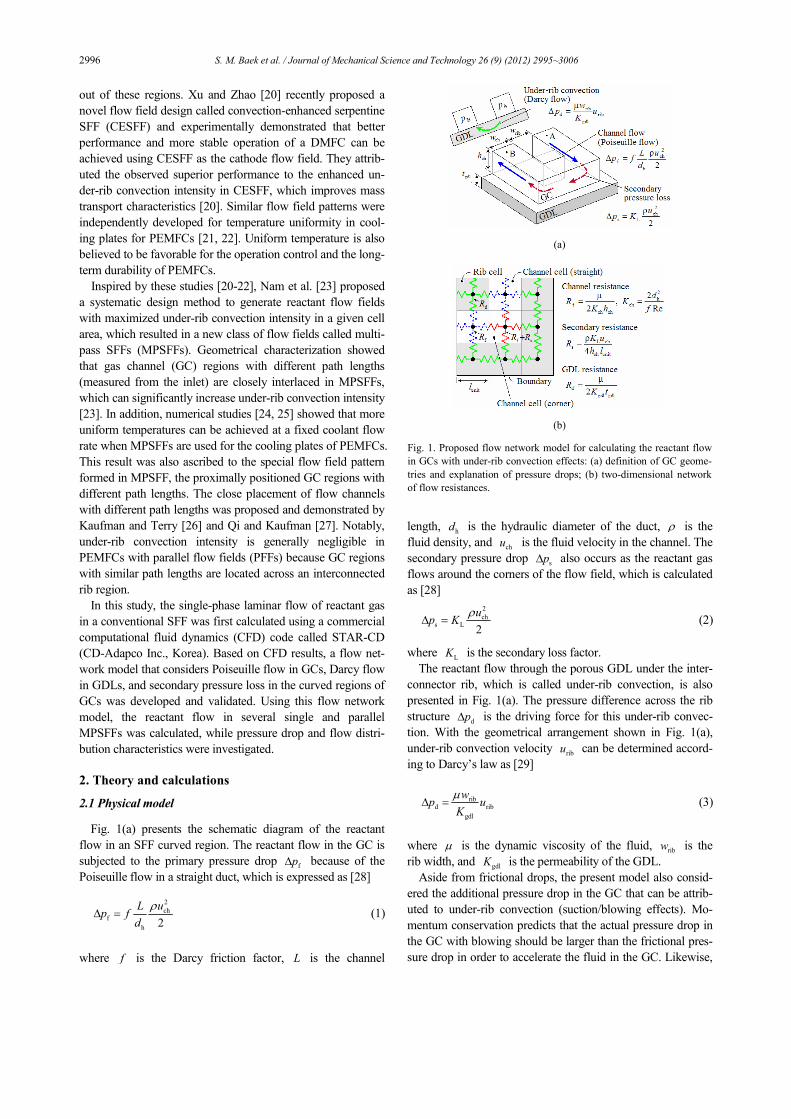
Fig. 1(a) presents the schematic diagram of the reactant
flow in an SFF curved region. The reactant flow in the GC is
subjected to the primary pressure drop fp∆ because of the
Poiseuille flow in a straight duct, which is expressed as [28]
2
chf
h2
L up f
d
ρ∆ = (1)
where f is the Darcy friction factor, L is the channel
length, hd is the hydraulic diameter of the duct, ρ is the
fluid density, and chu is the fluid velocity in the channel. The
secondary pressure drop sp∆ also occurs as the reactant gas
flows around the corners of the flow field, which is calculated
as [28]
2
chs L
2
up K
ρ∆ = (2)
where
LK is the secondary loss factor.
The reactant flow through the porous GDL under the inter-
connector rib, which is called under-rib convection, is also
presented in Fig. 1(a). The pressure difference across the rib
structure dp∆ is the driving force for this under-rib convec-
tion. With the geometrical arrangement shown in Fig. 1(a),
under-rib convection velocity ribu can be determined accord-
ing to Darcy’s law as [29]
ribd rib
gdl
wp u
K
µ∆ = (3)
where µ is the dynamic viscosity of the fluid, ribw is the
rib width, and gdlK is the permeability of the GDL.
Aside from frictional drops, the present model also consid-
ered the additional pressure drop in the GC that can be attrib-
uted to under-rib convection (suction/blowing effects). Mo-
mentum conservation predicts that the actual pressure drop in
the GC with blowing should be larger than the frictional pres-
sure drop in order to accelerate the fluid in the GC. Likewise,
(a)
(b)
Fig. 1. Proposed flow network model for calculating the reactant flow
in GCs with under-rib convection effects: (a) definition of GC geome-
tries and explanation of pressure drops; (b) two-dimensional network
of flow resistances.
S. M. Baek et al. / Journal of Mechanical Science and Technology 26 (9) (2012) 2995~3006 2997
the actual pressure drop in the GC with suction is smaller than
the frictional pressure drop because of fluid deceleration. No-
tably, the fluid that leaves the GC by suction has some mo-
mentum in the flow direction, whereas the fluid that enters GC
by blowing has no momentum.
In this study, the additional pressure drop from the momen-
tum balance in the GC is termed as the inertial pressure drop
m,chp∆ . For a given region in the GC, this inertial pressure
drop can be calculated as [30, 31]
m,ch m ch,out ch,out ch,in ch,in ch rib ch,in( )p C m u m u m u→∆ = − +ɺ ɺ ɺ (4)
where ch,inmɺ and ch,outmɺ are respectively the mass flow rates
into and out of the channel region through the channel, while
ch ribm →ɺ denotes the mass flow rate that leaves the channel re-
gion via under-rib convection. As noted above, the mass flow
rate that enters the channel region can be disregarded. In Eq.
(4), mC is the momentum correction factor at 1.44 (for fully
developed laminar flow in square ducts), which is the assumed
value in this study. Notably, m,chp∆ can have a positive value
(pressure drop) or a negative value (pressure compensation).
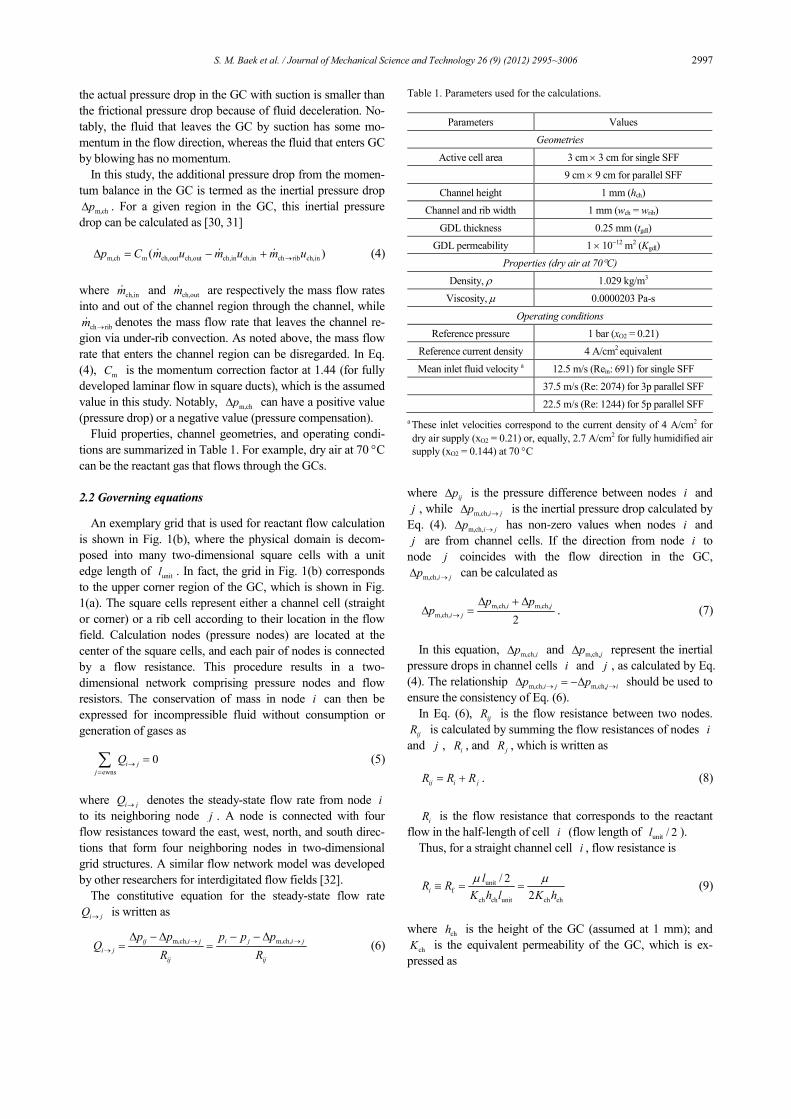
Fluid properties, channel geometries, and operating condi-
tions are summarized in Table 1. For example, dry air at 70 °C
can be the reactant gas that flows through the GCs.
2.2 Governing equations
An exemplary grid that is used for reactant flow calculation
is shown in Fig. 1(b), where the physical domain is decom-
posed into many two-dimensional square cells with a unit
edge length of unitl . In fact, the grid in Fig. 1(b) corresponds
to the upper corner region of the GC, which is shown in Fig.
1(a). The square cells represent either a channel cell (straight
or corner) or a rib cell according to their location in the flow
field. Calculation nodes (pressure nodes) are located at the
center of the square cells, and each pair of nodes is connected
by a flow resistance. This procedure results in a two-
dimensional network comprising pressure nodes and flow
resistors. The conservation of mass in node i can then be
expressed for incompressible fluid without consumption or
generation of gases as
ewns
0i j
j
Q→
=
=∑ (5)
where i jQ → denotes the steady-state flow rate from node i
to its neighboring node j . A node is connected with four
flow resistances toward the east, west, north, and south direc-
tions that form four neighboring nodes in two-dimensional
grid structures. A similar flow network model was developed
by other researchers for interdigitated flow fields [32].
The constitutive equation for the steady-state flow rate
i jQ → is written as
m,ch, m,ch,ij i j i j i j
i j
ij ij
p p p p pQ
R R
→ →
→
∆ − ∆ − − ∆= = (6)
where ijp∆ is the pressure difference between nodes i and
j , while m,ch,i jp →∆ is the inertial pressure drop calculated by
Eq. (4). m,ch,i jp →∆ has non-zero values when nodes i and
j are from channel cells. If the direction from node i to
node j coincides with the flow direction in the GC,
m,ch,i jp →∆ can be calculated as
m,ch, m,ch,
m,ch,2
i j
i j
p pp →
∆ + ∆∆ = . (7)
In this equation, m,ch,ip∆ and m,ch,jp∆ represent the inertial
pressure drops in channel cells i and j , as calculated by Eq.
(4). The relationship m,ch, m,ch,i j j ip p→ →∆ = −∆ should be used to
ensure the consistency of Eq. (6).
In Eq. (6), ijR is the flow resistance between two nodes.
ijR is calculated by summing the flow resistances of nodes i
and j , iR , and jR , which is written as
ij i jR R R= + . (8)
iR is the flow resistance that corresponds to the reactant
flow in the half-length of cell i (flow length of unit / 2l ).
Thus, for a straight channel cell i , flow resistance is
unitf
ch ch unit ch ch
/ 2
2i
lR R
K h l K h
µ µ≡ = = (9)
where chh is the height of the GC (assumed at 1 mm); and
chK is the equivalent permeability of the GC, which is ex-
pressed as
Table 1. Parameters used for the calculations.
Parameters Values
Geometries
Active cell area 3 cm × 3 cm for single SFF
9 cm × 9 cm for parallel SFF
Channel height 1 mm (hch)
Channel and rib width 1 mm (wch = wrib)
GDL thickness 0.25 mm (tgdl)
GDL permeability 1 × 10⁻¹² m2 (Kgdl)
Properties (dry air at 70°C)
Density, ρ 1.029 kg/m3
Viscosity, µ 0.0000203 Pa-s
Operating conditions
Reference pressure 1 bar (xO2 = 0.21)
Reference current density 4 A/cm2 equivalent
Mean inlet fluid velocity a 12.5 m/s (Rein: 691) for single SFF
37.5 m/s (Re: 2074) for 3p parallel SFF
22.5 m/s (Re: 1244) for 5p parallel SFF
a These inlet velocities correspond to the current density of 4 A/cm2 for
dry air supply (xO2 = 0.21) or, equally, 2.7 A/cm2 for fully humidified air
supply (xO2 = 0.144) at 70 °C
2998 S. M. Baek et al. / Journal of Mechanical Science and Technology 26 (9) (2012) 2995~3006
2
hch
2
Re
dK
f= (10)
where Re is the Reynolds number. Ref is 64 for laminar
flow in circular ducts and 56.91 for that in square ducts.
Similarly, for rib cell i , flow resistance is calculated as
unitd
gdl gdl unit gdl gdl
/ 2
2i
lR R
K t l K t
µ µ≡ = = (11)
where gdlt is the thickness of the GDL (assumed at 0.25 mm).
For a corner channel cell, flow resistance is expressed as
L chf s
ch ch ch unit2 4
i
K uR R R
K h h l
µ ρ≡ + = + . (12)
Flow resistance for the corner channel cell depends on the
fluid velocity in the channel. Thus, the governing equation of
Eq. (5) becomes nonlinear, which requires an iterative proce-
dure to obtain the solution. The inertial pressure drop in Eq.
(4) also depends on the fluid velocity in the channel and con-
tributes to the nonlinearity of the governing equation.
2.3 Friction factor
GC reactants in PEMFCs generally have rectangular cross-
sectional shapes, while their flow fields have numerous cor-
ners to fit into a given active area, such as the square active
area considered in this study. For a fully developed laminar
flow in a rectangular duct, the product of the friction factor
and the Reynolds number, which is RD( Re)f , can be deter-
mined as [33]
2
RD
3 4 5
( Re) 96(1 1.3553 1.9467
1.7012 0.9564 0.2537 )
f α α
α α α
= − +
− + − (13)
where α is the aspect ratio that is defined as the ratio of the
channel height h to the channel width w ( /h wα ≡ ). Cal-
culation with Eq. (13) derived RD( Re) 56.91f = for a square
channel ( 1α = ).
However, modification is required when the correlation for
RD( Re)f in Eq. (13) is used to calculate the reactant flow in
SFFs of PEMFCs because the reactant flow in GCs of
PEMFCs repeatedly develops after passing through each cor-
ner of the flow fields. The entrance length eL for the laminar
flow inside the duct is estimated as e h/ 0.06ReL d ≈ [28].
Therefore, a fully developed laminar flow is attained when the
flow length x becomes larger than h60d (
h60x d> ) for Re
= 1000 and h120x d> for Re = 2000. That is, the entrance
length is estimated to be approximately 6 cm for Re = 1000
and 12 cm for Re = 2000 for a square channel with 1 mm
length. Prior reaching the entrance length, flow still develops
in the channel, and the apparent friction factor becomes higher
than the fully developed value.
The entrance length of 6 or 12 cm is similar to or longer
than the edge length of the square active area, which is con-
sidered in this study. For the developing flow in a circular duct,
the apparent friction factor CD( Re)f can be determined as
[33]
1/ 2
app CD 1/ 2 2
13.76 5/(4 ) 64 13.76 /( )( Re)
( ) 1 0.00021( )
x xf
x x
+ +
+ + −
+ −= +
+ (14)
where the dimensionless flow length x+ is defined as
hRe
xx
d
+ = . (15)
Note that app CD( Re)f converges to 64 when x+ ap-
proaches infinity.
The above-mentioned Eqs. (14) and (15) indicate that the
apparent friction factor is dependent on the Reynolds number
(hRe /udρ µ= ), unlike the fully developed friction factor that
is constant for the laminar flow. The inlet Reynolds number
inRe , which is based on the inlet fluid velocity inu , is obvi-
ously a good approximation when the channel velocity is rela-
tively constant in SFF with negligible under-rib convection.
However, the pressure drop across SFF can potentially be
over-estimated by using inRe , when the channel velocity
considerably changes along GC due to high under-rib convec-
tion. Thus, in this study, the mean channel velocity chu was
used to determine the Reynolds number required in Eq. (15).
Finally, the apparent friction factor for a rectangular channel
app RD( Re)f was obtained as
app CD
app RD CD RD RD
CD
app CD
RD
( Re)( Re) f ( Re) ( Re)
( Re)
( Re)( Re)
64
ff f f
f
ff
= ⋅ = ⋅
= ⋅
(16)
where app CD( Re)f was derived based on Eqs. (14) and (15).
A natural choice for the flow length x in Eq. (15) is the edge
length of the square active area. That is, 3x = cm for a 3 cm
× 3 cm active cell area and 9x = cm for a 9 cm × 9 cm ac-
tive cell area. In Eq. (16), CDf is used to convert the fully
developed friction factor RD( Re)f into the apparent friction
factor with the entrance effect app RD( Re)f .
3. Results and discussion
3.1 Model validation
The proposed flow network model was first validated to en-
sure the reliability of subsequent calculations for single and
parallel SFFs. For the validation of this model, laminar flow in
a conventional SFF, as shown in Fig. 2(a), was calculated
using the present network model. The results were then com-
pared with those obtained via CFD simulation. The conven-
tional SFF was designed to cover a small active cell area of 9
S. M. Baek et al. / Journal of Mechanical Science and Technology 26 (9) (2012) 2995~3006 2999
cm2 (3 cm × 3 cm) with 15 straight GC regions and 28 mitered
elbows (90° bend). In the flow network calculation, the unit
cell size of unit 1 mml = was used to decompose the domain,
resulting in a two-dimensional network of 961 square cells or
pressure nodes.
In the CFD simulation, the grid for the conventional SFF
was generated for two regions. First, the grid for the GC re-
gion was constructed by allocating a total of 100 finite volume
cells (10 × 10 cells) at the cross-sectional area (1 mm width
and 1 mm height). Second, the grid for the GDL region (0.25
mm thickness) was constructed with five layers of finite vol-
ume cells. In summary, 322,000 finite volume cells were used
in the CFD model, where 161,500 cells were in the GC region,
and 160,500 cells were in the GDL region. This grid density
sufficiently ensured reliable flow calculation inside the SFFs
of PEMFCs [24, 25]. The geometrical and operating parame-
ters employed in both calculations are detailed in Table 1,
along with the fluid properties (dry air at 70 °C). A commer-
cial CFD solver, STAR-CD (CD-Adapco Inc., USA), was
used to solve the laminar and incompressible flow in the GC
with an isotropic GDL permeability of 1×10⁻¹²
m2.
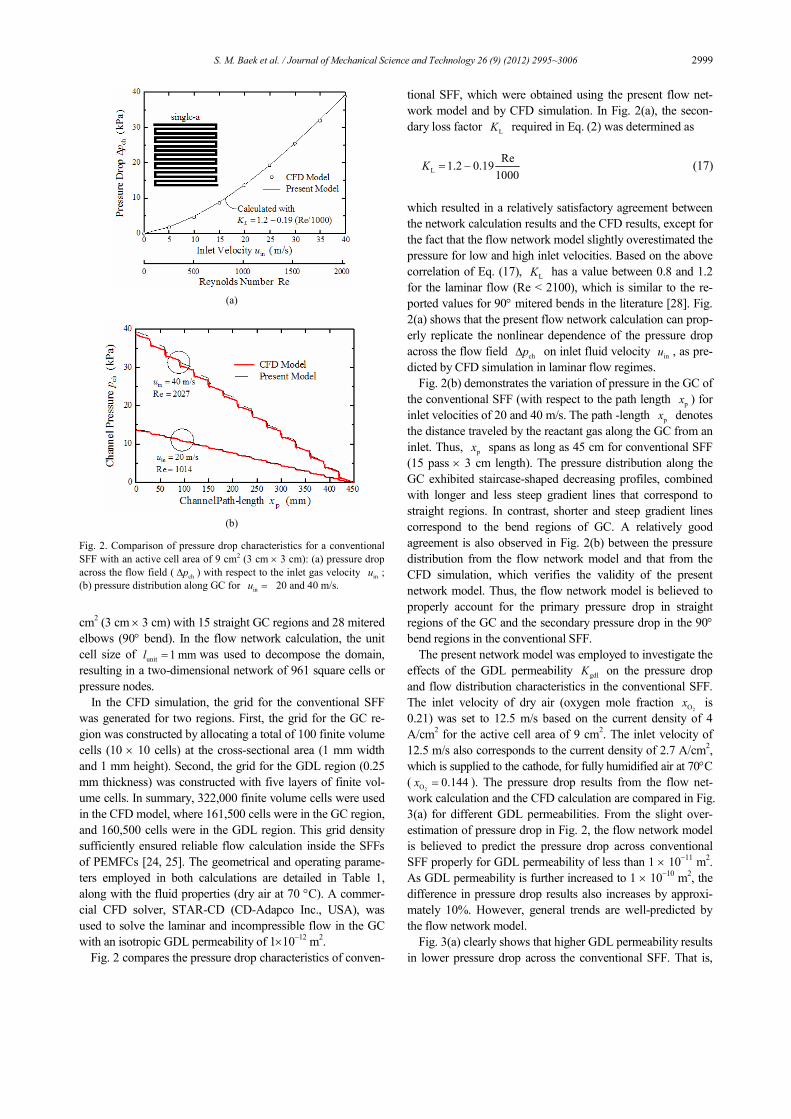
Fig. 2 compares the pressure drop characteristics of conven-
tional SFF, which were obtained using the present flow net-
work model and by CFD simulation. In Fig. 2(a), the secon-
dary loss factor LK required in Eq. (2) was determined as
L
Re1.2 0.19
1000K = − (17)
which resulted in a relatively satisfactory agreement between
the network calculation results and the CFD results, except for
the fact that the flow network model slightly overestimated the
pressure for low and high inlet velocities. Based on the above
correlation of Eq. (17), LK has a value between 0.8 and 1.2
for the laminar flow (Re < 2100), which is similar to the re-
ported values for 90° mitered bends in the literature [28]. Fig.
2(a) shows that the present flow network calculation can prop-
erly replicate the nonlinear dependence of the pressure drop
across the flow field chp∆ on inlet fluid velocity
inu , as pre-
dicted by CFD simulation in laminar flow regimes.
Fig. 2(b) demonstrates the variation of pressure in the GC of
the conventional SFF (with respect to the path length px ) for
inlet velocities of 20 and 40 m/s. The path -length px denotes
the distance traveled by the reactant gas along the GC from an
inlet. Thus, px spans as long as 45 cm for conventional SFF
(15 pass × 3 cm length). The pressure distribution along the
GC exhibited staircase-shaped decreasing profiles, combined
with longer and less steep gradient lines that correspond to
straight regions. In contrast, shorter and steep gradient lines
correspond to the bend regions of GC. A relatively good
agreement is also observed in Fig. 2(b) between the pressure
distribution from the flow network model and that from the
CFD simulation, which verifies the validity of the present
network model. Thus, the flow network model is believed to
properly account for the primary pressure drop in straight
regions of the GC and the secondary pressure drop in the 90°
bend regions in the conventional SFF.
The present network model was employed to investigate the
effects of the GDL permeability gdlK on the pressure drop
and flow distribution characteristics in the conventional SFF.
The inlet velocity of dry air (oxygen mole fraction 2Ox is
0.21) was set to 12.5 m/s based on the current density of 4
A/cm2 for the active cell area of 9 cm
2. The inlet velocity of
12.5 m/s also corresponds to the current density of 2.7 A/cm2,
which is supplied to the cathode, for fully humidified air at 70°C
(2O 0.144x = ). The pressure drop results from the flow net-
work calculation and the CFD calculation are compared in Fig.
3(a) for different GDL permeabilities. From the slight over-
estimation of pressure drop in Fig. 2, the flow network model
is believed to predict the pressure drop across conventional
SFF properly for GDL permeability of less than 1 × 10⁻¹¹
m2.
As GDL permeability is further increased to 1 × 10⁻¹⁰
m2, the
difference in pressure drop results also increases by approxi-
mately 10%. However, general trends are well-predicted by
the flow network model.
Fig. 3(a) clearly shows that higher GDL permeability results
in lower pressure drop across the conventional SFF. That is,
(a)
(b)
Fig. 2. Comparison of pressure drop characteristics for a conventional
SFF with an active cell area of 9 cm2 (3 cm × 3 cm): (a) pressure drop
across the flow field (chp∆ ) with respect to the inlet gas velocity
inu ;
(b) pressure distribution along GC for inu = 20 and 40 m/s.
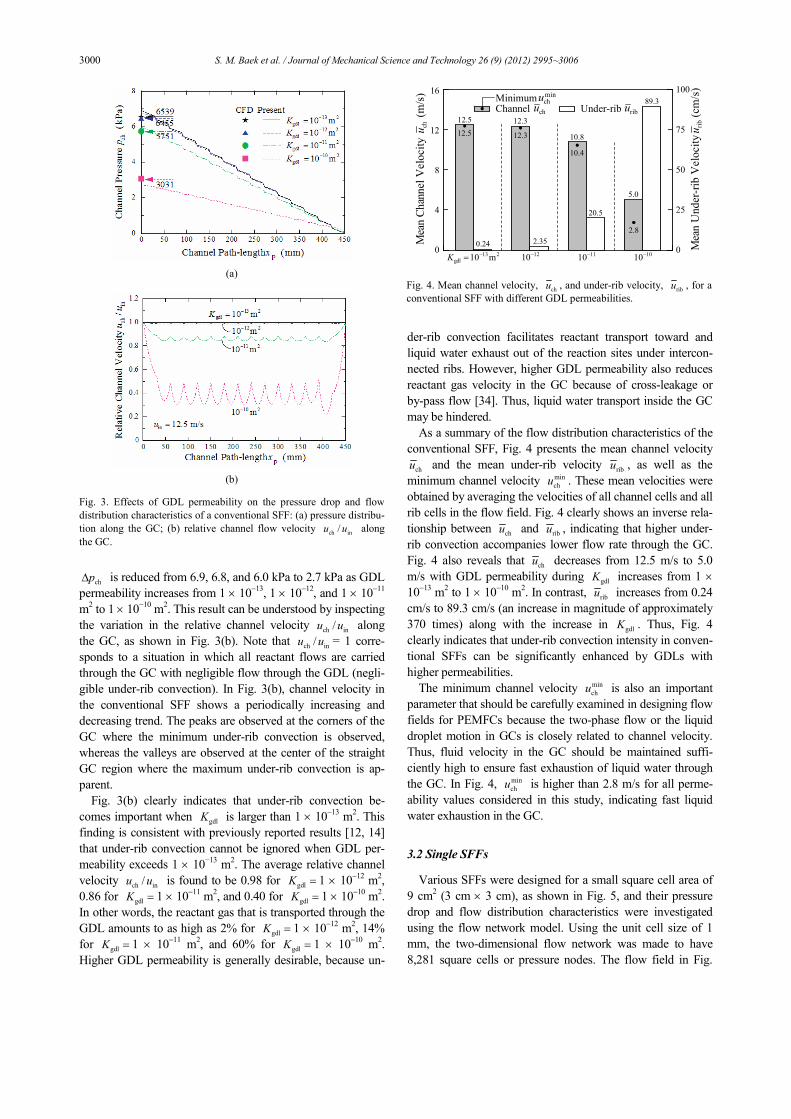
3000 S. M. Baek et al. / Journal of Mechanical Science and Technology 26 (9) (2012) 2995~3006
chp∆ is reduced from 6.9, 6.8, and 6.0 kPa to 2.7 kPa as GDL
permeability increases from 1 × 10⁻¹³
, 1 × 10⁻¹²
, and 1 × 10⁻¹¹
m2 to 1 × 10
−10 m
2. This result can be understood by inspecting
the variation in the relative channel velocity ch in/u u along
the GC, as shown in Fig. 3(b). Note that ch in/u u = 1 corre-
sponds to a situation in which all reactant flows are carried
through the GC with negligible flow through the GDL (negli-
gible under-rib convection). In Fig. 3(b), channel velocity in
the conventional SFF shows a periodically increasing and
decreasing trend. The peaks are observed at the corners of the
GC where the minimum under-rib convection is observed,
whereas the valleys are observed at the center of the straight
GC region where the maximum under-rib convection is ap-
parent.
Fig. 3(b) clearly indicates that under-rib convection be-
comes important when gdlK is larger than 1 × 10⁻¹³
m2. This
finding is consistent with previously reported results [12, 14]
that under-rib convection cannot be ignored when GDL per-
meability exceeds 1 × 10⁻¹³
m2. The average relative channel
velocity ch in/u u is found to be 0.98 for gdlK = 1 × 10
−12 m
2,
0.86 for gdlK = 1 × 10⁻¹¹
m2, and 0.40 for gdlK = 1 × 10
−10 m
2.
In other words, the reactant gas that is transported through the
GDL amounts to as high as 2% for gdlK = 1 × 10⁻¹²
m2, 14%
for gdlK = 1 × 10⁻¹¹
m2, and 60% for gdlK = 1 × 10
−10 m
2.
Higher GDL permeability is generally desirable, because un-
der-rib convection facilitates reactant transport toward and
liquid water exhaust out of the reaction sites under intercon-
nected ribs. However, higher GDL permeability also reduces
reactant gas velocity in the GC because of cross-leakage or
by-pass flow [34]. Thus, liquid water transport inside the GC
may be hindered.
As a summary of the flow distribution characteristics of the
conventional SFF, Fig. 4 presents the mean channel velocity
chu and the mean under-rib velocity ribu , as well as the
minimum channel velocity min
chu . These mean velocities were
obtained by averaging the velocities of all channel cells and all
rib cells in the flow field. Fig. 4 clearly shows an inverse rela-
tionship between chu and
ribu , indicating that higher under-
rib convection accompanies lower flow rate through the GC.
Fig. 4 also reveals that chu decreases from 12.5 m/s to 5.0
m/s with GDL permeability during gdlK increases from 1 ×
10−13
m2 to 1 × 10
−10 m
2. In contrast,
ribu increases from 0.24
cm/s to 89.3 cm/s (an increase in magnitude of approximately
370 times) along with the increase in gdlK . Thus, Fig. 4
clearly indicates that under-rib convection intensity in conven-
tional SFFs can be significantly enhanced by GDLs with
higher permeabilities.
The minimum channel velocity min
chu is also an important
parameter that should be carefully examined in designing flow
fields for PEMFCs because the two-phase flow or the liquid
droplet motion in GCs is closely related to channel velocity.
Thus, fluid velocity in the GC should be maintained suffi-
ciently high to ensure fast exhaustion of liquid water through
the GC. In Fig. 4, min
chu is higher than 2.8 m/s for all perme-
ability values considered in this study, indicating fast liquid
water exhaustion in the GC.
3.2 Single SFFs
Various SFFs were designed for a small square cell area of
9 cm2 (3 cm × 3 cm), as shown in Fig. 5, and their pressure
drop and flow distribution characteristics were investigated
using the flow network model. Using the unit cell size of 1
mm, the two-dimensional flow network was made to have
8,281 square cells or pressure nodes. The flow field in Fig.
0
4
8
12
16
0
25
50
75
100
(m/s)
chu
Mea
nChan
nel V
elocity
(cm/s)
rib
uM
ean U
nder-rib V
elocity
Channel Under-ribMinimum
chu ribuchumin
12.5
10.8
20.5
2.35
12.3
0.24
89.3
5.0
12.5
10.4
12.3
2.8
213gdl m10−=K 1210− 1110− 1010−
Fig. 4. Mean channel velocity, chu , and under-rib velocity,
ribu , for a
conventional SFF with different GDL permeabilities.
(a)
(b)
Fig. 3. Effects of GDL permeability on the pressure drop and flow
distribution characteristics of a conventional SFF: (a) pressure distribu-
tion along the GC; (b) relative channel flow velocity ch in/u u along
the GC.

S. M. Baek et al. / Journal of Mechanical Science and Technology 26 (9) (2012) 2995~3006 3001
5(a) is the conventional SFF employed for model validation,
whereas that in Fig. 5(f) is the conventional spiral flow field.
The flow fields in Fig. 5(b)-5(e) are MPSFFs based on various
patterns. Nam et al. [23] proposed a systematic method to
generate cooling performance as a MPSFFs, and their superior
coolant flow field was numerically demonstrated by Yu et al.
[24] and Baek et al. [25]. In fact, the MPSFF with a two-pass
pattern (single-b) is similar to one of the coolant flow fields
considered by Chen et al. [21] and Choi et al. [22]. The
MPSFF with a three-pass pattern (single-c) is the same as the
cathode flow field for a DMFC that was considered by Xu and
Zhao [20]. Meanwhile, the spiral flow field (single-f) has
geometrical similarity with the MPSFF with a two-pass pat-
tern (single-b).
Fig. 6 shows pressure drop and flow distribution character-
istics of the single SFFs in this study. In the calculation, inlet
fluid velocity was set to 12.5 m/s, and GDL permeability was
fixed at 1 × 10⁻¹²
m2, as listed in Table 1. This permeability
value was selected based on the measured values for Toray
carbon papers that range from 2 × 10⁻¹²
m2 to 9 × 10
−12 m
2
[35−37]. GDL permeability of 1 × 10⁻¹²
m2 is assumed to be
reasonable, considering the reduction of pore volume due to
hydrophobic coating and compression during fabrication, as
well as liquid water accumulation in GDL during operation
[23]. Fig. 6(a) shows that the conventional SFF (single-a) has
the largest pressure drop (approximately 6.8 kPa), followed by
the MPSFF with a five-path pattern (single-d) and the MPSFF
with a three-path pattern (single-c). On the contrary, the spiral
flow field (single-f) exhibits the smallest pressure drop (ap-
proximately 3.8 kPa), which indicates the largest under-rib
convection intensity. MPSFF with a five-pass spiral pattern
(single-e) and that with a two-pass pattern (single-b) show
similarly small pressure drop characteristics. This trend is
consistent with the prediction by Nam et al. [23] based on the
geometrical characterization of MPSFFs, which showed that
the spiral flow field and MPSFFs with a two-pass or spiral
pattern induce the largest under-rib convection intensity.
The variation in relative channel velocity ch in/u u along the
GC is shown in Fig. 6(b), where ch in/u u remains unchanged
at 0.98 for the conventional SFF (single-a). However, the
MPSFFs exhibited lower relative channel velocities. The
minimum value for ch in/u u is 0.84 for the MPSFF with a
five-pass pattern (single-d), 0.66 for the MPSFF with a three-
pass pattern (single-c), 0.59 for the MPSFF with a two-pass
pattern (single-b), and 0.52 for the MPSFF with a five-pass
spiral pattern (single-e). The spiral flow field (single-f) pro-
duced the lowest channel velocity with a minimum value of
0.45. With the previous assumption that under-rib convection
intensity is inversely proportional to channel velocity, spiral
flow fields and MPSFFs can significantly enhance under-rib
convection intensity, regardless of the small active cell area.
In summary, under-rib convection intensities in single
MPSFFs, as predicted by the present flow network model, are
Fig. 5. Single SFFs that are designed for a small active cell area of 9
cm2 (3 cm × 3 cm): (a) conventional SFF; (b) single MPSFF with two-
pass pattern; (c) single MPSFF with three-pass pattern; (d) single
MPSFF with five-pass pattern; (e) single MPSFF with five-pass spiral
pattern; (f) spiral flow field. These flow fields are denoted as single-a, -
b, -c, -d, -e, and -f, respectively.
(a)
(b)
Fig. 6. Pressure drop and flow distribution characteristics of single
SFFs for a small active cell area of 9 cm2: (a) pressure distribution in
the GC; (b) relative channel velocity ch in/u u in the GC.
(a)
(c)
(e)
(b)
(d)
(f)

3002 S. M. Baek et al. / Journal of Mechanical Science and Technology 26 (9) (2012) 2995~3006
smaller than those predicted by a previous geometrical charac-
terization study [23]. This discrepancy is mainly attributed to
the reduction of the pressure drop in MPSFFs, as shown in Fig.
6(a). Since under-rib convection is primarily driven by the
pressure difference between two GC regions across an inter-
connected rib, the reduction of total pressure drop potentially
decreases under-rib convection intensity.
Fig. 7 presents the mean channel velocity chu and the
mean under-rib velocity ribu of single SFFs as a summary for
the flow distribution characteristics. The conventional SFF
(single-a) exhibited the highest chu of 12.3 m/s, similar to
inlet velocity (inu = 12.5 m/s), but the smallest
ribu of 2.4
cm/s. In contrast, the spiral flow field (single-f) revealed the
smallest chu of 8.4 m/s, but the largest
ribu of 7.1 cm/s, thus
registering the highest under-rib convection intensity among
the single SFFs considered in this study. The MPSFFs (single-
b, c, d, and e) had chu that ranged from 9.1 m/s to 11.1 m/s
and ribu from 5.5 cm/s to 6.8 cm/s, which ensured relatively
high under-rib convection in single MPSFFs. Thus, Fig. 7
illustrates that under-rib convection intensity can be enhanced
by approximately two to three times when single MPSFFs
(single-b, c, d, and e) are used instead of the conventional SFF
(single-a). The minimum channel velocity min
chu is also pre-
sented in Fig. 7, where min
chu is higher than 5 m/s for all single
SFFs. This result suggests that liquid water accumulation in
these flow fields is insignificant.
3.3 Parallel SFFs
For PEMFCs with a large active cell area, parallel SFFs are
preferred because single SFFs require extremely high pump
power for the reactant flow in GCs. If a conventional SFF
similar to Fig. 5(a) is formed in a large cell area of 81 cm2 (9
cm × 9 cm), the channel path length px readily exceeds 405
cm (45 pass × 9 cm length). In addition, the inlet fluid velocity
inu must be higher than 100 m/s to supply a sufficient
amount of dry air for a 4 A/cm2 current density in a large ac-
tive cell area. Fig. 8 shows the parallel SFFs that were de-
signed for a large square cell area of 81 cm2 (9 cm × 9 cm).
The flow fields in Figs. 8(a) and 8(c) are conventional SFFs
that have three or five parallel paths. Note that conventional
SFFs have been widely used in numerical and experimental
research, as well as in the actual fabrication of PEMFCs. The
flow field in Fig. 8(b) is the three-path parallel MPSFF based
on a five-pass pattern, whereas that in Fig. 8(d) is the five-path
parallel MPSFF based on a three-pass pattern. The method for
constructing parallel MPSFFs in a given cell area is also ex-
plained by Nam et al. [23]. Subsequently, the maximum chan-
nel path-length px is 135 cm for SFFs with three parallel
paths (parallel-a and parallel-b) and 81 cm for SFFs with five
parallel paths (parallel-c and parallel-d).
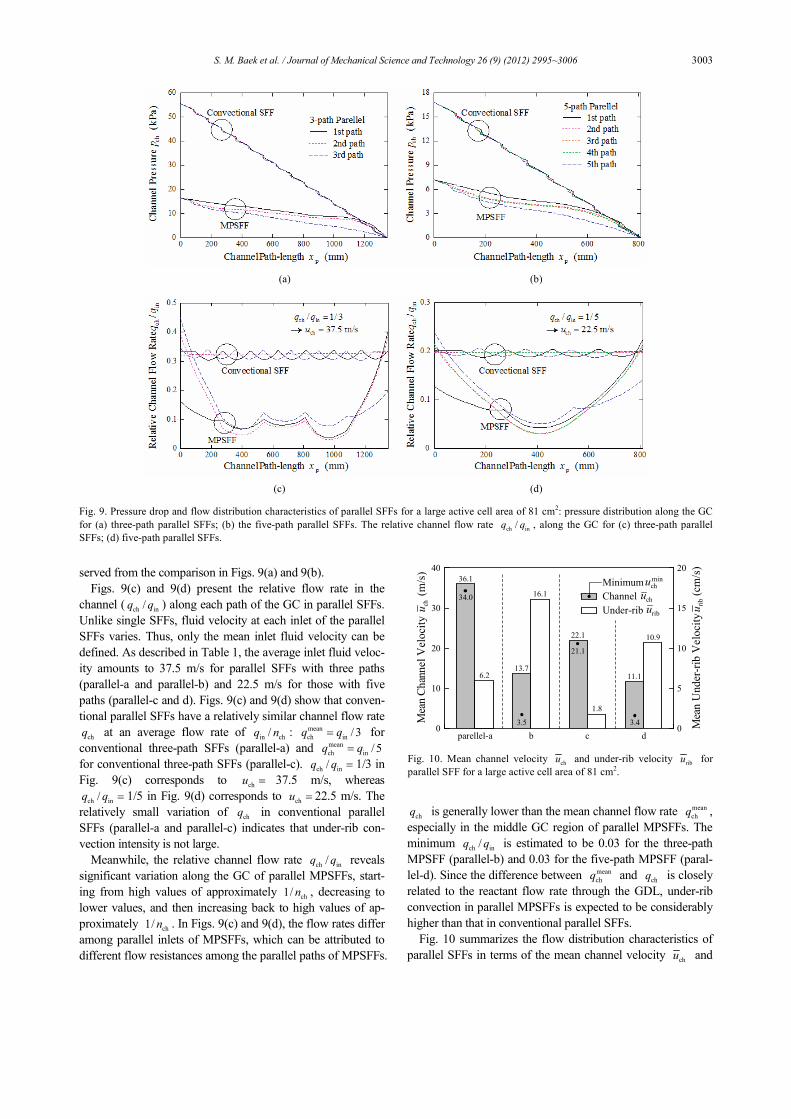
The pressure drop and flow distribution characteristics of
parallel SFFs were investigated, as shown in Fig. 9. In the
calculation, an inlet fluid pressure that can produce the reac-
tant flow rate corresponding to the reference current density of
4 A/cm2 was imposed on all parallel paths in the parallel SFFs.
Notably, these velocities result in laminar flow in a square
channel of a 1 mm × 1 mm cross-sectional area, as indicated
in Table 1. Figs. 9(a) and 9(b) present the predicted pressure
distribution along each path of the GC in the three-path paral-
lel SFFs and in the five-path parallel SFFs, respectively. The
pressure drop across the GC chp∆ is predicted as 55.6 kPa
for the conventional three-path SFF (parallel-a) and 16.5 kPa
for the three-path MPSFF (parallel-b). Similarly, chp∆ is
predicted as 16.8 kPa for the conventional five-path SFF (par-
allel-c) and 7.2 kPa for the five-path MPSFF (parallel-d). Figs.
9(a) and 9(b) clearly indicate that pressure drop can be signifi-
cantly reduced by using parallel MPSFFs instead of conven-
tional parallel SFFs. In addition, pressure drop decreases as
the number of parallel paths chn increases, as can be ob-
(a) (b) a b
(c) (d) c d
Fig. 8. Parallel SFFs designed for a large active cell area of 81 cm2 (9
cm × 9 cm): (a) conventional three-path SFF; (b) three-path MPSFF
with a five-pass pattern; (c) conventional five-path SFF; (d) five-path
MPSFF with a three-pass pattern. These flow fields are denoted as
parallels-a, -b, -c, and -d, respectively.
single-a b c d e f0
4
8
12
16
0
4
8
12
16
Channel
Under-rib
(m/s)
chu
Mea
nChan
nel V
elocity
(cm/s)
rib
uM
ean U
nder-rib V
elocity
12.3
10.0
6.46.2
9.4
2.4
5.5
11.1
8.4
6.8
9.1
7.1
12.3
8.2
7.4
10.5
5.7
6.5
Minimum
chu
ribu
chumin
Fig. 7. Mean channel velocity chu and under-rib velocity
ribu of
single SFFs for a small active cell area of 9 cm2.
S. M. Baek et al. / Journal of Mechanical Science and Technology 26 (9) (2012) 2995~3006 3003
served from the comparison in Figs. 9(a) and 9(b).
Figs. 9(c) and 9(d) present the relative flow rate in the
channel (ch in/q q ) along each path of the GC in parallel SFFs.
Unlike single SFFs, fluid velocity at each inlet of the parallel
SFFs varies. Thus, only the mean inlet fluid velocity can be
defined. As described in Table 1, the average inlet fluid veloc-
ity amounts to 37.5 m/s for parallel SFFs with three paths
(parallel-a and parallel-b) and 22.5 m/s for those with five
paths (parallel-c and d). Figs. 9(c) and 9(d) show that conven-
tional parallel SFFs have a relatively similar channel flow rate
chq at an average flow rate of in ch/q n : mean
ch in/ 3q q= for
conventional three-path SFFs (parallel-a) and mean
ch in/ 5q q=
for conventional three-path SFFs (parallel-c). ch in/q q = 1/3 in
Fig. 9(c) corresponds to chu = 37.5 m/s, whereas
ch in/q q = 1/5 in Fig. 9(d) corresponds to chu = 22.5 m/s. The
relatively small variation of chq in conventional parallel
SFFs (parallel-a and parallel-c) indicates that under-rib con-
vection intensity is not large.
Meanwhile, the relative channel flow rate ch in/q q reveals
significant variation along the GC of parallel MPSFFs, start-
ing from high values of approximately ch1/n , decreasing to
lower values, and then increasing back to high values of ap-
proximately ch1/n . In Figs. 9(c) and 9(d), the flow rates differ
among parallel inlets of MPSFFs, which can be attributed to
different flow resistances among the parallel paths of MPSFFs.
chq is generally lower than the mean channel flow rate mean
chq ,
especially in the middle GC region of parallel MPSFFs. The
minimum ch in/q q is estimated to be 0.03 for the three-path
MPSFF (parallel-b) and 0.03 for the five-path MPSFF (paral-
lel-d). Since the difference between mean
chq and
chq is closely
related to the reactant flow rate through the GDL, under-rib
convection in parallel MPSFFs is expected to be considerably
higher than that in conventional parallel SFFs.
Fig. 10 summarizes the flow distribution characteristics of
parallel SFFs in terms of the mean channel velocity chu and
(a) (b)
(c) (d)
Fig. 9. Pressure drop and flow distribution characteristics of parallel SFFs for a large active cell area of 81 cm2: pressure distribution along the GC
for (a) three-path parallel SFFs; (b) the five-path parallel SFFs. The relative channel flow rate ch in/q q , along the GC for (c) three-path parallel
SFFs; (d) five-path parallel SFFs.
0
10
20
30
40
0
5
10
15
20
parellel-a b c d
(m/s)
chu
Mea
nChan
nel Velocity
(cm
/s)
rib
uM
ean U
nder
-rib V
elo
city
Channel
Under-rib
Minimum
chu
ribu
chumin36.1
22.1
1.8
16.1
13.76.2
10.9
11.1
34.0
21.1
3.5 3.4
Fig. 10. Mean channel velocity chu and under-rib velocity
ribu for
parallel SFF for a large active cell area of 81 cm2.
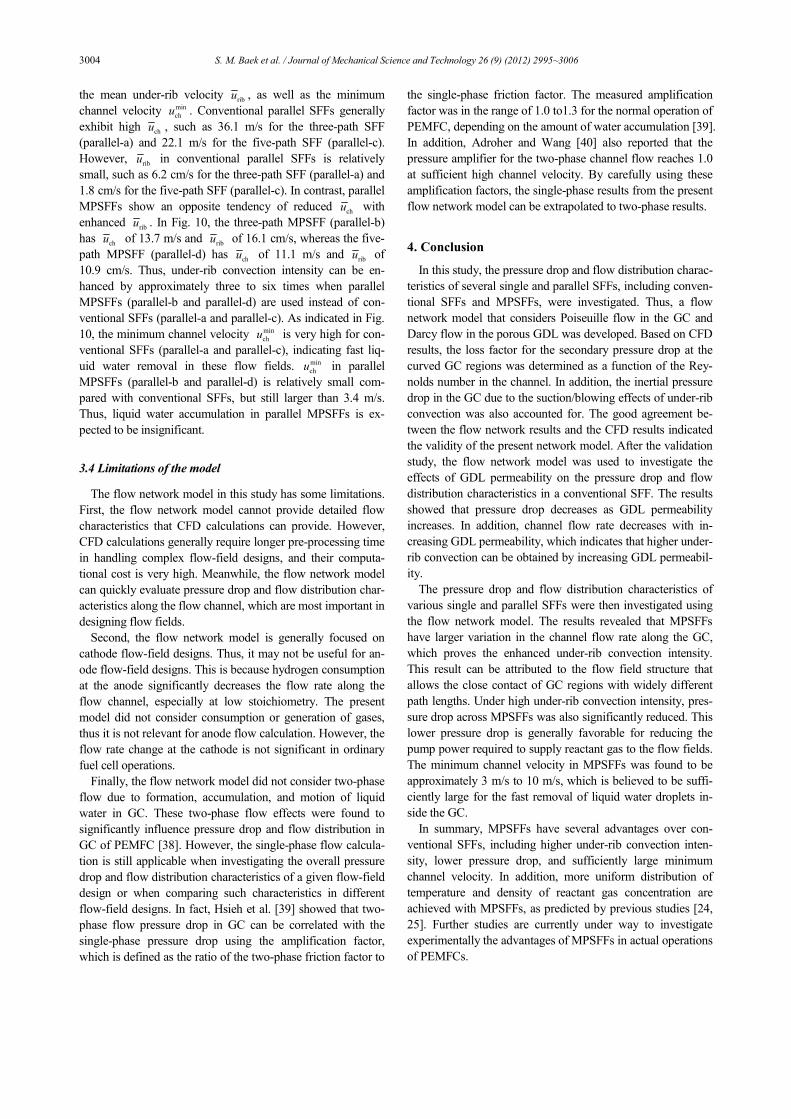
3004 S. M. Baek et al. / Journal of Mechanical Science and Technology 26 (9) (2012) 2995~3006
the mean under-rib velocity ribu , as well as the minimum
channel velocity min
chu . Conventional parallel SFFs generally
exhibit high chu , such as 36.1 m/s for the three-path SFF
(parallel-a) and 22.1 m/s for the five-path SFF (parallel-c).
However, ribu in conventional parallel SFFs is relatively
small, such as 6.2 cm/s for the three-path SFF (parallel-a) and
1.8 cm/s for the five-path SFF (parallel-c). In contrast, parallel
MPSFFs show an opposite tendency of reduced chu with
enhanced ribu . In Fig. 10, the three-path MPSFF (parallel-b)
has chu of 13.7 m/s and
ribu of 16.1 cm/s, whereas the five-
path MPSFF (parallel-d) has chu of 11.1 m/s and
ribu of
10.9 cm/s. Thus, under-rib convection intensity can be en-
hanced by approximately three to six times when parallel
MPSFFs (parallel-b and parallel-d) are used instead of con-
ventional SFFs (parallel-a and parallel-c). As indicated in Fig.
10, the minimum channel velocity min
chu is very high for con-
ventional SFFs (parallel-a and parallel-c), indicating fast liq-
uid water removal in these flow fields. min
chu in parallel
MPSFFs (parallel-b and parallel-d) is relatively small com-
pared with conventional SFFs, but still larger than 3.4 m/s.
Thus, liquid water accumulation in parallel MPSFFs is ex-
pected to be insignificant.
3.4 Limitations of the model
The flow network model in this study has some limitations.
First, the flow network model cannot provide detailed flow
characteristics that CFD calculations can provide. However,
CFD calculations generally require longer pre-processing time
in handling complex flow-field designs, and their computa-
tional cost is very high. Meanwhile, the flow network model
can quickly evaluate pressure drop and flow distribution char-
acteristics along the flow channel, which are most important in
designing flow fields.
Second, the flow network model is generally focused on
cathode flow-field designs. Thus, it may not be useful for an-
ode flow-field designs. This is because hydrogen consumption
at the anode significantly decreases the flow rate along the
flow channel, especially at low stoichiometry. The present
model did not consider consumption or generation of gases,
thus it is not relevant for anode flow calculation. However, the
flow rate change at the cathode is not significant in ordinary
fuel cell operations.
Finally, the flow network model did not consider two-phase
flow due to formation, accumulation, and motion of liquid
water in GC. These two-phase flow effects were found to
significantly influence pressure drop and flow distribution in
GC of PEMFC [38]. However, the single-phase flow calcula-
tion is still applicable when investigating the overall pressure
drop and flow distribution characteristics of a given flow-field
design or when comparing such characteristics in different
flow-field designs. In fact, Hsieh et al. [39] showed that two-
phase flow pressure drop in GC can be correlated with the
single-phase pressure drop using the amplification factor,
which is defined as the ratio of the two-phase friction factor to
the single-phase friction factor. The measured amplification
factor was in the range of 1.0 to1.3 for the normal operation of
PEMFC, depending on the amount of water accumulation [39].
In addition, Adroher and Wang [40] also reported that the
pressure amplifier for the two-phase channel flow reaches 1.0
at sufficient high channel velocity. By carefully using these
amplification factors, the single-phase results from the present
flow network model can be extrapolated to two-phase results.
4. Conclusion
In this study, the pressure drop and flow distribution charac-
teristics of several single and parallel SFFs, including conven-
tional SFFs and MPSFFs, were investigated. Thus, a flow
network model that considers Poiseuille flow in the GC and
Darcy flow in the porous GDL was developed. Based on CFD
results, the loss factor for the secondary pressure drop at the
curved GC regions was determined as a function of the Rey-
nolds number in the channel. In addition, the inertial pressure
drop in the GC due to the suction/blowing effects of under-rib
convection was also accounted for. The good agreement be-
tween the flow network results and the CFD results indicated
the validity of the present network model. After the validation
study, the flow network model was used to investigate the
effects of GDL permeability on the pressure drop and flow
distribution characteristics in a conventional SFF. The results
showed that pressure drop decreases as GDL permeability
increases. In addition, channel flow rate decreases with in-
creasing GDL permeability, which indicates that higher under-
rib convection can be obtained by increasing GDL permeabil-
ity.
The pressure drop and flow distribution characteristics of
various single and parallel SFFs were then investigated using
the flow network model. The results revealed that MPSFFs
have larger variation in the channel flow rate along the GC,
which proves the enhanced under-rib convection intensity.
This result can be attributed to the flow field structure that
allows the close contact of GC regions with widely different
path lengths. Under high under-rib convection intensity, pres-
sure drop across MPSFFs was also significantly reduced. This
lower pressure drop is generally favorable for reducing the
pump power required to supply reactant gas to the flow fields.
The minimum channel velocity in MPSFFs was found to be
approximately 3 m/s to 10 m/s, which is believed to be suffi-
ciently large for the fast removal of liquid water droplets in-
side the GC.
In summary, MPSFFs have several advantages over con-
ventional SFFs, including higher under-rib convection inten-
sity, lower pressure drop, and sufficiently large minimum
channel velocity. In addition, more uniform distribution of
temperature and density of reactant gas concentration are
achieved with MPSFFs, as predicted by previous studies [24,
25]. Further studies are currently under way to investigate
experimentally the advantages of MPSFFs in actual operations
of PEMFCs.
S. M. Baek et al. / Journal of Mechanical Science and Technology 26 (9) (2012) 2995~3006 3005
Acknowledgment
This work was supported by the second stage of Brain Ko-
rea 21 (BK21) Project and also by Daegu University Research
Fund.
Nomenclature------------------------------------------------------------------------
dh : Hydraulic diameter, m
f : Darcy friction factor
h,l,w,t : Height, length, width, thickness, m
K : Flow permeability, m2
KL : Secondary loss factor
mɺ : Mass flow rate, kg/s
n : Number of parallel channels
p : Pressure, Pa
Q : Flow rate, m3/s
R : Flow resistance, Pa-s/m3
Re : Reynolds number
u : Velocity, m/s
xp : Channel path length, m
Greek letters
µ : Fluid viscosity, Pa-s
ρ : Fluid density, kg/m3
Subscripts
ch : Channel region
gdl : Gas diffusion layer (GDL)
in : Inlet or inflow
min : Minimum
out : Outflow
rib : Under-rib region
unit : Unit cell
References
[1] J. Larminie and A. Dicks, Fuel cell systems explained, John
Wiley & Sons, Chichester (2000).
[2] R. P. O’Hayre, S. W. Cha, W. Colella and F. B. Prinz, Fuel
cell fundamentals, John Wiley & Sons, New York (2006).
[3] A. Faghri and Z. Guo, Challenges and opportunities of ther-
mal management issues related to fuel cell technology and
modeling, International Journal of Heat and Mass Transfer,
48 (2005) 3891-3920.
[4] H. Li, Y. Tang, Z. Wang, Z. Shi, S. Wu and D. Song, et al.,
A review of water flooding issues in the proton exchange
membrane fuel cell, Journal of Power Sources, 178 (2008)
103-117.
[5] Y. Wang, K. S. Chen, J. Mishler, S. C. Cho and X. C. Adro-
her, A review of polymer electrolyte membrane fuel cells:
Technology, applications, and needs on fundamental re-
search, Applied Energy, 88 (2011) 981-1007.
[6] X. Li and I. Sabir, Review of bipolar plates in PEM fuel
cells: Flow-field designs, International Journal of Hydrogen
Energy, 30 (2005) 359-371.
[7] P. J Hamilton and B. G. Pollet, Polymer electrolyte mem-
brane fuel cell (PEMFC) flow field plate: Design, materials
and characterization, Fuel Cells, 10 (2010) 489-509.
[8] T. V. Nguyen, A gas distributor design for proton-exchange-
membrane fuel cells, Journal of the Electrochemical Society,
143 (1996) L103-L105.
[9] W. He, J. S. Yi and T. V. Nguyen, Two-phase flow model of
the cathode of PEM fuel cells using interdigitated flow fields,
AIChE Journal, 46 (1999) 2053-2064.
[10] S. Dutta, S. Shimpalee and J. W. Van Zee, Numerical pre-
diction of mass-exchange between cathode and anode chan-
nels in a PEM fuel cell, International Journal of Heat and
Mass Transfer, 44 (2001) 2029-2042.
[11] M. V. Williams, H. R. Kunz and J. M. Fenton, Influence of
convection through gas-diffusion layers on limiting current
in PEM FCs using a serpentine flow field, Journal of the
Electrochemical Society, 151 (2004) A1617-A1627.
[12] J. G. Pharoah, On the permeability of gas diffusion media
used in PEM fuel cells, Journal of Power Sources, 144
(2005) 77-82.
[13] P. H. Oosthuizen, L. Sun and K. B. McAuley, The effect of
channel-to-channel gas crossover on the pressure and tem-
perature distribution in PEM fuel cell flow plates, Applied
Thermal Engineering, 25 (2005) 1083-1096.
[14] J. P. Feser, A. K. Prasad and S. G. Advani, On the relative
influence of convection in serpentine flow fields of PEM
fuel cells, Journal of Power Sources, 161 (2006) 404-412.
[15] Q. Ye, T. S. Zhao and C. Xu, The role of under-rib convec-
tion in mass transport of methanol through the serpentine
flow field and its neighboring porous layer in a DMFC,
Electrochimica Acta, 51 (2006) 5420-5429.
[16] T. Kanezaki, X. Li and J. J. Baschuk, Cross-leakage flow
between adjacent flow channels in PEM fuel cells, Journal
of Power Sources, 162 (2006) 415-425.
[17] D. Tehlar, R. Flückiger, A. Wokaun and F. N. Büchi, In-
vestigation of channel-to-channel cross convection in ser-
pentine flow fields, Fuel Cells, 10 (2009) 1040-1049.
[18] P. V. Suresh, S. Jayanti, A. P. Deshpande and P. Haridoss,
An improved serpentine flow field with enhanced cross-flow
for fuel cell applications, International Journal of Hydrogen
Energy, 36 (2011) 6067-6072.
[19] S. M. Baek, S. G. Koh, K. N. Kim, J. H. Kang, J. H. Nam
and C. J. Kim, A numerical study on the performance of
polymer electrolyte membrane fuel cells due to the variation
in gas diffusion layer permeability, Journal of Mechanical
Science and Technology, 25 (2011) 457-467.
[20] C. Xu and T. S. Zhao, A new flow field design for polymer
electrolyte-based fuel cells, Electrochemistry Communica-
tions, 9 (2007) 497-503.
[21] F. C. Chen, Z. Gao, R.O. Loutfy and M. Hecht, Analysis of
optimal heat transfer in a PEM fuel cell cooling plate, Fuel
Cells, 3 (2003) 181-188.
3006 S. M. Baek et al. / Journal of Mechanical Science and Technology 26 (9) (2012) 2995~3006
[22] J. Choi, Y. H. Kim, Y. Lee, K. J. Lee and Y. Kim, Numeri-
cal analysis on the performance of cooling plates in a PEFC,
Journal of Mechanical Science and Technology, 22 (2008)
1417-1425.
[23] J. H. Nam, K. J. Lee, S. Sohn and C. J. Kim, Multi-pass
serpentine flow-fields to enhance under-rib convection in
polymer electrolyte membrane fuel cells: Design and geo-
metrical characterization, Journal of Power Sources, 188
(2009) 14-23.
[24] S. H. Yu, S. Sohn, J. H. Nam and C. J. Kim, Numerical
study to examine the performance of multi-pass serpentine
flow-fields for cooling plates in polymer electrolyte mem-
brane fuel cells, Journal of Power Sources, 194 (2009) 697-
703.
[25] S. M. Baek, S. H. Yu, J. H. Nam and C. J. Kim, A numeri-
cal study on uniform cooling of large-scale PEMFCs with
different coolant flow field designs, Applied Thermal Engi-
neering, 31 (2011) 1427-1434.
[26] A. Kaufman and P. L. Terry, Hydrogen-air fuel cell, US
Patent, No. 5,776,625 (1998).
[27] Z. Qi and A. Kaufman, PEM fuel cell stacks operated under
dry-reactant conditions, Journal of Power Sources, 109
(2002) 469-476.
[28] F. M. White, Fluid mechanics, 5th Ed., McGraw Hill, New
York, (2003).
[29] M. Kaviany, Principles of heat transfer in porous media,
2nd Ed., Springer, New York (1999).
[30] M. K. Bassiouny and H. Martin, Flow distribution and
pressure drop in plate heat exchangers − I. U-type arrange-
ment, Chemical Engineering Science, 39 (1984) 693−700.
[31] M. K. Bassiouny and H. Martin, Flow distribution and
pressure drop in plate heat exchangers − II. Z-type arrange-
ment, Chemical Engineering Science, 39 (1984) 701−704.
[32] K. B. S. Prasad, P. V. Suresh and S. Jayanti, A hydrody-
namic network model for interdigitated flow fields, Interna-
tional Journal of Hydrogen Energy, 34 (2009) 8289-8301.
[33] R. K. Shah and A. L. London, Laminar flow forced convec-
tion in ducts, Academic Press, New York (1978).
[34] J. A. Rock, Mirrored serpentine flow channels for fuel cell,
US Patent, No. 6,099,984 (2000).
[35] M. V. Williams, E. Begg, L. Bonville, H. R. Kunz and J. M.
Fenton, Characterization of gas diffusion layers for PEMFC,
Journal of the Electrochemical Society, 151 (2004) A1173-
A1180.
[36] J. T. Gostick, M. W. Fowler, M. D. Pritzker, M. A. Ioanni-
dis and L. M. Behra, In-plane and through-plane gas perme-
ability of carbon fiber electrode backing layers, Journal of
Power Sources, 162 (2006) 228-238.
[37] J. P. Feser, A. K. Prasad and S. G. Advani, Experimental
characterization of in-plane permeability of gas diffusion
layers, Journal of Power Sources, 162 (2006) 1226-1231.
[38] S. G. Kandlikar, Z. Lu, W. E. Domigan, A. D. White and
M. W. Benedict, Measurement of flow maldistribution in
parallel channels and its application to ex-situ and in-situ ex-
periments in PEMFC water management studies, Interna-
tional Journal of Heat and Mass Transfer, 52 (2009)
1741−1752.
[39] S. S. Hsieh, Y. J. Huang and B. S. Her, Pressure drop on
water accumulation distribution for a micro PEM fuel cell
with different flow field plates, International Journal of
Heat and Mass Transfer, 52 (2009) 5657−5659.
[40] X. C. Adroher and Y. Wang, Ex situ and modeling study of
two-phase flow in a single channel of polymer electrolyte
membrane fuel cells, Journal of Power Sources, 196 (2011)
9544−9551.
Seung Man Baek received his Bache-
lor of Science degree in Mechanical
Engineering from Seoul National Uni-
versity of Technology, Korea in 2005.
He then received his Master of Science
degree in Mechanical Engineering from
Seoul National University, Korea in
2007. Currently, he is a Doctor of Phi-
losophy candidate in the School of Mechanical and Aerospace
Engineering at Seoul National University. His research is fo-
cused on the thermal modeling of Li-ion battery systems, fuel
cell systems, and solar thermal systems.
Jin Hyun Nam received his Bachelor of
Science, Master of Science, and Doctor
of Philosophy degrees in Mechanical
Engineering from Seoul National Uni-
versity, Korea in 1996, 1998, and 2003,
respectively. Dr. Nam currently works
as an Assistant Professor in the School
of Mechanical and Automotive Engi-
neering at Daegu University in Gyungsan, Korea. His research
interests include fuel cell and battery systems, heat and mass
transfer, and thermo-fluid process modeling.