Surface pressure characteristics on a triangular prism located behind a porous fence
15
* Corresponding author. Journal of Wind Engineering and Industrial Aerodynamics 80 (1999) 69—83 Surface pressure characteristics on a triangular prism located behind a porous fence Sang-Joon Lee*, Cheol-Woo Park Department of Mechanical Engineering, Pohang University of Science and Technology, 790-784 Pohang, South Korea Received 15 June 1997; received in revised form 10 April 1998; accepted 21 May 1998 Abstract The shelter effect of porous wind fences on wind-blown dust was studied by measuring the pressure characteristics around a two-dimensional prism of triangular cross-section. The wind fence of porosity e"40% which was known to be most effective to abate the wind erosion was used in this study. The wind fence and the prism model were embedded in a thermally neutral atmospheric surface boundary layer over the suburb. The fence had the same height as the prism crest of 40 mm and Reynolds number based on the model height was Re"2.6]104. We also investigated the effect of a back fence located behind the prism model and multiple back prisms on the pressure and wall shear stress on the prism surface. By installing the porous wind fence, the mean pressure and pressure fluctuations on the prism surface were decreased, and the wall shear stress on the windward surface of the prism was decreased up to 1 3 of that without the fence. When a back fence was installed behind the prism in addition to the front fence, the pressure fluctuations on the model surface decreased more than half. When several consecutive prisms of the same shape were located behind the fence, the shelter-effect of the porous wind fence was extended up to the 5th—6th prism. ( 1999 Elsevier Science Ltd. All rights reserved. Keywords: Porous fence; Triangular prism; Surface pressure 1. Introduction Atmospheric dispersion of wind-blown dust particles from an open storage coal yard may cause several air-pollution problems. Many wind simulation studies have been carried out in order to reduce the dust emission or to analyze the wind erosion mechanism. Although porous fences have been used as a practical wind shelter, the basic study to evaluate the effectiveness of the porous wind fence for abating the 0167-6105/99/$ — see front matter ( 1999 Elsevier Science Ltd. All rights reserved. PII: S 0 1 6 7 - 6 1 0 5 ( 9 8 ) 0 0 1 9 5 - 0
-
Upload
independent -
Category
Documents
-
view
2 -
download
0
Transcript of Surface pressure characteristics on a triangular prism located behind a porous fence
*Corresponding author.
Journal of Wind Engineeringand Industrial Aerodynamics 80 (1999) 69—83
Surface pressure characteristics on a triangular prismlocated behind a porous fence
Sang-Joon Lee*, Cheol-Woo ParkDepartment of Mechanical Engineering, Pohang University of Science and Technology,
790-784 Pohang, South Korea
Received 15 June 1997; received in revised form 10 April 1998; accepted 21 May 1998
Abstract
The shelter effect of porous wind fences on wind-blown dust was studied by measuring thepressure characteristics around a two-dimensional prism of triangular cross-section. The windfence of porosity e"40% which was known to be most effective to abate the wind erosion wasused in this study. The wind fence and the prism model were embedded in a thermally neutralatmospheric surface boundary layer over the suburb. The fence had the same height as theprism crest of 40 mm and Reynolds number based on the model height was Re"2.6]104. Wealso investigated the effect of a back fence located behind the prism model and multiple backprisms on the pressure and wall shear stress on the prism surface. By installing the porous windfence, the mean pressure and pressure fluctuations on the prism surface were decreased, and thewall shear stress on the windward surface of the prism was decreased up to 1
3of that without the
fence. When a back fence was installed behind the prism in addition to the front fence, thepressure fluctuations on the model surface decreased more than half. When several consecutiveprisms of the same shape were located behind the fence, the shelter-effect of the porous windfence was extended up to the 5th—6th prism. ( 1999 Elsevier Science Ltd. All rights reserved.
Keywords: Porous fence; Triangular prism; Surface pressure
1. Introduction
Atmospheric dispersion of wind-blown dust particles from an open storage coalyard may cause several air-pollution problems. Many wind simulation studies havebeen carried out in order to reduce the dust emission or to analyze the wind erosionmechanism. Although porous fences have been used as a practical wind shelter, thebasic study to evaluate the effectiveness of the porous wind fence for abating the
0167-6105/99/$ — see front matter ( 1999 Elsevier Science Ltd. All rights reserved.PII: S 0 1 6 7 - 6 1 0 5 ( 9 8 ) 0 0 1 9 5 - 0
wind-blown dust from coal piles is still necessary to understand the wind erosionmechanism in more detail.
The wind erosion is closely related to the wall shear stress and the pressurefluctuations on the coal pile surface. For this kind of wind engineering study,a simulated atmospheric boundary layer is needed which satisfies the surface flowcharacteristics and dynamic similarity [1].
Borges and Viegas [2] investigated the shelter effect of windbreaks by measuringthe velocity reduction and the shear stress distribution behind the windbreaks. Plate[3] also revealed that the windbreak could reduce the wind-blown dust effectivelywhen it is embedded in the atmospheric boundary layer over a plain terrain. Perera[4] found that the separation bubbles which formed behind a porous fence disap-peared with increasing the fence porosity greater than e"30%.
Seginer and Sagi [5] calculated the drag force and the moment exerted on a wind-break placed perpendicular to the wind direction by measuring the pressure differenceand the shear stress. Ranga et al. [6] revealed that the drag force acting on a windfence was mainly affected by the porosity and height of the fence.
On the other hand, the lifting force which ejects dust particles from the coalpile surface is known to be closely related to the relative velocity of the oncomingflow and the viscous friction velocity near the surface. From this we can see thatthe pressure fluctuations on the coal pile surface depend analogically on thesurface flow characteristics. There are several empirical equations which can beused to predict the erosion quantity of the dust particles, but the accurate relation-ship between the fluctuating surface pressure and the flow structure has not beenfully established. The pressure fluctuations show irregular peaks near theseparation region, especially a remarkable sharp peak occurs at the separation point[7—9].
Ogawa et al. [10] carried out the spectral analysis of the pressure signals measuredfrom a semi-circular prism surface and derived a relationship between the surfacepressure and the time-averaged mean velocity. They found that the turbulenceintensity of the oncoming flow affects the surface pressure fluctuations. Tieleman [11]investigated the effect of small-scale turbulence on the surface pressure observed onthe surface-mounted prism and compared this result with that of a full-scale experi-ment.
Most previous studies were focused on the flow structure itself around the windfence. But, it is difficult to find studies on the interaction between the porous fencewake and the surface pressure on the model surface located behind the fence. We haveinvestigated the effect of porous wind fences on the surface pressure variations ofa triangular prism by changing the porosity and height of the wind fence [12]. In thisprevious study, the porous fence with porosity e"40—50% was found to be mosteffective in abating the wind erosion, reducing the mean pressure and pressurefluctuations on the model surface.
The main objective of this study is to investigate the effect of porous wind fences onthe surface pressure and the wall shears stress on the two-dimensional triangularprism in more detail, with studying the effects of an added back fence, and increasingthe number of prism models.
70 S.-J. Lee et al./J. Wind Eng. Ind. Aerodyn. 80 (1999) 69–83
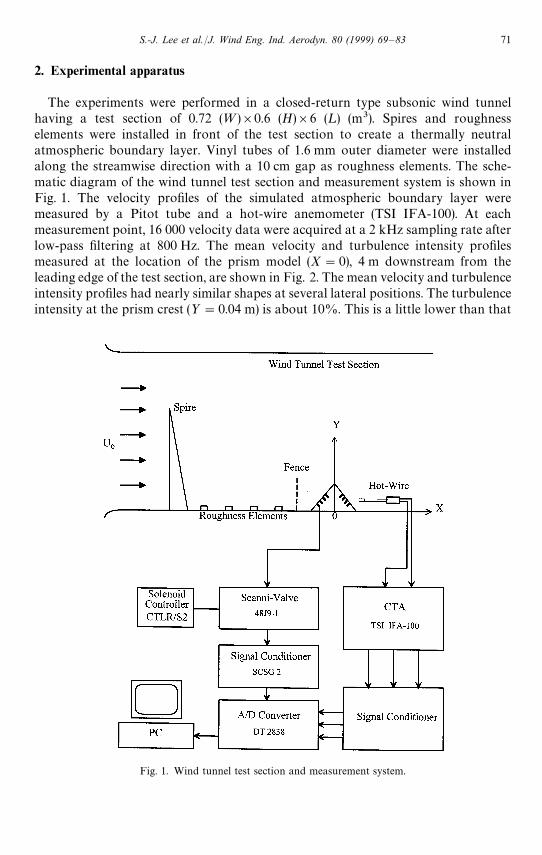
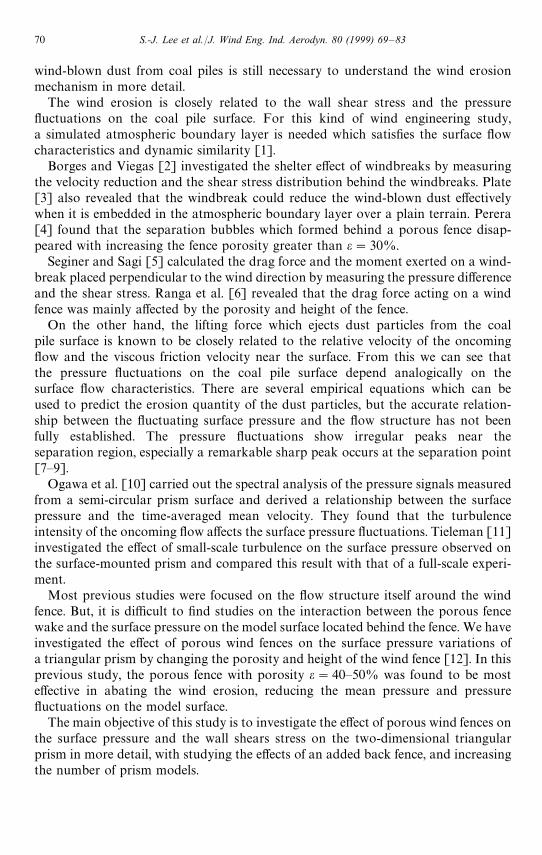
Fig. 1. Wind tunnel test section and measurement system.
2. Experimental apparatus
The experiments were performed in a closed-return type subsonic wind tunnelhaving a test section of 0.72 (¼)]0.6 (H)]6 (¸) (m3). Spires and roughnesselements were installed in front of the test section to create a thermally neutralatmospheric boundary layer. Vinyl tubes of 1.6 mm outer diameter were installedalong the streamwise direction with a 10 cm gap as roughness elements. The sche-matic diagram of the wind tunnel test section and measurement system is shown inFig. 1. The velocity profiles of the simulated atmospheric boundary layer weremeasured by a Pitot tube and a hot-wire anemometer (TSI IFA-100). At eachmeasurement point, 16 000 velocity data were acquired at a 2 kHz sampling rate afterlow-pass filtering at 800 Hz. The mean velocity and turbulence intensity profilesmeasured at the location of the prism model (X"0), 4 m downstream from theleading edge of the test section, are shown in Fig. 2. The mean velocity and turbulenceintensity profiles had nearly similar shapes at several lateral positions. The turbulenceintensity at the prism crest (½"0.04 m) is about 10%. This is a little lower than that
S.-J. Lee et al./J. Wind Eng. Ind. Aerodyn. 80 (1999) 69–83 71
Fig. 2. Profiles of mean streamwise velocity and turbulence intensity measured at X"0. (a) Mean velocity,(b) turbulent intensity.
of the suburban exposure, but near the ground surface the turbulence intensity hassimilar magnitude.
The mean streamwise velocity has the following power law profile:
º(y)
º0
"Ay
hBn, (1)
where h is the crest height of the triangular prism model. The velocity profile is wellfitted with n"0.22, which corresponds to the velocity profile of a city suburb case.The triangular prism model is scale-downed to 1
375of the prototype coal pile to
accommodate multiple prisms behind the wind fence. The crest height and inclinationangle of the prism are h"0.04 m and h"40°, respectively. Sixteen pressure taps wereinstalled along the middle span (Z"0) of the prism with 5 mm intervals. The pressuretaps were connected to the Scanivalve system (48J9-1) with vinyl tubes of 0.8 mminner diameter and 300 mm long to keep the dynamic characteristics of the pressuresignal unchanged. Each channel was selected by a solenoid controller (CTLR/S2) andthe analog voltage output from the pressure transducer (PDCR22-1psid) was digitizedby a high-precision A/D converter (DT2838). At each channel, 16 384 pressure datawere acquired at 500 samples/s.
In this study, a porous wind fence of porosity e"40% was used to investigate thesurface pressure and the wall shear stress on the prism surface. This fence was proved
72 S.-J. Lee et al./J. Wind Eng. Ind. Aerodyn. 80 (1999) 69–83

Fig. 3. Experimental setup and coordinate system.
to be one of the most effective fences to abate the wind-erosion dusts from ourprevious experiments [12]. In addition, the effects of the back fence and the multipleback prisms were also investigated for the wind fence of porosity e"40%. The porousfence was made of an aluminum plate of 4 mm thickness and has the shape ratio(thickness/height) of 0.1. Since the shape ratio is less than 0.33, the flow can beregarded as a fence flow [13]. The experimental setup and coordinate system used inthis study are shown in Fig. 3. Here, the fence height H was set to have the same heightas the prism crest.
The pressure difference between the surface pressure p and the reference staticpressure p
0was non-dimensionalized by the dynamic pressure with velocity º
0.04at the
prism crest height h, and the air density o!. The pressure coefficient C
pis expressed as
Cp"
p!p0
12oaº2
0.04
. (2)
The reference pressure p0
was measured by a Pitot-static tube located at ½"0.4 mwhere the influence of the experimental model was small. The local pressure differencep!p
0also can be expressed by the following form:
p!p0"o
8gd, (3)
where d is the pressure head difference and o8g is the specific weight of water. During
the experiment, the oncoming velocity was fixed at º0.04
"9.3 m/s and its corre-sponding Reynolds number based on the model height h was Re"2.6]104.
S.-J. Lee et al./J. Wind Eng. Ind. Aerodyn. 80 (1999) 69–83 73
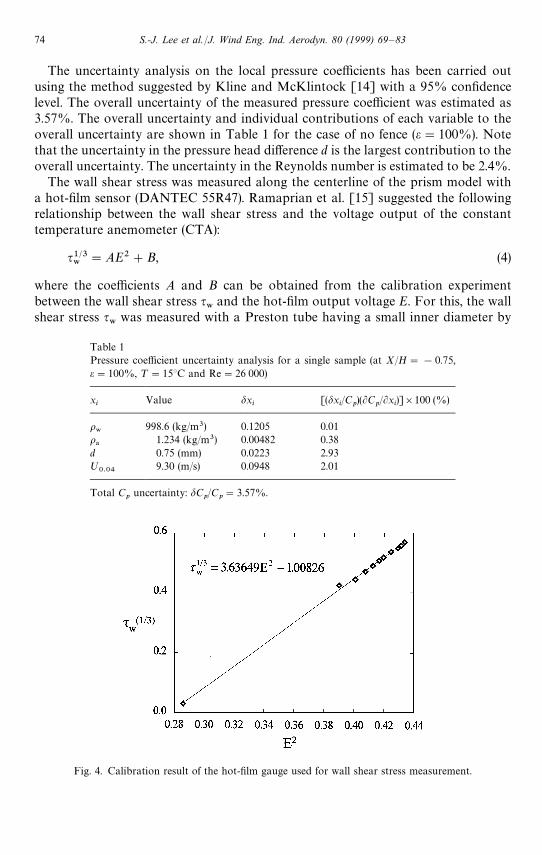
Fig. 4. Calibration result of the hot-film gauge used for wall shear stress measurement.
Table 1Pressure coefficient uncertainty analysis for a single sample (at X/H"!0.75,e"100%, ¹"15°C and Re"26 000)
xi
Value dxi
[(dxi/C
p)(LC
p/Lx
i)]]100 (%)
o8
998.6 (kg/m3) 0.1205 0.01o!
1.234 (kg/m3) 0.00482 0.38d 0.75 (mm) 0.0223 2.93º
0.049.30 (m/s) 0.0948 2.01
Total Cp
uncertainty: dCp/C
p"3.57%.
The uncertainty analysis on the local pressure coefficients has been carried outusing the method suggested by Kline and McKlintock [14] with a 95% confidencelevel. The overall uncertainty of the measured pressure coefficient was estimated as3.57%. The overall uncertainty and individual contributions of each variable to theoverall uncertainty are shown in Table 1 for the case of no fence (e"100%). Notethat the uncertainty in the pressure head difference d is the largest contribution to theoverall uncertainty. The uncertainty in the Reynolds number is estimated to be 2.4%.
The wall shear stress was measured along the centerline of the prism model witha hot-film sensor (DANTEC 55R47). Ramaprian et al. [15] suggested the followingrelationship between the wall shear stress and the voltage output of the constanttemperature anemometer (CTA):
q1@38
"AE2#B, (4)
where the coefficients A and B can be obtained from the calibration experimentbetween the wall shear stress q
8and the hot-film output voltage E. For this, the wall
shear stress q8
was measured with a Preston tube having a small inner diameter by
74 S.-J. Lee et al./J. Wind Eng. Ind. Aerodyn. 80 (1999) 69–83
calculating the pressure difference between the Preston tube and the reference statictube [16]. At each measurement point, 32 000 data were acquired at 2000 samples/s.The calibration result of the hot-film sensor is shown in Fig. 4. The wall shear stresswas non-dimensionalized with the velocity º
0.04at the prism crest height and the air
density o!to give the friction coefficient C
&,
C&"
q8
12o!º2
0.04
. (5)
In general, the friction coefficient C&decreases in proportion to the Reynolds number
in a form of Re~1@2 [17].In order to see the qualitative characteristics of the flow field around the prism and
the wind fence, a particle suspension technique was employed in a circulating waterchannel having a test section of 30 (¼)]20 (H)]120 (¸) (cm3). The free streamvelocity was 12 cm/s and its corresponding Reynolds number was Re"2.8]103. Inthis flow-visualization experiment, the same atmospheric boundary layer was alsosimulated by installing spires in front of the test-section. Polystyrene particles with anaverage diameter of 300 lm were seeded, and the particle pathlines, illuminated bya cold light sheet, were photographed with a Nikon FE camera.
3. Results and discussions
3.1. Flow visualization
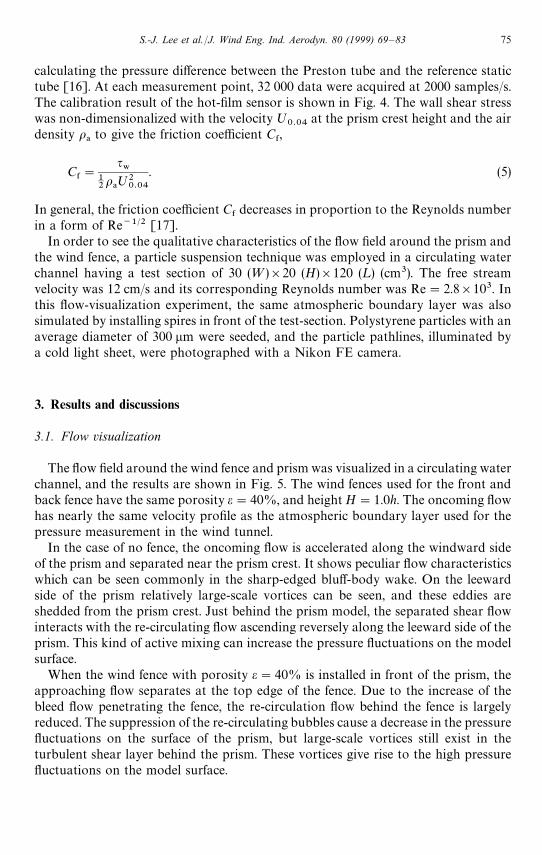
The flow field around the wind fence and prism was visualized in a circulating waterchannel, and the results are shown in Fig. 5. The wind fences used for the front andback fence have the same porosity e"40%, and height H"1.0h. The oncoming flowhas nearly the same velocity profile as the atmospheric boundary layer used for thepressure measurement in the wind tunnel.
In the case of no fence, the oncoming flow is accelerated along the windward sideof the prism and separated near the prism crest. It shows peculiar flow characteristicswhich can be seen commonly in the sharp-edged bluff-body wake. On the leewardside of the prism relatively large-scale vortices can be seen, and these eddies areshedded from the prism crest. Just behind the prism model, the separated shear flowinteracts with the re-circulating flow ascending reversely along the leeward side of theprism. This kind of active mixing can increase the pressure fluctuations on the modelsurface.
When the wind fence with porosity e"40% is installed in front of the prism, theapproaching flow separates at the top edge of the fence. Due to the increase of thebleed flow penetrating the fence, the re-circulation flow behind the fence is largelyreduced. The suppression of the re-circulating bubbles cause a decrease in the pressurefluctuations on the surface of the prism, but large-scale vortices still exist in theturbulent shear layer behind the prism. These vortices give rise to the high pressurefluctuations on the model surface.
S.-J. Lee et al./J. Wind Eng. Ind. Aerodyn. 80 (1999) 69–83 75
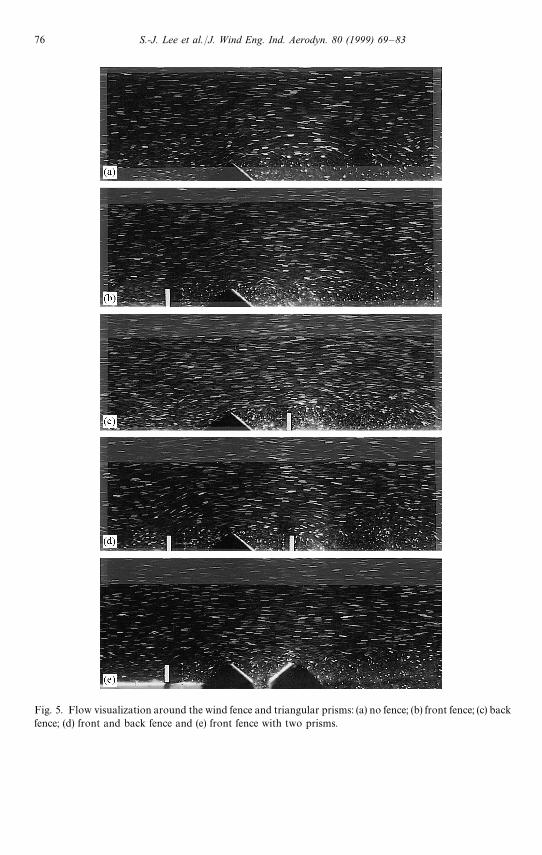
Fig. 5. Flow visualization around the wind fence and triangular prisms: (a) no fence; (b) front fence; (c) backfence; (d) front and back fence and (e) front fence with two prisms.
76 S.-J. Lee et al./J. Wind Eng. Ind. Aerodyn. 80 (1999) 69–83
Fig. 6. Effect of the back fence on the surface pressure. (a) Mean pressure, (b) pressure fluctuations.
When a back fence is installed behind the model in addition to the front fence, there-circulating flow along the leeward surface of the prism is almost prohibited by theback fence. Additional vortices exist, however, between the prism and the back fence.These vortices result from the fact that the separated flow around the prism creststrikes near the top of the back fence, and some parts of the re-circulating flow areentrained into the upper shear layer.
In the case of two prisms with a front fence, the flow between the fence and thewindward side of the first prism looks similar to the flow shown in Fig. 5b, but thereexists a re-circulating flow between the two prisms. This decelerated re-circulatingflow, which rotates in the clockwise direction decreases the surface pressure on thewindward side of the second prism, but large-scale vortices still exist in the shear layerbehind the second prism.
3.2. Effect of back fence
Fig. 6 shows the effect of the back fence on the mean and RMS pressure distribu-tions on the prism surface. The distance between the back fence and the prism was
S.-J. Lee et al./J. Wind Eng. Ind. Aerodyn. 80 (1999) 69–83 77
equal to the gap in front of the prism, G"60 mm. When there is a back fence only, theflow around the windward side of the prism is similar to that of the no fence case asshown in the flow visualization. With the back fence, however, the re-circulation flowascending reversely along the leeward surface is restricted. This may cause somedecrease of the mean surface pressure on the leeward side of the prism. Compared tothe case of a front fence only, the mean pressure increased at the windward surface, butdecreased at the leeward surface of the prism model. Therefore, it seems to beineffectual for abating dust emission with the back fence only.
When the same porous fence is installed on both sides of the prism, the meanpressure on the windward surface is decreased due to the delaying effect of there-circulating flow between the prism and the back fence. On the leeward surface ofthe prism, however, the mean pressure is increased. From the RMS pressure distribu-tion shown in Fig. 6b, we can see that the back fence reduces effectively the RMSpressure fluctuations on the leeward surface compared to the case of no back fence. Ifthere is a back fence only, however, the RMS pressure on the windward surface of theprism increases up to that of no fence case. Therefore, the pressure fluctuations onboth surfaces can be reduced effectively by installing the front fence and the back fencesimultaneously.
3.3. Effect of back prism
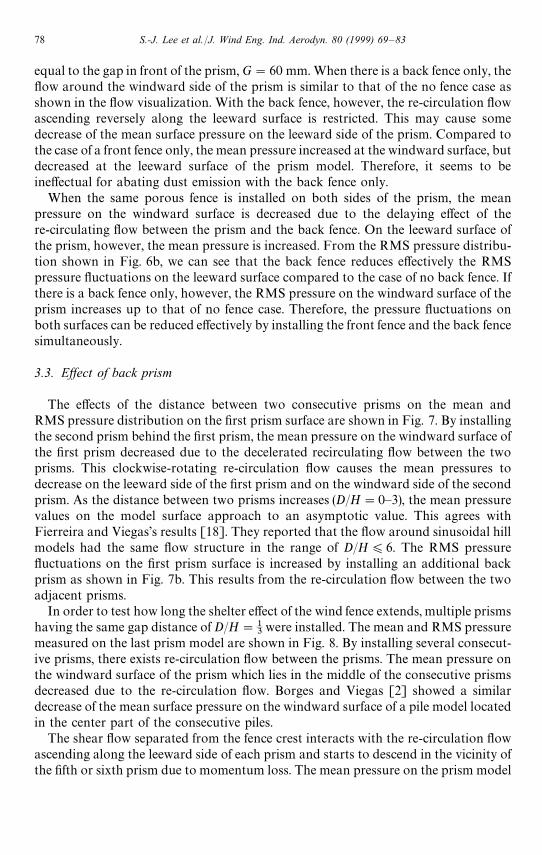
The effects of the distance between two consecutive prisms on the mean andRMS pressure distribution on the first prism surface are shown in Fig. 7. By installingthe second prism behind the first prism, the mean pressure on the windward surface ofthe first prism decreased due to the decelerated recirculating flow between the twoprisms. This clockwise-rotating re-circulation flow causes the mean pressures todecrease on the leeward side of the first prism and on the windward side of the secondprism. As the distance between two prisms increases (D/H"0—3), the mean pressurevalues on the model surface approach to an asymptotic value. This agrees withFierreira and Viegas’s results [18]. They reported that the flow around sinusoidal hillmodels had the same flow structure in the range of D/H)6. The RMS pressurefluctuations on the first prism surface is increased by installing an additional backprism as shown in Fig. 7b. This results from the re-circulation flow between the twoadjacent prisms.
In order to test how long the shelter effect of the wind fence extends, multiple prismshaving the same gap distance of D/H"1
3were installed. The mean and RMS pressure
measured on the last prism model are shown in Fig. 8. By installing several consecut-ive prisms, there exists re-circulation flow between the prisms. The mean pressure onthe windward surface of the prism which lies in the middle of the consecutive prismsdecreased due to the re-circulation flow. Borges and Viegas [2] showed a similardecrease of the mean surface pressure on the windward surface of a pile model locatedin the center part of the consecutive piles.
The shear flow separated from the fence crest interacts with the re-circulation flowascending along the leeward side of each prism and starts to descend in the vicinity ofthe fifth or sixth prism due to momentum loss. The mean pressure on the prism model
78 S.-J. Lee et al./J. Wind Eng. Ind. Aerodyn. 80 (1999) 69–83
Fig. 7. Effect of the distance between two consecutive prisms on the surface pressure. (a) Mean pressure, (b)pressure fluctuations.
located around this descending point increased nearly up to the case of no fence. TheRMS pressures on the windward surface also increased as shown in Fig. 8b. Fromthis, we can see that the shelter effect of the porous fence having a porosity e"40%extends up to the 5th—6th prism. Therefore, additional wind fences are needed toprevent the effect of descending shear flow and to abate dust emission for every 5—6consecutive coal piles.
3.4. Power spectra
The power spectral density (PSD) distributions of the pressure signals measuredfrom the prism surface are shown in Fig. 9. The sequential time series of the pressuredata was acquired at 100 samples/s to analyze the frequency characteristics of thepressure signal.
S.-J. Lee et al./J. Wind Eng. Ind. Aerodyn. 80 (1999) 69–83 79

Fig. 8. Shelter effect of the porous wind fence on multiple prisms. (a) Mean pressure, (b) pressurefluctuations.
From this figure, the wind fence effect on the PSD reduction at lower frequency isevident. The PSD has a high value at frequencies less than 0.5 Hz, but beyond thisfrequency the power density of the pressure decays rapidly. Ogawa et al. [19]observed several frequency peaks in their two-dimensional fence wake. They ex-plained that the peaks came from the high turbulence intensity of the oncoming flownear the surface and the small vorticity-induced eddies. Richardson [20] analyzed thepower spectra of pressure signals of the wake behind a 50% permeable windbreak.The pressure signals showed large power attenuation at a lower frequency (0.14 Hz),compared to the drag force signal. In addition, the pressure has a higher correlationcoefficient at low frequencies than at high frequencies. This is attributed to thecharacteristic length scale of the flow which exceeds the windbreak size at lowfrequencies.
By installing the front wind fence, the PSD was reduced evidently on both wind-ward and leeward surface at low frequencies due to the interaction of the bleed flowand large-scale recirculating flow between the fence and prism. The effect of theback fence on the PSD attenuation measured on the windward surface is small at
80 S.-J. Lee et al./J. Wind Eng. Ind. Aerodyn. 80 (1999) 69–83
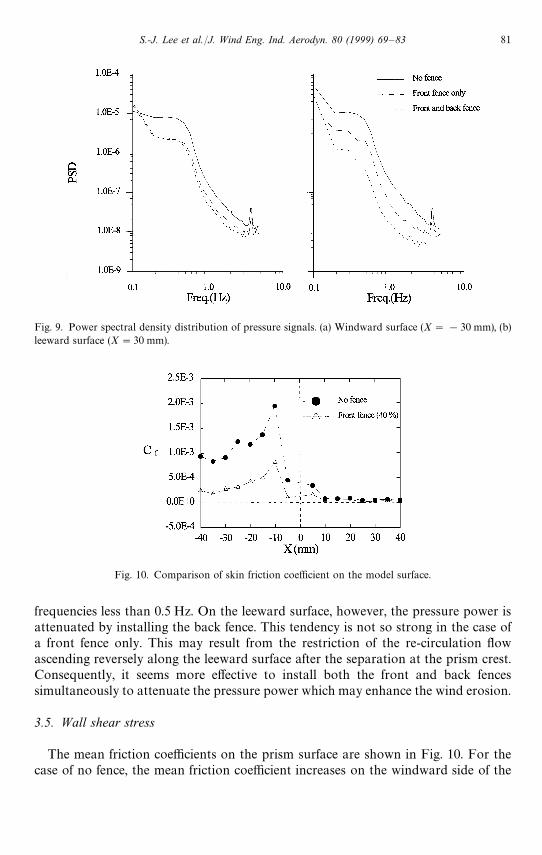
Fig. 9. Power spectral density distribution of pressure signals. (a) Windward surface (X"!30 mm), (b)leeward surface (X"30 mm).
Fig. 10. Comparison of skin friction coefficient on the model surface.
frequencies less than 0.5 Hz. On the leeward surface, however, the pressure power isattenuated by installing the back fence. This tendency is not so strong in the case ofa front fence only. This may result from the restriction of the re-circulation flowascending reversely along the leeward surface after the separation at the prism crest.Consequently, it seems more effective to install both the front and back fencessimultaneously to attenuate the pressure power which may enhance the wind erosion.
3.5. Wall shear stress
The mean friction coefficients on the prism surface are shown in Fig. 10. For thecase of no fence, the mean friction coefficient increases on the windward side of the
S.-J. Lee et al./J. Wind Eng. Ind. Aerodyn. 80 (1999) 69–83 81
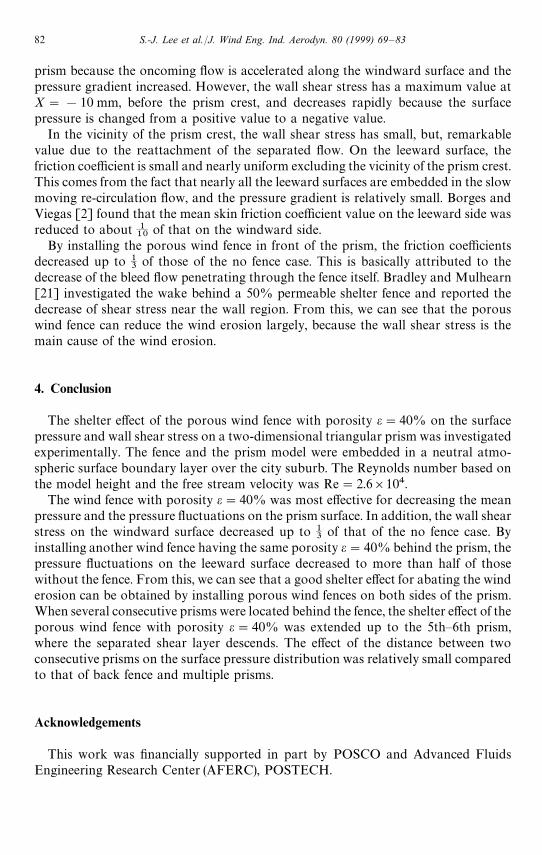
prism because the oncoming flow is accelerated along the windward surface and thepressure gradient increased. However, the wall shear stress has a maximum value atX"!10 mm, before the prism crest, and decreases rapidly because the surfacepressure is changed from a positive value to a negative value.
In the vicinity of the prism crest, the wall shear stress has small, but, remarkablevalue due to the reattachment of the separated flow. On the leeward surface, thefriction coefficient is small and nearly uniform excluding the vicinity of the prism crest.This comes from the fact that nearly all the leeward surfaces are embedded in the slowmoving re-circulation flow, and the pressure gradient is relatively small. Borges andViegas [2] found that the mean skin friction coefficient value on the leeward side wasreduced to about 1
10of that on the windward side.
By installing the porous wind fence in front of the prism, the friction coefficientsdecreased up to 1
3of those of the no fence case. This is basically attributed to the
decrease of the bleed flow penetrating through the fence itself. Bradley and Mulhearn[21] investigated the wake behind a 50% permeable shelter fence and reported thedecrease of shear stress near the wall region. From this, we can see that the porouswind fence can reduce the wind erosion largely, because the wall shear stress is themain cause of the wind erosion.
4. Conclusion
The shelter effect of the porous wind fence with porosity e"40% on the surfacepressure and wall shear stress on a two-dimensional triangular prism was investigatedexperimentally. The fence and the prism model were embedded in a neutral atmo-spheric surface boundary layer over the city suburb. The Reynolds number based onthe model height and the free stream velocity was Re"2.6]104.
The wind fence with porosity e"40% was most effective for decreasing the meanpressure and the pressure fluctuations on the prism surface. In addition, the wall shearstress on the windward surface decreased up to 1
3of that of the no fence case. By
installing another wind fence having the same porosity e"40% behind the prism, thepressure fluctuations on the leeward surface decreased to more than half of thosewithout the fence. From this, we can see that a good shelter effect for abating the winderosion can be obtained by installing porous wind fences on both sides of the prism.When several consecutive prisms were located behind the fence, the shelter effect of theporous wind fence with porosity e"40% was extended up to the 5th—6th prism,where the separated shear layer descends. The effect of the distance between twoconsecutive prisms on the surface pressure distribution was relatively small comparedto that of back fence and multiple prisms.
Acknowledgements
This work was financially supported in part by POSCO and Advanced FluidsEngineering Research Center (AFERC), POSTECH.
82 S.-J. Lee et al./J. Wind Eng. Ind. Aerodyn. 80 (1999) 69–83
References
[1] J. Xuan, W. Ye, Wind tunnel modeling of dust emission and deposition in lower atmosphere:similarity principles, Proc. 3rd Asia—Pacific Symp. on Wind Engineering, 1993, pp. 1053—1058.
[2] A.R. Borges, D.X. Viegas, Shelter effects on a row of coal piles to prevent wind erosion, J. Wind Eng.Ind. Aerodyn. 29 (1988) 145—154.
[3] E.J. Plate, The aerodynamics of shelter belts, Agric. Meteorol. 8 (1971) 203—222.[4] M.A.E.S. Perera, Shelter behind two-dimensional solid and porous fences, J. Wind Eng. Ind. Aerodyn.
8 (1981) 93—104.[5] I. Seginer, R. Sagi, Drag on a windbreak in two-dimensional flow, Agric. Meteorol. 9 (1972) 323—333.[6] R.K.G. Ranga, R.J. Garde, S.K. Singh, N. Singh, Experimental study on characteristics of flow past
porous fences, J. Wind Eng. Ind. Aerodyn. 29 (1988) 155—163.[7] D.A. Gillette, On the production of soil wind erosion aerosols having the potential for long range
transport, J. Rech. Atmos. 8 (3/4) (1974) 735—774.[8] P.R. Owen, Saltation of uniform grains in air, J. Fluid Mech. 20 (1964) 225—242.[9] V.J. Peridier, F.T. Smith, J.D.A. Walker, Vortex-induced boundary-layer separation, Part 2. Unsteady
interacting boundary-layer theory, J. Fluid Mech. 232 (1991) 133—165.[10] T. Ogawa, M. Nakayama, S. Murayama, Y. Sasaki, Characteristics of wind pressure on basic
structures with curved surfaces and their response in turbulent flow, J. Fluid Mech. 38 (1991) 427—438.[11] H.W. Tieleman, Pressure on surface mounted prisms: the effects of incident turbulence, J. Wind Eng.
Ind. Aerodyn. 49 (1993) 289—300.[12] S.J. Lee, C.W. Park, Surface pressure variations on a triangular prism by porous fences in a simulated
atmospheric boundary layer, J. Wind Eng. Ind. Aerodyn. 73 (1998) 45—58.[13] F. Durst, A.K. Rastogi, Turbulent Shear Flows 2, Springer, Berlin, 1980, pp. 231—281.[14] S.J. Kline, F.A. McKlintock, Describing uncertainties in single sample experiments, J. Mech. Eng. 75
(1953) 3—8.[15] B. Ramaprian, S.W. Tu, Calibration of heat flux gage for skin friction measurement, J. Fluids Eng. 105
(1983) 455—457.[16] V.C. Patel, Calibration of the preston tube and limitation on its use in pressure gradients, J. Fluid
Mech. 23 (1965) 185—208.[17] S. Jovic, D. Driver, Reynolds number effect on the skin friction in separated flows behind a back-
ward-facing step, Exp. Fluids 18 (1995) 464—467.[18] A.D. Ferreira, D.X. Viegas, Wind tunnel simulation of the adiabatic flow around a set of sinusoidal
hills, 9th ICWE, 1995, pp. 311—321.[19] Y. Ogawa, P.G. Diosey, Surface roughness and thermal stratification effects on the flow behind
a two-dimensional fence — I. Field study, Atmos. Environ. 14 (1980) 1301—1308.[20] G.M. Richardson, A permeable windbreak: its effect on the structure of the natural wind, J. Wind Eng.
Ind. Aerodyn. 32 (1989) 101—110.[21] E.F. Bradley, P.J. Mulhearn, Development of velocity and shear stress distributions in the wake of
porous shelter fence, J. Wind Eng. Ind. Aerodyn. 15 (1983) 145—156.
S.-J. Lee et al./J. Wind Eng. Ind. Aerodyn. 80 (1999) 69–83 83