
Pressure drop correlation for oil–refrigerant R134a mixture flashing flow in a small diameter tube
10
This article appeared in a journal published by Elsevier. The attached copy is furnished to the author for internal non-commercial research and education use, including for instruction at the authors institution and sharing with colleagues. Other uses, including reproduction and distribution, or selling or licensing copies, or posting to personal, institutional or third party websites are prohibited. In most cases authors are permitted to post their version of the article (e.g. in Word or Tex form) to their personal website or institutional repository. Authors requiring further information regarding Elsevier’s archiving and manuscript policies are encouraged to visit: http://www.elsevier.com/copyright
Transcript of Pressure drop correlation for oil–refrigerant R134a mixture flashing flow in a small diameter tube
This article appeared in a journal published by Elsevier. The attachedcopy is furnished to the author for internal non-commercial researchand education use, including for instruction at the authors institution
and sharing with colleagues.
Other uses, including reproduction and distribution, or selling orlicensing copies, or posting to personal, institutional or third party
websites are prohibited.
In most cases authors are permitted to post their version of thearticle (e.g. in Word or Tex form) to their personal website orinstitutional repository. Authors requiring further information
regarding Elsevier’s archiving and manuscript policies areencouraged to visit:
http://www.elsevier.com/copyright

Author's personal copy
Pressure drop correlation for oil–refrigerant R134a mixtureflashing flow in a small diameter tube
Heryca O.S. Castroa, Jose Luiz Gascheb,*, Alvaro T. Pratac
aUniversity of Rio Verde, College of Engineering, 75.901-970 Rio Verde, GO, BrazilbUNESP, Sao Paulo State University, Department of Mechanical Engineering, Av. Brasil Centro, 56, 15385-000 Ilha Solteira, SP, BrazilcUFSC – Federal University of Santa Catarina, Department of Mechanical Engineering, 88.040-970 Florianopolis, SC, Brazil
a r t i c l e i n f o
Article history:
Received 9 October 2007
Received in revised form
23 July 2008
Accepted 3 September 2008
Published online 24 September 2008
Keywords:
Refrigeration system
Mixture
R134a
Synthetic oil
Two-phase flow
Tube
Geometry
Experiment
Pressure drop
Correlation
a b s t r a c t
This paper presents an experimental investigation of the ester oil ISO VG10/refrigerant
R134a mixture flashing flow in a 6.0 m long, 3.22 mm ID tube, which is one of the primary
steps towards the construction of a methodology for the study of the lubrication and gas
leakage in refrigeration compressors. The phase change starts with solubility reduction of
the refrigerant in the oil as the pressure decreases due to the friction forces. In this flashing
flow the foam pattern is observed at the end of the tube as vapor quality reaches high
values, and this is a particular phenomenon of this kind of mixture flow. In order to study
this pressure drop, an experimental apparatus was designed to allow the measurement of
both pressure and temperature profiles along the tube as well as the visualization of the
flow patterns. Pressure and temperature distribution along the flow were measured for
saturation pressure ranging from 450 to 650 kPa, mass flux ranging from about 2000 to
3000 kg/(m2s), temperatures around 303 K, and inlet refrigerant concentration varying
between 0.2 and 0.4 kg ref/kg mixt. An available correlation proposed to predict the fric-
tional pressure drop for a mixture composed by the mineral oil SUNISO 1GS and refrigerant
R12 flowing in small diameter tubes yielded large deviations in predicting the ester oil and
refrigerant R134a mixture flow. A new correlation has been proposed that fitted the
experimental data with rms deviations of 24%.
ª 2008 Elsevier Ltd and IIR. All rights reserved.
Correlation de la chute de pression d’un melange defrigorigene R134a et d’huile en ecoulement a l’interieur d’untube de faible diametre
Mots cles : systeme frigorifique ; melange ; R134a ; huile de synthese ; ecoulement diphasique ; tube ; geometrie ; experimentation ; chute
de pression ; correlation
* Corresponding author. Tel.: þ55 18 3743 1035; fax: þ55 18 3742 2992.E-mail addresses: [email protected] (H.O.S. Castro), [email protected] (J.L. Gasche), [email protected] (A.T. Prata).
www. i ifi i r .org
ava i lab le at www.sc iencedi rec t . com
journa l homepage : www.e lsev i er . com/ loca te / i j r e f r ig
0140-7007/$ – see front matter ª 2008 Elsevier Ltd and IIR. All rights reserved.doi:10.1016/j.ijrefrig.2008.09.001
i n t e r n a t i o n a l j o u r n a l o f r e f r i g e r a t i o n 3 2 ( 2 0 0 9 ) 4 2 1 – 4 2 9
Author's personal copy
1. Introduction
It is well known that, in a vapor refrigeration system, a good
miscibility between refrigerant and lubricant oil is required
to allow easy return of circulating oil to the compressor. This
oil–refrigerant characteristic benefits evaporators,
condensers, and expansion devices. In addition, high refrig-
erant absorption rates in the oil are desirable to diminish the
equalizing pressure, which reduces torque and power
required for compressor start-up (Prata and Barbosa, 2007).
On the other hand, this miscibility can modify the lubrica-
tion of sliding parts, the performance of journal bearings,
and the leakage of refrigerant gas through the compressor
clearances. For a given oil–refrigerant mixture, the solubility
of the refrigerant in the oil depends on the pressure and
temperature, diminishing as temperature increases or pres-
sure decreases. Consequently, as the oil–refrigerant mixture
flows through the several channels inside the compressor,
the refrigerant is released from the mixture (outgassing) due
to the solubility reduction caused by the friction pressure
drop. The resultant two-phase flow, depending on local
conditions, can be quite different from pure oil flow.
Therefore, single-phase flow models usually employed to
design those channels are frequently inappropriate. For
instance, estimations of refrigerant gas leakage through
radial clearance in rolling piston compressors can be quite
different depending if an oil single-phase flow or a mixture
two-phase flow model is employed. It has been found that
the mass flow rate of the refrigerant gas through the radial
clearance calculated using the mixture two-phase flow
model can be up to 30% lower than the mass flow rate
estimated by the single-phase flow model (Gasche et al.,
2000). Reduction in load capacity of compressor journal
bearings has been observed when oil–refrigerant mixture
flow model is used rather than pure oil flow model (Grando
et al., 2005).
Mainly in the 80s and 90s, several studies related to oil–
refrigerant mixture started being developed. Some of these
works were directed towards the determination of the ther-
mophysical properties of the mixtures (Martz et al., 1996;
Grebner and Crawford, 1993; Thomas and Pham, 1992; Baus-
tian et al., 1986; Thome, 1995; Van Gaalen et al., 1990, 1991a,b).
Other researchers concentrated their studies on the behavior
of refrigerant flows contaminated with lubricating oil (refrig-
erant-rich mixtures) with the objective of analyzing the
influence of the oil in the mixture flow and heat transfer
dynamics in evaporators, condensers, and capillary tubes
(Schlager et al., 1987; Jensen and Jackman, 1984; Wallner and
Dick, 1975; Hambraeus, 1995; Motta et al., 2002).
From the point of view of the refrigeration compressor,
some researches have focused on the lubricant–refrigerant
mixture lubricating characteristics. Jonsson (1999) has pre-
sented viscosity and pressure–viscosity data for three ISO VG
32 polyolester lubricants and also a film forming comparison
between two ISO VG 68 polyolester lubricants. The author has
concluded that the reduction in viscosity and pressure–
viscosity coefficient when diluted by refrigerant R134a is far
greater than for normal/linear (not branched) lubricants,
resulting in a poorer film forming ability in applications where
the lubricant is subjected to refrigerant gas with low super-
heat. Chul Na et al. (1997) have performed a tribological study
of refrigeration oils under refrigerant R134a environment,
providing results on compressor lubricity and material
compatibility and suggesting a methodology for the proper
Nomenclature
a constant of Eq. (A.1a)
b constant of Eq. (A.1a)
c constant of Eq. (A.1a)
d constant of Eq. (A.1a)
D inner tube diameter (m)
f friction factor (-)
G mass flux [kg m�2 s�1]
O objective function (-)
p pressure (Pa)
ReG gas Reynolds number ¼ ½rGUGSDhG� (-)
ReL liquid Reynolds number ¼ ½rLULSDhL� (-)
T temperature (�C)
V average velocity (m s�1)
w equilibrium mass fraction of refrigerant in the
liquid (kg ref. kg mixt�1)
x vapor quality (-)
X Martinelli parameter (-)
z longitudinal coordinate (m)
Greek symbols
3 tube roughness
h dynamic viscosity, (kg m�1 s�1)
r density (kg m�3)
n kinematic viscosity (m2 s�1)
F2G gas two-phase multiplier
Subscripts
acc accelerational
calc calculated
exp experimental
f friction
G gas
o overall (inside HPT)
ini initial
L liquid
TP two-phase
Abbreviations
HE Heat exchanger (1 and 2)
HPA High pressure accumulator
HPT High pressure tank
ID Internal diameter
LPA Low pressure accumulator
LPT Low pressure tank
SV Solenoid valve (1 and 2)
i n t e r n a t i o n a l j o u r n a l o f r e f r i g e r a t i o n 3 2 ( 2 0 0 9 ) 4 2 1 – 4 2 9422

Author's personal copy
selection of refrigeration oils to improve the durability and
performance of the compressor. Another important aspect of
the interaction between lubricant and refrigerant, that may
play an important role in the compressor lubrication, is the
dynamic of the mixing and separation processes, which has
been treated by Fukuta et al. (2005), who have studied the
transient mixing/separation characteristics of isobutene with
refrigerant oil. However, none of these works have addressed
the issue of the mixture flow with phase change.
There have been very few studies on oil-rich mixture
(mixture with high content of oil) flow with phase change,
which may also be an important issue when the compressor is
the focus of the study. A general understanding of the oil-rich
mixture flashing flow through small channels is important in
order to develop a knowledge basis onto which lubrication and
gas leakage models can be built. One of the primary steps
towards the construction of a methodology for the study of the
lubrication of compressor parts and gas leakage in the pres-
ence of refrigerant outgassing is the investigation of refrig-
erant–lubricant oil flows in a simple geometry as a straight
horizontal tube. The resulting two-phase, two-component
flow possesses very peculiar characteristics and requires
special attention as far as its modeling is concerned. Many
efforts have been done in this direction in the last 8 years.
Computational (Grando et al., 2003; Dias and Gasche, 2006) as
well as experimental (Lacerda et al., 2000; Poiate and Gasche,
2006; Castro and Gasche, 2006) works directed to flashing flow
of oil–refrigerant mixture in small diameter tubes around
3 mm have been reported. The two-phase flow characteristic
is the most important aspect present in all those works. In
addition, foam flow pattern is always observed as the void
fraction reaches high values, usually greater than 0.7.
Together with the pressure drop, a significant temperature
drop due to the outgassing is also noticed.
Attempting to analyze one important feature of this type of
flow, that is, the prediction of the component of the total
pressure gradient due to friction, Barbosa et al. (2004) have
investigated the frictional pressure drop in the two-phase flow
with outgassing of a mixture, composed by refrigerant R12
and oil SUNISO 1GS, flowing through a 5.3 m long, 2.86 mm ID
tube. The authors stated that several two-phase multiplier
correlations (Mishima and Hibiki, 1996; Wang et al., 2000;
Friedel, 1979; Tran et al., 2000; Chen et al., 2001) based on
a variety of experimental conditions including oil–refrigerant
flows and flows in small diameter tubes failed to predict the
database. Based on these results they proposed a new corre-
lation for predicting the frictional pressure drop in this type of
flow, considering an adaptation of the gas pressure drop
multiplier of Chisholm (1973). The authors also suggested, as
a crude approximation, that the correlations could be used to
assess the performance of mixtures such as the ester oil–
refrigerant R134a mixture.
The main purpose of this work is to test the correlation
proposed by Barbosa et al. (2004) using experimental data for
the two-phase flow of another mixture, composed by ester oil
ISO VG 10 and refrigerant R134a, flowing through a 6.0 m long,
3.22 mm ID tube. As it will be observed, that correlation yiel-
ded large deviations in representing the oil/refrigerant R134a
mixture database, indicating that a new correlation should be
proposed for the oil/refrigerant R134a mixture.
2. Experimental method
An experimental apparatus was designed to produce steady
flow of an oil/refrigerant mixture through metallic and glass
6 m long tubes. The metallic tube was instrumented with
pressure transducers and thermocouples in order to measure
the pressure and temperature distributions along the flow.
The glass tube was used to allow for the visualization of the
flow patterns. Because of the main emphasis of the present
work on the pressure drop correlation, visualization results
will not be explored and can be found in Poiate and Gasche
(2006) and Castro and Gasche (2006).
2.1. Apparatus and instrumentation
A scheme of the experimental apparatus is depicted in Fig. 1.
The main components of the test facility are the four tanks, the
test section (two horizontal tubes), a vapor return line, an oil
return line, instrumentation, and a data acquisition system. All
these equipments are connected with each other in order to
produce a steady flow through either of two 6 m long horizontal
tubes. The first tube is made of borosilicate glass (3.0 mm ID)
and allows for flow visualization, whereas the other tube is
a metallic 3.22 (�0.03) mm ID tube equipped with 10 absolute
pressure transducers based on strain-gauge sensor type P8AP
made by HBM� and 14 AWG 36 type-T thermocouples. The
pressure transducers were calibrated using a dead weight
calibrating machine, resulting in a 2-s uncertainty of �2 kPa,
and were installed along the tube through 0.3 mm diameter
pressure taps. Type-T thermocouples were employed and
calibrated using a 0.1 �C-resolution mercury-in-glass ther-
mometer and the 0 �C-electronic reference of the data acqui-
sition system, resulting in a 2-s uncertainty of �0.5 �C; they
were installed through superficial roles made on the tube
surface. Thermocouple and pressure readings were hardwired
into an HBM� data acquisition system (Spider8 and MGCplus)
and routed directly to a personal computer. Data interpretation
and manipulation was performed using the software package
Catman� by HBM�. Specific details regarding the experi-
mental apparatus, instrumentation, calibration procedure,
and data acquisition system can be obtained in Poiate (2001).
The main objective of the four tanks is to maintain
a constant pressure difference between the inlet and outlet of
the tube. Pressure in the high pressure tank (HPT) and in the
low pressure tank (LPT) is kept constant through the high and
HPT
HPALPA
pump
compressor
HE1
HE2
SV1 SV2
glass tube
metallic tube
LPT
refrigerant
vapor
mixture
Fig. 1 – Experimental apparatus.
i n t e r n a t i o n a l j o u r n a l o f r e f r i g e r a t i o n 3 2 ( 2 0 0 9 ) 4 2 1 – 4 2 9 423

Author's personal copy
low pressure accumulators, HPA and LPA, respectively. The
HPT is filled with oil and refrigerant, and an equilibrium liquid
mixture at the lower part of the tank coexists with the refrig-
erant vapor at the upper part for the desired temperature and
vapor pressure. Pressure and temperature sensors monitor the
conditions of the gas and liquid in both tanks. High and low
pressure accumulators (HPA, LPA) operating at pressures
higher and lower than those at HPT and LPT, respectively, keep
the pressure at constant levels in both tanks using two auto-
matic solenoid valves (SV) controlled by a desktop computer.
During operation the equilibrium liquid mixture existing in
the HPT is driven into either one of the two tubes. The exper-
imental apparatus runs on the blow down mode.
Auxiliary equipment consists of a compressor, an oil
pump, and two heat exchangers (HE1, HE2). The compressor is
employed to return the gas to the HPA and the pump returns
the oil to the HPT. The heat exchangers are used to cool both
fluids if necessary before reaching the HPA and HPT.
2.2. Experimental procedure
Firstly, the parts of the apparatus occupied by the mixture
were cleaned with a solvent fluid to remove impurities, and
the system was evacuated to 10 Pa. After that, about 80 kg of
oil was introduced into the HPT and heated until 60 �C for 3 h
in order to remove impurities (mainly dissolved gases and
water), while the vacuum pump was kept running. Next,
about 60 kg of refrigerant was introduced partly into the HPT
and HPA.
All tests start with the saturation of the oil in the HPT at the
desired test temperature and 10 kPa above the desired test
pressure, po, that is, at an initial pressure, pini¼ poþ 10 kPa. In
order to increase the rate of absorption, the refrigerant is
bubbled into the HPT employing the compressor, which sucks
the refrigerant gas from the top and compresses it at the
bottom of the HPT, as sketched in Fig. 2. As the liquid mixture
absorbs gas in the HPT, the pressure tends to decrease, acti-
vating the automatic solenoid valve (SV1), which releases
refrigerant from HPA to HPT in order to maintain a constant
pressure inside the HPT. This process continues until satura-
tion is achieved in the HPT at the initial pressure, pini. This
saturation process can last up to 6 h. After saturation is
reached at pini, some amount of gas is released from the top of
HPT to decrease the pressure to po, the desired test pressure.
This pressure reduction promotes a fast outgassing and
assures that saturation is indeed established at the pressure
test, po (�1% of the value). This new saturation state is reached
within 30–60 min, and is verified when pressure stops
increasing because of the gas release. The temperature is
controlled at the desired value (�1 �C) during the whole
process.
Depending on whether flow visualization or measurement
run is desired, after the saturation process is finished, the test
section valves are arranged so that the mixture is forced into
the glass or the metallic tube, respectively. The compressor
remains running during the tests in order to circulate gas from
the LPA to the HPA. Data acquisition is initiated after steady
flow is reached. The steady state regime is characterized by
observing the time variation of the mixture temperature in all
measuring positions. When the variation temperature is of
the order of 0.5 �C, it is assumed that the steady state flow is
reached.
Prior to initiating the experiments with the mixture, some
tests were performed with pure oil in laminar flow inside the
metallic tube, and nitrogen pressurizing the tanks and accu-
mulators. Experimental results were then compared to the
available analytical solutions for fully developed laminar flow.
These tests were used to evaluate and validate the experi-
mental loop, instrumentation, and data acquisition. In addi-
tion, these tests validated the methodology to obtain the mass
flow rate of the mixture flows, which was based on the use of
the linear pressure gradient established at the inlet of the
tube. Details about the validation of the experimental appa-
ratus can be found in Poiate (2001).
2.3. Experimental results and data reduction
Table 1 shows the experimental conditions for the tests
carried out using a mixture composed by an ester oil ISO VG10
and refrigerant R134a. Pressure and temperature distribution
along the flow were measured for saturation pressure inside
the high pressure tank (HPT), po, ranging from 450 to 650 kPa
(abs), total mass flux, G, ranging from about 2000 to 3000 kg/
(m2s), temperatures around 303 K, and refrigerant concentra-
tion inside the HPT, wo, varying between 0.227 and 0.443 kg ref/
kg mixt. Figs. 3 and 4 depict pressure and temperature distri-
butions, respectively, for tests 7–9. It can be noticed in these
figures that there is an inlet flow region where pressure
decreases linearly and temperature remains practically
constant. In addition, qualities are low at this region. Close to
the tube outlet, however, pressure and temperature gradients
are much larger and, because of the outgassing, mixture
qualities increase.
The same procedure used by Barbosa et al. (2004) for
obtaining the local frictional pressure gradient at an inter-
mediate position between two adjacent pressure tappings was
utilized in this work, i.e., by subtracting the estimated accel-
erational pressure gradient from the total pressure gradient at
the same intermediate position,�dpdz
�f;TP
¼�
dpdz
�total
��
dpdz
�acc
(1)
HPT
SV1
HE2
compressor
to HE1
to HPA
to test
section
su
ctio
n
compression
Fig. 2 – Sketch of the saturation procedure.
i n t e r n a t i o n a l j o u r n a l o f r e f r i g e r a t i o n 3 2 ( 2 0 0 9 ) 4 2 1 – 4 2 9424

Author's personal copy
The total pressure gradient at an intermediate position was
calculated by dividing the difference between two adjacent
pressure readings by the distance of the pressure tappings.
The local accelerational pressure gradient was estimated
assuming a homogeneous flow model (Barbosa et al., 2004),
that is,
�dpdz
�acc
¼ G2
��1rG
� 1rL
�dxdz� x
r2G
drG
dz� ð1� xÞ
r2L
drL
dz
�(2)
Neglecting the oil vapor pressure, the local equilibrium
vapor quality is given by
x ¼ wo �w1�w
(3)
where w is the local refrigerant concentration at the inter-
mediate position estimated by using a linear interpolation
between two adjacent values, which were calculated utilizing
the pressure and temperature readings, and a solubility
correlation, w¼w( p,T ). Neglecting the oil vapor is a very good
assumption due to the low vapor pressure of the oil. The non-
equilibrium model described in Grando et al. (2006) is adopted
to calculate the local refrigerant mass fraction, that is, no gas
is considered to be absorbed after being released. Therefore,
for each run test only the data that produced decreasing local
mass concentration along the flow was accepted as valid.
The local physical properties were estimated using the
local pressure, temperature, and refrigerant concentration.
The derivatives dx/dz, drG/dz and drL/dz at an intermediate
position were estimated by using a linear approximation
and two adjacent values of x, rG, and rL.
In order to avoid an undesired outgassing before the
mixture flow reached the tube entrance, a mass flow meter
was not used; instead, the mass flow rate was calculated by
using the pressure gradient measured at the inlet region of the
flow, where a constant pressure gradient was still observed.
The uncertainty estimated for the mass flow rate calculation
was about 5% of the calculated value. The total mass flux, G,
was estimated by
G ¼ rLV (4)
where rL is the liquid mixture density and V is the average
velocity estimated by:
V ¼�
2DrLf
��dp
dz
�total
�1=2
(5)
where D is the tube diameter, rL is the density of the liquid
mixture calculated at the inlet temperature of the flow, f is the
friction factor estimated by the equation proposed by
Churchill (1977), and (dp/dz)total is the experimental total
0
100
200
300
400
500
600
0 1 2 3 4 5 6z (m)
p(k
Pa
)
Test 8Test 9
Fig. 3 – Longitudinal pressure distribution for tests 8 and 9.
20
22
24
26
28
30
32
0 1 2 3 4 5 6z (m)
T(oC
)
Test 8Test 9
Fig. 4 – Longitudinal temperature distribution for tests
8 and 9.
Table 1 – Experimental conditions
Test number po
(kPa)G
(kg m�2 s�1)wo
(kg ref. kg mixt�1)
01 450 2358 0.231
02 2235 0.234
03 2272 0.230
04 2272 0.227
05 2345 0.227
06 2407 0.227
07 500 2223 0.271
08 2124 0.279
09 2210 0.268
10 2186 0.264
11 2112 0.267
12 2284 0.266
13 2481 0.267
14 550 2210 0.314
15 2260 0.304
16 2124 0.310
17 2100 0.313
18 2321 0.296
19 2124 0.310
20 2284 0.318
21 2395 0.307
22 2468 0.308
23 600 2530 0.352
24 2345 0.376
25 2542 0.347
26 2481 0.343
27 2333 0.399
28 2567 0.319
29 2493 0.342
30 2702 0.344
31 650 2763 0.411
32 2751 0.411
33 2738 0.443
34 2677 0.424
35 2947 0.387
i n t e r n a t i o n a l j o u r n a l o f r e f r i g e r a t i o n 3 2 ( 2 0 0 9 ) 4 2 1 – 4 2 9 425
Author's personal copy
pressure gradient measured at the inlet region of the flow. The
measurement of the tube roughness ratio, which was used in
the Churchill equation, resulted in 3/D¼ 0.000124 (Poiate,
2001).
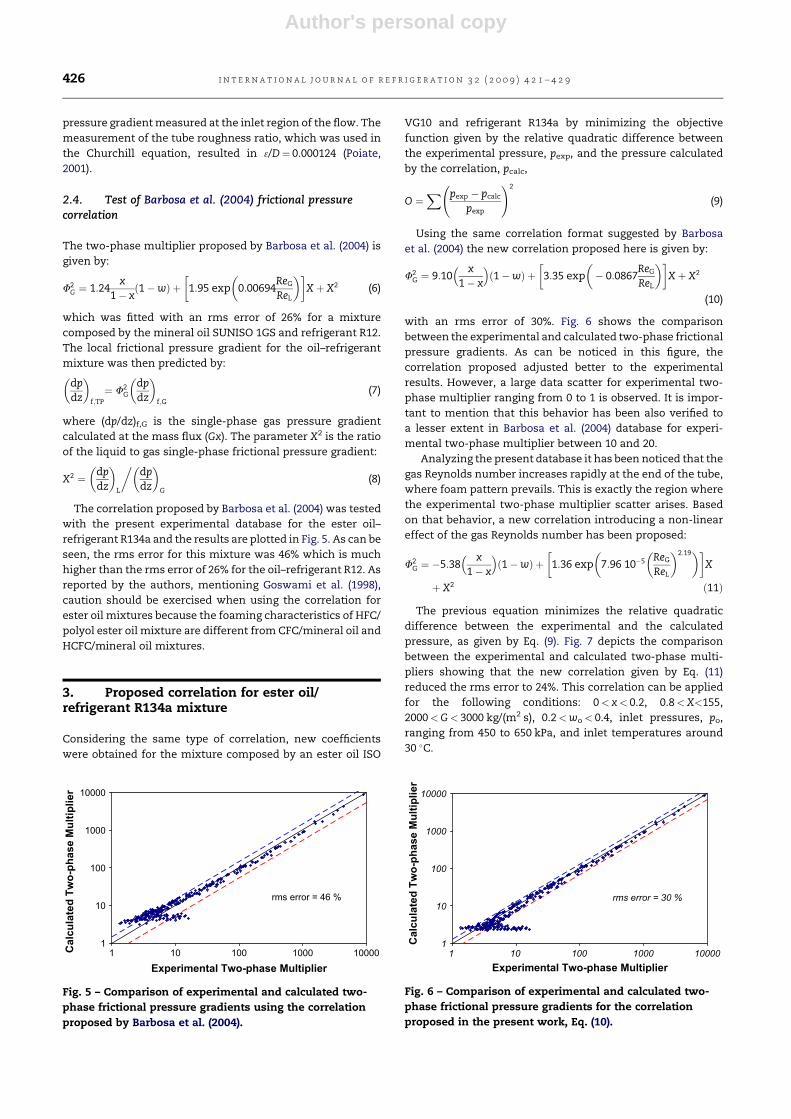
2.4. Test of Barbosa et al. (2004) frictional pressurecorrelation
The two-phase multiplier proposed by Barbosa et al. (2004) is
given by:
F2G ¼ 1:24
x1� x
ð1�wÞ þ�1:95 exp
�0:00694
ReG
ReL
��Xþ X2 (6)
which was fitted with an rms error of 26% for a mixture
composed by the mineral oil SUNISO 1GS and refrigerant R12.
The local frictional pressure gradient for the oil–refrigerant
mixture was then predicted by:�dpdz
�f;TP
¼ F2G
�dpdz
�f;G
(7)
where (dp/dz)f,G is the single-phase gas pressure gradient
calculated at the mass flux (Gx). The parameter X2 is the ratio
of the liquid to gas single-phase frictional pressure gradient:
X2 ¼�
dpdz
�L
��dpdz
�G
(8)
The correlation proposed by Barbosa et al. (2004) was tested
with the present experimental database for the ester oil–
refrigerant R134a and the results are plotted in Fig. 5. As can be
seen, the rms error for this mixture was 46% which is much
higher than the rms error of 26% for the oil–refrigerant R12. As
reported by the authors, mentioning Goswami et al. (1998),
caution should be exercised when using the correlation for
ester oil mixtures because the foaming characteristics of HFC/
polyol ester oil mixture are different from CFC/mineral oil and
HCFC/mineral oil mixtures.
3. Proposed correlation for ester oil/refrigerant R134a mixture
Considering the same type of correlation, new coefficients
were obtained for the mixture composed by an ester oil ISO
VG10 and refrigerant R134a by minimizing the objective
function given by the relative quadratic difference between
the experimental pressure, pexp, and the pressure calculated
by the correlation, pcalc,
O ¼X
pexp � pcalc
pexp
!2
(9)
Using the same correlation format suggested by Barbosa
et al. (2004) the new correlation proposed here is given by:
F2G ¼ 9:10
� x1� x
�ð1�wÞ þ
�3:35 exp
�� 0:0867
ReG
ReL
��Xþ X2
(10)
with an rms error of 30%. Fig. 6 shows the comparison
between the experimental and calculated two-phase frictional
pressure gradients. As can be noticed in this figure, the
correlation proposed adjusted better to the experimental
results. However, a large data scatter for experimental two-
phase multiplier ranging from 0 to 1 is observed. It is impor-
tant to mention that this behavior has been also verified to
a lesser extent in Barbosa et al. (2004) database for experi-
mental two-phase multiplier between 10 and 20.
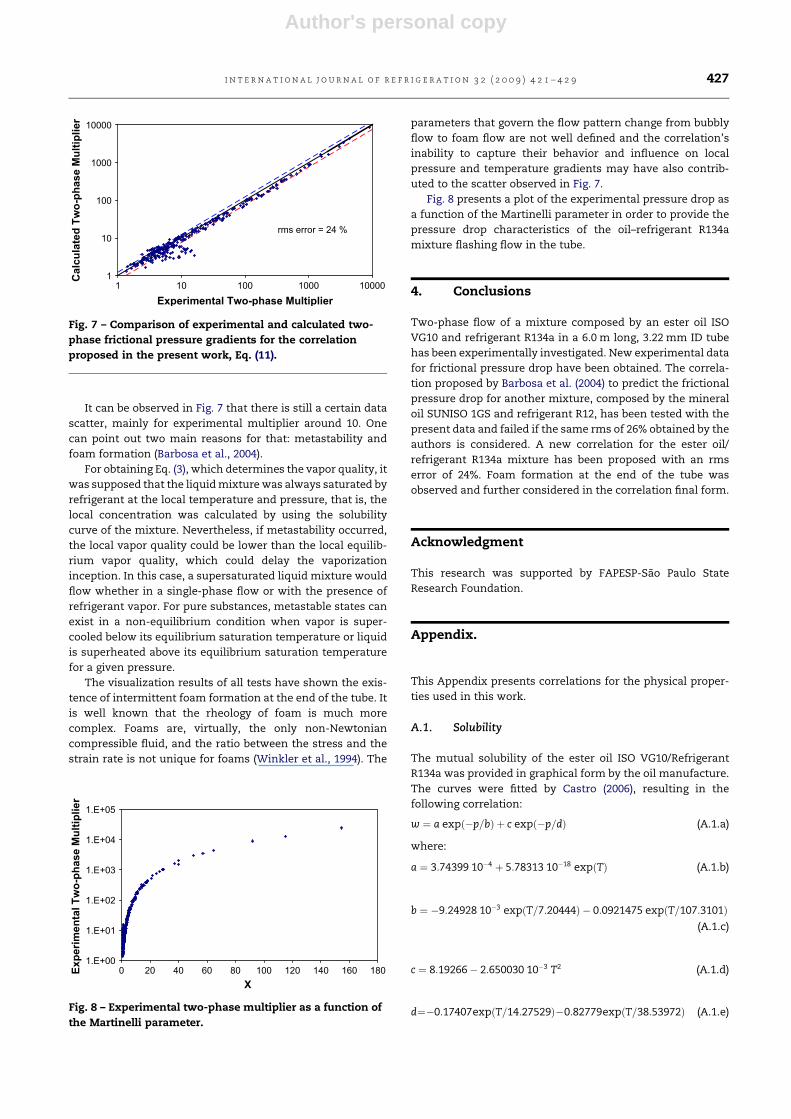
Analyzing the present database it has been noticed that the
gas Reynolds number increases rapidly at the end of the tube,
where foam pattern prevails. This is exactly the region where
the experimental two-phase multiplier scatter arises. Based
on that behavior, a new correlation introducing a non-linear
effect of the gas Reynolds number has been proposed:
F2G ¼ �5:38
� x1� x
�ð1�wÞ þ
�1:36 exp
�7:96 10�5
�ReG
ReL
�2:19��X
þ X2 ð11Þ
The previous equation minimizes the relative quadratic
difference between the experimental and the calculated
pressure, as given by Eq. (9). Fig. 7 depicts the comparison
between the experimental and calculated two-phase multi-
pliers showing that the new correlation given by Eq. (11)
reduced the rms error to 24%. This correlation can be applied
for the following conditions: 0< x< 0.2, 0.8<X<155,
2000<G< 3000 kg/(m2 s), 0.2<wo< 0.4, inlet pressures, po,
ranging from 450 to 650 kPa, and inlet temperatures around
30 �C.
1
10
100
1000
10000
1 10 100 1000 10000Experimental Two-phase Multiplier
Calcu
lated
T
wo
-p
hase M
ultip
lier
rms error = 46 %
Fig. 5 – Comparison of experimental and calculated two-
phase frictional pressure gradients using the correlation
proposed by Barbosa et al. (2004).
1
10
100
1000
10000
1 10 100 1000 10000
Experimental Two-phase Multiplier
Calcu
lated
T
wo
-p
hase M
ultip
lier
rms error = 30 %
Fig. 6 – Comparison of experimental and calculated two-
phase frictional pressure gradients for the correlation
proposed in the present work, Eq. (10).
i n t e r n a t i o n a l j o u r n a l o f r e f r i g e r a t i o n 3 2 ( 2 0 0 9 ) 4 2 1 – 4 2 9426
Author's personal copy
It can be observed in Fig. 7 that there is still a certain data
scatter, mainly for experimental multiplier around 10. One
can point out two main reasons for that: metastability and
foam formation (Barbosa et al., 2004).
For obtaining Eq. (3), which determines the vapor quality, it
was supposed that the liquid mixture was always saturated by
refrigerant at the local temperature and pressure, that is, the
local concentration was calculated by using the solubility
curve of the mixture. Nevertheless, if metastability occurred,
the local vapor quality could be lower than the local equilib-
rium vapor quality, which could delay the vaporization
inception. In this case, a supersaturated liquid mixture would
flow whether in a single-phase flow or with the presence of
refrigerant vapor. For pure substances, metastable states can
exist in a non-equilibrium condition when vapor is super-
cooled below its equilibrium saturation temperature or liquid
is superheated above its equilibrium saturation temperature
for a given pressure.
The visualization results of all tests have shown the exis-
tence of intermittent foam formation at the end of the tube. It
is well known that the rheology of foam is much more
complex. Foams are, virtually, the only non-Newtonian
compressible fluid, and the ratio between the stress and the
strain rate is not unique for foams (Winkler et al., 1994). The
parameters that govern the flow pattern change from bubbly
flow to foam flow are not well defined and the correlation’s
inability to capture their behavior and influence on local
pressure and temperature gradients may have also contrib-
uted to the scatter observed in Fig. 7.
Fig. 8 presents a plot of the experimental pressure drop as
a function of the Martinelli parameter in order to provide the
pressure drop characteristics of the oil–refrigerant R134a
mixture flashing flow in the tube.
4. Conclusions
Two-phase flow of a mixture composed by an ester oil ISO
VG10 and refrigerant R134a in a 6.0 m long, 3.22 mm ID tube
has been experimentally investigated. New experimental data
for frictional pressure drop have been obtained. The correla-
tion proposed by Barbosa et al. (2004) to predict the frictional
pressure drop for another mixture, composed by the mineral
oil SUNISO 1GS and refrigerant R12, has been tested with the
present data and failed if the same rms of 26% obtained by the
authors is considered. A new correlation for the ester oil/
refrigerant R134a mixture has been proposed with an rms
error of 24%. Foam formation at the end of the tube was
observed and further considered in the correlation final form.
Acknowledgment
This research was supported by FAPESP-Sao Paulo State
Research Foundation.
Appendix.
This Appendix presents correlations for the physical proper-
ties used in this work.
A.1. Solubility
The mutual solubility of the ester oil ISO VG10/Refrigerant
R134a was provided in graphical form by the oil manufacture.
The curves were fitted by Castro (2006), resulting in the
following correlation:
w ¼ a expð�p=bÞ þ c expð�p=dÞ (A.1.a)
where:
a ¼ 3:74399 10�4 þ 5:78313 10�18 expðTÞ (A.1.b)
b ¼ �9:24928 10�3 expðT=7:20444Þ � 0:0921475 expðT=107:3101Þ(A.1.c)
c ¼ 8:19266� 2:650030 10�3 T2 (A.1.d)
d¼�0:17407expðT=14:27529Þ�0:82779expðT=38:53972Þ (A.1.e)
1.E+00
1.E+01
1.E+02
1.E+03
1.E+04
1.E+05
0 20 40 60 80 100 120 140 160 180X
Exp
erim
en
tal T
wo
-p
hase M
ultip
lier
Fig. 8 – Experimental two-phase multiplier as a function of
the Martinelli parameter.
1
10
100
1000
10000
1 10 100 1000 10000Experimental Two-phase Multiplier
Calcu
lated
T
wo
-p
hase M
ultip
lier
rms error = 24 %
Fig. 7 – Comparison of experimental and calculated two-
phase frictional pressure gradients for the correlation
proposed in the present work, Eq. (11).
i n t e r n a t i o n a l j o u r n a l o f r e f r i g e r a t i o n 3 2 ( 2 0 0 9 ) 4 2 1 – 4 2 9 427

Author's personal copy
in which the concentration is given in (%), pressure in (bar),
and temperature in (�C). The curve fit is applicable for pressure
ranging from 0 to 700 kPa and temperature ranging from 0 to
40 �C.
A.2. Density
The density of the oil/refrigerant mixture was also provided in
graphical form by the manufacture and the data were curve
fitted, resulting in the following correlation:
rL ¼0:94109þ 1:90541 10�3wþ 1:21933 10�18w3 � 7:4 T
103
(A.2)
where concentration is given in (%), temperature in (�C), and
density in (kg m�3). The correlation was fitted by Castro (2006)
for w< 30% and 0< T< 40 �C.
A.3. Kinematic viscosity
Following a similar procedure used to fit concentration and
density data from the manufacture, Castro (2006) also found
the following correlation for the kinematic viscosity of the
liquid mixture, nL,
nL ¼aþ bTþ cT2 þ dT3 þ eT4
�110�6 (A.3.1)
where:
a ¼ a1 þ a2wþ a3w2 þ a4w3 þ a5 expðwÞ (A.3.2)
b ¼ b1 þ b2wþ b3w3=2 þ b4w2 þ b5w3 (A.3.3)
c ¼ c1 þ c2wþ c3w2 þ c4w5=2 þ c5w3 (A.3.4)
d ¼ d1 þ d2wþ d3w2 þ d4w3 þ d5w4 (A.3.5)
e ¼ e1 þ e2wþ e3w2 þ e4w3 þ e5w4 (A.3.6)
in which all constants are listed in Table A.1. In this correla-
tion, the kinematic viscosity is given in (m2 s�1), concentration
in (%), and temperature in (�C). The correlation was fitted for
w< 55% and �10< T< 50 �C.
All refrigerant properties were calculated using the
package REFPROP (NIST, 1998).
r e f e r e n c e s
Barbosa Jr., J.R., Lacerda, V.T., Prata, A.T., 2004. Prediction ofpressure drop in refrigerant–lubricant oil flows with highcontents of oil and refrigerant outgassing in small diametertube. International Journal of Refrigeration 27, 129–139.
Baustian, J.J., Pate, M.B., Bergles, A.E., 1986. Properties of oil–refrigerant mixtures liquid with applications to oilconcentration measurements: part I – thermophysical andtransport properties. ASRHAE Transactions 92, 55–73.
Castro, H.O.S., Gasche, J.L., 2006. Foam flow of oil–refrigerantR134a mixture in a small diameter tube. In: Proceedings of the13th International Heat Transfer Conference–IHTC13, Sydney,Australia, paper 359.
Castro, H.O.S., 2006. Experimental characterization of two-phaseflow with foam formation of the ester oil–refrigerant R134amixture along a straight constant cross section tube, masterdissertation, Sao Paulo State University, Ilha Solteira-SP, Brazil(in Portuguese).
Chen, I.Y., Yang, K.S., Chang, Y.J., Wang, C.C., 2001. Two-phasepressure drop of air-water and R-410a in small horizontaltubes. International Journal of Multiphase Flow 27, 1293–1299.
Chisholm, D., 1973. Pressure gradients due to friction during theflow of evaporating two-phase mixtures in smooth tubes andchannels. International Journal of Heat Mass Transfer 16,347–358.
Chul Na, B., Chun, K.J., Han, D.C., 1997. A tribological study ofrefrigeration oils under HFC-134a environment. TribologyInternational 30 (9), 707–716.
Churchill, S.W., 1977. Friction-factor equation spans all fluid-flowregimes. Chemistry Engineering 7, 91–92.
Dias, J.P., Gasche, J.L., 2006. Computational simulation of the oil-R134a mixture two-phase flow with foam formation ina circular cross section tube. In: ECI International Conferenceon Boiling Heat Transfer, Spoleto, Italia, paper 13.
Friedel, L., 1979. Improved friction pressure drop correlation forhorizontal and vertical two-phase flow. In: European Two-Phase Group Meeting, Ispra, Italy, paper E2.
Fukuta, M., Yanagisawa, T., Omura, M., Ogi, Y., 2005. Mixing andseparation characteristics of isobutane with refrigeration oil.International Journal of Refrigeration 28, 997–1005.
Gasche, J.L., Ferreira, R.T.S., Prata, A.T., 2000. Two-phase flow ofoil–refrigerant mixture through the radial clearance inrolling piston compressors. In: 15th InternationalCompressor Engineering Conference at Purdue, WestLafayette-IN, pp. 459–466.
Goswami, D.Y., Shah, D.O., Jotshi, C.K., Bhagwat, S.S., Leung, M.,Gregory, A.S., Lu, S., 1998. Foaming characteristics ofrefrigerant/lubricant mixtures, ARTI MCLR project no. 655–53200, Final report.
Grando, F.P., Prata, A.T., 2003. Computational modeling of oil–refrigerant two-phase flow with foam formation in straight
Table A.1 – . Constants used in Eqs. (A.3.1–A.3.6)
Constant a b c d e
Subscript
1 1.4138 10�2 9.6799 10�4 2.0454 10�5 2.7497 10�9 �5.7896 10�11
2 1.4899 10�3 1.3450 10�4 5.2077 10�6 1.3717 10�8 �2.8533 10�10
3 6.2747 10�5 �4.2158 10�5 �1.1169 10�6 6.6998 10�9 �8.3874 10�11
4 7.7374 10�7 9.4270 10�6 2.8237 10�7 �3.5512 10�12 4.6565 10�12
5 �2.1416 10�27 �6.3823 10�8 �1.9552 10�8 4.3568 10�12 �5.8576 10�14
i n t e r n a t i o n a l j o u r n a l o f r e f r i g e r a t i o n 3 2 ( 2 0 0 9 ) 4 2 1 – 4 2 9428
Author's personal copy
horizontal pipes. In: Proceedings of the Second InternationalConference on Heat Transfer, Fluid Mechanics andThermodynamics – HEFAT, Zambia, paper GF2.
Grando, P., Priest, M., Prata, A.T., 2005. Lubrication inrefrigeration systems: performance of journal bearingslubricated with oil and refrigerant mixtures, life cycletribology. In: Proc. 31st Leeds-Lyon Symposium on Tribology,Leeds 2004. Tribology and Interface Engineering Series.Elsevier, Amsterdam, pp. 481–491.
Grando, F.P., Priest, M., Prata, A.T., 2006. A two-phase flowapproach to cavitation modeling in journal bearings. TribologyLetters 3 (21), 233–244.
Grebner, J.J., Crawford, R.R., 1993. Measurement of pressuretemperature-concentration relations for mixtures of R12/mineral oil and R134a synthetic oil. ASHRAE Transactions 99,387–396. Part 1.
Hambraeus, K., 1995. Heat transfer of oil-contaminated HFC134ain a horizontal evaporator. International Journal ofRefrigeration 18 (2), 87–99.
Jensen, M.K., Jackman, D.L., 1984. Prediction of nucleate poolboiling heat transfer coefficients of refrigerant-oil mixtures.Journal of Heat Transfer 106, 184–190.
Jonsson, U.J., 1999. Lubrication of rolling element bearings withHFC-polyolester mixtures. WEAR 232, 185–191.
Lacerda, V.T., Prata, A.T., Fagotti, F., 2000. Experimentalcharacterization of oil–refrigerant two-phase flow. In:Proceedings of ASME–Advanced Energy System Division, SanFrancisco, pp. 101–109.
Martz, W.L., Burton, C.M., Jacobi, A.M., 1996. Local compositionmodelling of the thermodynamic properties of refrigerant andoil mixtures. International Journal of Refrigeration 19 (1),25–33.
Mishima, K., Hibiki, T., 1996. Some characteristics of air-watertwo-phase flow in small diameter vertical tubes. InternationalJournal of Multiphase Flow 22, 703–712.
Motta, S.F.Y., Parise, J.A.R., Braga, S.L., 2002. A visual study ofR404a/oil flow through adiabatic capillary tubes. InternationalJournal of Refrigeration 25, 586–596.
NIST, 1998. Thermodynamic and transport properties ofrefrigerants and refrigerant mixtures-REFPROP, version 6.01.
Poiate Jr., E., Gasche, J.L., 2006. Foam flow of oil–refrigerant R12mixture in a small diameter tube. Journal of the BrazilianSociety of Mechanical Sciences and Engineering XXVIII (4),391–399.
Poiate Jr., E., 2001. Two-phase flow of the mineral oil–refrigerantR12 through a straight round tube, master dissertation, SaoPaulo State University, Ilha Solteira-SP, Brazil (in Portuguese).
Prata, A.T., Barbosa Jr., J.R., 2007. The thermodynamics, heattransfer and fluid mechanics role of lubricant oil inhermetic reciprocating compressors (keynote paper). In:Fifth International Conference on Heat Transfer, FluidMechanics and Thermodynamics, CD-ROM, Sun City, SouthAfrica, July 01–04.
Schlager, L.M., Pate, M.B., Bergles, A.E., 1987. A survey ofrefrigerant heat transfer and pressure drop emphasizing oileffects and in-tube augmentation. ASHRAE Transactions 93,392–415. Part 1.
Thomas, R.H.P., Pham, H.T., 1992. Solubility and miscibility ofenvironmentally safer refrigerant/lubricant mixtures. ASHRAETransactions 98, 783–788. Part 1.
Thome, J.R., 1995. Comprehensive thermodynamic approach tomodeling refrigerant–lubricant oil mixtures. HVAC & R.Research 1 (2), 110–126.
Tran, T.N., Chyu, M.C., Wambsganss, M.W., France, D.M., 2000.Two-phase pressure drop of refrigerants during flow boiling insmall channels: an experimental investigation and correlationdevelopment. Journal of Multiphase Flow 26, 1739–1754.
Van Gaalen, N.A., Pate, M.B., Zoz, S.C., 1990. The measurement ofsolubility and viscosity of oil/refrigerant mixtures at highpressuresandtemperatures: testfacilityandinitial results forR22/naphthenic oil mixtures. ASHRAE Transactions 96 (2), 183–190.
Van Gaalen, N.A., Zoz, S.C., Pate, P.E., 1991a. The solubility andviscosity of solutions of R502 in a naphthenic oil and in analkylbenzene at high pressures and temperatures. ASHRAETransactions 97 (2), 100–108.
Van Gaalen, N.A., Zoz, S.C., Pate, P.E., 1991b. The solubility andviscosity of solutions of HCFC-22 in a naphthenic oil and in analkylbenzene at high pressures and temperatures. ASHRAETransactions 97 (1), 285–292.
Wallner, R., Dick, H.G., 1975. Heat transfer to boiling refrigerant-oil mixtures. In: Proc. International Congress of Refrigeration,vol. 2, pp. 351–359.
Wang, C.C., Yang, K.S., Chang, Y.J., Lu, D.C., 2000. Characteristicsof air–water two-phase flow in a 3 mm smooth tube. CanadianJournal of Chemical Engineering 78, 1011–1017.
Winkler, W., Valko, P.P., Economides, M.J., 1994. A rheologicalmodel for polymers foams. Society of Petroleum Engineers 3,897–906.
i n t e r n a t i o n a l j o u r n a l o f r e f r i g e r a t i o n 3 2 ( 2 0 0 9 ) 4 2 1 – 4 2 9 429