FORMULATION AND STABILITY TESTING OF EYE DROP ...
222
FORMULATION AND STABILITY TESTING OF EYE DROP PREPARATIONS CONTAINING PHENYLEPHRINE HYDROCHLORIDE CHINEDUM OLUCHUKWU OKAFOR
-
Upload
khangminh22 -
Category
Documents
-
view
1 -
download
0
Transcript of FORMULATION AND STABILITY TESTING OF EYE DROP ...

FORMULATION AND STABILITY TESTING OF EYE DROP PREPARATIONS
CONTAINING PHENYLEPHRINE HYDROCHLORIDE
CHINEDUM OLUCHUKWU OKAFOR

ii
FORMULATION AND STABILITY TESTING OF EYE DROP PREPARATIONS
CONTAINING PHENYLEPHRINE HYDROCHLORIDE
CHINEDUM OLUCHUKWU OKAFOR
Submitted in fulfillment of the requirements for the degree of MAGISTER
SCIENTIAE in the FACULTY OF HEALTH SCIENCES at the NELSON MANDELA
METROPOLITAN UNIVERSITY
DECEMBER 2012
SUPERVISOR: Mrs. M. Keele
CO-SUPERVISORS: Dr M. Worthington, Prof. G. Kilian
iii
DECLARATION
I, Chinedum Oluchukwu Okafor, 205010351, hereby declare that the dissertation for
Magister Scientiae is my own work and that it has not previously been submitted for
assessment or completion of any postgraduate qualifcaton to another University or
for another qualification.
Chinedum Oluchukwu Okafor

iv
ACKNOWLEDGEMENTS
I wish to thank the following people and institutions for their assistance during the
compiling of this dissertation:
My exceptional families Okafor and Makamure for their steadfast support and
love;
Dr. M Worthington, as without sponsorship and guidance there could be no
research;
My supervisors, Mrs. M. Keele, and Prof. G. Kilian for guidance and support;
Prof. Milne, for his unwavering support, no words in the dictionary can
describe his help;
Michael (Aspen), Jean, Charne and Arista (NMMU) for her input, support and
exceptional skills at sourcing materials for me;
Aspen Pharmacare, for financial assistance and the use of equipment and
materials needed to perform my experiments;
All my friends all around the world, every moment with you was a blessing.
The Pharmacy, Biochemistry and Microbiology and Chemistry Departments of
the Nelson Mandela Metropolitan University for the use of laboratory facilities
and technical assistance;
Above all, God Almighty, only through His Grace can I achieve all things.
v
SUMMARY
Phenylephrine hydrochloride is a potent adrenergic agent and β-receptor
sympathomimetic drug, used in its optically active form (Pandey et al., 2003; Pandey
et al., 2006). As an α1-adrenergic receptor agonist, phenylephrine hydrochloride is
used ocularly as a decongestant for uveitis and as an agent to dilate the pupil (Lang,
1995). High intraocular doses have been reported to cause tachycardia,
hypertension, and headache. These side effects are caused by large amounts of the
drop draining into the nasal cavity. Eye drops that contain phenylephrine
hydrochloride have proven to have low intra-ocular bioavailability because of a short
contact time with the eyes which reduces the amount of drug reaching the site of
action. Formulations of phenylephrine hydrochloride eye drops have varying shelf-
lives of approximately two to four years. The aim of this study was to formulate and
manufacture an eye drop product containing phenylephrine hydrochloride. Important
characteristics that were targeted were increased ocular absorption by increasing the
viscosity of the product and reduced degradation of phenylephrine hydrochloride.
A variety of phenylephrine hydrochloride formulations were manufactured on a
laboratory scale using hydroxypropyl methylcellulose (HPMC), glycerol, and sodium
carboxy methylcellulose as viscosity modifying agents (VMA). The concentration of
phenylephrine hydrochloride was ten percent. Ten millimeters of each formulation
was made in triplicate. The quantity in each was evaluated using a previously
validated high performance (pressure) liquid chromatography method.
Physicochemical properties including pH and colour were also evaluated. Stability
was assessed using real time and accelerated stability conditions in accordance with
the International Conference on Harmonization (ICH) guidelines.
Formulations containing hydroxypropyl methylcellulose (HPMC) as the viscosity
modifying agents proved to be stable under all storage conditions when compared
with formulations containing other viscosity modifying agents (VMA). However,
sodium citrate dihydrate; sodium metabisulphite and EDTA also stabilized the
formulations to a certain extent.

vi
Changes in the appearance and colour of products containing glycerol under
accelerated storage conditions were observed. The sodium carboxy methylcellulose
(SCMC) containing formulation was found to be physically and chemically stable in
two conditions, namely 30 °C/65%RH and 25 °C/60%RH. The formulations
containing hydroxypropyl methylcellulose along with an antioxidant showed to be
most stable as it remained aesthetically pleasing did not change colour and did not
have a reduction in phenylephrine hydrochloride concentrations. This meant that
phenylephrine hydrochloride did not degrade while the viscosity modifying agents
remained stable.
Rheological tests showed differences in the viscosities of the formulations as
glycerol had increased in viscosity over time while HMPC and SCMC displayed
relative similarities. The formulations were compared to a marketed eye drop
containing polyvinyl alcohol as a VMA. After rheological analysis the formulation
containing HPMC displayed better viscosity than the product with polyvinyl alcohol.
The preservatives in the formulations were active against the microbial organisms
use to challenged them.
Key words: Phenylephrine hydrochloride, glycerol, hydroxypropyl methylcellulose,
preservatives, storage conditions, viscosity.
vii
TABLE OF CONTENTS
DECLARATION ...................................................................................................................... iii
ACKNOWLEDGEMENTS ....................................................................................................... iv
SUMMARY ............................................................................................................................... v
TABLE OF CONTENTS ......................................................................................................... vii
LIST OF ABBREVIATIONS ..................................................................................................... x
LIST OF FIGURES ............................................................................................................... xiv
LIST OF TABLES ............................................................................................................... xxviii
1. INTRODUCTION ............................................................................................................. 1
1.1 Background and motivation ...................................................................................... 1
1.2 Aim and objectives ................................................................................................... 2
1.3 Plan of work .............................................................................................................. 3
2. LITERATURE REVIEW ................................................................................................... 4
2.1 Anatomy and physiology of the eye ......................................................................... 4
2.2 Pathophysiology of the eye ......................................................................................... 10
2.3 Phenylephrine hydrochloride and its ocular uses ........................................................ 14
2.3.1 Phenylephrine hydrochloride .................................................................................... 14
2.3.2 Pharmacological actions and uses ........................................................................... 15
2.3.3 Mechanism of action ................................................................................................ 15
2.3.4 Pharmacokinetics ..................................................................................................... 16
2.3.5 Adverse effects ......................................................................................................... 16
2.3.6 Drug interactions ...................................................................................................... 17
2.3.7 Bioavailability ............................................................................................................ 17
2.3.7.1 Reasons for poor ocular bioavailability .................................................................. 18
2.3.7.2 Strategies for improving drug availability in ocular adminstration ......................... 19
2.3.7.2.1 Increasing ocular residence time ........................................................................ 19
2.3.7.2.2 Increasing ocular absorption .............................................................................. 19
2.3.7.2.3 Altering drug structure ........................................................................................ 20
2.3.8 Polymorphism and pseudomorphism of phenylephrine hydrochloride ..................... 21
2.4 Ophthalmic formulations .............................................................................................. 21
2.4.1 Eye drops as an ophthalmic dosage form ................................................................ 22
2.4.2 Eye drop formulation characteristics ........................................................................ 24
2.4.2.1 Clarity .................................................................................................................... 24
2.4.2.2 Stability, pH and buffer systems ............................................................................ 25
2.4.2.3 Tonicity .................................................................................................................. 26

viii
2.4.2.4 Viscosity ................................................................................................................ 27
2.4.2.5 Additives ................................................................................................................ 30
2.5 Sterilization .................................................................................................................. 34
2.5.1 Steam under pressure as a method of sterilization .................................................. 35
2.5.2 Filtration as a method of sterilization ........................................................................ 35
2.5.3 Laminar-flow principles ............................................................................................. 35
2.5.4 Preservatives used in eye drop formulations ........................................................... 36
2.5.4.1 Quaternary ammonium compounds ...................................................................... 38
2.5.4.2 Parahydroxybenzoic acid esters ........................................................................... 40
2.6 Efficacy of antimicrobial preservation .......................................................................... 42
2.7 Packaging .................................................................................................................... 43
2.9 Formulation development ............................................................................................ 44
2.9.1 Validation of HPLC analytical methods .................................................................... 46
2.9.1.1 Stability indicating HPLC analysis ......................................................................... 47
2.9.1.2 Choice of analytical column and conditions ........................................................... 48
2.9.1.3 Steps for HPLC method validation ........................................................................ 50
2.9.1.4 Linearity ................................................................................................................. 50
2.9.1.5 Accuracy and precision ......................................................................................... 51
2.9.1.6 Limit of detection and limit of quantification ........................................................... 51
2.9.1.7 Range .................................................................................................................... 51
2.9.1.8 Specificity .............................................................................................................. 51
2.9.2 Active-excipient compatibility studies ....................................................................... 53
2.10 Determining formulation stability study ...................................................................... 54
3. METHODOLOGY .......................................................................................................... 57
3.1 HPLC method validation .............................................................................................. 57
3.1.1 Equipment ................................................................................................................ 57
3.1.2 Materials and reagents ............................................................................................. 57
3.1.3 Mobile phase preparation and standard curve construction ..................................... 57
3.1.4 Chromatographic conditions ..................................................................................... 58
3.1.5 Linearity .................................................................................................................... 58
3.1.6 Accuracy and precision ............................................................................................ 59
3.1.7 Limit of detection and limit of quantification .............................................................. 59
3.1.8 Range and system suitability .................................................................................... 60
3.1.9 Specificity ................................................................................................................. 60
3.2 Determination of active–excipient compatibility .......................................................... 62
3.3 Manufacture of products .............................................................................................. 62
ix
3.3.1 Materials ............................................................................................................... 63
3.3.2 Product manufacture ................................................................................................ 63
3.3.2.1 Sterilization for heat sensitive API and exipients ................................................... 64
3.3.3 Manufacturing methods for products I–V ................................................................. 64
3.4 Stability Tests .............................................................................................................. 69
3.5 Qualitative and quantitative analysis of the formulations ............................................ 70
3.5.1 Appearance and pH ................................................................................................. 70
3.5.2 Phenyleprine hydrochloride concentration ............................................................... 70
3.6 Test for preservative efficacy ...................................................................................... 70
3.6.1 Procedure for standard plate count .......................................................................... 71
3.6.2 Procedure for plating the bacteria and fungi ............................................................ 71
3.6.3 Standardization of cultures using turbidimetry method ............................................ 72
3.6.4 Preservative efficacy ................................................................................................ 73
3.7 Determination of viscosity ........................................................................................... 73
3.8 Statistical analysis ....................................................................................................... 74
4. RESULTS AND DISCUSSION ...................................................................................... 75
4.1 Validation of the stability indicating assay ................................................................... 75
4.1.1 Linearity .............................................................................................................. 75
4.1.2 Accuracy .......................................................................................................... 76
4.1.3 Precision ......................................................................................................... 76
4.1.4 Limit of detection (LOD) and quantification (LOQ) .......................................... 77
4.1.5 Specificity and system suitability ..................................................................... 77
4.2 Active and excipient study ......................................................................................... 113
4.3 Stability study ............................................................................................................ 123
4.4 Determination of yield point and viscosity of products .............................................. 137
4.5 Effectiveness of the ophthalmic solution preservatives ............................................. 144
5. CONCLUSION AND RECOMMENDATIONS .............................................................. 147
REFERENCES ................................................................................................................... 151
APPENDIX A ...................................................................................................................... 176
CONCEPT ARTICLE ....................................................................................................... 176
APPENDIX B ...................................................................................................................... 192
LIST OF EQUIPMENT .................................................................................................... 192
APPENDIX C ...................................................................................................................... 193
LIST OF SOLUTIONS ..................................................................................................... 193

x
LIST OF ABBREVIATIONS
API Active Pharmaceutical Ingredient
AUC Area under Curve
Å angstrom
ANOVA Analysis of variance
atm atmospheric pressure
BP British Pharmacopeia
CPR Cardio Pulmonary Resuscitation
COMT catechol–O–methyltransferases
R2 Correlation coefficient
cAMP cyclic Adenosine Monophosphate
CYP Cytochrome P 450
Da Dalton
EDTA Ethylenediaminetetraacetic acid
ET Eustachian tube
FPLC Fast Protein Liquid Chromatography
FDA Food and Drug Administration

xi
> Greater than
HEPA High Efficiency Particulate Air
HPLC High Performance (pressure) Liquid Chromatography
HIV Human Immunodeficiency Virus
HPMC Hydroxypropyl methylcellulose
ICH International Conference on Harmonization
kg kilogram
< Less than
log logarithmic
m/v Mass per volume
MCC Medicines Control Council
MAO Monoamine oxidases
MIC Minimum Inhibitory Concentration
µg microgram
µL microliter
µm micrometer
mg milligram

xii
mm millimeter
min minute
M Molar concentration (moles of solute per liter of solution)
N Normal concentration (gram-equivalents of solute per liter of
solution)
OTC Over–The–Counter
Pa·s Pascals per second
PAC Perennial Allergic Conjunctivitis
% Percentage
psi Pounds per square inch
RH Relative humidity
RSD Relative Standard Deviation
~ roughly similar
SAC Seasonal Allergic Conjunctivitis
s seconds
SA South Africa
SD Standard Deviation

xiii
Tf Tailing factor
T Temperature
TPN Total Parenteral Nutrition
UV Ultraviolet
USP United States Pharmacopeia
UK United Kingdom
VMA Viscosity Modifying Agent
λ Wavelength

xiv
LIST OF FIGURES
Figure 1: Anatomy of the eye (Del Amo & Urtti, 2008). ............................................. 4
Figure 2: Structure of Phenylephrine, its base and salts (Trommer et al., 2010). .... 15
Figure 3: Diagram of Ocular Absorption (Nanjawade et al., 2007). ......................... 17
Figure 4: Diagram of a typical HPLC-UV absorbance peak and plots of noise (or
threshold) and purity angles (Krull & Swartz, 2001). ................................................ 52
Figure 5: Laboratory scale 1000 ml manufacturing process of product I ................. 65
Figure 6: Laboratory scale 1000 ml manufacturing process of product II ................ 66
Figure 7: Laboratory scale 1000 ml manufacturing process of product III ............... 67
Figure 8: Laboratory scale 1000 ml manufacturing process of product IV ............... 68
Figure 9: Laboratory scale 1000 ml manufacturing process of product V ................ 69
Figure 10: Graph showing a mean peak area versus concentration of replicate
samples of phenylephrine hydrochloride standards. Linear regression equation: y =
8541.1x + 438.55, R2 = 0.9999. ............................................................................... 75
Figure 11: HPLC Chromatogram for mobile phase alone. ....................................... 78
Figure 12: HPLC Chromatogram for phenylephrine hydrochloride dissolved in
mobile phase with a retention time of 7.80 minutes. ................................................ 79
Figure 13: Peak purity profile calculated using PDA data (from 190–800 nm) for
phenylephrine hydrochloride prepared in mobile phase. Peak shown in pink and
purity curve in black. Peak purity index = 1.00000; Single point threshold = 0.999999.
................................................................................................................................. 79
Figure 14: HPLC Chromatogram for product I dissolved in mobile phase with a
retention time of 7.87 minutes. ................................................................................. 79
Figure 15: Peak purity profile calculated using PDA data (from 190–800 nm) for
Product I prepared in mobile phase. Peak shown in pink and purity curve in black.
Peak purity index = 1.00000; Single point threshold = 0.999054 ............................. 80
Figure 16: HPLC Chromatogram for product II dissolved in mobile phase with a
retention time of 7.82 minutes. ................................................................................. 80
Figure 17: Peak purity profile calculated using PDA data (from 190–800 nm) for
Product II prepared in mobile phase. Peak shown in pink and purity curve in black.
Peak purity index = 1.00000; Single point threshold = 0.996482. ............................ 80
xv
Figure 18: HPLC Chromatogram for product III dissolved in mobile phase with a
retention time of 7.83 minutes. ................................................................................. 81
Figure 19: Peak purity profile calculated using PDA data (from 190–800 nm) for
Product III prepared in mobile phase. Peak shown in pink and purity curve in black.
Peak purity index = 1.00000; Single point threshold = 0.998178. ............................ 81
Figure 20: HPLC Chromatogram for product IV dissolved in mobile phase with a
retention time of 7.89 minutes. ................................................................................. 81
Figure 21: Peak purity profile calculated using PDA data (from 190–800 nm) for
Product IV prepared in mobile phase. Peak shown in pink and purity curve in black.
Peak purity index = 1.00000; Single point threshold = 0.996947. ............................ 82
Figure 22: HPLC Chromatogram for product V dissolved in mobile phase with a
retention time of 7.84 minutes. ................................................................................. 82
Figure 23: Peak purity profile calculated using PDA data (from 190–800 nm) for
product V prepared in mobile phase. Peak shown in pink and purity curve in black.
Peak purity index = 1.00000; Single point threshold = 0.999587. ............................ 82
Figure 24: HPLC Chromatogram for phenylephrine hydrochloride stressed under UV
light dissolved in mobile phase with a retention time of 7.81 minutes. ..................... 83
Figure 25: Peak purity profile calculated using PDA data (from 190–800 nm) for
phenylephrine hydrochloride prepared in mobile phase. Peak shown in pink and
purity curve in black. Peak purity index = 1.00000; Single point threshold = 0.999999.
................................................................................................................................. 83
Figure 26: HPLC Chromatogram for product I stressed under UV light dissolved in
mobile phase with a retention time of 7.86 minutes. ................................................ 84
Figure 27: Peak purity profile calculated using PDA data (from 190–800 nm) for
product I prepared in mobile phase. Peak shown in pink and purity curve in black.
Peak purity index = 1.00000; Single point threshold = 0.999054. ............................ 84
Figure 28: HPLC Chromatogram for product II stressed under UV light dissolved in
mobile phase with a retention time of 7.82 minutes. ................................................ 84
Figure 29: Peak purity profile calculated using PDA data (from 190–800 nm) for
product II in mobile phase. Peak shown in pink and purity curve in black. Peak purity
index = 1.00000; Single point threshold = 0.999116. ............................................... 85
Figure 30: HPLC Chromatogram for product III stressed under UV light dissolved in
mobile phase with a retention time of 7.85 minutes. ................................................ 85

xvi
Figure 31: Peak purity profile calculated using PDA data (from 190–800 nm) for
product III in mobile phase. Peak shown in pink and purity curve in black. Peak purity
index = 0.999999; Single point threshold = 0.997116. ............................................. 85
Figure 32: HPLC Chromatogram for product IV stressed under UV light dissolved in
mobile phase with a retention time of 7.81 minutes. ................................................ 86
Figure 33: Peak purity profile calculated using PDA data (from 190–800 nm) for
product IV in mobile phase. Peak shown in pink and purity curve in black. Peak
purity index = 1.000000; Single point threshold = 0.997916. .................................... 86
Figure 34: HPLC chromatogram for product V stressed under UV light dissolved in
mobile phase with a retention time of 7.87 minutes. ................................................ 86
Figure 35: Peak purity profile calculated using PDA data (from 190–800 nm) for
product V in mobile phase. Peak shown in pink and purity curve in black. Peak purity
index = 1.000000; Single point threshold = 0.997475. ............................................. 87
Figure 36: HPLC chromatogram of phenylephrine hydrochloride stressed with 0.2 M
HCl dissolved in mobile phase with a retention time of 7.86 minutes. ...................... 88
Figure 37: Peak purity profile calculated using PDA data (from 190–800 nm) for
phenylephrine hydrochloride in mobile phase. Peak shown in pink and purity curve in
black. Peak purity index = 1.000000; Single point threshold = 0.999574. ................ 88
Figure 38: HPLC chromatogram of Product I stressed with 0.2 M HCl dissolved in
mobile phase with a retention time of 7.82 minutes. ................................................ 88
Figure 39: Peak purity profile calculated using PDA data (from 190–800 nm) for
product I stressed with 0.2 M HCl in mobile phase. Peak shown in pink and purity
curve in black. Peak purity index = 0.999999; Single point threshold = 0.997116. ... 89
Figure 40: HPLC chromatogram for product II stressed with 0.2 M HCl dissolved in
mobile phase with a retention time of 7.83 minutes. ................................................ 89
Figure 41: Peak purity profile calculated using PDA data (from 190–800 nm) for
product II stressed with 0.2 M HCl in mobile phase. Peak shown in pink and purity
curve in black. Peak purity index = 1.000000; Single point threshold = 0.996296. ... 89
Figure 42: HPLC chromatogram for product III stressed with 0.2 M HCl dissolved in
mobile phase with a retention time of 7.91 minutes. ................................................ 90
Figure 43: Peak purity profile calculated using PDA data (from 190–800 nm) for
product III stressed with 0.2 M HCl in mobile phase. Peak shown in pink and purity
curve in black. Peak purity index =0.999999; Single point threshold = 0.995179. .... 90
xvii
Figure 44: HPLC chromatogram for product IV stressed with 0.2 M HCl dissolved in
mobile phase with a retention time of 7.86 minutes. ................................................ 90
Figure 45: Peak purity profile calculated using PDA data (from 190–800 nm) for
product IV stressed with 0.2 M HCl in mobile phase. Peak shown in pink and purity
curve in black. Peak purity index =1.000000; Single point threshold = 0.997097. .... 91
Figure 46: HPLC chromatogram of product V stressed with 0.2 M HCl dissolved in
mobile phase with a retention time of 7.80 minutes. ................................................ 91
Figure 47: Peak purity profile calculated using PDA data (from 190–800 nm) for
product V stressed with 0.2 M HCl in mobile phase. Peak shown in pink and purity
curve in black. Peak purity index =1.000000; Single point threshold = 0.999578. .... 91
Figure 48: HPLC chromatogram of phenylephrine hydrochloride stressed with 0.2 M
NaOH dissolved in mobile phase with a retention time of 7.82 minutes ................... 92
Figure 49: Peak purity profile calculated using PDA data (from 190–800 nm) for
phenylephrine hydrochloride stressed with 0.2 M NaOH in mobile phase. Peak
shown in pink and purity curve in black. Peak purity index =0.999999; Single point
threshold = 0.996847. .............................................................................................. 92
Figure 50: HPLC chromatogram of product I stressed with 0.2 M NaOH dissolved in
mobile phase with a retention time of 7.89 minutes. ................................................ 93
Figure 51: Peak purity profile calculated using PDA data (from 190–800 nm) for
product I stressed with 0.2 M NaOH in mobile phase. Peak shown in pink and purity
curve in black. Peak purity index =1.000000; Single point threshold = 0.995815. .... 93
Figure 52: HPLC chromatogram of product II stressed with 0.2 M NaOH dissolved in
mobile phase with a retention time of 7.9 minutes. .................................................. 93
Figure 53: Peak purity profile calculated using PDA data (from 190–800 nm) for
product II stressed with 0.2 M NaOH in mobile phase. Peak shown in pink and purity
curve in black. Peak purity index = 0.999999; Single point threshold = 0.996370. ... 94
Figure 54: HPLC chromatogram for product III stressed with 0.2 M NaOH dissolved
in mobile phase with a retention time of 7.79 minutes. ............................................. 94
Figure 55: Peak purity profile calculated using PDA data (from 190–800 nm) for
product III stressed with 0.2 M NaOH in mobile phase. Peak shown in pink and purity
curve in black. Peak purity index = 0.999999; Single point threshold = 0.998771. ... 94
Figure 56: HPLC chromatogram of product IV stressed with 0.2 M NaOH dissolved
in mobile phase with a retention time of 7.91 minutes. ............................................. 95
xviii
Figure 57: Peak purity profile calculated using PDA data (from 190–800 nm) for
product IV stressed with 0.2 M NaOH in mobile phase. Peak shown in pink and
purity curve in black. Peak purity index = 0.999999; Single point threshold =
0.996930. ................................................................................................................. 95
Figure 58: HPLC chromatogram for product V stressed with 0.2 M NaOH dissolved
in mobile phase with a retention time of 7.85 minutes. ............................................. 95
Figure 59: Peak purity profile calculated using PDA data (from 190–800 nm) for
product V stressed with 0.2 M NaOH in mobile phase. Peak shown in pink and purity
curve in black. Peak purity index = 0.999999; Single point threshold = 0.999587. ... 96
Figure 60: HPLC chromatogram for phenylephrine hydrochloride stressed with 0.2
M H2O2 dissolved in mobile phase with a retention time of 7.82 minutes. ................ 96
Figure 61: Peak purity profile calculated using PDA data (from 190–800 nm) for
phenylephrine hydrochloride stressed with 0.2 H2O2 in mobile phase. Peak shown in
pink and purity curve in black. Peak purity index = 1.000000; Single point threshold =
0.999987. ................................................................................................................. 97
Figure 62: HPLC chromatogram for product I stressed with 0.2 M H2O2 dissolved in
mobile phase with a retention time of 7.81 minutes. ................................................ 97
Figure 63: Peak purity profile calculated using PDA data (from 190–800 nm) for
product I stressed with 0.2 H2O2 in mobile phase. Peak shown in pink and purity
curve in black. Peak purity index = 1.000000; Single point threshold = 0.999522. ... 97
Figure 64: HPLC chromatogram for product II stressed with 0.2 M H2O2 dissolved in
mobile phase with a retention time of 7.9 minutes. .................................................. 98
Figure 65: Peak purity profile calculated using PDA data (from 190–800 nm) for
product II stressed with 0.2 H2O2 in mobile phase. Peak shown in pink and purity
curve in black. Peak purity index = 0.999999; Single point threshold = 0.999722. ... 98
Figure 66: HPLC chromatogram of product III stressed with 0.2 M H2O2 dissolved in
mobile phase with a retention time 7.94 minutes. .................................................... 98
Figure 67: Peak purity profile calculated using PDA data (from 190–800 nm) for
product III stressed with 0.2 H2O2 in mobile phase. Peak shown in pink and purity
curve in black. Peak purity index = 0.999999; Single point threshold = 0.999706. ... 99
Figure 68: HPLC chromatogram for product IV with 0.2 M H2O2 dissolved in mobile
phase with a retention time of 7.81 minutes. ............................................................ 99

xix
Figure 69: Peak purity profile calculated using PDA data (from 190–800 nm) for
product IV stressed with 0.2 H2O2 in mobile phase. Peak shown in pink and purity
curve in black. Peak purity index = 1.000000; Single point threshold = 0.999896. ... 99
Figure 70: HPLC chromatogram for product V stressed with 0.2 M H2O2 dissolved in
mobile phase with a retention time of 7.88 minutes. .............................................. 100
Figure 71: Peak purity profile calculated using PDA data (from 190–800 nm) for
product V stressed with 0.2 H2O2 in mobile phase. Peak shown in pink and purity
curve in black. Peak purity index = 0.999999; Single point threshold = 0.999536. . 100
Figure 72: HPLC chromatogram for phenylephrine hydrochloride stored at 100 °C
for 24 hours dissolved in mobile phase with a retention time of 7.8 minutes. ......... 102
Figure 73: Peak purity profile calculated using PDA data (from 190–800 nm) for
phenylephrine hydrochloride stored at 100 °C for 24 hours in mobile phase. Peak
shown in pink and purity curve in black. Peak purity index = 1.000000; Single point
threshold = 0.999999. ............................................................................................ 102
Figure 74: HPLC chromatogram for phenylephrine hydrochloride stored at 65 °C for
1 month dissolved in mobile phase with a retention time of 7.83 minutes. ............. 103
Figure 75: Peak purity profile calculated using PDA data (from 190–800 nm) for
phenylephrine hydrochloride stored at 65 °C for 1 month in mobile phase. Peak
shown in pink and purity curve in black. Peak purity index = 1.000000; Single point
threshold = 0.999989. ............................................................................................ 103
Figure 76: HPLC chromatogram for product I stored at 65 °C for 1 month dissolved
in mobile phase with a retention time of 7.92 minutes. ........................................... 103
Figure 77: Peak purity profile calculated using PDA data (from 190–800 nm) for
product I stored at 65 °C for 1 month in mobile phase. Peak shown in pink and purity
curve in black. Peak purity index = 0.999998; Single point threshold = 0.999956. . 104
Figure 78: HPLC chromatogram for product II stored at 65 °C for 1 month dissolved
in mobile phase with a retention time of 7.84 minutes. ........................................... 104
Figure 79: Peak purity profile calculated using PDA data (from 190–800 nm) for
product II stored at 65 °C for 1 month in mobile phase. Peak shown in pink and purity
curve in black. Peak purity index = 1.000000; Single point threshold = 0.999056. . 104
Figure 80: HPLC chromatogram for Product III stored at 65 °C for 1 month dissolved
in mobile phase with a retention time of 7.89 minutes. ........................................... 105
Figure 81: Peak purity profile calculated using PDA data (from 190–800 nm) for
product III stored at 65 °C for 1 month in mobile phase. Peak shown in pink and
xx
purity curve in black. Peak purity index = 1.000000; Single point threshold =
0.999720. ............................................................................................................... 105
Figure 82: HPLC chromatogram for Product IV stored at 65 °C for 1 month dissolved
in mobile phase with a retention time of 7.87 minutes. ........................................... 105
Figure 83: Peak purity profile calculated using PDA data (from 190–800 nm) for
product IV stored at 65 °C for 1 month in mobile phase. Peak shown in pink and
purity curve in black. Peak purity index =0.999999; Single point threshold =
0.999803. ............................................................................................................... 106
Figure 84: HPLC chromatogram for Product V stored at 65 °C for 1 month dissolved
in mobile phase with a retention time of 7.90 minutes. ........................................... 106
Figure 85: Peak purity profile calculated using PDA data (from 190–800 nm) for
product V stored at 65 °C for 1 month in mobile phase. Peak shown in pink and
purity curve in black. Peak purity index = 1.000000; Single point threshold =
0.999752. ............................................................................................................... 106
Figure 86: HPLC chromatogram for phenylephrine hydrochloride stored at 40
°C/75%RH for 1 month dissolved in mobile phase with a retention time of 7.86
minutes. .................................................................................................................. 107
Figure 87: Peak purity profile calculated using PDA date (from 190–800 nm) for
phenylephrine hydrochloride stored at 40 °C/75%RH for 1 month in mobile phase.
Peak shown in pink and purity curve in black. Peak purity index = 1.000000; Single
point threshold = 0.999056. .................................................................................... 107
Figure 88: HPLC chromatogram for Product I stored at 40 °C/75%RH for 1 month
dissolved in mobile phase with a retention time of 7.87 minutes. ........................... 107
Figure 89: Peak purity profile calculated using PDA data (from 190–800 nm) for
product I stored at 40 °C/75% RH for 1 month in mobile phase. Peak shown in pink
and purity curve in black. Peak purity index = 0.999999; Single point threshold =
0.995566. ............................................................................................................... 108
Figure 90: HPLC chromatogram for Product II stored at 40 °C/75%RH for 1 month
dissolved in mobile phase with a retention time of 7.84 minutes. ........................... 108
Figure 91: Peak purity profile calculated using PDA data (from 190–800 nm) for
product II stored at 40 °C/75%RH for 1 month in mobile phase. Peak shown in pink
and purity curve in black. Peak purity index = 1.000000; Single point threshold =
0.999579. ............................................................................................................... 108
xxi
Figure 92: HPLC chromatogram for product III stored at 40 °C/75%RH for 1 month
dissolved in mobile phase with a retention time of 7.81 minutes. ........................... 109
Figure 93: Peak purity profile calculated using PDA data (from 190–800 nm) for
product III stored at 40 °C/75%RH for 1 month in mobile phase. Peak shown in pink
and purity curve in black. Peak purity index = 1.000000; Single point threshold =
0.994609. ............................................................................................................... 109
Figure 94: HPLC chromatogram for Product IV stored at 40 °C/75%RH for 1 month
dissolved in mobile phase with a retention time of 7.85 minutes. ........................... 109
Figure 95: Peak purity profile calculated using PDA data (from 190–800 nm) for
product IV stored at 40 °C/75%RH for 1 month in mobile phase. Peak shown in pink
and purity curve in black. Peak purity index = 1.000000; Single point threshold =
0.994609. ............................................................................................................... 110
Figure 96: HPLC chromatogram for Product V stored at 40 °C/75%RH for 1 month
dissolved in mobile phase with a retention time of 7.83 minutes. ........................... 110
Figure 97: Peak purity profile calculated using PDA data (from 190–800 nm) for
product V stored at 40 °C/75%RH for 1 month in mobile phase. Peak shown in pink
and purity curve in black. Peak purity index = 0.999999; Single point threshold =
0.995332. ............................................................................................................... 110
Figure 98: HPLC chromatogram for phenylephrine hydrochloride alone dissolved in
mobile phase with retention of 7.82 minutes. ......................................................... 115
Figure 99: Peak purity profile calculated using PDA date (from 190–800 nm) for
phenylephrine hydrochloride in mobile phase. Peak shown in pink and purity curve in
black. Peak purity index = 1.000000; Single point threshold = 0.999999. .............. 115
Figure 100: HPLC chromatogram for phenylephrine hydrochloride with sodium
citrate dihydrate (1:1) dissolved in mobile phase with a retention time of 7.92
minutes. .................................................................................................................. 115
Figure 101: Peak purity profile calculated using PDA data (from 190–800 nm) for
phenylephrine hydrochloride with sodium citrate dihydrate (1:1) in mobile phase.
Peak shown in pink and purity curve in black. Peak purity index = 1.000000; Single
point threshold = 0.999896. .................................................................................... 116
Figure 102: HPLC chromatogram for phenylephrine hydrochloride with
carboxymethycellulose sodium (1:1) dissolved in mobile phase with a retention time
of 7.82 minutes. ...................................................................................................... 116

xxii
Figure 103: Peak purity profile calculated using PDA data (from 190–800 nm) for
phenylephrine hydrochloride with carboxymethycellulose sodium (1:1) in mobile
phase. Peak shown in pink and purity curve in black. Peak purity index = 1.000000;
Single point threshold = 0.999999. ......................................................................... 116
Figure 104: HPLC chromatogram for phenylephrine hydrochloride with hypromellose
(1:1) dissolved in mobile phase with a retention time of 7.81 minutes. .................. 117
Figure 105: Peak purity profile calculated using PDA date (from 190–800 nm) for
phenylephrine hydrochloride with hypromellose (1:1) in mobile phase. Peak shown in
pink and purity curve in black. Peak purity index = 1.000000; Single point threshold =
0.999999. ............................................................................................................... 117
Figure 106: HPLC chromatogram for phenylephrine hydrochloride with glycerol (1:1)
dissolved in mobile phase with a retention time of 7.85 minutes. ........................... 117
Figure 107: Peak purity profile calculated using PDA data (from 190–800 nm) for
phenylephrine hydrochloride with glycerol (1:1) in mobile phase. Peak shown in pink
and purity curve in black. Peak purity index = 1.000000; Single point threshold =
0.999989. ............................................................................................................... 118
Figure 108: HPLC chromatogram for phenylephrine hydrochloride with
benzalkonium chloride (1:1) dissolved in mobile phase with a retention time of 7.88
minutes. .................................................................................................................. 118
Figure 109: Peak purity profile calculated using PDA date (from 190–800 nm) for
phenylephrine hydrochloride with benzalkonium chloride (1:1) in mobile phase. Peak
shown in pink and purity curve in black. Peak purity index = 0.999999; Single point
threshold = 0.999918. ............................................................................................ 118
Figure 110: HPLC chromatogram for phenylephrine hydrochloride with EDTA (1:1)
dissolved in mobile phase with a retention time of 7.86 minutes. ........................... 119
Figure 111: Peak purity profile calculated using PDA data (from 190–800 nm) for
phenylephrine hydrochloride with EDTA (1:1) in mobile phase. Peak shown in pink
and purity curve in black. Peak purity index = 0.999999; Single point threshold =
0.999991. ............................................................................................................... 119
Figure 112: HPLC chromatogram for phenylephrine hydrochloride with boric acid
(1:1) dissolved in mobile phase with a retention time of 7.92 minutes. .................. 119
Figure 113: Peak purity profile calculated using PDA data (from 190–800 nm) for
phenylephrine hydrochloride with boric acid (1:1) in mobile phase. Peak shown in
xxiii
pink and purity curve in black. Peak purity index = 1.000000; Single point threshold =
0.999999. ............................................................................................................... 120
Figure 114: HPLC chromatogram for phenylephrine hydrochloride with sodium
metabisulfite (1:1) dissolved in mobile phase with a retention time of 7.82 minutes.
............................................................................................................................... 120
Figure 115: Peak purity profile calculated using PDA data (from 190–800 nm) for
phenylephrine hydrochloride with sodium metabisulfite (1:1) in mobile phase. Peak
shown in pink and purity curve in black. Peak purity index = 1.000000; Single point
threshold = 0.999870. ............................................................................................ 120
Figure 116: HPLC chromatogram for phenylephrine hydrochloride with disodium
edetate (1:1) dissolved in mobile phase with a retention time of 7.82 minutes. ...... 121
Figure 117: Peak purity profile calculated using PDA data (from 190–800 nm) for
phenylephrine hydrochloride with disodium edetate (1:1) in mobile phase. Peak
shown in pink and purity curve in black. Peak purity index = 1.000000; Single point
threshold = 0.998891. ............................................................................................ 121
Figure 118: HPLC chromatogram for phenylephrine hydrochloride with propyl
paraben (1:1) dissolved in mobile phase with a retention time of 7.83 minutes. .... 121
Figure 119: Peak purity profile calculated using PDA data (from 190–800 nm) for
phenylephrine hydrochloride with propyl paraben (1:1) in mobile phase. Peak shown
in pink and purity curve in black. Peak purity index = 1.000000; Single point
threshold = 0.999948. ............................................................................................ 122
Figure 120: HPLC chromatogram for phenylephrine hydrochloride with methyl
paraben (1:1) dissolved in mobile phase with a retention time of 7.82 minutes. .... 122
Figure 121: Peak purity profile calculated using PDA data (from 190–800 nm) for
phenylephrine hydrochloride with methyl paraben (1:1) in mobile phase. Peak
shown in pink and purity curve in black. Peak purity index = 1.000000; Single point
threshold = 0.999982. ............................................................................................ 122
Figure 122: HPLC chromatogram for product I stored at 30 °C/65%RH for 3 months
dissolved in mobile phase with a retention time of 7.87 minutes. ........................... 123
Figure 123: Peak purity profile calculated using PDA date (from 190–800 nm) for
product I stored at 30 °C/65%RH for 3 months in mobile phase. Peak shown in pink
and purity curve in black. Peak purity index = 0.999999; Single point threshold =
0.999950. ............................................................................................................... 124

xxiv
Figure 124: HPLC chromatogram for product II stored at 30 °C/65%RH for 3 months
dissolved in mobile phase with a retention time of 7.85 minutes. ........................... 124
Figure 125: Peak purity profile calculated using PDA date (from 190–800 nm) for
product II stored at 30 °C/65%RH for 3 months in mobile phase. Peak shown in pink
and purity curve in black. Peak purity index = 1.000000; Single point threshold =
0.996473. ............................................................................................................... 124
Figure 126: HPLC chromatogram for product III stored at 30 °C/65%RH for 3
months dissolved in mobile phase with a retention time of 7.87 minutes. .............. 125
Figure 127: Peak purity profile calculated using PDA date (from 190–800 nm) for
product III stored at 30 °C/65%RH for 3 months in mobile phase. Peak shown in pink
and purity curve in black. Peak purity index = 0.999999; Single point threshold =
0.996955. ............................................................................................................... 125
Figure 128: HPLC chromatogram for product IV stored at 30 °C/65% RH for 3
months dissolved in mobile phase with a retention time of 7.88 minutes. .............. 125
Figure 129: Peak purity profile calculated using PDA date (from 190–800 nm) for
product IV stored at 30 °C/65%RH for 3 months in mobile phase. Peak shown in pink
and purity curve in black. Peak purity index = 0.999998; Single point threshold =
0.998694. ............................................................................................................... 126
Figure 130: HPLC chromatogram for product V stored at 30 °C/65%RH for 3 months
dissolved in mobile phase with a retention time of 7.87 minutes. ........................... 126
Figure 131: Peak purity profile calculated using PDA date (from 190–800 nm) for
product V stored at 30 °C/65%RH for 3 months in mobile phase. Peak shown in pink
and purity curve in black. Peak purity index = 0.999998; Single point threshold =
0.994533. ............................................................................................................... 126
Figure 132: HPLC chromatogram for product I stored at 25 °C/60%RH for 3 months
dissolved in mobile phase with a retention time of 7.91 minutes. ........................... 127
Figure 133: Peak purity profile calculated using PDA date (from 190–800 nm) for
product I stored at 25 °C/60%RH for 3 months in mobile phase. Peak shown in pink
and purity curve in black. Peak purity index = 1.000000; Single point threshold =
0.995873. ............................................................................................................... 127
Figure 134: HPLC chromatogram for product II stored at 25 °C/60%RH for 3 months
dissolved in mobile phase with a retention time of 7.89 minutes. ........................... 128
Figure 135: Peak purity profile calculated using PDA date (from 190–800 nm) for
product II stored at 25 °C/60%RH for 3 months in mobile phase. Peak shown in pink

xxv
and purity curve in black. Peak purity index = 0.999998; Single point threshold =
0.999950. ............................................................................................................... 128
Figure 136: HPLC chromatogram for product III stored at 25 °C/60%RH for 3
months dissolved in mobile phase with a retention time of 7.92 minutes. .............. 128
Figure 137: Peak purity profile calculated using PDA date (from 190–800 nm) for
product III stored at 25 °C/60%RH for 3 months in mobile phase. Peak shown in pink
and purity curve in black. Peak purity index = 0.999999; Single point threshold =
0.998742. ............................................................................................................... 129
Figure 138: HPLC chromatogram for product IV stored at 25 °C/60%RH for 3
months dissolved in mobile phase with a retention time of 7.92 minutes. .............. 129
Figure 139: Peak purity profile calculated using PDA date (from 190–800 nm) for
product IV stored at 25 °C/60%RH for 3 months in mobile phase. Peak shown in pink
and purity curve in black. Peak purity index = 0.999999; Single point threshold =
0.996396. ............................................................................................................... 129
Figure 140: HPLC chromatogram for product V stored at 25 °C/60%RH for 3 months
dissolved in mobile phase with a retention time of 7.84 minutes. ........................... 130
Figure 141: Peak purity profile calculated using PDA date (from 190–800 nm) for
product V stored at 25 °C/60%RH for 3 months in mobile phase. Peak shown in pink
and purity curve in black. Peak purity index = 1.000000; Single point threshold =
0.998093. ............................................................................................................... 130
Figure 142: HPLC chromatogram for product I stored at 40 °C/75%RH for 3 months
dissolved in mobile phase with a retention time of 7.84 minutes. ........................... 131
Figure 143: Peak purity profile calculated using PDA date (from 190 – 800 nm) for
product I stored at 40 °C/75%RH for 3 months in mobile phase. Peak shown in pink
and purity curve in black. Peak purity index = 1.000000; Single point threshold =
0.998093. ............................................................................................................... 131
Figure 144: HPLC chromatogram for product II stored at 40 °C/75%RH for 3 months
dissolved in mobile phase with a retention time of 7.84 minutes. ........................... 131
Figure 145: Peak purity profile calculated using PDA date (from 190 – 800 nm) for
product II stored at 40 °C/75%RH for 3 months in mobile phase. Peak shown in pink
and purity curve in black. Peak purity index = 1.000000; Single point threshold =
0.998093. ............................................................................................................... 132
Figure 146: HPLC chromatogram for product III stored at 40 °C/75%RH for 3
months dissolved in mobile phase with a retention time of 7.84 minutes. .............. 132
xxvi
Figure 147: Peak purity profile calculated using PDA date (from 190–800 nm) for
product III stored at 40 °C/75%RH for 3 months in mobile phase. Peak shown in pink
and purity curve in black. Peak purity index = 1.000000; Single point threshold =
0.998093. ............................................................................................................... 132
Figure 148: HPLC chromatogram for product IV stored at 40 °C/75%RH for 3
months dissolved in mobile phase with a retention time of 7.84 minutes. .............. 133
Figure 149: Peak purity profile calculated using PDA date (from 190–800 nm) for
product IV stored at 40 °C/75%RH for 3 months in mobile phase. Peak shown in pink
and purity curve in black. Peak purity index = 1.000000; Single point threshold =
0.998093. ............................................................................................................... 133
Figure 150: HPLC chromatogram for product V stored at 40 °C/75%RH for 3 months
dissolved in mobile phase with a retention time of 7.91 minutes. ........................... 133
Figure 151: Peak purity profile calculated using PDA date (from 190–800 nm) for
product V stored at 40 °C/75%RH for 3 months in mobile phase. Peak shown in pink
and purity curve in black. Peak purity index = 0.999999; Single point threshold =
0.998093. ............................................................................................................... 134
Figure 152: A graph showing standard error and phenylephrine hydrochloride left in
product I–V after 12 weeks at 30 °C/65%RH, 40 °C/75%RH, 25 °C/60%RH. ........ 134
Figure 153: Flow and viscosity curve of Prefrin® and products I–V at time zero for
storage condition 30 °C/65% RH. ........................................................................... 138
Figure 154: Flow and viscosity curve of Prefrin® and products I–V after 3 months for
storage condition 30 °C/65% RH. ........................................................................... 138
Figure 155: Flow and viscosity curve of Prefrin® and products I–V at time zero for
storage condition 40 °C/75% RH. ........................................................................... 139
Figure 156: Flow and viscosity curve of Prefrin® and products I–V after 3 months for
storage condition 40 °C/75% RH. ........................................................................... 139
Figure 157: Flow and viscosity curve of Prefrin® and products I–V at time zero for
storage condition 25 °C/60%RH. ............................................................................ 140
Figure 158: Flow and viscosity curve of Prefrin® and products I–V after 3 months for
storage condition 25 °C/60% RH. ........................................................................... 140
Figure 159: Graph showing viscosity of products I–V stored in a stability chamber of
40 °C/75%RH tested at time zero (T0), three months later (T1) and compared to an
original marketed product Prefrin®. ........................................................................ 141
xxvii
Figure 160: Graph showing viscosity of products I–V stored in a stability chamber of
25 °C/60%RH tested at time zero (T0), 3 months later (T1) and compared to an
original marketed product Prefrin®. ........................................................................ 141
Figure 161: Graph showing viscosity of products I–V stored in a stability chamber of
30 °C/65%RH tested at time zero (T0), 3 months later (T1) and compared to an
original marketed product Prefrin®. ........................................................................ 142

xxviii
LIST OF TABLES
Table 1: Conventional dosage forms and usage (Lang, 1995). ............................... 24
Table 2: Typical minimum inhibitor concentrations of benzalkonium chloride (Kibbe,
2006). ....................................................................................................................... 39
Table 3: Minimum inhibitory concentration for propylparaben in aqueous solution
(Rieger, 2006b) ........................................................................................................ 40
Table 4: Minimum inhibitory concentrations of methylparaben in aqueous solution
(Rieger, 2006a). ....................................................................................................... 41
Table 5: Formulation summary of active pharmaceutical ingredient and excipients
used in the manufacturing of products I–V ............................................................... 64
Table 6: Criteria for tested microorganisms (USP, 2004) ........................................ 73
Table 7: Accuracy data for quantification of phenylephrine hydrochloride ............... 76
Table 8: Precision data for quantification of phenylephrine hydrochloride ............... 76
Table 9: Physical appearance of phenylephrine hydrochloride and products I–V
before and after storage conditions 40 °C/75%RH for 1 month .............................. 101
Table 10: Results showing absence of impurity from a series of stressed and
unstressed samples of phenylephrine hydrochloride (API) and products. .............. 111
Table 11: Results showing phenylephrine hydrochloride left with samples stressed
and unstressed (API and Products) ....................................................................... 112
Table 12: Assay result showing phenylephrine hydrochloride and excipients in a 1:1
ratio after storage conditions 40 °C/75%RH for 1 month ........................................ 113
Table 13: Physical appearance of active–excipients samples before and after
storage conditions 40 °C/75%RH for 4 weeks ........................................................ 114
Table 14: Results of one-way ANOVA analysis for products I–V stored at 25
°C/60%RH, 30 °C/65%RH and 40 °C/75%RH for 3 months. ................................. 135
Table 15: Changes in pH of phenylephrine hydrochloride and products I–V before
and after storage conditions 40 °C/75%RH for 1 month. ........................................ 136
Table 16: Changes in pH for products I–V before and after varying storage
conditions for 3 months .......................................................................................... 136
Table 17: Results of one-way ANOVA analysis for similarities in pH of products II 25
°C/60%RH, 40 °C/75%RH and IV 25 °C/60%RH after 3 months. .......................... 136

xxix
Table 18: Physical appearance of products I–V before and after varying storage
conditions for 3 months. ......................................................................................... 137
Table 19: Results of one-way ANOVA analysis for viscosity of products I–V stored at
25 °C/60%RH, 30 °C/65%RH and 40 °C/75%RH for 3 months. The values shown
indicate differences in p-values and significance in differences of mean was defined
as p < 0.05. ............................................................................................................ 143
Table 20: Antimicrobial preservative efficacy of the eye-drop products I–V
challenged with E. coli, S.aureus, P. aeruginosa, C.albicans. ................................ 145
1
1. INTRODUCTION
1.1 Background and motivation
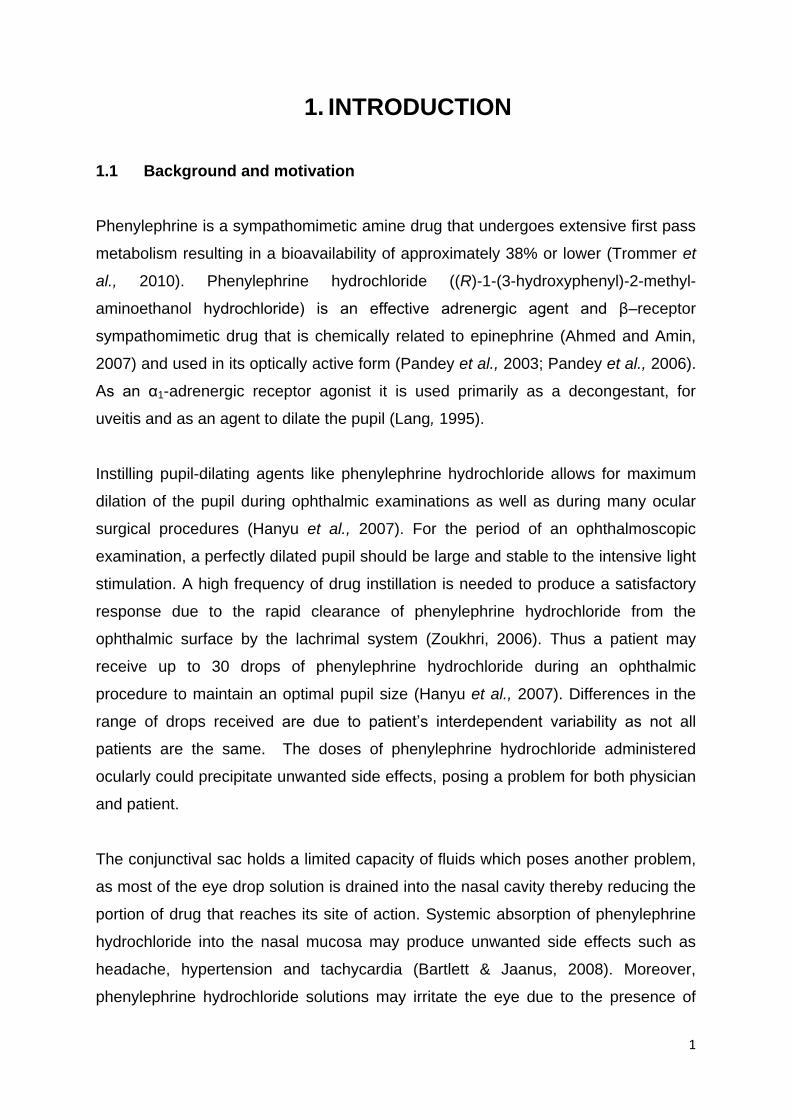
Phenylephrine is a sympathomimetic amine drug that undergoes extensive first pass
metabolism resulting in a bioavailability of approximately 38% or lower (Trommer et
al., 2010). Phenylephrine hydrochloride ((R)-1-(3-hydroxyphenyl)-2-methyl-
aminoethanol hydrochloride) is an effective adrenergic agent and β–receptor
sympathomimetic drug that is chemically related to epinephrine (Ahmed and Amin,
2007) and used in its optically active form (Pandey et al., 2003; Pandey et al., 2006).
As an α1-adrenergic receptor agonist it is used primarily as a decongestant, for
uveitis and as an agent to dilate the pupil (Lang, 1995).
Instilling pupil-dilating agents like phenylephrine hydrochloride allows for maximum
dilation of the pupil during ophthalmic examinations as well as during many ocular
surgical procedures (Hanyu et al., 2007). For the period of an ophthalmoscopic
examination, a perfectly dilated pupil should be large and stable to the intensive light
stimulation. A high frequency of drug instillation is needed to produce a satisfactory
response due to the rapid clearance of phenylephrine hydrochloride from the
ophthalmic surface by the lachrimal system (Zoukhri, 2006). Thus a patient may
receive up to 30 drops of phenylephrine hydrochloride during an ophthalmic
procedure to maintain an optimal pupil size (Hanyu et al., 2007). Differences in the
range of drops received are due to patient’s interdependent variability as not all
patients are the same. The doses of phenylephrine hydrochloride administered
ocularly could precipitate unwanted side effects, posing a problem for both physician
and patient.
The conjunctival sac holds a limited capacity of fluids which poses another problem,
as most of the eye drop solution is drained into the nasal cavity thereby reducing the
portion of drug that reaches its site of action. Systemic absorption of phenylephrine
hydrochloride into the nasal mucosa may produce unwanted side effects such as
headache, hypertension and tachycardia (Bartlett & Jaanus, 2008). Moreover,
phenylephrine hydrochloride solutions may irritate the eye due to the presence of

2
preservatives such as benzalkonium chloride and methyl paraben amongst others
(Giaconi et al., 2009).
The contact time of eye drops is considered as being the most important factor in
ophthalmic drug delivery (Agarwal et al., 2002). This research study will focus on
formulating an eye drop solution which improves contact time. Various formulations
of phenylephrine hydrochloride eye drops have been made in the quest to improve
contact time. These include viscous solutions (Saettone et al., 1984), rods (Alani,
1978), gels (Durrani et al., 1996), ointments (Saettone et al., 1980; Gurjar et al.,
1998), and a polyvinyl alcohol flag (O’Donnell & Gillibrand, 1995; Maitani et al.,
1997).
Phenylephrine hydrochloride have been formulated in varying dosage forms using
potassium, sodium and lysine salts or mixed with viscosity modifiers such as HPMC
and SCMC to improve its effectiveness. Ocular penetration and retention of
phenylephrine hydrochloride demands an ophthalmic solution of acidic pH which
could precipitate the drug or increase the ocular irritation potential and viscosity
modifiers could solve both problems. Benzalkonium chloride, a cationic preservative,
used in eye drops causes eye irritation, caution is needed in its use and
concentration. Thus a non irratiting ophthalmic solution of phenylephrine
hydrochloride can be formulated by dissolving an eye-friendly water soluble salt, a
viscosity modifyier, an antioxidant in purified water and stability in mind with
benzalkonium chloride.
However, there is still scope for an eye drop that can be administered easily in less
frequent doses which produces consistent, rapid results and minimizes the risk of
adverse effects to the patient.
1.2 Aim and objectives
The primary aim of the study was to develop a pharmaceutically stable
phenylephrine hydrochloride eye drop. The following objectives were accordingly
identified:
3
Validate a high performance liquid chromatographic (HPLC) method for the
quantitative determination of phenylephrine hydrochloride in the finished
product.
Propose formulations of phenylephrine hydrochloride eye drops and
manufacture laboratory scale batches of these.
Characterize the physicochemical properties of the formulations by assessing
appearance, rheology, pH and degradation.
Conduct real time and accelerated stability studies on the formulations; in
accordance with the International Conference for Harmonization (ICH) and
Medicines Control Council guidelines.
Determine the efficacy of antimicrobial preservation.
1.3 Plan of work
In order to achieve the above objectives, a well laid out plan was to be followed.
Literature reviews, on the theory relating to phenylephrine and its prodrugs were
undertaken in an effort to understand the API, eye drops, solutions and product
formulation. Active–excipients compatibility studies were conducted using HPLC and
various eye drops were formulated and manufactured on a laboratory scale. These
underwent stability studies in accordance with International Conference on
Harmonization and Medicine Control Council guidelines. Rheological tests and
efficacy of antimicrobial preservation were demonstrated.

4
2. LITERATURE REVIEW
2.1 Anatomy and physiology of the eye
The human eye provides a challenge to formulators who seek to produce dosage
forms where the API is administered ocularly. This is due to (a) the permeability of
the cornea and (b) the protective operation of the eyelids and lacrimal system. The
operation of the eyelids and lacrimal system rapidly removes materials instilled into
the eye; however, this clearance does not apply to materials that are small in volume
and which are chemically and physiologically compatible with surface tissues
(Hughes, 2004).
The eyes are highly specialized organs of photoreception and are protected by
eyelids and the orbit in which they are placed (Rathore & Nema, 2009). The eye can
be divided into two segments, namely the anterior and posterior segments. The
anterior segment comprises of the cornea, iris, the ciliary body, the anterior chamber
and the posterior chamber while the posterior segment comprises of retina and the
vitreous body as seen in Figure 1 (Ghosh & Jasti, 2005).
Figure 1: Anatomy of the eye (Del Amo & Urtti, 2008).
The unique anatomy, physiology and biochemistry of the eye make it resistant to
foreign substances (Del Amo & Urtti, 2008) this protective mechanism poses a

5
challenge to the formulator who is required to bypass the barriers without causing
damage to the eye (Meqi & Deshpande, 2002). The corneal barrier poses
physiological constraints due to its poor permeability which reduces the absorption of
ophthalmic drugs. The cornea is made up of three membranes; the epithelium, the
endothelium and inner stroma (Chien et al., 1990). The epithelium has tight
junctions that serve as a selective barrier to ion transport, thereby limiting the
diffusion of macromolecules via the paracellular route. The stroma is a highly
lipophilic layer that lies beneath the epithelium, and the more lipophilic a drug is, the
less resistance it will have crossing the stroma (Patel et al., 2010).
The eyelids, conjunctiva, lacrimal systems, cornea–precorneal film and its absorption
are discussed below as they play a major role in the absorption metabolism of eye
drops.
Eyelids: The eyelids have two functions: mechanical protection of the globe (eye)
and creation of an optimum environment for the cornea. The eyelids are lubricated
and kept moist by secretions of the lacrimal glands and specialized cells found in the
bulbar conjunctiva. The antechamber is shaped in a narrow cleft manner directly
over the front of the eyeball, with pocket-like extensions upward and downward. The
pockets are called the superior and inferior fornices (vaults), and the entire space is
called the cul-de-sac. The oval opening between the eyelids is called the palpebral
fissure (Zide, 2006).
Conjunctiva: The conjunctiva is defined as a thin, vascularised mucus membrane
that lines the inner surface of the eyelids and covers the anterior part of the sclera up
to the cornea (Kaur et al., 2003). Its loose attachment permits free movement of the
eyeball. Except for the cornea the conjunctiva is the most exposed portion of the eye
(Hughes, 2004). Uptake of drugs applied topically is greater in the conjunctiva than
in the cornea because the conjunctiva is porous, has a rich blood flow and a large
surface area (Araújo et al., 2009).
Lacrimal system: The conjunctival and lacrimal glands secrete a film of fluid which
covers and lubricates the conjunctival and corneal surfaces. The lacrimal glands
produce tears which are delivered through a number of fine ducts into the
6
conjunctival fornix. A tear is a clear, watery fluid containing salts, glucose, other
organic compounds, approximately 0.7% protein, and the enzyme lysozyme. Small
accessory lacrimal glands are situated in the conjunctival fornices. Their secretion
provides lubrication and cleansing during ordinary conditions and also maintains a
thin fluid film covering the cornea and conjunctiva (the precorneal film). The stability
of the film is maintained through the mucin–protein layer. The sebaceous glands of
the eyelids secrete an oily fluid that prevents overflowing of tears at the lid margin
and reduces evaporation from the exposed surfaces of the eye by spreading over
the tear film (Hughes, 2004).
Blinking helps in replenishing the fluid film by pushing a thin layer of fluid ahead of
the lid margins as they come together. The excess fluid is directed into the lacrimal
lake which is a small, triangular area lying in the angle bound by the innermost
portions of the lids. The skin of the eyelids is the thinnest in the body and folds
easily which permits rapid opening and closing of the palpebral fissures. The eyelids
provide controlled movement such as narrowing of the palpebral fissures in a zipper-
like action from the lateral canthus toward the medial canthus. The transport or
movement of fluid toward the lacrimal lake is aided by the eyelids (Del Amo & Urtti,
2008).
Tears are drained from the lacrimal lake by two small tubes–the lacrimal canaliculi–
which go into the upper part of the nasolacrimal duct, called the lacrimal sac. The
drainage of tears into the nose does not depend only on gravity. Fluid moves along
the lacrimal canaliculi by capillary attraction supported by aspiration caused by
contraction of muscle found in the eyelids. The blinking action causes contraction of
the muscles inducing dilation of the upper part of the lacrimal sac and compression
of its lower portion (Cohen et al., 2006). Tears are aspirated into the sac, which is
collected in its lower part by forcing down the tears through the nasolacrimal duct
toward its opening into the nose. As the muscle relaxes, the lids open. Owing to
muscle relaxation, the upper part of the sac forces fluid into the lower part where it is
simultaneously released from compression. The act of blinking therefore exerts a
suction force-pump action in removing tears from the lacrimal lake as well as
emptying them into the nasal cavity (Cohen et al., 2006). Lacrimation is induced by
reflex action through the stimulation of nerve endings of the cornea or conjunctiva.
7
The reflex could be abolished by anaesthetization of the surface of the eye and by
disorders affecting its nerve components (Cohen et al., 2006).
The cul-de-sac is free of pathogenic organisms and is sterile. The sterility is due to
the action of lysozyme, in the tears, which destroys saprophytic organisms but has
little action against pathogens. Certain diseases cause the lacrimal gland, to undergo
involution, resulting in scanty lacrimal fluid production and a change in the
conjunctival glands also leads to changes in the amount of the secretions. This may
lead to symptoms of dryness, burning and general discomfort and may interfere with
visual acuity (Kaur & Kanwar, 2002).
Precorneal film: The precorneal film is composed of a thin outer lipid layer, a thicker
middle aqueous layer, and a thin inner mucoid layer. It is renewed during each blink,
and when blinking is suppressed, either by drugs or by mechanical means, it dries in
patches. The precorneal film is unaffected by the addition of concentrations of up to
2% sodium chloride into the conjunctiva. The precorneal film, which is part of the
tear fluid, maintains the cornea’s moist surfaces and its functionality depends on the
condition of the corneal epithelium. A pH below four or above nine causes
derangement of the film (Grosvenor, 2007).
Cornea: The cornea has a thickness of 0.5 to 1 mm and consists mainly of the
following structures (from the front backward): Corneal epithelium, subtantia propia
(stroma), corneal endothelium. The cornea is transparent to visible light due to the
special laminar arrangement of the cells and fibres and because of the absence of
blood vessels (Chien & Schoenwald, 1990). Cloudiness of the cornea may be due to
several factors including excess pressure in the eyeball as in glaucoma, and scar
tissue due to injury, infection, deficiency of oxygen or excess hydration such as may
occur during the wearing of improperly–fitted contact lenses. Trauma to the cornea
usually heals as an opaque patch that can permanently impair vision unless it is
located in the periphery of the cornea (Kaur et al., 2003).
The outer surface of the cornea is most responsible for the refraction of light
whereby the index of refraction changes from that of air (1.00) to that of precorneal
substance (1.38). Alteration in its shape or transparency interferes with the formation

8
of a clear image; therefore any pathological process, however little, may seriously
interfere with the resolving power or visual acuity of the eye (Lang et al., 2005).
The normal cornea possesses no blood vessels except at the corneoscleral junction.
The cornea derives its nutrition from the aqueous humour by diffusion and has
certain permeable characteristics. It also receives nourishment from the fluid
circulating through the chambers of the eye and from the air. The corneal epithelium
provides an efficient barrier against bacterial invasions due to its poor blood supply.
Foreign bodies that either scratch the cornea or lodge or become embedded in the
cornea are of serious concern, as the presence of any of these could play a role in
permitting pathogenic bacteria to gain access to the cornea. Trauma plays an
important part in most of the infectious diseases of the cornea that occurs
exogenously (Ghosh & Jasti, 2005).
Corneal absorption: The cornea is a membrane having both hydrophilic and
lipophilic layers. It is composed of three general layers: the lipid–rich epithelium, the
lipid-poor stroma, and the lipid rich endothelium. The combined lipid content of the
corneal epithelium and the corneal endothelium approximately 100 times more than
the lipid content of the corneal stroma. Modern ocular drug delivery system designs
are based on an understanding of drug deposition pathways within the relative lipid
content of these layers and their overall ocular pharmacokinetic/pharmacodynamic
profile (Curtin & Cormican, 2003). Only drugs having both lipid and hydrophilic
properties have the greatest corneal penetration. Highly water–soluble drugs
penetrate less readily. For example, highly water–soluble steroid phosphate esters
penetrate the cornea poorly and for better penetration to be attained a poorly soluble
but more lipophilic steroid alcohol is used (Holladay, 2006).
Eye drops penetrate the eye primarily through the cornea. Typical drug penetraton
occurs as follows:
a) The drug molecule as a free base and the salt will be in an equilibrium
depending on the drugs physicochemical characteristics and the pH.

9
b) If the formulation is slightly acidic at the moment of instillation, the acidity is
neutralised by the lacrimal fluid which converts it rapidly to the physiological
pH range ( pH 7.4).
c) There will be sufficient free base to begin penetration of the corneal
epithelium at this pH. An undissociated drug molecule will penetrate the
stroma, epithelium, and endothelium because it is water–soluble.
d) The dissociated drug leaves the endothelium for the aqueous humour, as it
can readily diffuse to the iris, the ciliary body, and the site of the
pharmacological actions (Nanjawade et al., 2007).
Martini and colleagues (1997) discussed the implications of the mechanism of
precorneal drug loss in the design of ocular drug-delivery systems, including the
effect of instilled drug volume on aqueous humour concentrations and the amount of
drug available for systemic absorption. Ideally, smaller volumes permit more drugs
to be absorbed. For a given instilled concentration the opposite is true; however, a
smaller volume instilled remains more efficient (Friedrich et al., 1993).
There are two types of corneal penetrations: transcorneal and non-corneal
absorption (Nanjawade et al., 2007). Lang and colleagues (2005) stated that the
transcorneal route of absorption of a drug into the eye is the route most effective in
bringing a given drug to the anterior portion of the eye. This is enhanced by the
water-lipid gradient found in the cornea.
Drugs penetrate the corneal epithelium with the use of transcellular or paracellular
pathways which are both types of transcorneal penetration. Transcellular and
paracellular pathways are used by both lipophilic and hydrophilic drugs; these
pathways involve passive diffusion or modified diffusion through intercellular spaces
and most topically–applied drugs diffuse passively along their concentration gradient.
However, the stereospecific carrier–mediated transport system is used by certain
drugs as their mode of transport such as l-lysine which makes use of the Na+ –K+ –
ATPase pump as medium of transport in the cornea (Urtti, 2006). Physicochemical
properties of drugs have properties such as lipophilicity, solubility, molecular size
and shape, charge and degree of ionization affects the route and rate of permeation
in the cornea (Järvinen et al., 1995). The hydrophilic drugs are rate–limited by the

10
lipophilic corneal epithelium, while lipophilic drugs partitioning from the epithelium to
the hydrophilic stroma are rate limiting (Järvinen et al., 1995).
Non-corneal absorption pathways involve the penetration of drug across the bulbar
conjunctiva and sclera into the uveal tract and vitreous humour. The conjunctiva and
sclera provide a route for large hydrophilic molecules for example inulin and p-
aminoclonidine (Nanjawade et al., 2007; Lang et al., 2005).
The cornea can be penetrated by small ions through extracellular spaces to a
measurable degree. The diameter of the largest particles that can pass across the
cellular layers is in the range of 10 to 25 Å. Permeation of instilled drugs can also be
reduced by protein binding in the tear fluid and metabolic degradation by enzymes.
There are numerous drug metabolizing enzymes present in the cornea like
esterases, peptidases, reductases and cytochrome P (CYP) family enzymes among
others (Gaynes & Fiscella, 1996; Mashkevisch, 2007). Enzymes help in drug
detoxification and metabolism. These enzymes also maintain ocular homeostasis by
preventing environmental and systemic injuries (Mashkevisch, 2007). Martini and
colleagues (1997) concluded that the following are responsible for precorneal drug
loss in a descending order: drainage vasodilation > nonconjunctival loss > induced
lacrimation conjunctival absorption > normal tear turnover.
2.2 Pathophysiology of the eye
Ocular manifestation of allergy in which the body produces hypersensitivity to
normally harmless substances (allergens) is classified to be an allergic eye disease.
Allergy prevalence in Europe is between 15 and 20%; by 2015 the rates are
estimated to increase to 50% which is about 20% more (Bilkhu et al., 2011).
Improved hygiene practices and increased antibiotic use by modern day lifestyle in
addition to environmental factors such as increased air pollution, climate change and
increased planting and importation of allergenic plant species have been reported to
increase the allergy prevalence, although genetics plays an important role in
susceptibility (Bilkhu et al., 2011).

11
Seasonal allergic conjunctivitis (SAC) is the most common form of allergic eye
disease that constitutes of 90% of the allergy cases with perennial allergic
conjunctivitis at 5% (Bielory, 2008). SAC is most frequently caused by grass, tree
and weed pollens and outdoor moulds which peak at different times of the year
(Bielory, 2008; Chigbu, 2009), often as part of seasonal rhinoconjunctivitis (hay
fever). However, PAC occurs year round due to house dust mites, animal dander,
insects and indoor moulds (Chigbu, 2009). The signs and symptoms of SAC develop
gradually but sometimes it can develop suddenly in contact with an offending
allergen (Bielory, 2000 & Bielory 2008). Some of the signs and symptoms of SAC
includes itching, tearing, eyelid oedema and conjunctival hyperaemia, chemosis and
papillary reaction in which the severity often varies with pollen counts (Cox, 2007).
PAC and SAC have similar signs and symptoms but differ as PAC is milder and
chronic in nature and may have seasonal exacerbations (Bielory, 2008 & Buckley,
1998). The impact of allergic eye disease on the quality of life can be profound even
though the signs of symptoms of SAC and PAC are relatively mild (Bielory, 2006). It
affects daily activities, productivity at work, school performance and the
economy (Pitt et al., 2004; Smith et al., 2005; Palmares et al., 2010). The severities
of presentation limits the complications of SAC and are linked to steroid use in cases
refractory to conventional treatment (Hingorani and Lightman, 1995; Joss & Craig,
1998; Bielory et al., 2010). The treatments provided for SAC are mainly for
preventing and alleviating symptoms rather than cure due to the fact that no cure has
been found or produced for SAC or any allergy. However, immunotherapy shows
promise (Bielory, 2008).
The pathophysiological mechanism of acute ocular allergy involves acute antibody
(immunoglobulin E (IgE))-mediated mast cell degranulation and minimal presence of
migratory inflammatory cells. In chronic ocular allergy, the pathophysiology consists
of persistent activation of mast cells and eosinoiphil–T–lymphocyte-mediated
delayed-type hypersensitivity (DTH) response. Antigen-specific antibodies, such as
IgG and IgE contribute to the pathogenesis of Th2-mediated diseases including
allergies. IgE and IgG receptors are expressed on mast cells and as such IgE and
IgG may participate in mast cell activation and mediator release. Antibody (IgE or
IgG, particularly of the IgG1 isotype–mediated–mast cell activation results in
degranulation, with the release of pre-formed and newly formed pro-inflammatory
12
mediators as well as the secretion of chemokines and cytokines (Tkaczyk et al.,
2002).
Both SAC and PAC are IgE-mast cell mediated hypersensitivity reactions, divided
into two phases with the mast cell playing a central role (Bacon et al., 2000; Choi &
Bielory 2008). The reaction involves a very complex series of immunological events
coordinated by various mediators initiated by an allergen (Ono & Abelson, 2005 ;
Hodges & Kean–Myers, 2007) An allergen such as pollen reacts with specific IgE
antibodies bound to a sensitised mast cell, triggering cross linkage of the IgE
molecules and an influx of calcium ions into the mast cell. This causes the mast cell
to degranulate and release preformed inflammatory mediators such as histamine
which cause the signs and symptoms associated with the early phase response in
sensitised individuals. The early phase response is immediate and lasts clinically for
20–30 minutes (Leonardi et al., 2008).
With increasing knowledge of the pathophysiology/underlying mechanisms of allergic
eye disease, there has been a rapid and large increase in the number of
pharmacological anti–allergic medications available for treatment. Several authors
have pointed out that ocular allergies have been under-diagnosed and under-treated,
in particular seasonal allergic conjunctivitis where the ocular symptoms fall under the
umbrella of seasonal hay fever which may underestimate its true prevalence (Cox,
2007; Bielory, 2008; Berdy & Berdy, 2009). A recent study by Wolffsohn and
colleagues (2011) highlighted the current poor management of ocular allergies,
where patients often self-medicate and rarely undergo an ophthalmic examination.
Due to the increasing prevalence of allergy, allergic eye disease is becoming more
common and combined with its impact on the quality of life and inadequate
management, it is important for practitioners to identify these patients in order to
manage them appropriately.
Mast cell degranulaion also initiates a series of cellular and extracellular events
which lead to the late phase response, including production of prostaglandins,
thromboxanes and leukotrienes derived from arachidonic acid. Mast cells also
release cytokines and chemotactic factors which induce the production of IgE from
B-cells, enhance production of Th2-lymphocytes, attract eosinophils and activate

13
vascular endothelial corneal and conjunctival cells to release chemokines and
adhesion molecules. The chemokines and adhesion molecules mediate the
infiltration of eosinophils, basophils, neutrophils and Th2-lymphocytes to the site of
inflammation and coupled with the newly formed mediators and sustained mast cell
activation they result in the late phase response (Stahl et al., 2002). This may occur
3–12 hours after the initial reaction and symptoms can continue up to 24 hours. The
year round symptoms associated with PAC are the result of chronic mast cell
activation and Th2-lymphocyte infiltration (Bonini et al., 1989).
The most important and most effective step in treating allergic eye disease is
avoiding the offending allergen to prevent the hypersensitivity reaction from being
triggered. This necessitates the identification of the offending allergen and complete
avoidance is not always possible (Friedlaender, 2001). In SAC a detailed history is
essential as knowledge of the period of time of year symptoms occur can allow
identification using a pollen calendar to some extent but peak levels of common
causative pollens often overlap. However, effective measures for allergen avoidance
in SAC and PAC are based upon control of the environment. Given that pollens are
the main cause of SAC, preventative measures include limiting outdoor activity
during the symptomatic period, closing windows and using air conditioning when in a
car or indoors, avoid touching/rubbing eyes after being outdoors, wash hands after
being outdoors and wearing close fitting or wrap around style sunglasses when
outdoors (Veys, 2004). As PAC can affect the patient all year round, more thorough
avoidance measures are necessary. Dust mite levels in the home can be reduced by
using and regularly replacing protective pillow, mattress and duvet covers; washing
bedding regularly at least at 60 °C; vacuum and damp dust entire house on weekly
basis; reduce humidity to between 35 and 50% and remove or regularly clean
carpets, upholstery, curtains and any other areas that gather dust (Gotzche &
Johansen, 2008; Scheikh et al., 2010). Animal dander can be reduced by eliminating
all pets/animals from the home or keep them outdoors; regular vacuuming;
minimising exposure to areas that gather animal dander; avoid touching animals;
washing hands and avoid eye touching/rubbing after contact with animals; and
washing all clothes that have come into contact with animals (Eggleston & Wood,
1992; Bush, 2008).

14
Despite implementing these avoidance measures, complete avoidance is not always
possible so use of anti–allergic medication may become necessary to prevent and
alleviate symptoms. With increased knowledge of the pathophysiology of the
hypersensitivity reaction in SAC and PAC over the years, there has been a rapid
increase in the number of anti-allergic medications that target the immunological
cells and inflammatory mediators involved in the allergic expression. Ophthalmic
anti-allergic medications include topical mast cell stabilisers, antihistamines,
vasoconstrictors (phenylephrine hydrochloride), antihistamine–vasoconstrictor
combinations and dual action agents with mast cell stabilising and antihistaminic
properties (Schultz, 2006).
Studies on the ocular use of phenylephrine hydrochloride started in 1933 and were
first reported in 1936 (Greaves et al., 1992). The present research or study is based
on the insight into phenylephrine hydrochloride and its properties.
2.3 Phenylephrine hydrochloride and its ocular uses
2.3.1 Phenylephrine hydrochloride
Phenylephrine is a sympathomimetic drug, used to relieve pain associated with
complicated uveitis, allergic conditions, reduce posterior synechiae formation, and
induce mydriasis, and as a topical spray into the ear to reduce the pressure in the
Eustachsian tube (Johnson et al., 2008; Ahmed and Amin, 2007). Some of the
commonly found salts are: phenylephrine hydrochloride; phenylephrine acid tartrate;
phenylephrine bitartrate; phenylephrine tannate and phenylephrine tartrate
(Sweetman, 2002). Phenylephrine oxazolidine, which is an ester of phenylephrine,
has been found to provide longer retention time with lower plasma levels, thereby
reducing chances of side effects like increased blood pressure. There is no salt form
for phenylephrine oxazolidine (Rautio et al., 2008).
Phenylephrine hydrochloride was used in this study due to its pharmaceutical
stability and availability (Trommer et al., 2010). The following discussion will
therefore be limited to phenylephrine hydrochloride.
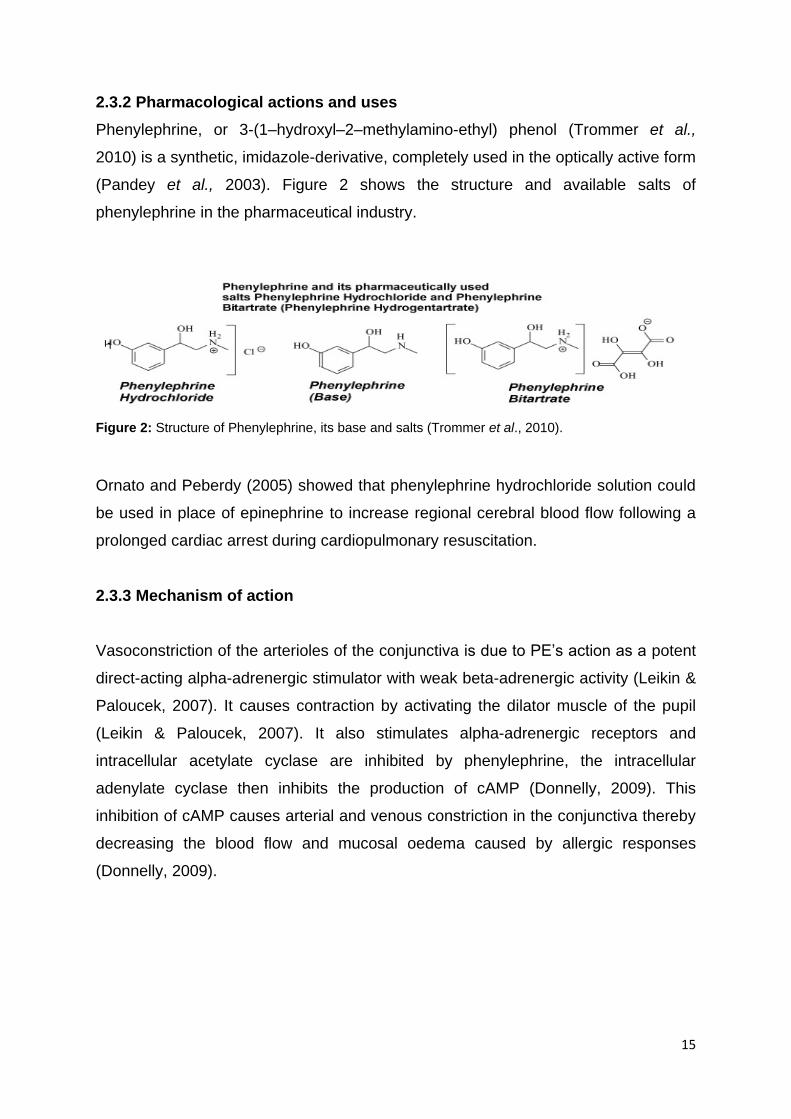
15
2.3.2 Pharmacological actions and uses
Phenylephrine, or 3-(1–hydroxyl–2–methylamino-ethyl) phenol (Trommer et al.,
2010) is a synthetic, imidazole-derivative, completely used in the optically active form
(Pandey et al., 2003). Figure 2 shows the structure and available salts of
phenylephrine in the pharmaceutical industry.
Figure 2: Structure of Phenylephrine, its base and salts (Trommer et al., 2010).
Ornato and Peberdy (2005) showed that phenylephrine hydrochloride solution could
be used in place of epinephrine to increase regional cerebral blood flow following a
prolonged cardiac arrest during cardiopulmonary resuscitation.
2.3.3 Mechanism of action
Vasoconstriction of the arterioles of the conjunctiva is due to PE’s action as a potent
direct-acting alpha-adrenergic stimulator with weak beta-adrenergic activity (Leikin &
Paloucek, 2007). It causes contraction by activating the dilator muscle of the pupil
(Leikin & Paloucek, 2007). It also stimulates alpha-adrenergic receptors and
intracellular acetylate cyclase are inhibited by phenylephrine, the intracellular
adenylate cyclase then inhibits the production of cAMP (Donnelly, 2009). This
inhibition of cAMP causes arterial and venous constriction in the conjunctiva thereby
decreasing the blood flow and mucosal oedema caused by allergic responses
(Donnelly, 2009).
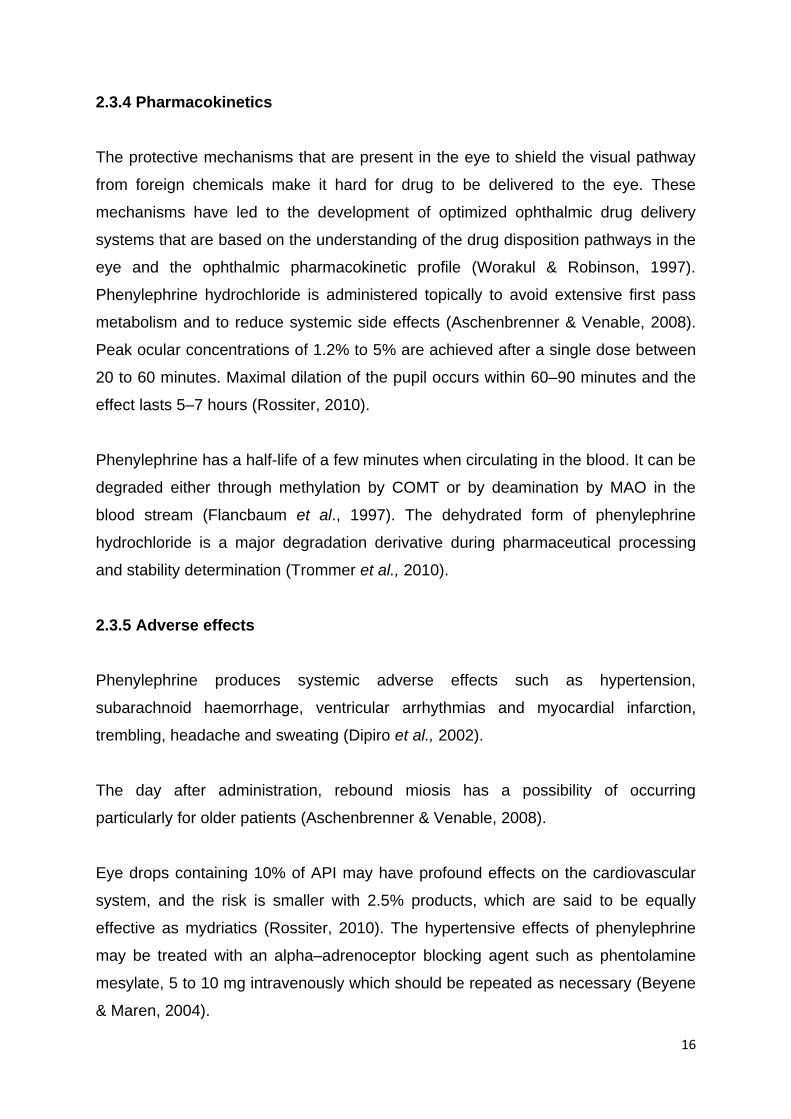
16
2.3.4 Pharmacokinetics
The protective mechanisms that are present in the eye to shield the visual pathway
from foreign chemicals make it hard for drug to be delivered to the eye. These
mechanisms have led to the development of optimized ophthalmic drug delivery
systems that are based on the understanding of the drug disposition pathways in the
eye and the ophthalmic pharmacokinetic profile (Worakul & Robinson, 1997).
Phenylephrine hydrochloride is administered topically to avoid extensive first pass
metabolism and to reduce systemic side effects (Aschenbrenner & Venable, 2008).
Peak ocular concentrations of 1.2% to 5% are achieved after a single dose between
20 to 60 minutes. Maximal dilation of the pupil occurs within 60–90 minutes and the
effect lasts 5–7 hours (Rossiter, 2010).
Phenylephrine has a half-life of a few minutes when circulating in the blood. It can be
degraded either through methylation by COMT or by deamination by MAO in the
blood stream (Flancbaum et al., 1997). The dehydrated form of phenylephrine
hydrochloride is a major degradation derivative during pharmaceutical processing
and stability determination (Trommer et al., 2010).
2.3.5 Adverse effects
Phenylephrine produces systemic adverse effects such as hypertension,
subarachnoid haemorrhage, ventricular arrhythmias and myocardial infarction,
trembling, headache and sweating (Dipiro et al., 2002).
The day after administration, rebound miosis has a possibility of occurring
particularly for older patients (Aschenbrenner & Venable, 2008).
Eye drops containing 10% of API may have profound effects on the cardiovascular
system, and the risk is smaller with 2.5% products, which are said to be equally
effective as mydriatics (Rossiter, 2010). The hypertensive effects of phenylephrine
may be treated with an alpha–adrenoceptor blocking agent such as phentolamine
mesylate, 5 to 10 mg intravenously which should be repeated as necessary (Beyene
& Maren, 2004).
17
2.3.6 Drug interactions
Phenylephrine may produce severe hypertension and cardiac arrhythmias when
used concurrently with beta blockers or other antihypertensive (for example
reserpine) and, tricyclic antidepressants. Mono amine oxidase inhibitors increase
pressor effects of phenylephrine which potentiates the risk of hypertensive crisis
(Pray, 2006).
2.3.7 Bioavailability
The average human being has a tear volume of 7 µL while the cul-de-sac has a
maximum capacity of about 30 µL. Many ophthalmic formulations range from 50 to
75 µL in volume; however, volumes in excess of 50 µL are probably unable to enter
the cul-de-sac (Greaves et al., 1992). Systemic absorption occurs through solution
drainage into the nose, which causes the loss of an instilled drug as shown in Figure
3 (Jarvinen et al., 1995).
Figure 3: Diagram of Ocular Absorption (Nanjawade et al., 2007).
The equation describing the above processes in terms of drug concentration is:
Drug in tear fluid
Ocular absorption (5% of the dose)
Systemic absorption (50-100% of the dose) -Conjunctiva of the eyes -Nose Minor routes: -Larcrimal drainage system -pharynx GI-tract -Skin at the cheek and lids -Aqueous humour -Inner ocular tissues
Corneal route
- 1 route - Small, lipophilic drugs
Conjunctival and Scleral route -Large, hydrophilic drugs
Aqueous humour
Ocular tissues

18
Where F is the fraction of dose absorbed, D is the dose, k and K are absorption and
elimination rate constants, respectively, and V, is the apparent volume of distribution
(Lee & Robinson, 1979; Worakul &Robinson, 1997; Lee & Robinson, 1986).
An ideal eye drop preparation possesses a high concentration of drug in a minimum
drop volume. Martini and partners (1997) reported that equal tear-film concentrations
were obtained whether either 5 µL of 1.61 x 10¹⁰ M or 25 µL of 1.0 x 10¹⁰ M
pilocarpine nitrate solution were administered. The higher bioavailability of the 5 µL
solution was due to decreased drainage loss. However, there is a practical limitation
to the minimum dosage volume used. Dropper configuration that delivers small
volumes poses difficulties in its design and patients often cannot sense or detect the
administration of volumes in the 5.0 to 7.5 µL dose volume ranges (Martini et al.,
1997).
2.3.7.1 Reasons for poor ocular bioavailability
The most common method for the administration of therapeutic treatment for ocular
diseases is the topical delivery of eye drops. The rapid elimination of drugs from the
precorneal lachrymal fluid by solution drainage, lachrymation, and poor absorption
by the conjunctiva creates problems for topical delivery (Bartlett & Jaanus, 2008).
The eye has the ability to permanently maintain its residence volume at 7–10 µL due
to high drainage rate. The volumes instilled with eye drops range from 20–50 µL,
therefore the residence time of solutions is limited to a few minutes, causing the
overall absorption of a topically applied drug to be limited to 1–10% (Felt et al.,
1999).
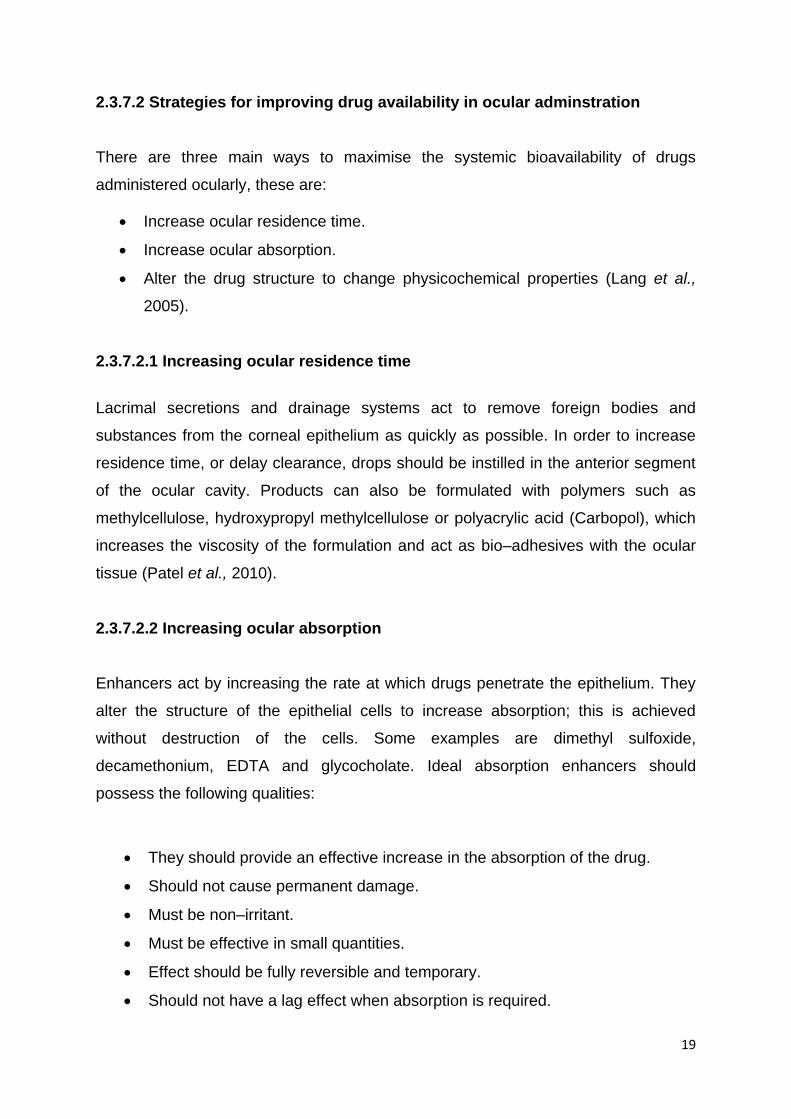
19
2.3.7.2 Strategies for improving drug availability in ocular adminstration
There are three main ways to maximise the systemic bioavailability of drugs
administered ocularly, these are:
Increase ocular residence time.
Increase ocular absorption.
Alter the drug structure to change physicochemical properties (Lang et al.,
2005).
2.3.7.2.1 Increasing ocular residence time
Lacrimal secretions and drainage systems act to remove foreign bodies and
substances from the corneal epithelium as quickly as possible. In order to increase
residence time, or delay clearance, drops should be instilled in the anterior segment
of the ocular cavity. Products can also be formulated with polymers such as
methylcellulose, hydroxypropyl methylcellulose or polyacrylic acid (Carbopol), which
increases the viscosity of the formulation and act as bio–adhesives with the ocular
tissue (Patel et al., 2010).
2.3.7.2.2 Increasing ocular absorption
Enhancers act by increasing the rate at which drugs penetrate the epithelium. They
alter the structure of the epithelial cells to increase absorption; this is achieved
without destruction of the cells. Some examples are dimethyl sulfoxide,
decamethonium, EDTA and glycocholate. Ideal absorption enhancers should
possess the following qualities:
They should provide an effective increase in the absorption of the drug.
Should not cause permanent damage.
Must be non–irritant.
Must be effective in small quantities.
Effect should be fully reversible and temporary.
Should not have a lag effect when absorption is required.

20
Should be stable (Saettone et al., 1996; Patel et al., 2010).
2.3.7.2.3 Altering drug structure
Modifications to a drug molecule are usually done to achieve certain
physicochemical properties in order to, amongst others, increase aqueous solubility
and improve partitioning. Caution should be applied in drug modification as it could
pose the risk of changing a drug’s therapeutic and toxicological profile. Subsequent
changes in salts or molecules could result in increased costs and lengthy
investigations due to regulatory requirements. Some factors that have been found to
influence drug absorption are its weight and pH (Krishnamoorthy & Mitra 1998).
Molecular size and weight: Ocular absorption of small compounds, approximately
100 Daltons, is higher, (around 80%), when compared to oral absorption. This
however reduces markedly as the molecular weight increases. There is a restriction
to the molecular weights that can pass through pathways and channels (molecular
weight cut–off) as only molecules that are smaller than the channels can diffuse
through them (Akiba et al., 1993).
The effect of pH and the partition coefficient: The partition coefficients of drugs
are dependent upon environmental pH which affects the ionization of drugs (local pH
can be modified by ocular formulation). The rate of absorption is increased when the
drug or substance is un–ionized. The movement of ionizable drugs through
membranes depends on the chemical equilibrium between ionized and unionized
drug in the eye drop and the lacrimal fluid (Geroski & Edelhauser, 2000). The ionized
form does not easily penetrate the lipid membrane compared to the unionized
molecule. The partitioning of ionized molecule does not only depend on the degree
of ionization but also on the charge of the molecules (Liaw et al., 1992). The corneal
epithelium is negatively charged (isoelectric point is pI 3.2), and as a result,
hydrophilic–charged cationic substances permeate easily through the cornea than
anionic compounds (Liaw et al., 1992). Compounds below pI 3.2 are negatively-
charged and pass through the cornea making the pH too acidic, and irritating for
clinical use. Consequently, in practice, charge–discriminating effects of the corneal

21
epithelium decrease the absorption of negatively charged compounds (Rojanasakul
& Robinson, 1989; Conroy & Maren, 1995; Taylor, 2002; Lee & Robinson, 2009;
Hecht, 2000).
2.3.8 Polymorphism and pseudomorphism of phenylephrine hydrochloride
A polymorph is a solid substance with the ability to crystallize in at least two different
crystal structures that produce distinct crystal species. Polymorphism is important in
the drug development process as it can affect drug dissolution, chemical stability, as
well as drug bioavailability (Yoshihashi et al., 2002). Polymorphs are the collection of
different crystal structures that can exist for a single chemical entity and its hydrates.
The difference between a solvate and polymorph is that a solvate contains different
quantities of solvent trapped within the crystal structure (as is the case for
MgSO4.7H2O and MgSO4.10H2O) and polymorphism is when there is no solvent
trapped in the crystal structure and the same chemical species are found in various
crystal structures. Solvates or false polymorphs are called pseudopolymorphs.
Pseudopolymorphs can be obtained by changing the recrystallizing solvent.
Common solvents used to induce polymorphic change are water, methanol, ethanol,
and acetone and chloroform (Lee et al., 2006). Phenylephrine hydrochloride does
not exhibit polymorph or solvate forms, its chemical stability will therefore not be
hampered when dissolved in solvents like water and glycerol (Yoshihashi et al.,
2002).
2.4 Ophthalmic formulations
Eye drops are sterile products, free from foreign particles, compounded and
packaged for ocular drug delivery. Eye drops can be prepared as single or multidose
products (Van Santvliet & Ludwig, 2004).
Compared to the buccal, nasal, rectal, vaginal or dermal routes, eye drops are easier
to use, non-invasive, accurate and less expensive for systemic delivery of drugs
(Pillion et al., 1994). The ocular route helps eliminate painful parenteral injections or
gastro-intestinal degradation (Chiou et al., 1991 and Pillion et al., 1994).

22
Absorption of the eye drops across the mucosa in the nasal cavity that is near to the
conjunctival sac helps eye drops with active pharmaceutical ingredients reach the
bloodstream (Winfield et al., 2009). Physicochemical drug properties, such as
lipophilicity, solubility, molecular size and shape (Huang et al., 1989; Liaw &
Robinson, 1992), charge (Rojanasakul et al., 1992; Liaw et al., 1992) and degree of
ionization (Brechu & Maren, 1993) affect the route and rate of permeation in the
cornea.
Drugs can be absorbed through the naso-lacrymal system and reach systemic
circulation without passing metabolism by the liver only if there is (a) drainage loss of
topically-applied solutions,(b) increase in bioavailability of the instilled drug (Saettone
et al., 1984), and (c) an increase in viscosity (Flach, 2002). Mild to severe side
effects may therefore be observed. The phenomenon has led to the reduction in the
size of eye drops (Saettone et al., 1984; Ludwig & Van Ooteghem, 1989; Salminen,
1990; Flach, 2002).
2.4.1 Eye drops as an ophthalmic dosage form
Liquid formulations (eye drops and eye lotions), semisolids (creams, ointment and
gels), solids (biodegradable implants) are various ophthalmic dosage forms used to
deliver therapeutic agents topically (Kaur & Kanwar, 2002). Eye drops are
conventional dosage forms that account for 90% of the currently accessible
ophthalmic formulations. Eye drop solutions are common dosage form as they offer
advantages like administrations, easy preparation and low costs. Eye drops also
have some disadvantages like short contact time with ophthalmic surface and
nasolacrimal drainage which causes poor bioavailability of the drug (Ali &
Lehmussaari, 2006). Ophthalmic delivery systems are being investigated in order to
increase the corneal permeability and prolong the contact time with the ocular
surface through the addition of viscosity modifying agents such as hydroxypropyl
methylcellulose, carboxy methylcellulose sodium and other cellulose derivatives
(Gad, 2008).
Suspensions are defined as the dispersion of finely divided, relatively insoluble drug
substances in aqueous vehicle containing suitable suspending and dispersing
agents (Hecht, 2000). Due to the tendency of particles being retained in the cul-de-
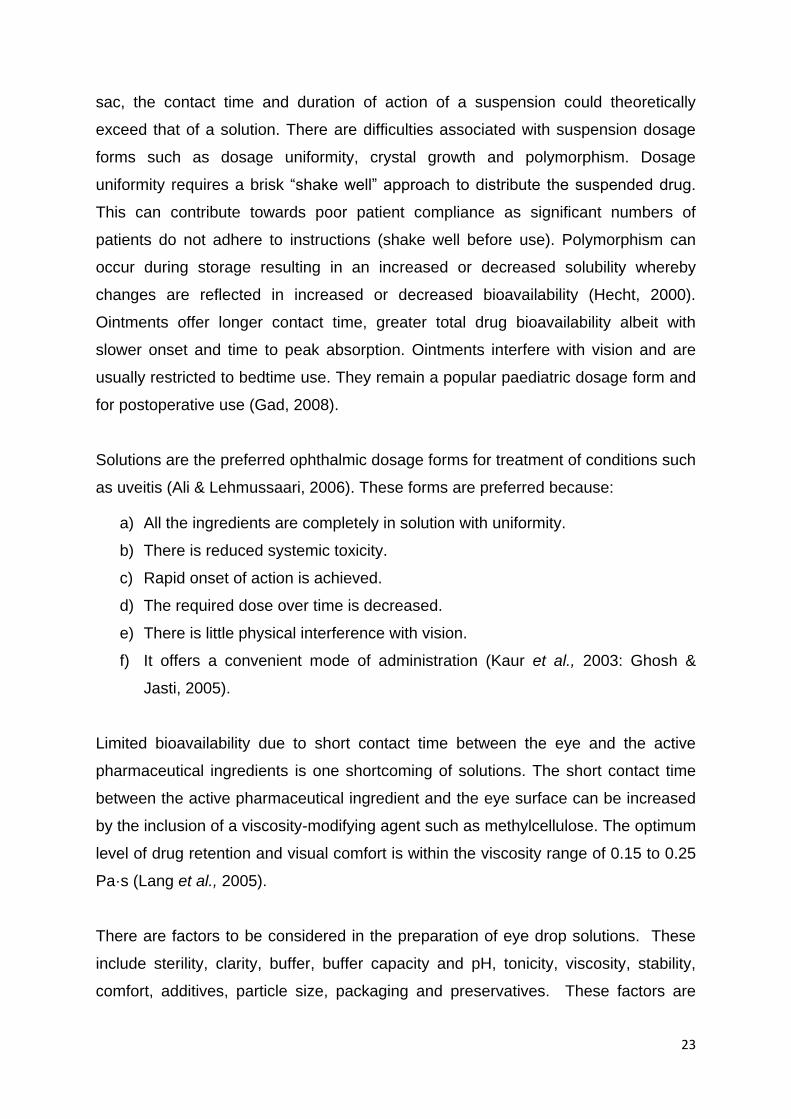
23
sac, the contact time and duration of action of a suspension could theoretically
exceed that of a solution. There are difficulties associated with suspension dosage
forms such as dosage uniformity, crystal growth and polymorphism. Dosage
uniformity requires a brisk “shake well” approach to distribute the suspended drug.
This can contribute towards poor patient compliance as significant numbers of
patients do not adhere to instructions (shake well before use). Polymorphism can
occur during storage resulting in an increased or decreased solubility whereby
changes are reflected in increased or decreased bioavailability (Hecht, 2000).
Ointments offer longer contact time, greater total drug bioavailability albeit with
slower onset and time to peak absorption. Ointments interfere with vision and are
usually restricted to bedtime use. They remain a popular paediatric dosage form and
for postoperative use (Gad, 2008).
Solutions are the preferred ophthalmic dosage forms for treatment of conditions such
as uveitis (Ali & Lehmussaari, 2006). These forms are preferred because:
a) All the ingredients are completely in solution with uniformity.
b) There is reduced systemic toxicity.
c) Rapid onset of action is achieved.
d) The required dose over time is decreased.
e) There is little physical interference with vision.
f) It offers a convenient mode of administration (Kaur et al., 2003: Ghosh &
Jasti, 2005).
Limited bioavailability due to short contact time between the eye and the active
pharmaceutical ingredients is one shortcoming of solutions. The short contact time
between the active pharmaceutical ingredient and the eye surface can be increased
by the inclusion of a viscosity-modifying agent such as methylcellulose. The optimum
level of drug retention and visual comfort is within the viscosity range of 0.15 to 0.25
Pa·s (Lang et al., 2005).
There are factors to be considered in the preparation of eye drop solutions. These
include sterility, clarity, buffer, buffer capacity and pH, tonicity, viscosity, stability,
comfort, additives, particle size, packaging and preservatives. These factors are

24
interrelated and assessed collectively in the preparation of an eye drop product. The
buffer system is considered along with tonicity and comfort. Stability of the eye drop
product depends on pH, buffer system, and packaging. Viscosity-modifying agents
which may or may not be present should not affect the therapeutic effectiveness of
the active ingredient (Lang et al., 2005).
The pH and buffer capacity is a compromise between stability of the drug and
comfort in the eye. Optimum patient comfort is found at the pH of the tear fluid, or at
7.4 pH, while optimum stability for many drugs is lower than 5 pH. Buffers are
therefore needed to maintain the desired pH for drug stability and allow it to be
altered to 7.4 immediately after instillation in the eye (Aulton, 2002).
Table 1: Conventional dosage forms and usage (Lang, 1995).
Formulation Number %
Gels 2 0.7
Injectables 11 3.8
Inserts 11 3.8
Ointments 50 17.4
Orals 9 3.1
Solutions 179 62.4
Suspensions 25 8.7
2.4.2 Eye drop formulation characteristics
2.4.2.1 Clarity
Eye drop solutions should be clear which is achieved by filtration. Filtration
equipment, which has a pore size of 0.45 µm, must be sterile particle free so that
particulate matter is not found in the solution by equipment designed to remove it.
Sterile techniques must be performed in clean surroundings: and using laminar-flow
hoods and proper garments will aid in preparing solutions free from foreign particles.
With sophisticated machines clarity and sterility can be achieved in the same
filtration step. It is important to note that solution clarity is equally dependent on the
cleanliness of the intended container and closure. Both container and its closure
must be sterile. This means that the container or closure must not contribute
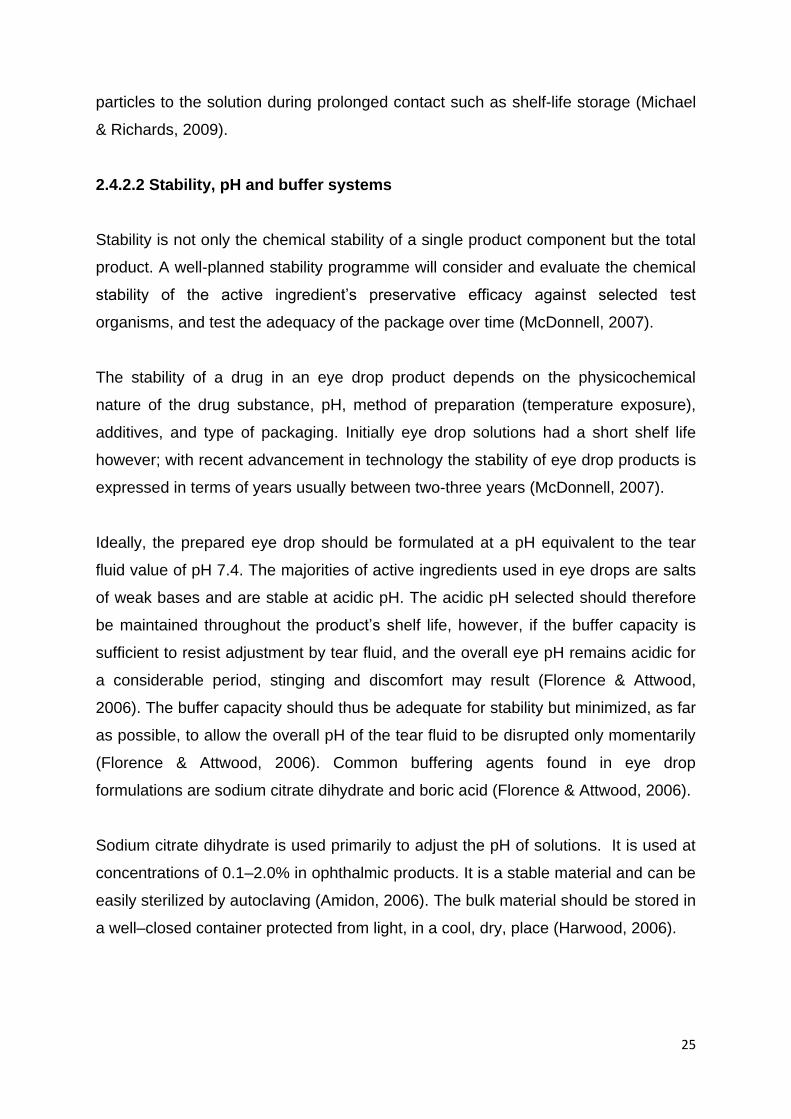
25
particles to the solution during prolonged contact such as shelf-life storage (Michael
& Richards, 2009).
2.4.2.2 Stability, pH and buffer systems
Stability is not only the chemical stability of a single product component but the total
product. A well-planned stability programme will consider and evaluate the chemical
stability of the active ingredient’s preservative efficacy against selected test
organisms, and test the adequacy of the package over time (McDonnell, 2007).
The stability of a drug in an eye drop product depends on the physicochemical
nature of the drug substance, pH, method of preparation (temperature exposure),
additives, and type of packaging. Initially eye drop solutions had a short shelf life
however; with recent advancement in technology the stability of eye drop products is
expressed in terms of years usually between two-three years (McDonnell, 2007).
Ideally, the prepared eye drop should be formulated at a pH equivalent to the tear
fluid value of pH 7.4. The majorities of active ingredients used in eye drops are salts
of weak bases and are stable at acidic pH. The acidic pH selected should therefore
be maintained throughout the product’s shelf life, however, if the buffer capacity is
sufficient to resist adjustment by tear fluid, and the overall eye pH remains acidic for
a considerable period, stinging and discomfort may result (Florence & Attwood,
2006). The buffer capacity should thus be adequate for stability but minimized, as far
as possible, to allow the overall pH of the tear fluid to be disrupted only momentarily
(Florence & Attwood, 2006). Common buffering agents found in eye drop
formulations are sodium citrate dihydrate and boric acid (Florence & Attwood, 2006).
Sodium citrate dihydrate is used primarily to adjust the pH of solutions. It is used at
concentrations of 0.1–2.0% in ophthalmic products. It is a stable material and can be
easily sterilized by autoclaving (Amidon, 2006). The bulk material should be stored in
a well–closed container protected from light, in a cool, dry, place (Harwood, 2006).

26
Boric acid is odourless, colourless and greasy to the touch. It has weak bacteriostatic
and fungistatic properties. It is commonly used as a buffer and antimicrobial in eye
drops at concentrations of 1.22%. Boric acid volatilizes in steam (Stewart, 2004).
Oxygen sensitivity is an important factor to be considered as certain active
ingredients may require the inclusion of an antioxidant (Ansel et al., 2011; Sutton et
al., 1998 and Mitra, 2009).
Phenylephrine hydrochloride is stable at a pH range of 3.5–8. It shows signs of
degradation by changing its clear colour to yellow or brown, when dissolved in
aqueous solutions (Lang et al., 2005).
2.4.2.3 Tonicity
Tonicity refers to the osmotic pressure exerted by salts in aqueous solution. An eye
drop solution is isotonic with another solution when the magnitudes of the colligative
properties of the solutions are equal. An eye drop solution is considered isotonic
when its tonicity is equal to that of a 0.9% sodium chloride solution. The calculation
of tonicity at one time was stressed rather heavily to the detriment of other factors
such as sterility and stability. In actuality the eye is much more tolerant of tonicity
variations than it was formerly thought. The eye tolerates solutions equivalent to a
range of 0.5 to 1.8% sodium chloride (Ansel et al., 2011).
Glycerol is used in ophthalmic pharmaceutical formulations as a tonicity modifying
agent with an antimicrobial and viscosity-modifying functions when used at
concentrations of >20% and 0.5–3% respectively. Glycerol is hygroscopic and not
prone to oxidation by the atmosphere under ordinary storage conditions, but
decomposes on heating, with the evolution of toxic acrolein. Mixtures of glycerol
with water, ethanol, and propylene glycol are chemically stable. Black discolouration
of glycerol occurs in the presence of light on contact with zinc oxide or basic bismuth
nitrate (Price, 2006).

27
2.4.2.4 Viscosity
Medicated eye drops usually have poor bioavailability due to the barrier created by
the precorneal area. The site of absorption is cleared rapidly by protective
mechanisms such as blinking and nasolacrimal drainage (Ali & Lehmussaari, 2006).
This necessitates frequent instillation, increasing side effects associated with the
active pharmaceutical ingredient (Di Colo et al., 2009). There is need therefore to
increase API residence in the eye by increasing or adding the polymer that prolongs
drug contact time with the ocular surface (Wilson, 2004).
Substances such as methylcellulose, polyvinyl alcohol, and hydroxypropyl
methylcellulose can be added to increase viscosity and prolong contact time in the
eye which enhances drug absorption and activity. Viscosity ranging from 0.15 to 0.25
Pa·s significantly improves contact time in the eye. Results tend to plateau beyond
the 0.25 Pa·s as higher viscosity values offer no significant advantage (Winfield &
Richards, 2004).
Hydroxypropyl methylcellulose is a widely used thickening agent in topical
pharmaceutical formulation especially for ophthalmic formulations (Romanelli et al.,
1994) Compared with methylcellulose; hydroxypropyl methylcellulose produces
solutions of greater clarity, with fewer undispersed fibres present, thus making it
preferable for formulations for ophthalmic use. Its concentration is between 0.45-
1.0%w/w (Harwood, 2006).
For an aqueous solution to be prepared, hydroxypropyl methylcellulose should be
dispersed and thoroughly hydrated in about 20–30% of the required amount of water
(Harwood, 2006).The water used should be vigorously stirred and heated to between
80–90 °C and the remaining hydroxypropyl methylcellulose added. Cold water should
be added to produce the required volume (Harwood, 2006).
Aqueous solutions of HPMC are enzyme-resistant, and provide viscosity stability
during long-term storage. However, aqueous solutions are liable to microbial
spoilage and should be preserved with an antimicrobial preservative. When used as
a viscosity-increasing agent in ophthalmic solutions, benzalkonium chloride is

28
commonly used for antimicrobial protection. Aqueous solutions may be sterilized by
autoclaving; the coagulated polymer must be redispersed on cooling by shaking
(Harwood, 2006).
Carboxymethylcellulose sodium is widely used as a topical pharmaceutical
formulation primarily for its viscosity-modifying properties and its concentrations
range between 3–6%. Viscous aqueous solutions are used to suspend powders
intended for topical administration (Parsons, 2006).
Carboxymethylcellulose sodium is a stable hygroscopic material. Under high
humidity conditions carboxymethylcellulose sodium can absorb a large quantity of
water (> 50%). Aqueous solutions are stable between pH 2–10, precipitation can
occur below pH 2 solution and viscosity rapidly increase above pH 10 (Gopferich,
1997). Generally, solutions exhibit maximum viscosity and stability at pH 7–9.
Aqueous solutions may be sterilized by heating although this may results in some
reduction in viscosity. After autoclaving, viscosity is reduced by about 25% although
this reduction is less marked than for solutions prepared from material sterilized in
the dry state. Aqueous solutions stored for prolonged periods should contain an
antimicrobial preservative. The bulk material should be stored in a well-closed
container in a cool, dry, place (Parsons, 2006).
Viscosity-increasing agents are extensively used in the formulation of many
pharmaceuticals. In solution formulations, cellulose derivatives are used most
frequently. As increased viscosity can offer both advantages and disadvantages with
respect to use of the preparation, therefore, knowledge of viscosity and flow
properties is important in selecting appropriate ingredients. If sterility of the
preparation is required, the alteration in viscosity properties due to the sterilization
process and various additives, namely electrolytes, should be investigated
(Šklubalová and Zatloukal, 2011).
The viscosity modifying agents used in ophthalmology are water-soluble naturally
occurring, semi-synthetic or synthetic polymers (Shell, 1982; Lee and Robinson,
1986). The natural polymers include botanical polysaccharides (guar gum, locust
bean gum) semi-synthetic cellulose derivatives, such as cellulose ethers
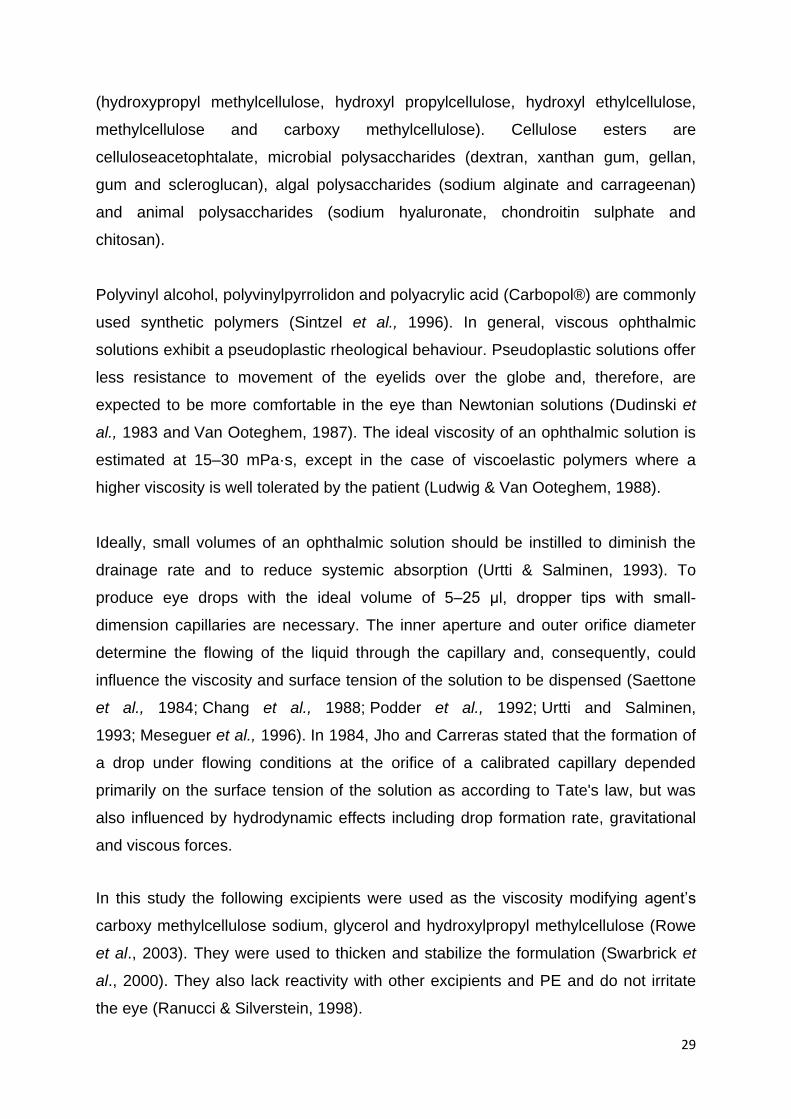
29
(hydroxypropyl methylcellulose, hydroxyl propylcellulose, hydroxyl ethylcellulose,
methylcellulose and carboxy methylcellulose). Cellulose esters are
celluloseacetophtalate, microbial polysaccharides (dextran, xanthan gum, gellan,
gum and scleroglucan), algal polysaccharides (sodium alginate and carrageenan)
and animal polysaccharides (sodium hyaluronate, chondroitin sulphate and
chitosan).
Polyvinyl alcohol, polyvinylpyrrolidon and polyacrylic acid (Carbopol®) are commonly
used synthetic polymers (Sintzel et al., 1996). In general, viscous ophthalmic
solutions exhibit a pseudoplastic rheological behaviour. Pseudoplastic solutions offer
less resistance to movement of the eyelids over the globe and, therefore, are
expected to be more comfortable in the eye than Newtonian solutions (Dudinski et
al., 1983 and Van Ooteghem, 1987). The ideal viscosity of an ophthalmic solution is
estimated at 15–30 mPa·s, except in the case of viscoelastic polymers where a
higher viscosity is well tolerated by the patient (Ludwig & Van Ooteghem, 1988).
Ideally, small volumes of an ophthalmic solution should be instilled to diminish the
drainage rate and to reduce systemic absorption (Urtti & Salminen, 1993). To
produce eye drops with the ideal volume of 5–25 μl, dropper tips with small-
dimension capillaries are necessary. The inner aperture and outer orifice diameter
determine the flowing of the liquid through the capillary and, consequently, could
influence the viscosity and surface tension of the solution to be dispensed (Saettone
et al., 1984; Chang et al., 1988; Podder et al., 1992; Urtti and Salminen,
1993; Meseguer et al., 1996). In 1984, Jho and Carreras stated that the formation of
a drop under flowing conditions at the orifice of a calibrated capillary depended
primarily on the surface tension of the solution as according to Tate's law, but was
also influenced by hydrodynamic effects including drop formation rate, gravitational
and viscous forces.
In this study the following excipients were used as the viscosity modifying agent’s
carboxy methylcellulose sodium, glycerol and hydroxylpropyl methylcellulose (Rowe
et al., 2003). They were used to thicken and stabilize the formulation (Swarbrick et
al., 2000). They also lack reactivity with other excipients and PE and do not irritate
the eye (Ranucci & Silverstein, 1998).
30
2.4.2.5 Additives
Very few additives in eye drop solutions are permissible because they either reduce
the efficacy of the active pharmaceutical ingredient or are toxic for use in the ocular
region. Antioxidants like sodium bisulfite or sodium metabisulfite are permitted in
concentrations of up to 0.3%, particularly in solutions containing phenylephrine and
epinephrine salts. The antioxidant acts as a stabilizer to minimize oxidation of PE
and epinephrine. Other types of antioxidants are ascorbic acid and acetylcysteine
(Järvinen et al., 1995).
Non-ionic surfactants which are least toxic to the ophthalmic tissues are permitted at
concentrations of approximately 0.005%–0.2%. Surfactants are used as co-solvents
to increase solubility and to improve topical bioavailability of the API and to improve
the therapeutic response of an ophthalmic drug. Some surfactants can prolong
ocular residence time of the drug enhancing ocular permeation of the drug molecules
(Urtti & Salminen, 1993; Järvinen et al., 1995).
Benzalkonium chloride is a cationic surfactant and a preservative used frequently in
eye drop solutions. Concentrations that are used are in the range of 0.005–0.02%,
with toxicity the limiting factor on the concentration used. The benzalkonium cation
has a large molecular weight and is inactivated by macromolecules possessing an
opposite charge or by sorption. Benzalkonium chloride is the preservative of choice
and is used in many commercial eye drops, as it has low irritation potential to the
eye, has a broad-spectrum bactericidal activity at very low concentrations and is
compatible with many API (Winfield et al., 2009).
A common penetration enhancer is EDTA which loosens the tight junctions between
the superficial epithelial cells, facilitating paracellular transport (Saettone et al., 1996;
Hochman & Artursson, 1994). It is used in concentration of 0.1%.
The sorption characteristics of surfactants have to be identified before being included
in a formulation. The reason being is that surfactants can absorb preservatives and
thus render the formulation unpreserved (Baudouin et al., 2010).
31
Sodium metabisulfite has antioxidant, antimicrobial (in acidic preparations), and
antibrowning agent properties. In acidic preparations, sodium metabisulfite is used at
concentrations of 0.01–1% and less than 0.5% in alkaline preparations is slowly
oxidized to sodium sulfate on exposure to air and moisture. Sodium metabisulfite is
immediately converted to sodium ions (Na+) and bisulfite ions (HSO3+) when mixed
with water. The crystals also disintegrate when exposed to air and moisture.
Decomposition of aqueous sodium metabisulfite occurs as it exposed to air. The bulk
material should be stored in a well-closed container protected from light, in a cool,
dry, place (Stewart, 2006).
Edetic acid and edetate salts are used in ophthalmic pharmaceutical formulations as
chelating agents. Edetic acid and edetates are primarily used as antioxidant
synergists by sequestering trace amounts of metal ions, particularly copper, iron, and
manganese, which might otherwise catalyze autoxidation reactions. Edetic acid and
edetates may be used alone or in combination with true antioxidants, the usual
concentration employed being in the range 0.005–0.1% w/v. Edetic acid possesses
antimicrobial activity against Gram-negative microorganisms, Pseudonomas
aeruginosa, some yeasts, and fungi, although this activity is insufficient for edetic
acid to be used effectively as an antimicrobial preservative on its own. Many
solutions used for the cleaning, storage and wetting of contact lenses contain
disodium edentate. Edetic acid occurs as a white crystalline powder (Weller, 2006).
Aqueous solutions of edetic acid or edetate salt may be sterilized by autoclaving,
and should be stored in an alkali-free container. Edetic acid and edentates should be
stored in well-closed containers in a cool, dry, place (Weller, 2006).
The most widely used vehicle for pharmaceutical products which is also a solvent is
water. This is due to its physiological compatibility with many compounds and
absence of toxicity. It has a high dielectric constant which is necessary for ensuring
the dissolution of a wide range of ionisable materials (Mido et al., 2003).
There are two types of water used in the production of pharmaceutical products:
purified water and water for injections. Purified water must be free of ionic and
organic chemicals and microbial increase. It is produced by mains water going
through a unit that deionizes and distills the water, has an ion-exchange, provides for

32
reverse osmosis and finally filters. All purified water systems must be validated.
Purified water should be supplied constantly at ≥ 80 °C (Potdar, 2007).
Water for injection is used in the production of injections and other pharmaceutical
applications like cleaning of critical equipment and preparation of pharmaceutical
products. The water for injection gets its feed from purified water, which is subjected
to further distillation and reverse osmosis. The requirements for bacterial endotoxin
tests are much higher values as it must be free of microbial contamination and
endotoxins. Water for injection must show no reaction with the limulus amebocyte
lysate (LAL) reagent which is used to test for microbes (Potdar, 2007).
An important factor for eye drops is that they should be sterile when dispensed in a
multiple-application container (Reddy & Ganesan, 1996). Aseptic techniques during
the manufacture of injections have to be adopted when manufacturing sterile eye
drops (Turco & King, 2005).
Essentially two strategies are adopted in the manufacture of microbiologically
acceptable pharmaceutical formulations. The first and most important is to minimize
the introduction of microorganisms from sources such as air, water, raw materials
and personnel; and the second is to formulate the final product so as to be hostile to
microorganisms, by the addition of preservatives. Common waterborne organisms
found are the Pseudomonas-Achromobacter-Alcaligenes types, including
occasionally P. aeruginosa (McDonnell, 2007).
Purified water is a typical source of microorganisms as during use, the ion-exchange
column may become contaminated from the water passing through and the
entrapped organisms rapidly and multiplies to produce high counts in the outflowing
water. Water produced by reverse osmosis might present a problem if the osmosis
membrane is not disinfected at regular intervals. Distilled water may also be a
significant source of contamination, because the chlorine that protects tap water is
lost on distillation, and Gram-negative bacteria may grow to concentrations as high
as 105 to 106 ml-1 within a few days of storage at ambient temperature. With the
above in mind the correct approaches to preservation are based on two important
principles. The first is that a preservative must not be added to a product to mask
33
any deficiencies in the manufacturing procedures, and the second is that the
preservative should be an integral part of the formulation, chosen to afford protection
in that particular environment (Parker, 2002).
Sterility is one of the important characteristics for ophthalmic solutions. It is defined
as the absence of all living organism (McDonnell, 2007). This especially includes
microorganisms, such as bacteria, yeasts, molds, and viruses. The presence of even
one bacterium in an eye drop container renders its non-sterile. Sterility could be
determined or proved by inoculating the eye drop with microbiological cultural media.
If sterile, no microbial growth will be observed; if not, the culture medium will become
turbid as a result of microbial proliferation (Hanlon, 2002).
Serious ocular infection can result from the use of contaminated eye drop solutions.
Such solutions are the cause of corneal ulcers and loss of eyesight. Contaminated
solutions have been found in use and dispensed on prescription in community and
hospital pharmacies (Hodges, 2002).
Microbes commonly found as a contaminants are the Staphylococcus group.
Pseudomonas aeruginosa is a less frequent contaminant; however it is often found
as a contaminant in sodium flourescein. P aeruginosa is an opportunistic and very
dangerous organism that grows well on most culture media and produces both toxins
and antibacterial products. The latter tend to kill off other contaminants and allow
the P aeruginosa to grow in pure culture. This gram-negative bacillus also grows
readily in eye drop solutions, making it a source of extremely serious infections of the
cornea. Its rapid infection rate can cause complete loss of sight in 24 to 48 hours. In
concentrations tolerated by tissues of the eye, only certain antimicrobial agents are
effective against some strains of this organism (Hanlon, 2002).
Sterile eye drop solutions in multiple-dose containers can be contaminated easily.
For example, if a dropper bottle is used, the tip of the dropper while out of the bottle
can touch the surface of a table or shelf if laid down or it can touch the eyelid or
eyelash of the patient during administration. The solution may be an effective
antimicrobial agent, but the next use of the contaminated solution may occur before
enough time has elapsed for all of the organisms to be killed. In this manner living
34
organisms penetrate through an abrasion into the corneal stroma, within the corneal
stroma, traces of antimicrobial agents are neutralized by tissue components and the
organisms finds an excellent culture medium for rapid growth and dissemination
through the cornea and the anterior segment of the eye (Fassihi, 2001).
When the vitreous humour is infected by Bacillus subtils, it produces an abscess
which can cause blindness. Aspergillus fumigates is a pathogenic fungus found in
eye solutions and is responsible for accelerating deterioration of the active drugs. In
the late 1930s there was an epidemic of keratoconjunctivitis, it was caused by one
bottle of virus contaminated tetracaine solution. Virus contamination is difficult to
control because none of the preservatives available is virucidal. In addition, viruses
are not removable by filtration they are however destroyed by autoclaving. Recent
studies show that the adenoviruses (Type III and VIII), are causative agents of viral
conjunctivitis such as the epidemic keratoconjunctivitis (McDonnell, 2007).
2.5 Sterilization
Sterilization is defined as a process used to render a surface or product free from
viable organisms, including bacterial spores. Common methods of sterilization
include moist heat under pressure, dry heat, filtration, gas sterilization, and ionizing
radiation (McDonnell, 2007). A process, whereby a product is sterilized in its final
container and, which permits the measurement and evaluation of quantifiable
microbial lethality is called terminal sterilization. This process differs from aseptic
manufacture, which requires a series of sterile techniques and provides a passive
process of protection of the dosage form from contamination. If a finished product is
suitable for terminal sterilization, then this is the method of choice (Hanlon, 2002).
Sterilization is a requirement during the manufacture of eye products. The methods
used depend on the active ingredient, product resistance to heat and on the
packaging used. The sterile solution will usually contain an antimicrobial
preservative to protect against unintended contamination during use. Preservatives
are not used to produce a sterile but rather to maintain sterility (Prabhasawat et al.,
2005).
35
2.5.1 Steam under pressure as a method of sterilization
Terminal sterilization by autoclaving is an effective method of sterilization but the
solution components have to be heat-resistant in order to avoid degradation.
Effective sterilization is achieved when steam penetrates the autoclave load
uniformly. Products in their primary containers are autoclaved under pressure (1–2
atm) at 121 °C for 15 minutes. A technique has been developed which is called air-
over-steam autoclave. This allows pressure adjustments to be made during the
autoclave cycle to permit the autoclave sterilization of materials such as,
polypropylene containers that deform when exposed to heat (Lang et al., 2005).
2.5.2 Filtration as a method of sterilization
Filtration is defined as the process of removing solids or suspended matter in a liquid
or gas by passing matter through a porous medium where solids are retained or
entrapped (Twitchell, 2002). The USP (2004) states that sterile membrane filters
must have a pore size of 0.2 µm. Filtration is a method of sterilization as it offers the
substantial advantage of room temperature operation with none of the damaging
effects of exposure to heat or sterilizing gas. Filtration sterilization involves the
transfer of the finished sterile product into sterilized containers, through a filter paper
using aseptic techniques. The membrane filter is either hydrophobic or hydrophilic;
the right choice should be made based its compatibility with the API and excipients,
so as to reduce sorption. Sorption could significantly reduce the efficacy of the
manufactured product. The membrane filtration equipment itself usually is sterilised
by autoclaving. Filtration permits extemporaneous preparation of eye drop solutions
that have a high probability of being sterile under aseptic conditions (Gould, 2004).
2.5.3 Laminar-flow principles
A laminar-flow work area is used to prepare sterile, particulate free solutions.
Laminar-flow is defined as airflow in which the total body of air moves with uniform
velocity along parallel lines with a minimum of eddies. Laminar-flow with the HEPA
filters reduces the possibility of airborne microbial contamination by providing air free
of viable particles and free of practically all inert particulates. Laminar-flow units can

36
be found in different shapes and sizes and in two categories, horizontal and vertical
laminar-flow (Turco & King, 2005). Laminar-flow is not a guarantee of sterility and
correct procedures and sterile techniques are necessary (McHugh, 2010).
Laminar flow areas are supplied with air passed through high effiecincy particulate
filter (HEPA) filters which are high density mats composed of randomly arranged
fibres and are used as air filters to remove much smaller particles such as dust
pollutants and microbes. The fibres, made of fibreglass, have a diameter-range of
0.5 and 2.0 µm.
Factors that affect function of HEPA filters are fibre diameter, filter thickness, and
face velocity (Abdel-Magid & Caron, 2006).
The HEPA filters remove finer particles in air passed through them, and virtually free
it from foreign matter. Ultraviolet light (UV) is installed in the air ducts on the
downstream side of the filter to kill microbes that may have escaped through or
around the filter (Brooks et al., 2007). The hood air flow should have an air velocity
of 100 ft. / minute (Potdar, 2007).
2.5.4 Preservatives used in eye drop formulations
Preservative substances must be evaluated as part of the total eye drop preparation
in the proposed package. The growth or presence of microorganisms in the eye drop
can lead to destruction of the product or transmission of disease to the consumer.
Destruction can be in the form of chemical degradation of drugs or excipients by the
enzymes produced by the microorganism or a breakdown of the physical attributes
such as tactile change, visible change in colour, or smell (Amin et al., 2010).
The USP (2004) states that eye drop solutions may be packaged in multiple-dose
containers and must contain a substance or mixture of substances to prevent the
growth of, or to destroy, microorganisms introduced accidentally when the container
is opened during use. Eye drop solutions prepared and packaged for a single
application, need not contain a preservative because they are not intended for reuse.

37
Preservatives are not to be used in solutions intended for intraocular use because of
the risk of irritation.
The selection of an eye drop preservative can be cumbersome because of the
relatively small number of suitable agents. As there is no ideal preservative,
however the following criteria are useful in preservative selection:
The agent should have a broad spectrum and be active against gram-positive
and gram-negative organisms as well as against fungi.
The agent should exert a rapid bactericidal activity, particularly against known
virulent organisms such as P aeruginosa strains.
The agent should be stable over a wide range of conditions for example
autoclaving temperatures and a wide pH range.
Compatibility should be established with other components in the product and
with packaging systems.
Lack of toxicity and irritation should be established with a margin of safety
(Lang et al., 2005).
Sterile eye drop solutions in multiple-dose containers can be contaminated easily.
For example, if a dropper bottle is used, the tip of the dropper, while out of the bottle,
can touch the surface of a table or shelf if laid down or it can touch the eyelid or
eyelash of the patient during administration (Amin et al., 2010). The solution may
have an effective antimicrobial, but the next use of the contaminated solution may
occur before enough time has elapsed for all of the organisms to be killed (Hodges,
2002). In this manner living organisms penetrate through an abrasion into the
corneal stroma, within the corneal, traces of antimicrobial agents are neutralized by
tissue components and the organism finds an excellent culture medium for rapid
growth and dissemination through the cornea and the anterior segment of the eye
(Fassihi, 2001).
The USP (2004) provides a test for preservative effectiveness; preservative
effectiveness as an immediate measure, its adequacy or stability as a function of
time must also be ascertained. This is achieved by measuring both chemical
stability and preservative effectiveness over a given period of time and under varying
38
storage conditions. Common compounds used as preservatives are discussed
below.
2.5.4.1 Quaternary ammonium compounds
Benzalkonium chloride is a quaternary ammonium compound and the most common
preservative used in eye drop formulations. Reviews have indicated that it is well
suited for use as an eye drop preservative. It has antimicrobial, antiseptic and
disinfectant properties (Kibbe, 2006). Benzalkonium chloride is found in 65% of
commercial eye drop products as a preservative (Rojanasakul et al., 1992). As a
cationic surface-active agent of high molecular weight it is not compatible with
anionic compounds, this defines its limitations, despite its broad use. It is
incompatible with salicylates and nitrates and inactivated by high-molecular-weight
non-ionic compounds (Le Bourlais et al., 1998).
Benzalkonium chloride has excellent chemical stability and desirable antimicrobial
characteristics. It is a mixture of alkyl benzyldimethylammonium chlorides ranging
from n-C8H17 through n-C16H33. The n-C12H25 homolog content is not less than 40%
on an anhydrous basis (Ali et al., 2009). It is one of the most widely used
preservatives, at a concentration of 0.01–0.02% w/v. It is used in combination with
other preservatives or excipients, particularly, 0.1% w/v disodium edetate, to
enhance its antimicrobial activity against strains of Pseudomonas (Rozet et al.,
2011).
Benzalkonium chloride occurs as a white or yellowish-white amorphous powder, a
thick gel, or gelatinous flakes. It is hygroscopic, soapy to the touch, and has a mild
aromatic odour and has a very bitter taste (Kibbe, 2006).
Benzalkonium chloride solutions are active against a wide range of bacteria, yeasts,
and fungi. Activity is more marked against Gram-positive than Gram-negative
bacteria and minimal against bacterial endospores and acid-fast bacteria. The
antimicrobial activity of benzalkonium chloride is significantly dependent upon the
alkyl composition of the homolog mixture. Benzalkonium chloride is ineffective
against some Pseudomonas aeruginosa strains, Mycobacterium tuberculosis,
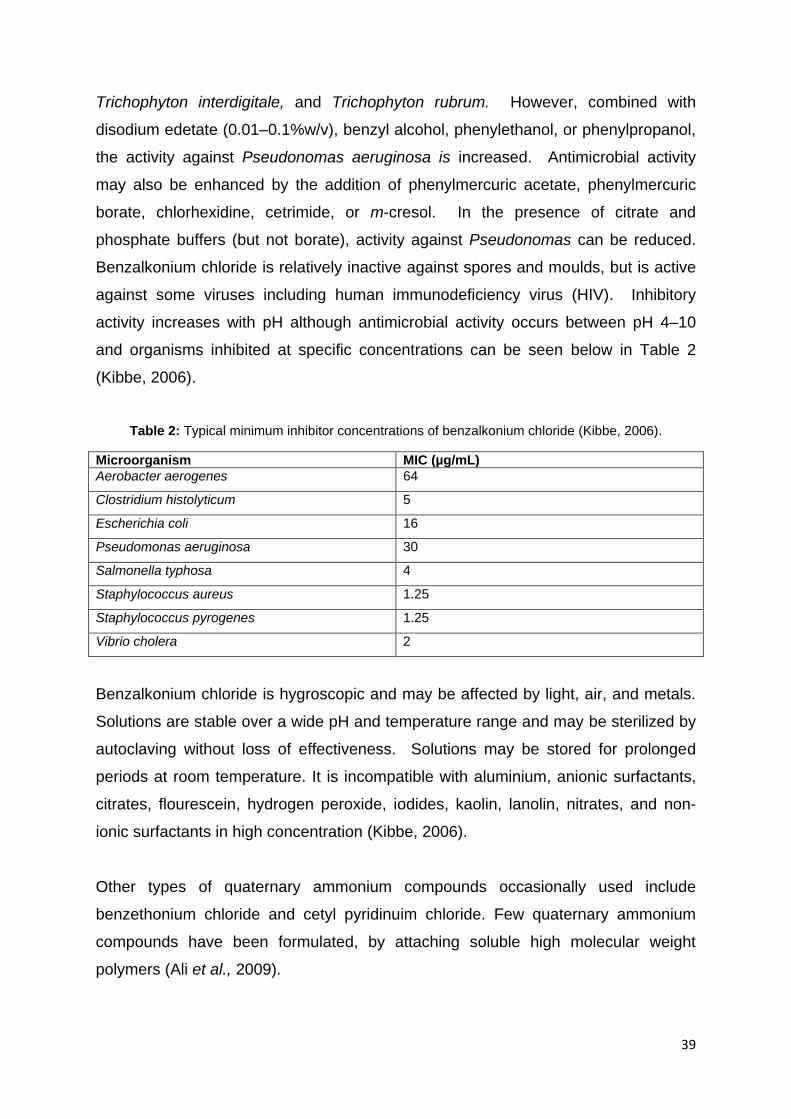
39
Trichophyton interdigitale, and Trichophyton rubrum. However, combined with
disodium edetate (0.01–0.1%w/v), benzyl alcohol, phenylethanol, or phenylpropanol,
the activity against Pseudonomas aeruginosa is increased. Antimicrobial activity
may also be enhanced by the addition of phenylmercuric acetate, phenylmercuric
borate, chlorhexidine, cetrimide, or m-cresol. In the presence of citrate and
phosphate buffers (but not borate), activity against Pseudonomas can be reduced.
Benzalkonium chloride is relatively inactive against spores and moulds, but is active
against some viruses including human immunodeficiency virus (HIV). Inhibitory
activity increases with pH although antimicrobial activity occurs between pH 4–10
and organisms inhibited at specific concentrations can be seen below in Table 2
(Kibbe, 2006).
Table 2: Typical minimum inhibitor concentrations of benzalkonium chloride (Kibbe, 2006).
Microorganism MIC (µg/mL)
Aerobacter aerogenes 64
Clostridium histolyticum 5
Escherichia coli 16
Pseudomonas aeruginosa 30
Salmonella typhosa 4
Staphylococcus aureus 1.25
Staphylococcus pyrogenes 1.25
Vibrio cholera 2
Benzalkonium chloride is hygroscopic and may be affected by light, air, and metals.
Solutions are stable over a wide pH and temperature range and may be sterilized by
autoclaving without loss of effectiveness. Solutions may be stored for prolonged
periods at room temperature. It is incompatible with aluminium, anionic surfactants,
citrates, flourescein, hydrogen peroxide, iodides, kaolin, lanolin, nitrates, and non-
ionic surfactants in high concentration (Kibbe, 2006).
Other types of quaternary ammonium compounds occasionally used include
benzethonium chloride and cetyl pyridinuim chloride. Few quaternary ammonium
compounds have been formulated, by attaching soluble high molecular weight
polymers (Ali et al., 2009).

40
2.5.4.2 Parahydroxybenzoic acid esters
Mixtures of methylparaben and propylparaben are sometimes used as ophthalmic
antimicrobial preservatives. The concentration of methylparaben used is in the range
of 0.1 to 0.2%, while that of propylparaben approaches its solubility in water (
0.04%). They are not considered efficient bacteriostatic agents and are slow in their
antimicrobial action. Ocular irritation and stinging are attributed to their use in eye
drop preparation (Furrer et al., 2002).
Propylparaben is widely used as an antimicrobial preservative in pharmaceutical
formulations. It may be used alone, in combination with other paraben esters, or
with other antimicrobial agents. It is effective over a wide pH range and has a broad
spectrum of antimicrobial activity although it is most effective against yeasts and
moulds. It is known for its poor solubility; particularly the sodium salt. This may cause
the pH of poorly buffered formulations to become more alkaline. Use in ophthalmic
formulations is in a concentration range of 0.005–0.01%, Table 3 shows organisms
inhibited at various concentrations. Propylparaben is found as a white, crystalline,
odourless, and tasteless powder (Rieger, 2006b).
Table 3: Minimum inhibitory concentration for propylparaben in aqueous solution (Rieger, 2006b)
Microorganism MIC (µg/mL)
Aspergillus niger ATCC 9642 500
Bacillus subtilis ATCC 6633 500
Candida albicans ATCC 10231 250
Escherichia coli ATCC 8739 500
Klebsiella pneumonia ATCC 8308 500
Pseudomonas aeruginosa ATCC 9027 >1000
Salmonella typhosa ATCC 6539 500
Staphylococcus aureus ATCC 6538P 500
Staphylococcus epidermidis ATCC 12228 500
Trichophyton mentagrophytes 65
Aqueous propylparaben solutions at pH 3–6 can be sterilized by autoclaving, without
decomposition. At pH 3–6 aqueous solutions are stable for up to about 4 years at

41
room temperature while solutions at pH 8 or above are subject to rapid hydrolysis
(Rieger, 2006b).
Methylparaben may be used either alone, in combination with other parabens, or
with other antimicrobial agents. Preservative efficacy is also improved by the addition
of 2–5% propylene glycol, or by using parabens in combination with other
antimicrobial agents such as imidurea (Rieger, 2006a). In ophthalmic formulations it
is used between 0.015–0.2 percent. Methylparaben occurs as colourless crystals or
a white crystalline powder. It is odourless or almost odourless and has a slight
burning taste (Rieger, 2006a).
Methylparaben exhibits antimicrobial activity between pH 4–8. Preservative efficacy
decreases with increasing pH due to the formation of the phenolate anion. Parabens
are more active against yeasts and moulds than against bacteria, Tables 3 and 4
show ophthalmic concentrations and organisms inhibited respectively. They are also
more active against Gram-positive bacteria than against Gram-negative bacteria.
Aqueous solutions of methylparaben, at pH 3–6, may be sterilized by autoclaving at
120 ˚C for 20 minutes, without decomposition. Aqueous solutions at pH 3–6 are
stable for up to about 4 years at room temperature, while aqueous solutions at pH 8
or above are subject to rapid hydrolysis (Rieger, 2006a).
Table 4: Minimum inhibitory concentrations of methylparaben in aqueous solution (Rieger, 2006a).
Microorganism MIC (µg/mL)
Aspergillus niger ATCC 10254 1000
Bacillus subtilis ATCC 6633 2000
Candida albicans ATCC 10231 2000
Escherichia coli ATCC 8739 1000
Klebsiella pneumonia ATCC 8308 1000
Pseudomonas aeruginosa ATCC 9027 4000
Salmonella typhosa ATCC 6539 1000
Staphylococcus aureus ATCC 6538P 2000
Staphylococcus epidermidis ATCC 12228 2000
Trichophyton mentagrophytes 250
42
2.6 Efficacy of antimicrobial preservation
Pharmaceutical formulations that do not have adequate antimicrobial activity are
protected with antimicrobial preservatives particularly in aqueous formulations. This
is to prevent the proliferation or to limit microbial contamination which, during normal
conditions of storage and use, particularly for multidose containers, could occur and
present a hazard to the patient. The efficacy of an antimicrobial preservative may be
enhanced or diminished by the active constituent of the preparation or by the
formulation in which it is incorporated or by the container and closure used. The
antimicrobial activity of the formulation in its final container is investigated to ensure
that its activity has not been impaired by storage. Such investigation may be carried
out on samples removed from the final container immediately prior to testing (B.P,
2011).
During development of a pharmaceutical formulation, it should be demonstrated that
the antimicrobial activity in the formulation including preservatives provides adequate
protection from adverse effects that may arise from microbial contamination or
proliferation during storage and use of the preparation. The efficacy of the
preservatives on microbial activity can be achieved by tests which consist of
challenging the preparation in its final container, with prescribed inoculums of
suitable micro-organism, storing the inoculated formulation at a prescribed
temperature, withdrawing samples from the container at specified intervals of time
and counting the organisms in the samples removed (B.P, 2011).
The preservative properties of the formulation are adequate if, in the conditions of
test, there is a significant fall or no increase, as appropriate, in the number of micro-
organisms in the inoculated product after the times and at the temperatures
prescribed (B.P, 2011).
Laboratories can isolate different strains of desired micro-organisms by swabbing
infected patients, isolating strains from contaminated food, cosmetic or
pharmaceutical products and many other sources. Therefore strains obtained in
various manners vary in resistance to antimicrobial chemicals. Strains obtained from
human and animals are more resistant to antimicrobial chemicals than those from
43
other sources. Strains derived from contaminated medicines will be more resistant to
preservatives. This is because the characteristics of the organism (including its
resistance to antimicrobial chemicals) over a period of time changes as a result of
mutation and natural selection (Curtin and Cormican, 2003). To get results that are
reproducible by a variety of laboratories it is necessary to specify the strain of the
organism used for the experiment. The common strains used are cultures of
Escherichia coli, Candida albicans, Pseudomonas aeruginosa, Staphylococcus
aureus. Methods used to assess the activity of antimicrobial preservatives involve an
inoculum of the test organisms which are added to a solution of the product in
question. Samples are then removed over a period of time, the preservative is
inactivated and the surviving cells calculated (Brooks et al., 2007).
In all cases of measurement of antimicrobial activity it is necessary to standardise
and control factors such as the concentration of the test organism, its origin (species
and strain employed), the culture medium in which the cells are placed, temperature
and the of incubation time of cells after exposure to the chemical (Brooks et al.,
2007).
2.7 Packaging
According to the American Society for Testing and Materials, a plastic is a material
that contains, as an essential ingredient, one or more polymeric organic substances
of large molecular weight, is solid in its finished state and at some stage of
manufacture or processing into finished articles it can be shaped by flow (Rabinow
& Roseman, 2005). Important mechanical properties required in plastic packaging
materials are: tensile strength, impact strength, stiffness, flex resistance, tear
strength, coefficient of friction, blocking, fatigue resistance and creep failure
(Massey, 2004).
Optical properties are important qualities needed in the plastics as a method of
packaging. Some needed characteristics are light transmission, clarity, haze and
gloss (Marriot, 2006).
44
Ophthalmic glass containers with glass droppers have largely been replaced by
plastic bottles, only in rare cases are glass containers still in use (Van Santvliet &
Ludwig, 2004). Plastic containers are used more often due to their increased
resistance to shock, they are lightweight, and they present more options with regard
to design opportunities (Jenkins & Osborn, 1993).
Plastic containers used to store ophthalmic products should have the following
characteristics:
Flexibility (ability to deform).
Elasticity (ability to return to its original form after deformation).
Stiffness (resistance to deformation) (Smith and Hui, 2004).
Most plastic containers are shaped with round or oval bases containing substances
of 3 to 15 ml (Santvliet & Ludwig, 2004). There are disadvantages in plastic
containers, these are:
Minimal transparency (poor visuals of solutions inside the containers).
Low-density polyethylene allows permeability to vapours and light.
Adsorption of molecules from its contents and cracking due to intensive use
(McDonald and Parkin, 1995).
Plastic packaging is not interchangeable with glass (Shah et al., 2008). Plastic
packages may contain a variety of extraneous substances such as mould-release
agents, antioxidants, and reaction quenchers amongst others which can readily
leach out of the plastic and into the contained solution (Tokiwa & Calabia, 2004) and
label glues, inks and dyes also have been reported to penetrate (Van Santvliet &
Ludwig, 2004). Commercially-produced plastic eye drop bottles are made of
polyethylene or polypropylene. They are common containers for various drugs
including phenylephrine hydrochloride solutions (Winfield et al., 2009).
2.9 Formulation development
Each formulation and API is unique. Formulation experiments begin with a well-
structured formulation plan. The formulation strategy is a result of thorough analysis

45
of the preformulation data report and manufacturing process. The following criteria
are to be met in order to begin formulation development:
Relevant patents have been accessed and investigated.
The appropriate literature search has been sourced.
The regulatory and formulation strategies have been well-known.
The desired APIs have been ordered and received (Al-Shaalan, 2010).
A beneficial approach to formulation development of a generic product is to critically
evaluate and where possible, to characterize, the innovator product with respect to
composition and other qualitative and or quantitative analyses which may be
feasible. A simple approach to achieve the above analysis, is to determine the pH of
the innovator drug product dispersed in a small volume of pH adjusted purified water,
and then to compare the result with that yielded by a similar dispersion of the trail
formulation. The approach is based on the principle that if two dispersions provide
comparable pHs’, the excipients compositions of the innovator and generic
formulations are probably similar. However caution is needed since this test may not
be sufficient to provide all results needed. Initial trials and selection of batches
should be done using similar excipients. Possible instability or incompatibility can be
overlooked, as long as the same excipients provided in text are used. Small changes
in the concentration of key excipients can alter the appearance and physical
attributes, while impact on the drug product stability and dissolution can be
significant (Miller & Ermer, 2005).
The assessment of the final formulation can be achieved by scaling to require pilot
batches, and packaged into all possible configurations intended for future
commercialization. The batch is placed into accelerated (40 °C/75%RH) storage
conditions for a period of three months. The batches are tested using validated
analytical methods, should the batch prove to be stable over the 3 months period of
exposure, it would have a high degree of probability that the product is stable and
formulae succeeded. It is pivotal to ensure that all desirable characteristics are
achieved. The generic drug product must demonstrate the minimum 3 months
satisfactory stability, before the following are achieved:
46
Development of specifications for both API and the dosage form.
Ordering of the API and excipients for batch manufacturing.
Ordering of all relevant tooling, change parts.
Completion of development report (Ansel et al., 2011).
2.9.1 Validation of HPLC analytical methods
Guidelines provided by the international conference on harmonization are deemed
paramount for the registration of pharmaceuticals for human use as they represent
the regulatory agencies of the three largest pharmaceutical markets (U.S. Food and
drug administration, European Commission for the European Union, and Japanese
ministry for Health and Welfare (MHW)). The three regulatory agencies came
together to address issues of efficacy, safety, quality and harmonized guidelines.
Validation is a basic requirement to ensure quality and reliability of the results for all
analytical applications (Miller & Ermer, 2005). It is a requirement by registration
bodies like the MCC and FDA that the method be validated. A typical validation
technique would be the use of HPLC for its pharmaceutical analysis (Karcher et al.,
2005). Physical separation technique employed by HPLC is conducted in the liquid
phase in which a sample is separated into its constituent components (or analytes)
by distributing between the mobile phase (a flowing liquid) and a stationary phase
(sorbents packed inside a column). An online detector used by the HPLC monitors
the concentration of each separated component in the column effluent and
generates a chromatogram (Cecil & Sheinin, 2005). These detectors are then able to
quantify the major components in a purified sample, differentiate among components
of a reaction mixture and show trace impurities in a complex sample matrix (Wells,
2002).
Reversed-phase HPLC is the method of choice for stability-indicating assays
because the samples are generated in aqueous solutions. The advantages of
reversed-phase chromatography are due to convenience, a broad range of samples
that can be chromatographed conveniently and the speed of column equilibration is
shorter when compared to normal–phase chromatography (Nakashima et al., 2002;
Marin et al., 2005; Wong et al., 2006; Palabiyik & Onur, 2007; Heydari, 2008; Das
47
Gupta & Parasrampuria, 1987; Bastos & de Oliveira, 2009). Most reversed phase
HPLC separations are done in the isocratic mode, where the composition of the
mobile phase is held constant during the analysis. The external standard method is
the most general method for determination of the concentration of a compound in an
unknown sample. It involves the construction of a calibration plot using external
standards of the analyte. A fixed volume of each standard solution of known
concentration is injected onto the column and the peak response of each injection is
plotted versus the concentration of the standard solution. The standards are called
‘external standards’ because they are prepared and analyzed separately from the
unknown samples. After constructing the calibration plot, the unknown sample is
prepared, injected and analyzed in exactly the same manner. The concentration of
the analyte in the unknown sample is then determined from the calibration plot
(Wong, 2006).
Other types of standards are the internal standard, mass balance and area
normalization. The internal standard procedure allows the analyst to identify a region
of the chromatogram that is devoid of peaks (quiet region). The analyst then
attempts to identify a compound of known purity, that is structurally related to the
analyte, and which elutes in the quiet region of the chromatogram. The internal
standard should have a relative response factor that is about the same as the
analyte (Cecil & Sheinin, 2005).
Reversed phase HPLC has been extensively used for the pharmaceutical analysis of
phenylephrine hydrochloride in pharmaceutical dosage forms (Sprieck, 1974;
Muhammad and Bodnar, 1980; Chien & Schoenwald, 1985; Zeise et al., 1996;
Muszalska et al., 2000; Goicoechea & Olivieri, 2001; Savic et al., 2008; Samadi–
Maybodi & Nejad–Darzi, 2009; & Al-Shaalan, 2010).
2.9.1.1 Stability indicating HPLC analysis
Analytical procedures used for the assay of the API alone or in the final product
during stability studies should be stability indicating. A stability indicating assay is
one that accurately quantifies the API without interference from degradation
products, process impurities, excipients, or other potential impurities. Samples are

48
obtained by placing the pure API under stress intentionally, for example, by
subjecting the API to acid, base, heat, light or oxidation. This process is often called
forceful degradation or purposeful degradation. Usually, the goal is to degrade the
parent API by 10–20%. Degradation much greater than 10–20% could result in
secondary degradants that will complicate the development process (ICH
Harmonised Tripartite Guideline Q2A, 1994).
In the mass balance approach, all impurities are quantified and subtracted from the
absolute API value of 100%. This approach will result in a purity value that, if all
impurities are accounted for, is more accurate than the external or internal standard
methods. However, the ability to identify all impurities in a given drug substance may
require the use of hyphenated detection techniques and could be extremely costly to
complete on a regular basis. A related approach is called area normalization, and is
often used where the majority of the impurities can be identified and quantified in a
single chromatogram. All of the impurities would be assumed to have the same
relative response factor as the parent drug. The quantification of the individual
impurities would be reported as a percentage of the parent drug rather than an
absolute value in milligrams (Cecil & Sheinin, 2005).
2.9.1.2 Choice of analytical column and conditions
The C18 (2)-bonded phase [-CH2-(CH2)16-CH3] is the separation material contained
within columns used in the early development of HPLC. It is available in a wide
variety of forms and differs based on for example, silica type, pore size, surface
area. As most laboratories with HPLC equipment will have a C18 column available, it
is the first choice for initial experiments. In addition, with the broad range of
applications accessible in the literature or from commercial sources, it is often easy
to find a separation that is similar, allowing for selection of mobile phase conditions
that are likely to be suitable for solving a particular analytical problem. C18 columns
were utilised most prevalently in the analytical HPLC methods sourced in the
literature for the quantitative determination of phenylephrine hydrochloride solutions.
The advantages noted for the C18 (2)-bonded are flexibility in pH, ligand stability at
acidic pH and hydrolytic stability of the bonded phase based on a bi silane at low pH
49
which is five times higher than that of a monofunctional bonded phase (Saettone et
al., 1980; O’Donnell & Gillibrand, 1995; Palabiyik & Onur, 2007).
An ion-pairing agent is commonly used with reversed–phase chromatography as it is
a better alternative to ion–exchange chromatography for the separation of ionic
species. The most common ion–pairing agents are the tetrabutylammonium salts
and alkylsulphonic salts (octane-1-sulfonic acid sodium salt). Properties of the two
are as follows:
Tetrabutylammonium salts are:
Buffered to pH 7.5.
Form ion pairs with strong and weak acids.
Suppresses weak base ions.
While alkylsulphonic salts are:
Buffered to pH 3.5.
Form ion–pairs with strong and weak bases.
Buffering suppresses weak acid ions.
The longer the alkyl chain, the greater is the retention time (Florence and
Attwood, 2006).
Ion–pairing agents and pH increase the retention time with increasing concentration
of ion–pairing agent. The true origins of the ions which pair with drug ions is not
clear, but there is evidence that ion–pair formation aids absorption. Ion–pairing
provides the interaction between a drug ion and an organic ion of opposite charges
to form an absorbable neutral species. The formation of ion pairs will depend on
solvent–ion interactions: hydrophobic ions might be encouraged to form ion pairs by
the mechanism of water-structure enforced ion–pairing in which water attempts to
minimize the disturbance on its structuring, and achieves this end by reducing the
polarity of the species in solution by ion–pair formation (Florence and Attwood,
2006).
50
2.9.1.3 Steps for HPLC method validation
Method validation is the process of demonstrating that analytical procedures are
suitable for their intended use and that they support the identity, strength, quality,
purity and potency of pharmaceutical substances and products. The process of
validating a method cannot be separated from the actual development of the method
conditions, because the developer will not know whether the method conditions are
acceptable until validation studies are performed. Results of validation studies may
indicate that a change in the procedure is necessary, which may then require
revalidation. During each validation study, key method parameters are determined
and then used for all subsequent validation steps. The method developed for this
study was validated according to the International Conference on Harmonization
guidelines and the following were determined for the HPLC method:
Specificity.
System suitability.
Linearity.
Accuracy.
Precision.
Limit of detection.
Limit of quantification.
Range (ICH Harmonized Tripartite Guideline Q2A, 1994).
2.9.1.4 Linearity
Linearity of an analytical procedure is its ability, within a given range, to obtain test
results that are directly proportional to the concentration of analyte in the sample
(ICH Harmonized Tripartite Guideline Q2A, 1994). The requirements for linearity are
that the correlation coefficient of the regression line must be greater than or equal to
0.9999 and that the y-intercept must not be significantly different from zero (ICH
Harmonized Tripartite Guideline Q2A, 1994).

51
2.9.1.5 Accuracy and precision
Accuracy of an analytical procedure expresses the closeness of agreement between
the value that is found and the value that is accepted (either as a conventional true
value or an accepted reference value). Precision of an analytical procedure
expresses the closeness of agreement (degree of scatter) between a series of
measurements obtained from multiple sampling of the same homogenous sample
under the prescribed conditions (ICH Harmonized Tripartite Guideline Q2A, 1994).
The requirement for accuracy is that the percentage recovery of API for each
solution prepared must be within the 98.00 to 102.00% limit. The requirement for
precision is that the relative standard deviations at any one concentration must be
less than or equal to 2.00%.
2.9.1.6 Limit of detection and limit of quantification
The limit of detection (LOD) is the lowest analyte concentration that produces a
response detectable above the noise level of the system and the limit of
quantification (LOQ) is the lowest level of analyte that can be accurately and
precisely measured (Kupiec et al., 2004). The LOD is thus the lowest concentration
for which the relative standard deviation of multiple injections is less than 5.0%. By
convention, the LOD value is taken as 0.3 times the LOQ (Thomsen et al., 2003).
2.9.1.7 Range
Range of an analytical procedure is the interval between the upper and lower
concentrations of analyte in the sample (including these concentrations) for which it
has been demonstrated that the analytical procedure has a suitable level of linearity,
accuracy and precision (ICH Harmonized Tripartite Guideline Q2A, 1994).
2.9.1.8 Specificity
Specificity of an analytical procedure is its ability to assess, unequivocally, the
analyte in the presence of components that may be expected to be present (ICH
Harmonized Tripartite Guideline Q2A, 1994). Specificity suggests that a given

52
analyte peak is indeed the desired analyte structure and is 100% pure (Krull &
Swartz, 2001). The peak purity results from the photodiode-array analysis must show
that the phenylephrine hydrochloride peak is pure. In other words the purity angle
must be less than the threshold angle. Depending on the wavelength, a tungsten
lamp and a deuterium lamp are used as light sources. The polychromatic light beam
is focused on a flow-cell and subsequently dispersed by a holographic grating or
quartz prism. The spectral light then reaches a chip that contains 100 to 1000 light-
sensitive diodes arranged side by side. Each diode only registers a well-defined
fraction of the information and in this way all wavelengths are measured at the same
time. At the end of the run, a three-dimensional spectrochromatogram (absorbance
as a function of wavelength and time) is stored on the computer and can be
evaluated qualitatively and quantitatively. Peak identity and peak homogeneity (peak
purity) can be investigated by analyzing spectrum collected during chromatographic
seperations and detection, a pure compound will produce a peak with spectra that
have the same shape across the peak. In contrast any interefence from coeluting
analytes will produce composite spectra with varying degrees of spectra
dissimilarities across the peak. This is the basis of peak purity index. Diode array
detection offers the advantage that knowledge of the spectra of compounds of
interest enables interfering peaks to be eliminated such that an accurate
quantification of peaks of interest can be achieved despite less than optimal
resolution. Peak purity is of the utmost importance in the quality control of
pharmaceutical products (Kupiec et al., 2004).
Figure 4: Diagram of a typical HPLC-UV absorbance peak and plots of noise (or threshold) and purity angles (Krull & Swartz, 2001).
Figure 4 above shows a typical HPLC-UV absorbance peak with plots of noise and
purity angles. Stress testing is undertaken to demonstrate specificity when
53
developing stability indicating methods (Reynolds et al., 2002). The API and finished
products will be subjected to stress studies in order to force phenylephrine
hydrochloride degradation and thereby verify or exclude the presence of co-eluting
impurities or degradation products in the mobile phase, solvent or unstressed /
stressed solutions.
Impurities should be between 10 – 20 % of the API. This should include samples
stored under relevant stress conditions such as: light, heat, humidity, acid/base
hydrolysis and oxidation. Peak purity tests are used to show that the analyte’s
chromatographic peak is not attributable to more than one component (ICH
Harmonized Tripartite Guideline Q2 (R1), 2005).
2.9.2 Active-excipient compatibility studies
Impurities can be formed in pharmaceutical products as a result of an interaction
between the active ingredient and excipient introduced by formulation. In an ideal
product, the excipient used in the formulations should not interact with the drug
substance or introduce unwanted substances capable of accelerating the formation
of new impurities. Incompatibility found between drugs and excipients in
pharmaceutical products can alter the stability and bioavailability of drugs, thereby
affecting its safety and efficacy. Stress studies of the active-excipients mixture
generate high amounts of degradation products which can be identified using various
analytical procedures even though the potential degradation products are in low
concentrations (Douša et al., 2011).
Binary mixture compatibility testing is a commonly used method. In this approach,
binary (1:1 or customized) mixtures of the drug and excipient, with or without, added
water and sometimes compacted or prepared as slurries, are stored under stressed
conditions (also known as isothermal stress testing (IST)) and analyzed using a
stability-indicating method, e.g. HPLC. The water slurry approach allows the pH of
the drug-excipient blend and the role of moisture to be investigated. Alternatively,
binary mixtures can be screened using other thermal methods, such as differential
scanning calorimetry (DSC) (Clas et al., 1999).

54
DSC is a technique that is used extensively in the field of pharmaceutics. The main
benefit of DSC, compared to stress storage methods, is its ability to quickly screen
potential excipients for incompatibilities derived from the appearance, shifts or
disappearances of peaks and/or variations in the corresponding peak. DSC is mostly
used to show instability resulting from solid-solid interactions. Another feature of
DSC possesses is low sample consumption making it an attractive method. Although
DSC is unquestionably a valuable technique, interpretation of the data may not be
straightforward. In this method, the sample is exposed to high temperatures (up to
300 °C or more), which in reality is not experienced by the dosage form. Thus, DSC
results should be interpreted carefully, as the conclusions based on DSC results
alone can be often misleading and inconclusive. The results obtained with DSC
should therefore always be confirmed with isothermal stress testing, IST (Giron,
1998).
Isothermal stress testing involves storage of drug-excipient blends with, or without
moisture, at elevated temperatures for a specific period of time, typically 3–4 weeks
to accelerate drug degradation and interaction with excipients. The samples are then
visually observed for any changes in color or physical characteristics, and the drug
content, along with any degradants, is determined quantitatively. Although more
useful, the disadvantage with this method is that it is time consuming and requires
quantitative analysis using e.g. HPLC (Verma & Garg, 2004).
Ideally, both techniques, DSC and IST should be used in combination for the
selection of excipients. That was not the case in this research study and only IST
was used as it could satisfactorily indicate the results.
2.10 Determining formulation stability study
Stability, with respect to drug dosage form, refers to the chemical and physical
integrity of the dosage unit and the ability of the dosage unit to maintain protection
against microbiological contamination. The shelf life of the dosage form is the time
lapse from initial preparation to the specified expiration date. The product within its
shelf life must fulfil the monograph specification for identity, strength, quality, and

55
purity. Stability parameters of a drug dosage form can be influenced by
environmental conditions of storage (temperature, light, air, and humidity) as well as
packaging (USP, 2004).
Stability studies on dosage forms should be conducted by means of specific
temperatures and relative humidities representing storage conditions experienced in
the distribution chain of climatic zones of South Africa (climatic zones I and II).
Stability studies performed on eye drops in the pharmaceutical industry follow an
integral part of a formulation development programme. The standardized approach
applied to the formulation or design of the eye drop is similar to those applied to
other dosage forms, which are:
Selection of batches.
Test procedure and criteria.
Specification storage test conditions.
Testing frequency.
Packaging material.
Evaluation statements and labelling (Miller–Meeks et al., 1991).
Stability study is one of the most important areas, in relation to the registration of
pharmaceutical products, as it predicts shelf life and storage instructions for batches.
It also determines degradation of products, mechanism of breakdown and conditions
under which the breakdown occurs. With the help of stability studies, any parameter
subject to change within the eye drop during storage can be measured, such as
appearance, pH, viscosity and density, (where relevant), solubility time
(reconstitution and appearance thereof) sterility, preserving ability and preservative
content (where relevant). Tests are also performed to ensure compatibility between
the container-closure system and the product. Stability testing is the cornerstone of
drug development or formulation (Jeffs, 2009).
During storage, one or more of the following changes may take place:
a) Chemical interaction involving drug, excipients or container, or many
combinations of these.
b) Alteration of physical form.
56
c) Mould or bacterial growth commonly referred to as biological change.
Their effect may be to make the preparation unusable on account of:
i. Loss of active agent.
ii. Development of a toxic decomposition product.
iii. Poor aesthetics to the patient.
Chemical change involves the drug itself because this is normally the most reactive
component of the system. Occasionally, it doesn’t involve the drug but is limited to
the excipient and/or the container for example the rusting of cans or flaking of glass,
this thus gives plastics added advantage. A hazardous occurrence within plastic is
the extraction of substances from the walls of plastic containers. Other chemical
changes, such as discoloration, may be harmless and quantitatively negligible but
could have serious effect on the acceptability of the product. Chemical change
occurs when stimulated by heat light, moisture and aeration. Thus antioxidants,
buffers and chelating agents are commonly added to offer protection against light
and moisture. Physical change may make a product inconvenient or impossible to
use and occasionally can lead to danger to patient. The growth of micro-organisms
can cause spoilage either by their appearance or because they have induced
significant chemical change (Huynh-Ba, 2009).
57
3. METHODOLOGY
3.1 HPLC method validation
3.1.1 Equipment
The HPLC system consisted of a complete FPLC Shimadzu® HPLC system which
has a SPD-M20A Prominence diode array detector, SIL-20A Prominence auto-
sampler, DGU-20A5 Prominence degasser, LC-20AB Prominence liquid
chromatography and CTO-10AS vp Prominence column oven ( Shimadzu, Tokyo,
Japan). The stationary phase consisted of a reverse phase Phenomenex® Luna C18
(2) column 250 mm × 4.60 mm, 5 μm particle size (Separations, Johannesburg, SA).
3.1.2 Materials and reagents
Phenylephrine hydrochloride, sodium citrate dihydrate, boric acid, disodium ededate,
sodium metabisulphite, and benzalkonium chloride were kindly donated by Aspen
Pharmacare (Port Elizabeth, SA). Water for chromatography was produced by an
Ultra Clear TWF/El-Ion® system which was pre-treated and made ultrapure (reverse
osmosis) (Separations, Johannesburg, SA). HPLC grade methanol and octane-1-
sulfonic acid sodium salt were obtained from Sigma-Aldrich (Pty) Ltd (Kempton Park,
SA). Analytical/technical grades of sodium hydroxide pellets, carboxy
methylcellulose sodium, hydroxylpropyl methylcellulose, glycerol, hydrochloride acid
solution 33% and pyrophosphoric acid (phosphoric acid) were obtained from Merck
Laboratory Supplies (Pty) Ltd (Midrand, SA) and hydrogen peroxide 30% was
sourced from Saarchem (Pty) Ltd (Johannesburg, SA).
3.1.3 Mobile phase preparation and standard curve construction
A mass of 1.1 g of octane-1-sulfonic acid sodium salt was dissolved in a Schott
bottle that contained one litre of a mixture of methanol and water (1:1). The pH was
adjusted to 3.0 with pyrophosphoric acid. The resulting solution was mixed,
degassed by ultrasonication (Ultrasonic LC 130, Labotec, Germany) and vacuum
filtered through a 0.45 μm Millipore filter (Millipore Corporation, Bedford,

58
Massachusetts, USA) prior to use. The dilution solvent was prepared by mixing
HPLC grade methanol and water in a 1:1 ratio and adjusted to a pH of 3 with
pyrophosphoric acid.
The standard curve: Phenylephrine hydrochloride stock solution was prepared by
accurately weighing 2 mg of phenylephrine hydrochloride material into a 100 ml
volumetric flask, dissolving it in dilution solvent and making up to volume with dilution
solvent. Calibration standards containing 0.0125, 0.025, 0.05, 0.075, 0.1 and 0.15
mg/ml were prepared by making appropriate solvent dilutions of the working stock
solution. Five millimetre of calibration standard was filtered through a 0.45 μm
Millex® Syringe Driven Filter Unit prior to injection
3.1.4 Chromatographic conditions
The flow rate was set at one millimetre per minute. The column temperature was set
at its temperature of 40 °C and column back-pressure varied between 2800 to 3000
psi. A PDA was used, therefore all runs were analysed at wave length, 280 nm. The
injection volume was 20 μl (USP, 2004). The assay was performed utilizing a reverse
phase Phenomenex® Luna C18 (2) column (250 mm × 4.60 mm, 5 μm particle size).
To identify the phenylephrine hydrochloride, the retention times of the peaks were
noted and to quantitate the amount of the API, values found of AUC (peak area)
which is computer-stored and generated was used. A graph of the concentrations vs.
peak area was plotted. Equation of the line was calculated using Microsoft Excel®
program. With the above, the following were determined: specificity, system
suitability, linearity, accuracy, precision, limit of detection/limit of quantification and
range.
3.1.5 Linearity
A 2 mg/ml stock solution was prepared and diluted to concentrations of 0.0125,
0.025, 0.05, 0.075, 0.1 and 0.15 mg/ml using the dilution solvent. The concentration
of 0.1 mg/ml was defined as 100% while 0.15 mg/ml was taken to be 150%. Each of
the concentrations was assayed in triplicate. The calibration curve was constructed

59
by plotting the peak areas of phenylephrine hydrochloride versus the respective
phenylephrine hydrochloride concentrations and a linear regression trend line was
fitted to the plot on Microsoft Excel® 2007, (Microsoft Corporation).
3.1.6 Accuracy and precision
Accuracy and precision were determined by replicate injection (n=3 and 6,
respectively) of three phenylephrine hydrochloride solutions, at the upper, middle,
and lower limits of the concentration range studied. The accuracy of a measurement
system is the degree of closeness of measurements of a quantity to that quantity's
actual (true) value (Green, 1996). The precision of a measurement system, also
called reproducibility or repeatability, is the degree to which repeated measurements
under unchanged conditions show the same results (ICH Harmonized Tripartite
Guideline Q2A, 1994). The concentration ranges were 0.0095 mg/ml (lower limit),
0.054 mg/ml (middle limit) and 0.138 mg/ml (upper limit). The theoretical
concentrations were calculated from the linear regression curve, and compared to
the actual concentrations tested. The actual mean concentration and standard
deviation were calculated at each theoretical concentration. The mean
concentrations and percentage recovery of phenylephrine hydrochloride obtained for
the replicate injections were a measure of the accuracy of the method, whilst the
relative standard deviations at any one concentration provided a measure of
precision. The requirement for accuracy is that the percentage recovery of
phenylephrine hydrochloride for each solution prepared must be within the 98.00 to
102.00% limit. The requirement for precision is that the relative standard deviations
at any one concentration must be less than or equal to 2.00%.
3.1.7 Limit of detection and limit of quantification
Sensitivity of the method was determined by means of the detection limit (LOD) and
quantification limit (LOQ). Calculations for LOD were based on the standard
deviation of the calibration curve (σ) and the slope of curve (S), using the equation
LOD = 3.3 × σ divided by S. LOQ was calculated using the equation LOQ = 3.33
multiplied by LOD (ICH Harmonized Tripartite Guideline Q2 (R1), 1994). Standard
solutions of decreasing concentration were produced by successive dilution of the

60
lowest calibration standard and the resulting solutions were injected in triplicate. A
volume or concentration of 0.01 ml, the least calibration standard concentration was
diluted 10 times.
3.1.8 Range and system suitability
The range was determined by observing the interval between the upper and lower
concentration of phenylephrine hydrochloride for which the HPLC analytical assay
has suitable level of linearity, accuracy and precision (ICH Harmonized Tripartite
Guideline Q2 (R1), 1994).
System suitability is a measure of the performance and chromatographic quality of
the total analytical system, namely instrumentation and procedure (ICH Harmonized
Tripartite Guideline Q2B, 1994). Six replicate injections of the standard solution of
phenylephrine hydrochloride were performed. The requirements for system suitability
are that the percentage relative standard deviation of the peak responses due to for
six injections must be less than or equal to 1.0 %. The tailing factor of the peak must
not be more than 2.0. A peak is labeled as tailing or asymmetrical when it deviates
from the ideal, symmetrical shape of a Gaussian peak. The later-eluted half of the
peak is wider than the front half and the broadening appears to be emphasized near
the baseline. Peak tailing is measured using the USP tailing factor (Tf) (Dolan,
2003). The tailing factor is expressed by: Tf = a + b
2a
where Tf = USP tailing factor
a = front half-width measured at 5 % of peak height
b = back half-width measured at 5 % of peak height (USP, 2004).
3.1.9 Specificity
Stress testing of API and finished product is undertaken to demonstrate specificity
when developing stability indicating methods (Reynolds et al., 2002). The API and
finished products were stressed in order to force phenylephrine hydrochloride
degradation. This would verify or exclude the presence of co-eluting impurities or
degradation products arising from the mobile phase, solvent, unstressed and
61
stressed products. The products are referred to as product I, II, III, IV, V and were
formulated as indicated in Table 5 (section 3.3.2). The nature of the specificity
samples and the relevant stress conditions are listed below:
All five products and the phenylephrine hydrochloride were subjected to the following
stress conditions after which they were analysed:
0.2 M NaOH for 30 minutes (reflux system).
0.2 M HCl for 30 minutes (reflux system).
0.2 M H2O2 for 30 minutes (reflux system).
UV lights (17 hours inside a stability chamber).
100 °C (24 hours inside a stability chamber).
65 °C (1 month inside a stability chamber).
40 °C / 75% RH (1 month inside a stability chamber).
Unstressed batch of phenylephrine hydrochloride and products I–V.
A quantity of 10 mg of unstressed phenylephrine hydrochloride was dissolved in 100
ml of dilution solvent and analysed using the HPLC method being validated. A
volume of 0.3 ml of unstressed products I–V was dissolved in 10 ml dilution solvent
and analysed using the HPLC method being validated.
A mass of 10 mg of phenylephrine hydrochloride was diluted to 100 ml with 0.2 M
HCl, 5 ml of this mixture was diluted to 25 ml with 0.2 M HCl and then refluxed for 30
minutes; the same manipulation was applied when using NaOH and H2O2. A
measured volume of 0.5 ml from product I–V was diluted to 100 ml with 0.2 M HCl
and refluxed for 30 minutes, 10 ml of this was diluted to 100 ml using the dilution
solvent, filtered and analysed using the HPLC method being validated.
Phenylephrine hydrochloride and products I–V were stressed in a stability chamber
(Binder, SA) which emitted both UV and visible light through a window glass filter
(type 2) and conformed to the requirements of the ICH guidelines. The stability
chamber had an irradiance level of 318 watts/m2 in order to expose the samples to
an overall illumination of not less than 1.2 million lux hours and an integrated near

62
UV energy of not less than 200 watt hours/m2 all according to ICH Harmonized
Tripartite Guideline Q1B, (2005).
All impurities and degradation products should be between 10 – 20 % of the API.
This includes samples stored under relevant stress conditions: light, heat, humidity,
acid/base hydrolysis and oxidation (ICH Harmonized Tripartite Guideline Q2 (R1),
2005). Degradants and impurities will be labeled as unknown (Ω) and if more than
one is present will be denoted as Ωi, Ωii, Ωiii and so on.
3.2 Determination of active–excipient compatibility
Active-excipients mixtures were achieved by mixing in a Schott beaker accurately
weighed 10 mg of phenylephrine hydrochloride and 10 mg of excipient, both were
dissolved in 10 ml ultra-pure water and transferred into plastic eye drop bottles. They
were stored at accelerated conditions for one month. A quantity of 5 ml was filtered
and analysed in triplicate using the validated HPLC method. The samples were
analysed before and after storage. The potency of the phenylephrine hydrochloride
was then calculated as a percentage of the initial potency. Significant change would
be defined as a 5% potency loss from the initial assay value of the API (Thakur et al.,
1999).
The assayed results of the active-excipient mixture were calculated on the
percentage of phenylephrine hydrochloride remaining in each sample from the linear
regression curve, y = 8541.1x + 438.55, taking the initial assay of phenylephrine
hydrochloride in each vial to be 100%. Physical stability was analyzed by visually
assessing the appearance and colour of the sample contents.
3.3 Manufacture of products
An important factor for eye drops is that they should be sterile when dispensed in a
multiple-application container. The preservative should be effective against
accidental introduction of micro-organisms and contaminants. The formulations were
manufactured in a clean environment in a laminar-flow hood using aseptic technique.

63
3.3.1 Materials
The hotplate magnetic stirrer utilized during the manufacturing process was a
Heidolph® MR 3002 (Labotec®, Midrand, SA), the storage chamber (BINDER® KMF
series, BINDER Inc, New York, USA) and the autoclave (Hirayama, New York,
USA), Natural dropper bottle 15 ml (LDPE) polyethylene container with closure
component (plugs with cap).Eeye drop bottles 13 MM CTRL dropper tip 0.031
needle natural (Amcor pharmaceutical packaging, New Jersey, USA), beakers and
graduated glass bottles (SCHOTT® North America, Inc. New York, USA), membrane
filter paper 0.45 µm (Millipore Corporation, Bedford, Massachusetts, USA), alcohol
preparation swabs WEBCOLTM, plastipak syringes (10 and 5 mL), HiCare int. latex
gloves large, avacare hypodermic needles (green) 21 g, alcohol 70% (particle free)
were all supplied by Alpha Pharm. Pty (Ltd), Port Elizabeth, South Africa.
3.3.2 Product manufacture
1 M Sodium Hydroxide: A mass of 40 g of sodium hydroxide was mixed in a round
bottom flask with one liter of purified water.
Hydroxypropyl methylcellulose (0.3%): A mass of 3 g of HPMC grade E5 was
dispersed in a beaker with 150 ml of purified water at 90 °C, when thoroughly
hydrated; 850 ml of ice water was added and stirred until a clear homogenous liquid
was formed.
Sodium carboxy methylcellulose (0.2%): A mass of 2 g of SCMC was dispersed in
a beaker with 150 ml of purified water at 90 °C, when thoroughly hydrated; 850 ml of
ice water was added and stirred until a clear homogenous liquid was formed.
The summary of the formulation excipients, API and concentration can be seen
below in Table 5.

64
Table 5: Formulation summary of active pharmaceutical ingredient and excipients used in the manufacturing of products I–V
Lot Size: 1L
Material Product I
Product II
Product III
Product IV
Product V
Phenylephrine Hydrochloride 10% w/v 10% w/v 10% w/v 10% w/v 10% w/v
Sodium citrate Dihydrate
0.1% w/v 0.1% w/v - - -
Sodium Metabisulfite
- 1% w/v - - -
Boric Acid - - - 1.9% w/v -
Benzalkonium Chloride
0.1% v/v 0.1% v/v - - -
Hydroxypropyl methylcellulose QS to
0.3% w/v 0.3% w/v - - 0.3% w/v
Methyl hydroxybenzoate - - 0.18% w/v - 0.18% w/v
Propyl hydroxybenzoate - - 0.02% w/v - 0.02% w/v
Sodium carboxy Methylcellulose to
- - - 0.2 % w/v -
Water Purified (RO) 10% v/v 10% v/v 10% v/v 10% v/v 10% v/v
Ethylenediaminetetraacetic Acid
- - - 0.1% w/v -
Glycerol to - - 100% v/v -
1 M Phosphoric acida
a
a
1 M Sodium Hydroxidei
i
i i
i and a – For pH adjustment only, ( - ) means it was absent from the formulation
3.3.2.1 Sterilization for heat sensitive API and exipients
The API and excipients were sterilized as follows: The heat sensitive PE was
steamed in a water bath at 100 °C for 30 minutes. Autoclave is not
recommended as phenylephrine hydrochloride has tendency to decompose
on heating.
All other equipments and excipients were autoclaved as follows: 121 °C for 15
minutes at 1 atm (200 kPa or 15 psi).
After sterilization the bottles containing products were shaken every 15
minutes until cool, to make sure HPMC and SCMC stayed fully mixed and
hydrated.
3.3.3 Manufacturing methods for products I–V
The manufacturing processes followed the same general method, with slight
variations in the processes based on certain excipeints. The few exceptions are seen
with the preservatives methyl and propyl hydroxybenzoate. Ingredients were added

65
sequentially to the main portion of solution while mixing with the glass rod. The
formulation was mixed until visually homogenous before addition of the next
ingredient. The methyl and propyl hydroxybenzoate were dissolved in ultra-pure
water with the aid of gentle heat and mixing with a glass rod. Addition of the
dissolved preservatives to the bulk solution was done to ensure complete
quantitative transfer of all preservatives to the bulk formulation. The solution was
then transferred to a calibrated plastic bottle, the dropper inserted and the bottle
capped. The stability of the formulations was determined in the primary plastic
packaging. The laboratory scale manufacturing processes for the five products
(products I–V) can be seen in figures 5 to 9.
Figure 5: Laboratory scale 1000 ml manufacturing process of product I
3) Filtered and pasteurized at
100 °C for 30 minutes in
water bath
ii) Sodium citrate dihydrate 0.1% w/v Benzalkonium chloride 0.1% v/v HPMC 0.3% w/v to 100%
iii) Disperse and mix with a glass
rod until all dissolve
iv) Autoclave mixture at 121 °C for
15 minutes
5) Aseptically and
quantitatively mixed
6) A volume of 15 ml was
aseptically and quantitatively
transferred to the calibrated
plastic eye-drop bottle which
was capped.
4) Cooled to room
temperature of 25 °C
1) Ultra pure water 10% v/v
2) Disperse and mix with a glass
rod until all dissolve i) Phenylephrine hydrochloride 10% w/v

66
Figure 6: Laboratory scale 1000 ml manufacturing process of product II
ii) Sodium citrate dihydrate 0.1% w/v Sodium metabisulfite 0.1% w/v HPMC 0.3 % w/v to 100%
iii) Disperse and mix with a glass
rod until all dissolve
iv) Autoclave mixture at 121 °C for
15 minutes
3) Filtered and pasteurized at
100 °C for 30 minutes in
water bath
1) Ultra pure water 10%v/v
4) Cooled to room
temperature of 25 °C
5) Aseptically and
quantitatively mixed
6) A volume of 15 ml was
aseptically and quantitatively
transferred to the calibrated
plastic eye-drop bottle which
was capped
2) Disperse and mix with a
glass rod until all dissolve i) Phenylephrine hydrochloride 10% w/v

67
Figure 7: Laboratory scale 1000 ml manufacturing process of product III
ii)Methyl hydroxy benzoate 0.18% w/v Propyl hydroxy benzoate 0.02% w/v Glycerol to 100% v/v
iii) Disperse and mix with a glass
rod until all dissolve
iv) Autoclave mixture at 121 °C for
15 minutes
1) Ultra pure water 10% v/v
4) Cooled to room
temperature of 25 °C
5) Aseptically and
quantitatively mixed
6) A volume of 15 ml was
aseptically and quantitatively
transferred to the calibrated
plastic eye-drop bottle which
was capped.
2) Disperse and mix with a
glass rod until all dissolve i)Phenylephrine hydrochloride 10%
w/v
3) Filtered and pasteurized at
100 °C for 30 minutes in water
bath

68
Figure 8: Laboratory scale 1000 ml manufacturing process of product IV
ii) Boric acid 1.9% w/v EDTA 0.1% w/v SCMC 0.2% w/v to 100%
iii) Disperse and mix with a glass rod
until all dissolve
iv) Autoclave mixture at 121 °C for 15
minutes
1) Ultra pure water 10% v/v
%
4) Cooled to room
temperature of 25 °C
5) Aseptically and
quantitatively mixed
3) Filtered and pasteurized at
100 °C for 30 minutes in water
bath
2) Disperse and mix with a glass
rod until all dissolve i) Phenylephrine hydrochloride 10%
w/v
6) A volume of 15 ml was
aseptically and quantitatively
transferred to the calibrated
plastic eye-drop bottle which
was capped.
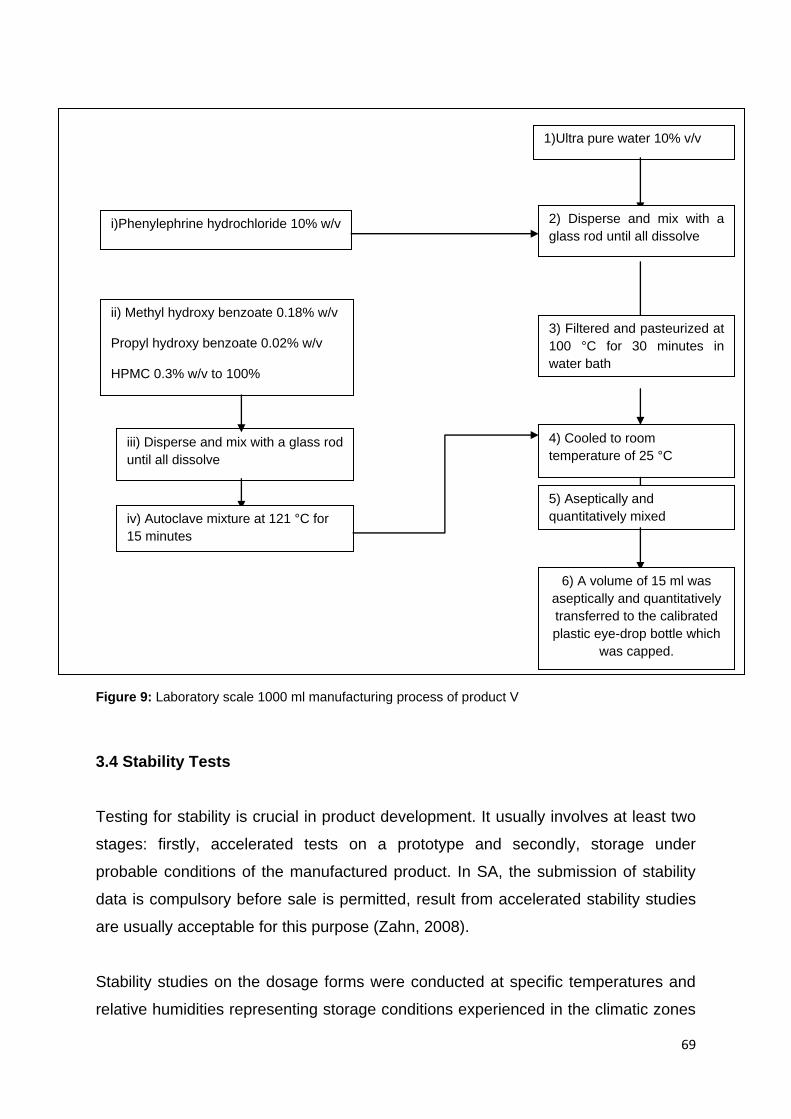
69
Figure 9: Laboratory scale 1000 ml manufacturing process of product V
3.4 Stability Tests
Testing for stability is crucial in product development. It usually involves at least two
stages: firstly, accelerated tests on a prototype and secondly, storage under
probable conditions of the manufactured product. In SA, the submission of stability
data is compulsory before sale is permitted, result from accelerated stability studies
are usually acceptable for this purpose (Zahn, 2008).
Stability studies on the dosage forms were conducted at specific temperatures and
relative humidities representing storage conditions experienced in the climatic zones
ii) Methyl hydroxy benzoate 0.18% w/v Propyl hydroxy benzoate 0.02% w/v HPMC 0.3% w/v to 100%
iii) Disperse and mix with a glass rod
until all dissolve
iv) Autoclave mixture at 121 °C for
15 minutes
1)Ultra pure water 10% v/v
4) Cooled to room
temperature of 25 °C
5) Aseptically and
quantitatively mixed
6) A volume of 15 ml was
aseptically and quantitatively
transferred to the calibrated
plastic eye-drop bottle which
was capped.
3) Filtered and pasteurized at
100 °C for 30 minutes in
water bath
2) Disperse and mix with a
glass rod until all dissolve i)Phenylephrine hydrochloride 10% w/v

70
of South Africa (climatic zones I and II). The formulations were stored at 40
°C/75%RH, 25 °C/40%RH and 30 °C/65%RH. The five formulations were stored at
all three of the above mentioned conditions and tested in triplicate at 0, 3, and 6
months. The most appropriate and stable formulation was chosen based on the level
of degradation of the phenylephrine hydrochloride, pH change and appearance.
3.5 Qualitative and quantitative analysis of the formulations
3.5.1 Appearance and pH
The bulk appearance of the prepared products was visually examined for colour,
homogeneity, and for the appearance of any precipitate. The pH of the solutions
was measured using a pH/mV/ °C meter (744 pH meter, metrohm). Each solution
was stirred with a magnetic stirrer (Hanna instruments supplied by Tecnilab, SA) for
30 seconds before pH measurement.
3.5.2 Phenyleprine hydrochloride concentration
The unknown peaks have to be less than or equal to 1% while the phenylephrine
hydrochloride left must be between 95%–105% to be accepted as a successful
formulation. The mean peak area was divided by the theoretical amount of drug
found in the formulation multiplied as a percentage to give the final result of
phenylephrine hydrochloride left.
3.6 Test for preservative efficacy
The test challenged the formulation in its final primary container, with a prescribed
inoculum of suitable micro-organisms, storing the inoculated product at a prescribed
temperature, withdrawing the samples from the container at specified intervals of
time and counting the organisms in the samples removed. The two methods used
for determining bacterial numbers were the standard (viable) plate count method and
spectrophotometric (turbidimetric) analysis. The standard plate method reveals
information related to live bacteria while indirectly measuring cell density. The
71
spectrophotometric method is based on turbidity and indirectly measures all bacteria
(cell biomass), dead or alive (Harley and Prescott, 1998).
3.6.1 Procedure for standard plate count
Materials: Cultures of Escherichia coli (ATCC No. 38218), Candida albicans (ATCC
No. 66027), Pseudomonas aeruginosa (ATCC No. 27853), Staphylococcus aureus
(ATCC No. 43300) were obtained from the Department of Biomedical Technology at
the Nelson Mandela Metropolitan University. The bacteria were chosen because of
their classification as well as pathogenicity. Pipettes, petri plates, curvettes
(Hellma®, precision cells, Lasec, Johannesburg, SA) were obtained from Lasec
(Johannesburg, SA). Bunsen burner, platinum loop wire dispensers (1/200 mL)
(Lasec, Johannesburg, SA), water was produced by Ultra Clear TWF/El-Ion® system
which was pre-treated and made ultrapure (reverse osmosis) (Separations,
Johannesburg, SA). Tryptone soya broth and agar, Sabouraud broth and agar were
supplied by Sigma-Aldrich (Pty) Ltd (Kempton Park, SA). Sodium chloride was
obtained from Merck Laboratory Supplies (Pty) Ltd (Midrand, SA). Hockey stick was
obtained from Lasec (Johannesburg, SA). Tecam® SB-16 Shaking Water bath was
obtained from Spellbound Laboratory solutions (Port Elizabeth, SA). Vacutec
(Johannesburg, SA) supplied the P Spectra colony counter, Shimadzu® UV
spectrophotometer (UV-1800) (Shimadzu, Tokyo, Japan).
Media preparations: All broths and agars poured into 1000 ml Schott bottles with a
screw cap and autoclaved at 121 °C for 15 minutes. Tryptone soya broth was made
by weighing 25 g and dissolving 1000 ml of distilled water. Tryptone soya agar was
made by weighing 40 g which was dissolved in 1000ml of distilled water. Sabouraud
broth was made by weighing 30 g which was dissolved in 1000 ml of distilled water.
Sabouraud agar was made by weighing 45 g which was dissolved in 1000 ml of
distilled water.
3.6.2 Procedure for plating the bacteria and fungi
All Petri dishes and saline bottles were labelled accordingly. Using aseptic
technique, 0.1 ml was added to a 9.9 ml sterile saline and was shaken vigorously to

72
distribute the bacteria. A volume of 0.1 ml of this was aseptically transferred to a
second 9.9 ml sterile saline, it was then capped and the second dilution was shaken
vigorously. The process was repeated until 10-8 dilution was attained. Volumes of 0.1
ml and 0.01 ml from each dilution of microbes were aseptically transferred to petri
plates. The tryptone soya agar at 48 °C was aseptically poured into a petri dish. The
agar and sample were immediately mixed by gently moving the plate in a figure-eight
motion. The process was repeated for the other plates which were then left to cool;
they were inverted and incubated at 35 °C for 24 hours. The plates were counted
using the P Spectra® colony counter. Plates with more than 250 colonies were not
counted and were labelled too numerous to count (TNTC). Plates with fewer than 25
colonies were designated too few to count (TFTC). The colony forming unit per
millilitre was calculated by dividing the number of colonies by the dilution factor
(Harley and Prescott, 1998).
3.6.3 Standardization of cultures using turbidimetry method
One empty tube and five tubes containing 3 ml of sterile tryptone soya broth were
placed in a test-tube rack and labelled A–E, with the exception of the empty tube.
The five tubes of broth were used to make five serial dilutions of the culture. With the
aid of a spectrophotometer (Shimadzu® UV spectrophotometer (UV-1800) and
curvettes (Hellma®, precision cells) the different cultures were standardized at a
wavelength of 600 nm; the blank was a sterile broth without the culture. From the
culture broth, different absorbance concentrations of 0.200 to 1.0 were achieved with
sterile saline using the serial dilution method. Each absorbance concentration was
plated and the colony counted in triplicate. A straight line graph was constructed by
plotting the absorbance of the culture broth at 600 nm versus the number of colony
forming units, and a linear regression trendline was fitted to the plot (Microsoft
Excel® 2007, Microsoft Corporation). A linear relationship was found with all the
organisms, as indicated by the linear correlation coefficient (R2), which was greater
than 0.99, even though the y-intercepts were significantly different to zero (Harley
and Prescott, 1998). This method was applied to the different microorganism.

73
3.6.4 Preservative efficacy
The preservative properties of the formulation are adequate if, in the conditions of
the test, there is a significant fall or no increase in the number of micro-organisms in
the inoculated product after the times and at the temperatures prescribed. Negative
controlled samples were prepared by excluding preservatives, and inoculums of 100
µl of 106 CFU/ml were added to both control and products I–V. The inoculated
samples were stored away from light at 25 °C for 6 hours, 24 hours, 7 days, 14 days
and 28 days. Aliquots of 1 ml were removed from each sample at zero, six and 24
hours and after 7, 14 and 28 days intervals. The sampled were then enumerated.
One milliliter aliquots were transferred to a sterile 10 ml nutrient broth and plated in
duplicate on tryptone soya agar (for bacteria) or Sabouraud dextrose agar (for fungi).
Plates were incubated at 35 °C for 48 hours for bacteria and 25 °C for 72 hours for
fungi. Raw data counts were converted to log10 values and the reduction from
inoculum values was calculated for evaluation against compendial requirements
found in Table 6 below.
Table 6: Criteria for tested microorganisms (USP, 2004)
Category 1 products such as eye drops
Bacteria Not less than 1.0 log reduction from the initial calculated count at 7 days, not less than 3.0 log reduction from the initial count at 14 days, and no increase from the 14 days' count at 28 days.
Yeast and molds
No increase from the initial calculated count at 7, 14, and 28 days.
The samples were diluted in a 1:10 ratio at the time of testing, 10 CFU (or 1.0 log
reduction) is the lowest sensitivity allowed by the test.
3.7 Determination of viscosity
3.7.1 Equipments and method
All measurements were performed with an Anton Paar RheolabQC rheometer with
cylinder measuring CC27 according to ISO 3219. ISO 3219 describes the
dimensions of the cylinder geometry and defines the ratio of measuring cup radius to
measuring bob radius as 1.0847. This guarantees an industrial standard for shearing
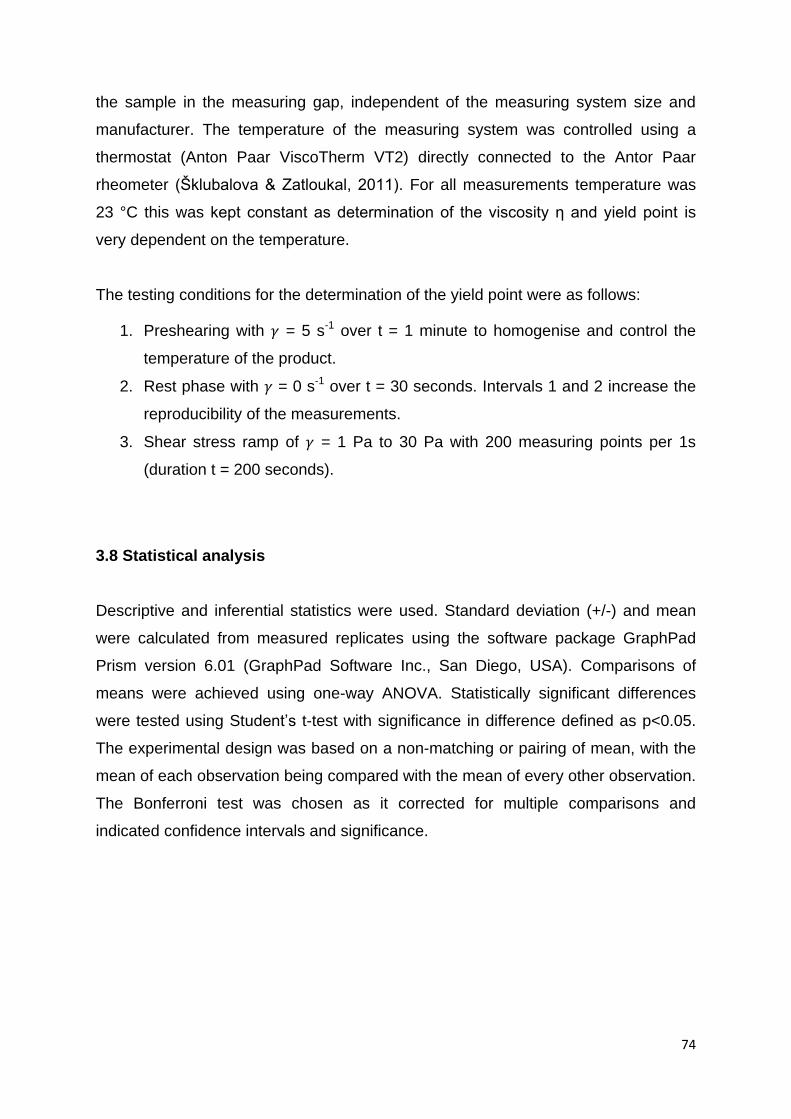
74
the sample in the measuring gap, independent of the measuring system size and
manufacturer. The temperature of the measuring system was controlled using a
thermostat (Anton Paar ViscoTherm VT2) directly connected to the Antor Paar
rheometer (Šklubalova & Zatloukal, 2011). For all measurements temperature was
23 °C this was kept constant as determination of the viscosity η and yield point is
very dependent on the temperature.
The testing conditions for the determination of the yield point were as follows:
1. Preshearing with = 5 s-1 over t = 1 minute to homogenise and control the
temperature of the product.
2. Rest phase with = 0 s-1 over t = 30 seconds. Intervals 1 and 2 increase the
reproducibility of the measurements.
3. Shear stress ramp of = 1 Pa to 30 Pa with 200 measuring points per 1s
(duration t = 200 seconds).
3.8 Statistical analysis
Descriptive and inferential statistics were used. Standard deviation (+/-) and mean
were calculated from measured replicates using the software package GraphPad
Prism version 6.01 (GraphPad Software Inc., San Diego, USA). Comparisons of
means were achieved using one-way ANOVA. Statistically significant differences
were tested using Student’s t-test with significance in difference defined as p<0.05.
The experimental design was based on a non-matching or pairing of mean, with the
mean of each observation being compared with the mean of every other observation.
The Bonferroni test was chosen as it corrected for multiple comparisons and
indicated confidence intervals and significance.

75
4. RESULTS AND DISCUSSION
4.1 Validation of the stability indicating assay
The method used to analyse the formulations was obtained from the USP. Though it
was a pharmacopoeial method its suitability for use on the present system had to be
validated. The validation process followed ICH guidelines and the results are
indicated below.
4.1.1 Linearity
Linearity is determined by a calibration curve which was constructed by plotting the
area of the phenylephrine hydrochloride peak versus phenylephrine hydrochloride
concentration. Figure 10 below shows linearity over the concentration range of
0.0125 to 0.15 mg/ml. The linear regression equation was y = 8541.1x + 438.55, with
a correlation coefficient, R2, equal to 0.9999. The requirements for linearity were
attained, as the correlation coefficient of the regression line was greater than 0.999
and the percentage relative standard deviations for the phenylephrine hydrochloride
peak areas of multiple injections 0.0125, 0.025, 0.05, 0.075, 0.1 and 0.15 mg/ml
were all less than 1.5%. This means that the results achieved are directly
proportional to the concentration of phenylephrine hydrochloride within a given
range. 8541.1 defines the slope, y, is 438.55.
Figure 10: Graph showing a mean peak area versus concentration of replicate samples of phenylephrine hydrochloride standards. Linear regression equation: y = 8541.1x + 438.55, R
2 =
0.9999.
.
0
200000
400000
600000
800000
1000000
1200000
1400000
0 0.05 0.1 0.15 0.2
pe
ak
are
a
concentration (mg/ml)
linearity graph of phenylephrine hydrochloride standards
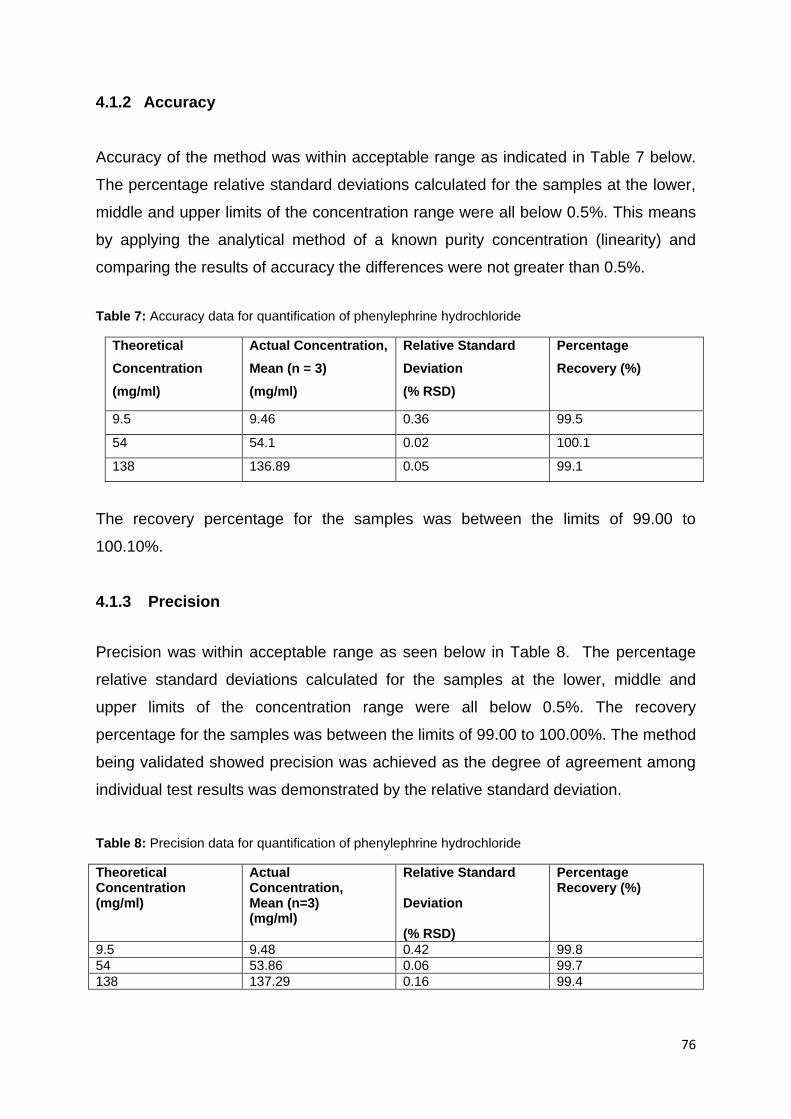
76
4.1.2 Accuracy
Accuracy of the method was within acceptable range as indicated in Table 7 below.
The percentage relative standard deviations calculated for the samples at the lower,
middle and upper limits of the concentration range were all below 0.5%. This means
by applying the analytical method of a known purity concentration (linearity) and
comparing the results of accuracy the differences were not greater than 0.5%.
Table 7: Accuracy data for quantification of phenylephrine hydrochloride
Theoretical
Concentration
(mg/ml)
Actual Concentration,
Mean (n = 3)
(mg/ml)
Relative Standard
Deviation
(% RSD)
Percentage
Recovery (%)
9.5 9.46 0.36 99.5
54 54.1 0.02 100.1
138 136.89 0.05 99.1
The recovery percentage for the samples was between the limits of 99.00 to
100.10%.
4.1.3 Precision
Precision was within acceptable range as seen below in Table 8. The percentage
relative standard deviations calculated for the samples at the lower, middle and
upper limits of the concentration range were all below 0.5%. The recovery
percentage for the samples was between the limits of 99.00 to 100.00%. The method
being validated showed precision was achieved as the degree of agreement among
individual test results was demonstrated by the relative standard deviation.
Table 8: Precision data for quantification of phenylephrine hydrochloride
Theoretical Concentration (mg/ml)
Actual Concentration, Mean (n=3) (mg/ml)
Relative Standard Deviation (% RSD)
Percentage Recovery (%)
9.5 9.48 0.42 99.8
54 53.86 0.06 99.7
138 137.29 0.16 99.4

77
4.1.4 Limit of detection (LOD) and quantification (LOQ)
The LOD was determined by serial dilutions of the lowest concentration (0.0125
mg/ml) of the attained phenylephrine hydrochloride standard and found to be 12.3
μg/ml. The amount stated is the lowest amount of phenylephrine hydrochloride in a
sample that can be detected. The LOD is the lowest concentration for which the
relative standard deviation of multiple injections is less than 5.0%. The LOQ was
found to be 41 μg/ml. The amount shows the lowest amount of analyte in a sample
that can be determined with acceptable precision and accuracy. By convention, the
LOD value is taken as 0.3 times the LOQ (Armbruster & Pry, 2008) while LOQ = 3.33
LOD (Thomsen et al., 2003). The results of the two did fit this mathematical
assumption. These methods are HPLC specific and are dependent on the type of
HPLC conditions; therefore re-determination in each laboratory is necessary. The
range was 0.0125 to 0.15 mg/ml.
4.1.5 Specificity and system suitability
Specificity of a chromatographic method is the ability of the method to accurately
measure the analyte response in the presence of all potential sample components.
Specificity is useful to show that an analyte response cannot be attributed to more
than one component (Rozet et al., 2011). The chromatograms were examined for the
presence of compounds, metabolites, impurities, degradants and matrix components
that may interfere or partly co-elute with the phenylephrine hydrochloride peak.
The mean peak area for the 6 replicate injections of phenylephrine hydrochloride had
a percentage relative standard deviation of 0.14 %. The tailing factor was 2.0. The
analytical system thus complied with the requirements specified by the system
suitability as the percentage relative standard deviation of the peak responses due to
phenylephrine hydrochloride for six injections was less than 1.0 %. The column was
thus deemed suitable for analysis. There is a peak tailing as potrayed in the
chromatograms, some reasons could be due to more than one retention mechanism
is present in a separation, and one of those mechanisms is overloaded. At the
surface, the polymer terminates in silanol groups. There are different possible silanol
configurations which are abundant at the surface of the columns as free silanols, but

78
silicon atoms with two hydroxyl groups in a geminal configuration also are present. If
the silanol groups are positioned next to each other, an associated silanol group can
share a proton with an adjacent group. The free silanol groups are more acidic than
the geminal and associated groups, and they interact more strongly with basic
solutes. The result is peak tailing commonly associated with the separation of bases.
To further complicate matters, trace metals (e.g., iron and aluminium) can be present
in the silica matrix. These trace metals can act as ion-exchange sites or, when
adjacent to free silanols, can withdraw electrons, which makes the silanols even
more acidic. To reduce the incidence of tailing or fronting, concentrations should be
reduced proportionally by appropriate dilutions (Dolan, 2003).
Mobile phase chromatogram showed no interference as it produced a chromatogram
which had a steady baseline and no ghost peaks as seen in Figure 11.
Figure 11: HPLC Chromatogram for mobile phase alone.
The peak produced by phenylephrine hydrochloride shows no interference from
contaminants or impurities. Figure 12 below shows it eluted after 7.8 minutes and
had an average retention time of 7 minutes. This means the conditions and
concentrations were suitable for the phenylephrine hydrochloride standard. The
purity peak shows the phenylephrine hydrochloride standard was pure as the value
was 1.0, the closer the value is to one the purer a compound is. The start of the
mobile phase for the gradient elution was different from the dilution solvent; as a
result a constant peak is noted between 2.5 and 3.5 minutes as seen in the figures
below. They are known as ghost or false peaks. It takes that amount of time for the
injected solvent to reach the detector and the polarity differences caused by the
changes in pH and solvent phase causes it to be identified as a peak. The peaks
were not symmetrical and fronting or tailing was found to be 2.0.

79
Figure 12: HPLC Chromatogram for phenylephrine hydrochloride dissolved in mobile phase with a retention time of 7.80 minutes.
Figure 13: Peak purity profile calculated using PDA data (from 190–800 nm) for phenylephrine hydrochloride prepared in mobile phase. Peak shown in pink and purity curve in black. Peak purity index = 1.00000; Single point threshold = 0.999999.
Products I–V without any stress are indicated below in figures 14–23. They show
purity indexes of 1.0 and chromatograms showing no co-elution or impurities. The
average retention time for PE was 7.85 minutes.
Figure 14: HPLC Chromatogram for product I dissolved in mobile phase with a retention time of 7.87 minutes.
0.0 2.5 5.0 7.5 10.0 12.5 min
0
5
10
15
20
25
30
35
40
45
mAU280nm,4nm (1.00)
7.5 8.0 min
0.0
0.1
0.2
0.3
0.4
0.5
0.6
0.7
0.8
0
10
20
30
40
50
60
mAUPeak
Zero LinePurity Curve
0.0 2.5 5.0 7.5 10.0 12.5 min
-5
0
5
10
15
20
25
30
35
40
45
50
55
60
mAU280nm,4nm (1.00)
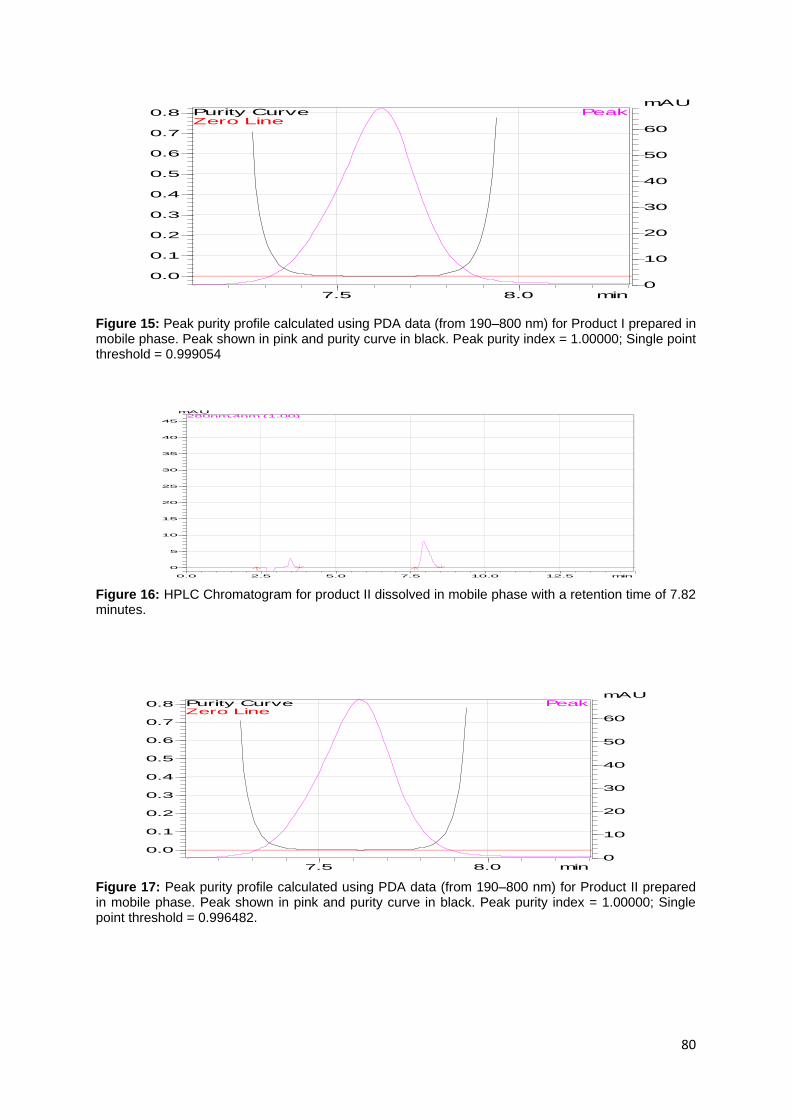
80
Figure 15: Peak purity profile calculated using PDA data (from 190–800 nm) for Product I prepared in mobile phase. Peak shown in pink and purity curve in black. Peak purity index = 1.00000; Single point threshold = 0.999054
Figure 16: HPLC Chromatogram for product II dissolved in mobile phase with a retention time of 7.82 minutes.
Figure 17: Peak purity profile calculated using PDA data (from 190–800 nm) for Product II prepared in mobile phase. Peak shown in pink and purity curve in black. Peak purity index = 1.00000; Single point threshold = 0.996482.
7.5 8.0 min
0.0
0.1
0.2
0.3
0.4
0.5
0.6
0.7
0.8
0
10
20
30
40
50
60
mAUPeak
Zero LinePurity Curve
0.0 2.5 5.0 7.5 10.0 12.5 min
0
5
10
15
20
25
30
35
40
45
mAU280nm,4nm (1.00)
7.5 8.0 min
0.0
0.1
0.2
0.3
0.4
0.5
0.6
0.7
0.8
0
10
20
30
40
50
60
mAUPeak
Zero LinePurity Curve

81
Figure 18: HPLC Chromatogram for product III dissolved in mobile phase with a retention time of 7.83 minutes.
Figure 19: Peak purity profile calculated using PDA data (from 190–800 nm) for Product III prepared in mobile phase. Peak shown in pink and purity curve in black. Peak purity index = 1.00000; Single point threshold = 0.998178.
Figure 20: HPLC Chromatogram for product IV dissolved in mobile phase with a retention time of 7.89 minutes.
0.0 2.5 5.0 7.5 10.0 12.5 min
0
5
10
15
20
25
30
35
40
45
50
mAU280nm,4nm (1.00)
7.5 8.0 min
0.0
0.1
0.2
0.3
0.4
0.5
0.6
0.7
0.8
0
10
20
30
40
50
60
mAUPeak
Zero LinePurity Curve
0.0 2.5 5.0 7.5 10.0 12.5 min
0
5
10
15
20
25
30
35
40
45
mAU280nm,4nm (1.00)

82
Figure 21: Peak purity profile calculated using PDA data (from 190–800 nm) for Product IV prepared in mobile phase. Peak shown in pink and purity curve in black. Peak purity index = 1.00000; Single point threshold = 0.996947.
Figure 22: HPLC Chromatogram for product V dissolved in mobile phase with a retention time of 7.84 minutes.
Figure 23: Peak purity profile calculated using PDA data (from 190–800 nm) for product V prepared in mobile phase. Peak shown in pink and purity curve in black. Peak purity index = 1.00000; Single point threshold = 0.999587.
7.5 8.0 min
0.0
0.1
0.2
0.3
0.4
0.5
0.6
0.7
0.8
0
10
20
30
40
50
60
mAUPeak
Zero LinePurity Curve
0.0 2.5 5.0 7.5 10.0 12.5 min
0
5
10
15
20
25
30
35
40
45
mAU280nm,4nm (1.00)
7.5 8.0 min
0.0
0.1
0.2
0.3
0.4
0.5
0.6
0.7
0.8
0
10
20
30
40
50
60
mAUPeak
Zero LinePurity Curve
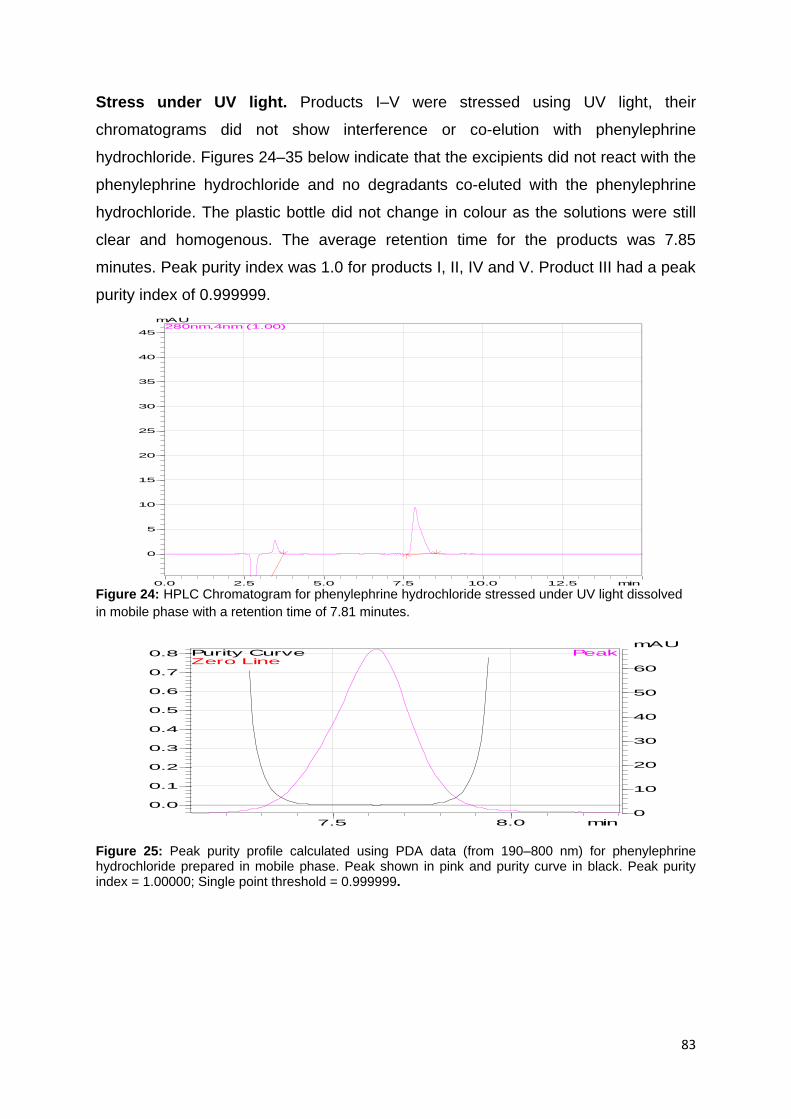
83
Stress under UV light. Products I–V were stressed using UV light, their
chromatograms did not show interference or co-elution with phenylephrine
hydrochloride. Figures 24–35 below indicate that the excipients did not react with the
phenylephrine hydrochloride and no degradants co-eluted with the phenylephrine
hydrochloride. The plastic bottle did not change in colour as the solutions were still
clear and homogenous. The average retention time for the products was 7.85
minutes. Peak purity index was 1.0 for products I, II, IV and V. Product III had a peak
purity index of 0.999999.
Figure 24: HPLC Chromatogram for phenylephrine hydrochloride stressed under UV light dissolved
in mobile phase with a retention time of 7.81 minutes.
Figure 25: Peak purity profile calculated using PDA data (from 190–800 nm) for phenylephrine hydrochloride prepared in mobile phase. Peak shown in pink and purity curve in black. Peak purity index = 1.00000; Single point threshold = 0.999999.
0.0 2.5 5.0 7.5 10.0 12.5 min
0
5
10
15
20
25
30
35
40
45
mAU280nm,4nm (1.00)
7.5 8.0 min
0.0
0.1
0.2
0.3
0.4
0.5
0.6
0.7
0.8
0
10
20
30
40
50
60
mAUPeak
Zero LinePurity Curve
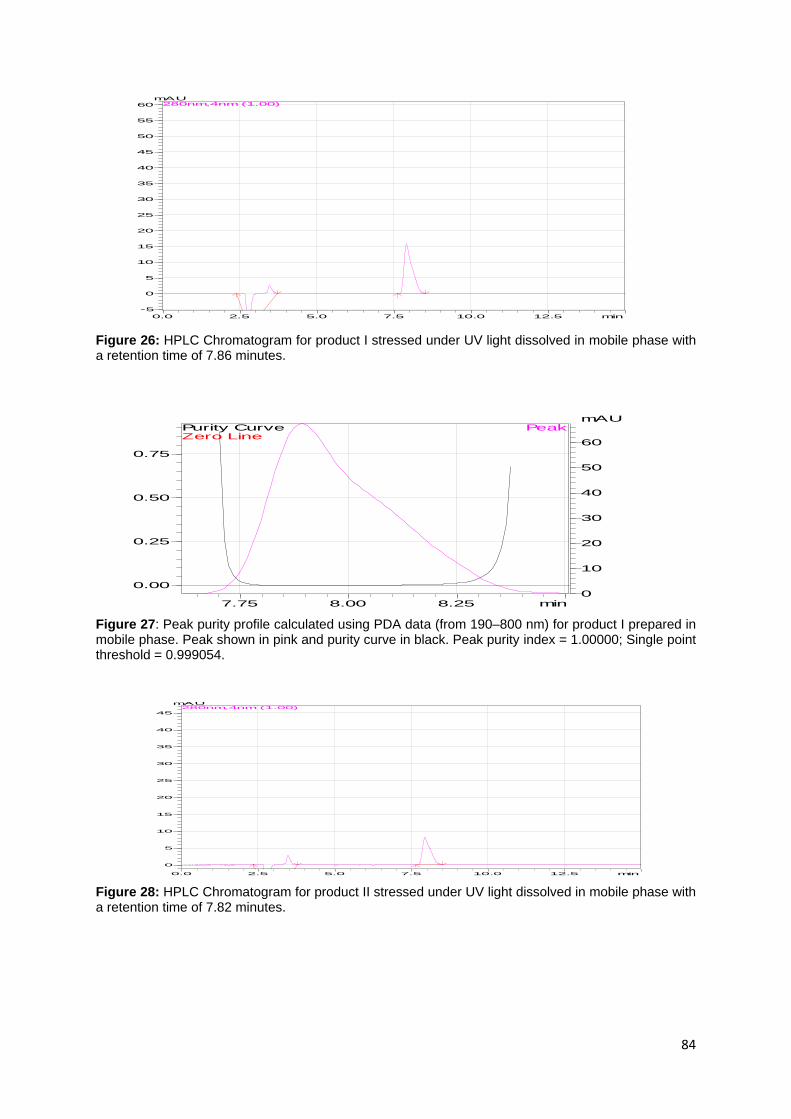
84
Figure 26: HPLC Chromatogram for product I stressed under UV light dissolved in mobile phase with a retention time of 7.86 minutes.
Figure 27: Peak purity profile calculated using PDA data (from 190–800 nm) for product I prepared in mobile phase. Peak shown in pink and purity curve in black. Peak purity index = 1.00000; Single point threshold = 0.999054.
Figure 28: HPLC Chromatogram for product II stressed under UV light dissolved in mobile phase with a retention time of 7.82 minutes.
0.0 2.5 5.0 7.5 10.0 12.5 min
-5
0
5
10
15
20
25
30
35
40
45
50
55
60
mAU280nm,4nm (1.00)
7.75 8.00 8.25 min
0.00
0.25
0.50
0.75
0
10
20
30
40
50
60
mAUPeak
Zero LinePurity Curve
0.0 2.5 5.0 7.5 10.0 12.5 min
0
5
10
15
20
25
30
35
40
45
mAU280nm,4nm (1.00)

85
Figure 29: Peak purity profile calculated using PDA data (from 190–800 nm) for product II in mobile phase. Peak shown in pink and purity curve in black. Peak purity index = 1.00000; Single point threshold = 0.999116.
Figure 30: HPLC Chromatogram for product III stressed under UV light dissolved in mobile phase with a retention time of 7.85 minutes.
Figure 31: Peak purity profile calculated using PDA data (from 190–800 nm) for product III in mobile phase. Peak shown in pink and purity curve in black. Peak purity index = 0.999999; Single point threshold = 0.997116.
7.75 8.00 8.25 min
0.00
0.25
0.50
0.75
0.0
5.0
10.0
15.0
20.0
25.0
30.0
mAUPeak
Zero LinePurity Curve
0.0 2.5 5.0 7.5 10.0 12.5 min
0
5
10
15
20
25
30
35
40
45
50
mAU280nm,4nm (1.00)
7.75 8.00 8.25 min
0.0
0.1
0.2
0.3
0.4
0.5
0.0
5.0
10.0
15.0
20.0
25.0
30.0
35.0
mAUPeak
Zero LinePurity Curve

86
Figure 32: HPLC Chromatogram for product IV stressed under UV light dissolved in mobile phase with a retention time of 7.81 minutes.
Figure 33: Peak purity profile calculated using PDA data (from 190–800 nm) for product IV in mobile
phase. Peak shown in pink and purity curve in black. Peak purity index = 1.000000; Single point
threshold = 0.997916.
Figure 34: HPLC chromatogram for product V stressed under UV light dissolved in mobile phase with a retention time of 7.87 minutes.
0.0 2.5 5.0 7.5 10.0 12.5 min
0
5
10
15
20
25
30
35
40
45
mAU280nm,4nm (1.00)
7.75 8.00 8.25 min
0.00
0.25
0.50
0.75
0.0
5.0
10.0
15.0
20.0
25.0
30.0
35.0
mAUPeak
Zero LinePurity Curve
0.0 2.5 5.0 7.5 10.0 12.5 min
0
5
10
15
20
25
30
35
40
45
mAU280nm,4nm (1.00)

87
Figure 35: Peak purity profile calculated using PDA data (from 190–800 nm) for product V in mobile phase. Peak shown in pink and purity curve in black. Peak purity index = 1.000000; Single point threshold = 0.997475.
No colour change was observed with products I–V and phenylephrine hydrochloride
remained stable under the UV light stress. If it was unstable a colour chang would be
observed from clear to dark brown. The average concentrations of the products
remained at 99.01%. Using the above mentioned statistical analysis (one-way
ANOVA), there were no significant difference in the API concentration among the
products (I–V) manufactured at time zero (T0). They had a P-value of p > 0.9999, this
meant that the products during formulation and testing maintained their API at T0.
Physical and chemical degradation are known to occur in phenylephrine
hydrochloride and this is sometimes accompanied by a change in color, e.g.
changing from a white or almost white colour into a darker, brownish color.
Discoloration is accelerated by light, but it occurs eventually even in light-protected
solutions. Degradation of phenylephrine hydrochloride may be caused by a variety of
factors including the presence of oxygen, moisture, reducing sugars, bases and high
temperature (Douša et al., 2011)
Stress with HCl: Products I–V were stressed with HCl, their chromatograms did not
show interference or co-elution with phenylephrine hydrochloride. Figures 36–47
below indicates that the excipients did not react with the phenylephrine hydrochloride
and no degradants co-eluted with the phenylephrine hydrochloride. Discolorations
were observed during the reflux of products I–V with HCl, the colours ranged from
7.75 8.00 8.25 min
0.0
0.1
0.2
0.3
0.4
0.5
0.0
5.0
10.0
15.0
20.0
25.0
30.0
35.0
mAUPeak
Zero LinePurity Curve

88
very light yellow to yellow. The greatest change was observed in product III, as it
turned bright yellow. These could mean glycerol, HCl and phenylephrine
hydrochloride were undergoing a reaction of oxidation or reduction. The average
retention time for the products was 7.85 minutes. Peak purity index was 1.0 for
products I–V however; the average API concentration had reduced to 79.64 %.
Figure 36: HPLC chromatogram of phenylephrine hydrochloride stressed with 0.2 M HCl dissolved in mobile phase with a retention time of 7.86 minutes.
Figure 37: Peak purity profile calculated using PDA data (from 190–800 nm) for phenylephrine hydrochloride in mobile phase. Peak shown in pink and purity curve in black. Peak purity index = 1.000000; Single point threshold = 0.999574.
Figure 38: HPLC chromatogram of Product I stressed with 0.2 M HCl dissolved in mobile phase with a retention time of 7.82 minutes.
0.0 2.5 5.0 7.5 10.0 12.5 min
0
5
10
15
20
25
30
35
40
45
mAU280nm,4nm (1.00)
7.5 8.0 min
0.0
0.1
0.2
0.3
0.4
0.5
0.6
0.7
0.8
0
10
20
30
40
50
60
mAUPeak
Zero LinePurity Curve
0.0 2.5 5.0 7.5 10.0 12.5 min
0
5
10
15
20
25
30
35
40
45
mAU280nm,4nm (1.00)

89
Figure 39: Peak purity profile calculated using PDA data (from 190–800 nm) for product I stressed with 0.2 M HCl in mobile phase. Peak shown in pink and purity curve in black. Peak purity index = 0.999999; Single point threshold = 0.997116.
Figure 40: HPLC chromatogram for product II stressed with 0.2 M HCl dissolved in mobile phase with a retention time of 7.83 minutes.
Figure 41: Peak purity profile calculated using PDA data (from 190–800 nm) for product II stressed with 0.2 M HCl in mobile phase. Peak shown in pink and purity curve in black. Peak purity index = 1.000000; Single point threshold = 0.996296.
7.75 8.00 8.25 min
0.0
0.1
0.2
0.3
0.4
0.5
0.0
5.0
10.0
15.0
20.0
25.0
30.0
35.0
mAUPeak
Zero LinePurity Curve
0.0 2.5 5.0 7.5 10.0 12.5 min
0
5
10
15
20
25
30
35
40
45
mAU280nm,4nm (1.00)
7.75 8.00 8.25 min
0.00
0.25
0.50
0.75
0.0
5.0
10.0
15.0
20.0
25.0
30.0
mAUPeak
Zero LinePurity Curve
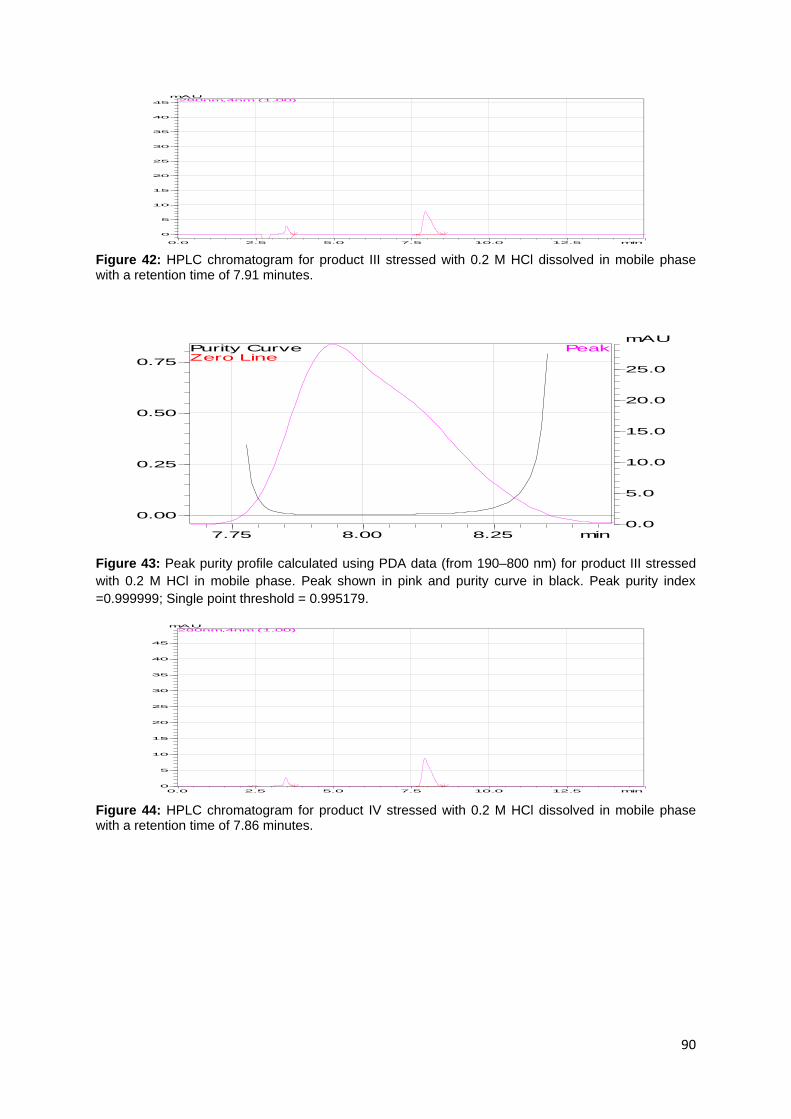
90
Figure 42: HPLC chromatogram for product III stressed with 0.2 M HCl dissolved in mobile phase with a retention time of 7.91 minutes.
Figure 43: Peak purity profile calculated using PDA data (from 190–800 nm) for product III stressed
with 0.2 M HCl in mobile phase. Peak shown in pink and purity curve in black. Peak purity index
=0.999999; Single point threshold = 0.995179.
Figure 44: HPLC chromatogram for product IV stressed with 0.2 M HCl dissolved in mobile phase with a retention time of 7.86 minutes.
0.0 2.5 5.0 7.5 10.0 12.5 min
0
5
10
15
20
25
30
35
40
45
mAU280nm,4nm (1.00)
7.75 8.00 8.25 min
0.00
0.25
0.50
0.75
0.0
5.0
10.0
15.0
20.0
25.0
mAUPeak
Zero LinePurity Curve
0.0 2.5 5.0 7.5 10.0 12.5 min
0
5
10
15
20
25
30
35
40
45
mAU280nm,4nm (1.00)
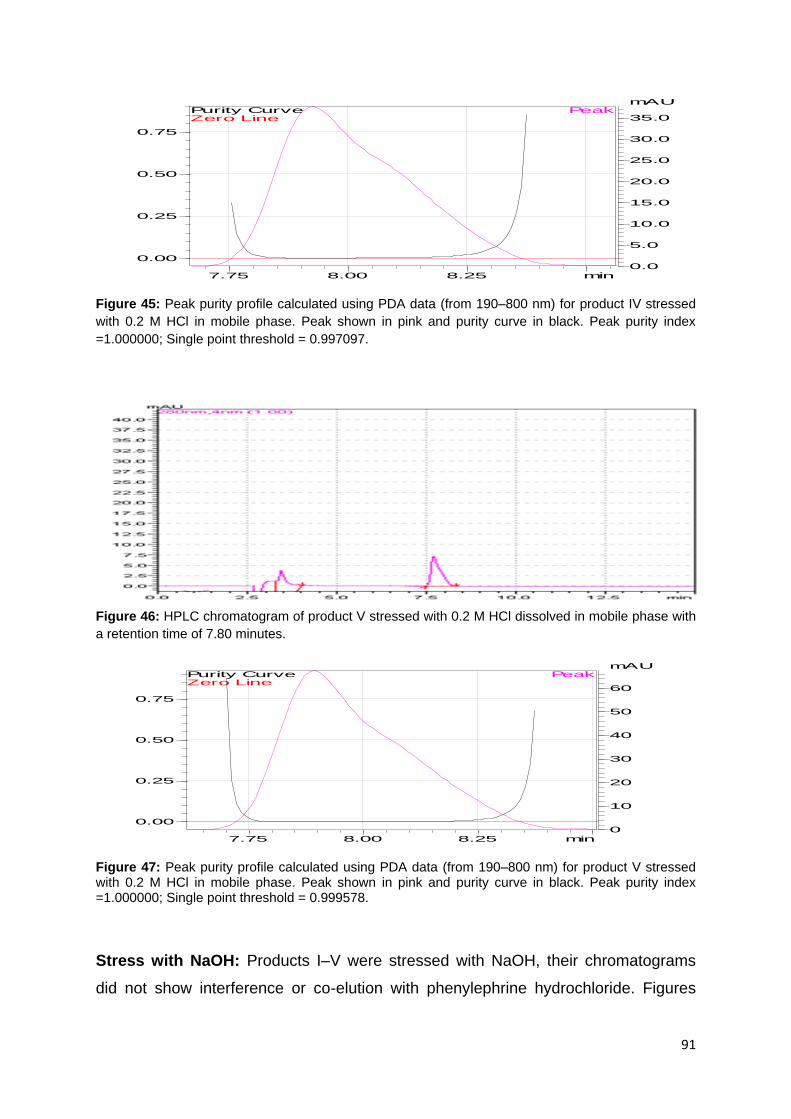
91
Figure 45: Peak purity profile calculated using PDA data (from 190–800 nm) for product IV stressed
with 0.2 M HCl in mobile phase. Peak shown in pink and purity curve in black. Peak purity index
=1.000000; Single point threshold = 0.997097.
Figure 46: HPLC chromatogram of product V stressed with 0.2 M HCl dissolved in mobile phase with
a retention time of 7.80 minutes.
Figure 47: Peak purity profile calculated using PDA data (from 190–800 nm) for product V stressed with 0.2 M HCl in mobile phase. Peak shown in pink and purity curve in black. Peak purity index =1.000000; Single point threshold = 0.999578.
Stress with NaOH: Products I–V were stressed with NaOH, their chromatograms
did not show interference or co-elution with phenylephrine hydrochloride. Figures
7.75 8.00 8.25 min
0.00
0.25
0.50
0.75
0.0
5.0
10.0
15.0
20.0
25.0
30.0
35.0
mAUPeak
Zero LinePurity Curve
7.75 8.00 8.25 min
0.00
0.25
0.50
0.75
0
10
20
30
40
50
60
mAUPeak
Zero LinePurity Curve

92
48–59 below indicate that the excipients did not react with the phenylephrine
hydrochloride nor did degradation products of products I–V co-elute with the
phenylephrine hydrochloride. Discolorations were observed during the reflux of
products I–V with NaOH, the colours changed from clear to brown. The average
retention time for the products was 7.84 minutes. Due to the caustic nature of NaOH
the products had a reduced average API concentration of 42.36%.
Figure 48: HPLC chromatogram of phenylephrine hydrochloride stressed with 0.2 M NaOH dissolved
in mobile phase with a retention time of 7.82 minutes
Figure 49: Peak purity profile calculated using PDA data (from 190–800 nm) for phenylephrine hydrochloride stressed with 0.2 M NaOH in mobile phase. Peak shown in pink and purity curve in black. Peak purity index =0.999999; Single point threshold = 0.996847.
0.0 2.5 5.0 7.5 10.0 12.5 min
0
5
10
15
20
25
30
35
40
mAU280nm,4nm (1.00)
7.75 8.00 8.25 min
0.0
0.1
0.2
0.3
0.4
0.5
0.6
0.0
5.0
10.0
15.0
20.0
25.0
30.0
mAUPeak
Zero LinePurity Curve

93
Figure 50: HPLC chromatogram of product I stressed with 0.2 M NaOH dissolved in mobile phase with a retention time of 7.89 minutes.
Figure 51: Peak purity profile calculated using PDA data (from 190–800 nm) for product I stressed with 0.2 M NaOH in mobile phase. Peak shown in pink and purity curve in black. Peak purity index =1.000000; Single point threshold = 0.995815.
Figure 52: HPLC chromatogram of product II stressed with 0.2 M NaOH dissolved in mobile phase with a retention time of 7.9 minutes.
0.0 2.5 5.0 7.5 10.0 12.5 min
0
5
10
15
20
25
30
35
40
mAU280nm,4nm (1.00)
7.75 8.00 8.25 min
0.0
0.1
0.2
0.3
0.4
0.5
0.6
0.0
5.0
10.0
15.0
20.0
25.0
30.0
mAUPeak
Zero LinePurity Curve
0.0 2.5 5.0 7.5 10.0 12.5 min
0
5
10
15
20
25
30
35
40
45
mAU280nm,4nm (1.00)

94
Figure 53: Peak purity profile calculated using PDA data (from 190–800 nm) for product II stressed with 0.2 M NaOH in mobile phase. Peak shown in pink and purity curve in black. Peak purity index = 0.999999; Single point threshold = 0.996370.
Figure 54: HPLC chromatogram for product III stressed with 0.2 M NaOH dissolved in mobile phase
with a retention time of 7.79 minutes.
Figure 55: Peak purity profile calculated using PDA data (from 190–800 nm) for product III stressed with 0.2 M NaOH in mobile phase. Peak shown in pink and purity curve in black. Peak purity index = 0.999999; Single point threshold = 0.998771.
7.75 8.00 8.25 min
0.00
0.25
0.50
0.75
0.0
2.5
5.0
7.5
10.0
12.5
15.0
17.5
mAUPeak
Zero LinePurity Curve
0.0 2.5 5.0 7.5 10.0 12.5 min
0.0
2.5
5.0
7.5
10.0
12.5
15.0
17.5
20.0
22.5
25.0
27.5
30.0
32.5
35.0
37.5mAU
280nm,4nm (1.00)
7.75 8.00 8.25 min
0.00
0.25
0.50
0.75
0.0
2.5
5.0
7.5
10.0
12.5
15.0
mAUPeak
Zero LinePurity Curve

95
Figure 56: HPLC chromatogram of product IV stressed with 0.2 M NaOH dissolved in mobile phase with a retention time of 7.91 minutes.
Figure 57: Peak purity profile calculated using PDA data (from 190–800 nm) for product IV stressed
with 0.2 M NaOH in mobile phase. Peak shown in pink and purity curve in black. Peak purity index =
0.999999; Single point threshold = 0.996930.
Figure 58: HPLC chromatogram for product V stressed with 0.2 M NaOH dissolved in mobile phase with a retention time of 7.85 minutes.
0.0 2.5 5.0 7.5 10.0 12.5 min
0
5
10
15
20
25
30
35
40
45
mAU280nm,4nm (1.00)
7.75 8.00 8.25 min
0.0
0.1
0.2
0.3
0.4
0.5
0.6
0.0
5.0
10.0
15.0
20.0
25.0
30.0
35.0
mAUPeak
Zero LinePurity Curve
0.0 2.5 5.0 7.5 10.0 12.5 min
0
5
10
15
20
25
30
35
40
45mAU
280nm,4nm (1.00)
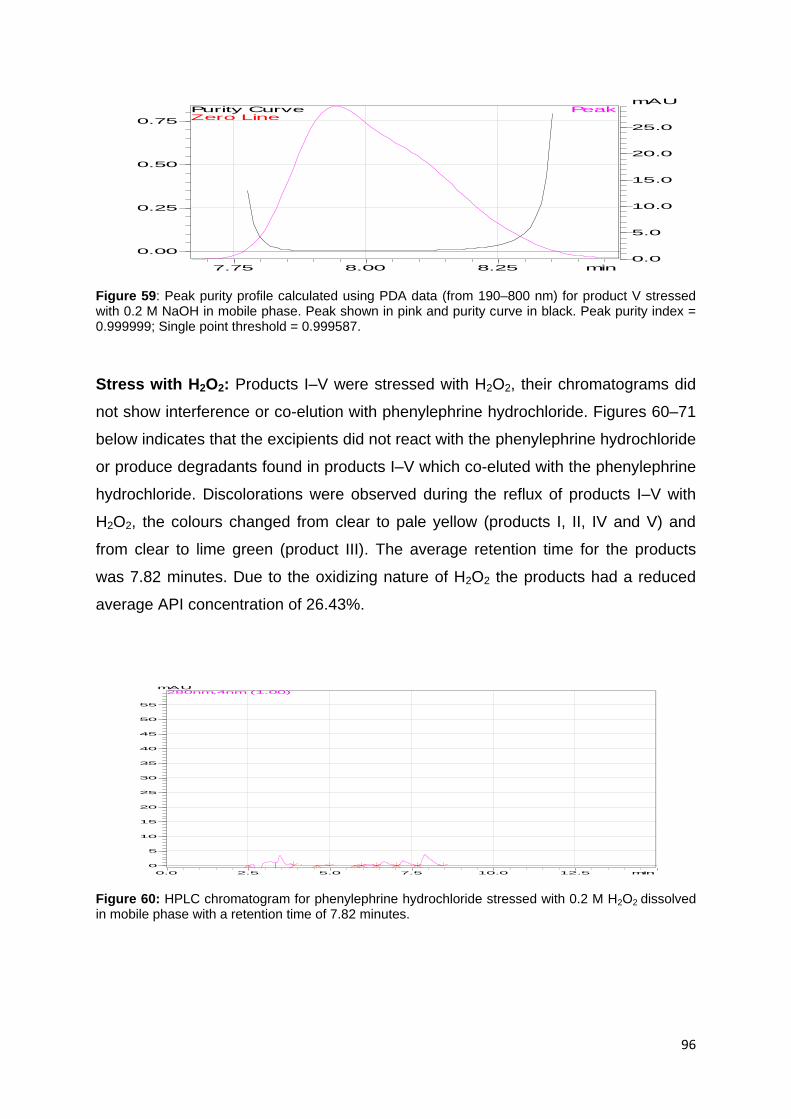
96
Figure 59: Peak purity profile calculated using PDA data (from 190–800 nm) for product V stressed with 0.2 M NaOH in mobile phase. Peak shown in pink and purity curve in black. Peak purity index = 0.999999; Single point threshold = 0.999587.
Stress with H2O2: Products I–V were stressed with H2O2, their chromatograms did
not show interference or co-elution with phenylephrine hydrochloride. Figures 60–71
below indicates that the excipients did not react with the phenylephrine hydrochloride
or produce degradants found in products I–V which co-eluted with the phenylephrine
hydrochloride. Discolorations were observed during the reflux of products I–V with
H2O2, the colours changed from clear to pale yellow (products I, II, IV and V) and
from clear to lime green (product III). The average retention time for the products
was 7.82 minutes. Due to the oxidizing nature of H2O2 the products had a reduced
average API concentration of 26.43%.
Figure 60: HPLC chromatogram for phenylephrine hydrochloride stressed with 0.2 M H2O2 dissolved in mobile phase with a retention time of 7.82 minutes.
7.75 8.00 8.25 min
0.00
0.25
0.50
0.75
0.0
5.0
10.0
15.0
20.0
25.0
mAUPeak
Zero LinePurity Curve
0.0 2.5 5.0 7.5 10.0 12.5 min
0
5
10
15
20
25
30
35
40
45
50
55
mAU280nm,4nm (1.00)
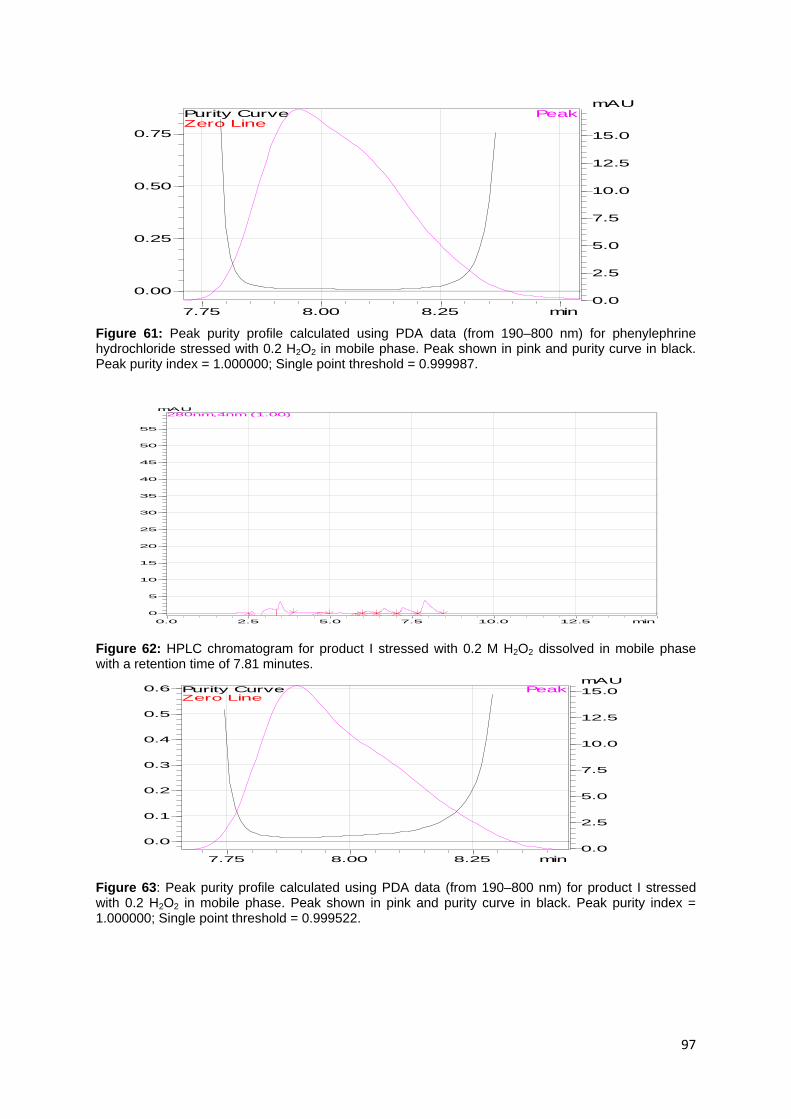
97
Figure 61: Peak purity profile calculated using PDA data (from 190–800 nm) for phenylephrine hydrochloride stressed with 0.2 H2O2 in mobile phase. Peak shown in pink and purity curve in black. Peak purity index = 1.000000; Single point threshold = 0.999987.
Figure 62: HPLC chromatogram for product I stressed with 0.2 M H2O2 dissolved in mobile phase with a retention time of 7.81 minutes.
Figure 63: Peak purity profile calculated using PDA data (from 190–800 nm) for product I stressed with 0.2 H2O2 in mobile phase. Peak shown in pink and purity curve in black. Peak purity index = 1.000000; Single point threshold = 0.999522.
7.75 8.00 8.25 min
0.00
0.25
0.50
0.75
0.0
2.5
5.0
7.5
10.0
12.5
15.0
mAUPeak
Zero LinePurity Curve
0.0 2.5 5.0 7.5 10.0 12.5 min
0
5
10
15
20
25
30
35
40
45
50
55
mAU280nm,4nm (1.00)
7.75 8.00 8.25 min
0.0
0.1
0.2
0.3
0.4
0.5
0.6
0.0
2.5
5.0
7.5
10.0
12.5
15.0
mAUPeak
Zero LinePurity Curve

98
Figure 64: HPLC chromatogram for product II stressed with 0.2 M H2O2 dissolved in mobile phase with a retention time of 7.9 minutes.
Figure 65: Peak purity profile calculated using PDA data (from 190–800 nm) for product II stressed
with 0.2 H2O2 in mobile phase. Peak shown in pink and purity curve in black. Peak purity index =
0.999999; Single point threshold = 0.999722.
Figure 66: HPLC chromatogram of product III stressed with 0.2 M H2O2 dissolved in mobile phase with a retention time 7.94 minutes.
0.0 2.5 5.0 7.5 10.0 12.5 min
0
5
10
15
20
25
30
35
40
45
50
55
mAU280nm,4nm (1.00)
7.75 8.00 8.25 min
0.00
0.25
0.50
0.75
0.0
2.5
5.0
7.5
10.0
12.5
15.0
17.5
mAUPeak
Zero LinePurity Curve
0.0 2.5 5.0 7.5 10.0 12.5 min
-5
0
5
10
15
20
25
30
35
40
45
50
55
60mAU
280nm,4nm (1.00)

99
Figure 67: Peak purity profile calculated using PDA data (from 190–800 nm) for product III stressed with 0.2 H2O2 in mobile phase. Peak shown in pink and purity curve in black. Peak purity index = 0.999999; Single point threshold = 0.999706.
Figure 68: HPLC chromatogram for product IV with 0.2 M H2O2 dissolved in mobile phase with a retention time of 7.81 minutes.
Figure 69: Peak purity profile calculated using PDA data (from 190–800 nm) for product IV stressed with 0.2 H2O2 in mobile phase. Peak shown in pink and purity curve in black. Peak purity index = 1.000000; Single point threshold = 0.999896.
7.75 8.00 8.25 min
0.00
0.25
0.50
0.75
0.0
2.5
5.0
7.5
10.0
12.5
15.0
17.5
mAUPeak
Zero LinePurity Curve
0.0 2.5 5.0 7.5 10.0 12.5 min
0
5
10
15
20
25
30
35
40
45
50
55
mAU280nm,4nm (1.00)
7.75 8.00 8.25 min
0.0
0.1
0.2
0.3
0.4
0.5
0.6
0.7
0.0
2.5
5.0
7.5
10.0
12.5
mAUPeak
Zero LinePurity Curve

100
Figure 70: HPLC chromatogram for product V stressed with 0.2 M H2O2 dissolved in mobile phase with a retention time of 7.88 minutes.
Figure 71: Peak purity profile calculated using PDA data (from 190–800 nm) for product V stressed with 0.2 H2O2 in mobile phase. Peak shown in pink and purity curve in black. Peak purity index = 0.999999; Single point threshold = 0.999536.
Stress with heat and humidity: Products I–V were stressed with heat and humidity;
their chromatograms did not show interference or co-elution of impurities with
phenylephrine hydrochloride. Figures 72–98 below indicates that the excipients did
not react with the phenylephrine hydrochloride. In Figure 72, phenylephrine
hydrochloride stressed at 100 °C for 24 hours in a stability chamber showed a
reduction of its API to 95% while showing no physical discolorations. Heat therefore
has an effect in reducing the potency of phenylephrine hydrochloride.
Chromatograms of products I–V stressed at the 65 °C for one month are shown in
figures 74–85 below. The API concentration was reduced and products I and III
0.0 2.5 5.0 7.5 10.0 12.5 min
0
5
10
15
20
25
30
35
40
45
50mAU
280nm,4nm (1.00)
7.75 8.00 8.25 min
0.0
0.1
0.2
0.3
0.4
0.5
0.6
0.0
5.0
10.0
15.0
20.0
25.0
30.0
35.0
mAUPeak
Zero LinePurity Curve

101
showed degardants or impurities eluting at 2, 5 and 10 minutes. Tailing was
observed in the all products stressed under this condition, which could mean the API
had reduced however the peak purity profile indicated that it was still pure.
Degradants did not interfere or co-elute with phenylephrine hydrochloride. Changes
in physical appearance were recorded in Table 9 below.
Table 9: Physical appearance of phenylephrine hydrochloride and products I–V before and after storage conditions 40 °C/75%RH for 1 month
Item Initial Physical appearance
Physical appearance After 4 weeks of storage
40 °C/75%RH 65 °C
Phenylephrine Hydrochloride
Clear solution, no precipitate/residue, no colour change
No change in initial appearance
Yellow, no precipitate formed
Product I Clear solution, no precipitate/residue, no colour change
No change in initial appearance
Light yellow, no precipitate formed
Product II Clear solution, no precipitate/residue, no colour change
No change in initial appearance
Tinge brown, No precipitate formed
Product III Clear solution, no precipitate/residue, no colour change
No change in initial appearance
Slight yellow, No precipitate formed
Product IV Clear solution, no precipitate/residue, no colour change
No change in initial appearance
Tinge brown, No precipitate formed
Product V Clear solution, no precipitate/residue, no colour change
No change in initial appearance
Tinge brown, No precipitate formed
Bold print indicates physical mixtures that showed a change in appearance after 4 weeks of storage
Table 9 above shows changes in appearance at 65 °C for all products. The same did
not occur at the 45 °C/75%RH storage condition where none of the samples
underwent any physical change.
Chromatograms of products I–V stressed at the 40 °C/75%RH for one month are
indicated in figures 86–97 below. The API concentration was reduced, however all
concentrations were above the 95%, except for product V which was at 94.97%.
Products I–V were able to withstand the heat and humidity without showing any
change in physical appearance. Tailing was observed in the all products stressed
under this condition, which could mean the API had slightly reduced however the
peak purity profile indicated that it was still pure. Degradants did not interfere or co-
elute with phenylephrine hydrochloride.

102
Figure 72: HPLC chromatogram for phenylephrine hydrochloride stored at 100 °C for 24 hours dissolved in mobile phase with a retention time of 7.8 minutes.
Figure 73: Peak purity profile calculated using PDA data (from 190–800 nm) for phenylephrine hydrochloride stored at 100 °C for 24 hours in mobile phase. Peak shown in pink and purity curve in black. Peak purity index = 1.000000; Single point threshold = 0.999999.
0.0 2.5 5.0 7.5 10.0 12.5 min
0
5
10
15
20
25
30
35
40
45
mAU280nm,4nm (1.00)
7.5 8.0 min
0.0
0.1
0.2
0.3
0.4
0.5
0.6
0.7
0.8
0
10
20
30
40
50
60
mAUPeak
Zero LinePurity Curve

103
Figure 74: HPLC chromatogram for phenylephrine hydrochloride stored at 65 °C for 1 month dissolved in mobile phase with a retention time of 7.83 minutes.
Figure 75: Peak purity profile calculated using PDA data (from 190–800 nm) for phenylephrine hydrochloride stored at 65 °C for 1 month in mobile phase. Peak shown in pink and purity curve in black. Peak purity index = 1.000000; Single point threshold = 0.999989.
Figure 76: HPLC chromatogram for product I stored at 65 °C for 1 month dissolved in mobile phase with a retention time of 7.92 minutes.
0.0 2.5 5.0 7.5 10.0 12.5 min
0
5
10
15
20
25
30
35
40
45
mAU280nm,4nm (1.00)
7.75 8.00 8.25 min
0.0
0.1
0.2
0.3
0.4
0.5
0.0
5.0
10.0
15.0
20.0
25.0
30.0
mAUPeak
Zero LinePurity Curve
0.0 2.5 5.0 7.5 10.0 12.5 min
0
5
10
15
20
25
30
35
40
45
mAU280nm,4nm (1.00)
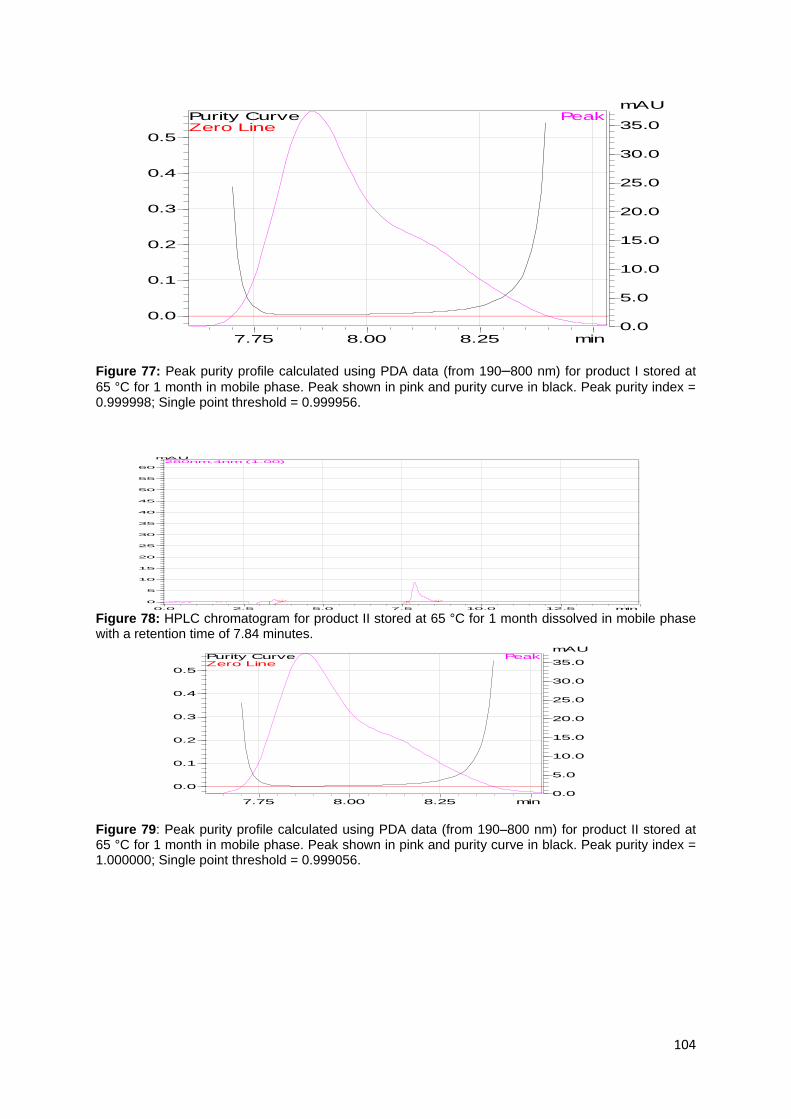
104
Figure 77: Peak purity profile calculated using PDA data (from 190–800 nm) for product I stored at
65 °C for 1 month in mobile phase. Peak shown in pink and purity curve in black. Peak purity index = 0.999998; Single point threshold = 0.999956.
Figure 78: HPLC chromatogram for product II stored at 65 °C for 1 month dissolved in mobile phase with a retention time of 7.84 minutes.
Figure 79: Peak purity profile calculated using PDA data (from 190–800 nm) for product II stored at 65 °C for 1 month in mobile phase. Peak shown in pink and purity curve in black. Peak purity index = 1.000000; Single point threshold = 0.999056.
7.75 8.00 8.25 min
0.0
0.1
0.2
0.3
0.4
0.5
0.0
5.0
10.0
15.0
20.0
25.0
30.0
35.0
mAUPeak
Zero LinePurity Curve
0.0 2.5 5.0 7.5 10.0 12.5 min
0
5
10
15
20
25
30
35
40
45
50
55
60
mAU280nm,4nm (1.00)
7.75 8.00 8.25 min
0.0
0.1
0.2
0.3
0.4
0.5
0.0
5.0
10.0
15.0
20.0
25.0
30.0
35.0
mAUPeak
Zero LinePurity Curve
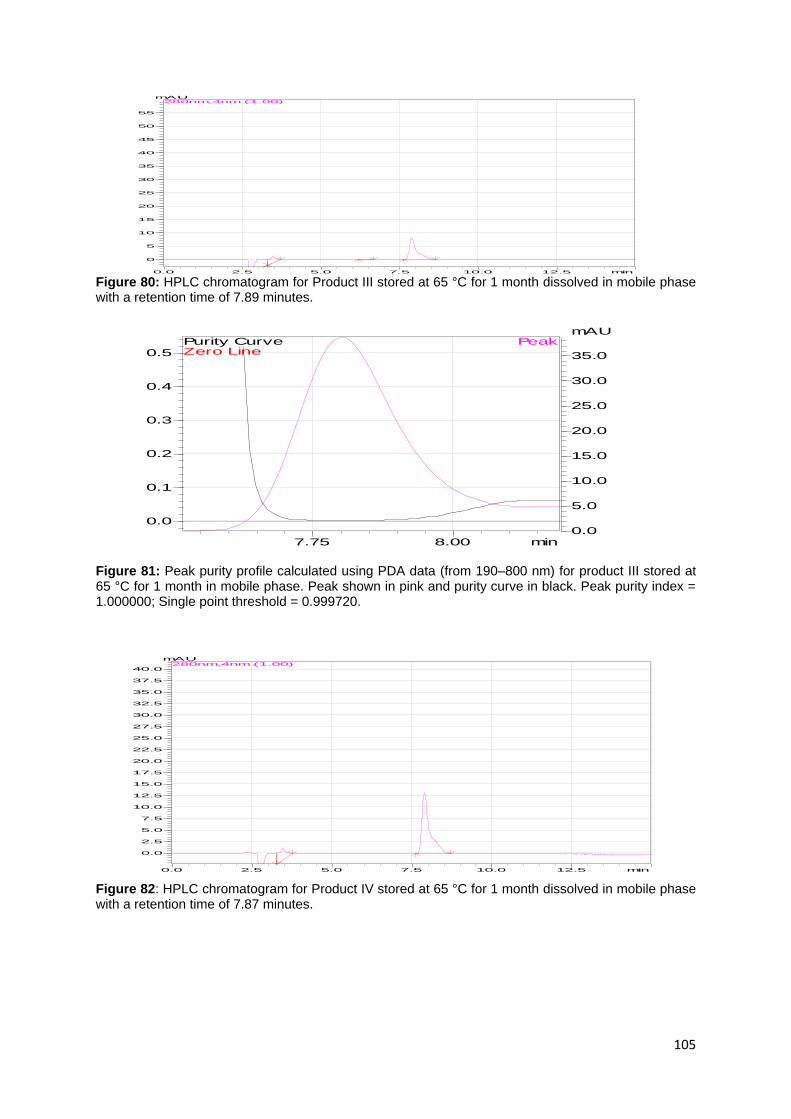
105
Figure 80: HPLC chromatogram for Product III stored at 65 °C for 1 month dissolved in mobile phase with a retention time of 7.89 minutes.
Figure 81: Peak purity profile calculated using PDA data (from 190–800 nm) for product III stored at 65 °C for 1 month in mobile phase. Peak shown in pink and purity curve in black. Peak purity index = 1.000000; Single point threshold = 0.999720.
Figure 82: HPLC chromatogram for Product IV stored at 65 °C for 1 month dissolved in mobile phase with a retention time of 7.87 minutes.
0.0 2.5 5.0 7.5 10.0 12.5 min
0
5
10
15
20
25
30
35
40
45
50
55
mAU280nm,4nm (1.00)
7.75 8.00 min
0.0
0.1
0.2
0.3
0.4
0.5
0.0
5.0
10.0
15.0
20.0
25.0
30.0
35.0
mAUPeak
Zero LinePurity Curve
0.0 2.5 5.0 7.5 10.0 12.5 min
0.0
2.5
5.0
7.5
10.0
12.5
15.0
17.5
20.0
22.5
25.0
27.5
30.0
32.5
35.0
37.5
40.0
mAU280nm,4nm (1.00)
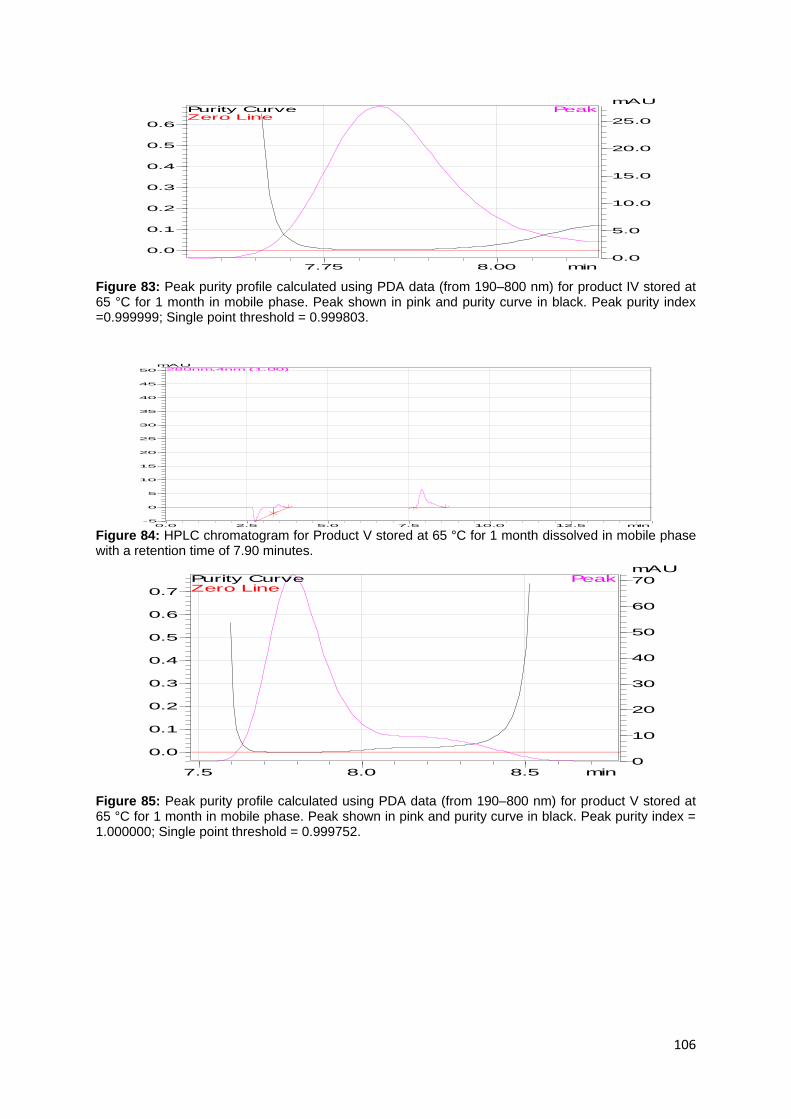
106
Figure 83: Peak purity profile calculated using PDA data (from 190–800 nm) for product IV stored at 65 °C for 1 month in mobile phase. Peak shown in pink and purity curve in black. Peak purity index =0.999999; Single point threshold = 0.999803.
Figure 84: HPLC chromatogram for Product V stored at 65 °C for 1 month dissolved in mobile phase with a retention time of 7.90 minutes.
Figure 85: Peak purity profile calculated using PDA data (from 190–800 nm) for product V stored at 65 °C for 1 month in mobile phase. Peak shown in pink and purity curve in black. Peak purity index = 1.000000; Single point threshold = 0.999752.
7.75 8.00 min
0.0
0.1
0.2
0.3
0.4
0.5
0.6
0.0
5.0
10.0
15.0
20.0
25.0
mAUPeak
Zero LinePurity Curve
0.0 2.5 5.0 7.5 10.0 12.5 min-5
0
5
10
15
20
25
30
35
40
45
50
mAU280nm,4nm (1.00)
7.5 8.0 8.5 min
0.0
0.1
0.2
0.3
0.4
0.5
0.6
0.7
0
10
20
30
40
50
60
70
mAUPeak
Zero LinePurity Curve

107
Figure 86: HPLC chromatogram for phenylephrine hydrochloride stored at 40 °C/75%RH for 1 month dissolved in mobile phase with a retention time of 7.86 minutes.
Figure 87: Peak purity profile calculated using PDA date (from 190–800 nm) for phenylephrine hydrochloride stored at 40 °C/75%RH for 1 month in mobile phase. Peak shown in pink and purity curve in black. Peak purity index = 1.000000; Single point threshold = 0.999056.
Figure 88: HPLC chromatogram for Product I stored at 40 °C/75%RH for 1 month dissolved in mobile phase with a retention time of 7.87 minutes.
0.0 2.5 5.0 7.5 10.0 12.5 min
-2.5
0.0
2.5
5.0
7.5
10.0
12.5
15.0
17.5
20.0
22.5
25.0
27.5
30.0
32.5
35.0
mAU280nm,4nm (1.00)
7.50 7.75 8.00 8.25 min
0.0
0.1
0.2
0.3
0.4
0.5
0.6
0.0
5.0
10.0
15.0
20.0
mAUPeak
Zero LinePurity Curve
0.0 2.5 5.0 7.5 10.0 12.5 min
-2.5
0.0
2.5
5.0
7.5
10.0
12.5
15.0
17.5
20.0
22.5
25.0
27.5
30.0
32.5
35.0
mAU280nm,4nm (1.00)

108
Figure 89: Peak purity profile calculated using PDA data (from 190–800 nm) for product I stored at 40 °C/75% RH for 1 month in mobile phase. Peak shown in pink and purity curve in black. Peak purity index = 0.999999; Single point threshold = 0.995566.
Figure 90: HPLC chromatogram for Product II stored at 40 °C/75%RH for 1 month dissolved in mobile phase with a retention time of 7.84 minutes.
Figure 91: Peak purity profile calculated using PDA data (from 190–800 nm) for product II stored at 40 °C/75%RH for 1 month in mobile phase. Peak shown in pink and purity curve in black. Peak purity index = 1.000000; Single point threshold = 0.999579.
7.50 7.75 8.00 8.25 min
0.0
0.1
0.2
0.3
0.4
0.5
0.6
0.0
5.0
10.0
15.0
20.0
25.0
mAUPeak
Zero LinePurity Curve
0.0 2.5 5.0 7.5 10.0 12.5 min
0
10
20
30
40
50
60
70
80
90
100
mAU280nm,4nm (1.00)
7.50 7.75 8.00 8.25 min
0.0
0.1
0.2
0.3
0.4
0.5
0.6
0.7
0.8
0.0
5.0
10.0
15.0
20.0
25.0
mAUPeak
Zero LinePurity Curve
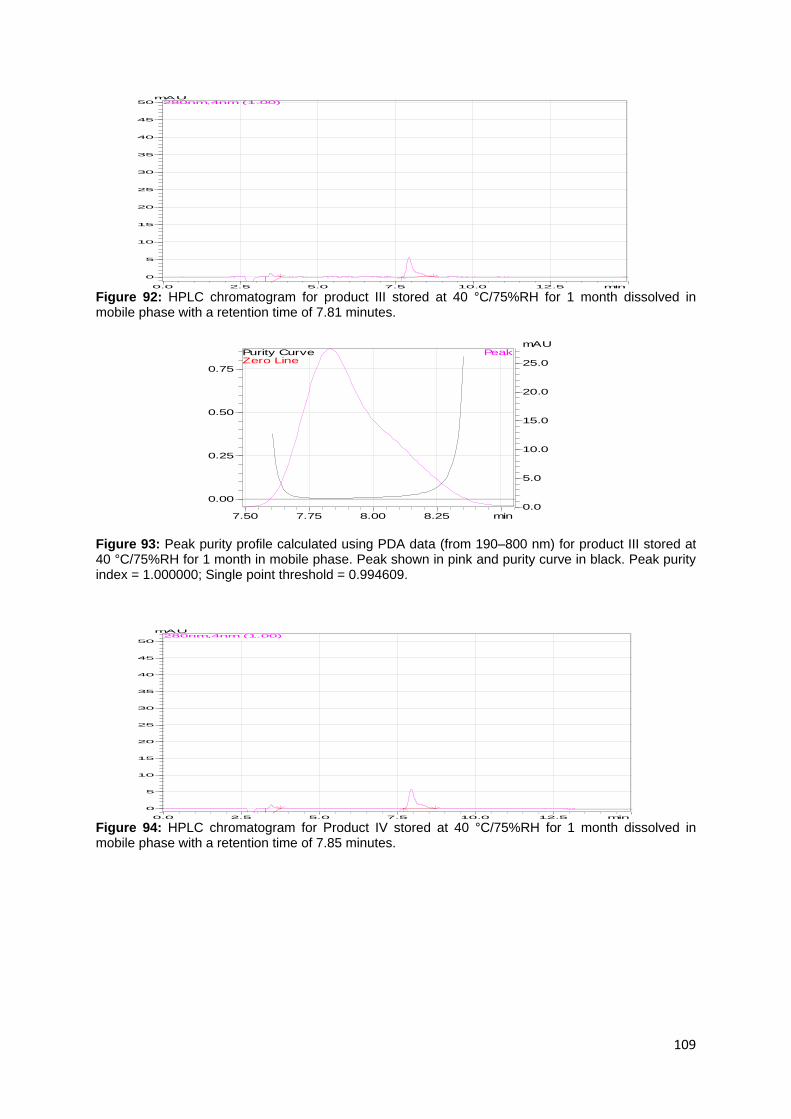
109
Figure 92: HPLC chromatogram for product III stored at 40 °C/75%RH for 1 month dissolved in mobile phase with a retention time of 7.81 minutes.
Figure 93: Peak purity profile calculated using PDA data (from 190–800 nm) for product III stored at 40 °C/75%RH for 1 month in mobile phase. Peak shown in pink and purity curve in black. Peak purity index = 1.000000; Single point threshold = 0.994609.
Figure 94: HPLC chromatogram for Product IV stored at 40 °C/75%RH for 1 month dissolved in mobile phase with a retention time of 7.85 minutes.
0.0 2.5 5.0 7.5 10.0 12.5 min
0
5
10
15
20
25
30
35
40
45
50mAU
280nm,4nm (1.00)
7.50 7.75 8.00 8.25 min
0.00
0.25
0.50
0.75
0.0
5.0
10.0
15.0
20.0
25.0
mAUPeak
Zero LinePurity Curve
0.0 2.5 5.0 7.5 10.0 12.5 min
0
5
10
15
20
25
30
35
40
45
50
mAU280nm,4nm (1.00)

110
Figure 95: Peak purity profile calculated using PDA data (from 190–800 nm) for product IV stored at 40 °C/75%RH for 1 month in mobile phase. Peak shown in pink and purity curve in black. Peak purity index = 1.000000; Single point threshold = 0.994609.
Figure 96: HPLC chromatogram for Product V stored at 40 °C/75%RH for 1 month dissolved in mobile phase with a retention time of 7.83 minutes.
Figure 97: Peak purity profile calculated using PDA data (from 190–800 nm) for product V stored at 40 °C/75%RH for 1 month in mobile phase. Peak shown in pink and purity curve in black. Peak purity index = 0.999999; Single point threshold = 0.995332.
7.75 8.00 8.25 min
0.00
0.25
0.50
0.75
0.0
5.0
10.0
15.0
20.0
25.0
mAUPeak
Zero LinePurity Curve
0.0 2.5 5.0 7.5 10.0 12.5 min
0
5
10
15
20
25
30
35
40
45
50
55
60
mAU280nm,4nm (1.00)
7.50 7.75 8.00 8.25 min
0.00
0.25
0.50
0.75
0.0
5.0
10.0
15.0
20.0
25.0
mAUPeak
Zero LinePurity Curve

111
Peak purities of all samples of stressed and unstressed phenylephrine hydrochloride
and finished product solutions are indicated in Table 10 below. Phenylephrine
hydrochloride alone showed loss to the combination of heat and humidity.
Table 10: Results showing absence of impurity from a series of stressed and unstressed samples of phenylephrine hydrochloride (API) and products.
Number Sample name Co-eluting impurities found
Image reference
1 Mobile phase only None Figure 11
2 Active: unstressed None Figure 12
3 Product I, unstressed None Figure 14
4 Product II, unstressed None Figure 16
5 Product III, unstressed None Figure 18
6 Product IV, unstressed None Figure 20
7 Product V, unstressed None Figure 22
8 Active, stressed under UV for 17 hours
None Figure 24
9 Product I, stressed under UV for 17 hours
None Figure 26
10 Product II, stressed under UV for 17 hours
None Figure 28
11 Product III, stressed under UV for 17 hours
None Figure 30
12 Product IV, stressed under UV for 17 hours
None Figure 32
13 Product V, stressed under UV for 17 hours
None Figure 34
14 Active, stressed with HCl None Figure 36
15 Product I, stressed with HCl None Figure 38
16 Product II, stressed with HCl None Figure 40
17 Product III, stressed with HCl None Figure 42
18 Product IV, stressed with HCl None Figure 44
19 Product V, stressed with HCl None Figure 46
20 Active, stressed with NaOH None Figure 48
21 Product I, stressed with NaOH None Figure 50
22 Product II, stressed with NaOH None Figure 52
23 Product III, stressed with NaOH None Figure 54
24 Product IV, stressed with NaOH None Figure 56
25 Product V, stressed with NaOH None Figure 58
26 Active, stressed with H2O2 None Figure 60
27 Product I, stressed with H2O2 None Figure 62
28 Product II, stressed with H2O2 None Figure 64
29 Product III, stressed with H2O2 None Figure 66
30 Product IV, stressed with H2O2 None Figure 68
31 Product V, stressed with H2O2 None Figure 70
32 Active, stressed at 100 °C None Figure 72
33 Active, stressed at 65 °C None Figure 74
34 Product I, stressed at 65 °C None Figure 76
35 Product II, stressed at 65 °C None Figure 78
36 Product III, stressed at 65 °C None Figure 80
37 Product IV, stressed at 65 °C None Figure 82
38 Product V, stressed at 65 °C None Figure 84
39 Active, stressed at 40 °C/75%RH None Figure 86

112
40 Product I, stressed at 40 stressed at 40 °C/75%RH
None Figure 88
41 Product II, stressed at 40 °C/75%RH
None Figure 90
42 Product III, stressed at 40 °C/75%RH
None Figure 92
43 Product IV, stressed at 40 °C/75%RH
None Figure 94
44 Product V, stressed at 40 °C/75%RH
None Figure 96
The products were decomposed (reduction in API concentration) by the combination
of heat and humidity, fairly decomposed by heat, and significantly broken (p<0.05)
down by hydrogen peroxide and base as seen in Table 11.
Table 11: Results showing phenylephrine hydrochloride left with samples stressed and unstressed (API and Products)
Sample number Sample condition Phenylephrine hydrochloride left
2 Active, unstressed 99.57%
3 Product I, unstressed 100.20%
4 Product II, unstressed 97.09%
5 Product III, unstressed 97.20%
6 Product IV, unstressed 98.68%
7 Product V, unstressed 97.31%
8 Active, stressed under UV light 99.10%
9 Product I, stressed under UV light 99.10%
10 Product II, stressed under UV light 99.61%
11 Product III, stressed under UV light 99.66%
12 Product IV, stressed under UV light 98.33%
13 Product V, stressed under UV light 98.63%
14 Active, stressed with HCl 75.26%
15 Product I, stressed with HCl 77.67%
16 Product II, stressed with HCl 81.11%
17 Product III, stressed with HCl 78.43%
18 Product IV, stressed with HCl 82.18%
19 Product V, stressed with HCl 83.21%
20 Active, stressed with NaOH 33.86%
21 Product I, stressed with NaOH 43.11%
22 Product II, stressed with NaOH 42.56%
23 Product III, stressed with NaOH 30.29%
24 Product IV, stressed with NaOH 50.77%
25 Product V, stressed with NaOH 53.57%
26 Active, stressed with H2O2 23.73%
27 Product I, stressed with H2O2 26.79%
28 Product II, stressed with H2O2 26.29%
29 Product III, stressed with H2O2 32.42%
30 Product IV, stressed with H2O2 23.55%
31 Product V, stressed with H2O2 25.80%
32 Active, stressed at 100 °C 95.42%
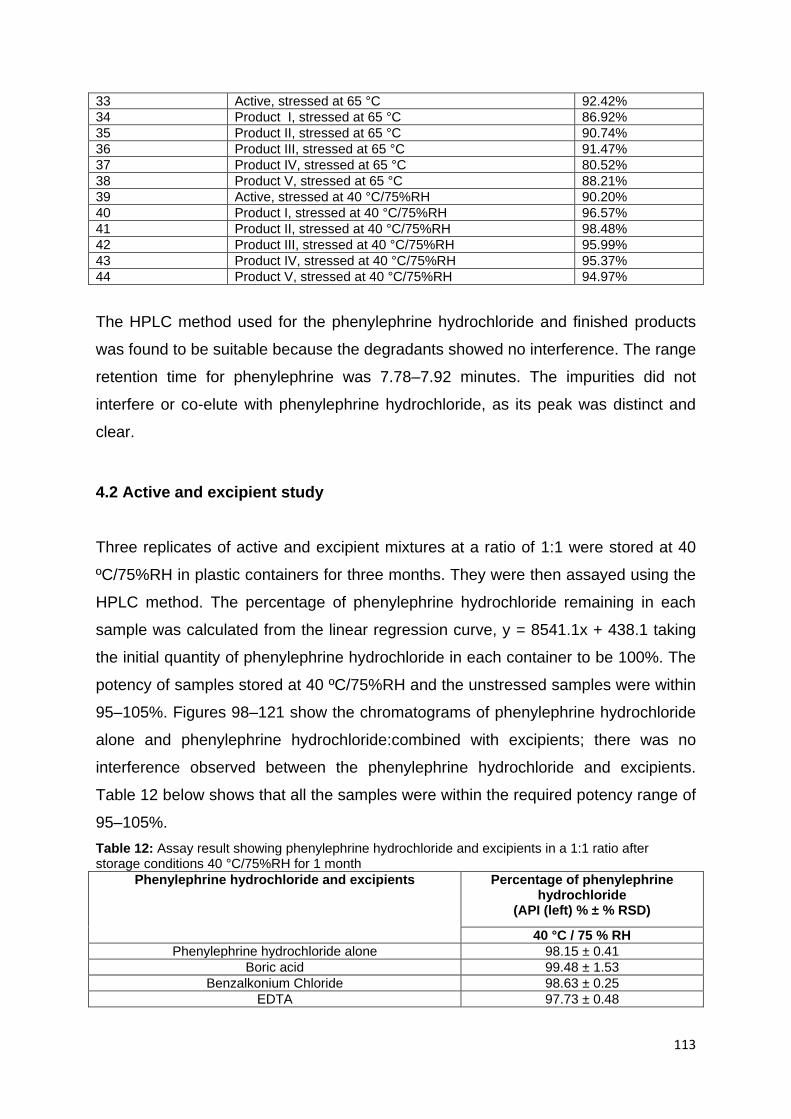
113
33 Active, stressed at 65 °C 92.42%
34 Product I, stressed at 65 °C 86.92%
35 Product II, stressed at 65 °C 90.74%
36 Product III, stressed at 65 °C 91.47%
37 Product IV, stressed at 65 °C 80.52%
38 Product V, stressed at 65 °C 88.21%
39 Active, stressed at 40 °C/75%RH 90.20%
40 Product I, stressed at 40 °C/75%RH 96.57%
41 Product II, stressed at 40 °C/75%RH 98.48%
42 Product III, stressed at 40 °C/75%RH 95.99%
43 Product IV, stressed at 40 °C/75%RH 95.37%
44 Product V, stressed at 40 °C/75%RH 94.97%
The HPLC method used for the phenylephrine hydrochloride and finished products
was found to be suitable because the degradants showed no interference. The range
retention time for phenylephrine was 7.78–7.92 minutes. The impurities did not
interfere or co-elute with phenylephrine hydrochloride, as its peak was distinct and
clear.
4.2 Active and excipient study
Three replicates of active and excipient mixtures at a ratio of 1:1 were stored at 40
ºC/75%RH in plastic containers for three months. They were then assayed using the
HPLC method. The percentage of phenylephrine hydrochloride remaining in each
sample was calculated from the linear regression curve, y = 8541.1x + 438.1 taking
the initial quantity of phenylephrine hydrochloride in each container to be 100%. The
potency of samples stored at 40 ºC/75%RH and the unstressed samples were within
95–105%. Figures 98–121 show the chromatograms of phenylephrine hydrochloride
alone and phenylephrine hydrochloride:combined with excipients; there was no
interference observed between the phenylephrine hydrochloride and excipients.
Table 12 below shows that all the samples were within the required potency range of
95–105%.
Table 12: Assay result showing phenylephrine hydrochloride and excipients in a 1:1 ratio after storage conditions 40 °C/75%RH for 1 month
Phenylephrine hydrochloride and excipients Percentage of phenylephrine hydrochloride
(API (left) % ± % RSD)
40 °C / 75 % RH
Phenylephrine hydrochloride alone 98.15 ± 0.41
Boric acid 99.48 ± 1.53
Benzalkonium Chloride 98.63 ± 0.25
EDTA 97.73 ± 0.48

114
Glycerol 95.79 ± 0.22
Methyl Paraben 96.33 ± 1.86
Propyl Paraben 96.73 ± 0.36
Sodium metabisulfite 97.58 ± 0.53
Sodium citrate dehydrate 95.10 ± 0.39
Carboxymethylcellulose Sodium 96.24 ± 1.44
Hydroxypropyl methylcellulose 98.59 ± 1.33
Table 13: Physical appearance of active–excipients samples before and after storage conditions 40 °C/75%RH for 4 weeks
Phenylephrine hydrochloride and excipients
Initial physical appearance
Physical appearance after 4 weeks of
storage
40 °C/75%RH
Phenylephrine hydrochloride alone Clear solution, no precipitate or residue, no colour change
No change
Benzalkonium chloride and phenylephrine hydrochloride
Clear solution, no precipitate or residue, no colour change
No change
Boric acid and phenylephrine hydrochloride
Clear solution, no precipitate or residue, no colour change
No change
Sodium carboxy methylcellulose and phenylephrine hydrochloride
Clear solution, no precipitate or residue, no colour change
No change
EDTA and phenylephrine hydrochloride
Clear solution, no precipitate or residue, no colour change
No change
Glycerol and phenylephrine hydrochloride
Clear solution, no precipitate or residue, no colour change
No change
HPMC and phenylephrine hydrochloride
Clear solution, no precipitate or residue, no colour change
No change
Methyl paraben and phenylephrine hydrochloride
Clear solution, no precipitate or residue, no colour change
No change
Propyl paraben and phenylephrine hydrochloride
Clear solution, no precipitate or residue, no colour change
No change
Sodium citrate dihydrate and phenylephrine hydrochloride
Clear solution, no precipitate or residue, no colour change
No change
Sodium metabisulfite and phenylephrine hydrochloride
Clear solution, no precipitate or residue, no colour change
No change
The physical appearance of the phenylephrine hydrochloride and excipient blends
can be found in Table 13 above. No colour change and precipitate formation were
observed in any of the 1:1 mixtures after four weeks of storage. There were no
reductions or increase in liquid level after storage, meaning that the plastic container
was not permeable to moisture. The data also proved that the active and excipients
did not interfere or interact with each other.

115
Figure 98: HPLC chromatogram for phenylephrine hydrochloride alone dissolved in mobile phase with retention of 7.82 minutes.
Figure 99: Peak purity profile calculated using PDA date (from 190–800 nm) for phenylephrine hydrochloride in mobile phase. Peak shown in pink and purity curve in black. Peak purity index = 1.000000; Single point threshold = 0.999999.
Figure 100: HPLC chromatogram for phenylephrine hydrochloride with sodium citrate dihydrate (1:1) dissolved in mobile phase with a retention time of 7.92 minutes.
0.0 2.5 5.0 7.5 10.0 12.5 min
0
5
10
15
20
25
30
35
40
45
mAU280nm,4nm (1.00)
7.5 8.0 min
0.0
0.1
0.2
0.3
0.4
0.5
0.6
0.7
0.8
0
10
20
30
40
50
60
mAUPeak
Zero LinePurity Curve

116
Figure 101: Peak purity profile calculated using PDA data (from 190–800 nm) for phenylephrine
hydrochloride with sodium citrate dihydrate (1:1) in mobile phase. Peak shown in pink and purity
curve in black. Peak purity index = 1.000000; Single point threshold = 0.999896.
Figure 102: HPLC chromatogram for phenylephrine hydrochloride with carboxymethycellulose sodium (1:1) dissolved in mobile phase with a retention time of 7.82 minutes.
Figure 103: Peak purity profile calculated using PDA data (from 190–800 nm) for phenylephrine
hydrochloride with carboxymethycellulose sodium (1:1) in mobile phase. Peak shown in pink and
purity curve in black. Peak purity index = 1.000000; Single point threshold = 0.999999.
8.0 8.5 min
0.0
0.1
0.2
0.3
0.4
0.5
0.6
0
50
100
150
200
mAUPeak
Zero LinePurity Curve
0.0 2.5 5.0 7.5 10.0 12.5 min
0
10
20
30
40
50
60
70
80
90
mAU280nm4nm (1.00)
7.5 8.0 min
0.0
0.1
0.2
0.3
0.4
0.5
0.6
0.7
0.8
0
10
20
30
40
50
60
mAUPeak
Zero LinePurity Curve
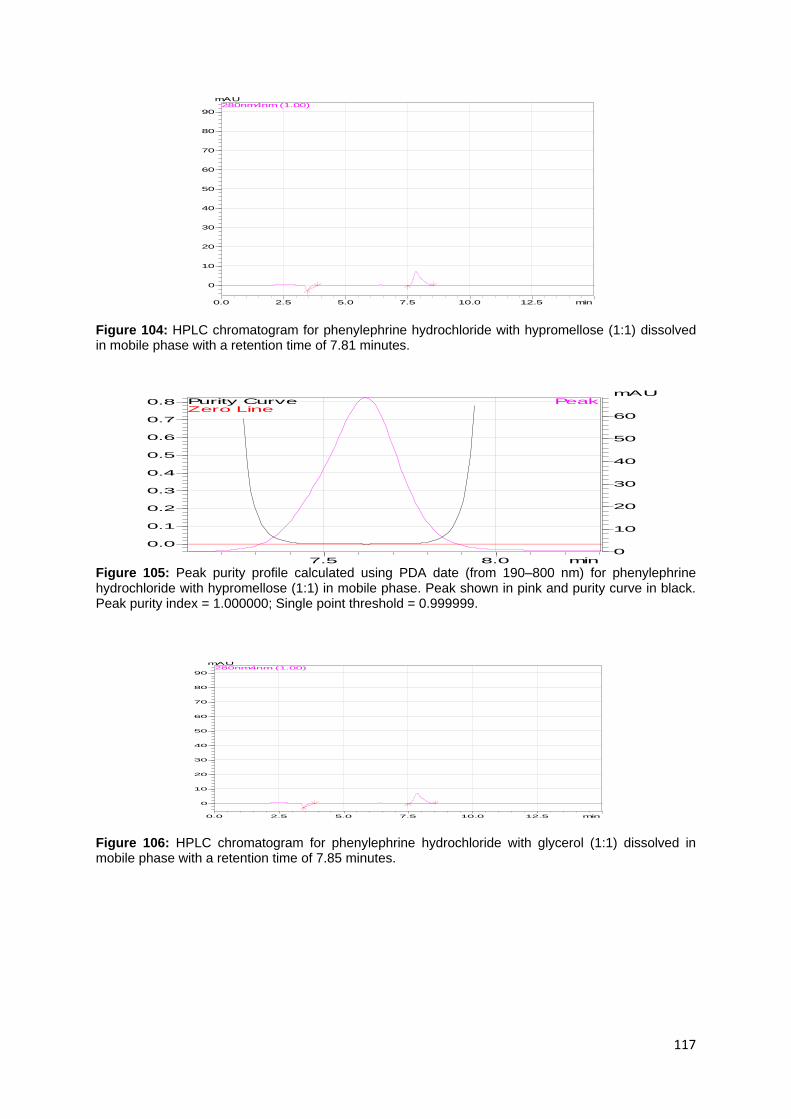
117
Figure 104: HPLC chromatogram for phenylephrine hydrochloride with hypromellose (1:1) dissolved in mobile phase with a retention time of 7.81 minutes.
Figure 105: Peak purity profile calculated using PDA date (from 190–800 nm) for phenylephrine hydrochloride with hypromellose (1:1) in mobile phase. Peak shown in pink and purity curve in black. Peak purity index = 1.000000; Single point threshold = 0.999999.
Figure 106: HPLC chromatogram for phenylephrine hydrochloride with glycerol (1:1) dissolved in mobile phase with a retention time of 7.85 minutes.
0.0 2.5 5.0 7.5 10.0 12.5 min
0
10
20
30
40
50
60
70
80
90
mAU280nm4nm (1.00)
7.5 8.0 min
0.0
0.1
0.2
0.3
0.4
0.5
0.6
0.7
0.8
0
10
20
30
40
50
60
mAUPeak
Zero LinePurity Curve
0.0 2.5 5.0 7.5 10.0 12.5 min
0
10
20
30
40
50
60
70
80
90
mAU280nm4nm (1.00)

118
Figure 107: Peak purity profile calculated using PDA data (from 190–800 nm) for phenylephrine hydrochloride with glycerol (1:1) in mobile phase. Peak shown in pink and purity curve in black. Peak purity index = 1.000000; Single point threshold = 0.999989.
Figure 108: HPLC chromatogram for phenylephrine hydrochloride with benzalkonium chloride (1:1)
dissolved in mobile phase with a retention time of 7.88 minutes.
Figure 109: Peak purity profile calculated using PDA date (from 190–800 nm) for phenylephrine hydrochloride with benzalkonium chloride (1:1) in mobile phase. Peak shown in pink and purity curve in black. Peak purity index = 0.999999; Single point threshold = 0.999918.
7.5 8.0 min
0.0
0.1
0.2
0.3
0.4
0.5
0.6
0.7
0.8
0
10
20
30
40
50
60
mAUPeak
Zero LinePurity Curve
0.0 2.5 5.0 7.5 10.0 12.5 min
0
10
20
30
40
50
60
70
80
90
mAU280nm4nm (1.00)
7.5 8.0 min
0.0
0.1
0.2
0.3
0.4
0.5
0.6
0.7
0.8
0
10
20
30
40
50
60
mAUPeak
Zero LinePurity Curve

119
Figure 110: HPLC chromatogram for phenylephrine hydrochloride with EDTA (1:1) dissolved in mobile phase with a retention time of 7.86 minutes.
Figure 111: Peak purity profile calculated using PDA data (from 190–800 nm) for phenylephrine
hydrochloride with EDTA (1:1) in mobile phase. Peak shown in pink and purity curve in black. Peak
purity index = 0.999999; Single point threshold = 0.999991.
Figure 112: HPLC chromatogram for phenylephrine hydrochloride with boric acid (1:1) dissolved in
mobile phase with a retention time of 7.92 minutes.
8.0 8.5 min
0.0
0.1
0.2
0.3
0.4
0.5
0.6
0.7
0
50
100
150
200
250
mAUPeak
Zero LinePurity Curve
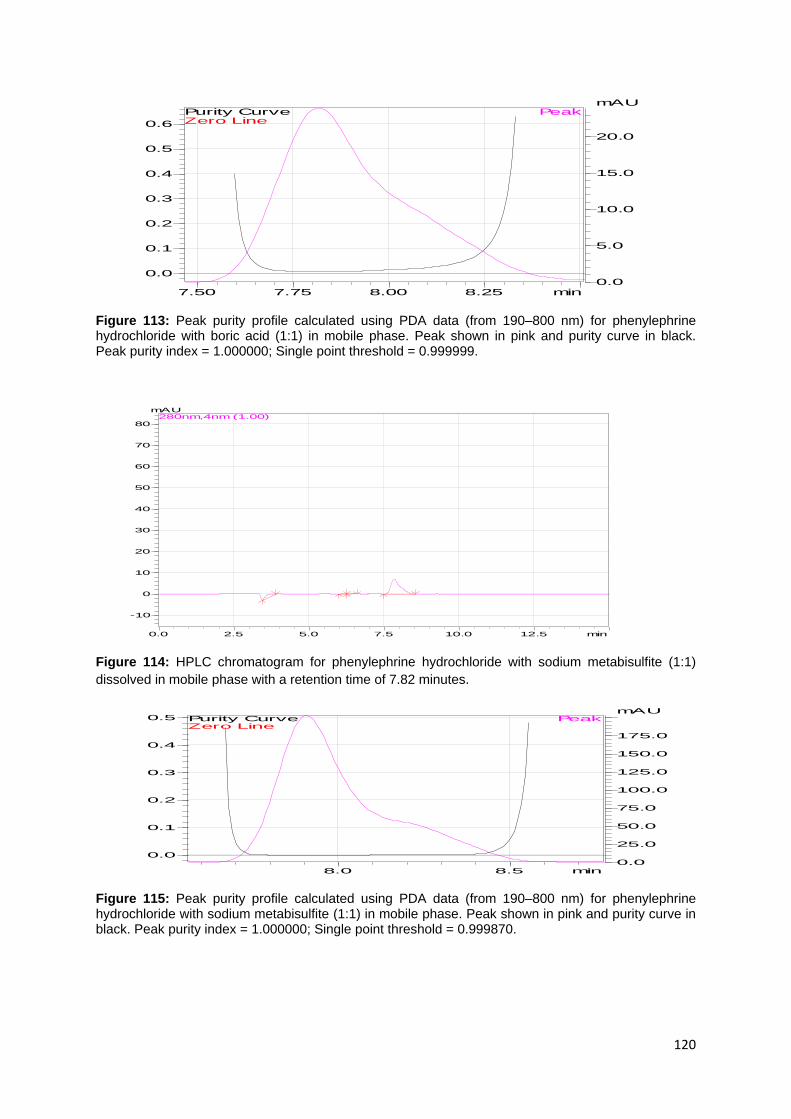
120
Figure 113: Peak purity profile calculated using PDA data (from 190–800 nm) for phenylephrine hydrochloride with boric acid (1:1) in mobile phase. Peak shown in pink and purity curve in black. Peak purity index = 1.000000; Single point threshold = 0.999999.
Figure 114: HPLC chromatogram for phenylephrine hydrochloride with sodium metabisulfite (1:1)
dissolved in mobile phase with a retention time of 7.82 minutes.
Figure 115: Peak purity profile calculated using PDA data (from 190–800 nm) for phenylephrine hydrochloride with sodium metabisulfite (1:1) in mobile phase. Peak shown in pink and purity curve in black. Peak purity index = 1.000000; Single point threshold = 0.999870.
7.50 7.75 8.00 8.25 min
0.0
0.1
0.2
0.3
0.4
0.5
0.6
0.0
5.0
10.0
15.0
20.0
mAUPeak
Zero LinePurity Curve
0.0 2.5 5.0 7.5 10.0 12.5 min
-10
0
10
20
30
40
50
60
70
80
mAU280nm,4nm (1.00)
8.0 8.5 min
0.0
0.1
0.2
0.3
0.4
0.5
0.0
25.0
50.0
75.0
100.0
125.0
150.0
175.0
mAUPeak
Zero LinePurity Curve

121
Figure 116: HPLC chromatogram for phenylephrine hydrochloride with disodium edetate (1:1) dissolved in mobile phase with a retention time of 7.82 minutes.
Figure 117: Peak purity profile calculated using PDA data (from 190–800 nm) for phenylephrine
hydrochloride with disodium edetate (1:1) in mobile phase. Peak shown in pink and purity curve in
black. Peak purity index = 1.000000; Single point threshold = 0.998891.
Figure 118: HPLC chromatogram for phenylephrine hydrochloride with propyl paraben (1:1) dissolved in mobile phase with a retention time of 7.83 minutes.
8.00 8.25 8.50 8.75 min
0.0
0.1
0.2
0.3
0.4
0.5
0.6
0.7
0.8
0
10
20
30
40
50
mAUPeak
Zero LinePurity Curve

122
Figure 119: Peak purity profile calculated using PDA data (from 190–800 nm) for phenylephrine
hydrochloride with propyl paraben (1:1) in mobile phase. Peak shown in pink and purity curve in
black. Peak purity index = 1.000000; Single point threshold = 0.999948.
Figure 120: HPLC chromatogram for phenylephrine hydrochloride with methyl paraben (1:1)
dissolved in mobile phase with a retention time of 7.82 minutes.
Figure 121: Peak purity profile calculated using PDA data (from 190–800 nm) for phenylephrine hydrochloride with methyl paraben (1:1) in mobile phase. Peak shown in pink and purity curve in black. Peak purity index = 1.000000; Single point threshold = 0.999982.
7.5 8.0 8.5 min
0.0
0.1
0.2
0.3
0.4
0.5
0.6
0.0
25.0
50.0
75.0
100.0
125.0
150.0
175.0
mAUPeak
Zero LinePurity Curve
9.0 9.5 10.0 min
0.00
0.25
0.50
0.75
1.00
0
100
200
300
400
500
mAUPeak
Zero LinePurity Curve

123
4.3 Stability study
Stability studies were performed on products I–V at climatic zone II storage
conditions these were 40 °C/75%RH, 25 °C/40%RH and 30 °C/65%RH. The five
products were stored at all three of the above mentioned conditions in triplicate and
tested at zero, one and three months. The most aesthetically pleasing and stable
formulation was chosen based on the phenylephrine hydrochloride left in the
product, pH change and appearance.
The results for storage time zero and one month 40 °C/75%RH (accelerated
condition) were stated in specificity above.
Products I–V stored for 3 months at 30 °C/65%RH: The chromatograms of the
products showed that there was no co-elution and no interference with the API as
shown in Figures 122–131 below. The API left in from products I–V was 72.86%,
96.79%, 75.14%, 98.35% and 61.73% respectively. The difference in mean were
statistically different as p<0.01. The products I and V failed aesthetically as they
turned slightly yellow with no residue, precipitate and no solution loss. The remaining
products remained clear and aesthetically pleasing.
Figure 122: HPLC chromatogram for product I stored at 30 °C/65%RH for 3 months dissolved in mobile phase with a retention time of 7.87 minutes.
0.0 2.5 5.0 7.5 10.0 12.5 min
-6
-5
-4
-3
-2
-1
0
1
2
3
4
5
6
7
mAU280nm,4nm (1.00)

124
Figure 123: Peak purity profile calculated using PDA date (from 190–800 nm) for product I stored at 30 °C/65%RH for 3 months in mobile phase. Peak shown in pink and purity curve in black. Peak purity index = 0.999999; Single point threshold = 0.999950.
Figure 124: HPLC chromatogram for product II stored at 30 °C/65%RH for 3 months dissolved in mobile phase with a retention time of 7.85 minutes.
Figure 125: Peak purity profile calculated using PDA date (from 190–800 nm) for product II stored at 30 °C/65%RH for 3 months in mobile phase. Peak shown in pink and purity curve in black. Peak purity index = 1.000000; Single point threshold = 0.996473.
7.75 8.00 8.25 8.50 min
0.00
0.05
0.10
0.15
0.20
0.25
0.30
0.35
0.40
0.45
0.50
0.55
0.60
0.65
0.0
2.5
5.0
7.5
10.0
12.5
15.0
17.5
20.0
22.5
25.0
27.5
mAUPeak
Zero LinePurity Curve
0.0 2.5 5.0 7.5 10.0 12.5 min
-5.0
-2.5
0.0
2.5
5.0
7.5
mAU280nm,4nm (1.00)
7.75 8.00 8.25 8.50 min
0.00
0.05
0.10
0.15
0.20
0.25
0.30
0.35
0.40
0.45
0.50
0.55
0.60
0.0
2.5
5.0
7.5
10.0
12.5
15.0
17.5
20.0
22.5
25.0
27.5
mAUPeak
Zero LinePurity Curve

125
Figure 126: HPLC chromatogram for product III stored at 30 °C/65%RH for 3 months dissolved in mobile phase with a retention time of 7.87 minutes.
Figure 127: Peak purity profile calculated using PDA date (from 190–800 nm) for product III stored at 30 °C/65%RH for 3 months in mobile phase. Peak shown in pink and purity curve in black. Peak purity index = 0.999999; Single point threshold = 0.996955.
Figure 128: HPLC chromatogram for product IV stored at 30 °C/65% RH for 3 months dissolved in mobile phase with a retention time of 7.88 minutes.
0.0 2.5 5.0 7.5 10.0 12.5 min
-5.0
-2.5
0.0
2.5
5.0
7.5
mAU280nm,4nm (1.00)
7.75 8.00 8.25 8.50 min
0.0
0.1
0.2
0.3
0.4
0.5
0.6
0.7
0.8
0.0
2.5
5.0
7.5
10.0
12.5
15.0
17.5
20.0
22.5
25.0
27.5
30.0
32.5
mAUPeak
Zero LinePurity Curve
0.0 2.5 5.0 7.5 10.0 12.5 min
-7.5
-5.0
-2.5
0.0
2.5
5.0
7.5
10.0
12.5
15.0mAU
280nm,4nm (1.00)
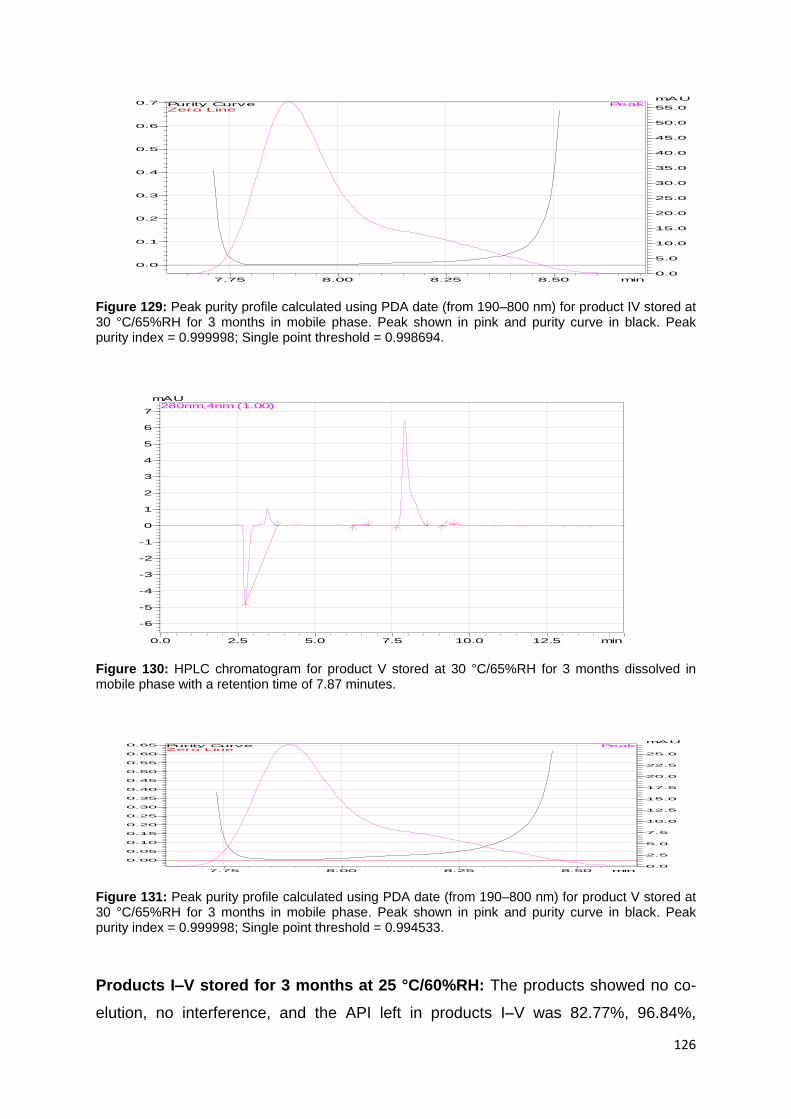
126
Figure 129: Peak purity profile calculated using PDA date (from 190–800 nm) for product IV stored at 30 °C/65%RH for 3 months in mobile phase. Peak shown in pink and purity curve in black. Peak purity index = 0.999998; Single point threshold = 0.998694.
Figure 130: HPLC chromatogram for product V stored at 30 °C/65%RH for 3 months dissolved in mobile phase with a retention time of 7.87 minutes.
Figure 131: Peak purity profile calculated using PDA date (from 190–800 nm) for product V stored at 30 °C/65%RH for 3 months in mobile phase. Peak shown in pink and purity curve in black. Peak purity index = 0.999998; Single point threshold = 0.994533.
Products I–V stored for 3 months at 25 °C/60%RH: The products showed no co-
elution, no interference, and the API left in products I–V was 82.77%, 96.84%,
7.75 8.00 8.25 8.50 min
0.0
0.1
0.2
0.3
0.4
0.5
0.6
0.7
0.0
5.0
10.0
15.0
20.0
25.0
30.0
35.0
40.0
45.0
50.0
55.0
mAUPeak
Zero LinePurity Curve
0.0 2.5 5.0 7.5 10.0 12.5 min
-6
-5
-4
-3
-2
-1
0
1
2
3
4
5
6
7
mAU280nm,4nm (1.00)
7.75 8.00 8.25 8.50 min
0.00
0.05
0.10
0.15
0.20
0.25
0.30
0.35
0.40
0.45
0.50
0.55
0.60
0.65
0.0
2.5
5.0
7.5
10.0
12.5
15.0
17.5
20.0
22.5
25.0
mAUPeak
Zero LinePurity Curve

127
86.78%, 97.06%, and 70.88% respectively. There was a statistic difference of
p<0.05. The products III and V failed aesthetically as they turned slightly yellow and
brown respectively, with no residue, precipitate and loss of solution. The remaining
products remained clear and aesthetically pleasing. The figures 132–141 below
show the chromatograms of the products.
Figure 132: HPLC chromatogram for product I stored at 25 °C/60%RH for 3 months dissolved in
mobile phase with a retention time of 7.91 minutes.
Figure 133: Peak purity profile calculated using PDA date (from 190–800 nm) for product I stored at 25 °C/60%RH for 3 months in mobile phase. Peak shown in pink and purity curve in black. Peak purity index = 1.000000; Single point threshold = 0.995873.
.
0.0 2.5 5.0 7.5 10.0 12.5 min
-2.5
0.0
2.5
5.0
7.5
10.0
12.5
15.0
17.5mAU
280nm,4nm (1.00)
7.75 8.00 8.25 8.50 min
0.0
0.1
0.2
0.3
0.4
0.5
0.6
0.7
0.8
0.9
0.0
5.0
10.0
15.0
20.0
25.0
30.0
35.0
40.0
45.0
mAUPeak
Zero LinePurity Curve

128
Figure 134: HPLC chromatogram for product II stored at 25 °C/60%RH for 3 months dissolved in mobile phase with a retention time of 7.89 minutes.
Figure 135: Peak purity profile calculated using PDA date (from 190–800 nm) for product II stored at 25 °C/60%RH for 3 months in mobile phase. Peak shown in pink and purity curve in black. Peak purity index = 0.999998; Single point threshold = 0.999950.
Figure 136: HPLC chromatogram for product III stored at 25 °C/60%RH for 3 months dissolved in mobile phase with a retention time of 7.92 minutes.
0.0 2.5 5.0 7.5 10.0 12.5 min
-20
-10
0
10
20
30
40
50
60
70
80
90
100
mAU280nm,4nm (1.00)
7.50 7.75 8.00 8.25 8.50 min
0.00
0.05
0.10
0.15
0.20
0.25
0.30
0.35
0.40
0.45
0
50
100
150
200
250
300
350
400
mAUPeak
Zero LinePurity Curve
0.0 2.5 5.0 7.5 10.0 12.5 min
-7.5
-5.0
-2.5
0.0
2.5
5.0
7.5
10.0
12.5
15.0
mAU280nm,4nm (1.00)

129
Figure 137: Peak purity profile calculated using PDA date (from 190–800 nm) for product III stored at 25 °C/60%RH for 3 months in mobile phase. Peak shown in pink and purity curve in black. Peak purity index = 0.999999; Single point threshold = 0.998742.
Figure 138: HPLC chromatogram for product IV stored at 25 °C/60%RH for 3 months dissolved in
mobile phase with a retention time of 7.92 minutes.
Figure 139: Peak purity profile calculated using PDA date (from 190–800 nm) for product IV stored at 25 °C/60%RH for 3 months in mobile phase. Peak shown in pink and purity curve in black. Peak purity index = 0.999999; Single point threshold = 0.996396.
7.75 8.00 8.25 8.50 min
0.0
0.1
0.2
0.3
0.4
0.5
0.6
0.0
5.0
10.0
15.0
20.0
25.0
30.0
35.0
40.0
45.0
50.0
55.0
mAUPeak
Zero LinePurity Curve
0.0 2.5 5.0 7.5 10.0 12.5 min
-5.0
-2.5
0.0
2.5
5.0
7.5
mAU280nm,4nm (1.00)
7.75 8.00 8.25 8.50 min
0.0
0.1
0.2
0.3
0.4
0.5
0.6
0.7
0.8
0.0
2.5
5.0
7.5
10.0
12.5
15.0
17.5
20.0
22.5
25.0
27.5
30.0
32.5
mAUPeak
Zero LinePurity Curve
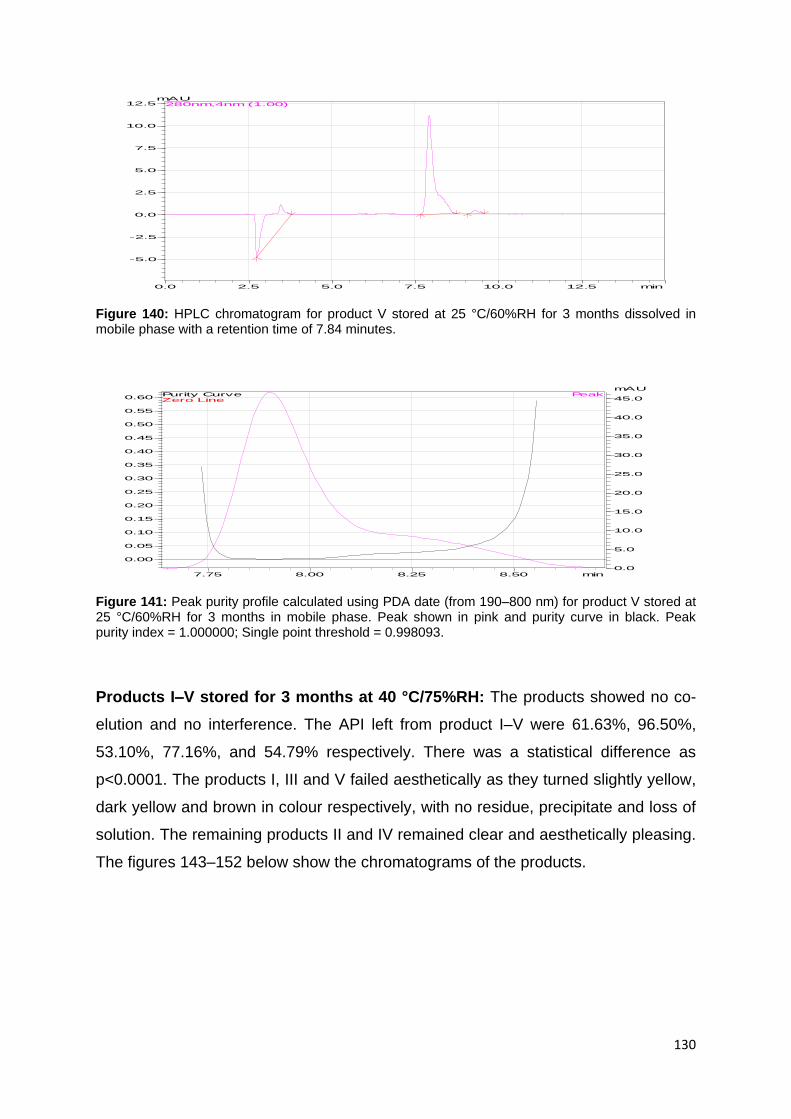
130
Figure 140: HPLC chromatogram for product V stored at 25 °C/60%RH for 3 months dissolved in mobile phase with a retention time of 7.84 minutes.
Figure 141: Peak purity profile calculated using PDA date (from 190–800 nm) for product V stored at 25 °C/60%RH for 3 months in mobile phase. Peak shown in pink and purity curve in black. Peak purity index = 1.000000; Single point threshold = 0.998093.
Products I–V stored for 3 months at 40 °C/75%RH: The products showed no co-
elution and no interference. The API left from product I–V were 61.63%, 96.50%,
53.10%, 77.16%, and 54.79% respectively. There was a statistical difference as
p<0.0001. The products I, III and V failed aesthetically as they turned slightly yellow,
dark yellow and brown in colour respectively, with no residue, precipitate and loss of
solution. The remaining products II and IV remained clear and aesthetically pleasing.
The figures 143–152 below show the chromatograms of the products.
0.0 2.5 5.0 7.5 10.0 12.5 min
-5.0
-2.5
0.0
2.5
5.0
7.5
10.0
12.5mAU
280nm,4nm (1.00)
7.75 8.00 8.25 8.50 min
0.00
0.05
0.10
0.15
0.20
0.25
0.30
0.35
0.40
0.45
0.50
0.55
0.60
0.0
5.0
10.0
15.0
20.0
25.0
30.0
35.0
40.0
45.0
mAUPeak
Zero LinePurity Curve

131
Figure 142: HPLC chromatogram for product I stored at 40 °C/75%RH for 3 months dissolved in mobile phase with a retention time of 7.84 minutes.
Figure 143: Peak purity profile calculated using PDA date (from 190 – 800 nm) for product I stored at
40 °C/75%RH for 3 months in mobile phase. Peak shown in pink and purity curve in black. Peak
purity index = 1.000000; Single point threshold = 0.998093.
Figure 144: HPLC chromatogram for product II stored at 40 °C/75%RH for 3 months dissolved in mobile phase with a retention time of 7.84 minutes.
0.0 2.5 5.0 7.5 10.0 12.5 min
0.0
2.5
5.0
7.5
10.0
12.5
15.0
17.5
mAU280nm,4nm (1.00)
7.75 8.00 8.25 8.50 min
0.00
0.05
0.10
0.15
0.20
0.25
0.30
0.35
0.40
0.45
0.50
0.55
0.60
0.65
0.0
5.0
10.0
15.0
20.0
25.0
30.0
35.0
40.0
45.0
mAUPeak
Zero LinePurity Curve
0.0 2.5 5.0 7.5 10.0 12.5 min
-5.0
-2.5
0.0
2.5
5.0
7.5
mAU280nm,4nm (1.00)

132
Figure 145: Peak purity profile calculated using PDA date (from 190 – 800 nm) for product II stored at 40 °C/75%RH for 3 months in mobile phase. Peak shown in pink and purity curve in black. Peak purity index = 1.000000; Single point threshold = 0.998093.
Figure 146: HPLC chromatogram for product III stored at 40 °C/75%RH for 3 months dissolved in mobile phase with a retention time of 7.84 minutes.
Figure 147: Peak purity profile calculated using PDA date (from 190–800 nm) for product III stored at 40 °C/75%RH for 3 months in mobile phase. Peak shown in pink and purity curve in black. Peak purity index = 1.000000; Single point threshold = 0.998093.
7.75 8.00 8.25 8.50 min
0.00
0.05
0.10
0.15
0.20
0.25
0.30
0.35
0.40
0.45
0.50
0.55
0.60
0.0
2.5
5.0
7.5
10.0
12.5
15.0
17.5
20.0
22.5
25.0
27.5
mAUPeak
Zero LinePurity Curve
0.0 2.5 5.0 7.5 10.0 12.5 min
-5.0
-2.5
0.0
2.5
5.0
7.5
mAU280nm,4nm (1.00)
7.75 8.00 8.25 8.50 min
0.0
0.1
0.2
0.3
0.4
0.5
0.6
0.7
0.8
0.0
5.0
10.0
15.0
20.0
25.0
30.0
35.0
mAUPeak
Zero LinePurity Curve

133
Figure 148: HPLC chromatogram for product IV stored at 40 °C/75%RH for 3 months dissolved in mobile phase with a retention time of 7.84 minutes.
Figure 149: Peak purity profile calculated using PDA date (from 190–800 nm) for product IV stored at
40 °C/75%RH for 3 months in mobile phase. Peak shown in pink and purity curve in black. Peak
purity index = 1.000000; Single point threshold = 0.998093.
Figure 150: HPLC chromatogram for product V stored at 40 °C/75%RH for 3 months dissolved in mobile phase with a retention time of 7.91 minutes.
0.0 2.5 5.0 7.5 10.0 12.5 min
-6
-5
-4
-3
-2
-1
0
1
2
3
4
5
6
mAU280nm,4nm (1.00)
7.75 8.00 8.25 8.50 min
0.0
0.1
0.2
0.3
0.4
0.5
0.6
0.7
0.8
0.9
0.0
2.5
5.0
7.5
10.0
12.5
15.0
17.5
20.0
22.5
mAUPeak
Zero LinePurity Curve
0.0 2.5 5.0 7.5 10.0 12.5 min-7
-6
-5
-4
-3
-2
-1
0
1
2
3
4
5
6
mAU280nm,4nm (1.00)
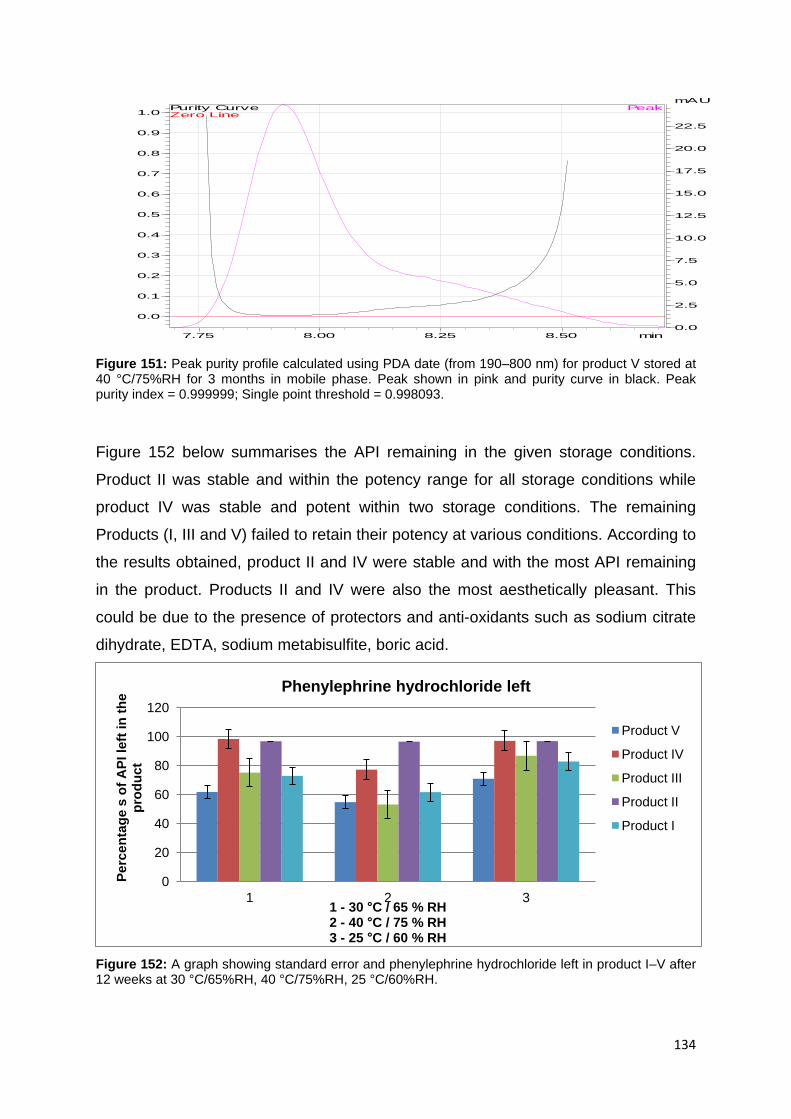
134
Figure 151: Peak purity profile calculated using PDA date (from 190–800 nm) for product V stored at 40 °C/75%RH for 3 months in mobile phase. Peak shown in pink and purity curve in black. Peak purity index = 0.999999; Single point threshold = 0.998093.
Figure 152 below summarises the API remaining in the given storage conditions.
Product II was stable and within the potency range for all storage conditions while
product IV was stable and potent within two storage conditions. The remaining
Products (I, III and V) failed to retain their potency at various conditions. According to
the results obtained, product II and IV were stable and with the most API remaining
in the product. Products II and IV were also the most aesthetically pleasant. This
could be due to the presence of protectors and anti-oxidants such as sodium citrate
dihydrate, EDTA, sodium metabisulfite, boric acid.
Figure 152: A graph showing standard error and phenylephrine hydrochloride left in product I–V after 12 weeks at 30 °C/65%RH, 40 °C/75%RH, 25 °C/60%RH.
7.75 8.00 8.25 8.50 min
0.0
0.1
0.2
0.3
0.4
0.5
0.6
0.7
0.8
0.9
1.0
0.0
2.5
5.0
7.5
10.0
12.5
15.0
17.5
20.0
22.5
mAUPeak
Zero LinePurity Curve
0
20
40
60
80
100
120
1 2 3
Pe
rce
nta
ge
s o
f A
PI
left
in
th
e
pro
du
ct
1 - 30 °C / 65 % RH 2 - 40 °C / 75 % RH 3 - 25 °C / 60 % RH
Phenylephrine hydrochloride left
Product V
Product IV
Product III
Product II
Product I
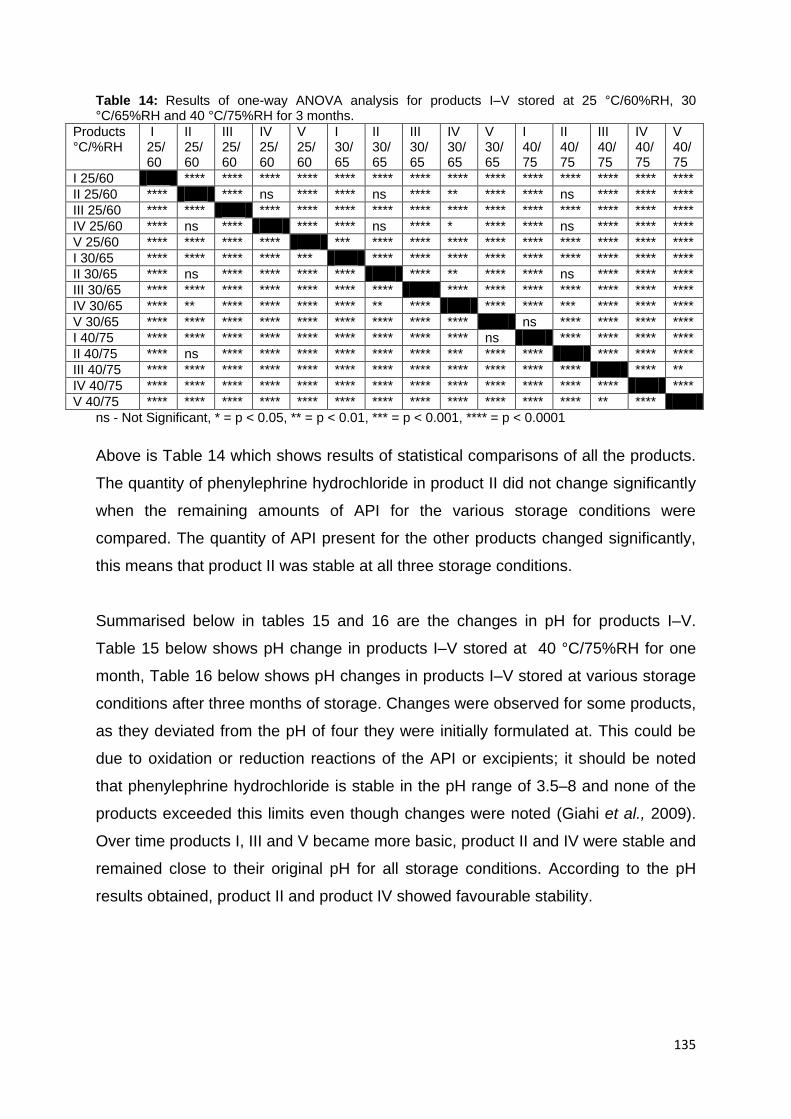
135
Table 14: Results of one-way ANOVA analysis for products I–V stored at 25 °C/60%RH, 30 °C/65%RH and 40 °C/75%RH for 3 months.
Products °C/%RH
I 25/60
II 25/60
III 25/60
IV 25/60
V 25/60
I 30/65
II 30/65
III 30/65
IV 30/65
V 30/65
I 40/75
II 40/75
III 40/75
IV 40/75
V 40/75
I 25/60 **** **** **** **** **** **** **** **** **** **** **** **** **** ****
II 25/60 **** **** ns **** **** ns **** ** **** **** ns **** **** ****
III 25/60 **** **** **** **** **** **** **** **** **** **** **** **** **** ****
IV 25/60 **** ns **** **** **** ns **** * **** **** ns **** **** ****
V 25/60 **** **** **** **** *** **** **** **** **** **** **** **** **** ****
I 30/65 **** **** **** **** *** **** **** **** **** **** **** **** **** ****
II 30/65 **** ns **** **** **** **** **** ** **** **** ns **** **** ****
III 30/65 **** **** **** **** **** **** **** **** **** **** **** **** **** ****
IV 30/65 **** ** **** **** **** **** ** **** **** **** *** **** **** ****
V 30/65 **** **** **** **** **** **** **** **** **** ns **** **** **** ****
I 40/75 **** **** **** **** **** **** **** **** **** ns **** **** **** ****
II 40/75 **** ns **** **** **** **** **** **** *** **** **** **** **** ****
III 40/75 **** **** **** **** **** **** **** **** **** **** **** **** **** **
IV 40/75 **** **** **** **** **** **** **** **** **** **** **** **** **** ****
V 40/75 **** **** **** **** **** **** **** **** **** **** **** **** ** ****
ns - Not Significant, * = p < 0.05, ** = p < 0.01, *** = p < 0.001, **** = p < 0.0001
Above is Table 14 which shows results of statistical comparisons of all the products.
The quantity of phenylephrine hydrochloride in product II did not change significantly
when the remaining amounts of API for the various storage conditions were
compared. The quantity of API present for the other products changed significantly,
this means that product II was stable at all three storage conditions.
Summarised below in tables 15 and 16 are the changes in pH for products I–V.
Table 15 below shows pH change in products I–V stored at 40 °C/75%RH for one
month, Table 16 below shows pH changes in products I–V stored at various storage
conditions after three months of storage. Changes were observed for some products,
as they deviated from the pH of four they were initially formulated at. This could be
due to oxidation or reduction reactions of the API or excipients; it should be noted
that phenylephrine hydrochloride is stable in the pH range of 3.5–8 and none of the
products exceeded this limits even though changes were noted (Giahi et al., 2009).
Over time products I, III and V became more basic, product II and IV were stable and
remained close to their original pH for all storage conditions. According to the pH
results obtained, product II and product IV showed favourable stability.
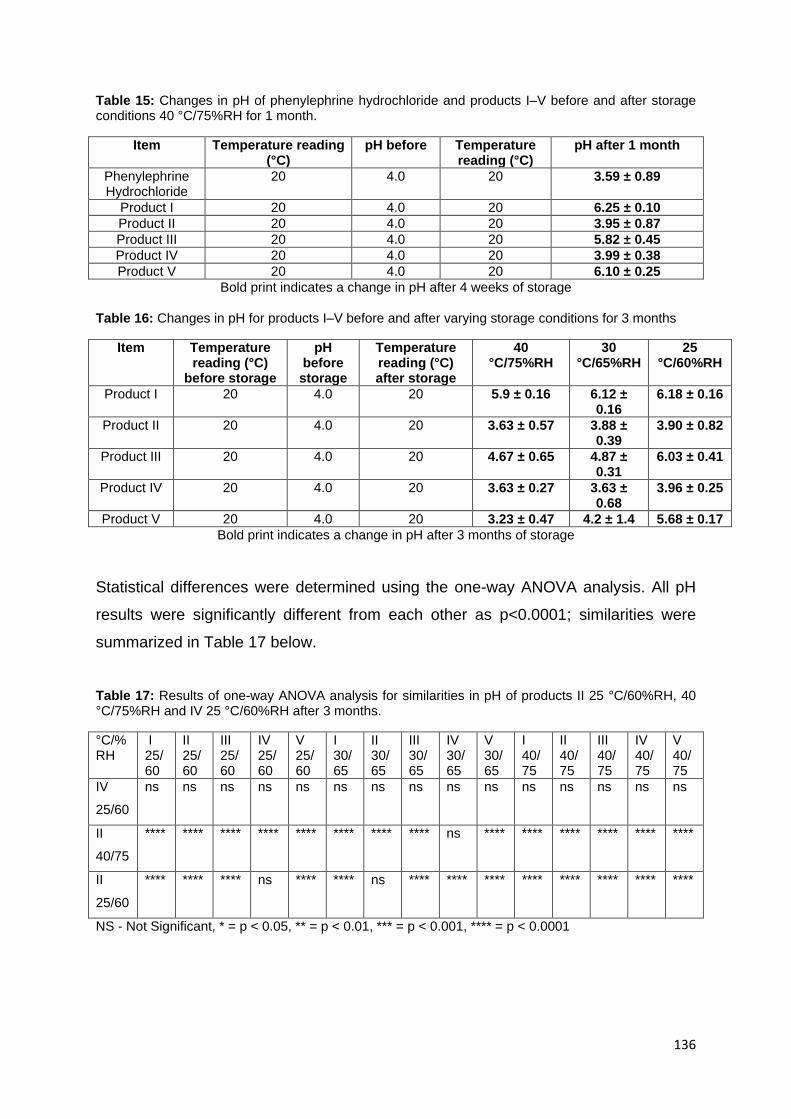
136
Table 15: Changes in pH of phenylephrine hydrochloride and products I–V before and after storage conditions 40 °C/75%RH for 1 month.
Item Temperature reading (°C)
pH before Temperature reading (°C)
pH after 1 month
Phenylephrine Hydrochloride
20 4.0 20 3.59 ± 0.89
Product I 20 4.0 20 6.25 ± 0.10
Product II 20 4.0 20 3.95 ± 0.87
Product III 20 4.0 20 5.82 ± 0.45
Product IV 20 4.0 20 3.99 ± 0.38
Product V 20 4.0 20 6.10 ± 0.25
Bold print indicates a change in pH after 4 weeks of storage
Table 16: Changes in pH for products I–V before and after varying storage conditions for 3 months
Item Temperature reading (°C)
before storage
pH before storage
Temperature reading (°C) after storage
40 °C/75%RH
30 °C/65%RH
25 °C/60%RH
Product I 20 4.0 20 5.9 ± 0.16 6.12 ± 0.16
6.18 ± 0.16
Product II 20 4.0 20 3.63 ± 0.57 3.88 ± 0.39
3.90 ± 0.82
Product III 20 4.0 20 4.67 ± 0.65 4.87 ± 0.31
6.03 ± 0.41
Product IV 20 4.0 20 3.63 ± 0.27 3.63 ± 0.68
3.96 ± 0.25
Product V 20 4.0 20 3.23 ± 0.47 4.2 ± 1.4 5.68 ± 0.17
Bold print indicates a change in pH after 3 months of storage
Statistical differences were determined using the one-way ANOVA analysis. All pH
results were significantly different from each other as p<0.0001; similarities were
summarized in Table 17 below.
Table 17: Results of one-way ANOVA analysis for similarities in pH of products II 25 °C/60%RH, 40 °C/75%RH and IV 25 °C/60%RH after 3 months.
°C/%RH
I 25/60
II 25/60
III 25/60
IV 25/60
V 25/60
I 30/65
II 30/65
III 30/65
IV 30/65
V 30/65
I 40/75
II 40/75
III 40/75
IV 40/75
V 40/75
IV
25/60
ns ns ns ns ns ns ns ns ns ns ns ns ns ns ns
II
40/75
**** **** **** **** **** **** **** **** ns **** **** **** **** **** ****
II
25/60
**** **** **** ns **** **** ns **** **** **** **** **** **** **** ****
NS - Not Significant, * = p < 0.05, ** = p < 0.01, *** = p < 0.001, **** = p < 0.0001

137
Table 18: Physical appearance of products I–V before and after varying storage conditions for 3 months.
Item Initial
Physical appearance
Physical appearance After 3 months of storage
40 °C/75%RH 30 °C/65%RH 25 °C/60%RH
Product I Clear solution, no precipitate or residue, no colour change
Clear solution, yellow in colour, no residue, no precipitate, no loss of solution
Slightly yellow, clear, no residue, no precipitate, no loss of solution
No change in initial appearance, no loss of solution
Product II Clear solution, no precipitate or residue, no colour change
No change in initial appearance, no loss of solution
Clear, no residue, no precipitate, no loss of solution
No change in initial appearance, no loss of solution
Product III Clear solution, no precipitate or residue, no colour change
Clear solution, tinge yellow, no residue, no precipitate, no loss of solution
Clear, no residue, no precipitate, no loss of solution
Slight yellow, no precipitate formed
Product IV Clear solution, no precipitate or residue, no colour change
No change in initial appearance, no loss of solution
Clear, no residue, no precipitate, no loss of solution
No change in initial appearance, no loss of solution
Product V Clear solution, no precipitate or residue, no colour change
Dark brown, no precipitate formed, presence of residue, no loss of solution
Brown, no residue, no precipitate, no loss of solution
Tinge brown, no precipitate formed, no loss of solution, no residue
Bold print indicates a change after 3 months of storage
Changes in physical appearance were judged visually. Aesthetically pleasing
products were noted and above in Table 18 is a summary of what they looked like
after three months, products II and IV were the only ones that did not have physical
changes.
4.4 Determination of yield point and viscosity of products
The viscosity of a solution is a particluarly important parameter, especially during
production as continous quality control is essential in order to achive consitently high
quality despite the immense production volume. The graphs seen in figures 153–158
below show the flow curves of products I–V and a marketed product Prefrin® at
different storage conditions. With the aid of Herschel/Bulkley formula, yield points
were calculated and measured by Anton Paar rheometer (RheoPlusTM).
Good viscosity properties of the VMA is important in this experiment, as viscosity
shows the flow movement, while yield points corresponds directly to the elastic
properties of the formulation. The product must flow out of the plastic eye drop bottle
but should be viscous enough for accurate drop dosing.

138
Figure 153: Flow and viscosity curve of Prefrin® and products I–V at time zero for storage condition 30 °C/65% RH.
Figures 153–158 show variance in viscosity between the different viscosity modifiers
(glycerol, hydroxy propyl methylcellulose and sodium carboxy methyl cellulose). At
time zero, Prefrin® and product I–V display slightly similar flow. After three months
glycerol had a marked increase in its viscosity, this is seen in the figures 154, 156
and 158 below. Other viscosity modifiers show slight changes.
Figure 154: Flow and viscosity curve of Prefrin® and products I–V after 3 months for storage condition 30 °C/65% RH.
0
2
4
6
8
10
12
14
16
18
20
22
24
26
30
Pa
10-3
10-2
10-1
100
Pa·s
0 100 200 300 400 500 600 7001/s
Shear Rate .
TAU
Anton Paar GmbH
hpmc product 5 30/65 3 t0 2
CC27-SN25781; d=0 mm
Shear Stress
Viscosity
glycerol product 3 30/65 3 t0 2
CC27-SN25781; d=0 mm
Shear Stress
Viscosity
hpmc product 1 30/65 3 t0 2
CC27-SN25781; d=0 mm
Shear Stress
Viscosity
hpmc product 2 30/65 3 t0 1
CC27-SN25781; d=0 mm
Shear Stress
Viscosity
scmc product 4 30/65 3 t0 1
CC27-SN25781; d=0 mm
Shear Stress
Viscosity
Prefrin 3 1
CC27-SN25781; d=0 mm
Shear Stress
Viscosity
0
2
4
6
8
10
12
14
16
18
20
22
24
26
30
Pa
10-3
10-2
10-1
100
Pa·s
0 100 200 300 400 500 600 7001/s
Shear Rate .
TAU
Anton Paar GmbH
glycerol product 330/65 3 1
CC27-SN25781; d=0 mm
Shear Stress
Viscosity
hpmc product 2 30/65 3 1
CC27-SN25781; d=0 mm
Shear Stress
Viscosity
hpmc product 1 30/65 3 1
CC27-SN25781; d=0 mm
Shear Stress
Viscosity
hpmc product 5 30/65 3 1
CC27-SN25781; d=0 mm
Shear Stress
Viscosity
scmc product 4 30/65 3 1
CC27-SN25781; d=0 mm
Shear Stress
Viscosity
Prefrin 3 1
CC27-SN25781; d=0 mm
Shear Stress
Viscosity

139
Figure 155: Flow and viscosity curve of Prefrin® and products I–V at time zero for storage condition 40 °C/75% RH.
Figure 156: Flow and viscosity curve of Prefrin® and products I–V after 3 months for storage condition 40 °C/75% RH.
0
2
4
6
8
10
12
14
16
18
20
22
24
26
30
Pa
10-3
10-2
10-1
100
Pa·s
0 100 200 300 400 500 600 7001/s
Shear Rate .
TAU
Anton Paar GmbH
hpmc product 1 40/75 3 t0 1
CC27-SN25781; d=0 mm
Shear Stress
Viscosity
hpmc product 2 40/75 3 t0 1
CC27-SN25781; d=0 mm
Shear Stress
Viscosity
hpmc product 5 40/75 3 t0 1
CC27-SN25781; d=0 mm
Shear Stress
Viscosity
glycerol product 3 40/75 3 t0 1
CC27-SN25781; d=0 mm
Shear Stress
Viscosity
scmc product 4 40/75 3 t0 1
CC27-SN25781; d=0 mm
Shear Stress
Viscosity
Prefrin 3 1
CC27-SN25781; d=0 mm
Shear Stress
Viscosity
0
2
4
6
8
10
12
14
16
18
20
22
24
26
30
Pa
10-3
10-2
10-1
100
Pa·s
0 100 200 300 400 500 600 7001/s
Shear Rate .
TAU
Anton Paar GmbH
scmc product 4 40/75 3 1
CC27-SN25781; d=0 mm
Shear Stress
Viscosity
hpmc product 2 40/75 3 1
CC27-SN25781; d=0 mm
Shear Stress
Viscosity
hpmc product 1 40/75 3 1
CC27-SN25781; d=0 mm
Shear Stress
Viscosity
hpmc product 5 40/75 3 1
CC27-SN25781; d=0 mm
Shear Stress
Viscosity
glycerol product 3 40/75 3 1
CC27-SN25781; d=0 mm
Shear Stress
Viscosity
Prefrin 3 1
CC27-SN25781; d=0 mm
Shear Stress
Viscosity
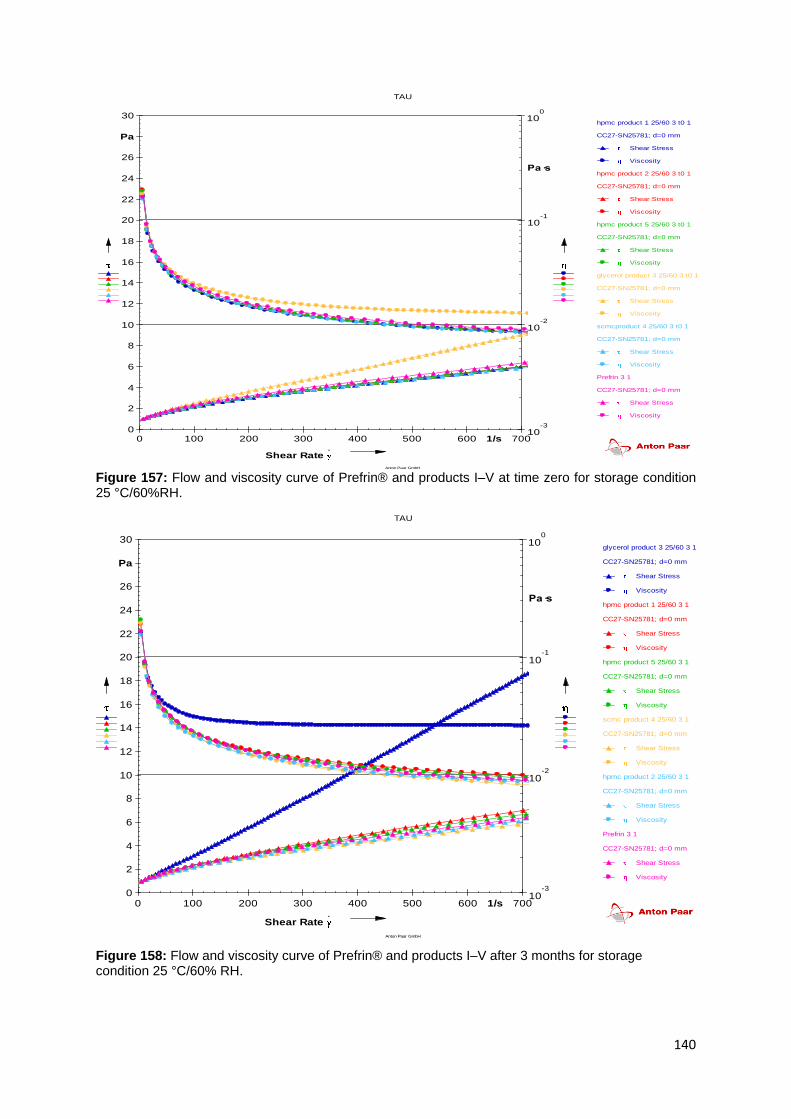
140
Figure 157: Flow and viscosity curve of Prefrin® and products I–V at time zero for storage condition 25 °C/60%RH.
Figure 158: Flow and viscosity curve of Prefrin® and products I–V after 3 months for storage condition 25 °C/60% RH.
0
2
4
6
8
10
12
14
16
18
20
22
24
26
30
Pa
10-3
10-2
10-1
100
Pa·s
0 100 200 300 400 500 600 7001/s
Shear Rate .
TAU
Anton Paar GmbH
hpmc product 1 25/60 3 t0 1
CC27-SN25781; d=0 mm
Shear Stress
Viscosity
hpmc product 2 25/60 3 t0 1
CC27-SN25781; d=0 mm
Shear Stress
Viscosity
hpmc product 5 25/60 3 t0 1
CC27-SN25781; d=0 mm
Shear Stress
Viscosity
glycerol product 3 25/60 3 t0 1
CC27-SN25781; d=0 mm
Shear Stress
Viscosity
scmcproduct 4 25/60 3 t0 1
CC27-SN25781; d=0 mm
Shear Stress
Viscosity
Prefrin 3 1
CC27-SN25781; d=0 mm
Shear Stress
Viscosity
0
2
4
6
8
10
12
14
16
18
20
22
24
26
30
Pa
10-3
10-2
10-1
100
Pa·s
0 100 200 300 400 500 600 7001/s
Shear Rate .
TAU
Anton Paar GmbH
glycerol product 3 25/60 3 1
CC27-SN25781; d=0 mm
Shear Stress
Viscosity
hpmc product 1 25/60 3 1
CC27-SN25781; d=0 mm
Shear Stress
Viscosity
hpmc product 5 25/60 3 1
CC27-SN25781; d=0 mm
Shear Stress
Viscosity
scmc product 4 25/60 3 1
CC27-SN25781; d=0 mm
Shear Stress
Viscosity
hpmc product 2 25/60 3 1
CC27-SN25781; d=0 mm
Shear Stress
Viscosity
Prefrin 3 1
CC27-SN25781; d=0 mm
Shear Stress
Viscosity
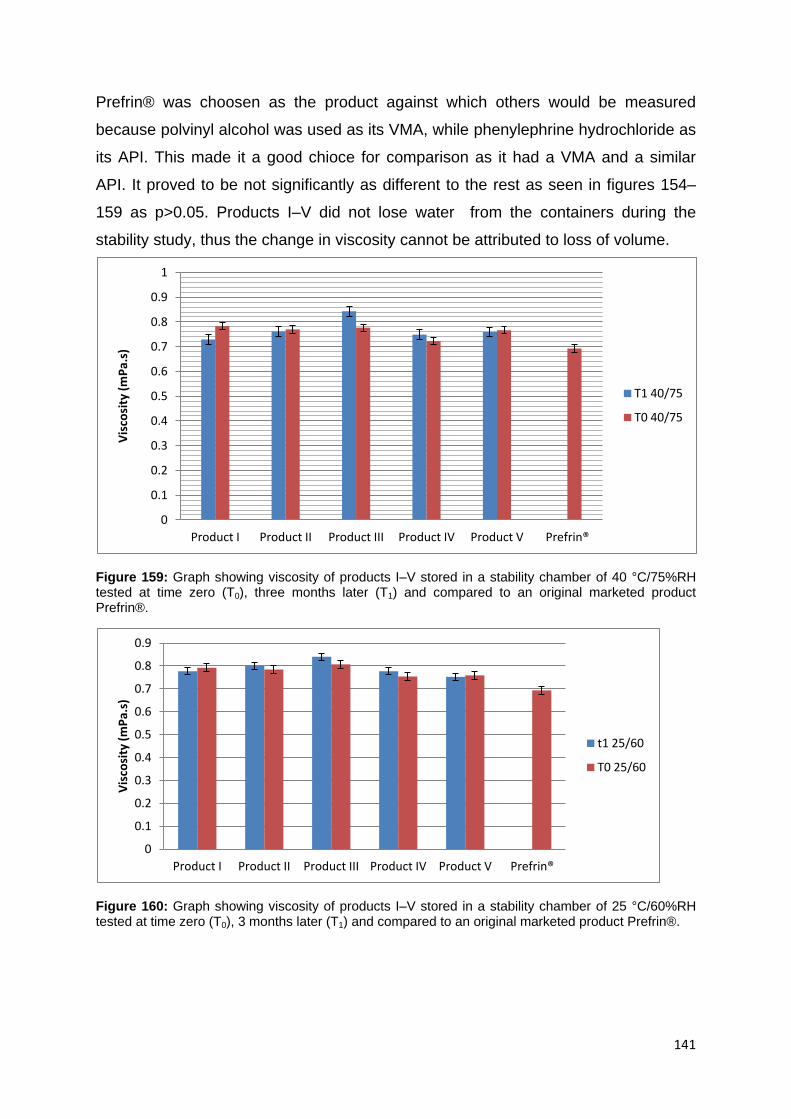
141
Prefrin® was choosen as the product against which others would be measured
because polvinyl alcohol was used as its VMA, while phenylephrine hydrochloride as
its API. This made it a good chioce for comparison as it had a VMA and a similar
API. It proved to be not significantly as different to the rest as seen in figures 154–
159 as p>0.05. Products I–V did not lose water from the containers during the
stability study, thus the change in viscosity cannot be attributed to loss of volume.
Figure 159: Graph showing viscosity of products I–V stored in a stability chamber of 40 °C/75%RH tested at time zero (T0), three months later (T1) and compared to an original marketed product Prefrin®.
Figure 160: Graph showing viscosity of products I–V stored in a stability chamber of 25 °C/60%RH tested at time zero (T0), 3 months later (T1) and compared to an original marketed product Prefrin®.
0
0.1
0.2
0.3
0.4
0.5
0.6
0.7
0.8
0.9
1
Product I Product II Product III Product IV Product V Prefrin®
Vis
cosi
ty (
mP
a.s)
T1 40/75
T0 40/75
0
0.1
0.2
0.3
0.4
0.5
0.6
0.7
0.8
0.9
Product I Product II Product III Product IV Product V Prefrin®
Vis
cosi
ty (
mP
a.s)
t1 25/60
T0 25/60
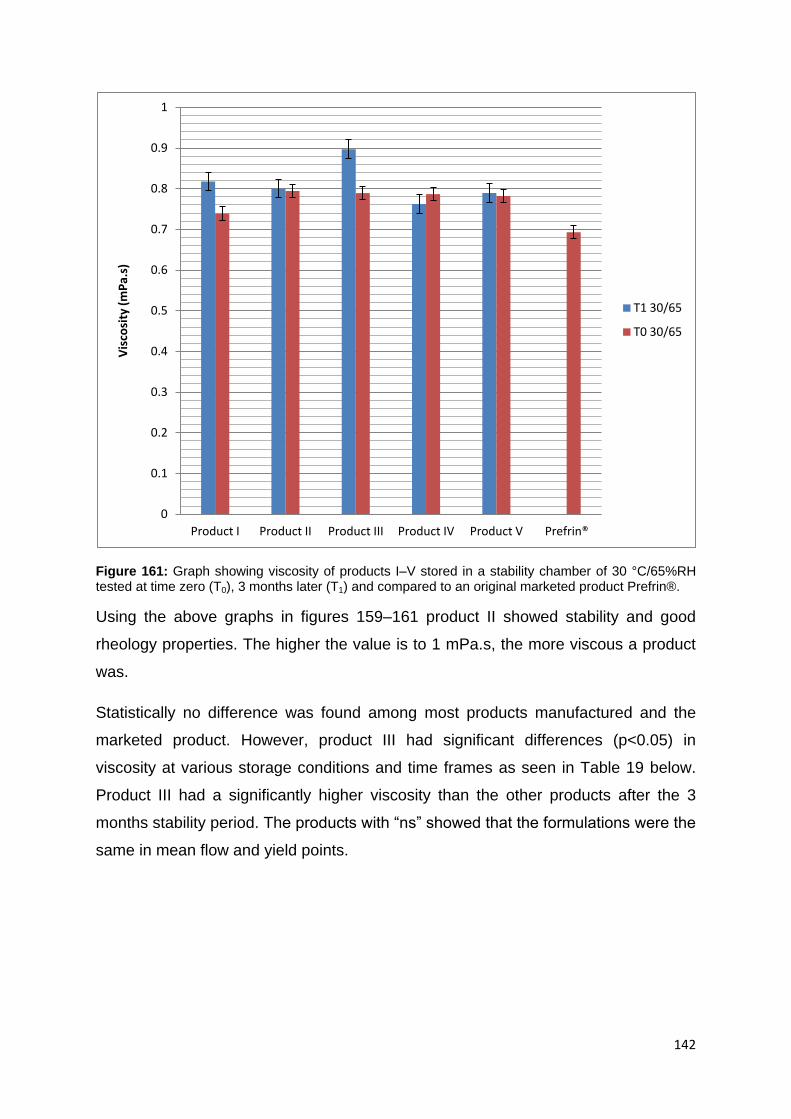
142
Figure 161: Graph showing viscosity of products I–V stored in a stability chamber of 30 °C/65%RH tested at time zero (T0), 3 months later (T1) and compared to an original marketed product Prefrin®.
Using the above graphs in figures 159–161 product II showed stability and good
rheology properties. The higher the value is to 1 mPa.s, the more viscous a product
was.
Statistically no difference was found among most products manufactured and the
marketed product. However, product III had significant differences (p<0.05) in
viscosity at various storage conditions and time frames as seen in Table 19 below.
Product III had a significantly higher viscosity than the other products after the 3
months stability period. The products with “ns” showed that the formulations were the
same in mean flow and yield points.
0
0.1
0.2
0.3
0.4
0.5
0.6
0.7
0.8
0.9
1
Product I Product II Product III Product IV Product V Prefrin®
Vis
cosi
ty (
mP
a.s)
T1 30/65
T0 30/65

143
Table 19: Results of one-way ANOVA analysis for viscosity of products I–V stored at 25 °C/60%RH, 30 °C/65%RH and 40 °C/75%RH for 3 months. The values shown indicate differences in p-values and significance in differences of mean was defined as p < 0.05.
mPa.s
PI 25/60
PII 25/60
PIII 25/60
PIV 25/60
PV 25/60
PI 30/65
PII 30/65
PIII 30/65
PIV 30/65
V 30/65
I 40/75
II 40/75
III 40/75
IV 40/75
V 40/75
Prefrin
®
PI 25/60
ns ns ns ns ns ns ns ns ns ns ns ns ns ns ns
PII 25/60
ns ns ns ns ns ns ns ns ns ns ns ns ns ns ns
PIII 25/60
ns ns ns ns ns ns ns ns ns ns ns ns ns ns **
PIV 25/60
ns ns ns ns ns ns ns ns ns ns ns ns ns ns ns
PV 25/60
ns ns ns ns ns ns ns ns ns ns ns ns ns ns ns
PI 30/65
ns ns ns ns ns ns ns ns ns ns ns ns ns ns ns
PII 30/65
ns ns ns ns ns ns ns ns ns ns ns ns ns ns ns
PIII 30/65
ns ns ns ns ** ns ns * ns *** * ns ** * ****
PIV 30/65
ns ns ns ns ns ns ns ns ns ns ns ns ns ns ns
PV 30/65
ns ns ns ns ns ns ns ns ns ns ns ns ns ns ns
PI 40/75
ns ns ns ns ns ns ns ns ns ns ns ns ns ns ns
PII 40/75
ns ns ns ns ns ns ns ns ns ns ns ns ns ns ns
PIII 40/75
ns ns ns ns ns ns ns ns ns ns ns ns ns ns **
PIV 40/75
ns ns ns ns ns ns ns ns ns ns ns ns ns ns ns
PV 40/75
ns ns ns ns ns ns ns ns ns ns ns ns ns ns ns
Prefrin
®
ns ns ns ns ns ns ns ns ns ns ns ns ns ns ns
ns - Not Significant, *= p < 0.05, ** = p < 0.01, ***=p < 0.001, **** = p < 0.0001
144
4.5 Effectiveness of the ophthalmic solution preservatives
Ophthalmic drops are sterile formulations which are usually packed in multi-dose
containers. Microbial contamination from multiple uses may lead to product
degradation or result in ocular infection (Sutton et al., 2002). Protection of these
multiple dose products against microbial contamination is usually achieved by
addition of a suitable preservative system. The antimicrobial effectiveness test is
designed to provide a laboratory test that gauges the level of antimicrobial activity by
a pharmaceutical product and to evaluate how well a product withstands microbial
contamination while being used (Nostro et al., 2004 and Sutton et al., 2002).
The antimicrobial preservative efficacy of the eye-drops challenged with E. coli, S.
aureus, P. aeruginosa, and C. albicans showed varied results as seen in Table 20
below. The control eye-drop formulation failed in its preservative efficacy as it lacked
any form of preservative. After six hours all formulations containing preservatives
showed reduction in the initial microbial count. Four of the eye-drops eradicated the
inoculated microorganisms by more than 3 logs in 24 hours, except product IV,
which remained as log 2.
The number of P. aeruginosa, C. albicans, E. coli and S. aureus in product IV
decreased gradually while the remaining products decreased by over two to three
logs. This means that the EDTA, boric acid, sodium metabisulfite and sodium citrate
dihydrate acted synergistically to prevent increase in microbial count of other
products. For the stated excipients, EDTA had antioxidant and antimicrobial
properties; boric acid had antiseptic properties while sodium metabisulfite and
sodium citrate had small preservative powers. Products III and V, which contained
methylparaben and propylparaben showed the most decrease in microbial load.
After 14 days, all the eye-drops had varied log reduction against all the challenging
organisms which were all within acceptable limits. In all cases the number of fungi
after 7, 14 and 28 days were acceptable as they were reduced by 3 and 4 logs which
surpassed the requisite of fungi count.

145
Table 20: Antimicrobial preservative efficacy of the eye-drop products I–V challenged with E. coli, S.aureus, P. aeruginosa, C.albicans. Microorganism Eye-drop Sampling time/Log reduction
E. coli ATCC 38218
0 hour
6 hours 24 hours
7 days 14 days 28 days
Product I 2.9 x 10
6 3 2 - - NR
Product II 2.7 x 10
6
3 3 - - NR
Product III 2.7 x 10
6
4 1 - - NR
Product IV 2.9 x 10
6
2 2 - - NR
Product V 2.9 x 10
6
4 2 - - NR
S.aureus ATCC 43300
Product I 1.1 x 10
6 3 2 - - NR
Product II 1.1 x 10
6
3 3 - - NR
Product III 2.1 x 10
6
3 2 - - NR
Product IV 2.0 x 10
6
2 2 - - NR
Product V 1.1 x 10
6
4 2 - - NR
P. aeruginosa ATCC 27853
Product I 3.8 x 10
6 3 2 - - NR
Product II 3.8 x 10
6
3 3 - - NR
Product III 3.5 x 10
6
4 1 - - NR
Product IV 3.5 x 10
6
2 2 - - NR
Product V 3.5 x 10
6
4 2 - - NR
C. albicans ATCC 66027
Product I 2.1 x 10
6 - - 3 2 NI
Product II 2.0 x 10
6
- - 3 - NI
Product III 2.0 x 10
6
- - 4 2 NI
Product IV 2.1 x 10
6
- - 3 2 NI
Product V 2.0 x 10
6
- - 4 - NI
NR – no recovery of microbial load, NI – no increase of fungi growth.
Eye drops are classified under category 1 in the USP (2007). The criteria for
category one under the USP (2007) goes as thus, “bacteria, not less than 1.0 log
reduction from the initial calculated count at seven days, not less than 3.0 log

146
reduction from the initial count at 14 days, and no increase from 14 days’ count at 28
days”. The fungus that was specified showed no increase from initial calculated
count at 7, 14 and 28 days. No increase was defined as not more than 0.5 log10 unit
higher than the previous value measured. The requirements for antimicrobial
effectiveness of all the products were met.

147
5. CONCLUSION AND RECOMMENDATIONS
The HPLC method used in the present study permitted rapid and precise
determination of phenylephrine hydrochloride and complied with the requirements for
specificity, linearity, accuracy, precision and range. The method was accepted as
valid, and was therefore deemed suitable for quantitative assay of phenylephrine
hydrochloride in the finished products during initial formulation analysis and for the
ensuing stability studies.
Active-excipient compatibility studies were carried out in order to determine which
excipients would have a potential for reacting unfavourably with phenylephrine
hydrochloride. From the above results, HPLC showed it could be used as a method
of analysis for active-excipient mixtures of phenylephrine hydrochloride products.
Excipients analyzed in the active-excipient compatibility study, demonstrated
compatibility with phenylephrine hydrochloride as no interfering peaks or co-eluting
peaks were found. If such occurred it would be regarded as an impurity to the API. A
1:1 ratio of active-excipient mixture was used; while, in the actual formulation, the
ratio of excipients to phenylephrine hydrochloride was small, minimizing the potential
for interaction. The chromatograms showed no interference from impurities or
degradation of product. The results showed compatibility between phenylephrine
hydrochloride and its excipients.
The products were analyzed in order to determine which formulations produced a
physically and chemically stable product after stability testing. The API remaining
after the three storage conditions differed among the products I–V; product II and IV
stayed within accepted concentrations of greater than 90% among the three different
storage conditions, however, product II was the only one that showed no statistical
difference during storage. The remaining products failed to achieve the same
concentrations. Product III and V fared better in the 25 °C/60%RH but the
concentrations were still below the accepted range. The better stability could be due
to the fact that products II and IV had excipients with antioxidant and buffering
properties, sodium metabisulfite and sodium citrate dihydrate for product II, EDTA
and boric acid for product IV. Product II was stable and within potency range in all

148
storage condition whereas product IV was stable and potent in two storage
conditions namely 25 °C/60%RH and 30 °C/65%RH. The remaining Products (I, III,
V) failed to retain their potency at most storage conditions.
Colour and pH changes were observed mostly with no loss or increase of solution.
Observations with regard to no loss of solution meant that the container was suitable
for the formulations and it was impervious to moisture. Further observations were
that products III and V showed degradation of phenylephrine hydrochloride. This was
clearly depicted as phenylephrine hydrochloride within the product formulation of III
and V was brown or reddish in colour. This meant the phenylephrine hydrochloride
had oxidized fully over the period of three months in which the products were
stressed in variable storage conditions. It shows that phenylephrine hydrochloride
formulations which are in solutions require antioxidants or protective agents and
buffering agents to reduce its quick breakdown, product II and IV had both.
The pH of the products varied from 3.5 to 8, all within the stable range of
phenylephrine hydrochloride. From the assay results of HPLC, phenylephrine
hydrochloride loses its potency when reacted with hydrogen peroxide and sodium
hydroxide. As the pH of the products increases there is a decrease in the
concentration of phenylephrine hydrochloride. Product II an IV stayed within the pH
of 3 meaning acidity kept PE from degrading. Any future research could focus on
optimizing buffers and chemicals that protect phenylephrine from degrading.
Rheological tests conducted displayed notable findings especially with glycerol
included in product III. Prefrin® (polyvinyl alcohol) was used as standard to which the
products were compared. In all, three viscosity-modifying agents were used for
products I–V and they were HPMC, SCMC and glycerol. Figures 154–158 indicate
that Prefrin® did not display superior viscosity when compared to products I–V.
Glycerol increased in its viscosity over time, the reason is still unknown as it is said
to be a stable excipient. A study should be conducted on the glycerol containing
product to determine why there is an increase in viscosity over time. Viscosity
modifying agents, HPMC and SCMC are similar in function but physicochemically
dissimilar (Kibbe, 2006). The viscosity of SCMC loses 25% of its original strength
when autoclaved while HPMC only gets denatured at extremely high temperatures
149
(Parsons, 2006). Generally, increased temperature (autoclaving and storage
conditions) decreases the viscosity of the stated three viscosity modifying agents,
the important function needed is the ability to return back to their original state. With
this being noted, product IV recovered its viscosity during rheological tests of time
zero and three months later while product II also recovered but not completely.
Product I failed to recover at the storage condition 40 °C/75%RH. This could mean
that SCMC and HPMC could have lost some of their viscosity due to cellulose gum
depolymerization. This in turn adds to the reason why it in many cases needs
additives and preservatives. Another fact that was observed from literature written by
Junyan and colleagues (2009) was that EDTA protects cellulose from loss of
viscosity; this could have enabled SCMC and HPMC in achieving their return to initial
viscosity. Product II, III and IV showed best performances with regard to their flow.
According to the results obtained, product II and IV were favourable. Any future
research could focus on optimizing favourable viscosity-modifying range for
hydroxylpropyl methylcellulose and carboxy methylcellulose sodium. The optimal
value for phenylephrine hydrochloride protectors such as sodium citrate dihydrate,
EDTA, sodium metabisulfite, boric acid should be studied.
Another aspect from the objectives was to find whether the products were provided
with preservatives which were effective to inhibit microbial growth. The result showed
a positive answer. All products reduced the microbial load that they were inoculated
with. Also they passed the compendia requisite for category 1 products (eye drops).
Product I, II, III and V were successful in fulfilling the compendial requirement of
preservative efficacy.
Overall, product II was selected as the best among the five products. It would be
beneficial to approach its development on a more intensive and rigorous scale as to
determine if it would be passed as a generic product for the market at large.
Some limitations of the study were due to reduced sample size. It could have been
increased to ensure a representative distribution in differences and possibly
similarities among products. An increase in formulations samples could lead to

150
increased chances of a more favourable and stable solution. This allows for wider
research to find the best fit ingredients to be mixed together to provide the desired
solution. Reliable reports on phenylephrine hydrochloride in solutions would enhance
quicker decisions in stabilization, as those available are patented and require
substantial amount of money to acquire and use. Extra methods could have been
applied in testing the available samples. An example is the full factorial experimental
design, this design makes it possible to examine all possible combinations of
ingredient variant are served with equal probability.

151
REFERENCES
Abdel-Magid, A. F. Caron, S. 2006. Fundamentals of early clinical drug development:
from synthesis design to formulation. Illustrated. West Sussex: John Wiley and Sons,
pp 284–287.
Agarwal, S. Agarwal, A. Apple, S. 2002. Textbook of ophthalmology, Volume 2. New
Delhi. Jaypee brothers Publishers, pp 710–730.
Ahmed, I. S. Amin, A. S. 2007. Spectrophotometric microdetermination of
phenylephrine hydrochloride in pure and in pharmaceutical formulations using
haemotoxylin. Journal of Molecular Liquids, vol. 130, Issues 1–3, pp 84–87.
Akiba, J. Ueno, N. Chakrabarti, B. 1993. Age-related changes in the molecular
properties of vitreous collagen. Current Eye Research, vol. 12, No. 10, pp 951–954.
Alani, D. S. 1978. The ophthalmic rod-description of a disposable ophthalmic drug
delivery device. Acta Pharmaceutical Suecica, vol. 15, pp 237–241.
Ali, Y. Lehmussaari, K. 2006. Industrial perspective in ocular drug delivery.
Advanced Drug Delivery Reviews, vol. 58, pp 1258–1268.
Ali, Y. Ahmed, I. Patton, T. F. 2009. Recent advances in ocular delivery. Advanced
Drug Delivery Reviews, vol. 59, pp 215–222.
Al-Shaalan, N. H. 2010. Determination of phenylephrine hydrochloride and
chlorpheniramine maleate in binary mixture using chemometric-assisted
spectrophotometric and high-performance liquid chromatographic-uv methods.
Journal of Saudi Chemical Society, vol. 14, Issue 1, pp 15–21.
Amidon, G. E. 2006. ‘Sodium Citrate Dihydrate’, in A. H. Kibbe (ed), Handbook of
Pharmaceutical Excipients, 5th Edition, Pharmaceutical Press, Chicago, pp 482–484.

152
Amin, A. Chauhan, S. Dare, M. Bansal, K. A. 2010. Degradation of parabens by
pseudomonas beteli and burkholderia latens. European Journal of Pharmaceutics
and Biopharmaceutics, vol. 75, Issue 2, pp 206–212.
Ansel, H. C. Popovich, N. Allen, G. 2011. Pharmaceutical dosage forms and drug
delivery systems. 5th Edition. Philadelphia: Lea & Febiger, pp 347–349.
Araujo, J. Vega, E. Lopes, C. Egea, M. A. Garcia, M. L. 2009. Effect of polymer
viscosity on physicochemical properties and ocular tolerance of fb-loaded plga
nanospheres. Colloids and Surfaces B: Biointerfaces, vol: 72, pp 48–56.
Armbruster, D. A. Pry, T. 2008. Limit of blank, limit of detection and limit of
quantitation. Clinical Biochemical Review, vol. 29, Issue 1, pp 49–52.
Aschenbrenner, D. S. Venable, S. J. 2008. Drug Therapy in Nursing. 3rd Edition.
Maryland; Lippincott Williams and Wilkins. pp 164–165.
Aulton, M. 2002. ‘Pharmaceutical preformulation: the physicochemical properties of
drug substances’, in M. E. Aulton (ed), Pharmaceutics – The Science of Dosage
Form Design, 2nd Edition, Churchill Livingstone, Edinburgh, pp 15–32.
Bacon, A. S. Ahluwalia, P. Irani, A. M. Schwartz, L. B. Holgate, S. T. Church, M. K.
2000. Tear and conjunctival changes during the allergen – induced early - and late –
phase responses. Journal of Allergy and Clinical Immunology, vol. 106, Issue 5, pp
948 – 954.
Barlett, J. D. Jaanus S. D. 2008. Clinical ocular pharmacology. 5th edition. Churchill
Livingstone: Elsevier Health Sciences. pp 1–50.
Bastos, C. A. de Oliveira, M. A. L. 2009. Quatitative determination of acetaminophen,
phenylephrine and carbinoxamine in tablets by high-performance liquid
chromatography. Quimica Nova, vol. 32, pp 18–27.

153
Baudouin, C. Labbe, A. Liang, H. Pauly, A. 2010. Preservatives in eye drops: the
good, the bad and the ugly. Progress in retinal and eye research, vol.29, pp 312-334.
Berdy, G. J. Berdy, S. S. 2009. Ocular allergic disorders: disease entities and
differential diagnoses. Current Allergy and Asthma Reports, vol. 9, Issue 4, pp 297–
303.
Beyene, N. W. Van Staden J. F. 2004. Sequential injection spectrophotometric
determination of phenylephrine hydrochloride in pharmaceutical preparations.
Talanta, vol. 63, no. 3, pp 599–604.
Bielory, L. 2000. Allergic and immunologic disorders of the eye Part II: ocular allergy.
Journal of Allergy and Clinical Immunology, vol. 106, Issue 6, pp 1019–1032.
Bielory, L. 2006. Allergic diseases of the eye. Medical Clinics of North America, vol.
90, Issue 1, pp 129–148.
Bielory, L. 2008. Ocular allergy overview. Immunology and Allergy Clinics of North
America, vol. 28, Issue 1, pp 1–23.
Bielory, B. P. Perez, V. L. Bielory, L. 2010. Treatment of seasonal allergic
conjunctivitis with ophthalmic corticosteroids: in search of the perfect ocular
corticosteroids in the treatment of allergic conjunctivitis. Current Opinion in Allergy
and Clinical Immunology, vol. 10, Issue 5, pp 469–477.
Bilkhu, P. S. Wolffsohn, J. S. Naroo, S. A. 2011. A review of non-pharmacological
and pharmacological management of seasonal and perennial allergic conjunctivitis.
Contact Lens and Anterior Eye, vol. 35, Issue 1, pp 9–16.
Bonini, S. T. Bonini, S. E. Berruto, A. Tomassini, M. Carlesimo, S. Bucci, M. G. 1989.
Conjunctival provocation test as a model for the study of allergy and inflammation in
humans. International Archives of Allergy and Applied Immunology, vol.88, pp 144.

154
Brechu, W. F. Maren, T. H. 1993. pH and drug ionization affects ocular pressure
lowering of topical carbonic anhydrase inhibitors. Investigative Ophthalmology Visual
Science, vol. 34, pp 2581–2587.
B.P. (2011). British pharmacopoeia, London, The Stationery Office, pp 1155–1255.
Brooks, G. F. Carroll, K. C. Butel, J. S. Morse, S. A. 2007. Jawetz, Melnick, &
Adelberg’s Medical Microbiology: A Lange Medical Book. University of Michigan.
McGraw-Hill Medical. pp 168–198.
Buckley, R. J. 1998. Allergic eye disease - a clinical challenge. Clinical and
Experimental Allergy, vol. 28, Issue 6, pp 39–43.
Bush, R. K. 2008. Indoor allergens, environmental avoidance and allergic respiratory
disease. Allergy and Asthma Proceedings, vol. 29, Issue 6 pp 575–579.
Cecil, T. Sheinin, E. 2005. ‘Impurity Evaluations’, in S. Ahuja and M. W. Dong (ed),
Handbook of Phamaceutical Analysis by Hplc, 1st edition, Elsevier Academic Press,
Oxford, pp 359–377.
Chang, S. Dhien, D. Bundgaard, H. Lee, V.1988. Relative effectiveness of prodrug
and viscous solution approaches in maximizing the ratio of ocular to systemic
absorption of topically applied timolol. Experimental Eye Research, vol. 46 pp 59–69.
Chien, D. S. Schoenwald, R. D. 1985. Fluorometric determination of phenylephrine
hydrochloride by liquid chromatography in human plasma. Journal of Pharmaceutical
Sciences, vol. 74, Issue 5, pp 562–564.
Chien, D. S. Homsy, J. J. Gluchoeski, C. Tang-Liu, D. D. 1990. Corneal and
conjuctival/sclera penetration of p-aminoclonidine, agn 190342 and clonidine in
rabbit eyes. Current Eye Research, vol. 9, Issue 11, pp 1051–1059.

155
Chien, D. S. Schoenwald, R. D. 1990. Ocular pharmokinetics and
pharmacodynamics of phenylephrine and phenylephrine oxazolidine in rabbit eyes.
Pharmacological Research, vol. 7, no. 5, pp 476–483.
Chigbu, D. I. 2009. The management of allergic eye disease in primary care.
Contact Lens and Anterior Eye, vol. 32, Issue 6, pp 260–272.
Chiou, G. Shen, Z. Zheng, Y. Chen, Y 1991. Systemic delivery of polypeptides drugs
through ocular route. Annual Review of Pharmacology and Toxicology, vol. 31, pp
457–467.
Choi, S. H. Bielory, L. 2008. Late – phase reaction in ocular allergy. Current Opinion
in Allergy and Clinical Immunology, vol. 8, Issue 5, pp 438–444.
Clas, S. D Dalton, C. R. Hancock, B. C. 1999. Differential scanning calorimetry:
applications in drug development. Pharmaceutical Science & Technology Today.
Issue 2, pp 311–320.
Cohen, A. J. Mercandetti, M. Brazzo, B. G. 2006. The Lacrimal System: Diagnosis,
Management, and Surgery. Springer, New York, pp 3–19.
Conroy, C. W. Maren, T. H. 1995. Effect of ph on the ocular distribution of a topical
carbonic anhydrase inhibitor. Experimental Eye Research, vol. 61, no. 2, pp 213–
222.
Cox, L. 2007. Allergic conjunctivitis. Allergy and Clinical Immunology International –
Journal of the World Allergy Organisation, vol. 19, pp 4–8.
Curtin, J. Cormican, M. 2003. Measuring antimicrobial activity against biofilm
bacteria. Reviews in Environmental Science and Biotechnology, vol. 2, no. 2-4, pp
285–291.
156
Das Gupta, V. Parasrampuria, J. 1987. Quantitation of phenylephrine hydrochloride
in pharmaceutical dosage forms. Drug Development and Industrial Pharmacy, vol.
13, Issue 3, pp 473–486.
Del Amo, E. M. Urtti, A. 2008. Current and future ophthalmic drug delivery systems:
a shift to the posterior segment. Drug Discovery Today, vol. 13, no.4, pp 135–143.
Di Colo, G. Zambito, Y. Zaino, C. SansÒ. 2009. Selected polysaccharides at
comparison for their mucoadhesivesness and effect on precorneal residence of
different drugs in the rabbit model. Drug Development and Industrial Pharmacy, vol.
35, pp 941–949.
Dipiro, J. T. Talbert, R. L. Yee, G. C. Matzke, G. R. Wells, B. G. Michael Posey, L.
2002. Pharmacotherapy: A Pathophysiological Approach. New York; McGraw-Hill.
pp 435–451.
Dolan, J. W. 2003. ‘Why Do Peaks Tail?’, LCGC North America, vol. 21, no. 7, pp.
612-616.
Donnelly, Nurse’s Handbook of Combination Drugs. 2009. Donnelly, P. 2nd Edition.
Miami; 775–776.
Douša, M. Gibala, P. Havliček, J. Plaček, L. Tkadlecová, M. Břicháč, J. 2011. Drug-
excipient compatibility testing—identification and characterization of degradation
products of phenylephrine in several pharmaceutical formulations against the
common cold. Journal of Pharmaceutical and Biomedical Analysis, vol. 55, pp 949–
956.
Dudinski, O. Finnin, B. Reed. B. 1983. Acceptability of thickened eye drops to human
subjects. Current Therapeutic Research, vol.33, pp 322–338.
Durrani, A. M. Jamshaid, M. Kellaway, I. W. 1996. A novel ocular delivery system for
phenylephrine hydrochloride. Archives of Pharmacology Research, vol. 19, pp 386–
389.

157
Eggleston, P. A. Wood, R. A. 1992. Management of allergies to animals. Asthma
Proceedings, vol. 13, Issue 6, pp 289–292.
Fassihi, R. A, 2001, ‘Preservation and Microbiogical Attributes of Non Sterile
Pharmaceutical Products,’ in Seymour Stanton Block (ed.). Disinfection, sterilization
and Preservation, 5th Edition. Lippincott Williams & Wilkins, Philadephia, pp 1263–
1280.
Felt, O. Baeyens, V. Zignani, M. Buri, P. Gurny, R. 1999. Mucosal drug delivery-
ocular-encyclopedia of controlled drug delivery. University of Geneva, Geneva,
Switerzerland, vol. 2, pp 605–622.
Flach, A. J. 2002. Topical nonsteroidal antiinflamatory drug in ophthalmology.
International Ophthalmology Clinics, vol. 42, Issue 1, pp 1–11.
Flancbaum, L. Dick, M. Dasta, J. Sinha, R. Choban, P. 1997. A dose – response
study of phenylephrine in critically ill, septic surgical patients. European Journal of
Clinical Pharmacology, vol. 51, pp 461–465.
Florence, A. T. Attwood, D. 2006. Physicochemical Principles of Pharmacy. 4th
Edition. London: Pharmaceutical Press. pp 340–405, 366–374.
Friedlaender, M. 2001. Overview of ocular allergy treatment. Current Allergy and
Asthma Reports, vol. 1, Issue 4, pp 375–379.
Friedrich, S. W. Cheng, Y. –L. Saville, B. A. 1993. Theoretical corneal permeation
model for ionisable drugs. Journal of Ocular Pharmacology, vol. 9, pp 229–249.
Furrer, P. Mayer, J. M. Gurny, R. 2002. Ocular tolerance of preservatives and
alternatives. European Journal of Pharmaceutics and Biopharmaceutics, vol. 53, pp
263–280.

158
Gad, S. 2008. Pharmaceutical manufacturing handbook: production and processes.
Volume 5 of pharmaceutical development series, volume 1 of pharmaceutical
manufacturing handbook. Illustrated. New York: John Wiley & Sons, pp 726–747.
Gaynes, B. I. Fiscella, R. G. 1996. Biotransformation in Review: Applications in
Ocular Disease and Drug Design. Journal of Ocular Pharmacology and
Therapeutics, vol. 12, pp 527–539.
Geroski, D. H. Edelhauser, H. F. 2000. Drug delivery for psoterior segment eye
disease. Investigative Ophthalmology & Visual Science, vol. 41, no. 5, pp 961–964.
Ghosh, TK. Jasti, BR. 2005. Theory and practice of contemporary pharmaceutics.
Florida, CRC Press, pp 481–494.
Giaconi, J. A. Law, S. K. Caprioli, J. 2009. Pearls of glaucoma management.
London. Springer, pp 197–200.
Giahi, M. Mirzaei, M. Lahijani Veghar, G. 2009. Potentiometric PVC membrane
sensor for the determination of phenylephrine hydrochloride in some pharmaceutical
products. Journal of the Iranian Chemical Society. Vol. 7, Issue 2, pp 333–338.
Giron, D. 1998. Contribution of thermal methods and related techniques to the
rational development of pharmaceuticals—Part 2. Pharmaceutical Science &
Technology Today .Issue 1, pp 262–268.
Goicoechea, H. C. Olivieri, A. C. 2001. Sustained prediction ability of net analyte
preprocessing methods using reduced calibration sets. theoretical and experimental
study involving the spectrophotometric analysis of multicomponent mixtures. Analyst,
vol. 126, Issue 7, pp 1105–1112.
Gopferich, D. 1997. Mechanisms of Polymer Degradation and Elimination. In: Domb,
A. J. Kost, J. Wiseman, D. M., editors. Handbook of Biodegradable Polymers.
Amsterdam: Harwood Academic; pp 457–471.

159
Gould, G. W. 2004, ‘Sterilization’, in A. D. Russell, W. B. Hugo, A. P. Fraise, G. A. J.
Ayliffe, P. A. Lambert, J. –Y. Maillard (ed.). Russell, Hugo and Ayliffe’s Principles
and Practice of Disinfection, Preservation and Sterilization, 4th Edition, Wiley-
Blackwell, Oxford, pp 361–383.
Gotzche, P. C. Johansen, H. K. 2008. House dust mite control measures for asthma:
systemic review. Allergy, vol. 63, Issue 6, pp 646–659.
Greaves, J. L. Wilson, C. G. Birmingham, A. T. Richardson, M. C. Bentley, P. H.
1992. Scintigraphic studies on the corneal residence of a new ophthalmic delivery
system (nods): rate of clearance of a soluble marker in relation to duration of
pharmacological action of pilocarpine. British Journal of Clinical Pharmacology, vol
33, pp 603–609.
Green, J. M. 1996. A practical guide to analytical method development, Analytical
Chemistry News & Features, May, pp. 305–309.
Grosvenor, T. 2007. Primary care optometry. 5th edition. Elsevier Health Sciences,
New York, pp 137–182.
Gurjar, M. K. Krishna, L. M. Sarma, B. V. N. Chorghade, M. S. 1998. A practical
synthesis of (R)-(-)-phenylephrine hydrochloride. Organic Process Research and
Development, vol. 2, Issue 6, pp 422–424.
Hanlon, G. 2002, ‘Pharmaceutical preformulation: the physicochemical properties of
drug substances’, in M. E. Aulton (ed.). Pharmaceutics-The Science of Dosage Form
Design, 2nd Edition, Churchill Livingstone, Edinburgh, pp 599–622.
Hanyu, H. Hirao, K. Shimizu, S. Kanetaka, H. Sakurai, H. Iwamoto, T. 2007.
Phenylephrine and pilocarpine eye drop test for dementia with Lewy bodies and
Alzheimer’s disease. Neuroscience Letters, vol. 414, Issue 2, pp 174–177.
Harley, J. P. Prescott, L. M. 1998. Microbiolgy. 4th Edition, McGraw Hill College
Division, pp 199-235.

160
Harwood, R. J. 2006. ‘Hypromellose’, in A. H. Kibbe (ed), Handbook of
Pharmaceutical Excipients, 5th Edition, Pharmaceutical Press, Chicago, pp 252–349.
Hecht, G. 2000. ‘Ophthalmic preparations’, in A. R. Gennaro (ed), Remington: The
Science and Practice of Pharmacy, 20th Edition, Lippincott Williams & Wilkins,
Baltimore, pp 850–858.
Heydari, R. 2008. A new hplc method for the simultaneous determination of
acetaminophen, phenylephrine, dextromethorphan and chlorpheniramine in
pharmaceutical. Analytical Letters, pp 1–10.
Hingorani, M. Lightman, S. 1995. Therapeutic options in ocular allergic disease.
Drugs, vol. 50, Issue 2, pp 208–221.
Hochman, J. Artursson, P. 1994. Mechanisms of absorption enhancement and tight
junction regulation. Journal of Controlled Release, vol. 29, pp 253–267.
Hodges, N. 2002, ‘Pharmaceutical preformulation: the physicochemical properties of
drug substances’, in M. E. Aulton (ed.). Pharmaceutics-The Science of Dosage Form
Design, 2nd Edition, Churchill Livingstone, Edinburgh, pp 623–642.
Hodges, M. G. Kean – Myers, A. M. 2007. Classification of ocular allergy. Current
Opinion in Allergy and Clinical Immunology, vol. 7, Issue 5, pp 424–428.
Holladay, J. T. 2006. Quality of vision: essential optics for the cataract and refractive
surgeon. Thorofare, Slack Incorporated, pp 6–14.
Huang, A. J. W. Tseng, S. C. G. Kenyon, K. R. 1989. Paracellular Permeability of
Corneal and Conjunctival Epithelia. Investigative Ophthalmology Visual Science, vol.
30, pp 684-689.
Hughes, M. O. 2004. A pictorial anatomy of the human eye/anophhthalmic socket: a
review for ocularists. Journal of Ophthalmic Prosthetics, pp 51–63.
161
Huynh-Ba, K. 2009. ‘Stability operating practices’, in K. Huynh-Ba (ed), Handbook for
stability testing in pharmaceutical development: regulations, methodologies and best
practices, Springer, Chicago, pp 303–323.
International Conference on Harmonisation (ICH) of Technical Requirements for
Registration of Pharmaceuticals for Human Use, October, 1994, ‘Validation of
Analytical Procedures: Methodology Q2B’, ICH Harmonised Tripartite Guideline,
<http://www.ich.org>.
International Conference on Harmonisation (ICH) of Technical Requirements for
Registration of Pharmaceuticals for Human Use, October, 2005, ‘Validation of
Analytical Procedures: Methodology Q2A’, ICH Harmonised Tripartite Guideline,
<http://www.ich.org>.
International Conference on Harmonisation (ICH) of Technical Requirements for
Registration of Pharmaceuticals for Human Use, October, 1994, ‘Validation of
Analytical Procedures: Methodology Q2 (R1)’, ICH Harmonised Tripartite Guideline,
<http://www.ich.org>.
Järvinen, K. Järvinen, T. Urtti, A. 1995. Ocular absorption following topical delivery.
Advanced Drug Delivery Reviews, vol. 16, pp 3–19.
Jenkins, W. Osborn, K. 1993. Packaging drugs and pharmaceuticals. Technomic
Publishing Co, Basel.
Jeffs, 2009. ‘Foreword’, in D. J. Mazzo (ed.). International Stability Testing,
Interpharm Press, Inc. Illinois, pp xi–xviii.
Jho, C. Carreras, M. 1984. The effect of viscosity on the drop weight technique for
the measurement of dynamic surface tension. Journal of Colloid and Interface
Science, vol. 99, pp 543–548.

162
Johnson, D. Chandrasekhar, S. S. Mautone, A. J. 2008. Intranasal phenylephrine-
surfactant treatment is not beneficial in otitis media with effusion. International
Journal of Pediatric Otorhinolaryngology, vol. 72, Issue 7, pp 1085–1089.
Joss, J. Craig, T. 1998. Seasonal allergic conjunctivitis.Drugs of Today, vol. 34,
Issue 3, pp 259–265.
Junyan, A. Ji. Ingham, E. Wang, J. Y. 2009. Effect of EDTA and methionine on
preventing loss of viscosity of cellulose-based topical gel. AAPS PharmSciTech, vol.
10, No. 2, pp 678–683.
Karcher, B. D. Davies, M. L. Delaney, E. J. Venit, J. J. 2005. A 21st Century HPLC
Workflow for Process R&D. Journal of the Association for Laboratory Automation,
vol. 10, Issue 6, pp 381–393.
Kaur, I. P. Kanwar, M. 2002. Ocular preparations: the formulation approach. Drug
Development and Industrial Pharmacy, vol. 28, no. 5, pp 473–493.
Kaur, I. P. Garg, A. Singala, A. K. 2003. Vesicular systems in ocular drug delivery.
International Journal of Pharmaceutics, vol. 268, pp 1–10.
Kibbe, A. H. 2006. ‘Benzalkonium Chloride’, in A. H. Kibbe (ed), Handbook of
Pharmaceutical Excipients, 5th Edition, Pharmaceutical Press, Chicago, pp 33–35.
Krishnamoorthy, R. Mitra, A. K. 1998. Prodrugs for nasal drug delivery. Advanced
Drug Delivery Reviews, vol. 29, no. 1, pp 135–146.
Krull, I & Swartz, M 2001, ‘Determining specificity in a regulated environment’,
LCGC, vol. 19, no. 6, pp. 604–614.
Kupiec, T, Slawson, M, Pragst, F & Herzler, M 2004, ‘High performance liquid
chromatography’, in AC Moffat, MD Osselton & B Widdop (eds), Clarke’s Analysis of
Drugs and Poisons, 3rd Edition, vol. 1, The Pharmaceutical Press, London, p. 503.

163
Lang, J. C. 1995. Ocular drug delivery conventional ocular formulations. Advanced
Drug Delivery Reviews, vol. 16, no. 1, pp 39–43.
Lang, J. C. Roehrs, R. E. Jani, R. 2005. ‘Ophthalmic Preparations’, in Remingtons
(5th edition). Remington: The Science and Practice of Pharmacy, Lippincott Williams
& Wilkins, New York, pp 850–871.
Le Bourlais, C. Acar, L. Zia, H. Sado, P. A. Needham, T. Leverge, R. 1998.
Ophthalmic drug delivery system-recent advances. Progress in Retinal and Eye
Research, vol. 17, no. 1, pp 33–58.
Lee, V. H. L. Robinson, J. R. 1979. Mechanistic and quantitative evaluation of
precorneal pilocarpine disposition in albino rabbits. Journal of Pharmaceutical
Sciences, vol. 68, Issue 6, pp 673–684.
Lee, V. Robinson, J. 1986. Topical ocular drug delivery: Recent developments and
future challenges (Review). Journal of Ocular Pharmacology, vol. 2, pp 67–108.
Lee, Thomas W. Y. Robinson, J. R. 2009. Drug delivery to the posterior segment of
the eye iv: theoretical formulation of a drug delivery system for subconjunctival
injection. Journal of Ocular Pharmacology and Therapeutics, vol. 20, Issue 1, pp 29–
38.
Lee, T. Kuo, C. S. Chen, Y. H. 2006. Solubility, polymorphism, crystallinity, and
crsytal habit of acetaminophen and ibuprofen by initial solvent screening.
Pharmaceutical Technology, vol. 68, Issue 6, pp 673–684.
Leikin, B. L. Paloucek, F. P. 2007. Poisoining and Toxicology Handbook. 4th Edition.
New York; Informa Health Care. pp 543–544.
Leonardi, A. Motterle, L. Bortolotti, M. 2008. Allergy and the eye. Clinical and
Experimental Immunology, vol. 153, pp 17–21.

164
Liaw, J. Robinson, J. R. 1992. The effect of polyethylene glycol molecular weight on
corneal transport and the related influence of penetration enhancers. International
Journal of Pharmaceutical Sciences, vol. 88, pp 125–140.
Liaw, J. Rojanasakul, Y. Robinson, J. R. 1992. The effect of drug charge type and
charge density on corneal transport. International Journal of Pharmaceutical
Sciences, vol. 88, pp 111–124.
Ludwig, A. Van Ooteghem, M. 1989. The evaluation of viscous opthalmic vehicles by
slit lamp fluorophotometry in humans. International Journal of Pharmaceutics. Vol.
54, pp 95 – 102.
Maitani, Y. Nagai, T. Kollias, K. Peppas, N. A. 1997. Design of ocular/lacrimal and
nasal systems through analysis of drug administration and absorption. Journal of
Controlled Release, vol. 49, pp 185–192.
Marin, A. Espada, A. Vidal, P. Barbas, C. 2005. Major degradation product identified
in several pharmaceutical formulations against the common cold. Analytical
Chemistry, vol. 77, Issue 2, pp 471–471.
Marriott, J. F. 2006. Pharmaceutical compounding and dispensing. Illustrated.
London. Pharmaceutical Press. pp 111–124.
Martini, L. G. Embleton, J. K. Malcolmson, R. J. Wilson, C. G. 1997. The use of small
volume ocular sprays to improve the bioavailability of topically applied ophthalmic
drugs. European Journal of Pharmaceutics and Biopharmaceutics, vol. 44, Issue 2,
pp 121–126.
Mashkevich, B. O. 2007. Drug Delivery Research Advances. New York. Illustrated.
Nova Publishers. pp 1–37.
Massey, L. K. 2004. Film Properties of Plastics and Elastomers: A guide to non-
woven in packaging applications, 2nd Edition. William Andrew., New York, pp 2–10.

165
McDonnell, G. E. 2007. ‘Physical sterilization’, antisepsis, disinfection, and
sterilization: types, action, and resistance, Wiley-Blackwell, Washington D. C, pp
165–188.
McDonald, F. Parkin, J. 1995. The effect of disodium edetate and sodium chloride on
the stability of ethylmercury arising from the decompostion of thimerosal
(thiomersal). Drug Development and Industrial Pharmacy, vol. 21, pp 2403–2410.
McHugh, M. 2010. Workbook for Manual for Pharmacy Technicians. American
Soceity of Health-System Pharmacists. Bethesda, pp 1–20.
Meseguer, G. Buri, P. Plazonnet, B. Rozier, A. Gurny, R. 1996. Gamma
scintigraphic comparison of eyedrops containing pilocarpine in healthy volunteers.
Journal of Ocular Pharmacology and Therapeutics, vol. 12, pp 481–488.
Meqi, S. A. Deshpande, S. G. 2002. Ocular Drug Delivery. In Controlled and Novel
Drug Delivery, ed. N. K. Jain. CBS Publishers., New Delhi, pp 82–84.
Michael, R. Richards, E. 2009, ‘Ophthalmic Products’, in Winfield. A. J. Rees, J. A.
Smith, I (ed.). Pharmaceutical Practice, 4th edition, Churchill-Livingstone, Edinburgh,
pp 429–446.
Mido, Y. Taguchi, S. Sethi, M. S. Iqbal, S. A. 2003. Chemistry in Aqueous and Non-
Aqueous Solvents. New Delhi. Discovery publishing House. pp1–40.
Miller, J. H. McB. Ermer, J. 2005. Method Validation in Pharmaceutical Analysis (A
Guide to Best Practice),. Darmstadt:
Miller-Meeks, M. J. Farrell, T. A. Munden, P. M. Folk, J. C. Rao, C. Schoenwald, R.
D. 1991. Phenylephrine prodrug. Report of Clinical Trials. Ophthalmology, vol. 98,
no. 2, pp 222–226.
Mitra, A. K. 2009. Role of Transporters in Ocular Drug Delivery System.
Pharmaceutical Research, vol. 26, no. 5, pp 1192–1196.

166
Muhammad, N. Bodnar, J. A. 1980. Quantitative determination of guaifenesin,
phenylpropanolamine hydrochloride, sodium benzoate and codeine phosphate in
cough syrups by hplc. Journal of Liquid Chromatography, vol. 3, pp 113–122.
Muszalska, I. Zajac, M. Wròbel, G. Nogowska, M. 2000. Uv/vis spectrophotometric
methods for determination of caffeine and phenylephrine hydrochloride in complex
pharmaceutical preparations. validation of the methods. Acta Poloniae
Pharmaceutica, vol. 57, Issue 4, pp 247–252.
Nakashima, K. Kanehara, S. Kaddoumi, A. 2002. Hplc determination of
phenylpropanolamine in pharmaceutical otc preparations. Biomedical
Chromatography, vol. 16, Issue 7, pp 463–469.
Nanjawade, B. K. Manvi, F. V. Manjappa, A. S. 2007. In situ-forming Hydrogels for
Sustained Ophthalmic Drug Delivery. Journal of Controlled Release, vol. 122, pp
119–134.
Nostro, A. Cannatelli, M. A. Morelli, I. Musolino, A. D. Scuderi, F. Pizzimenti, F.
2004. Efficiency of Calamintha officinalis essential oil as a preservative in two topical
product types. Journal of Applied Microbiology, vol. 97, pp 395–401.
O’Donnell, N. P. Gillibrand, W. 1995. A comparison of the efficacy of tropicamide
applied topically using a novel ophthalmic delivery system versus a phenylephrine-
tropicamide drop preparation in insulin-independent diabetics. Eye, vol. 9, pp 811–
812.
Ono, S. J. Abelson, M. B. 2005. Allergic conjunctivitis: update on pathophysiology
and prospects for future treatment. Journal of Allergy and Clinical Immunology, vol.
115, Issue 1, pp 118–122.
Ornato, J. P. Peberdy, M. A. 2005. Cardiopulmonary Resuscitation. New York,
Humana Press, pp 305–333.
167
Palmares, J. Delgado, L. Cidade, M. Quadrado, M. J. Filipe, H. P. 2010. Allergic
conjunctivitis: a national cross – sectional study of clinical characteristics and quality
of life. European Journal of Ophthalmology, vol. 20, Issue 2, pp 257–264.
Palabiyik, I. M. Onur, F. 2007. The simultaneous determination of phenylephrine
hydrochloride, paracetamol, chlorpheniramine maleate and dextromethorphan
hydrobromide in pharmaceutical preparations. Chromatographia, vol. 66,
Supplement 1, pp 93–96.
Pandey, R. K. Upadhyay, P. K. Kumar, P. 2003. Enantioselective synthesis of (r)-
phenylephrine hydrochloride. Tetrahedron Letters, vol. 44, Issue 33, pp 6245–6246.
Pandey, R. K. Upadhyay, P. K. Kumar, P. 2006. An asymmetric dihydroxylation route
towards the synthesis of (R)-clorprenaline hydrochloride. General papers, pp 10–14.
Parker, M. 2002, ‘Microbiological contamination and preservation of pharmaceutical
products’, in ME Aulton (ed.), Pharmaceutics - The Science of Dosage Form Design,
2nd Edition, Churchill Livingstone, Edinburgh, pp. 658–667.
Parsons, D. 2006. ‘Carboxymethylcellulose Sodium’, in A. H. Kibbe (ed), Handbook
of Pharmaceutical Excipients, 5th Edition, Pharmaceutical Press, Chicago, pp 87–90.
Patel, P. B. Shastri, D. H. Shelat, P. K. Shukla, A. K. 2010. Ophthalmic drug delivery
system: challenge and approaches. Systemic Reviews in Pharmacy, vol. 1, no. 2, pp
113–120.
Pillion, E. Atchison, J. Scott, J. McCracken, D. Gargiulo, C. Meezan, E. 1994.
Efficacy of Insulin Eyedrops. Journal of Ocular Pharmacology, vol. 10, pp 461–470.
Pitt, A. D. Smith, A. D. Lindsell, L. Voon, L. W. Rose, P. W. Bron, A. J. 2004.
Economic and quality of life impact of seasonal allergic conjunctivitis in Oxfordshire.
Ophthalmic Epidemiology, vol. 11, Issue 4, pp 17–33.

168
Podder, S. Moy, K. Lee., V. 1992. Improving the safety of topically applied timolol
in the pigmented rabbit through manipulation of formulation composition.
Experimental Eye Research, vol. 54, pp 747–757.
Potdar, M. A. 2007. Pharmaceutical Quality Assurance. Pune. Pragatti Books Pvt.
Ltd. pp 1–62.
Prabhasawat, P. Chotikavanich, S. Leelaporn, A. 2005. Sterility of Non-Preservative
Eye Drops. Journal of the Medical Association of Thailand, Vol. 88, S 9, S6–S9.
Pray, W. S. 2006. Nonprescription Product Therapeutics M-Medicines Series.
Baltimore. Lippincott Williams & Williams, pp 235–264.
Price, J. C. 2006. ‘Glycerin’, in A. H. Kibbe (ed), Handbook of Pharmaceutical
Excipients, 5th Edition, Pharmaceutical Press, Chicago, pp 220-222.
Rabinow, B. E. Roseman, T. J. 2005, ‘Plastic packaging materials’, in remington: the
science and practice of pharmacy volume 1 of remington the science and practice of
pharmacy m - medicine series. 2005. 21st edition. Lippincott Williams & Wilkins, pp
1047–1057.
Ranucci, JA & Silverstein, IB 1998, ‘Polymeric Pharmaceutical Excipients’, in HA
Lieberman, MM Rieger & GS Banker (eds), Pharmaceutical Dosage Forms:
Disperse Systems, 2nd Edition, vol. 3, Marcel Dekker, Inc., New York, pp. 251, 274,
282, 285.
Rathore, K. S. Nema, R. K. 2009. An insight into ophthalmic drug delivery system.
International Journal of Pharmaceutical Sciences and Drug Research, vol. 1, no.1,
pp 1–5.
Rautio, J. Kumpulainen, H. Heimbach, T. Oliyai, R. Oh, D. Järvinen, T. Savolainen,
J. 2008. Prodrugs: Design and Clinical Applications. Nature Reviews Drug
Discovery, vol. 7, no. 3, pp 255–270.
169
Reddy, I. K. Ganesan, M. G. 1996. Ocular therapeutics and drug delivery: An
Overview. In Ocular Therapeutics and Drug Delivery: A Multi-Disciplinary Approach,
ed. I.K. Reddy. Technomic Publishing Co., Inc. Lancaster, Pennsylvania, USA, pp 3–
29.
Reynolds, M. Thakur, A. B. Serajuddin, A. T. M. Ghoshal, R. N. Fakes, M. G.
Ranadive, S. A. Morris, K. R. Varia, S. A. 2002. Selection of Solid Dosage Form
Composition Through Drug-Excipient Compatibility. Journal of Pharmaceutical
Sciences, vol. 88, no. 7, pp 3617–3631.
Rieger, M. M. 2006. ‘Methylparaben’, in A. H. Kibbe (ed), Handbook of
Pharmaceutical Excipients, 5th Edition, Pharmaceutical Press, Chicago, pp 341–344.
Rieger, M. M. 2006. ‘Propylparaben’, in A. H. Kibbe (ed), Handbook of
Pharmaceutical Excipients, 5th Edition, Pharmaceutical Press, Chicago, pp 451–453.
Rojanasakul, Y. Robinson, J. R. 1989. Transport Mechanism of the Cornea:
Characterisation of Barrier Permselectivity. International Journal of Pharmaceutics,
vol. 55, pp 237–246.
Rojanasakul, Y. Wang, L. Y. Bhat, M. Glover, D. D. Malanga, C. J. Ma, J. K. H. 1992.
The Transport Barrier of Epithelia: A Comparative Study on Membrane Permeability
and Charge Selectivity in the Rabbit. Pharmaceutical Research, vol. 9, pp 1029–
1034.
Romanelli, L. Valeri, P. Morrone, L. A. Pimpinella, G. Graziani, G. Tita, B. 1994.
Ocular Absorption and Distribution of Bendazac after Topical Administarion to
Rabbits with Different Vehicles. Life Sciences, vol. 54, no. 13, pp 877–885.
Rossiter, South African Medicines Formulary. 2010. Rossiter, D. 9th Edition. Health
and Medical Publishing Group. Cape Town.
Rowe, RC, Sheskey, PJ & Weller, PJ (eds) 2003, Handbook of Pharmaceutical
Excipients, 4th Edition, Pharmaceutical Press & American Pharmaceutical

170
Association, London, pp 89 - 92, 97- 99, 108 -110, 271-273, 343-346, 390-394, 479,
483, 508-512, 521-523, 526-528, 532- 534, 577-578, 596-598, 622-625, 691-693.
Rozet, E. Marini, R. D. Ziemons, E. Boulanger, B. Hubert, Ph. 2011. advances in
validation risk and uncertainty assessment of bioanalytical methods. Journal of
Pharmaceutical and Biological Analysis, vol. 55, Issue 4, pp 848–858.
Saettone, M. Giannacinni, B. Ravecca, S. La Marca, F. 1980. Polymer effects on
ocular bioavailability-the influence of different liquid vehicles on the mydriatic
response of tropicamide and in rabbits. International Journal of Pharmaceutics. Vol.
20, pp 185–190.
Saettone, M. Giannacinni, B. Ravecca, S. La Marca, F. Tota, G. 1984. Polymer
effects on ocular bioavailability-the influence of different liquid vehicles on the
mydriatic response of tropicamide in human and in rabbits. International Journal of
Pharmaceutics, vol. 20, pp 187–202.
Saettone, F. Chetoni, P. Cerbai, R. Mazzanti, G. Baghiroli, L. 1996. Evaluation of
ocular permeation enhancers: in vitro effects on corneal transport of four beta-
blockers, and in vitro/in vivo toxic activity. Inetrnational Journal of Pharmaceutics,
vol. 142, pp 103–113.
Salminen, L. 1990. Review: Systemic absorption of topically applied ocular drugs in
humans. Journal of Ocular Pharmacology, vol. 6, pp 243–249.
Samadi-Maybodi, A. Nejad-Darzi, S. K. H. 2009. Simultaneous determination of
paracetamol, phenylephrine hydrochloride and chlorpheniramine maleate in
pharmaceutical preaprations using multivariate calibration 1. Spectrochimica Acta
Part A: Molecular and Biomedical Spectroscopy, vol. 75, Issue 4, pp 1270–1274.
Savic, I. Nikolic, G. Bankovic, V. 2008. Development and validation of
spectrophotometric method for phenylephrine hydrochloride estimation in nasal
drops formulations. Macedonian Journal of Chemistry and Chemical Engineering,
vol. 27, no. 2, pp 149–156.
171
Scheikh, A. Hurwitz, B. Nurmatov, U. Van Schayck, C. P. 2010. House dust mite
avoidance measures for perennial allergic rhinitis. Cochrane Database of Systamatic
Reviews, vol. 7, pp CD001563.
Schultz, B. L. 2006. Pharmacology of ocular allergy. Current Opinion in Allergy and
Clinical Immunology, vol. 6, Issue 5, pp 383–389.
Shah, A. A. Hasan, F. Hameed, A. Ahmed, S. 2008. Biological degradation of
plastics: a comprehesive review. Biotechnology Advances, vol. 26, pp 246–265.
Shell, J. 1982. Pharmacokinetics of topically applied ophthalmic drugs. Survey of
Ophthalmology, vol.26, pp 207–218.
Sintzel, M. Bernatchez, S. Tabatabay, C. Gurny, R. 1996. Biomaterials in
ophthalmic drug delivery. European Journal of Pharmaceutics and
Biopharmaceutics, vol. 42, pp 358–374.
Šklubalová, Z. Zatloukal, Z. 2011. Area under rheogram as multi-point viscosity
characteristic of the sterilized hypromellose hydrogels. Polish Pharmaceutical
Society, vol. 68, no. 4, pp 565-5691.
Smith, J. S. Hui, Y. H. 2004. Food Processing: Principles and Applications. New
Jersey. Wiley-Blackwell, pp 101–132.
Smith, A. F. Pitt, A. D. Rodruiguez, A. E. Alio, J. L. Marti, N. Teus, M. 2005. The
economic and quality of life impact of seasonal allergic conjunctivitis in Spanish
setting. Ophthalmic Epidemiology, vol. 12, Issue 4, pp 233–242.
Sprieck, T. L. 1974. High-pressure liquid chromatographic determination of
adrenergic and antihistaminic compounds in pharmaceutical preparations. Journal of
Pharmaceutical Sciences, vol. 63, Issue 4, pp 591–593.
172
Stahl, J. L. Cook, E. B. Barney, N. P. Graziano, F. M. 2002. Pathophysiology of
ocular allergy: the roles of conjunctival mast cells and epithelial cells. Current Allergy
and Asthma Reports, vol. 2, Issue 4, pp 322–339.
Stewart, A. 2006. ‘Sodium Metabisulfite’, in A. H. Kibbe (ed), Handbook of
Pharmaceutical Excipients, 5th Edition, Pharmaceutical Press, Chicago, pp 441–444.
Sutton, S. Dunn, M. Dunn, D. 1998. In-use stability testing: what data are required
and when. The Regulatory Affairs Journal, vol. 8, pp 728–733.
Sutton, S. Porter D. 2002. Development of the antimicrobial effectiveness test as
USP chapter <51>. PDA Journal of Pharmaceutical Science and Technology, vol.
56, pp 300 – 311.
Swarbrick, J, Rubino, JT & Rubino, OP 2000, ‘Coarse Dispersions’, in AR Gennaro
(ed.), Remington: The Science and Practice of Pharmacy, 20th Edition, Lippincott
Williams & Wilkins, Pennsylvania, pp 317–322.
Sweetman, CS (ed.) 2002, Martindale - The Complete Drug Reference, 33rd Edition,
The Pharmaceutical Press, London, pp 1097–1098.
Taylor, P. 2002. ‘Nasal Drug Delivery’, in M.E. Aulton (ed), Pharmaceutics – The
Science of Dosage Form Design, 2nd Edition, Churchill Livingstone, Edinburgh, pp,
489–498.
Thakur, A. B. Serajuddin, A. T. M. Ghoshal, R. N. Fakes, M. G. Ranadive, S. A.
Morris, K. R. Varia, S. A. 1999. Selection of solid dosage form composition through
drug-excipient compatibility. Journal of Pharmaceutical Sciences, vol. 88, no. 7, pp
3617–3631.
Thomsen, V. Schatzlein, D. Mercuro, D. 2003. Limits of detection in spectroscopy.
Spectroscopy, vol. 18, Issue 12, pp 112–114.

173
Tkaczyk, C. Okayama, Y. Woolhiser, M. R. Hagaman, D. D. Gilfillan, A. M. Metcalfe,
D. D. 2002. Activation of human mast cells through the high affinity IgG receptor.
Molecular Immunology, vol. 38, Issue (16 – 18), pp 1289–1293.
Tokiwa, Y. Calabia, B. P. 2004. Degradation of microbial polyesters. Biotechnology
Letters, vol. 26, pp 1181–1189.
Trommer, H. Raith, K. Neubert, R. H. H. 2010. Investigating the degradation of the
sympathomimetic drug phenylephrine by electrospray ionisation-mass spectrometry.
Journal of Pharmaceutical and Biomedical Analysis, vol. 52, no.2, pp 203–209.
Turco, S. King, R. E. 2005, ‘Plastic Packaging Materials’, in Remington: the science
and practice of pharmacy Volume 1 of REMINGTON THE SCIENCE AND
PRACTICE OF PHARMACY M - Medicine Series. 2005. 21st edition. Lippincott
Williams & Wilkins, pp 840–849.
Twitchell, A. 2002,‘Pharmaceutical preformulation: the physicochemical properties of
drug substances’, in M. E. Aulton (ed.). Pharmaceutics-The Science of Dosage Form
Design, 2nd Edition, Churchill Livingstone, Edinburgh, pp 323–333.
USP (2004) Refer to United States Pharmacopoeia, 2004.
United States Pharmacopoeia, 2004, 27th Revision, The United States
Pharmacopoeial Convention, Inc., Rockville, pp 1235–1237, 2532–2628.
Urtti, A. 2006. Challenges and obstacles of ocular pharmacokinetic and drug
delivery. Advanced Drug Delivery and Review, vol.58, pp 1131–1135.
Urtti, A. Salminen, L. 1993. Minimizing systemic absorption of topically administered
ophthalmic drugs. Survey of Ophthalmology, vol. 37, pp 435–456.
Urtti, A. Salminen, L. 1993. Review: systemic absorption of topically applied ocular
drugs in humans. Journal of Ocular Pharmacology, vol. 6, pp 243–249.

174
Van Ooteghem, M., 1987. Factors influencing the retention of ophthalmic solutions
on the eye surface. In: Saettone, M., Bucci, M., Speiser, P. (Eds.), Ophthalmic Drug
Delivery. Biopharmaceutical, Technological and Clinical Aspects. Fidia Research
Series, vol. 11. Liviana Press, Padova, pp 7–17.
Van Santvliet, L. Ludwig, A. 2004. Determinants of eye drop size. Survey of
Ophthalmology, vol. 49, Issue 2, pp 197–213.
Verma, R. K. Garg, S. 2004. Compatibility studies between isosorbide mononitrate
and selected excipients used in the development of extended release formulations.
Journal of Pharmaceutical and Biomedical Analysis. Issue 35, pp 449–458.
Veys, J. 2004. Managing the contact lens wearing allergy sufferer. Optician, vol.
5950, Issue 227, pp 22–26.
Weller, P. J. 2006. ‘Edetic Acid’, in A. H. Kibbe (ed), Handbook of Pharmaceutical
Excipients, 5th Edition, Pharmaceutical Press, Chicago, pp 191–194.
Wells, J. 2002. ‘Pharmaceutical Preformulation: The Physicochemical Properties of
Drug Substances’, in M. E. Aulton (ed), Pharmaceutics – The Science of Dosage
Form Design, 2nd Edition, Churchill Livingstone, Edinburgh, pp 113–138.
Wilson, C. G. 2004. Topical Drug Delivery in the Eye, Experimental Eye Research,
vol. 78, pp 737–743.
Winfield, A. J. Rees, J. A. Smith, I. 2009. Pharmaceutical Practice. 4th Edition.
Philadelphia. Churchill-Livingston, pp 429–447.
Winfield, A. J. Richards, M. E. 2004. Pharmaceutical Practice. 3rd Edition Illustrated.
China. Elsevier health Sciences. pp 181–190.
Wolffsohn, J. S. Naroo, S. A. Gupta, N. Emberlin, J. 2011. Prevalence and impact of
ocular allergy in the population attending UK optometric practice. Contact Lens and
Anterior Eye, vol. 34, Issue 3, pp 133–138.

175
Wong, J. Wiseman, L. Al-Mamoon, S. Cooper, T. Zhang, L. –K. Chan, T. –M. 2006.
Major degradation product identified in several pharmaceutical formulations against
the common cold. Analytical Chemistry, vol. 78, Issue 22, pp 7891–7895.
Worakul, N. Robinson, J. R. 1997. Ocular Pharmacokinetics/Pharmcodynamics.
European Journal of Pharmaceutical and Biopharmaceuticals, vol. 44, Issue 1, pp
71–83.
Yoshihashi, Y. Yonemochi, E. Terada, K. 2002. Estimation of intial dissolution rate of
drug substance by thermal analysis: application for carbamazepine hydrate.
Pharmaceutical Development and Technology, vol. 7, Issue 1, pp 89–95.
Zahn, M. 2008. ‘Global Stability Practices’, in K. Huynh-Ba (ed), Handbook of
Stability Testing in Pharmaceutical Development: Regulations, Methodologies, and
Best Practices, Illustrated edition, Springer, New York, pp 43 – 93.
Zeise, M. M. McDougall, B. W. J. Bartlett, J. D. Corliss, D. Mitten, L. 1996.
Comparison of efficacy and tolerance between 1% hydroxyamphetamine plus 0.25%
tropicamide (paremyd®) and 0.5% tropicamide combined with 2.5% phenylephrine.
Journal of the American Optometric Association, vol. 67, pp 681–689.
Zide, B. M. 2006. Surgical Anatomy Around the orbit (The System of Zones),
Lippincott, Williams and Wilkins, Philadelphia, pp 1–128.
Zoukhri, D. 2006. Effect of inflammation on lacrimal gland function. Experimental Eye
Research, vol. 82, Issue 5, pp 885–898.
176
APPENDIX A
CONCEPT ARTICLE
The following manuscript is intended to be submitted for publication.
Use and validation of high performance liquid chromatography for
phenylephrine hydrochloride estimation
Chinedum Okafor a, Mbali Keele a*, Gareth Kilianb, Matthew Worthingtonc
a Department of Pharmacy, PO Box 77000, Nelson Mandela Metropolitan University,
Port Elizabeth, 6031
b University of Western Cape
c Aspen Pharmacare, 7 Fairclough Road, Korsten, Port Elizabeth, 6014
* E-mail: [email protected]
Abstract:
Simple, accurate and reproducible high performance liquid chromatography (HPLC)
method was validated for the estimation of phenylephrine hydrochloride in
pharmaceutical eye drop formulations. Phenylephrine hydrochloride (PE) was
assayed using HPLC at concentration range of 0.0125 to 0.15 mg/ml. Linearity, y =
8541.1 x + 438.55 was achieved as the range were directly proportional to the
concentration of phenylephrine hydrochloride within a given range (r2 = 0.9999). The
method was tested and validated for various parameters according to the ICH
(International Conference on Harmonization) guidelines. The detection and
quantification limits were found to be 12.3 and 41 μg/ml respectively. The proposed
method was successfully applied for the determination of phenylephrine
hydrochloride in pharmaceutical eye drop formulations. The results demonstrated
that the procedure is accurate, precise and reproducible, while being simple, cheap

177
and less time consuming, and hence can be suitably applied for the estimation of
phenylephrine hydrochloride in eye drops.
Key words: phenylephrine hydrochloride; HPLC; formulations; eye drops
Introduction
Phenylephrine hydrochloride (PE) is a potent adrenergic agent and β–receptor
sympathomimetic drug, used in its optically active form (Pandey et al., 2003; Pandey
et al., 2006). As an α1-adrenergic receptor agonist it is used primarily as a
decongestant, for uveitis and as an agent to dilate the pupil (Lang, 1995).
The drainage of phenylephrine hydrochloride into the nasal mucosa could result in
systemic absorption of this agent and produce many unwanted systemic side effects
including tachycardia, hypertension, and headache (Bartlett and Jaanus, 2008).
Also, the eye drop solutions were either blinked out or only a small portion of the
drug reached its site of action. The use of viscosity modifying agents is included in
solutions with the aim of obtaining thickening effects. However, these components
may have other effects, whether independently or as a consequence of interactions
with other components, these effects being mostly due to electrostatic, steric,
electrosteric, or depletion mechanisms (Duro et al., 1999).
Various methods have been reported in the literature for the analysis of
phenylephrine hydrochloride including spectrophotometer (Collado et al., 2000; Erk,
2000; Solich et al., 2000; Shama, 2002; Knochen & Giglio 2004), spectrophotometry
with chromogenic reagent (Ahmed and Amin, 2007), fluorometry (Martin et al.,
1993), High-performance liquid chromatography (Marin et al., 2002; Olmo et al.,
2005; Galmier et al., 2000) spectro-fluorimetric and derivative spectrophotometric
methods (Sabry et al., 2000), have also been reported for the determination of
phenylephrine hydrochloride.
The aim of the study was is to use and validate a HPLC analytical method for the
estimation of phenylephrine hydrochloride in pure form and in pharmaceutical eye

178
drop formulations. The method was validated as per ICH (International Conference
on Harmonization) guidelines and MCC requirements.
Materials and methods
Materials
Phenylephrine hydrochloride, sodium citrate dihydrate, boric acid, disodium
edentate, octane-1-sulfonic acid sodium salt, sodium metabisulphite, and
benzalkonium chloride were kindly donated by Aspen Pharmacare (Port Elizabeth,
SA). Water for chromatography was produced by Ultra Clear TWF/El-Ion® system
which has been pre-treated and made ultrapure (reverse osmosis) (Separations,
Johannesburg, SA). HPLC grade methanol and octane-1-sulfonic acid sodium salt
was obtained from Sigma-Aldrich (Pty) Ltd (Kempton Park, SA). Analytical / technical
grades of sodium hydroxide pellets, carboxymethylcellulose sodium,
hydroxymethylcellulose, glycerol, methanol hydrochloride acid solution 33%,
pyrophosphoric acid (phosphoric acid) was obtained from Merck Laboratory Supplies
(Pty) Ltd (Midrand, SA) and hydrogen peroxide 30% were sourced from Saarchem
(Pty) Ltd (Johannesburg, SA).
Instruments
The HPLC system consisted of a complete FPLC Shimadzu® HPLC system which
has a SPD-M20A Prominence diode array detector, SIL-20A Prominence auto-
sampler, DGU-20A5 Prominence degasser, LC-20AB Prominence liquid
chromatography and CTO-10AS vp Prominence column oven ( Shimadzu, Tokyo,
Japan). Column was a reverse phase Phenomenex® Luna C18 (2) column 250 mm
× 4.60 mm, 5 μm particle size (Separations, Johannesburg, SA).
179
Calibrations
1.1g of octane-1-sulfonic acid sodium salt was dissolved in one litre mixture of
methanol and water (1:1) and the pH was adjusted to 3.0 with pyrophosphoric acid.
The resulting solution was mixed, degassed by ultrasonication (Ultrasonic LC 130,
Labotec, Germany) and vacuum filtered through a 0.45 μm Millipore filter (Millipore
Corporation, Bedford, Massachusetts, USA) prior to use. Dilution solvent was
prepared as a mixture of HPLC grade methanol and water (1:1) and adjusted to a pH
of 3. The stock solution was prepared by accurately weighing 200 mg of
phenylephrine hydrochloride material into a 100 ml volumetric flask, dissolving it and
making up to volume with dilution solvent. Calibration standards containing 0.0125,
0.025, 0.05, 0.075, 0.1 and 0.15 mg / ml were prepared by making appropriate
solvent dilutions of the working stock solution. Each calibration standard was filtered
through a 0.45 μm Millex® syringe driven filter unit prior to injection.
Sample preparation
Eye drop formulations had PE concentration of 100 mg / ml. The eye drop
formulations were filtered and 0.3 ml was dissolved into 10ml of dilution solvent to
get a final concentration of 0.03 mg / ml. The samples were analyzed using the
following analytical method.
Methods
The samples were analyzed using the following analytical method:
Linearity
Linearity of an analytical procedure is its ability, within a given range, to obtain test
results that are directly proportional to the concentration of analyte in the sample
(ICH Harmonized Tripartite Guideline Q2A, 2005). A calibration curve was prepared
and linearity demonstrated over a phenylephrine hydrochloride concentration range.
A stock solution was prepared having a known concentration of 2 mg / ml (defined as
100%) and dilution of the stock solution to final concentrations of 0.0125 to 0.15 mg /
ml were prepared with reverse osmosis ( RO) water and filtered through 23 mm 0.45

180
µm PVDF syringe filters (Millex-HV, Millipore, Billerica, USA). Each of the standards
was assayed in triplicate. The calibration curve was constructed by plotting the peak
areas of phenylephrine hydrochloride versus the respective phenylephrine
hydrochloride concentrations and a linear regression trend line was fitted to the plot
on Microsoft Excel® 2007, Microsoft Corporation.
Accuracy and precision
Accuracy and precision were determined by replicate injection (n=6) of three
phenylephrine hydrochloride solutions, at the upper, middle, and lower limits of the
concentration range studied. The concentration ranges were 0.0095 lower limit,
0.054 middle limit and 0.138 upper limit (mg/ml). The theoretical concentrations were
calculated from the linear regression curve, and compared to the actual
concentrations obtained. The actual mean concentration and standard deviation
were calculated at each theoretical concentration. The mean concentrations and
percentage recovery of phenylephrine hydrochloride obtained for the replicate
injections were a measure of the accuracy of the method, whilst the relative standard
deviations at any one concentration provided a measure of precision. The
requirement for accuracy is that the percentage recovery of phenylephrine
hydrochloride for each solution prepared must be within the 98.00 to 102.00% limit.
The requirement for precision is that the relative standard deviations at any one
concentration must be less than or equal to 2.00%.
Limit of detection and limit of quantification
Standard solutions of decreasing concentration were produced by successive
dilution of the lowest calibration standard and the resulting solutions were injected in
triplet. 0.01 ml of the least calibration standard concentration was diluted 10 times.
Specificity
All five products and the phenylephrine hydrochloride were subjected to the following
stress conditions after which they were manipulated and analysed:
0.2 M NaOH for 30 minutes (reflux system);
0.2 M HCl for 30 minutes (reflux system);

181
0.2 M H2O2 for 30 minutes (reflux system);
UV lights (17 hours inside a stability chamber);
100 °C (24 hours inside a stability chamber);
65 °C (1 month inside a stability chamber);
40 °C/75%RH (1 month inside a stability chamber);
Unstressed batch of phenylephrine hydrochloride and Products I–V
A mass of 10 mg of unstressed phenylephrine hydrochloride was dissolved in 100 ml
of dilution solvent and analysed using the HPLC method being validated. A volume
of 0.3 ml of unstressed Product I–V was dissolved in 10 ml dilution solvent and
analysed using the HPLC method being validated. The same method was applied for
the samples (phenylephrine hydrochloride and products I–V) stressed within the
stability chamber (UV lights, 65 °C, 100 °C, 40 °C/75%RH). Phenylephrine
hydrochloride (10 mg) was diluted to 100ml 0.2 M HCl, 5 ml was diluted to 25 ml 0.2
HCl and refluxed for 30 minutes; the same manipulation was applied when using
NaOH and H2O2. 0.5ml of product I–V was diluted to 100 ml 0.2 M HCl and refluxed
for 30 minutes, 10 ml was diluted to 100ml dilution solvent, and analysed using the
HPLC method being validated. The same manipulation was applied when using
NaOH and H2O2. Samples (phenylephrine hydrochloride and Products I–V) were
stressed in a stability chamber (Binder, SA) which emitted both UV and visible light
through a window glass filter (type 2) and did conform to the requirements of the ICH
guidelines. The stability chamber had an irradiance level of 318 watts / m2 in order to
expose the samples to an overall illumination of not less than 1.2 million lux hours
and an integrated near UV energy of not less than 200 watt hours / m2 all according
to ICH Harmonized Tripartite Guideline Q1B, 2005.
Results and discussion
Linearity
Linearity indicates that the method a calibration curve was constructed by plotting
the area of the phenylephrine hydrochloride peak versus phenylephrine
hydrochloride concentration. The figure below shows linearity over the concentration
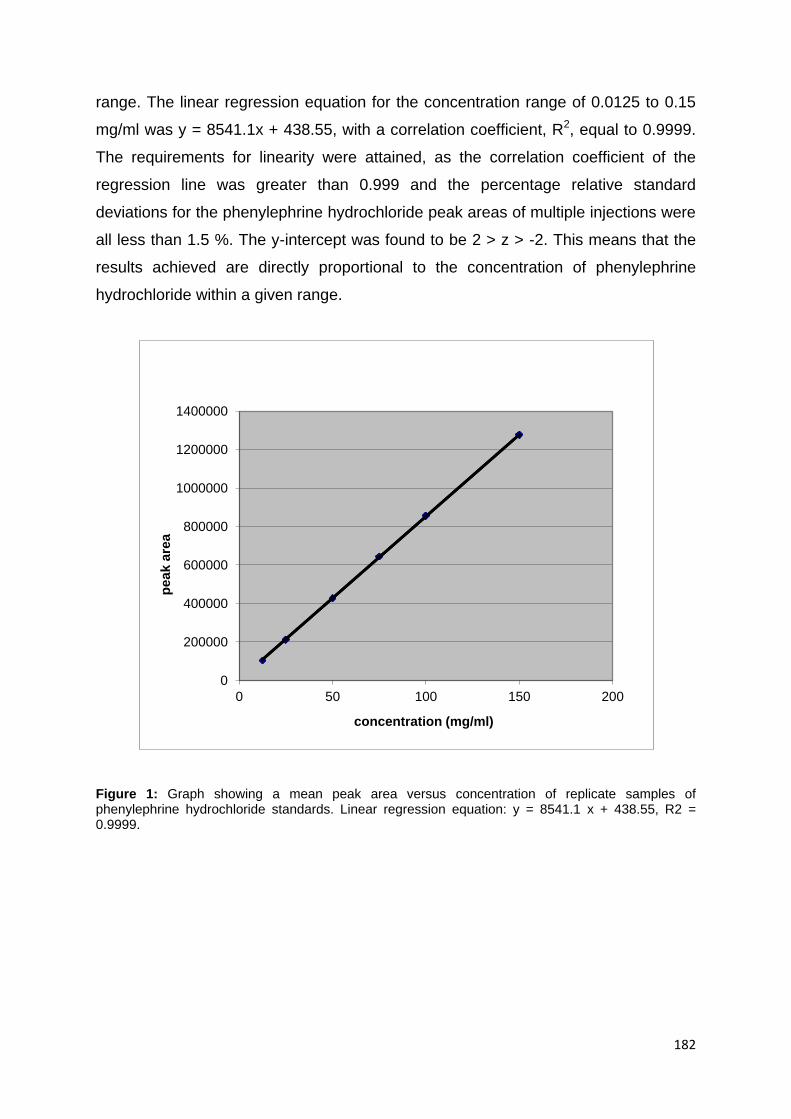
182
range. The linear regression equation for the concentration range of 0.0125 to 0.15
mg/ml was y = 8541.1x + 438.55, with a correlation coefficient, R2, equal to 0.9999.
The requirements for linearity were attained, as the correlation coefficient of the
regression line was greater than 0.999 and the percentage relative standard
deviations for the phenylephrine hydrochloride peak areas of multiple injections were
all less than 1.5 %. The y-intercept was found to be 2 > z > -2. This means that the
results achieved are directly proportional to the concentration of phenylephrine
hydrochloride within a given range.
Figure 1: Graph showing a mean peak area versus concentration of replicate samples of phenylephrine hydrochloride standards. Linear regression equation: y = 8541.1 x + 438.55, R2 = 0.9999.
0
200000
400000
600000
800000
1000000
1200000
1400000
0 50 100 150 200
pe
ak
are
a
concentration (mg/ml)

183
Accuracy
Accuracy was within acceptable range as noted in Table 1. The percentage relative
standard deviations calculated for the samples at the lower, middle and upper limits
of the concentration range were all below 0.5%. The recovery percentage for the
samples was between the limits of 99.00 to 100.10%. This means by applying the
analytical method of a known purity concentration (linearity) and comparing the
results of a second, well characterised method, the difference should not be greater
than 0.5%.
Precision
Precision was within acceptable range as seen above in Table 2. The percentage
relative standard deviations calculated for the samples at the lower, middle and
upper limits of the concentration range were all below 0.5%. The recovery
percentage for the samples was between the limits of 99.00 to 100.00%. The
precision method had the degree of agreement among individual test results when
the method was applied repeatedly to the three concentrations chosen of
phenylephrine hydrochloride. As above it is expressed in RSD, showing that it can
be reproduced or repeated under normal operating conditions.
Limit of detection (LOD)
The LOD was found to be 12.3 μg/ml. The amount stated is the lowest amount of
phenylephrine hydrochloride in a sample that can be detected. The LOD is the
lowest concentration for which the relative standard deviation of multiple injections is
less than 5.0%. By convention, the LOD value is taken as 0.3 times the LOQ
(Armbruster & Pry, 2008).

184
Limit of quantification (LOQ)
The LOQ was found to be 41 μg/ml. The amount shows the lowest amount of analyte
in a sample that can be determined with acceptable precision and accuracy. LOQ =
3.33 LOD (Thomsen et al., 2003).
Specificity
Specificity of a chromatographic method is the ability of the method to accurately
measure the analyte response in the presence of all potential sample components.
Specificity is useful to show that an analyte response cannot be attributed to more
than one component (Rozet et al., 2011). The chromatograms were examined for the
presence of compounds, metabolites, impurities, degradants that may interfere or
partly co-elute with the phenylephrine hydrochloride peak.
The results are shown below:
1. Mobile phase chromatogram showed no interference. The mobile phase
produced a chromatogram which had a steady baseline and no ghost peaks
as seen in Figure 2.
2. Phenylephrine hydrochloride peak observed, it shows no interference from
contaminants or impurities. It eluted (had a retention time) of 7.8 minutes. The
peak was symmetrical not fronting or tailing.
3. All products that were stressed using UV light, heat, humidity, HCl and NaOH,
did not produce compounds which interfered or co-eluted with phenylephrine
hydrochloride. This means the excipients did not react with the phenylephrine
hydrochloride or any degradants co-eluting with the phenylephrine
hydrochloride. The products changed from clear solution to a brownish colour
during base stress refluxing, while a pale yellow–lime green colour was
observed during peroxide stress refluxing. No change in colour was observed
during UV stress testing.
4. The mobile phase was different from the extraction as a result a constant
peak is noted between 2.5 and 3.5 minutes as observed in figures 2–6. It
takes that amount of time for the injected sample to reach the column. This
peak is constituent for all chromatograms.
Peak purities were observed in all samples of stressed and unstressed
phenylephrine hydrochloride and finished product solutions. Phenylephrine
185
hydrochloride showed loss to the combination of heat and humidity. It was, however,
potent against heat alone. There was decomposition by acid, peroxide and base.
Phenylephrine hydrochloride was stable to UV light.
Conclusion
High performance liquid chromatography method was used successfully for
phenylephrine hydrochloride determinations in eye drop formulations. The analytical
method was simple, sensitive, rapid and specific and it can be conveniently used for
analysis and quality control of phenylephrine hydrochloride in eye drop formulations.
The method was suitable to determine concentrations in the range 0.0125–0.15
mg/ml precisely and accurately. The limits of detection and quantification were
detected as 12.5 and 41 μg/ml respectively.
Reference
Ahmed, I.S. Amin, A.S. 2007. Spectrophotometric Microdetermination of
Phenylephrine Hydrochloride in Pure and in Pharmaceutical Formulations Using
Haemotoxylin. Journal of Molecular Liquids, vol. 130, Issues 1–3, pp 84–87.
Armbruster, D.A. & Pry, T. 2008. Limit of Blank, Limit of Detection and Limit of
Quantitation. Clinical Biochemical Review, vol. 29, Issue 1, pp 49–52.
Barlett, J. D. & Jaanus S. D. 2008. Clinical Ocular Pharmacology. 5th edition.
Churchill Livingstone: Elsevier Health Sciences, pp 1–50.
Collado, M. S. Mantovani, V. E. Goicoechea, H. C. Olivieri, A. C. 2000.Simultaneous
spectrophotometric-multivariate calibration determination of several components of
opthhalmic solutions: phenylephrine, chloramphenical, antipyrine, methylparaben
and thimerasal, Talanta, Issue 52, pp 909–920.
Duro, R. Souto, C. Gómez-Amoza, J.L. Martínez-Pacheco, R. & Concheiro, A. 1999.
Interfacial Adsorption of Polymers and Surfactants: Implications for the Properties of

186
Disperse Systems of Pharmaceutical Interest, Drug Development and Industrial
Pharmacy, vol. 25, no. 7, pp 817-829.
Galmier, M. J. Frasey, A. M. Meski, S. Beyssac, E. Petit, J. Aiache, J. Lartigue, M. C.
2000. High-performance liquid chromatographic determination of phenylephrine and
tropicamide in human aqueous humor, Biomedical Chromatography. Issue 14, pp
202–204.
International Conference on Harmonisation (ICH) of Technical Requirements for
Registration of Pharmaceuticals for Human Use, October, 2005, ‘Validation of
Analytical Procedures: Methodology Q2A’, ICH Harmonised Tripartite Guideline,
International Conference on Harmonisation (ICH) of Technical Requirements for
Registration of Pharmaceuticals for Human Use, October, 2005, ‘Validation of
Analytical Procedures: Methodology Q1B’, ICH Harmonised Tripartite Guideline,
Knochen, M. Giglio, J. 2004. Flow-injection determination of phenylephrine
hydrochloride in pharmaceutical dosage forms with on-line solid-phase extraction
and spectrophotometric detection phenylephrine hydrochloride and orphenadrine
citrate in pure and in dosage forms, Talanta. Issue 64 (5), pp1226–1232.
Lang, J. C. 1995. Ocular drug delivery conventional ocular formulations. Advanced
Drug Delivery Reviews, vol. 16, no. 1, pp 39–43.
Marin, A. Garcia, E. Garcia, A. Barbas, C. 2002. Validation of a HPLC quantification
of acetaminophen, phenylephrine and chlorphenitamine in pharmaceutical
formulations: capsules and sachets, Journal of Pharmaceutical and Biomedical
Analysis. Issue 29, pp 701–714.
Martin, M. del Castillo, A. Prados,B. P. 1993. 13-Hydrohaycena phato [1,2
b]quinoliuivs bromide as a new fluorescence indicator, Talanta. Issue 40, pp 1719–
1723.

187
Olmo, B. Garcıa, A. Marın, A. Barbas. C. 2005. New approaches with two cyano
columens to the separation of acetaminophen, phenylephrine, chlorpheniramine and
related compounds, Journal of Chromatography. Issue B 817, pp 159–165
Pandey, R. K. Upadhyay, P. K. Kumar, P. 2003. Enantioselective synthesis of (R)-
phenylephrine hydrochloride. Tetrahedron Letters, vol. 44, Issue 33, pp 6245–6246.
Pandey, R. K. Upadhyay, P. K. Kumar, P. 2006. An asymmetric dihydroxylation route
towards the synthesis of (R)-clorprenaline hydrochloride. General papers, pp 10–14.
Rozet, E. Marini, R.D. Ziemons, E. Boulanger, B. Hubert, Ph. 2011. Advances in
validation risk and uncertainty assessment of bioanalytical methods. Journal of
Pharmaceutical and Biological Analysis, vol. 55, Issue 4, pp 848–858.
Shama, S. A. 2002. Spectrophotometric determination of Journal of Pharmaceutical
and Biological Analysis. Issue 30, pp 1385–1392.
Solich, P. Polydorou, C. K. Koupparis, M. A. Efstathiou,C. E. 2000. Automated flow-
injection spectrophotometric determination of catecholamines (epinephrine and
isoproterenol) in pharmaceutical formulations based on ferrous complex formation,
Journal of Pharmaceutical and Biological Analysis. Issue 22, pp 781–789.
Sabry,S.M. Abdel-Hay,M.H. Barary, M. H. Belal, T. S. 2000. Sensitive
spectrofluorometric and spectrophotometric methods for the determination of
thonzylamine hydrochloride in pharmaceutical preparations based oncoupling with
dimethylbarbituric acid presenc of aircyclohexylcarbamide, Journal of
Pharmaceutical and Biological Analysis. Issue 22, pp 257–266.
Thomsen, V. Schatzlein, D. Mercuro, D. 2003. Limits of detection in spectroscopy.
Spectroscopy, vol. 18, Issue 12, pp 112–114.
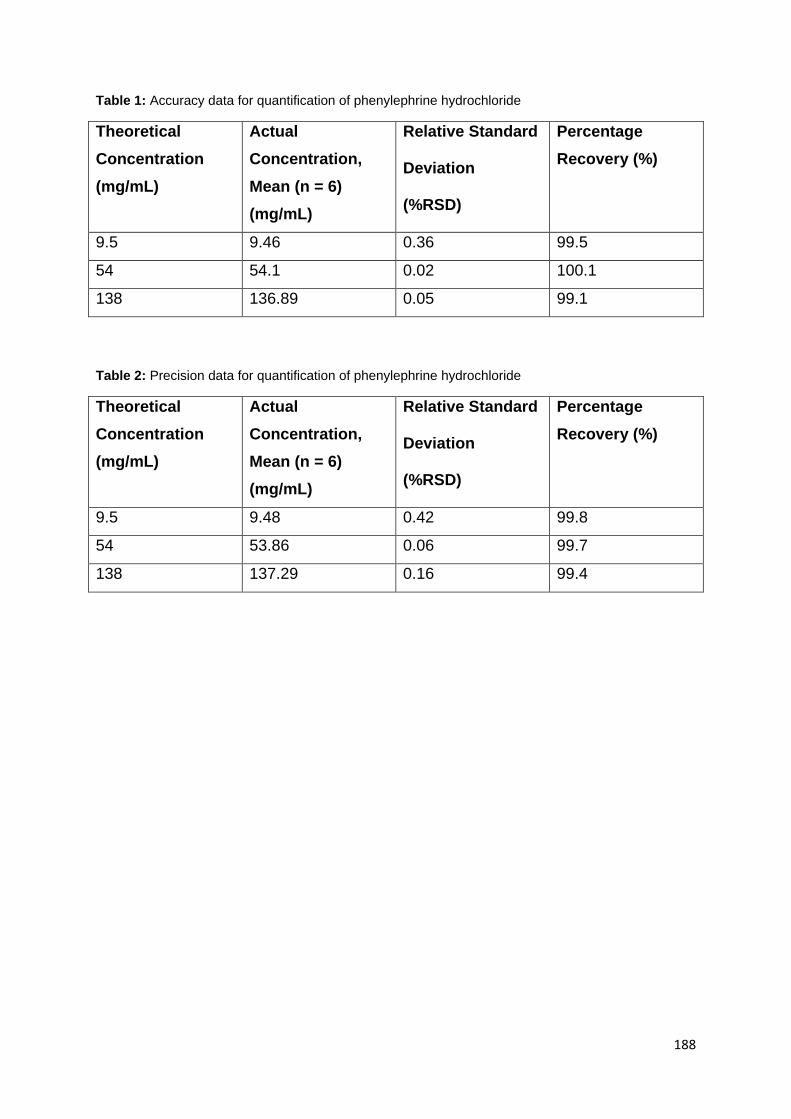
188
Table 1: Accuracy data for quantification of phenylephrine hydrochloride
Theoretical
Concentration
(mg/mL)
Actual
Concentration,
Mean (n = 6)
(mg/mL)
Relative Standard Deviation (%RSD)
Percentage
Recovery (%)
9.5 9.46 0.36 99.5
54 54.1 0.02 100.1
138 136.89 0.05 99.1
Table 2: Precision data for quantification of phenylephrine hydrochloride
Theoretical
Concentration
(mg/mL)
Actual
Concentration,
Mean (n = 6)
(mg/mL)
Relative Standard Deviation (%RSD)
Percentage
Recovery (%)
9.5 9.48 0.42 99.8
54 53.86 0.06 99.7
138 137.29 0.16 99.4

189
Figure 2: Chromatogram of mobile phase alone
Figure 3: Chromatogram of phenylephrine hydrochloride only
0.0 2.5 5.0 7.5 10.0 12.5 min
0
5
10
15
20
25
30
35
40
45
mAU280nm,4nm (1.00)
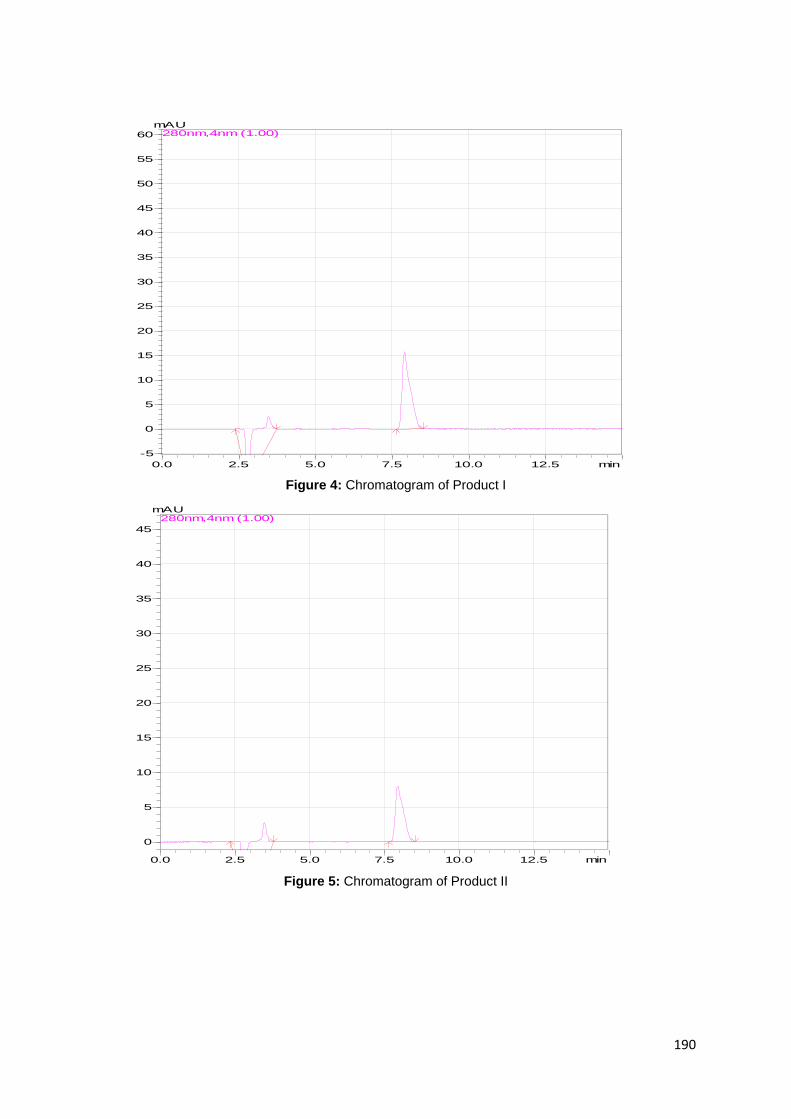
190
Figure 4: Chromatogram of Product I
Figure 5: Chromatogram of Product II
0.0 2.5 5.0 7.5 10.0 12.5 min
-5
0
5
10
15
20
25
30
35
40
45
50
55
60
mAU280nm,4nm (1.00)
0.0 2.5 5.0 7.5 10.0 12.5 min
0
5
10
15
20
25
30
35
40
45
mAU280nm,4nm (1.00)

191
Figure 6: Chromatogram of Product III
0.0 2.5 5.0 7.5 10.0 12.5 min
0
5
10
15
20
25
30
35
40
45
50
mAU280nm,4nm (1.00)

192
APPENDIX B
LIST OF EQUIPMENT
Autoclave Hirayama Manufacturing Corp, Japan
Spectrophotometer Lasec Cecil LE 2021, Wehingen, Germany
HPLC system LC2020 system, Kyoto, Japan
HPLC column Phenomenex Luna C8
PDA detector SPD M20A PDA detector, Kyoto, Japan
Incubator Labcon Incubator, Labex, Orange/grove
Edelstahl Rostfrei, Memmert, NT Laboratory

193
APPENDIX C
LIST OF SOLUTIONS
Nutrient agar
Nutrient agar 16 grams
RO water to 1000 ml
0.9% Sodium chloride solution
NaCl 9.0 grams
Reverse osmosis water to 1000 ml
1 M sodium hydroxide
Sodium hydroxide 40 grams
Reverse osmosis water to 1000 ml
Hydroxypropyl methylcellulose 0.3%
Hydroxy propyl methylcellulose 3 grams
Reverse osmosis water to 1000 ml
Sodium carboxy methylcellulose 0.2%
Sodium carboxy methylcellulose 2 grams
Reverse osmosis water to 1000 ml