Formulation and Evaluation of Sintered Floating Tablets of ...
Upload
khangminh22Category
view
0download
0
FORMULATION AND EVALUATION OF SITAGLIPTIN
PHOSPHATE LOADED TRANSDERMAL
MICROSPHERES GEL
Dissertation submitted to
THE TAMILNADU Dr. M.G.R. MEDICAL UNIVERSITY
CHENNAI-32
In partial fulfillment of the requirement
for the award of degree of
MASTER OF PHARMACY IN
BRANCH- I PHARMACEUTICS
Submitted By R.VIGNESH
(Reg. No: 261611308)
Under the guidance of
Dr. R.SENTHIL PRABHU, M.Pharm., Ph.D., Department of Pharmaceutics
COLLEGE OF PHARMACY MADURAI MEDICAL COLLEGE
MADURAI – 625 020
MAY-2018

CERTIFICATE

CERTIFICATE
This is to certify that the dissertation entitled, “Formulation And
Evaluation Of Sitagliptin Phosphate Loaded Transdermal Microspheres
Gel” bonafide work done by Mr. R. VIGNESH (Reg.No:261611308),
Department of Pharmaceutics, College of Pharmacy, Madurai Medical
College-20 in partial fulfillment of The Tamil Nadu Dr.M.G.R medical
university rules and regulations for award of MASTER OF PHARMACY IN
PHARMACEUTICS under my guidance and supervision during the academic
year 2017–2018.
Name & Signature of the Guide Name & Signature of the Head of Department Name & Signature of the Dean/Principal

ACKNOWLEDGEMENT

ACKNOWLEDGEMENT
I first and foremost express my revered regard and obeisance
to the ALMIGHTY GOD with whose blessings I was able to complete my
project work.
It is my pleasure to express my respectful regards and
thanks to Dr.D.MARUDUPANDI, M.S., F.I.C.S., F.A.I.S., Dean, Madurai
Medical College, Madurai for providing all kinds of supportive facilities
required to carry out my project work.
I am thankful to Dr.V.DHANALAKSHMI. M.D., Vice Principal, Madurai
Medical College, Madurai for her support and encouragement to carry out
on my project work.
It is my immense pleasure and honour to express my deep sense of
gratitude and heartfelt thanks to Prof. Dr. A.ABDUL HASAN SATHALI,
M.Pharm., Ph.D., Principal, college of pharmacy, Madurai medical
college for his excellence in guidance, contribution and encouragement
which helped me in the successful completion of each and every stage of
my project work.
I am greatly indebted to my guide Dr.R.SENTHIL PRABHU,
M.Pharm.,Ph.D., Assistant Professor, Department of Pharmaceutics, college
of pharmacy for his valuable guidance, contribution and encouragement
throughout each and every stage of my project work.
I would l ike to thank Ass is tan t p ro fessors o f our co l lege
Mr. K.Arun,, Dr.C.Pandiyan, M.Pharm., Ph.D., Mrs. D.Umamaheswari,.
M.Pharm, Mr.Prabhu., M.Pharm., Dr.G.Uma Rani, M.Pharm., Ph.D., for
their valuable suggestions and encouragement throughout the work.

I also express my special thanks to my senior Ms. C. Soniya for
providing Sitagliptin Phosphate drug sample to carry out my project work.
I also thank Kamaraj University, Madurai, for their help in carrying
out the evaluation of SEM studies.
I also thank JSS College of Pharmacy, Ootty, for their help in
carrying out the evaluation of DSC studies.
I express my heartiest thanks to United Scientific Appliances for
providing chemicals to carry out my project work.
I also extend my thanks to the Department of Pharmaceutical
Chemistry MMC, Madurai for permitting me to carry out the IR
study and UV spectrophotometric studies in connection to my
dissertation work and Mr. Lakshmanan Department of
Pharmaceutical Chemistry, to carry out UV spectrophotometric studies.
I would like to give my sincere thanks to my classmates
Ms. J. Jeyapriya, Ms. K.Mahalakshmi, Mr. C.A. Muniyasamy,
Ms. M. Muthumari, Ms. T.Nithya, Mr. M. Selva kumar, Mrs. S.Sivapriya,
and Mr. S. Zameer for their timely help and co-operation.
I express my whole hearted and sincere thanks to my seniors and
juniors for their moral support to carry out my project work.
I express my special thanks to my UG class mates
Mr. N. Ramanathan, Mr. C. Seeni Kumar, Mr. A. Tamil Mani, Mr. P. Vinoth
Kumar, Mr. A. Ponnu Durai, Mr. K. Raman, Mr. J. Robert Dilton,
Mr. C. Ranjith Kumar, Mr. I. Prakash Kumar, Mr. T. Rajesh,
Mr. S. Selvam., and Mr. C. Anbu for their encouragement to carry out my
project work.
I also extend my thanks to all the staff members and P.G. Students of
Department of Pharmaceutical Chemistry and Pharmacognosy for their Co-
operation.
I also extend my thanks to our department staff Mrs. Mumtaj,
Mrs. Sophia and Mrs.Tamilselvi for their contribution throughout my project
work.
Last but definitely not the least, I pledge my deepest sense of gratitude
towards my father (K. Raja Manickam), my Mother (R. Gnana Soundari)
and my cousin brother (R. Senthur Pandi) who stood with me, supporting in
all my endeavors.
I am extremely thankful to the Library Madurai medical college and
staff of Star Xerox, Laser Point, for their kind co-operation regarding printing
and binding of this dissertation work.
Place:
Date: (R.VIGNESH)

Dedicated
to My
family
members
and
Well wishers

CONTENTS
CHAPTER
NO TITLE
PAGE NO
I INTRODUCTION 1-15
II MICROSPHERES– A REVIEW 16-37
III LITERATURE REVIEW 38-52
IV AIM OF THE WORK 53-56
V PLAN OF WORK 57-58
VI MATERIALS AND EQUIPMENTS 59-60
VII DRUG PROFILE 61-68
VIII EXCIPIENTS PROFILE 69-76
IX EXPERIMENTAL PROTOCOL 77-88
X RESULTS AND DISCUSSION
TABLES & FIGURES 89-94
XI SUMMARY AND CONCLUSION 95-97
REFERENCES

CHAPTER – I
INTRODUCTION

CHAPTER I INTRODUCTION
COLLEGE OF PHARMACY, MADURAI MEDICAL COLLEGE. Page 1
INTRODUCTION
SUSTAINED RELEASE DRUG DELIVERY SYSTEM
Sustained release dosage form is designed to maintain constant levels of a
drug in the patient’s bloodstream by releasing the drug over an extended period.
Maintaining constant blood levels of the drug in the bloodstream increases the
therapeutic effectiveness of the drug. Drugs are defined precisely under some
act.( Mithal B.M.,2004) It is the single active chemical entity present in a medicine
that is used for diagnosis, prevention, treatment, cure of a disease.(Tripathi
K.D.,2001) Yet to a common man they are just substances which are administered
to win back an individual from the states of disease or ill health to the normal
health. The drugs also had mysterious origins and hence the word drug was a
form of the word called ‘drogues’ meaning of mysterious origin. The word disease
can be expressed as a combination of ‘dis’ and ‘ease’ indicating absence of
easiness or well-being or a feeling contrary to the feeling of health.
With many drugs the basic goal of therapy is to achieve a steady state blood or
tissue level that is therapeutically effective and nontoxic for an extended period of
time. The basic objective in dosage form design is to optimize the delivery of
medication so as to achieve a measure of control of therapeutic effect in the face
of uncertain fluctuations in the in-vivo environment in which drug release takes
place. The appropriate dosage form and correct dose will ensure the maximum
availability of the drug. The pharmaceutical industry provides a variety of dosage
forms and dosage levels of particular drugs thus enabling the physician to control
the onset and duration of drug therapy by altering the dose or mode of
administration.( Lachmann.L and Lieberman.H.A.,1987)
Scope of Sustained Drug Delivery
Sustained release delivery systems are designed to achieve a prolonged
therapeutic effect by continuously releasing medication over an extended period of
time after administration of a single dose. A sustained release dosage forms leads
to better management of the acute or chronic disease condition. The basic

CHAPTER I INTRODUCTION
COLLEGE OF PHARMACY, MADURAI MEDICAL COLLEGE. Page 2
rationale of a sustained drug delivery system is to optimize the bio-pharmaceutic,
pharmacokinetic and pharmacodynamic properties of a drug in such a way that its
utility is maximized through reduction in side effects and cure or control of
condition in the shortest possible time by using smallest quantity to drug,
administered by the most suitable route. This is usually accomplished by
maximizing drug availability, i.e., by attempting to attain maximum rate and extent
of drug absorption; however, control of drug action through formulation also
implies controlling bioavailability to reduce drug absorption rates. Sustained
release tablets and capsules are commonly taken only once or twice daily,
compared with counterpart conventional forms that may have to take three or four
times daily to achieve the same therapeutic effect.
The novel system of drug delivery offer a means of improving the therapeutic
effectiveness of incorporated drugs by providing sustained, controlled delivery
and/or targeting the drug to desired site.(Brahmankar,D.M. and sunil B.Jaiswal.,
2002) Oral route has been the most popular and successfully used for sustained
delivery of drugs because of convenience and ease of administration, greater
flexibility in dosage form design and ease of production and low cost of such a
system. The sustained release systems for oral use are mostly solid and based on
dissolution, diffusion or a combination of both mechanisms in the control of release
of drugs.
Sustained release can be achieved by,
• Incorporating the drug in a carrier system
• Altering the structure of the drug at the molecular level
• Controlling the input of the drug into the bio-environment to ensure a
programmed and desirable bio-distribution. The primary objectives are to ensure
safety and to improve efficacy of drugs as well as patient compliance. This is
achieved by better control of plasma drug levels and less frequent dosing.

CHAPTER I INTRODUCTION
COLLEGE OF PHARMACY, MADURAI MEDICAL COLLEGE. Page 3
Advantages of Sustained Release Dosage Form
i. Frequency of drug administration is reduced.
ii. ii. Patient compliance can be improved, and drug administration can be
made more convenient.
iii. The blood level oscillation characteristic of multiple dosing of
conventional dosage forms is reduced, because a more even blood level
is maintained.
iv. Implicit in the design of sustained release forms, is that the amount of
drug administered can be reduced, thus maximizing availability with a
minimum dose.
v. The safety margin of high-potency drugs can be increased, and the
incidence of both local and systemic adverse side effects can be
reduced in sensitive patients. .(Brahmankar,D.M. and sunil B.Jaiswal.,
2002)
Disadvantages
i. Administration of sustained release medication does not permit the
prompt termination of therapy.
ii. The physician has less flexibility in adjusting dosage regimens. This is
fixed by the dosage form regimen.
iii. Sustained release forms are designed for the normal basis of average
drug biologic half-lives. Consequently, disease states that alter drug
disposition, significant patient variation, so forth are not accommodated.
iv. Economically more costly processes and equipment are involved in
manufacturing many sustained release forms.
Factors to Be Considered for the Formulation of Sustained Release:
Physicochemical properties
a) Dose size: For a ideal sustained release formulation the dose size should be
not more than 500mg.

CHAPTER I INTRODUCTION
COLLEGE OF PHARMACY, MADURAI MEDICAL COLLEGE. Page 4
b) Aqueous solubility: The drug should not be more water soluble or poorly
soluble; moderate solubility is needed.
c) Partition co-efficient: Both lipophillic or hydrophilic drugs are difficult to
process and should possess optimum partition co-efficient.
d) Molecule size: Large molecules show small diffusion co-efficient and may be
difficult to place into a suitable sustained release system. Drugs of molecular
weight 500-700 finds no difficult in processing.
e) Drug stability: It should be significantly stable over an extended period of time
in the GIT. Generally non-potent drugs are more stable when formulated as
sustained release form. It should not show high degree of plasma protein binding.
Route of administration
Some routes of administration exert a negative influence on drug efficacy
especially during chronic administration. Many physiological constrains improved
by the particular route i.e., GI mobility, blood supply, first pass metabolism.
Biological properties
a) Absorption: Drugs that are slowly absorbed or adsorbed with variable
absorption rate are poor candidates for sustained release. It is assumed that the
GI transit time of 10-12 hrs, to be ideal for sustained release.
b) Metabolism: Rapid metabolism leads to poor formulation in extended release.
c) Distribution: Drugs with high apparent volumes of distribution which in turn
influences the rate of elimination for the drug are poor candidates for sustained
release.
d) Duration of action Drugs with short half-life and high doses impose a
constraint because of the dose size needed and those with a long half-life are
inherently sustained.

CHAPTER I INTRODUCTION
COLLEGE OF PHARMACY, MADURAI MEDICAL COLLEGE. Page 5
e) Therapeutic index Drugs with narrow therapeutic range require precise control
over the blood level of drug placing a constraint on sustained release.
f) Length of drug therapy Expected length of drug therapy to achieve control or
curve of ailment is an important factor, in design of control release products.
g) Disease state: Pathophysiological state of subject plays an important part in
the design of suitable controlled release delivery system.(Leon lachmann., et
al.,2002) and (Vyas S.P. and Roop.K., 2002)
Formulation Methods of Achieving Sustained Drug Release:
All sustained release formulations employ a chemical or physical barrier to
provide slow release of the maintenance dose. Many formulation techniques have
been used to ‘build’ the barrier into the per-oral dosage form. These techniques
include the use of coatings, embedding drugs in a wax, fat or plastic matrix,
microencapsulation, chemical binding to ion-exchange resins and incorporation in
an osmotic pump. The initial rapidly releasing priming dose of drug may be
provided by incorporating that portion of the drug in a separate rapidly releasing
form in the dosage form, for instance, as uncoated, rapidly releasing granules or
pellets along with coated, slowly releasing granules or pellets in a tablet or hard
gelatin capsule dosage form.
Alternatively, immediate and rapid release of the priming dose has been
achieved by virtue of the position of that portion of the drug being at the surface of
a porous wax or plastic matrix. The maintenance dose is provided by drug
embedded deeper in the porous matrix.

CHAPTER I INTRODUCTION
COLLEGE OF PHARMACY, MADURAI MEDICAL COLLEGE. Page 6
Figure 1.Characteristic representation of plasma concentrations of a
conventional immediate release dosage form (IR), a sustained release
dosage form (SR) and an idealized zero-order controlled release (ZOCR)
dosage form (in combination with a start-up dose).
A repeat action tablet may be distinguished from its sustained release
counterpart by the fact that the repeat action product does not release the drug
contained therein in a slow controlled manner and consequently doesn’t give a
plasma concentration-time curve which resembles that of sustained release
product9. A repeat action tablet usually contains two doses of drug, the first dose
being released immediately following per-oral administration in order to provide a
rapid onset of the therapeutic response. The release of the second dose is
delayed, usually by means of an enteric coat. Consequently when the enteric coat
surrounding the second dose is breached by the intestinal fluids, the second dose
is released immediately. (Lee V.H. and Robinson J.P.,1987)
Classification
From a mathematical-modeling point of view, sustained-release systems may
be classified according to the controlling physical mechanism(s) of release of the
incorporated drug. We have proposed a convenient method based on the
mechanism of transport for categorizing them as diffusion-controlled, swelling
controlled, osmotically controlled, and chemically controlled systems. Sustained
release of drugs, proteins, and other bioactive agents can be achieved by
incorporating them either in dissolved or dispersed form in polymers.

CHAPTER I INTRODUCTION
COLLEGE OF PHARMACY, MADURAI MEDICAL COLLEGE. Page 7
Diffusion-Controlled drug delivery system: Diffusion is the most common
mechanism for controlling the release. There are two major types of diffusion-
controlled systems; reservoir devices and membrane devices. Drug release from
each type of system occurs by diffusion through the macromolecular mesh or
through the water-filled pores.
a) Reservoir systems
Reservoir systems consist of a polymeric membrane surrounding a core
containing the drug. The rate-limiting step for drug release is diffusions through the
outer membrane of the device. To maintain a constant release rate or flux of drug
from the reservoir, the concentration difference must remain constant. This can be
achieved by designing a device with excess solid drug in the core. Under these
conditions, the internal solution in the core remains saturated. This type of device
is an extremely useful device as it allows for time - independent of zero-order
release. The major drawback of this type of drug delivery system is the potential
for catastrophic failure of the device.
b) Matrix system
In matrix devices, the drug is dispersed throughout the three-dimensional
structure of the polymer. Release occurs due to diffusion of the drug throughout
the macromolecular mesh or water-filled pores. In these systems, the release rate
is proportional to time to the one-half power. This is significant in that it is
impossible to obtain time independent of zero-order release in this type of system
with simple geometries.
C) Swelling –Controlled release systems: In swelling-controlled release
systems, the drug is dispersed within a glassy polymer. Upon contact with
biological fluid, the polymer begins to swell. No drug diffusion occurs through the
polymer phase. As the penetrant enters the glassy polymer, the glass transition
temperature of the polymer is lowered allowing for relaxations of the
macromolecular chains. The drug is able to diffuse out of the swollen, rubbery
area of the polymers. This type of system is characterized by two moving fronts:

CHAPTER I INTRODUCTION
COLLEGE OF PHARMACY, MADURAI MEDICAL COLLEGE. Page 8
the front separating the swollen (rubbery) portion and the glassy regions which
moves with velocity, υ, and the polymer-fluid interface. The rate of drug release is
controlled by the velocity and position of the front dividing the glassy and rubbery
portions of the polymer.
For true swelling-controlled release systems, the diffusion exponent, n, is 1.
This type of transport is known as Case II transport and results in zero-order
release kinetics. However, in some cases, drug release occurs due to a
combination of macromolecular relaxations and Fickian diffusion. In this case, the
diffusion exponent is between 0.5 and 1. This type of transport is known as
anomalous or non-Fickian transport.
d) Chemically-Controlled release systems
There are two major types of chemically controlled release systems: erodible
drug delivery systems, and pendent chain systems in erodible systems, drug
release occurs due to degradation or dissolution of the polymer. In pendent chain
systems, the drug is affixed to the polymer backbone through degradable linkages.
As these linkages degrade, the drug is released.
e) Erodible drug delivery systems: Erodible drug delivery systems, also known
as degradable or absorbable release systems, can be either matrix or reservoir
delivery systems. In reservoir devices, an erodible membrane surrounds the drug
core. If the membrane erodes significantly after the drug release is complete, the
dominant mechanism for release would be diffusion. Predictable, zero-order
release could be obtained with these systems. In some cases, the erosion of the
membrane occurs simultaneously with the drug release. As the membrane
thickness decreased due to erosion, the drug delivery rate would also change.
Finally in some erodible reservoir devices, the drug diffusion in the outer
membrane does not occur. Under these conditions, drug release does not occur
until the outer membrane erodes completely. In this type of device, the entire
contents are released in a single, rapid burst.

CHAPTER I INTRODUCTION
COLLEGE OF PHARMACY, MADURAI MEDICAL COLLEGE. Page 9
For erodible matrix devices, the drug is dispersed within the three-dimensional
structure of the polymer. Drug release is controlled by drug diffusion through the
gel of erosion of the polymer. In true erosion-controlled devices, the rate of drug
diffusion is significantly slower than the rate of polymer erosion, and the drug is
released as the polymer erodes.
Environmentally responsive systems
Environmentally responsive materials show drastic changes in their swelling
ratio due to changes in their external pH, temperature, ionic strength, nature and
composition of the swelling agent, enzymatic or chemical reaction, and Electrical
or magnetic stimulus In most responsive networks, a critical point exists at which
this transition occurs. Responsive materials are unique in that there are many
different mechanisms for drug release and many different types of release
systems based on these materials. For instance, in the most cases drug release
occurs when the gel is highly swollen and is typically controlled by gel swelling,
drug diffusion, or a coupling of swelling and diffusion. However, in a few instances,
drug release occurs during gel syneresis by a squeezing mechanism. Also, drug
release can occur due to erosion of the polymer caused by environmentally
responsive swelling. Another interesting characteristic about many responsive gels
is that the mechanism causing the network structural changes can be entirely
reversible in nature.
The ability of these materials to exhibit rapid changes in their swelling behavior
and pore structure in response to changes in environmental conditions lends these
materials favorable characteristics as carriers for bioactive agents, including
peptides and proteins. This type of behavior may allow these materials to serve as
self-regulated, pulsatile drug delivery system.
Initially, the gel is in an environment in which no swelling occurs. As a result,
very little drug release occurs. However, when the environment changes and the
gel swells rapid drug release occurs (either by Fickian diffusion, anomalous
transport, or Case II transport). When the gel collapses as the environment

CHAPTER I INTRODUCTION
COLLEGE OF PHARMACY, MADURAI MEDICAL COLLEGE. Page 10
changes, the release can be turned off again. This can be repeated over
numerous cycles. Such systems could be of extreme importance in the treatment
of chronic diseases such as diabetes. . (Lee V.H. and Robinson J.P.,1987)
DIABETES:
Diabetes Mellitus (DM), often simply referred to as diabetes, is a group of
metabolic diseases in which a person is mainly characterized by hyperglycemia
either because of insulin deficiency or because of the resistance shown by the
cells to insulin produced in the body. It may also be characterized by glycosuria,
negative nitrogen balance, and sometimes ketonemia. This high blood sugar
produces the classical symptoms of polyuria (frequent urination), polydipsia
(increased thirst) and polyphagia (increased hunger). Diabetes Mellitus is
classified based on the cause or mode of treatments into the following types:
1. Insulin-dependent diabetes mellitus (IDDM)
2. Non-insulin-dependent diabetes mellitus (NIDDM)
3. Gestational diabetes mellitus (GDM)
4. Secondary to other conditions
A) Type I (or) Insulin-dependent diabetes mellitus:
Characterized by the body's failure to produce insulin due to the destruction
of β cells in the islets of langerhans, and requires the person to inject
insulin.formerly, it is known as "juvenile diabetes," because it represents a majority
of the cases in children, teenagers, or young adults, but it can also affect adults.
Type-1diabetes is mostly caused by autoimmune disorder AND develops because
the body immune system mistakenly destroys the beta cells in the islet tissue of
the pancreas that produce insulin due to environmental factors. For the treatment
of type I insulin must be given subcutaneously or by injecting through any other
novel routs of administration.

CHAPTER I INTRODUCTION
COLLEGE OF PHARMACY, MADURAI MEDICAL COLLEGE. Page 11
B) Type II (or)Non-insulin-dependent diabetes mellitus:
Characterized by insulin resistance, a condition in which cells fail to use
insulin properly, sometimes combined with an absolute insulin deficiency. People
can develop type 2 diabetes at any age even during childhood. This form of
diabetes usually occurs because of abnormality in gluco receptor of β cells,
Reduced sensitivity of peripheral tissues to insulin, Excess of hyperglycemic
hormones.Insulin is not sufficient for the treatment of type II diabetes.
C) Secondary to other conditions
Diabetes occurring as secondary to the conditions like Pancreatic disease,
hormonal disease, Drug or chemical exposure, Insulin receptor abnormalities,
certain genetic syndromes.
Signs and Symptoms :
The classical symptoms of diabetes are,
Polyuria (frequent urination),
Polydipsia (increased thirst)
Polyphagia (increased hunger).
Diabetic ketoacidosis.
Management
Diabetes mellitus is a chronic disease which cannot be cured except in very
specific situations. Management keeps blood sugar levels as close to normal as
possible, without causing hypoglycemia. This can usually be accomplished
withdiet, exercise, and use of appropriate medications (insulin in the case of type
1diabetes, oral antidiabetec medications as well as possibly insulin in type
2diabetes.
CHAPTER I INTRODUCTION
COLLEGE OF PHARMACY, MADURAI MEDICAL COLLEGE. Page 12
Novel Oral Antidiabetecs
Dipeptidyl Peptidase (DPP)-4 Inhibitors
DPP4 inhibitors such as Sitagliptin and Vildagliptin are novel agents for treatment
of type 2 diabetes. They work by improving β-cell sensitivity to glucose, where by it
increases glucose-dependent insulin secretion. Gliptins can be used as Mono
therapy or combined with metformin or sulfonyl ureas.. Gliptins are largely weight
neutral.
Examples: Sitagliptin, Vidagliptin.
MICROENCAPSULTION:
Microencapsulation is a process whereby small discrete solid particles or small
liquid droplets are surrounded and enclosed by an intact shell. Microencapsulation
is used to modify and delayed drug release form pharmaceutical dosage forms. A
well designed controlled drug delivery system can overcome some of the problems
of conventional therapy and enhance the therapeutic efficacy of a particular drug.
It is the reliable means to deliver the drug to the target site with specificity, if
modified, and to maintain the desired concentration at the site of interest without
untoward effects.
Microspheres received much attention not only for prolonged release, but
also for targeting of anticancer drugs to the tumor. The intent of the paper is to
highlight the potential of microencapsulation technique as a vital technique in
novel drug delivery.
The Reasons for Microencapsulation
The reasons for microencapsulation are in some countless cases, the core
must be isolated from its surroundings, as in vitamins from the deterioration a
volatile core, improving the handling of a sticky material, or isolation core from
chemical a attack. The problem may be as simple as masking the taste or odor of

CHAPTER I INTRODUCTION
COLLEGE OF PHARMACY, MADURAI MEDICAL COLLEGE. Page 13
the core, or as complex as increasing the selectivity of an adsorption or extraction
process.
Fundamental Considerations
The realization of the potential that microencapsulation offers involves a
basic understanding of the general properties of microcapsules, such as the
nature of the core and coating materials, the stability and release characteristics of
the coated materials and the microencapsulation methods.
Core Material
The core material, defined as the specific material to be coated, can be
liquid or solid in nature. The composition of the core material can be varied as the
liquid core can include dispersed and/or dissolved material. The solid core can be
mixture of active constituents, stabilizers, diluents, excipients and release-rate
retardants or accelerators. The ability to vary the core materials composition
provides definite flexibility and utilization of this characteristic often allows effectual
design and development of the desired microcapsules properties.
Coating Material
The selection of appropriate coating material decides the physical and
chemical properties of the resultant microcapsules/microspheres.
FIGURE-2 Encapsulation

CHAPTER I INTRODUCTION
COLLEGE OF PHARMACY, MADURAI MEDICAL COLLEGE. Page 14
While selecting a polymer the product requirements i.e. stabilization,
reduced volatility, release characteristics, environmental conditions, etc. should be
taken into consideration. The polymer should be capable of forming a film that is
cohesive with the core material. It should be chemically compatible, non-reactive
with the core material and provide the desired coating properties such as strength,
flexibility, impermeability, optical properties and stability. Generally hydrophilic
polymers, hydrophobic polymers (or) a combination both are used for the
microencapsulation process. A number of coating materials gelatin have been
used successfully; examples of these include polyvinyl alcohol, ethyl cellulose,
cellulose acetate phthalate and styrene maleic anhydride. The film thickness can
be varied considerably depending on the surface area of the material to be coated
and other physical characteristics of the system. The microcapsules may consist
of a single particle or clusters of particles. After isolation from the liquid
manufacturing vehicle and drying, the material appears as a free flowing powder.
The powder is suitable for formulation as compressed tablets, hard gelatin
capsules, suspensions, and other dosage forms. ( C. Berkland., 2001)
Multi-particulate Drug Delivery Systems:
Multi-particulate drug delivery system applies specially to multiple particles
such as pellets, beads, microspheres, microcapsules. In recent years, multi-
particulate dosage forms or microparticles have gained in popularity for a variety of
reasons. Considerable research efforts have been spent on oral sustained or
controlled release multi-particulate drug delivery system due to its advantages
over monolithic dosage forms.
Multi-particulate drug delivery systems are mainly oral dosage forms
consisting of a multiplicity of small discrete units, each exhibit some desired
characteristics. In these systems, the dosage of the drug substances is divided on
a plurality of subunit, typically consisting of thousands of spherical particles with
diameter of 0.05-2.00mm.

CHAPTER I INTRODUCTION
COLLEGE OF PHARMACY, MADURAI MEDICAL COLLEGE. Page 15
Thus multi-particulate dosage forms are pharmaceutical formulations in
which the active substance is present as a number of small independent subunits.
To deliver the recommended total dose, these subunits are filled into a sachet and
encapsulated or compressed into a tablet. ( C. Berkland., 2001)

CHAPTER – II
MICROSPHERES-
A REVIEW

CHAPTER II MICROSPHERES – A REVIEW
COLLEGE OF PHARMACY, MADURAI MEDICAL COLLEGE. Page 16
MICROSPHERES – A REVIEW
INTRODUCTION OF MICROSPHERES
Introduction:
An ideal controlled drug delivery system is the one which delivers the drug at a
predetermined rate, locally or systemically, for a specified period of time. The
concept of miroencapsulation was initially utilized in carbonless copy papers. More
recently it has received increasing attention in pharmaceutical and biomedical
applications. The first research leading to the development of micro-encapsulation
procedures for pharmaceuticals was published by Bungenburg de Jong and Kass
in 1931 and dealt with the preparation of gelatin spheres and the use of gelatin
coacervation process for coating. In the late 1930s, Green and co-workers of
National cash register co. Dayton, Ohio, developed the gelatin coacervation
process. Since then may other coating materials and processes of application
have been developed by the pharmaceutical industry for the Microsphere of
medicines. Over the last 25 years numerous patents have been taken out by
pharmaceutical companies for microencapsulated drugs. Microsphere is a rapidly
expanding technology. As a process, it is a means of applying relatively thin
coating to small particles of solids or droplets of liquids and
dispersions.( Lachmann.L and Lieberman.H.A.,1987)
Microspheres are defined as ‘solid spherical particles containing dispersed
drug in either solution or microcrystalline form.’ They are ranging in size from 1 to
1000 micrometer. Microspheres are in strict sense, spherical solid particles.
Microcapsules are small particles that contains an active agent as a core material
and coating agent as shell, at present there is no universally accepted size range
that particle must have in order to be classified as microcapsules. However, many
workers classify capsules smaller than 1 micrometer as nanocapsules and
capsules layer more than 1000 micrometer as macroparticles. Commercial
microcapsules typically have a diameter between 3-80 micrometer and contain 10-
90 weight % cores. Microsphere is a rapidly expanding technology. It is the

CHAPTER II MICROSPHERES – A REVIEW
COLLEGE OF PHARMACY, MADURAI MEDICAL COLLEGE. Page 17
process of applying relatively thin coatings to small particles of solids or droplets of
liquids and dispersions. Microsphere provides the means of converting liquids to
solids, of altering colloidal and surface properties, of providing environmental
protection and of controlling the release characteristics or availability of coated
materials(Chien YW.,1990)and(Asha P..,2006). Microsphere is receiving
considerable attention fundamentally, developmentally and commercially.
However the terms microcapsule and microspheres are often used synonymously.
The microspheres are characteristically free flowing powders consisting of proteins
or synthetic polymers, which are biodegradable in nature, and ideally having a
particle size less than 200 micrometer. Solid biodegradable microcapsules
incorporating a drug dispersed or dissolved throughout the particle matrix have the
potential for the controlled release of drug.
Figure-3 (Microencapsulation core material)
A wide range of core materials have been encapsulated including adhesives,
agrochemicals, live cells, active enzymes, flavor fragrances, pharmaceuticals, and
inks. Most capsule shell materials are organics, polymers, but fats and waxes are
also used. Microcapsules can have a variety of structures some have a spherical
geometry with a continuous core region surrounded by a continuous shell as other
have an irregular geometry and contain a number of small droplets as particles of
core material. Microcapsules are used in a wide range of oral and injected drug
formulation. Encapsulated adhesive resins coated on automotive fasteners are
routinely used to assure that such fasteners are firmly set when installed.
Microcapsules are also the basis for a number of long acting commercial
CHAPTER II MICROSPHERES – A REVIEW
COLLEGE OF PHARMACY, MADURAI MEDICAL COLLEGE. Page 18
pesticides and herbicides. Improvement of these products and development of
new ones is an ongoing process that involves a large number of development
groups globally.
Merits of Microsphere:
Microsphere offers the ability to do the following.
1. Microsphere change liquid to solid (powder as particles.) E.g.
Clofibrate.
2. Microsphere separate reactive materials from one another and
handle them in a mix. As store them for a long time. E.g. Mix of
Aspirin and Chlorfilaramine.
3. Microsphere curtails any color, taste, odor or toxicity generates by
core materials.
4. Microsphere protects materials from environment for examples by
preventing oxidization. E.g. Vitamin A Palmitate.
5. Microsphere improves the effective life.
6. Microsphere holds a liquid on a flat surface by in effect, changing it
to a solid.
7. Microsphere controls the releasing conditions. For example, we can
control the timing of dissolving, volatilization, coloring, release of
smell, mixing and reaction by changing the size of the capsules, the
ratio of core materials to shell materials, or the properties of the shell
materials, such as strength and permeability or by adding
supplementary materials to core or shell materials.
8. Microsphere changes the specific gravity.
9. Microspheres make core materials easy to handle.
10. Microspheres solidify tacky materials and increase its fluidity. E.g.
thiamine HCL, riboflavin
11. Microspheres are normally used to enhance material stability, reduce
adverse or toxic effects as extend material release for different
applications in various fields of manufacturing.
CHAPTER II MICROSPHERES – A REVIEW
COLLEGE OF PHARMACY, MADURAI MEDICAL COLLEGE. Page 19
Demerits of Microsphere:
1. Drug entrapment is low because some portion of drug is lost in the
dispersion vehicle.
2. The industrial scale of microspheres formulation is difficult because
to maintain size of microspheres at industry level is difficult.
3. The manufacturing of microspheres involves use of solvents which
make the process costly.
4. As compared to the extended release tablets and capsules, the
manufacturing of microspheres is much more complicated.
5. Time consuming process as much time period for required for
emulsification, vaporization of solvent and rigidization of
microspheres.
Prerequisites for Ideal Microparticulate Carriers
The materials utilized for the preparation of microparticulates should ideally fulfill
the following prerequisites:
o Longer duration of action
o Control of content release
o Increase of therapeutic efficiency
o Protection of drug
o Reduction of toxicity
o Biocompatibility
o Sterilizability
o Relative stability
o Water solubility or dispersability
o Bioresorbability
o Targetability
o Polyvalent
Fundamental Consideration:
Microsphere often involves a basic understanding of the general properties of
microcapsules, such as the nature of the core and coating materials, the stability

CHAPTER II MICROSPHERES – A REVIEW
COLLEGE OF PHARMACY, MADURAI MEDICAL COLLEGE. Page 20
and release characteristics of the coated materials and the Microsphere methods.
The intended physical characters of the encapsulated product and the intended
use of the final product must also be considered. (Leon Lachman et.al)
A.Core material
The core material, defined as the specific material to be coated, can be liquid or
solid in nature. The composition of the core material can be varied as the liquid
core can include dispersed and/or dissolved material. The solid core can be a
mixture of active constituents, stabilizers, diluents, excipients and release rate
retardants or accelerators. The core material plays a significant role in the
production of microcapsules the core material defined as the specific material to
be coated, can be liquid or solid in nature. It dictates the process as well as the
polymer used as the coating material. It should be insoluble and non reactive with
the coating material and the solvent for it water soluble and insoluble solid, water
insoluble liquid solution and dispersions of liquids can be microencapsulated.
B. Coating material:
Coating material should be capable of forming a film that is cohesive with
the core materials, be chemically compatible and non reactive with the core
material and provide the desired coating properties such as strength, flexibility
impermeability, optical properties and stability. The total thickness of the coatings
achieved with Microsphere techniques is microscopic in size. The selection of the
appropriate coating material dictates, to major degree, the resultant physical &
chemical properties of the microcapsules, and consequently, this selection must
be given due consideration. The coating material should be capable of forming a
film that is cohesive with the core material; be chemically compatible and non-
compatible and non reactive with the core material; and provide the desired
coating properties, such as strength, flexibility, impermeability, optical properties
and stability. The coatings materials used in Microsphere methods are available;
to some extend, to in-situ modification. For example, colorants may be added to
achieve product elegance or masking, or coatings may be plasticized or

CHAPTER II MICROSPHERES – A REVIEW
COLLEGE OF PHARMACY, MADURAI MEDICAL COLLEGE. Page 21
chemically altered through cross-linking, for instance to achieve controlled
dissolution or permeability. (Jackson. And Lee, 1991).
C. Selected stability, release and other properties
Three important areas of current Microsphere application are the stabilization of
core materials, the control of the release or availability of core materials and
separation of chemically reactive ingredients within a tablet or powder mixture. A
wide variety of mechanisms is available to release encapsulated core materials;
such as disruption of the coating can occur by ressure, shear or abrasion forces,
permeability changes brought about enzymatically etc., improved gastro tolerability
of drugs can be obtained by Microsphere.
D. Physical character of the final product
Microcapsules should have desirable physical properties like ability to flow, to
be compacted or to be suspended and the capsule wall must be capable of
resisting the pressure during compression etc.

CHAPTER II MICROSPHERES – A REVIEW
COLLEGE OF PHARMACY, MADURAI MEDICAL COLLEGE. Page 22
TABLE-1 TYPES OF COATING MATERIALS USED TO PRODUCE
MICROSPHERE
Class of coating material Examples
Gums Gum Arabica, Agar, Sodium alginate,
Carageenan.
Carbohydrates Starch, Agarose, Sucrose, Dextran,
Corn syrup, Chitoson.
Cellulose Carboxy methyl cellulose, Methyl
cellulose, Ethyl cellulose, Nitro
cellulose, Acetyl cellulose, Cellulose
acetate phthalate.
Lipids Wax, Paraffin, Stearic acid, Bees wax,
Oils, Fats, Hardened oil, Diglycerides,
Monoglycerides.
Inorganic materials Cellulose phosphate, Silicates, Clays.
Proteins Albumins, Gelatin, Collagen,
Casein, Gluten.
Chemically modified carbohydrate Poly (acryl) Dextran, Poly (acryl) starch.
Non-biodegradable AEROLEIN, Glycidyl methacrylate,
Epoxy polymers.
Bio-degradable Poly anhydrates, Poly alkyl cyno
acrylate, Lactides and glycosides and
their co-polymers.

CHAPTER II MICROSPHERES – A REVIEW
COLLEGE OF PHARMACY, MADURAI MEDICAL COLLEGE. Page 23
Application:
1. Microspheres as drug delivery system or protein and peptides.
2. Microspheres as drug delivery system in cancer therapy.
3. Microspheres as local delivery system.
4. Microspheres for targeting of drug.
5. Microspheres in oral drug delivery.
6. Sustained drug delivery to brain.
7. Drug delivery to thee long.
Methods of Preparation
1. Solvent removed technique,
(A)Emulsion – solvent evaporation technique.
i) Oil in water (o/w) emulsion solvent evaporation
ii) Water in oil (w/o) emulation solvent evaporation
iii) Water in oil in water oil water (W/O/W)
emulsion solvent evaporation
(B)Emulsion solvent extraction.
(C)Emulsion solvent diffusion.
2. Coacervation and phase separation technique
(A)By temperature change.
(B)By incompatible polymer addition.
(C)By non solvent addition
(D)By salt addition
(E)By polymer polymer interaction

CHAPTER II MICROSPHERES – A REVIEW
COLLEGE OF PHARMACY, MADURAI MEDICAL COLLEGE. Page 24
(F)By solvent evaporation
3. Cross – linking technique.
(A)Chemical cross linking.
(B)Thermal cross linking.
4. Polymerization Technique.
(A)Normal polymerization.
(B)Vinyl polymerization.
(C)Interfacial polymerization.
5. Spray drying and spray congealing
6. Freeze drying technique.
7. Precipitation technique.
8. Multi orifice centrifugal process
9. Pan coating.
10.Air suspension coating.
11.Melt dispersion technique.
1. Solvent Removed Technique
(A) Emulsion Solvent evaporation technique
This technique is based on the evaporation of the internal phase of an emulsion
by agitation.
O/W Emulsification:
This technique is particularly suitable for encapsulation of lipophilic active
principles such as steroid hormone, anti-inflammatory and neuroleptics.
CHAPTER II MICROSPHERES – A REVIEW
COLLEGE OF PHARMACY, MADURAI MEDICAL COLLEGE. Page 25
The physicochemical properties of the active principle such as partition
coefficient, its degree of ionization or its surfactant character play an important role
in its localization.
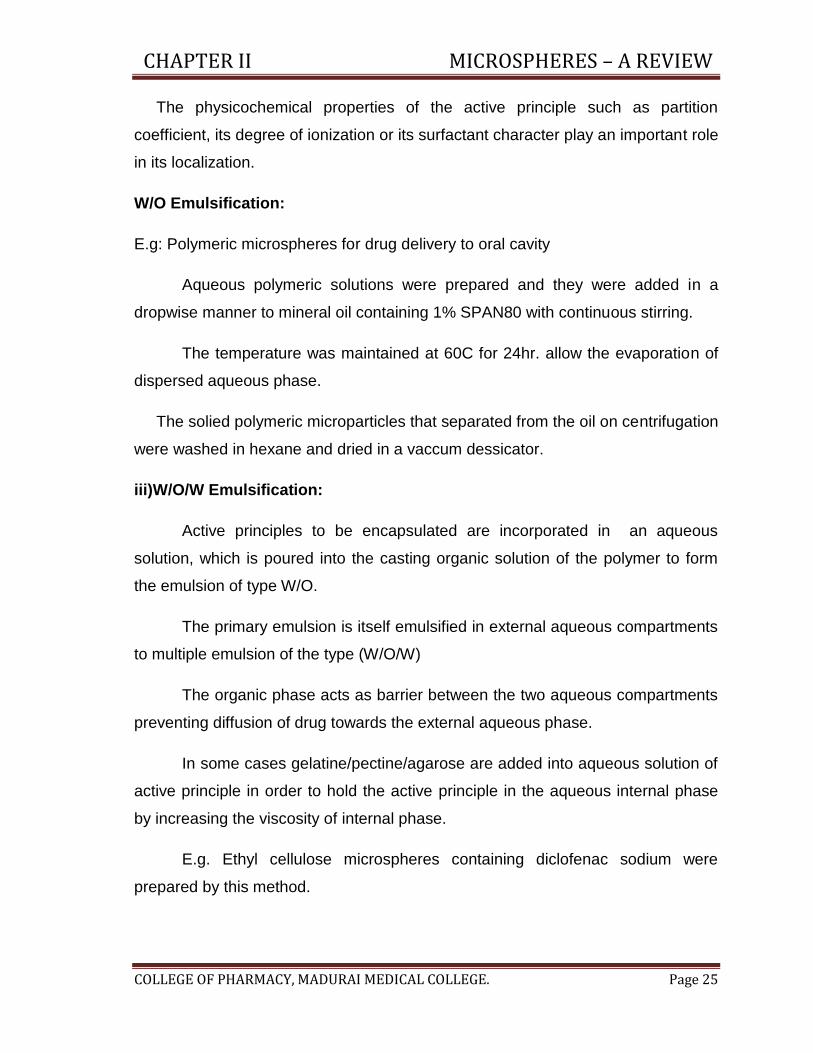
W/O Emulsification:
E.g: Polymeric microspheres for drug delivery to oral cavity
Aqueous polymeric solutions were prepared and they were added in a
dropwise manner to mineral oil containing 1% SPAN80 with continuous stirring.
The temperature was maintained at 60C for 24hr. allow the evaporation of
dispersed aqueous phase.
The solied polymeric microparticles that separated from the oil on centrifugation
were washed in hexane and dried in a vaccum dessicator.
iii)W/O/W Emulsification:
Active principles to be encapsulated are incorporated in an aqueous
solution, which is poured into the casting organic solution of the polymer to form
the emulsion of type W/O.
The primary emulsion is itself emulsified in external aqueous compartments
to multiple emulsion of the type (W/O/W)
The organic phase acts as barrier between the two aqueous compartments
preventing diffusion of drug towards the external aqueous phase.
In some cases gelatine/pectine/agarose are added into aqueous solution of
active principle in order to hold the active principle in the aqueous internal phase
by increasing the viscosity of internal phase.
E.g. Ethyl cellulose microspheres containing diclofenac sodium were
prepared by this method.
CHAPTER II MICROSPHERES – A REVIEW
COLLEGE OF PHARMACY, MADURAI MEDICAL COLLEGE. Page 26
Diclofenac sodium and gelatine were dissolved in water. The emulsion
obtained was poured in solution of PVA (Polyvinyl Alcohol) in water to make a
w/o/w emulsion and continuosly stirred. Microspheres were obtained.
(B)Emulsion Solvent Extraction Technique
In the emulsification-evaporation method, the organic solvent of dispered
phase of the emulsion is eliminated in two stages
Diffusion of the solvent in the continuous phase (Solvent extraction)
Elimination of the solvent at the continuous phase interphase.
In theory, if one uses a continuous phase, which will immediately extract the
solvent of the dispersed phase, the evaporation stage is no longer necessary in
formulation of microspherers. This can be achieved by Using large volume of
continuous phase with respect to the dispersed phase. (Eg. 5flouro uracil
biodegradable micropheres.) By using dispersed phase consisting of cosolvents,
of which at least one has a great affinity for the continuous phase. One may even
formulate a continuous phase with two solvents in which one act as solvents
extractor of the dispersed phase (Eg. PLG microspheres containing diphtheria
toxoid)
(C) Emulsion solvent diffusion :
The organic solution of drug and polymer is dispersed into aqueous
medium with constant stirring. During the process solvent first diffuses out and
then evaporating from the coacervate into the aqueous medium and forms the
microspheres. As compared to emulsion – solvent evaporation this method is
simple, quicker and does not required heat or any other harmful solvents.
2.Coacervation and Phase Separation Technique
The process is similar as for the preparation of microspheres. Microsphere
by coacervation phase separation is generally attributed to the national cash

CHAPTER II MICROSPHERES – A REVIEW
COLLEGE OF PHARMACY, MADURAI MEDICAL COLLEGE. Page 27
register (NCR) corporation and the patents of Green et.al. The general outline of
the processes consists of three steps carried out under continuous agitation.
1. Formation of three immiscible chemical phases.
2. Disposition of the coating, and
3. Rigidization of the coating
a. By thermal change:
Phase separation of the dissolved polymer occurs in the form of immiscible
liquid droplets, and if a core material is present in the system, under proper
polymer concentration, temperature and agitation conditions, the liquid polymer
droplets coalesce around the dispersed core material particles, thus forming the
embryonic microcapsules. As the temperature decreases, one phase becomes
polymer-poor (the Microsphere vehicle phase) and the second phase. (the coating
material phase) becomes polymer-rich.
b. By incompatible polymer addition:
It involves liquid phase separation of a polymers coating material and
Microsphere can be accomplished by utilizing the incompatibility of dissimilar
polymers existing in a common solvent.
c. By non-solvent addition:
A liquid that is a non-solvent for a given polymer can be added to a solution
of the polymer to induce phase separation. The resulting immiscible liquid polymer
can be utilized to effect Microsphere of an immiscible core material.
d. By salt addition:
There are two types of coacervation: simple and complex. Simple
coacervation involves the use of only one colloid, e.g. gelatin in water, and
involves removal of the associated water from around the dispersed colloid by
agents with a greater affinity for water, such as various alcohols and salts. The

CHAPTER II MICROSPHERES – A REVIEW
COLLEGE OF PHARMACY, MADURAI MEDICAL COLLEGE. Page 28
dehydrated molecules of polymer tend to aggregate with surrounding molecules to
form the coacervate. Complex coacervation involves the use of more than one
colloid. Gelatin and acacia in water are most frequently used, and the coacervation
is accomplished mainly by charge neutralization of the colloids carrying opposite
charges rather than by dehydration.
e. By polymer-polymer interaction:
The interaction of oppositely charged poly electrolytes can result in the
formation of a complex having such reduce solubility that phase separation occurs.
f. By solvent evaporation:
The processes are carried out in a liquid manufacturing vehicle. The
microcapsule coating is dispersed in a volatile solvent, which is dispersed in
volatile solvents, which is immiscible with the liquid manufacturing vehicle phase.
A core material to be microencapsulated is dissolved or dispersed in the coating
polymer solution. With agitation, the core material mixture is dispersed in the liquid
manufacturing vehicle phase to obtain the appropriate size microcapsule. The
mixture is then heated if necessary to evaporate the solvent for the polymer. In the
case in which the core material is dissolved in the coating polymer solution, matrix
type microcapsules are formed. The solvent evaporation technique to product
microcapsules is applicable to a wide variety of core materials. The core materials
may be either water soluble or water insoluble materials.
3. Cross Linking Technique
By Chemical and Thermal Cross Linking Microspheres made from natural
polymers are made by cross linking process. This polymer includes Gelatin,
Albumin, Starch,
Dextran In thos technique w/o emulsion is prepared, where Water phase is
a solution of polymer containing the drug to be incorporated. Oily phase is a
suitable vegetable oil or oil-mixture containing an oil soluble emulsifier. Once the
desired emulsion is formed, the water-soluble polymer is solidified by some kind of

CHAPTER II MICROSPHERES – A REVIEW
COLLEGE OF PHARMACY, MADURAI MEDICAL COLLEGE. Page 29
cross-linking process. This may involve thermal treatment or addition of a cross-
linking agent such as glutaraldehyde to form a stable chemical cross-link as in
albumin. Eg: Albumin, Chitosan beads prepared by heat stabilization method.
Theophylline was used as drug. Chemical interactions between the drug, albumin
and chitosan were evaluated using IR and HPLC. It was found that there was no
intervention between them. Microspheres with different drug ratios were prepared
and thermally cross-linked. Invitro release studies were carried out for a period of
8 hour and compared with pure drug. The microsphere containing 1:1:2 Drug:
albumin: Chitosan ratio showed maximum release & highest drug entrapment.
4. Polymerization Technique
(A) Normal Polymerization:
The two processes are carried out in a liquied phase. Normal
polymerization processed and carried out using different techniques as bulk,
suspension, precipitation, emulsion and miceller polymerization processes.
i) In Bulk Polymerization, a monomer or a mixture of monomer along with the
initiator is usually heated to initiate the polymerization and carry out the process.
The catalyst or the initiator is added to the reaction mixture to facilitate or
accelerate the rate of the reaction. The polymer so obtained may be moulded or
fragmented as microspheres. For loading of drug, adsorptive drug loading or
adding drug during the process of polymerization may be opted.
ii) The suspension polymerization, which is also referred to as the bead or pearl
polymerization is carried out by heating the monomer or mixture of monomers with
active principles(drugs) as droplets dispersion in a continuous aqueous phase..
The droplets may also contain an initiator and other additives.
iii) The emulsion polymerization differs from the suspension polymerization as due
to presence of the initiator in the aqueous phase, which later on diffuses to the
surface of the micelles or the emulsion globules. The bulk polymerization has an
advantage of formation of the pure polymer, but it also suffers a disadvantage, as

CHAPTER II MICROSPHERES – A REVIEW
COLLEGE OF PHARMACY, MADURAI MEDICAL COLLEGE. Page 30
it is very difficult to dissipate the heat of reaction, which can adversely affect the
thermo labile active ingredients. On the other hand the suspension and emulsion
polymerization can be carried out at lower temperature, since continuous external
phases is normally water through which heat can easily dissipate. The two
processes also lead to the formation of the higher molecular weight polymer at
relatively faster rate. The major disadvantage of suspension and emulsion
polymerization is, association of polymer with the unreacted monomer and other
additives.
(B) Vinyl polymerization:
Vinyl monomers are polymerized. The microspheres are formed using
techniques such as suspension, emulsion, soap less emulsion, dispersion and
precipitation, seeding and support polymerization. Drug was incorporated within
the monomers at the initial stage.
(C) Interfacial Polymerization:
Two complementary monomers are taken in a two-phase system and one
of the phases is dispersed as droplets in another phase, drug is incorporated in
any one phase and microsphere is obtained when condensation of monomers
takes place at interface.
5. Spray Drying and Spray Congealing Method:
Nebulization or spray drying is widely used in the chemical,
pharmaceauticaland food industries. The principle of spray drying rests on
atomization of a solution by compressed air or nitrogen through a dessicating
chamber and drying across a current if warm air.Laboratory spray dryer have
(1) Drying air inlet + filtration
(2) Heating
(3) Desiccation chamber
(4) Cyclone
(5) Collector for drying power microspheres

CHAPTER II MICROSPHERES – A REVIEW
COLLEGE OF PHARMACY, MADURAI MEDICAL COLLEGE. Page 31
(6) Filtration + air outlet.
(7) Solution, suspension, emulsion to spray
(8) Compressed or nitrogen air
(9) Spray nozzle (e.g., pneumatic, ultrasonic)
Four separate phases may be distinguished
1. Nebulization of the solution in the form of aerosol
2. Contact of the nebulized solution with the warm air
3. Drying of the aerosol
4. Separation of the diried product and air charged with the solvent Spray
Congealing:
Microsphere by spray congealing can be accomplished with spray drying
equipment when the protective coating is applied as a melt. General process
variables and conditions are quite similar to those already described, except thet
the core material is dispersed in a coating material melt rather than a coating
solution. Coating solidification (and Microsphere) is accomplished by spraying the
hot mixture into a cool air stream. Waxes, fatty acids and alcohols, polymers and
sugers, which are solids at room temperature but melt at reasonable temperature,
are applicable to spray congealing techniques.
Congealable Dispersed Phase Technique:
A heated aqueous drug solution can be dispersed in molten wax to form a
w/o emulsion which is emulsified in a heated external aqueous phase to form a
w/o/w emulsion. The system is cooled and the microspheres collected. Camuba
wax and beeswax can be used as coating materials. These wax-coated
microspheres have been successfully tableted. Another alternative is to rapidly
reduce the temperature when the primary emulsion is placed in the external
aqueous phase.

CHAPTER II MICROSPHERES – A REVIEW
COLLEGE OF PHARMACY, MADURAI MEDICAL COLLEGE. Page 32
6. Freeze Drying:
The freezing of the emulsion is done, the relative freezing points of
continuous and dispersed phases are important. The continuous phase solvent is
usually organic and is removed by sublimation at low temperature and pressure.
7. Precipitation Technique
The emulsion consists of polar droplets dispersed in non-polar
medium.Solvent may be removed from the droplets by use of a cosolvent. The
resultant increase in the polymer drug concentration causes a precipitation forming
a suspension. Microsphere by Precipitation / Gelation of Na-alginate
Eg: Glipizide microspheres with a coat consisting of alginate and a
mucoadhessive polymer such as sodium carboxy-methylcellulose,
methylcellulose, carbopol and hydroxyl propyl-methylcellulose, were prepared by
an orifice-ionic gelation process. Glipizide release from alginate-carbopol
mucoadhessive microspheres was slow and extended over long period(14hr.) of
time and depended on the composition of coat of the microspheres.
8. Multiorifice – centrifugal process
The South-West research institute (SWRI) has developed a mechanical
process for producing microcapsules that utilizes centrifugal forces to hurl, a core
material particle through an enveloping Microsphere membrane therapy effecting
mechanical Microsphere. Processing variables include the rotational speed of the
cylinder, the flow rate of the core and coating materials, the concentration and
viscosity of the coating material and the viscosity and surface tension of the core
material. This method is capable of microencapsulating liquids and solids of varied
size ranges, with diverse coating materials.
9. Pan coating:
The microcapsulation of relatively large particles by pan coating method
has become wide spread in the pharmaceutical industry and solid particles greater

CHAPTER II MICROSPHERES – A REVIEW
COLLEGE OF PHARMACY, MADURAI MEDICAL COLLEGE. Page 33
than 600 µg in size are generally considered essential for effective coating. The
coating is applied as a solution or as an automized spray to the desired solid core
passed over the coated materials during coatings are being applied in the coating
pans.
10. Air-suspension coating:
Air-suspension coating of particles by solutions or melts gives better control
and flexibility. The particles are coated while suspended in an upward-moving air
stream. They are supported by a perforated plate having different patterns of holes
inside and outside a cylindrical insert. Just sufficient air is permitted to rise through
the outer annular space to fluidize the settling particles. Most of the rising air
(usually heated) flows inside the cylinder, causing the particles to rise rapidly. At
the top, as the air stream diverges and slows, they settle back onto the outer bed
and move downward to repeat the cycle. The particles pass through the inner
cylinder many times in a few minutes.
11. Melt-dispersion technique:
In this technique the coating material is melted by heating upto 80oC. The
drug is suspended in it and then emulsified in water containing emulsifying agent
at 80oC under stirring. Microcapsules are formed as the temperature of the system
reaches to room temperature.
Evaluation of Microspheres:
The characterization of microcapsule carrier is an important phenomenon,
which helps to design a suitable carrier for the proteins, drug or antigen delivery.
The parameters that are generally evaluated for characterization of microcapsules
are:
1. Microsphere morphology
2. Microsphere size and shape
3. Drug content or drug loading
4. Mass loss and degree of hydration

CHAPTER II MICROSPHERES – A REVIEW
COLLEGE OF PHARMACY, MADURAI MEDICAL COLLEGE. Page 34
5. In-Vitro drug release study
6. Density determination.
7. Iso electric point.
8. Capture efficiency.
9. Contact angle.
1. Microsphere morphology:
The internal and external morphologies of microspheres were visualized using
SEM (Scanning electron Microscopy), Electron microscopy, and Scanning
tunneling microscopy. Fourier transforms Raman spectroscopy or X-ray
photoelectron spectroscopy may be used to determine if any of the material which
should have been entrapped is present on the surface and if any other
contaminates are present. Other surface characterization techniques include
surface charge analysis using microelectronphoresis.Surface charge can provide
information regarding microspheres aggregation. Surface charge is an important
parameter with respect to the interaction of microspheres within the body.
Following i.v Injection, microspheres can be taken by the macrophage or
monocyte cells present in the plasma; surface charge is one of the parameters,
which determines whether this takes place. Surface forces are important in the
entrapment, wetting and adhesion of core material by the coating material. The
wettability of solids by different liquids is assessed by contact angle
measurements. When wetting of core material is poor, it is difficult or impossible to
form microspheres
.2. Microsphere size
The most widely used procedure to visualize microcapsule are conventional
light microscopy, and Scanning electron microscopy (SEM). Both techniques can
be used to determine the shape and outer structure of microcapsule. SEM
provides higher resolution in contrast to the light microscopy. It allows investigation
of the microsphere surfaces and after particles are cross sectioned, it can also be

CHAPTER II MICROSPHERES – A REVIEW
COLLEGE OF PHARMACY, MADURAI MEDICAL COLLEGE. Page 35
used for the investigation of double walled systems. Confocal laser scanning
microscopy (CLSM) is applied as a nondestructive visualization technique, which
allows characterization of structures not only on surface, but also inside particle.
Different methods used are:
a. Light microscopy
b. Resistance blockage techniques (Coulter analysis)
c. Light blockage techniques
d. Light scattering
e. Laser diffraction analysis
Microscopic method For particles less than 1µm, photon correlation
spectroscopy is used. Average particle size is calculated from SEM
photomicrographs. The size distribution can be carried out by optical microscopy,
or using a Beckman-Coulter counter multisizer. A 100 micrometer orifice is
generally used and at least 50000 particles were counted for each sample. The
particle size distribution of the microspheres is also determined by laser scattering
instrument.
3. Drug loading or drug content
Differential scanning calorimetric and U.V. Spectrophotometric methods were
employed to verify the presence of drug in microspheres and its chemical stability.
The differential scanning calorimeter was used to obtain the thermograms of
various formulations.
Encapsulation Efficiency is defined as: E% = (La/Lt)*100
La = actual loading
Lt = Theoretical loading
4. Mass loss and degree of hydration:
The wet microspheres were weighed accurately (Wet wt. = Ww) dried for 48
hrs under reduced pressures at room temperature and weighted again. (dry wt. =
Wd)

CHAPTER II MICROSPHERES – A REVIEW
COLLEGE OF PHARMACY, MADURAI MEDICAL COLLEGE. Page 36
MR (%) = (Wd/Ww)*100
DH = (Ww – Wd) Wd
Where,
MR = Mass remaining,
DH = Degree of hydration,
Wd = dry weight,
Ww = Initial wt of microspheres
5. In vitro drug release
To find out the in vitro release the most commonly used techniques is as
follows: In vitro release profile of drug from microspheres is examined in
Phosphate buffer of pH 7.4 from 3-10 hr using the rotating basket method
specified in USP XX1 AT 100 rpm. Microspheres equivalent to 50mg of drug were
suspended in the dissolution medium and the medium was maintained at 37oC , 5
ml of samples were withdrawn periodically at intervals of half an hour ad same
volume of fresh medium was replaced in to the breaker. The concentration of drug
released at different time intervals was then determined by measuring the
absorbance using spectrophotometer.
6. Density determination
The density of the microcapsule can be measured by using a multi volume
pychnometer. Accurately weighed sample in a cup is placed in pychnometer,
helium is introduced at a constant pressure in chamber and allowed to expand.
The expansion results in a decrease in pressure within the chamber. From two
pressure readings the volume and hence density of microcapsule can be
determined.
7. Isoelectric point:
The micro electrophoresis is an apparatus used to measure electrophoretic
mobility of microsphere from which the isoelectric point can be determined. The

CHAPTER II MICROSPHERES – A REVIEW
COLLEGE OF PHARMACY, MADURAI MEDICAL COLLEGE. Page 37
electrophoretic mobility can be related to surface contained charge, ionisable
behavior or ion absorption nature of microsphere.
8. Capture efficiency
The capture efficiency of microcapsule or the percent drug entrapment can be
determined by allowing washed microcapsule to lyse. The lysate is then subjected
to determination of active constituents as per monograph. The percent
encapsulation efficiency is calculated using following equation
% Entrapment = actual content/theoretical content x 100
9. Contact angle
The angle of contact is measured to determine the wetting property of
microcapsule. It determines the nature of microsphere in terms of hydrophilicity or
hydrophobicity. The angle of contact is measured at the solid/air/water surface by
placing a droplet in circular cell mounted above the objective of inverted
microscope. Contact angle is measured at 20oC within a minute of decomposition
of microspheres.

CHAPTER – III
LITERATURE REVIEW

CHAPTER III LITERATURE REVIEW
COLLEGE OF PHARMACY, MADURAI MEDICAL COLLEGE. Page 38
LITERATURE REVIEW
[H. Abdul Rahman et al., 2017] prepared chitosan microspheres for the
delivery of chemotherapeutic agents, using paclitaxel as a model. Chitosan had
unique physiochemical and biological features that suggested as a good candidate
for the development of safe and effective drug delivery systems. The development
of formulations of targeted delivery systems for the chemotherapeutic agents like
paclitaxel can potentially alleviate the systemic cytotoxicity as well as directing
therapy to the specific lesions. The main aim of this work was to critically evaluate
the use of chitosan microspheres as a drug delivery system to enhance paclitaxel
distribution and efficacy in specific targeted sites. The medium molecular weight
of chitosan microspheres exhibited the highest paclitaxel dissolution rate because
of the highest aqueous perfusable microspheres, where 90% of the drug could be
released from the formulation and pH of the formulation and it was between 21-
83.7% then the cumulative release amount was increased within 24hours.
[Banasmita K., et al., 2017] formulated and evaluated metronidazole
microspheres-loaded bioadhesive vaginal gel to ensure longer residence time at
the infection site, providing a favourable release profile for the drug. Microspheres
were prepared by solvent evaporation method in various ratios of metronidazole to
poly-ε-caprolactone(PCL). The optimized batch of microspheres F4 showed
entrapment efficiency of 72.62%, solubility 1.5mg/ml, and partition coefficient of
0.12. Particle size of all the formulations was observed below 100µm. Regular
and spherical particles were observed in the SEM photomicrographs. The
optimized gel formulation G5 showed viscosity of 7538cps at 100 rpm, gel strength
recorded as 35 secobds for a 1000 mg load and spreadability of 4.6
g.cm/seconds. G5 showed 82.4%drug release at 10 hours and mucoadhesive
strength of 6.5±1.2 g. The study results suggested that metronidazole-loaded PCL
microspheres in mucoadhesive gel would provide a mean for sustained treatment
of vaginal infections.
CHAPTER III LITERATURE REVIEW
COLLEGE OF PHARMACY, MADURAI MEDICAL COLLEGE. Page 39
[Daniel G et al., 2017] designed and developed a novel sitagliptin-
loaded transdermal patch for diabetes treatment. Sitagliptin was formulated in a
gel-type reservoir on a transdermal patch device, optimized by a mathematical
simulation methodology, and experimentally validated in vitro using a franz cell
apparatus. The mathematical model determined optimal design parameters which
included 1% w/w acellulose as drug reservoir, transdermal patch rate control
membranes, 1.25 mM initial drug concentration, 2 mL initial volume, and 4.52 cm2
patch area. The optimized reservoir formulation was then fabricated in the
transdermal patch system and tested using Franz cell to validate the simulation.
The experimental results from the fabricated transdermal patch system indicated
that sitagliptin can be formulated in a patch to achieve the target effective plasma
drug concentration in less than one hour and is able to sustain glucose control for
over 24 hours.
[Bhagat BV., et al., 2016] formulated and evaluated the rifampicin loaded
microspheres by non-aqueous solvent evaporation method. Ethyl cellulose and
carboxy methyl cellulose were used as the retardant materials. The prepared
microspheres were red, free flowing and spherical in shape. It was observed that
the increase in concentration of the polymer, increases the mean particle size of
the microspheres. The mean particle size of the prepared microspheres was
found to be 40.14 ± 1.17 to 53.88 ± 2.1µm. The maximum yield of the
microspheres was found to be 87.27% and the encapsulation efficiency was found
to be 27%. In-vitro release studies indicated that the formulation F1 released
80.567% of rifampicin at the end of 12 hours. Thus the prepared microspheres
proved to be a potential candidate as a microparticulate drug delivery in this area
of patent novel.
[Hitesh K., et al., 2016] fabricated and characterized metformin
hydrochloride floating microspheres using Eudragit RS 100 as a retardant
polymer, by non-aqueous solvent evaporation method. The influence of
formulation factors on particle size, encapsulation efficiency and in vitro release
characteristics of the microspheres were investigated. SEM showed that the

CHAPTER III LITERATURE REVIEW
COLLEGE OF PHARMACY, MADURAI MEDICAL COLLEGE. Page 40
microspheres were spherical and smooth in texture. Drug entrapment efficiency
was found to increase with increase in polymer concentration. At 3:1 polymer:
drug ratio ES3, drug entrapment efficiency was found to be maximum 79.12%,
buoyancy of optimized formulation ES3 found to be 95% and they were in the size
range of 200-300 µm by all formulation. The in-vitro drug release profile was
biphasic with an initial burst release 19.23% in 1hour attributed to surface
associated drug, followed by a slower release phase, 83.27% drug release after
12 hours there was a sustained release of a drug at a constant rate.
[Ramya B and Krishna A., 2015]prepared and evaluated floating
microspheres of omeprazole by solvent evaporation method. Process parameters
such as stirring speed, stirring time and organic to aqueous phase ratio were
optimized. Floating microspheres were prepared by non-effervescent system.
Ethyl cellulose and Eudragit S 100 used as a swollen polymers. F4 formulation
showing highest entrapment efficiency, was found to be 96.8%, drug content was
60.9%. In a time period of 12 hours 70.3% of drug had been released from F10
formulation. The percentage of buoyancy was found to be 70.3%. From the
results , 1:30 drug to polymer ratio at 1:5 organic to aqueous phase ratio
omeprazole could be formulated with good entrapment efficiency, sustained
release property and highest percentage of buoyancy.
[Irin D., et al.,2015] formulated and evaluated glibenclamide microspheres
using different polymers such as ethyl cellulose, eudragit RS/RL 100 and
methocel K15 by non-aqueous solvent evaporation technique. The maximum and
minimum release of drug was observed 90.99% and 71.98%. Percent of actual
drug entrapment varied from 7.89% to 15.36% and percent of drug entrapment
efficiency varied from 69.23% to 98.21%. The in-vitro studies showed that after
the end of 8 hours of dissolution, the release drug from microspheres was 98.21%.

CHAPTER III LITERATURE REVIEW
COLLEGE OF PHARMACY, MADURAI MEDICAL COLLEGE. Page 41
[Prasanthi S., et al., 2015] formulated and evaluated sitagliptin phosphate
and simvastatin bilayered tablets by direct compression technique. Ten
formulations of sitagliptin phosphate and simvastatin bilayered tablets were
prepared by varying the ratios of polymers in the sitagliptin phosphate layer and
simvastatin layer F1 to F10 by direct compression technique. All the powdered
blends of formulations were evaluated for pre-compression parameters for flow
properties such as angle of repose, tapped density, compressibility index and post
compression parameters such as thickness, weight variation, friability, hardness,
drug content, in-vitro disintegration and dissolution studies and they were found to
be within USP limits. Among all formulations F7 was optimized as best
formulation. F7 formulaltion showed 97.23% for sitagliptin phosphate and
simvastatin 98.32%, maximum drug release at the end of 45 minutes.
[Tanvi P., et al.,2015] formulated and evaluated floating tablets of
sitagliptin phosphate prepared by employing different polymers like guar gum,
carbopol 940, and HPMC and magnesium stearate by effervescent technique.
Sodium bicarbonate and citric acid were incorporated as gas generating agent.
The tablets were produced by direct compression method. The floating tablets
were evaluated for uniformity of weight, hardness, friability, drug content, swelling
studies, dissolution studies, disintegration studies and stability studies. All the
prepared batches showed good results of in-vitro studies of tablets. It was aimed
to prepare for prolong residence in the stomach over conventional gastro-retentive
approaches.
[Sunita Shakya., 2015] formulated and optimized immediate release tablet
of sitagliptin phosphate using response surface methodology for the management
of type-II diabetes mellitus. Different formulations of immediate release were
prepared by applying 2 factor 2 level Central Composite Design using Minitab 16
which gave 13 formulations for each layer. The amount of Sodium Starch
Glycollate(SSG) and croscarmellose sodium in IR layer were used as independent
variables and the percent drug release at 15 minutes were selected as dependant
variables for optimization. Based on the in-vitro dissolution data, the composition

CHAPTER III LITERATURE REVIEW
COLLEGE OF PHARMACY, MADURAI MEDICAL COLLEGE. Page 42
of formulation with optimum drug release for immediate release were identified
and employed to formulate optimized tablets followed by its evaluation. All the
physico-chemical parameters of the tablets were found satisfactory. The
optimized sitagliptin phosphate IR tablet disintegrated in 14 seconds and showed
an initial release of sitagliptin 99.072% within 15 minutes.
[Alini D., et al., 2014] developed and validated the conditions for the
dissolution method for coated tablets based on in-vivo data for improving medium
sensitivity by investigating a possible in vivo- in vitro correlation. Several
parameters were tested to develop the method, and the following conditions were
considered satisfactory: pH 6.8 phosphate buffer, 900ml of dissolution medium,
temperature at 37 ± 1oc, paddle apparatus, and rotation speed at 50 rpm. The
dissolved percentage of sitagliptin was quantified by high performance liquid
chromatography. The method is linear in the range of 10.0-70.0 µg/ml, precise,
with RSD values less than 2%, and accurate. The dissolution method as
developed and validated supplied a good IVIVC when employing pH 6.8 phosphate
buffer medium, which can be used in quality control of sitagliptin coated tablets
since no official method has been described.
[Rashmi R., et al., 2014] developed and evaluated sustained release
microspheres of glibenclamide using ethyl cellulose N 100 as a rate retardant
polymer, by emulsion solvent evaporation method. SEM studies showed that the
microspheres were spherical and porous in nature, the mean particle size ranging
from 111.3 µm to 140.12µm. The batch EC5 showed highest drug entrapment
efficiency of about 82.33%. The in-vitro release studies revealed that the drug
release was sustained up to 24 hours. The in-vivo studies were performed in
healthy rabbits to analyze the floating efficiency of microspheres. Microspheres of
glibenclamide were prepared successfully and could help to manage better the
complications involved in type II diabetes.

CHAPTER III LITERATURE REVIEW
COLLEGE OF PHARMACY, MADURAI MEDICAL COLLEGE. Page 43
[Pavan Kumar and Sree Priya., et al., 2014] formulated and evaluated
floating microspheres of dextromethorphan hydrobromide by solvent evaporation
technique using polymers like ethyl cellulose and hydroxyl propyl methyl cellulose
in different ratios. The increased concentration of polymer affected the particle
size, percentage yield, in-vitro buoyancy and drug release from the microspheres.
Percentage yield of microspheres was found up to 71.16%. The formulated
microspheres were free flowing with good flow properties. SEM of optimized
formulation F3 confirmed spherical structure of microspheres with pores on the
rough surface and the particles were of the size range from 112-224 µm. The
floating microspheres of optimized formulation F3, exhibited the prolonged drug
release of 99.61% in sustained manner up to 12 hours and remain buoyant more
than 12 hours. The drug release mechanism from the floating microspheres was
found to be anamolus type(non-fickian diffusion) and followed Higuchi kinetics.
[Ramesh Y., et al., 2013] formulated and evaluated floating microspheres
of norfloxacin by non-aqueous solvent diffusion method using polymers hydroxyl
propyl methyl cellulose and ethyl cellulose. The SEM photographs of the
microspheres revealed that the microspheres were spherical with smooth surface
and slightly aggregated and size range was 340-425 µm. The formulation NF-XIII
showed highest percentage yield 98.5%, and highest entrapment efficiency 99%.
The buoyancy results indicated that all formulations floated for more than 12 hours
over the surface of the dissolution medium without any apparent gelation. The in-
vitro drug release revealed that batch NF-XIII was having 98.8% cumulative
release at the end of 10th hour when compared with all batches due to increase in
polymer concentration as seen in all formulation.
[Saudagar R B et al., 2013] formulated and evaluated sustained release
microspheres of Ropinirole hydrochloride using ethyl cellulose by w/o type
emulsion solvent evaporation technique and bees wax based microspheres was
prepared by spray drying technique. Thus the sustained release microsphere of
ropinirole hydrochloride for 12 hours were successfullu designed, optimized and
characterized by using potential polymers of ethyl cellulose and beeswax.

CHAPTER III LITERATURE REVIEW
COLLEGE OF PHARMACY, MADURAI MEDICAL COLLEGE. Page 44
[Navneet Garud and Akanksha., 2012] formulated metformin
microspheres by non-aqueous solvent evaporation method using various polymers
including ethyl cellulose, hydroxyl propyl methyl cellulose, carbopol 934P and
chitosan. The effect of process variables, viz, drug/polymer ratio, stirring rate and
type of polymer on the mean particle size, and drug release of the microspheres
were studied. It was observed that as the stirring speed increased from 600 to
1800 rpm, microsphere size decreased and hence drug release rate increased.
Drug release rate at 1:2 drug: polymer for microspheres produced at a stirring rate
of 1200 rpm was in the following order: carbopol 934P>HPMC>ethyl
cellulose>chitosan. The formulations containing carbopol 934P and HPMC
released drug faster than chitosan microspheres, Amongst the developed
microspheres, CH3 formulation exhibited maximum prolonged drug release at
gastrointestinal pH or at least 15 hours. This oral sustained metformin formulation
could potentially improve the bioavailability of the drug as well as patient
compliance.
[Manish D., et al., 2012] formulated and evaluated floating microspheres
of metformin hydrochloride using hydroxyl propyl methyl cellulose and Eudragit RS
100 polymers by emulsion solvent evaporation technique. The average particle
size of microspheres were between 608 and 864 µm. The SEM studies showed
microspheres were spherical, discrete and having a rough surface. The in-vitro
drug release studies indicated that the percent drug release rate for F4 formulation
showed high release than all formulations.
[Lydia F., et al., 2011] achieved controlled delivery of Gentamicin using
poly(3-hydroxybutyrate) microspheres using a solid-in-oil-water (s/o/w) technique.
For this study, several parameters such as polymer concentration, surfactant, and
stirring rates were varied in order to determine the effect on microsphere
characteristics. The average size of the microspheres was in the range of 2µm to
1.54µm, low stirring speed of 300rpm produced slightly larger microspheres when
compared to the smaller microspheres produced when the stirring velocity was
increased to 800rpm. The surface morphology of the microspheres appeared

CHAPTER III LITERATURE REVIEW
COLLEGE OF PHARMACY, MADURAI MEDICAL COLLEGE. Page 45
smooth when observed under SEM. The microspheres exhibiting the highest
encapsulation efficiency was 48%. The in-vitro release of gentamicin was
bimodal, an initial burst release was observed followed by a diffusion mediated
sustained release, finally after 20 hours, the cumulative drug release was 95.33%.
[Saritha D., et al., 2011] formulated and evaluated ramipril microspheres
produced by the non-aqueous emulsification solvent evaporation method. The
microspheres were prepared using polymethacrylate polymers and hypermellose.
The impact of different factors such as stirring rate, polymer concentration, and
volume at processing medium on the characteristics of the microspheres were
investigated. Surface of the microspheres was investigated by SEM, showed they
were spherical in shape and exhibited porous surface it suggested that the drug
was released through pores and the mechanism of drug release was diffusion
controlled. The mean particle size of the formulation F1 to F4 was found to be
increased from 52 µm ± 1.5 to 100 µm ± 0.52 due to increasing polymer
concentration. The entrapment efficiency was found to be increase from 52.43%
±0.45 to 23.19% ± 0.66 this could be due to the increased viscosity in a fixed
volume of solvent as the drug to polymer ratio increased. In-vitro release studies
were showed the increase in drug release rate from 20th & 18th hours was
observed due to higher migration of drug to the surface, increasing stirring speed,
decreased particle size and increased larger available surface area. Eudragit RL
100 polymer increased the porosity of the matrix and they accelerated the drug
release.
[Sudhamani . et al.,2011] prepared and evaluated of ethyl cellulose
microspheres of ibuprofen for sustained drug delivery. These ethyl cellulose
microspheres were prepared by the solvent evaporation method. The prepared
microspheres were subjected to various evaluation and in-vitro release studies.
Highest percentage of loading was obtained by increasing the amount of ibuprofen
with respect to polymer. The particle sizes of the prepared microspheres were
determined.

CHAPTER III LITERATURE REVIEW
COLLEGE OF PHARMACY, MADURAI MEDICAL COLLEGE. Page 46
[Kumar,Ankit .et al.,2011] evaluated microencapsulation this approach
facilitates accurate delivery of small quantities of potent drugs, reduced drug
concentrations at sites other than the target organ or tissue and protection of labile
compounds before and after administration and prior to appearance at the site of
action. Microencapsulation system offers potential advantages over conventional
drug delivery systems. Microspheres and microparticales are a unique carrier
system for various pharmaceuticals dosage form.
[Vijaya Ramesh et al.,2011] used different polymers for the development
of microparticles for controlled release of antibiotic drug ciprofloxacin.
Microspheres were prepared by emulsion solvent evaporation technique. Attempts
are also made to increase the entrapment efficiency by changing experimental
variables.
[Chinna B., et al., 2010] formulated and evaluated indomethacin
microspheres using natural and synthetic polymer such as egg albumin, ethyl
cellulose, eudragit L 100 as the retardant materials for controlled release
preparation of a highly water- soluble drug, indomethacin. Microspheres were
prepared by solvent evaporation method using an acetone/liquid paraffin system
and phase separation co-acervation method. The prepared microspheres were
evaluated and characterized, the mean particle size of the microspheres was
found in the range of 150 to 400µm. The drug-loaded microspheres showed 70-
86% of entrapment and release was extended up to 6 to 8 hours releasing 86%
the total drug from the microspheres. The release of indomethacin was
influenced by the drug to polymer ratio and particle size was found to be both
diffusion and dissolution controlled.
[Subbiah G., et al., 2010] formulated and evaluated controlled release
formulation of idarubicin microspheres using biodegradable hydrophilic and
hydrophobic polymer mixtures such as ethyl cellulose and HPMC by using solvent
evaporation method. By increasing the concentration of ethyl cellulose the mean
particle size also increased , with change in the speed of rotation, there is an
influence on the size of the microspheres that varied with increase in size with

CHAPTER III LITERATURE REVIEW
COLLEGE OF PHARMACY, MADURAI MEDICAL COLLEGE. Page 47
decrease in rotation and was in the range between 134.0±9.0 to 424.7±11.2 µm
for 1000rpm and 500rpm respectively. But the entrapment capacity did not show
much significant change in change in speed of rotation falling between 54% and
62%. The release of idarubicin microspheres showed Higuchi’s square root
model. This model showed that the idarubicin can be attempted to maintain
sustained release and reducing the side effects produced by the drug.
[Phutane P., et al., 2010] formulated and evaluated novel sustained
release microspheres of glipizide using Eudragit RS 100 and ethyl cellulose as a
rate retardant polymers by the emulsion solvent diffusion-evaporation technique by
using the modified ethanol,-dichloromethane co-solvent system. SEM indicated
that the microspheres were spherical with smooth surface and not aggregated.
Maximum encapsulation efficiency was observed of the batch F3 was 94.84%.
The combination of Eudragit RS 100 and ethyl cellulose had been achieved in
batch F3 where extended release of drug for approximately 12 hours had been
obtained and the %drug release at 12th hour was 96.76%
[YeM. et al.,2010] shown that biodegradable microparticles can be applied
in long-term protein delivery. The conventional way of delivering a protein drug
needs daily, sometimes multiple, injections to achieve its therapeutic
effectiveness. To perfect patient compliance and ease, sustained release dosage
forms have been developed.This section examines the properties of protein-
loaded microparticles, in specific, protein loading and release characteristics from
PLGA microparticles.
[Shashank tiwari. et al.,2010] formulated micoencapsulation by solvent
evaporation method (study of effect process variables) the properties of poly
(lacticacid) (poly lactic co glycolic acid) the effect of this microencapsulation is
successful .and to get a desire release rate and highest drug loading.
[Anand,Chirag. et al.,2010] formulated and evaluated of floating
micropsheres of captopril for prolong gastric residence time. Floating
microspheres was formulated using biocompatible polymers like Eudragit S100

CHAPTER III LITERATURE REVIEW
COLLEGE OF PHARMACY, MADURAI MEDICAL COLLEGE. Page 48
and Ethyl cellulose in different proportions by solvent evaporation technique. The
prepared microspheres were evaluated for percentage yield, micromeritic
properties, particle size, morphology, drug entrapment, buoyancy studies, In vitro
drug release studies, practical yield of the microspheres.
[Umamaheshwari. et al.,2010] developed effective drug delivery systems
for the treatment of Helicobacter pylori infection using polycarbonate (PC) floating
microspheres as drug carriers. In an effort to augment the anti-H. pylori effect of
acetohydroxamic acid (AHA), floating PC microspheres, which have the ability to
reside in the gastrointestinal (GI) tract for an extended period, were prepared by
emulsion (O/W) solvent evaporation technique. The effect of PC concentration on
the morphology, particle size, entrapment efficiency and drug release rate was
studied. Invitro studies confirmed the excellent floating properties of PC
microspheres. In conclusion, the floating microspheres more effectively cleared H.
pylori from the GI tract than the drug because of the prolonged gastric residence
time resulting from the excellent buoyancy of the PC.
[Kannan k., et al., 2009] formulated and evaluated sustained release
microspheres of acetazolamide by solvent evaporation technique using Eudragit
RL/RS as a rate retardant polymer. Spherical particles were obtained, when the
polymer and drug ratio was increased (2:1, 3:1) at stirring speed 750 rpm. The
average size of the microspheres was found as 250µm in all the formulations. The
in-vitro release of the drug from microspheres showed that the release rates were
very slow in Eudragit RS and in the release rate is fast in the microspheres made
by Eudragit RL. So the combination of the polymers Eudragit RS and Eudragit RL
gives desired release of drug from the microspheres.
[Durgacharan A., et al., 2009] formulated and evaluated controlled
release microspheres of isosorbide dinitrate by non-aqueous emulsification solvent
evaporation method using acrycoat S 100 as matrix polymer. The mean particle
size of the microspheres was in the range 140.2 ±8.3 to 248.7 ± 17.24 µm. SEM
showed that they were spherical with a smooth surface and exhibited a range of
sizes within each batch. The incorporation efficiency was showed higher at

CHAPTER III LITERATURE REVIEW
COLLEGE OF PHARMACY, MADURAI MEDICAL COLLEGE. Page 49
89.24% ± 2.1 in A3 batch. The in-vitro release studies were performed for 12
hours and the cumulative release of isosorbide dinitrate significantly decreased
with increasing acrycoat S 100 polymer concentration. Smaller microspheres
were formed at lower polymer concentration and had a larger surface area
exposed to dissolution medium, release was higher in the case of microspheres
prepared at a higher agitation speed but at low agitation speed the release rate
was slow.
[Vadhana singh et al.,2009] Develop the hollow microspheres as a new
dosage form of floating drug delivery system with prolonged stomach retention
time. Hollow microspheres containing ranitidine hydrochloride were prepared by
solvent evaporation method using Eudragit RLPO dissolved in a mixture of
dichloromethane and ethanol. Hollow microspheres could prolong drug release
time (approximately 24 hrs) and float over stimulate gastric fluid for more than
12hrs.
[Kem et al.,2009] produced uniform microspheres and double-wall
microspheres capable of efficiently encapsulating model drugs. Of primary
importance was the ability of monodisperse microsphere formulations.
Monodisperse PPF microspheres and core-shell microparticles offer advantages in
reproducibility, control, and consistency that may provide valuable assistance in
designing advanced drug delivery systems to achieve precise control of the
particle size and reproducibly fabricate nanocapsules the technology.
[Om praksh et al., 2009] Evaluated rosin polymer, Rosin application
agent, microencapsulating agent. It had been found anti-inflammatory and
antitumor activity. Its semisolid preparation such as skin cream shows good
homogeneity and spreadibility. It has prominent property for the sustained release
drug system with most of the drug and dosage form.
[Alaghusundram., et al.,2009] reported microspheres not only for
prolonged release, but also for targeting of anticancer drugs to the tumour. In
future by combining various other strategies, Microspheres will find the central

CHAPTER III LITERATURE REVIEW
COLLEGE OF PHARMACY, MADURAI MEDICAL COLLEGE. Page 50
place in novel drug delivery, particularly in diseased cell sorting, diagnostics, gene
& genetic materials, safe, targeted and effective in-vivo.
[Amal H. et al.,2009] formulated and evaluated captopril Sustained
release microparticles.using acetate propionate and employing the solvent
evaporation technique .it decreases the side effects.microparticles containing
different dug and polymer ratio.
[Naikwade S et al.,2009] studied the pulmonary delivery of budesonide
microparticles formulation and in vitro determination by spray drying. Prepared
Microparticles were spherical in shape and they are characterized by smooth
surface with low-density particles. Formulations shown extended in vitro drug
release up to 4 hours thus use of microparticles possibility offers sustained release
profile along with increase delivery of drug to the pulmonary tract.
[Roy S et al.,2009] prepared mefenamic acid microspheres by cross
linking chitosan with gluteraldehyde. The invitro release pattern was found to
follow zero order release as the dissolution exponent come nearer to 1.
[A. Dalmoro et al.,2009] prepared enteric microparticles for controlled and
made drug delivery applications through different ways of microencapsulation
(namely single emulsions: water in oil-W/O; oil in water-O/W; or double emulsions:
water-in oil-in water-W/O/W) and their impact on final properties of the product.
Microcapsules or microsphers can be designed to progressively release active
ingredients. A coating may also be given to open in specific areas of body “smart
polymers” which are perfect candidates for advancing self-regulated delivery
systems.
[Ravi Kumar Reddy J. et al.,2009] investigated the delayed release
microparticles prepared from different polymers by emulsion-solvent evaporation
method and examined the physic-chemical characters. The mechanism of drug
release was set up to be erosion as it was caused by (1-Mt/M) 1/3 versus time
plots. Relative drug release study allow that the formulated product have more
sustained effect than the marketed product.

CHAPTER III LITERATURE REVIEW
COLLEGE OF PHARMACY, MADURAI MEDICAL COLLEGE. Page 51
[Vinay mishara et al.,2008] prepared and evaluated matrix microspheres
system for simultaneous and sustained release of Candesartan cilexetil and
captopril for the management of nephritic syndrome, Ethyl cellulose was used as a
retardant polymer decrease of side effect, increase of bioavailability and
therapeutic action of both combination drugs.
[KBR chowdary, Dana.,2008] reported that the study is to evaluate ethyl
cellulose as a coat for controlled release microcapsules of diclofenac.. Ethyl
cellulose coated microcapsules were prepared by an emulsion-solvent evaporation
method employing different proportions of core and coat and the microcapsules
were evaluated for size, drug content and microencapsulation efficiency.
[Rajashree hirlekar et al.,2008] developed muco-adhesive drug delivery
system of Metoprolol tartarate using various polymer like sodium carboxy methyl
cellulose and natural polymers like gum karaya, xanthum gum and locust bean
gum. The formulation containing xanthum gum and locust bean gum in 2:1 ratio
exhibited complete drug release in 45 minutes.
[Lu et a.,2008] formulated a tumor-Penetrating microparticles for
intraperitoneal therapy of Ovarian Cancer using PLG copolymers. These tumor-
penetrating microparticles were prepared by Emulsion–solvent evaporation
method. The present study provided several findings that may be applied to
improving intraperitoneal therapy.
[Dr.lakshmanu prabu, shirwaikar.AR et al, 2007] prepared the sustained
release Aceclofenac microspheres by using rosin as an encapsulating polymer.
The release rate of drug from the microspheres could be properly controlled for
about 24h. Appropriate variation in the proportions of drug; polymer and stabilizer
can lead to a product with the desired controlled release features.
[Juergen Siepmann et al.,2006] envisaged that microparticles offer an
effectual defence of the encapsulated active agent against (e.g. enzymatic)
degradation, (ii) the chance to precise control the release rate of the incorporated
drug above periods of hours to months, and (iii) an easy administration.

CHAPTER III LITERATURE REVIEW
COLLEGE OF PHARMACY, MADURAI MEDICAL COLLEGE. Page 52
[Kevin et al.,2006] emphasized that controlled release drug delivery
systems are being evolved to address many of the difficulties connect with
conventional methods of administration. Controlled release drug delivery utilize
devices such as polymer-based disks, rods, pellets, or microparticles that
incorporate drug and release it at controlled rates for comparatively long periods of
time.
[El-Kamel et al., 2001] prepared floating microparticles of ketoprofen, by
emulsion solvent diffusion technique. Four different ratios of Eudragit S 100 with
Eudragit RL were used. The formulation containing 1:1 ratio of the 2 above-
mentioned polymers exhibited high percentage of floating particles in all the
examined media as evidenced by the percentage of particles floated at different
time intervals. This can be attributed to the low bulk density, high packing velocity,
and high packing factor.

CHAPTER – IV
AIM OF WORK

CHAPTER IV AIM OF WORK
COLLEGE OF PHARMACY, MADURAI MEDICAL COLLEGE. Page 53
AIM OF WORK
Sitagliptin phosphate is an insulin-sensitizing anti-diabetic drug. It was
chosen as a model drug since it has a half-life (8-14 h) and bioavailability 87%. It
belongs to BCS Class III drug(high solubility and low permeability). Low
permeability leads to potential problem of poor bioavailability and bioequivalence
of drug dosage form. Furthermore, micronized sitagliptin phosphate has shown
better absorption than nonmicronized form. Hence, the absorption of drug can be
enhanced using transdermal microsphere gel technique.
Sitagliptin phosphate is a dipeptidyl peptidase 4-(DPP-4) inhibitor with
glucose control capabilities that was effectively used for treating diabetes in the
past. However, the oral administration of this drug caused such severe side
effects that it was removed from the market.
Sitagliptin is an ideal candidate in considering transdermal diabetic drug
transport treatment due to its ability to effectively treat diabetes and small overall
size. Past studies have concluded that sitagliptin does not cause hypoglycaemia,
and it requires a low effective concentration in the body. The minimum effective
concentration of sitagliptin required in the blood is 100 nM. When sitagliptin is
taken orally, there are many negative side effects that have been reported which
include severe digestive discomfort, general pain, upper respiratory tract
infections, and headache. However, by delivering sitagliptin transdermally, there
is potential for these side effects to be circumvented through avoiding digestive
overload.
Type II diabetes is caused by insulin resistance and occurs when the
pancreas produces insulin, though the body does not appropriately react to the
protein. Type II diabetes increases one’s risk for many other health problems such
as heart and blood vessel diseases, kidney damage, vision degeneration, nerve
damage, and foot damage. Patients with type 2 diabetes continuously alternate
between a hyperglycaemic state, which refers to high blood glucose and low blood

CHAPTER IV AIM OF WORK
COLLEGE OF PHARMACY, MADURAI MEDICAL COLLEGE. Page 54
glucose levels, respectively. It is imperative for these patients to monitor their
blood glucose levels in order to remain in good health.
Oral drug delivery and liquid injections are currently the two most common
forms of diabetes treatment. However, both methods implicitly present limitaitons.
Patients who take oral anti-diabetic medications typically require high dosages in
order for sufficient efficacy due to low bioavailability in drug of this class. Patients
also tend to experience negative side effects, such as vomiting and digestive pain
from taking high dosage oral anti-diabetic medications. Patients who take
hypodermic insulin injections are required to inject themselves with insulin up to
three times a day; this method is very painful and inconvenient for patients who
are dependant on this life-saving protein. A feasible treatment option for diabetes
lays in transdermal drug delivery approaches. It has been shown that the skin is a
barrier that can be exploited for drugs to enter the body, so transdermal patch or
cream formulation has potential for development as an alternative to the typical
diabetes treatment.
Furthermore, the use of transdermal patches can provide sustained drug
release over hours, and even days. This novel methodology for diabetes
treatment would have the ability to enable patients to lead quality lives without the
pain from the numerous hypodermic insulin injections or the negative side effects
caused by oral anti-diabetic medications. However, this delivery method
possesses limitations of its own, such as the necessity of selecting a drug small
enough to facilitate transdermal diffusion.
Microspheres have been widely accepted as a means to achieve sustained
release drug delivery system. The microspheres requires a polymeric substance
as a carrier and a core material. Among the various methods developed for
formulation of microspheres, the non-aqueous solvent evaporation method has
gained much attention due to its ease of fabrication without compromising the
activity of drug.

CHAPTER IV AIM OF WORK
COLLEGE OF PHARMACY, MADURAI MEDICAL COLLEGE. Page 55
Eudragit RS 100 is referred as a ammoniomethacrylate copolymers, with the
former having 5%functional quaternary ammonium groups and the latter having
10% functional quaternary ammonium groups. Eudragit RS 100 is a water-
insoluble polymer that is widely used as a wall material for sustained release
microspheres due to its biocompatibility, good stability, easy fabrication and low
cost.
HPMC is a non-ionic, swellable polymer. Hydrophyllic polymer gel matrix
systems are widely used in sustained drug delivery to obtain a desirable drug
release profile and cost effectiveness because of their flexibility. The hydration
rate of HPMC increases with increase in the hydroxyl propy content.
The use of natural polymers is preferred due to their proven biocompatibility
and safety. In this respect, chitosan, a cationic polymer, has attracted particular
attention. It is biocompatible and bioadhesive at physiological pH ande possesses
OH and NH2 groups that can give rise to hydrogen bonding. It is a high molecular
weight polysaccharide, compromising of glucosamine and N-acetyl glucosamine
obtained by deacetylation of chitin. Because of its low production cost, non-toxic
nature, chitosan has found application in multiparticulate drug delivery.
Carbopol is a polymer consisting of acrylic acid cross-linked with either
polyalkenyl ether or divinyl glycol. It readily absorbs water, gets hydrated and
swell. In addition to hydrophilic nature, cross-linked structure and insolubility in
water, due to the high proportion of the carboxy groups present, carbomer solution
is known to be acidic. It is also low viscosity but when neutralized with
triethanolamine, it is converted to high viscous gels. The adhesive properties of
carbomer are exploited to develop bioadhesive gels and drug delivery systems for
sustained and localized drug delivery.
Transdermal drug administration generally refers to topical applications of
agents to healthy intact skin either for localized treatment of tissues underline the
skin of for systemic therapy. For transdermal product, the goal of dosage design

CHAPTER IV AIM OF WORK
COLLEGE OF PHARMACY, MADURAI MEDICAL COLLEGE. Page 56
is to maximize the flux through the skin into the systemic circulation and
simultaneously minimize the retention and metabolism of the drug in the skin.
Transdermal drug delivery has main advantage over the oral route of
administration such as improving patient compliance in long term therapy, by-
passing first pass metabolism, sustaining drug delivery, maintaining a constant
and prolonged drug level in plasma, minimizing the inter and intra-patient
variability, and making it possible to interrupt or terminate when necessary.
Transdermal route will eliminate the side effects associated with oral
administration of sitagliptin phosphate. The aim of this present study was to
formulate and evaluate sustained release microsphere gel loaded sitagliptin
phosphate in order to maintain a sustained drug concentration in serum for longer
period of time, which may result in enhanced absorption and thereby improved
bioavailability.

CHAPTER – V
PLAN OF WORK

CHAPTER V PLAN OF WORK
COLLEGE OF PHARMACY, MADURAI MEDICAL COLLEGE. Page 57
PLAN OF WORK
1. STANDARD CURVE FO SITAGLIPTIN PHOSPHATE
Preparation of calibration curve
Estimation of absorption maximum
Preparation of standard curve
2. PREFORMULATION STUDIES
Fourier transform infra-red spectroscopic
Differential Scanning Calorimetric studies
3. FORMULATION OF SITAGLIPTIN PHOSPHATE MICROSPHERES
The microspheres are prepared by non-aqueous solvent evaporation method.
4. CHARACTERIZATION OF SITAGLIPTIN PHOSPHATE MICROSPHERES
Determination of drug content
Determination of mean particle size
Scanning Electron Microscopic
Determination of percentage yield
Determination of encapsulation efficiency
In-vitro dissolution studies
5. SELECTION OF BEST FORMULATION
6. PREPARATION OF GEL LOADED SITAGLIPTIN MICROSPHERES

CHAPTER V PLAN OF WORK
COLLEGE OF PHARMACY, MADURAI MEDICAL COLLEGE. Page 58
7. CHARACTERIZATIION OF GEL LOADED SITAGLIPTIN MICROSPHERES
Deternmination of pH
Determination of gel strength
Determination of spreadability
Determination of drug content
8. COMPARATIVE IN-VITRO STUDIES
9. STABILITY STUDIES

CHAPTER – VI
MATERIALS AND
EQUIPMENTS

CHAPTER VI MATERIALS AND EQUIPMENTS
COLLEGE OF PHARMACY, MADURAI MEDICAL COLLEGE. Page 59
MATERIALS AND EQUIPMENTS
LIST OF MATERIALS
Table- 2. List of Materials Used
Materials Manufacturer
Sitagliptin phosphate Pure chem Pvt. Ltd. Gujarat
Eudragit RS 100 Universal Scientific Appliances, Madurai.
HPMC E15 Universal Scientific Appliances, Madurai.
Chitosan Universal Scientific Appliances, Madurai.
Tween 80 Universal Scientific Appliances, Madurai.
Carbopol 934 Universal Scientific Appliances, Madurai.
Triethanolamine Universal Scientific Appliances, Madurai.
Acetone Universal Scientific Appliances, Madurai.
Liquid paraffin Universal Scientific Appliances, Madurai.
Petroleum ether Universal Scientific Appliances, Madurai.

CHAPTER VI MATERIALS AND EQUIPMENTS
COLLEGE OF PHARMACY, MADURAI MEDICAL COLLEGE. Page 60
EQUIPMENTS USED
TABLE-3
EQUIPMENTS NAME MANUFACTURERS
Electronic weighing balance A & D company, Japan.
UV – Visbile spectrophotometer Shimadzu corporation, Japan
Infrared Spectroscopy Spectrum RX-1, Perkin Elmer,
German
Differential Scanning Calorimetry DSC Q 200, USA
Scanning Electron Microscopy Hitachi X 650, Tokyo,Japan
Optical microscope Towa Optics, India
Mechanical stirrer Remi, India
Magnetic stirrer Remi, India
Environmental stability testing
chamber
In Labs equipment(Madras)
Pvt.Ltd.

CHAPTER – VII
DRUG PROFILE

CHAPTER VII DRUG PROFILE
COLLEGE OF PHARMACY, MADURAI MEDICAL COLLEGE. Page 61
DRUG PROFILE
SITAGLIPTIN PHOSPHATE:
Structure:
Chemical Name:
4-Oxo-4- (3-(trifluoromethyl) 5,6 dihydro (1,2,4) triazolo [4,3a]
pyrazin-7 (8H) -yl) -1- (2,4,5-trifluorophenyl) butan-2 amine phosphate
Empirical Formula :
C16H15F6N5O.H3PO4
Molecular Weight :
505.31gm/mol
Description :
white to off-white crystalline powder
Melting Point:
198 – 202oC

CHAPTER VII DRUG PROFILE
COLLEGE OF PHARMACY, MADURAI MEDICAL COLLEGE. Page 62
Category:
Hypoglycemic agent DPP-4 inhibitor.
Brands:
Januvia, Janumet
Dose :
25 to 100 mg daily, in divided doses or once daily.
PKa:
12.4
pH:
pH of 1% aqueous solution of drugs is 6.68
Solubility:
Freely soluble in water, slightly soluble in ethanol (95%) practically insoluble in
acetone, chloroform, dichloromethane and ether.
BCS Classification:
It is a BCS class III (high solubility, low permeability)/borderline class I (high
solubility, high permeability) drug
Sitagliptin Phosphate Pharmacokinetics
Absorption
Absolute bioavailability 87%.
Rapidly absorbed following oral administration; at steady state (within 3
days of therapy initiation), peak plasma concentrations generally attained ≤3 hours
following administration of recommended doses.

CHAPTER VII DRUG PROFILE
COLLEGE OF PHARMACY, MADURAI MEDICAL COLLEGE. Page 63
Onset
Reduction in postprandial plasma glucose excursion: Approximately 60
minutes.
Duration
Approximately 80% inhibition of DPP-4 activity persists for 12 or 24 hours
following administration of ≥50 or ≥100 mg, respectively, of sitagliptin.
Food
Food does not appear to affect absorption.1
Special Populations
Renal impairment results in increased plasma AUC.Removed modestly by
hemodialysis; time to peak plasma drug concentration increased in a limited
number of patients with end-stage renal disease requiring hemodialysis.
Moderate hepatic impairment results in increased peak plasma
concentrations and AUC; not considered clinically important.
In geriatric patients, modest increases in plasma concentrations compared
with younger adults.
Distribution
Distributed into milk in rats; not known whether distributed into human milk.
Plasma Protein Binding
38%.
Metabolism
Metabolized to a limited extent by CYP isoenzymes 3A4 and 2C8 to
inactive metabolites.

CHAPTER VII DRUG PROFILE
COLLEGE OF PHARMACY, MADURAI MEDICAL COLLEGE. Page 64
Elimination Route
Eliminated principally by kidneys via active tubular secretion. Excreted in
urine (87%) mainly as unchanged drug and in feces (13%).
Half-life
12.4 hours.
Special Populations
Renal impairment results in increased terminal elimination half-life.
Storage
20–25°C (may be exposed to 15–30°C).
Actions

CHAPTER VII DRUG PROFILE
COLLEGE OF PHARMACY, MADURAI MEDICAL COLLEGE. Page 65
Inhibits DPP-4, an enzyme that inactivates incretin hormones glucagon-like
peptide (GLP-1) and glucose-dependent insulinotropic polypeptide (GIP).
Inhibits DPP-4 selectively with no effect on DPP-8 or DDP-9 in vitro at
concentrations approximating those from therapeutic dosage.
Increases circulating concentrations of GIP and GLP-1 in a glucose-
dependent manner. Coadministration of sitagliptin and metformin has an
additive effect on active GLP-1 concentrations.
GIP and GLP-1 stimulate insulin synthesis and release from pancreatic β-
cells in a glucose-dependent manner (i.e., when glucose concentrations are
normal or elevated) by intracellular signaling pathways involving cyclic 3′,5′-
adenosine monophosphate (cAMP).
GLP-1 also decreases glucagon secretion from pancreatic α-cells in a
glucose-dependent manner, leading to reduced hepatic glucose production.
Lowers fasting plasma glucose concentrations and reduces glucose
excursions following glucose load or meal in patients with type 2 diabetes
mellitus.
Sitagliptin usually not associated with hypoglycemia or substantial changes
in body weight.
Cautions for Sitagliptin Phosphate
Contraindications
Known serious hypersensitivity (e.g., anaphylaxis, angioedema) to
sitagliptin or any ingredient in formulation.
Warnings/Precautions:
Pancreatitis and Pancreatic Precancerous Changes
Worsening of Renal Function
Severe Arthralgia

CHAPTER VII DRUG PROFILE
COLLEGE OF PHARMACY, MADURAI MEDICAL COLLEGE. Page 66
Sensitivity Reactions
Loss of Glycemic Control
Macrovascular Outcomes
Pregnancy
Category B.
Lactation
Distributed into milk in rats; not known whether distributed into human milk.
Pediatric Use
Safety and efficacy of sitagliptin alone or in fixed combination with
metformin not established in children <18 years of age.
Geriatric Use
No substantial differences in safety and efficacy relative to younger adults,
but increased sensitivity cannot be ruled out.
Substantially eliminated by kidneys; assess renal function prior to initiation
of therapy and periodically thereafter because geriatric patients more likely to have
decreased renal function.
Renal Impairment
Substantially eliminated by kidneys; assess renal function prior to initiation
of therapy and periodically thereafter.
Common Adverse Effects
Sitagliptin monotherapy or add-on therapy with metformin and/or a
thiazolidinedione or glimepiride: Nasopharyngitis, upper respiratory tract
infection, peripheral edema, headache.
Interactions for Sitagliptin Phosphate

CHAPTER VII DRUG PROFILE
COLLEGE OF PHARMACY, MADURAI MEDICAL COLLEGE. Page 67
Metabolized to a limited extent by CYP isoenzymes 3A4 and 2C8 to
inactive metabolites.
Drugs Metabolized by Hepatic Microsomal Enzymes
Does not inhibit CYP isoenzymes 1A2, 2B6, 2C8, 2C9, 2C19, 2D6, or 3A4
in vitro or induce CYP3A4. Pharmacokinetic interactions with drugs metabolized
by these isoenzymes unlikely.
Inhibitors of P-glycoprotein Transport System
Substrate of p-glycoprotein transport system. Potential pharmacokinetic
interaction (increased absorption and renal clearance of sitagliptin) with
p-glycoprotein inhibitors.
Clinically important pharmacokinetic interactions with p-glycoprotein
inhibitors unlikely. Does not appear to inhibit p-glycoprotein transport system.
Drugs Secreted by Renal Tubular Cationic Transport
Substrate of organic anion transport system; pharmacokinetic interaction
unlikely with substrates of organic cationic transport system.
Protein-bound Drugs
Pharmacokinetic interaction unlikely.
There are several therapeutic options for the treatment of type 2 diabetes, which
can include lifestyle modification with diet and exercise, as well as drug therapy.
They are,

CHAPTER VII DRUG PROFILE
COLLEGE OF PHARMACY, MADURAI MEDICAL COLLEGE. Page 68
TABLE-4
Insulin
Sensitizers
Biguanides (Metformin, Buformin, Phenformin)
TZDs/"Glitazones" (PPAR) (Pioglitazone, Rivoglitazone,
Rosiglitazone, Troglitazone)
Dual PPAR agonist (Aleglitazar, Muraglitazar, Tesaglitazar)
Insulin
Secretagogues
K+ ATP, Sulfonylureas (1st generation: Acetohexamide,
Carbutamide, Chlorpropamide, Metahexamide, Tolbutamide,
Tolazamide)
K+ ATP, Sulfonylureas (2nd generation:
Glibenclamide(Glyburide), Glibornuride, Glipizide,
Gliquidone, Glisoxepide, Glyclopyramide, Glimepiride,
Gliclazide)
K+ ATP, Meglitinides/"glinides" (Nateglinide, Repaglinide,
Mitiglinide) GLP-1 agonists (Exenatide, Liraglutide,
Taspoglutide, Albiglutide, Lixisenatide)
DPP-4 inhibitors (Alogliptin, Gemigliptin, Linagliptin,
Saxagliptin, Sitagliptin, Vildagliptin)
Analogs/Other
Insulins
Fast-acting (Insulin Lispro, Insulin aspart, Insulin Glulisine)
Short-acting (Regular Insulin)
Long-acting (Insulin Glargine, Insulin Detemir, NPH Insulin)
Ultra-long-acting (Insulin Degludec)
Inhalable (Exubera)
AlphaGlucosidase
Inhibitors Acarbose, Miglitol, Voglibose
Amylin Analog Pramlintide
SGLT2 Inhibitors Canagliflozin, Dapagliflozin, Empagliflozin, Remogliflozin,
Sergliflozin, Tofogliflozin
Other Benfluorex, Tolrestat

CHAPTER – VIII
EXCIPIENTS PROFILE

CHAPTER VIII EXCIPIENTS PROFILE
COLLEGE OF PHARMACY, MADURAI MEDICAL COLLEGE. Page 69
EXCIPIENTS PROFILE
HYDROXYPROPYL METHYLCELLULOSE
Description : Odourless, tasteless, white or creamy-white coloured
fibrous or granular powder.
Molecular weight : Approximately 10,000 - 1,500,000.
Structural formula :
Applications : Primarily in the oral products hydroxypropyl
methylcellulose was used as a tablet binder, extended
release tablet matrix, suspending and thickening agent
particularly in ophthalmic preparations. It is widely
used in cosmetics and food products and also used as
a wetting agent for hard contact lenses and as an
adhesive in plastic bandages.

CHAPTER VIII EXCIPIENTS PROFILE
COLLEGE OF PHARMACY, MADURAI MEDICAL COLLEGE. Page 70
Acidity / Alkalinity : pH = 5.5 - 8.0 for a 1% w/w aqueous solution.
Density (tapped) : 0.50 - 0.70 g / cm3 for pharmacoat.
Melting point : Browns at 190-200oC. Glass Transition Temperature
is 170 - 180oC.
Solubility : Soluble in cold water and practically insoluble in
ethanol (95%), ether and chloroform. But soluble in
mixtures of methanol and dichloromethane and
mixtures of ethanol and dichloromethane.
Stability : Its powder is a stable material although it is
hygroscopic after drying.
Incompatibilities : Incompatible with some oxidizing agents and will not
complex with metallic salts and ionic organics.
Safety : Extensively used in cosmetics, food products and
widely used as an excipient in oral and topical
formulations.
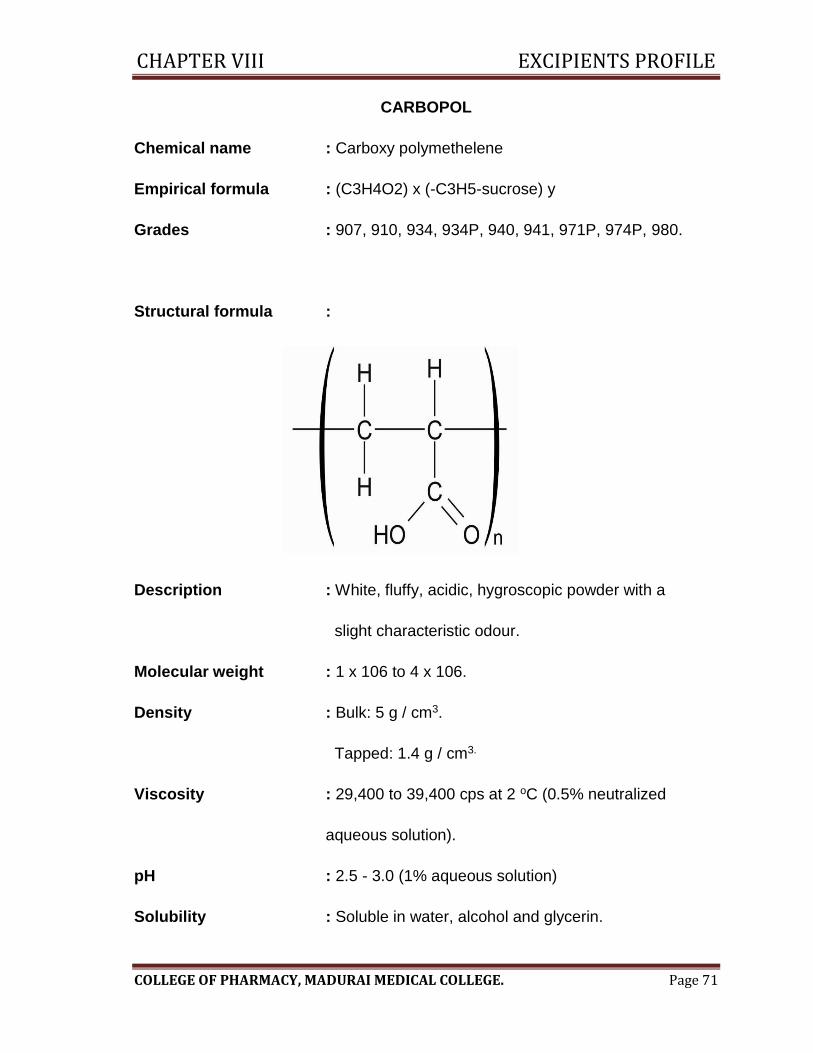
CHAPTER VIII EXCIPIENTS PROFILE
COLLEGE OF PHARMACY, MADURAI MEDICAL COLLEGE. Page 71
CARBOPOL
Chemical name : Carboxy polymethelene
Empirical formula : (C3H4O2) x (-C3H5-sucrose) y
Grades : 907, 910, 934, 934P, 940, 941, 971P, 974P, 980.
Structural formula :
Description : White, fluffy, acidic, hygroscopic powder with a
slight characteristic odour.
Molecular weight : 1 x 10⁶ to 4 x 10⁶.
Density : Bulk: 5 g / cm3.
Tapped: 1.4 g / cm3.
Viscosity : 29,400 to 39,400 cps at 2 oC (0.5% neutralized
aqueous solution).
pH : 2.5 - 3.0 (1% aqueous solution)
Solubility : Soluble in water, alcohol and glycerin.

CHAPTER VIII EXCIPIENTS PROFILE
COLLEGE OF PHARMACY, MADURAI MEDICAL COLLEGE. Page 72
Stability : It is relatively unaffected by temperature variations,
not subjected to hydrolysis or oxidation and is
resistant to bacterial growth.
Applications : It is excellent thickening, emulsifying, suspending
and gelling agent. It is used as a tablet binder in
sustained release formulations affording zero- to near
zero order release. It is used as the bioadhesive
component in mucoadhesive ointments, gels and
tablets.
Safety : No primary irritation or any evidence of allergic
reactions has been observed in human beings
following topical application.
Incompatibility :It is observed with cationic polymers, phenols,
resorcinol and high concentration of electrolytes.

CHAPTER VIII EXCIPIENTS PROFILE
COLLEGE OF PHARMACY, MADURAI MEDICAL COLLEGE. Page 73
CHITOSAN
Chemical name : Poly-b-(1,4)-2-Amino-2-deoxy-D-glucose
Description : Odourless, white or creamy-white powder or
flakes.
Structural formula :
Molecular formula : C6H11NO4n
Molecular weight : 10,000 - 1,000,000
Solubility : Easily soluble in water.
Moisture content : 10%
Ash content : 2.0%
Applications : Excellent film forming agent, additives, cosmetics
and good bacterial inhibitor. Also used for the
preservation of fruits and vegetables. It is widely
applied for improving immunity, activating cells,
preventing cancer, decreasing blood fat and blood

CHAPTER VIII EXCIPIENTS PROFILE
COLLEGE OF PHARMACY, MADURAI MEDICAL COLLEGE. Page 74
pressure, adjusting blood sugar, fighting against
ageing and adjusting organism environment.
Incompatibilities : Incompatible with strong oxidizing agents.
Stability : Chitosan powder is a stable material at room
temperature, although it is hygroscopic after drying.
Safety : Widely for use as an excipient in oral, cosmetics and
other pharmaceutical formulations. Generally regarded
as a nontoxic and nonirritant material. It is
biocompatible with both healthy and infected skin
and shown to be biodegradable.
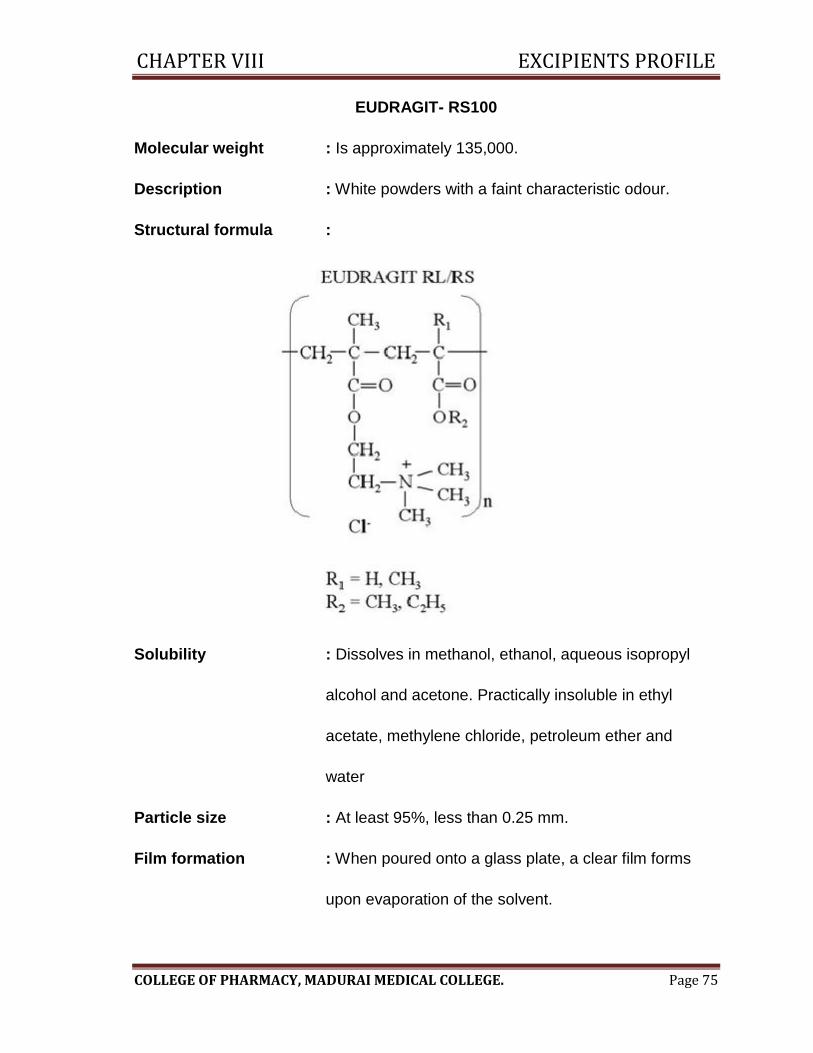
CHAPTER VIII EXCIPIENTS PROFILE
COLLEGE OF PHARMACY, MADURAI MEDICAL COLLEGE. Page 75
EUDRAGIT- RS100
Molecular weight : Is approximately 135,000.
Description : White powders with a faint characteristic odour.
Structural formula :
Solubility : Dissolves in methanol, ethanol, aqueous isopropyl
alcohol and acetone. Practically insoluble in ethyl
acetate, methylene chloride, petroleum ether and
water
Particle size : At least 95%, less than 0.25 mm.
Film formation : When poured onto a glass plate, a clear film forms
upon evaporation of the solvent.

CHAPTER VIII EXCIPIENTS PROFILE
COLLEGE OF PHARMACY, MADURAI MEDICAL COLLEGE. Page 76
Applications : Polymethacrylates are primarily used in oral capsule
and tablet formulations as film coating agents.
Depending on the type of polymer used, films of
different solubility characteristics can be produced.
Eudragit acrylic resins exhibit a broad spectrum of
physicochemical properties and are used in a variety
of pharmaceutical applications, such as film coating
of oral formulations and preparation of controlled
release drug systems.
Stability : Minimum stability dates are given on the product
labels and batch-related certificates of analysis.
Storage : Protect from warm temperatures and against
moisture.
Safety : Polymethacrylate co-polymers are widely used as
film coating materials in oral pharmaceutical
formulations. They are also used to a lesser extent in
topical formulations and are generally regard as non
toxic and non-irritant materials.

CHAPTER – IX
EXPERIMENTAL PROTOCOL

CHAPTER IX EXPERIMENTAL PROTOCOL
COLLEGE OF PHARMACY, MADURAI MEDICAL COLLEGE. Page 77
EXPERIMENTAL PROTOCOL
Preformulation study:
Preformulation testing is the first step in the rational development of dosage
forms of a drug substance. It can be defined as an investigation of physical and
chemical properties of a drug substance alone and when combined with
excipients. The overall objective of pre-formulation testing is to generate
information useful to the formulator in developing stable and bio available dosage
forms that can be man produced.
The following preformulation studies are carried out:
Description
Finding the absorption maxima
Standard curve
Infra-red spectroscopy studies (compatibility studies)
Differential Scanning Calorimetry
Description
About 1g of sample is taken in a dry petridish and the sample is observed
for compliance against the specification.
Identification of the drug: Finding the absorption maxima (λ max)
The absorption maxima were found for drug identification. Ultraviolet Visible
spectrophotometry has been used to obtain specific information on the
chromophoric part of the molecules. Organic molecules in solutions when exposed
to light in the visible/Ultraviolet region of the spectrum absorb light of particular
wavelength depending on the type of electronic transition associated with the
absorption.
The various batches of the microspheres were subjected for drug content
analysis. Accurately weighed microsphere samples were mechanically powdered.

CHAPTER IX EXPERIMENTAL PROTOCOL
COLLEGE OF PHARMACY, MADURAI MEDICAL COLLEGE. Page 78
The powdered microspheres were dissolved in adequate quantity of phosphate
buffer PH 7.2 then filter. The UV absorbance of the filtrate was measured using a
UV spectrometer at 267nm.
Fourier transform infrared (FTIR) spectral analysis
FT-IR is used to identify the functional groups in the molecule. The drug is
mixed with KBr and pellet is formed. Each KBr disk was scanned at 4 mm/s at a
resolution of 2 cm over a wave number region of 400 to 4,500 cm−1. The
characteristic peaks were recorded. The results are shown in the following figure.
and table.
Drug-Excipient Compatibility studies by FT-IR
Fourier infrared spectroscopy (FT-IR) analysis was performed for the pure
drug and physical admixtures (Polymers, excipients) individually and then the drug
and physical admixtures are mixed together and FT-IR is taken to find out that
there is no interaction between drug, polymers and the excipients. The results are
shown in the following figure.and table.
Differential Scanning Calorimetry(DSC):
Differential scanning calorimetry or DSC is a thermo analytical technique in
which difference in the amount of heat required to increase the temperature of a
sample and reference as a function of temperature. Both the sample and
reference mentioned at nearly sample temperature throughout the experiment.
Mehtod:
Accurately weighed sitagliptin phosphate and formulations were analyzed
using an automatic thermal analyzer by using an automatic thermal analyzer
system (DSC60 Shimadzu Corporation Japan). Sealed and perforated aluminium
pans were used in the experiments for all the samples. Temperature calibrations
were performed using indium as a reference. The entire sample were run at a
scanning rate of 10oc/min from 50 oc-300 oc.

CHAPTER IX EXPERIMENTAL PROTOCOL
COLLEGE OF PHARMACY, MADURAI MEDICAL COLLEGE. Page 79
Standard Curves For Sitagliptin Phosphate :
Preparation of O.1N HCL:(Indian Pharmacopoeia 2010)
8.5 ml of Hydrochloric acid was dissolved in 1000ml of distilled water.
Preparation of Phosphate Buffer pH 7.2:
A known volume of 0.2M potassium dihydorgen phosphate is placed in a
200ml volumetric flask. 22.4ml of 0.2M sodium hydroxide is added and make up
to the volume with distilled water.
0.2M Pottasium Dihydrogen Phosphate:
A known quantity(27.218g) of potassium dihydorgen phosphate is dissolved
and diluted to1000ml with water
0.2M Sodium Hydroxide:
A known quantity (8g) of sodium hydroxide is dissolved and make up to
1000 ml with water.
Estimation of absorption maximum: (λ max)
The sitagliptin phosphate drug solutions (5,10,15,20 and 25µg/ml) were
taken in a standard cuvette and scanned in the range of 200-400nm by using UV-
Spectrophotometer. The absorbance of each sample was measured at 267nm.
The standard curve is plotted against absorbance and concentration of the
sample. Similarly, the procedure can be repeated for phosphate buffer pH 7.2. and
for 0.1N HCL..
FORMULATION OF SITAGLIPTIN PHOSPHATE MICROSPHERES:
The microspheres containing the anti-diabetic drug, sitagliptin phosphate,
as the core material were prepared by a non-aqueous solvent evaporation
method. (Garud and Garud.,2012)

CHAPTER IX EXPERIMENTAL PROTOCOL
COLLEGE OF PHARMACY, MADURAI MEDICAL COLLEGE. Page 80
The drug and the plymers were mixed with acetone at various ratos. The
slurry was introduced into 100ml of liquid paraffin while stirring with a mechanical
stirrer equipped with a three-blade propeller at room temperature. The solution
was stirred for 4 hours to allow the solvent to evaporate and the microspheres
were collected by filtration by Whatman filter paper no. 1. The microspheres were
washed repeatedly with petroleum ether(40oc-60oc) until free from oil. The
microspheres were collected and dried for 3hours at room temperature stored in a
dessicator over fused calcium chloride.
CHARACTERIZATION OF SITAGLIPTIN MICROSPHERES:
Determination of mean particle size:
The particle size was measured using an optical microscope, and the mean
particle size was calculated by measuring 300 particles with the help of a
calibrated ocular micrometer. A small amount of dry microspheres was suspended
in liquid paraffin (10 ml). A small drop of suspension thus obtained was placed on
a clean glass slide. The slide containing microspheres was mounted on the stage
of the microscope and diameter of at least 300 particles was measured using a
calibrated optical micrometer.
Scanning Electron Microscopy:
The purpose of the Scanning Electron Microscopy study was to obtain a
topographical characterization of micropsheres. The micropsheres were mounted
on brass stubs using double-sided adhesive tape. Scanning electron microscopy
photographs were taken with a scanning electron microscope (JSM-5610LV, Joel
Ltd, Tokyo, Japan) at the required magnification at room temperature. The working
distance of 39 mm was maintained, and the acceleration voltage used was 15 kV,
with the secondary electron image as a detector.
Yield of Microspheres
The prepared Microspheres were collected and weighed. The actual weight
of obtained Microspheres divided by the total amount of all non-volatile material

CHAPTER IX EXPERIMENTAL PROTOCOL
COLLEGE OF PHARMACY, MADURAI MEDICAL COLLEGE. Page 81
that was used for the preparation of the Microspheres multiplied by 100 gives the
% yield of Microspheres.
This was calculated by the use of following formula.
% yield= (Actual weight of the product / Total weight of excipients and drug)
× 100
Determination of Drug Content and Encapsulation Efficiency
100 mg of accurately weight microspheres were suspended in a phosphate
buffer pH 7.2 upto 24 hours. Next day, the sample was shaken using mechanical
shaker for few hours. Then it was filtered and from the filtrate, few ml of aliquot
was taken and made the suitable dilutions and analyzed for the drug content at
267 nm by spectrophotometry. The % of Encapsulation Efficiency was calculated.
Taking into the consideration the dilution factor and the amount of micro beads
takes, the amount of drug encapsulation per unit weight of micro beads were
calculated. The drug encapsulation efficiency was calculated using for the formula
Encapsulation efficiency=practical drug content/theoretical drug content*100
Evaluation of in vitro release by static method:
Microspheres, equivalent to 25 mg of sitagliptin phosphate, were accurately
weighed and transferred to beaker containing 100 ml phosphate buffer (pH 7.2).
The flask was kept in a magnetic stirrer at 37oc, 1 ml samples withdrawn at
regular intervals and, after suitable dilution, the amount of drug released was
determined using a spectrophotometer at 267 nm. Following each sample
withdrawal, 1 ml of phosphate buffer was added to the release medium to
replenish it. The microspheres were allowed to settle down and clear supernatant
medium withdrawn for drug analysis. Samples were collected for every 1 hour and
the study was carried over for 12 hours. The sample was filtered and the
microspheres collected were transferred to the dissolution flask. (Karthikeyan K.,
et al., 2012)

CHAPTER IX EXPERIMENTAL PROTOCOL
COLLEGE OF PHARMACY, MADURAI MEDICAL COLLEGE. Page 82
Kinetics of drug Release:
Several theories and kinetic models describe the dissolution of drug from
immediate release and modified release dosage forms. There are several models
to represent the drug dissolution profiles where f (t) is a function of time related to
the amount of drug dissolved from the pharmaceutical dosage form.
The quantitative interpretation of the values obtained in the dissolution
assay is facilitated by the usage of a generic equation that mathematically
translates the dissolution curve function of some parameters related with the
pharmaceutical dosage forms. Drug dissolution from solid dosage forms has been
described by kinetic models in which the dissolved amount of drug (Q) is a
function of the test time‘t’ or Q(t). Some analytical definitions of the Q(t) function
are commonly used, such as zero order, first order, Higuchi, Korsmeyer-Peppas,
Hixson-Crowell models, Weibull models. These models are used to characterize
drug dissolution/release profiles.
(i) Zero Order Kinetics
This model represents an ideal release profile in order to achieve the
pharmacological prolonged action. Zero order release constitutes drug release
from the dosage form that is independent of the amount of drug in the delivery
system (that is, a constant release rate). The following equation is used to express
the model:
Qt = Qo + Kot
Where,
Qt is the amount of drug dissolved in time t
Qo is the initial amount of drug in the solution
Ko is the zero order release constant
For practical purposes the equation is rearranged:

CHAPTER IX EXPERIMENTAL PROTOCOL
COLLEGE OF PHARMACY, MADURAI MEDICAL COLLEGE. Page 83
Percent drug released = Kt
This is applicable to dosage forms like transdermal systems, coated dosage
forms, osmotic systems as well as matrix tablets with low soluble drugs.
(ii) First Order Kinetics
First order release constitutes drug release in a way that is proportional to
the amount of drug remaining in its interior; in such a way that amount of drug
released by unit time diminish. The following equation is used to express the
model:
log Qt = log Qo + Kt/2.303
Where,
Qt is the amount of drug dissolved in time t
Qo is the initial amount of drug in the solution
K is the first order release constant
For practical purposes the equation is rearranged:
Log % of drug unreleased = Kt/2.303
This model is applicable to dosage forms such as those containing water
soluble drugs in porous matrices.
(iii) Higuchi Model
Higuchi describes drug release as a diffusion process based in Fick’s
law,square root dependent. The following equation is used to express the model:
Qt = Kht1/2
Where,
Qt is the amount of drug dissolved in time t

CHAPTER IX EXPERIMENTAL PROTOCOL
COLLEGE OF PHARMACY, MADURAI MEDICAL COLLEGE. Page 84
Kh is the first order release constant
For practical purposes the equation is rearranged:
Percent drug released = Kt1/2
This model is applicable to systems with drug dispersed in uniform
swellable polymer matrix as in case of matrix tablets with water soluble drug.
(iv) Peppas-Korsmeyer Model:
This model is widely used when the release mechanism is not well known
or when more than one type of release phenomenon could be involved
The following equation is used to express the model
Qt/Q∞ = Ktn
Where,
Qt is the amount of drug dissolved in time t
Q∞ is the amount of drug dissolved in infinite time
n is the release exponent indicative of drug release mechanism K is the
kinetic constant
For practical purposes the equation is rearranged:
Log percent drug released = log k +n log t
Peppas used n value in order to characterize different release mechanism
concluding for values of n = 0.5 for Fickian diffusion and values of n, between 0.5
to 1.0 for anomalous transport (corresponds to diffusion, erosion and swelling
mechanism or mixed order kinetics) and higher values of n, n=1 or n>1 for case-II
transport (corresponds to erosion and relaxation of swollen polymer layer).

CHAPTER IX EXPERIMENTAL PROTOCOL
COLLEGE OF PHARMACY, MADURAI MEDICAL COLLEGE. Page 85
PREPARATION OF GEL:
Accurately weighed sitagliptin phosphate miccrospheres( drug equivalent)
was added to 15ml of water in a beaker and stirred well, 400 mg of carbopol was
added to that microspheres dispersion, while stirring at 250 rpm, to obtain a
homogenous mixture. Stirring was continued until a lump free suspension was
obtained. Thereafter, 0.33ml of triethanolamine was added to produce a gel.
(Karthikeyan K., et al., 2012)
Evaluation of microspheres-loaded gel:
Determination of pH:
Determination of pH was done by Indosati Digital pH meter pH meter was
calibrated before use using standard buffer solution.
Gel strength determination:
A composition of 50 g of microspheres-loaded gel was taken in a 10 ml
beaker. The weight of 1000 mg for measuring gel strength was allowed to
penetrate into the gel. The gel strength, which means the viscosity of the gel, was
determined by time (seconds)
Spreadability
A sample of 0.5 g of each formulation was pressed between two slides
(divided into squares of 5 mm sides) and left for about 5 minutes where no more
spreading was expected. Diameters of spreaded circles were measured in cm and
were taken as comparative values for spreadability. The results obtained are
average of three determinations.
Drug content:
About 0.5 g of gel was dissolved in 25 mL phosphate buffer at pH 7,2. It
was then filtered after constant stirring and analyzed by UV spectrophotometer
after suitable dilution at 267 nm.

CHAPTER IX EXPERIMENTAL PROTOCOL
COLLEGE OF PHARMACY, MADURAI MEDICAL COLLEGE. Page 86
Evaluation of in vitro release by dynamic method:
Evaluation of in vitro release studies of sitagliptin phosphate carbomer gel
was carried out at 37oc using phosphate buffer (pH 7.2) as the release medium. A
glass tube of 10 mm diameter and 100 mm height was taken. One end of the tube
was closed using an dialysis membrane with the help of adhesive tape while the
other end was kept open and used as drug reservoir compartment. Gel (1 g)
containing sitagliptin phosphate was accurately weighed and transferred to the
glass tube in a vertical position through the open end. The gel was gently pushed
down to the surface of the dialysis membrane with the help of a stainless steel
spatula to ensure that all the gel was in contact with the membrane. Phosphate
buffer (2 ml, pH 7.2) was added to the reservoir compartment to wet the gel. The
glass tube was placed in a beaker containing 100 ml of phosphate buffer (pH 7.2)
such that that the dialysis membrane is just immersed in the phosphate buffer
which acted as the receiving compartment. The receiving compartment was
magnetically stirred (100 rpm, Remi, India) at 37oc. Samples (1 ml) were
withdrawn from the receiving compartment at regular 1hour intervals and the
amount of sitagliptin phosphate released from the gel was determined using a
spectrophotometer at 267 nm. After each withdrawal of sample, an equal quantity
of phosphate buffer was added to the receiving compartment to replenish it.
Samples were collected for every 1 hour and the study was carried over for 12
hours. (Karthikeyan K., et al., 2012)
Stability Study
Accelerated Stability Studies
Stability
Stability is officially defined as the time lapse during which the drug product
retains the same property and characteristics that it possessed at the time of
manufacture. This process begins at early development phases.

CHAPTER IX EXPERIMENTAL PROTOCOL
COLLEGE OF PHARMACY, MADURAI MEDICAL COLLEGE. Page 87
Definition Stability of a pharmaceutical preparation can be defined as “the
capability of a particular formulation (dosage form or drug product) in a specific
container/closure system to remain within its physical, chemical, microbiological,
therapeutic and toxicological specifications throughout its shelf life.
Instability in modern formulation is often undetectable only after
considerable storage period under normal conditions. To assess the stability of a
formulated product it is usual to expose it to high stress conditions to enhance
deterioration and therefore the time required for testing is reduced. Common high
stress factors are temperature and humidity. This will eliminate unsatisfactory
formulation.
Purpose of stability testing:
To study of drug decomposition kinetics
To develop stable dosage form
To establish the shelflife or expiration date for commercially available drug
product.
To ensure the efficacy, safety and quality of active drug substance and
dosage forms.
Table - 5 Stability Conditions Chart

CHAPTER IX EXPERIMENTAL PROTOCOL
COLLEGE OF PHARMACY, MADURAI MEDICAL COLLEGE. Page 88
The stability studies of formulation F1 to F15 were carried out at 45° C ±
2°C 75% ± 5% RH and leakage of the drug from the microspheres were analyzed
in terms of percentage drug content.
CHAPTER – X
RESULTS AND DISCUSSION
TABLES AND FIGURES

CHAPTER X RESULTS AND DISCUSSION
COLLEGE OF PHARMACY, MADURAI MEDICAL COLLEGE. Page 89
RESULTS AND DISCUSSION
PREFROMULATION:
Description - White, Odourless powder.
STANDARD CURVES FOR SITAGLIPTIN PHOSPHATE:
The calibration medium pH (7.4) were prepared by using phosphate buffer
and 0.1 NHCL were as per the I.P procedure(I.P 2010)
Estimation of absorption maximum (λmax):
The λmax of sitagliptin phosphate was estimated by scanning the 10µg/ml
concentration of the drug solution in buffer solution of phosphate buffer pH (7.4)
and λmax of 267nm in phosphate buffer solution and λmax of 267nm in 0.1N HCL.
The results were shown in table-5a and table-5b.
Preparation of Standard curves:
The standard curves of sitagliptin phosphate prepared by using phosphate
buffer pH (7.4) and 0.1N HCL. The linear correlation coefficient was found to be
0.999605 and sitagliptin obeys the Beer’s law within the concentration range of
5-25µg/ml.
IR spectra study:
From IR spectra of sitagliptin, physical mixture of drug and polymer, and
Microspheres it can be seen that there is no significant change in IR spectra of
microspheres i.e., it is nearly same to that of plain compounds. IR Spectra is
shown in figure-5 a, b, c, d.
DSC spectra study:
The DSC thermogram of sitagliptin base exhibited an exothermic peak at
about 208.76oC corresponding to its melting point. But in thermal analysis,
sitagliptin-loaded microspheres show peak originating from sitagliptin only slighty

CHAPTER X RESULTS AND DISCUSSION
COLLEGE OF PHARMACY, MADURAI MEDICAL COLLEGE. Page 90
difference in peak of temp. From DSC spectra of sitagliptin peak shown, and
microspheres shown peak at, near to drug peak indicate that there is no significant
change in DSC spectra of microspheres i.e., it is nearly same to that of plain
compounds. DSC Spectra is shown in figure 6-a,b.
Formulation of Sitagliptin Phosphate Microspheres:
The sitagliptin microspheres were prepared by non-aqueous solvent
evaporation method. The microspheres were prepared by using Eudragit rs 100 in
different ratios. After conducting five trial batches(F1-F5) it was optimized by
characterization and changing the parameters such as stirring speed, rpm,
polymer ratios and (F6-F10) batches were prepared along with HPMC E15 and
(F11-F15) were prepared along with chitosan as a rate retardant polymers.
Characterization of Sitagliptin Phosphate Microspheres:
All the formulations were evaluated for its drug content, mean particle size,
encapsulation efficiency and drug loading.
Determination of Drug content:
Drug content of all formulation was found in range of 52.08% to 97.92% and
its efficiency slightly decreases with increasing the HPMC content. The extent of
loading influenced the particle size distribution of microspheres. When the
distribution coefficient was high, efficiency of drug entrapment into microspheres
was elevated. It is already reported that the size of microspheres depends upon
various factors such as viscosity of the dispersed phase and dispersion medium,
temperature, speed of stirring, amount and size of porous carrier, etc. So
microspheres of desired size can be obtained by varying these factors.
Encapsulation Efficiency:
The encapsulation efficiency of formulation F1 to F15 was carried out and
found to be in a range 54.17% to 88.88 %.

CHAPTER X RESULTS AND DISCUSSION
COLLEGE OF PHARMACY, MADURAI MEDICAL COLLEGE. Page 91
Particle characteristics:
SEM morphology:
Scanning electron microphotographs showed that the microspheres were
spherical with a smooth to rough surface (Fig 19). Pores were observed on the
microsphere surface.
Mean particle size:
Increasing polymer concentrations (i.e., drugpolymer ratio from 1:1 to 1:4)
increased microsphere size from 54.51to 92.62 61.42 μm for eudragit rs 100,
61.42 to 75.59μm for chitosan, 60.69 to 71.39μm for HPMC. However, in all cases,
the increase was not significant .
Increase in stirring rate from 600 rpm to 1400 rpm also seemed to have
decreased microsphere size but the decrease was not significant .
It was already cleared that if the size of microspheres is less than 55μm,
release rate of drug will be high with reduced floating ability, the average particle
sizes of microspheres were between 54.51 to 92.62 μm. It was observed that the
mean particle size of the microspheres was significantly decreased with increase
in the concentration of HPMC and reduces in the concentration of Eudragit RS100.
It may be attributed to the forming of a thicker Eudragit RS100 layer with the
increase of concentration of Eudragit RS100 in the medium
In-vitro drug release of Sitagliptin phosphate microspheres:
The dissolution studies was carried out in phosphate buffer for pH 7.2 for
12 hours. The invitro dissolution studies of all formulations were compared with
pure drug. The results of in vitro dissolution studies of all formulations form the
sitagliptin microspheres were shown in figure 13 a to 13d.
When compared the in vitro release profile of all formulations are
significantly greater than that pure drug sitagliptin phosphate.

CHAPTER X RESULTS AND DISCUSSION
COLLEGE OF PHARMACY, MADURAI MEDICAL COLLEGE. Page 92
Formulations (F1E-F5E) using eudragit rs 100 at different ratios shown the
percentage drug release of 99.37% at 7 hours, 95.08%at 8 hours,91.85% at 9
hours, 90.96% at 10 hours , 94.48% at 9 hours respectively.
Formulations (F6EH-F510EH) using eudragit rs 100 along with HPMC E15
at different ratios shown the percentage drug release of 90.46% at 8 hours,
90.39%at 10 hours, , 92.63% at 12 hours , 96.07% at 9 hours, 92.20% at
10hours respectively.
Formulations (F11ECH-F15ECH) using eudragit rs 100 along with chitosan
at different ratios shown the percentage drug release of 88.26% at 8 hours,
86.84%at 10 hours, , 87.34% at 12 hours , 88.44% at 9 hours,86.13% at 10hours
respectively.
Drug release (for 1:3 drug/polymer ratio) after 12 h was in the rank order:
HPMC > ethyl cellulose > chitosan>eudragit rs 100 (Fig 10), with the
formulation prepared with HPMC E15 releasing approximately 92.63% of drug
after 12 h.
Increase in stirring speed from 600 rpm to 1400 rpm enhanced drug release
rate. At 1600 rpm, complete drug release was observed except for chitosan
microspheres. Fig 10 shows that the difference in drug release pattern among the
various polymer types was not significant .
Kinetic analysis:
The release data was obtained for zero order, first order, higuchi model,
Hixson crowell model, korsmeyer-peppas model. The correlation co-efficient of
F1E to F15-ECH formulations for zero order, higuchi, Hixson-crowell and first
order equations was shown in table-7. Formulation F8-EH was found high
correlation to zero order kinetics(0.899, figure 11a to 11c) rather than Hixson-
crowell models.
CHAPTER X RESULTS AND DISCUSSION
COLLEGE OF PHARMACY, MADURAI MEDICAL COLLEGE. Page 93
Higuchi model:
The release kinetics of all the formulations is best fitted the higuchi model.
Higuchi model with R2 values from 0.575 to 0.900. From these higuchi model
values, the release kinetics showed purely diffusion controlled. The release
kinetics are shown in figure 16a to 16c.
Korsmeyer –peppas model:
The drug release was proportional to square root time, indicating that the
drug release from polymeric microspheres was diffusion controlled. The data
obtained was also put in korsemeyer-peppas equation to find out release exponent
(n values between 0.5 to 1.0 for anomalous transport corresponds to diffusion,
erosion and swelling mechanism or mixed order kinetics(n value ranges from
0.557 to 0.739), which describes the drug release mechanism by non fickian
diffusion.
SELECTION OF BEST FORMULATION:
From the above results characterization, the best formulation of
microspheres was selected showing particle size 62.28µm and in vitro drug
release 92.63% in 12 hours.
PREPARATION AND CHARACTERIZATION OF GEL:
The sitagliptin phosphate microspheres were incorporated in a conventional
carbomer gel formulation. Carbopol 934 is a commercial grade of carbomer. It is
gelled by neutralization with triethanolamine. The formulated carbomer gel was
very clear, transparent and elegant. Incorporation of gelatin microspheres resulted
in finely dispersed particles in the gel system. A loading dose of the free drug was
incorporated in the carbomer gel to produce immediate effect while drug-loaded
microspheres are added to provide sustaining dose. They were finally
characterized for drug content, pH, gel strength, and spreadability and shown
appreciable results.(Table-11)

CHAPTER X RESULTS AND DISCUSSION
COLLEGE OF PHARMACY, MADURAI MEDICAL COLLEGE. Page 94
Comparison of invitro dissolution studies of sitagliptin phosphate
microsphere gel with marketed formulation:
In-vitro drug release profile for sitagliptin phosphate of phosphate buffer of
pH 7.2 for 12 hours, sitagliptin microsphere gel showed greater sustained
action(12hours) when compared with sitagliptin marketed formulation(1hour).
The results were shown in table-6d.
Stability studies:
The formulations F15 was selected for stability studies on the basis of their
encapsulation efficiency, drug content, and high cumulative %drug release. The
stability studies carried out at 25oc (room temperature) and 40 oc/75%RH for the
best formulation up to 30 days. In 15 day time interval, the microspheres were
analysed for drug content, encapsulation efficiency and cumulative % drug
release. The formulation showed not much variation in any parameter. The
results are shown in figure 20a-c.

TABLE- 5a CALIBRATION OF SITAGLIPTIN PHOSPHATE IN 0.1N HCL
S.NO CONCENTRATION (µg/ml) ABSORBANCE(nm
1 5 0.011±0.0021
2 10 0.031±0.0016
3 15 0.05±0.0016
4 20 0.07±0.0012
5 25 0.089±0.0002
Regression value = 0.999605
TABLE-5b CALIBRATION OF SITAGLIPTIN PHOSPHATE IN PHOSPHATE
BUFFER PH 7.2
S.NO CONCENTRATION (µg/ml) ABSORBANCE(nm
1 5 0.021±0.0024
2 10 0.045±0.0019
3 15 0.069±0.0026
4 20 0.092±0.0031
5 25 0.116±0.0045
Regression value=0.9999975

TABLE -6 FORMULATION OF SITAGLIPTIN PHOSPHATE MICROSPHERES
FORMULATION
BATCH CODE
F1 F2 F3 F4 F5 F6 F7 F8 F9 F10 F11 F12 F13 F14 F15
SITAGLIPTIN
(mg) 0.25 0.25 0.25 0.25 0.25 0.25 0.25 0.25 0.25 0.25 0.25 0.25 0.25 0.25 0.25
EUDRAGIT RS
100 (mg) 0.25 0.50 0.75 1.00 1.25 1.00 1.00 1.00 1.00 1.00 1.00 1.00 1.00 1.00 1.00
HPMC E-15 (mg) - - - - - 0.10 0.20 0.30 0.40 0.50 - - - - -
CHITOSAN (mg) - - - - - - - - - - 0.10 0.20 0.30 0.40 0.50
ACETONE (ml) 6.00 9.00 12.0 15.0 18.0 15.0 15.0 15.0 15.0 15.0 15.0 15.0 15.0 15.0 15.0
TWEEN 80 (%) 0.10 0.30 0.50 0.70 0.90 0.70 0.70 0.70 0.70 0.70 0.70 0.70 0.70 0.70 0.70
STIRRING
SPEED(RPM) 600 800 1000 1200 1400 1200 1200 1200 1200 1200 1200 1200 1200 1200 1200

TABLE-7 DRUG CONTENT AND MEAN PARTICLE SIZE FOR SITAGLIPTIN
PHOSPHATE MICROSPHERES
S.NO FORMULATION
CODE
DRUG CONTENT
(%)
MEAN PARTICLE
SIZE(µm)
1. F1-E 60.42 92.62
2. F2-E 70.83 85.52
3. F3-E 81.25 76.35
4. F4-E 83.33 56.35
5. F5-E 75 54.51
6. F6-EH 60.42 60.69
7. F7-EH 66.66 61.63
8. F8-EH 97.92 62.28
9. F9-EH 81.25 66.54
10. F10-EH 77.08 71.39
11. F11-ECH 52.08 61.42
12. F12-ECH 60.41 65.39
13. F13-ECH 62.5 64.16
14. F14-ECH 66.67 71.94
15. F15-ECH 75 75.59

TABLE- 8 PERCENTAGE YIELD, DRUG CONTENT, THEORETICAL DRUG
LOADING, EXPERIMENTAL DRUG LOADING AND ENCAPSULATION
EFFICIENCY OF SITAGLIPTIN PHOSPHATE MICROSPHERES
S.NO F.CODE %YIELD
(%)
THEORETCIAL
DRUG
LOADING (%)
EXPERIMENTAL
DRUG LOADING
(%)
ENCAPSULATION
EFFICIENCY (%)
1. F1-E 39.91 50 70.47 56.25
2. F2-E 46.74 33.33 49.02 68.75
3. F3-E 56.79 25 33.93 77.08
4. F4-E 63.39 20 26.29 83.33
5. F5-E 69.86 16.67 18.55 77.77
6. F6-EH 65.73 18.51 16.43 58.33
7. F7-EH 67.24 17.24 17.98 70.13
8. F8-EH 70.89 16.12 20.22 88.88
9. F9-EH 72.79 15.15 16.62 79.86
10. F10-EH 77.54 14.28 13.94 75.69
11. F11-
ECH 66.71 18.51 15.03 54.17
12. F12-
ECH 69.05 17.24 15.25 61.11
13. F13-
ECH 71.79 16.12 14.51 64.58
14. F14-
ECH 72.37 15.15 14.82 70.83
15. F15-
ECH 74.86 14.29 14.70 77.08

TABLE 9a IN-VITRO DISSOLUTION PROFILE FOR SITAGLIPTIN PHOSPHATE MICROSPHERES
TIME IN
HOURS
CUMULATIVE % DRUG RELEASE
FORMULATION CODE- EUDRAGIT RS 100
F1-E F2-E F3-E F4-E F5-E
MEAN ±SD MEAN ±SD MEAN ±SD MEAN ±SD MEAN ±SD
1. 38.78 0.24 39.98 0.10 39.20 0.82 40.13 0.86 40.73 0.28
2. 39.95 0.53 41.72 0.174 41.30 0.56 42.22 0.81 42.65 0.12
3. 41.87 0.72 44.07 0.76 42.69 0.10 44.57 0.68 44.89 0.43
4. 45.67 0.28 45.70 0.61 44.60 0.10 45.17 0.53 47.19 0.40
5. 54.54 0.72 48.15 0.61 54.12 0.15 46.66 0.72 51.60 0.81
6. 64.16 0.68 59.90 0.61 60.22 0.16 53.83 0.26 62.10 0.13
7. 99.37 0.24 80.14 0.40 76.87 0.10 65.94 0.24 66.79 0.14
8. 95.08 0.38 80.10 0.61 70.52 0.16 74.42 0.28
9. 91.85 0.53 81.27 0.16 94.48 0.13
10. 90.96 0.61
11.
12.

TABLE-9b IN-VITRO DISSOLUTION PROFILE FOR SITAGLIPTIN PHOSPHATE MICROSPHERES
TIME IN
HOURS
CUMULATIVE % DRUG RELEASE
FORMULATION CODE- EUDRAGIT RS 100 WITH HPMC E15
F6-EH F7-EH F8-EH F9-EH F10-EH
MEAN ±SD MEAN ±SD MEAN ±SD MEAN ±SD MEAN ±SD
1. 38.31 0.51 37.30 0.27 37.94 0.53 37.82 0.81 39.31 0.60
2. 39.14 0.61 38.18 0.16 38.92 0.54 39.60 0.10 40.34 0.10
3. 39.99 0.61 40.63 0.54 40.56 0.10 41.34 0.16 43.11 0.10
4. 43.18 0.61 42.72 0.53 42.51 0.61 43.01 0.10 44.85 0.61
5. 45.66 0.57 43.86 0.46 43.25 0.61 45.21 0.61 45.81 0.44
6. 57.84 0.12 45.53 0.16 44.39 0.90 61.46 0.80 47.80 0.56
7. 80.88 0.61 49.93 0.30 45.38 0.40 80.45 0.58 54.86 0.22
8. 90.46 0.49 59.69 0.14 50.92 0.44 96.07 0.17 60.58 0.21
9. 79.50 0.53 61.93 0.24 78.72 0.68
10. 90.39 0.10 70.37 0.28 92.20 0.21
11. 87.06 0.21
12. 92.63 0.59
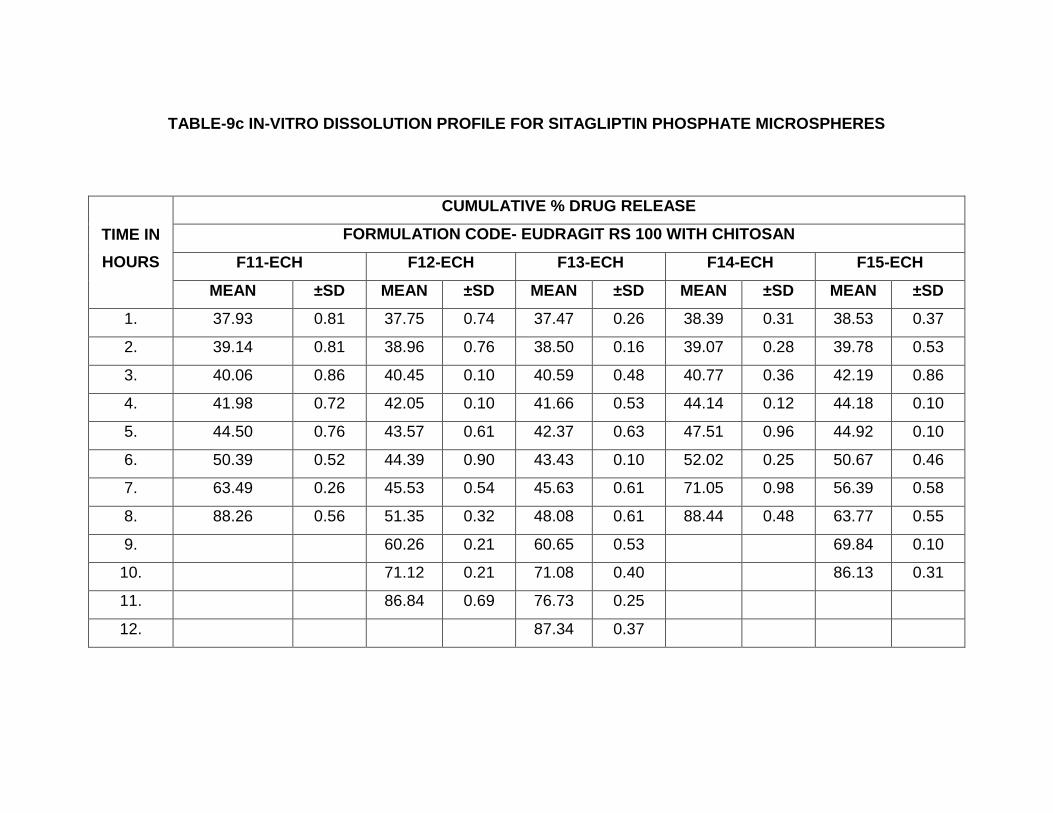
TABLE-9c IN-VITRO DISSOLUTION PROFILE FOR SITAGLIPTIN PHOSPHATE MICROSPHERES
TIME IN
HOURS
CUMULATIVE % DRUG RELEASE
FORMULATION CODE- EUDRAGIT RS 100 WITH CHITOSAN
F11-ECH F12-ECH F13-ECH F14-ECH F15-ECH
MEAN ±SD MEAN ±SD MEAN ±SD MEAN ±SD MEAN ±SD
1. 37.93 0.81 37.75 0.74 37.47 0.26 38.39 0.31 38.53 0.37
2. 39.14 0.81 38.96 0.76 38.50 0.16 39.07 0.28 39.78 0.53
3. 40.06 0.86 40.45 0.10 40.59 0.48 40.77 0.36 42.19 0.86
4. 41.98 0.72 42.05 0.10 41.66 0.53 44.14 0.12 44.18 0.10
5. 44.50 0.76 43.57 0.61 42.37 0.63 47.51 0.96 44.92 0.10
6. 50.39 0.52 44.39 0.90 43.43 0.10 52.02 0.25 50.67 0.46
7. 63.49 0.26 45.53 0.54 45.63 0.61 71.05 0.98 56.39 0.58
8. 88.26 0.56 51.35 0.32 48.08 0.61 88.44 0.48 63.77 0.55
9. 60.26 0.21 60.65 0.53 69.84 0.10
10. 71.12 0.21 71.08 0.40 86.13 0.31
11. 86.84 0.69 76.73 0.25
12. 87.34 0.37

TABLE-9d IN-VITRO DRUG RELEASE PROFILE FOR SITAGLIPTIN PHOSPHATE
TIME IN
HOURS
CUMULATIVE % DRUG RELEASE
COMPARISON FOR BEST RELEASE PROFILE
GEL PURE TABLET F8-EH F13-ECH
MEAN ±SD MEAN ±SD MEAN ±SD MEAN ±SD MEAN ±SD
1. 37.68 1.34 95.73 0.46 96.12 1.07 37.94 0.53 37.47 0.26
2. 38.78 0.43 38.92 0.54 38.50 0.16
3. 39.85 0.31 40.56 0.10 40.59 0.48
4. 40.34 0.21 42.51 0.61 41.66 0.53
5. 41.69 0.34 43.25 0.61 42.37 0.53
6. 43.82 0.27 44.39 0.91 43.43 0.10
7. 45.96 0.48 45.38 0.40 45.63 0.61
8. 48.77 0.32 50.92 0.44 48.08 0.61
9. 58.77 0.28 61.93 0.24 60.65 0.53
10. 66.11 0.60 70.37 0.28 71.08 0.40
11. 81.02 0.60 87.06 0.21 76.73 0.25
12. 94.80 0.60 92.63 0.59 87.34 0.37

TABLE-10 IN-VITRO RELEASE KINETICS OF SITAGLIPTIN PHOSPHATE MICROSPHERES
FORMULATION
CODE
ZERO ORDER
KINETICS
FIRST ORDER
KINETICS HIGUCHI MODEL
KORSMEYER
PEPPAS
MODEL
HIXON
CROWEL
MODEL
R2 KO(h-1) R2 KO(h-1) R2 KH(h-1/2) R2 n2 R2 KHC(h-1/3)
F1-E 0.775 9.877 0.776 -9.877 0.575 -0.366 0.557 0.362 0.575 -0.366
F2-E 0.847 9.020 0.847 -9.020 0.782 -0.273 0.657 0.371 0.782 -0.273
F3-E 0.897 8.199 0.897 -8.199 0.897 -0.236 0.779 0.394 0.897 -0.236
F4-E 0.868 6.869 0.868 -6.869 0.871 -0.195 0.739 0.345 0.870 -0.196
F5-E 0.860 7.654 0.886 -7.489 0.856 -0.233 0.639 0.386 0.856 -0.233
F6-EH 0.852 8.878 0.852 -8.877 0.814 -0.249 0.589 0.306 0.814 -0.249
F7-EH 0.785 5.542 0.786 -5.542 0.900 -0.153 0.639 0.331 0.731 -0.153
F8-EH 0.899 5.551 0.830 -5.550 0.778 -0.256 0.637 0.331 0.777 -0.167
F9-EH 0.835 7.848 0.835 -7.847 0.740 -0.240 0.637 0.369 0.740 -0.241
F10-EH 0.816 6.416 0.816 -6.416 0.767 -0.182 0.654 0.318 0.766 -0.182
F11-ECH 0.793 7.612 0.792 -7.611 0.734 -0.200 0.587 0.319 0.734 -0.200
F12-ECH 0.786 5.142 0.785 -5.141 0.756 -0.134 0.619 0.283 0.756 -0.134
F13-ECH 0.823 5.093 0.825 -5.093 0.813 -0.136 0.645 0.311 0.813 -0.136
F14-ECH 0.791 6.722 0.790 -6.722 0.748 -0.179 0.605 0.308 0.748 -0.179
F15-ECH 0.837 6.023 0.837 -6.025 0.836 -0.156 0.732 0.312 0.836 -0.157

TABLE -11 CHARACTERIZATION OF GEL OF SITAGLIPTIN MICROSPHERES
pH SPREADABILITY GEL STRENGTH DRUG CONTENT
5.01 4.8(g.cm/second) 52 seconds 98.02%
TABLE-12 STABILITY STUDIES
S.NO FORMULATION
CODE
EVALUATION
PARAMETERS
BEFORE
STORAGE
Stored at 40°C ± 2°C
and 75% ± 5% RH
(AFTER STORAGE)
For 15
days
For 30
days
1. F8-EH Drug content (%) 97.9 96.8 95.1
2. F8-EH Encapsulation
efficiency(%) 88.88 86.9 85.8
3. F8-EH % cumulative
drug release(%) 92.63 91.5 90.2

FIGURE-4a DETERMINATION OF λmax FOR SITAGLIPTIN PHOSPHATE
USING PHOSPHATE BUFFER PH 7.2 at 267nm

FIGURE 4b- CALIBRATION OF SITAGLIPTIN PHOSPHATE IN PHOSPHATE
BUFFER PH 7.2
y = 0.0047x + 5E-05R² = 0.9998
0
0.02
0.04
0.06
0.08
0.1
0.12
0.14
0 10 20 30
AB
SO
RB
AN
CE
(nm
)
CONCENTRATION(µg/ml)
CALIBRATION OF SITAGLIPTIN PHOSPHATE IN PHOSPHATE BUFFER PH 7.2

FIGURE-4c DETERMINATION OF λmax FOR SITAGLIPTIN PHOSPHATE
USING 0.1N HCL

FIGURE 4d- CALIBRATION OF SITAGLIPTIN PHOSPHATE IN 0.1N HCL
y = 0.0037x - 0.0026R² = 0.9976
-0.02
0
0.02
0.04
0.06
0.08
0.1
0 10 20 30AB
SO
RB
AN
CE
(nm
)
CONCENTRATION(µg/ml)
CALIBRATION OF SITAGLIPTIN PHOSPHATE IN O.1N HCL

FIGURE -5a IR SPECTRA OF SITAGLIPTIN PHOSPHATE
FIGURE 5b – IR SPECTRA OF EUDRAGIR RS 100
4006008001000140018002400320040001/cm
5
10
15
20
25
30
35
%T
3327.2
1
3059.1
0 1639.4
9
1064.7
11014.5
6
SITAGLIPTIN
50075010001250150017502000225025002750300032503500375040001/cm
22.5
30
37.5
45
52.5
60
67.5
75
82.5
90
%T
35
62
.52
35
25
.88
34
44
.87
34
19
.79
33
48
.42
32
71
.27
31
96
.05
31
74
.83
31
57
.47
29
89
.66
29
51
.09
28
45
.00
27
73
.64
27
23
.49
25
98
.12
25
51
.82
24
07
.16
23
87
.87
23
49
.30
23
06
.86
22
66
.36
20
88
.91
17
28
.22
16
43
.35
14
85
.19
14
52
.40
14
35
.04
13
84
.89
12
40
.23
11
78
.51
11
47
.65
10
20
.34
98
7.5
5 96
2.4
8
91
2.3
3
84
8.6
8
75
2.2
4
68
0.8
7
EUDRAGIT RS 100

FIGURE 5c- IR SPECTRA OF SITAGLIPTIN+EUDRAGIT RS 100+ HPMC E15+
CHITOSAN+CARBOPOL 934
FIGURE 5d- IR SPECTRA OF SITAGLIPTIN FORMULATION (BEST)
4006008001000140018002400320040001/cm
0
2.5
5
7.5
10
12.5
15
17.5
20%T
39
73
.36
39
59
.86
39
34
.78
39
13
.57
38
73
.06
38
63
.42
38
30
.63
38
15
.20
37
78
.55
37
70
.84
36
85
.97
34
69
.94
34
44
.87
34
10
.15
33
98
.57
33
83
.14
33
71
.57
33
52
.28
33
34
.92
32
90
.56
32
75
.13
32
30
.77
32
01
.83
31
90
.26
31
51
.69
31
22
.75
30
59
.10
29
76
.16
29
31
.80
28
75
.86
27
36
.99
26
57
.91
26
46
.34
26
11
.62
26
00
.04
25
34
.46
25
24
.82
24
65
.03
24
34
.17
24
12
.95
23
87
.87
23
53
.16
22
99
.15
22
66
.36
22
31
.64
22
04
.64
21
87
.28
21
40
.99
21
08
.20
20
29
.11
19
96
.32
17
26
.29
16
68
.43 16
27
.92 15
83
.56
15
70
.06
15
54
.63
15
14
.12
14
42
.75
13
81
.03
13
30
.88
12
76
.88
12
32
.51
12
07
.44
11
47
.65
11
39
.93
11
03
.28
10
85
.92
10
58
.92
10
24
.20
10
16
.49 98
5.6
29
14
.26
88
1.4
7 84
4.8
28
21
.68
80
4.3
27
81
.17
75
9.9
57
50
.31
72
5.2
36
51
.94
57
2.8
65
28
.50
50
7.2
84
84
.13
46
4.8
44
51
.34
43
7.8
4
SITAGLIPTIN WITH POLYMER MIXTURE
4006008001000140018002400320040001/cm
17.5
20
22.5
25
27.5
30
32.5
35
37.5%T
39
90
.72
39
81
.08
39
71
.43
39
52
.14
39
34
.78
39
00
.07
38
76
.92
38
15
.20
37
78
.55
37
70
.84
37
18
.76
36
95
.61
36
26
.17
35
87
.60
35
25
.88
34
10
.15
33
83
.14
33
54
.21
33
34
.92
33
09
.85
32
90
.56
32
71
.27
32
51
.98
32
28
.84
32
07
.62
31
88
.33
31
70
.97
31
53
.61
31
30
.47
31
09
.25
29
60
.73
29
24
.09
28
75
.86
28
54
.65
27
58
.21
27
48
.56
26
81
.05
26
59
.84
26
40
.55
26
11
.62
25
74
.97
25
51
.82
24
65
.03
24
43
.81
24
28
.38
24
09
.09
23
85
.95
23
53
.16
22
99
.15
22
31
.64
21
89
.21
21
75
.70
21
60
.27
21
39
.06
21
27
.48
21
13
.98
20
79
.26
20
58
.05
20
34
.90
20
09
.83
19
94
.40
19
73
.18
19
01
.81
18
92
.17
18
74
.81
18
42
.02
18
03
.44
17
45
.58
17
16
.65
16
78
.07 16
41
.42
16
04
.77
15
83
.56
15
12
.19
14
98
.69
14
31
.18
13
81
.03
13
25
.10
12
96
.16
12
74
.95
12
13
.23
11
66
.93
11
51
.50
11
16
.78
10
62
.78
10
47
.35
10
12
.63
96
2.4
89
12
.33
88
5.3
38
46
.75
82
5.5
37
61
.88 7
25
.23
68
0.8
76
55
.80
61
9.1
56
01
.79
58
4.4
35
59
.36
52
6.5
7 50
1.4
94
86
.06
46
8.7
0
42
4.3
44
01
.19
SITAGLIPTIN FORMULATION

FIGURE 6a – DSC THERMOGRAM OF SITAGLIPTIN PHOSPHATE
FIGURE 6b- DSC THERMOGRAM OF SITAGLIPTIN BEST FORMULATION

FIGURE 7- PERCENTAGE YIELD OF SITAGLIPTIN MICROSPHERES
FIGURE -8 THEORETICAL DRUG LOADING FOR SITAGLIPTIN
MICROSPHERES
0102030405060708090
PER
CEN
TAG
E Y
IELD
(%)
FORMULATION CODE
PERCENTAGE YIELD
0
10
20
30
40
50
60
THEO
RET
ICA
L D
RU
G L
OA
DIN
G(%
)
FORMULATION CODE
THEORETICAL DRUG LOADING

FIGURE -9 EXPERIMENTAL DRUG LOADING FOR SITAGLIPTIN
MICROSPHERES
FIGURE-10 DRUG CONTENT FOR SITAGLIPTIN MICROSPHERES
0
10
20
30
40
50
60
70
80
EXP
ERIM
ENTA
L D
RU
G L
OA
DIN
G(%
)
FORMULATION CODE
EXPERIMENTAL DRUG LOADING
0102030405060708090
100
DR
UG
CO
NTE
NT(
%)
FORMULATION CODE
DRUG CONTENT

FIGURE-11 ENCAPSULATION EFFICIENCY FOR SITAGLIPTIN
MICROSPHERES
FIGURE-12 MEAN PARTICLE SIZE FOR SITAGLIPTIN MICROSPHERES
0102030405060708090
100
ENC
AP
SULA
TIO
N E
FFIC
IEN
CY
(%)
FORMULATION CODE
ENCAPSULATION EFFICIENCY(%)
0102030405060708090
100
MEA
N P
AR
TIC
LE S
IZE(
µm
)
FORMULATION CODE
MEAN PARTICLE SIZE(µm)

FIGURE-13a COMPARISON OF INVITRO RELEASE PROFILE OF
SITAGLIPTIN PHOSPHATE MICROSPHERES CONTAINING
EUDRAGIT RS 100 AT DIFFERENT RATIOS
FIGURE-13b COMPARISON OF INVITRO RELEASE PROFILE OF
SITAGLIPTIN PHOSPHATE MICROSPHERES CONTAINING
EUDRAGIT RS 100 WITH HPMC-E15 AT DIFFERENT RATIOS
0
20
40
60
80
100
120
0 2 4 6 8 10 12 14
CU
MU
LATI
VE
% D
RU
G R
ELEA
SE
TIME IN HOURS
IN-VITRO DRUG RELEASE STUDIES
F1-E
F2-E
F3-E
F4-E
F5-E
0
10
20
30
40
50
60
70
80
90
100
0 5 10 15
CU
MU
LATI
VE
% D
RU
G R
ELEA
SE
TIME IN HOURS
IN-VITRO DRUG RELEASE STUDIES
F6-EH
F7-EH
F8-EH
F9-EH
F10-EH

FIGURE-13c COMPARISON OF INVITRO RELEASE PROFILE OF
SITAGLIPTIN PHOSPHATE MICROSPHERES CONTAINING
EUDRAGIT RS 100 WITH CHITOSAN AT DIFFERENT RATIOS
FIGURE-13d COMPARISON OF INVITRO RELEASE PROFILE OF
SITAGLIPTIN PHOSPHATE FOR SELECTION OF BEST FORMULATION
0
10
20
30
40
50
60
70
80
90
100
0 5 10 15
CU
MU
LATI
VE
% D
RU
G R
ELEA
SE
TIME IN HOURS
IN-VITRO DRUG RELEASE STUDIES
F11-ECH
F12-ECH
F13-ECH
F14-ECH
F15-ECH
0
20
40
60
80
100
120
0 5 10 15
CU
MU
LATI
VE
% D
RU
G R
ELEA
SE
TIME IN HOURS
IN-VITRO DRUG RELEASE STUDIES
F8-EH
F13-ECH
GEL
PURE
TABLET

FIGURE-14a COMPARISON OF IN-VITRO ZERO ORDER RELEASE KINETICS
OF SITAGLIPTIN PHOSPHATE MICROSPHERES BY USING
EUDRAGIT RS 100 AT DIFFERENT RATIOS
FIGURE-14b COMPARISON OF IN-VITRO ZERO ORDER RELEASE KINETICS
OF SITAGLIPTIN PHOSPHATE MICROSPHERES BY USING
EUDRAGIT RS 100 WITH HPMC E-15 RATIOS
0
20
40
60
80
100
120
0 2 4 6 8 10 12 14
%C
UM
ULA
TIV
E D
RU
G R
ELEA
SE
TIME IN HOURS
ZERO ORDER PLOT
F1-E
F2-E
F3-E
F4-E
F5-E
0
20
40
60
80
100
120
0 2 4 6 8 10 12 14
%C
UM
ULA
TIV
E D
RU
G R
ELEA
SE
TIME IN HOURS
ZERO ORDER PLOT
F6-EH
F7-EH
F8-EH
F9-EH
F10-EH

FIGURE-14c COMPARISON OF IN-VITRO ZERO ORDER RELEASE KINETICS
OF SITAGLIPTIN PHOSPHATE MICROSPHERES BY USING
EUDRAGIT RS 100 WITH CHITOSAN RATIOS
FIGURE-15a COMPARISON OF IN-VITRO FIRST ORDER RELEASE KINETICS
OF SITAGLIPTIN PHOSPHATE MICROSPHERES BY USING
EUDRAGIT RS 100 AT DIFFERENT RATIOS
0
10
20
30
40
50
60
70
80
90
100
0 5 10 15
%C
UM
ULA
TIV
E D
RU
G R
ELEA
SE
TIME IN HOURS
ZERO ORDER PLOT
F11-ECH
F12-ECH
F13-ECH
F14-ECH
F15-ECH
0
20
40
60
80
100
120
0 2 4 6 8 10 12 14
% D
RU
G R
EMA
INED
TIME IN HOURS
FIRST ORDER PLOT
F1-E
F2-E
F3-E
F4-E
F5-E

FIGURE-15b COMPARISON OF IN-VITRO FIRST ORDER RELEASE KINETICS
OF SITAGLIPTIN PHOSPHATE MICROSPHERES BY USING
EUDRAGIT RS 100 WITH HPMC E-15 RATIOS
FIGURE-15c COMPARISON OF IN-VITRO FIRST ORDER RELEASE KINETICS
OF SITAGLIPTIN PHOSPHATE MICROSPHERES BY USING
EUDRAGIT RS 100 WITH CHITOSAN RATIOS
0
20
40
60
80
100
120
0 2 4 6 8 10 12 14
% D
RU
G R
EMA
INED
TIME IN HOURS
FIRST ORDER PLOT
F6-EH
F7-EH
F8-EH
F9-EH
F10-EH
0
20
40
60
80
100
120
0 5 10 15
% D
RU
G R
EMA
INED
TIME IN HOURS
FIRST ORDER PLOT
F11-ECH
F12-ECH
F13-ECH
F14-ECH
F15-ECH
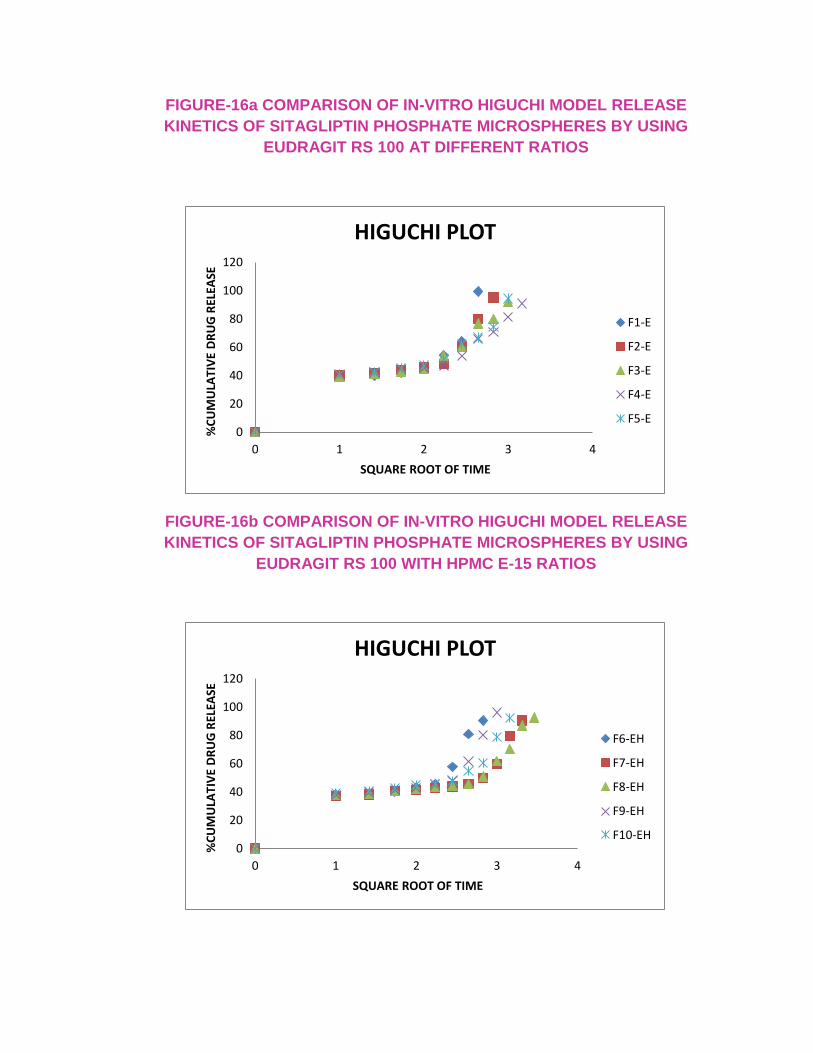
FIGURE-16a COMPARISON OF IN-VITRO HIGUCHI MODEL RELEASE
KINETICS OF SITAGLIPTIN PHOSPHATE MICROSPHERES BY USING
EUDRAGIT RS 100 AT DIFFERENT RATIOS
FIGURE-16b COMPARISON OF IN-VITRO HIGUCHI MODEL RELEASE
KINETICS OF SITAGLIPTIN PHOSPHATE MICROSPHERES BY USING
EUDRAGIT RS 100 WITH HPMC E-15 RATIOS
0
20
40
60
80
100
120
0 1 2 3 4
%C
UM
ULA
TIV
E D
RU
G R
ELEA
SE
SQUARE ROOT OF TIME
HIGUCHI PLOT
F1-E
F2-E
F3-E
F4-E
F5-E
0
20
40
60
80
100
120
0 1 2 3 4
%C
UM
ULA
TIV
E D
RU
G R
ELEA
SE
SQUARE ROOT OF TIME
HIGUCHI PLOT
F6-EH
F7-EH
F8-EH
F9-EH
F10-EH

FIGURE-16c COMPARISON OF IN-VITRO HIGUCHI MODEL RELEASE
KINETICS OF SITAGLIPTIN PHOSPHATE MICROSPHERES BY USING
EUDRAGIT RS 100 WITH CHITOSAN RATIOS
FIGURE-17a COMPARISON OF IN-VITRO KORSMEYER PEPPAS MODEL
RELEASE KINETICS OF SITAGLIPTIN PHOSPHATE MICROSPHERES BY
USING EUDRAGIT RS 100 AT DIFFERENT RATIOS
0
10
20
30
40
50
60
70
80
90
100
0 1 2 3 4
%C
UM
ULA
TIV
E D
RU
G R
ELEA
SE
SQUARE ROOT OF TIME
HIGUCHI PLOT
F11-ECH
F12-ECH
F13-ECH
F14-ECH
F15-ECH
0
0.5
1
1.5
2
2.5
0 0.2 0.4 0.6 0.8 1 1.2
LOG
%C
UM
ULA
TIV
E D
RU
G R
ELEA
SE
LOG T
PEPPAS PLOT
F1-E
F2-E
F3-E
F4-E
F5-E

FIGURE-17b COMPARISON OF IN-VITRO KORSMEYER PEPPAS MODEL
RELEASE KINETICS OF SITAGLIPTIN PHOSPHATE MICROSPHERES BY
USING EUDRAGIT RS 100 WITH HPMC E-15 RATIOS
FIGURE-17c COMPARISON OF IN-VITRO KORSMEYER PEPPAS MODEL
RELEASE KINETICS OF SITAGLIPTIN PHOSPHATE MICROSPHERES BY
USING EUDRAGIT RS 100 WITH CHITOSAN RATIOS
0
0.5
1
1.5
2
2.5
0 0.2 0.4 0.6 0.8 1 1.2
LOG
%C
UM
ULA
TIV
E D
RU
G R
ELEA
SE
LOG T
PEPPAS PLOT
F6-EH
F7-EH
F8-EH
F9-EH
F10-EH
0
0.5
1
1.5
2
2.5
0 0.2 0.4 0.6 0.8 1 1.2
LOG
%C
UM
ULA
TIV
E D
RU
G R
ELEA
SE
LOG T
PEPPAS PLOT
F11-ECH
F12-ECH
F13-ECH
F14-ECH
F15-ECH

FIGURE-18a COMPARISON OF IN-VITRO HIXSON CROWEL MODEL
RELEASE KINETICS OF SITAGLIPTIN PHOSPHATE MICROSPHERES BY
USING EUDRAGIT RS 100 AT DIFFERENT RATIOS
FIGURE-18b COMPARISON OF IN-VITRO KORSMEYER HIXSON CROWEL
MODEL RELEASE KINETICS OF SITAGLIPTIN PHOSPHATE
MICROSPHERES BY USING EUDRAGIT RS 100 WITH HPMC E-15 RATIOS
0
0.5
1
1.5
2
2.5
3
3.5
4
4.5
5
0 2 4 6 8 10 12 14
CU
BE
RO
OT
OF
%C
UM
ULA
TIV
E D
RU
G
REL
EASE
TIME IN HOURS
HIXSON PLOT
F1-E
F2-E
F3-E
F4-E
F5-E
0
0.5
1
1.5
2
2.5
3
3.5
4
4.5
5
0 5 10 15
CU
BE
RO
OT
OF
%C
UM
ULA
TIV
E D
RU
G
REL
EASE
TIME IN HOURS
HIXSON PLOT
F6-EH
F7-EH
F8-EH
F9-EH
F10-EH

FIGURE-18c COMPARISON OF IN-VITRO HIXSON CROWEL MODEL
RELEASE KINETICS OF SITAGLIPTIN PHOSPHATE MICROSPHERES BY
USING EUDRAGIT RS 100 WITH CHITOSAN RATIOS
FIGURE-19 SCANNING ELECTRON MICROSCOPY OF
SITAGLIPTIN MICROSPHERES
0
0.5
1
1.5
2
2.5
3
3.5
4
4.5
5
0 5 10 15
CU
BE
RO
OT
OF
%C
UM
ULA
TIV
E D
RU
G
REL
EASE
TIME IN HOURS
HIXSON PLOT
F11-ECH
F12-ECH
F13-ECH
F14-ECH
F15-ECH

FIGURE 20-a STABILITY STUDIES FOR SITAGLIPTIN PHOSPHATE
MICROSPHERES
FIGURE 20-b STABILITY STUDIES FOR SITAGLIPTIN PHOSPHATE
MICROSPHERES
0
50
100
150
200
250
0 15 0 30
DR
UG
CO
NTE
NT(
%)
TIME IN DAYS
STABILITY STUDIES DRUG CONTENT
0
50
100
150
200
0 15 0 30ENC
AP
SULA
TIO
N E
FFIC
IEN
CY
(%)
TIME IN DAYS
STABILITY STUDIES DRUG ENCAPSUSLATION EFFICIENCY

FIGURE 20-C STABILITY STUDIES FOR SITAGLIPTIN PHOSPHATE
MICROSPHERES
0
20
40
60
80
100
120
140
160
180
200
0 15 0 30
%C
UM
ULA
TIV
E D
RU
G R
ELEA
SE(%
)
TIME IN DAYS
STABILITY STUDIES FOR % CUMULATIVE DRUG RELEEASE

CHAPTER – XI
SUMMARY AND
CONCLUSION

CHAPTER XI SUMMARY AND CONCLUSION
COLLEGE OF PHARMACY, MADURAI MEDICAL COLLEGE. Page 95
SUMMARY AND CONCLUSION
In this present study was to formulate and evaluate sustained release
microsphere gel loaded sitagliptin phosphate in order to maintain a
sustained drug concentration in serum for longer period of time, which
may result in enhanced absorption and thereby improved
bioavailability.
The results of compatibility studies by infrared spectroscopy and
differential scanning calorimetry showed no interaction between the
drug and polymers.
The microgel of sustained release microspheres of sitagliptin
phosphate were successfully prepared by non-aqueous solvent
evaporation technique.
All formulations F1 to F15 micropheres were evaluated for particle
size analysis mean particle size range 54.51 to 92.62 μm.
Mean particle size range of sitagliptin microspheres were in the range
of suitable size range
The F8-EH shows the maximum drug content values of 97.92%
Percentage Encapsulation efficiency of the F8 – 88.88 %. As the
polymer concentration was increased the drug entrapment efficiency
% was increased due to increase in the viscosity of the solution. The
present investigation state that if the drugs are soluble in the solvent
system, it results in high drug encapsulation efficiency than that of
dispersed in the solvent system. The elimination of the drugs from the
prepared microspheres highly dependent on the concentration of the
polymer used, as the amount of the polymer increased the
encapsulation efficiency of the microsphere increased because of the
good matrix formation.
Scanning electron microphotographs showed that the microspheres
were spherical with a smooth to rough surface.

CHAPTER XI SUMMARY AND CONCLUSION
COLLEGE OF PHARMACY, MADURAI MEDICAL COLLEGE. Page 96
In-vitro release study of all the formulations were showed a sustained
drug release with increase in concentration of different rate retardant
polymers (EUDRAGIT RS 100, HPMC E15, CHITOSAN). Dissolution
rate of all the formulations were sustained when compared to pure
drug.
The selected best formulation was formulated into gel using carbopol
934 by loading sitagliptin phosphate microspheres in carbomer gel.
The dissolution study was carried out in phosphate buffer pH 7.2 for
12 hours. The formulations shows sustained release of drugs up to
12 hours and all formulations showed more than 90% drug release.

CHAPTER XI SUMMARY AND CONCLUSION
COLLEGE OF PHARMACY, MADURAI MEDICAL COLLEGE. Page 97
CONCLUSION
Sustained release microspheres of sitagliptin phosphate prepared with the
rate retardant polymers successfully by the non-aqueous solvent evaporation
technique.
From the results it was observed that drug: polymer ratio influences the
particle size, drug content, encapsulation efficiency and in-vitro drug release of
sustained release microspheres.
The formulated microspheres showed good drug-loading. The gel
formulation, which consisted of drug-loaded sitagliptin microspheres, showed
sustained release of for 12 h, thus indicating their suitability for the sustained
delivery of the drugs for the treatment of DM. However, further studies, including
clinical tests are required to confirm the gel’s therapeutic efficacy.

REFERENCES
REFERENCES
COLLEGE OF PHARMACY, MADURAI MEDICAL COLLEGE.
REFERENCES
1. Chinna Gangadhar B.*1, Shyam Sunder R.1, Vimal Kumar Varma. M.1,
Sleeva Raju M.2, Sai Kiran M. 2010., Formulation and Evaluation of
Indomethacin Microspheres using natural and synthetic polymers as
Controlled Release Dosage Forms.,International Journal of Drug Discovery,
ISSN: 0975–4423, Volume 2, Issue 1, 2010, pp-08-16
2. S. Duraivel*1, Harish.G1, B. Pragati Kumar1, Debjit Bhowmik1, Sunil
Midimalapu, 2013., Formulation and Evaluation of Ciprofloxacin
Microspheres for Nasal Drug Delivery .,Vol. 2 No. 4 2013
www.thepharmajournal.com
3. Subbiah ganesh*, D Sudheer Kumar, B Sandeep kumar, R abhilash 2010.,
controlled release formulation and evaluation of idarubicin microsphere usi
ng biodegradable hydrophilic and hydrophobic polymer mixture Asian
Journal of Pharmaceutical and Clinical Research Vol. 3, Issue 3, 2010
4. Basma yahya al-najjar.,2017 chitosan microspheres for the delivery of
chemotherapeutic agents: paclitaxel as a model Vol 10, Issue 8, 2017
5. Yogesh S Chaudhari, Suresh D Kumavat and Harshal A Pawar., 2014
Development and Evaluation of Sustained Release Microspheres of
Glibenclamide by Emulsion Solvent Evaporation Method Rashmi R
Kokardekar, Volume 4 • Issue 1 • 1000127
6. K.Kannan*, P.K.Karar, R.Manavalan.2009 formulation and evaluation of
sustained release microspheres of acetazolamide by solvent evaporation
technique K.Kannan et al/J. Pharm. Sci. & Res. Vol.1(1), 2009, 36-39
7. Phutane P, Shidhaye S1, Lotlikar V, Ghule A, Sutar S, Kadam.,2010 In vitro
Evaluation of Novel Sustained Release Microspheres of Glipizide Prepared
by the Emulsion Solvent Diffusion-Evaporation Method Phutane, et al. J
Young Pharm. 2010;2(1): 35-41

REFERENCES
COLLEGE OF PHARMACY, MADURAI MEDICAL COLLEGE.
8. BV. Bhagat, Rohit P Mishra and Sameer Katiyar., 2016. Rifampicin As
Microspheres By Non-Aqueous Solvent Evaporation Method Vol. 5 (1)
Jan-Mar 2016
9. Saritha Dunaka1*, Prabhakar Reddy. V.2, Sampath Mahesh Vechha1and
Balaiah Ale., 2011 Formulation and Invitro Characterization of Ramipril
Microspheres Vol. 2, No. 2, July-December 2011
10. * K.R. Vinod1, A. Padma Sri1, David Banji1, S. Anbazhagan2, Santhosh
Vasa1, 2010., S. Sandhya Formulation and in vitro characterization of
lansoprazole floating gastroretentive microspheres by modified non
aqueous solvent evaporation method Der Pharma Chemica, 2010, 2
(5):419-425
11. R.P. Batycky, J. Hanes, R. Langer, and D.A. Edwards. A theoretical model
of erosion and macromolecular drug release from biodegrading
microspheres. J. Pharm. Sci., 86:1464–1477, 1997.
12. C. Berkland. Methods of controlling size distribution of polymeric drug
delivery particles. [M.S.]. University of Illinois, Urbana, IL, 2001.
13. C. Berkland, A. Cox, K.K. Kim, and D.W. Pack. Three-month, zero-order
piroxicam release from monodisperseddouble-walled microspheres of
controlled shell thickness. J. Biomed. Mat. Res., 2004a (in press)
14. C. Berkland, K. Kim, and D.W. Pack. Fabrication of PLG microspheres with
precisely controlled and monodisperse size distributions. J. Control. Rel.,
73:59–74, 2001.
15. C. Berkland, K. Kim, and D.W. Pack. PLG microsphere size controls drug
release rate through several competing factors. Pharm. Res., 20:1055–
1062, 2003.

REFERENCES
COLLEGE OF PHARMACY, MADURAI MEDICAL COLLEGE.
16. C. Berkland, K. Kim, and D.W. Pack. Precision Polymer Microparticles for
Controlled Release Drug Delivery. ACS Symposium Series, 879:197– 213,
2004b.
17. C. Berkland, M. King, A. Cox, K. Kim, and D.W. Pack. Precise control of
PLG microsphere size provides enhanced control of drug release rate. J.
Control. Rel., 82:137–147, 2002.
18. C. Berkland, M.J. Kipper, B. Narasimhan, K. Kim, and D.W. Pack.
Microsphere size, precipitation kinetics, and drug distribution control drug
release from biodegradable polyanhydride microspheres. J. Control. Rel.,
94:129–141, 2004c.
19. C. Berkland, D.W. Pack, and K. Kim. Controlling surface nano-structure
using flow-limited fieldinjection electrostatic spraying (FFESS) of poly(D,L-
lactide-co-glycolide). Biomaterials, 25:5649–5658, 2004d.
20. C. Berkland, E. Pollauf, D.W. Pack, and K. Kim. Uniform double-walled
polymer microcapsules of controllable shell thickness. J. Control. Rel.,
96:101–111, 2004e.
21. J.M. Bezemer, R. Radersma, D.W. Grijpma, P.J. Dijkstra, C.A. van
Blitterswijk, and J. Feijen. Microspheres for protein delivery prepared from
amphiphilic multiblock copolymers 2. Modulation of release rate. J. Control.
Rel., 67:249–260, 2000a.
22. J.M. Bezemer, R. Radersma, D.W. Grijpma, P.J. Dijkstra, A.A. van
Blitterswijk, and J. Feijen. Microspheres for protein delivery prepared from
amphiphilic multiblock copolymers 2. Modulation of release rate. J. Control.
Rel., 67:249–260, 2000b.
23. B. Bittner, C. Witt, K. Mader, and T. Kissel. Degradation and protein release
properties of microspheres prepared from biodegradable poly(lactide-co-
glycolide) and ABA triblock copolymers: influence of buffer media on

REFERENCES
COLLEGE OF PHARMACY, MADURAI MEDICAL COLLEGE.
polymer erosion and bovine serum albumin release. J. Control. Rel., 60(2–
3):297–309, 1999.
24. Menzel C, Pharmaceutical Research and Development. Anal prof drug
subs, 20, 1991, 557- 562.
25. Scirra JJ, Gidwani RN. Formulation and characterization of mucoadhesive
buccal film of glipizide. J pharma sci, 02, 1972, 754-57.
26. Singh D, Saraf S, Dixit VK, Saraf S. Formulation optimization of gentamicin
loaded Eudragit RS100 microspheres using factorial design study. Biol
pharm Bull, 31, 2008, 662-67
27. Hincall AA, Calis S. Microsphere preparation by solvent evaporation
method. In: Wise DL, Editor. Handbook of pharmaceutical controlled
release technology. New York: Marcel Dekker; 2000. p. 329‐43.
28. Follonier N, Doelkar E. Biopharmaceutical comparison of oral multiple unit
and single unit sustained release dosage forms. STP Pharm Sci 1992;
2:141‐58.
29. Davis SS, Hardy JG, Taylor MJ, Whalley DR, Wilson CG. A comparative
study of the gastrointestinal transit of a pellet and tablet formulation. Int J
Pharm 1984; 21:167‐77
30. Tang ESK, Chan LW, Heng PWS. Coating of multiparticulates for sustained
release. Am J Drug Del 2005; 3:17‐28.
31. Singh J, Robinson DH. Controlled release kinetics of captopril from tableted
microcapsules. Drug Dev Ind Pharm 1988; 14:545‐60.
32. Vayas SP and Khar RK.Controlled drug delivery concepts and advances.
Ed. Jain MK, 1st Edn.,Ed. Jain MK, Vallabh Prakasan, Delhi, 2005; 218‐
219.

REFERENCES
COLLEGE OF PHARMACY, MADURAI MEDICAL COLLEGE.
33. Chourasia MK and Jain SK. Pharmaceutical approaches to colon targeted
drug delivery system. J. Pharm. Pharmaceutical Sci. 2003; 6(1): 33‐66.
34. Frank DW, Gray JE and Weaver RN. Cyclodextrin nephrosis in the rat. Am.
Pathol. 1976; 83: 367‐382.
35. Segi N, Yotsuyanagi T and Ikeda K. Interaction of calcium‐ induced alginate
gel beads with propranolol. Chem. Pharm. Bull. 1989; 37 (11): 3092‐3095.
36. Rama Prasad YV, Krishnayya YSR and Satyanarayan S. J.
control.Rel.1998; 51:281. .www.drugbank.com.
37. Satturwar PM, Mandaogade PM and Dorle AK. A novel method for
preparation of Eudragit RL microcapsules. J. Microencapsulation
2002;19(4): 407‐413.
38. Ghosh A, Nath LK and Roy P.A study on the effect of different acrylic
polymers on frusemide loaded calcium alginate micropellets prepared by
ionotropic gelation technique. Pharmacy online.
39. Chourasia MK and Jain SK.Potential of guar gum microspheres for target
specific drug release to colon. J.Drug Targeting 2004; 12(7): 435‐442.
40. Nappinnai M and Kishore VS. Formulation and evaluation of microspheres
of diltiazemhydrochloride. I. J. Pharm. Sci. 2007; 69 (4): 511‐514.
41. Avachat A and Kotwal V. Design and evaluation of matrix‐based controlled
release tablets of diclofenac sodium and chondroitin sulphate. AAPS.
Pharm. Sci. Tech. 2007; 8(4): 88.
42. Chourasia MK, Jain SK. Design and development of multiparticulate system
for targeted drug delivery to colon. Drug Deliv. 2004; 11:201‐207.
43. Jain, S., Chourasia, M., Jain, A. and Jain, R. (2004). Development and
Characterization of mucoadhesive microspheres bearing salbutamol for
nasal Delivery. Drug Delivery 11: 113–122.

REFERENCES
COLLEGE OF PHARMACY, MADURAI MEDICAL COLLEGE.
44. Jones, D. S. and Pearce, K. J. (1995). An investigation of the effects of
some process variables on the microencapsulation of propranolol
hydrochloride by the solvent evaporation method. Int. J. Pharm. 118:199-
205.
45. Leung, S. S. and Robinson, J. R. (1988). The contribution of anionic
polymers structural features to mucoadhesion, J. Control. Rel. 5: 223–231.
46. Lim, S. T., Martin, G. P., Berry, D. J. and Brown, M. B. (2000). Preparation
and evaluation of the in vitro drug release properties and mucoadhesion of
novel microspheres of hyaluronic acid and chitosan. J. Control. Rel. 66:
281-292.
47. Mathiowitz, E. (1999). Encyclopedia of controlled drug delivery, Vol. I, John-
Wiley & Sons Inc., New York, pp. 9-45.
48. Patel, J. K., Bodar, M. S., Amin, A.F. and Patel, M. M. (2004). Formulation
and optimization of mucoadhesive microspheres of Metoclopramide. Indian
J. Pharm. Sci. 66: 303-305.
49. Sandra, K., Gareth, D. R., John, T. and Smart, J. D. (2005). Mucoadhesive,
triclosan-loaded polymer microspheres for application to the oral cavity:
preparation and controlled release characteristics. Eur. J. Pharm.
Biopharm. 59: 207–216.
50. Soni, T., Nagda, C., Gandhi, T., Chotai, N. (2008). Development of
discriminating method for dissolution of aceclofenac marketed formulations.
Dissol. Techn. 15: 31-35.
51. Yadav, K. S., Satish, C. S. and Shivkumar, H. G. (2007). Preparation and
evaluation of chitosan-Poly (Acrylic acid) Hydrogels as Stomach specific
delivery for amoxicillin and Metronidazole. Indian J. Pharm. Sci. 69:
91-95.

REFERENCES
COLLEGE OF PHARMACY, MADURAI MEDICAL COLLEGE.
52. Mutalik, S., Naha, A., Usha, A. N., Ranjith, A.K., Musmade, P., Manoj, K.,
Anju, P. and Prasanna, S. (2007). Preparation, In vitro, Preclinical and
Clinical evaluations of once daily sustained release tablets of Aceclofenac.
Arch. Pharm. Res. 30: 222-234.

Copyright © 2022 FDOKUMEN